Embed Size (px)
Citation preview
Chapter 31
Phenology in Higher Education:
Ground-Based and Spatial Analysis Tools
Kirsten M. de Beurs, Robert B. Cook, Susan Mazer, Brian Haggerty,
Alisa Hove, Geoffrey M. Henebry, LoriAnne Barnett, Carolyn L. Thomas,
and Bob R. Pohlad
Abstract New spatial analysis methods and an increasing amount of remote
sensing data are the necessary tools for scaling from ground-based phenological
measurements to larger ecosystem, continental, and global processes. However,
since remote sensing data and tools are not straightforward to master, training at the
higher education level is often necessary. Curricula and training programs linking
these integral components of phenological research are sorely needed because the
number of people with requisite skills in the use of a growing array of sophisticated
analytical tools and collected remote sensing data is still quite small. In this chapter
we provide a series of examples of field-based approaches to college- and
K.M. de Beurs (*)
Department of Geography and Environmental Sustainability, The University of Oklahoma,
Norman, OK 73019, USA
e-mail: [email protected]
R.B. Cook
Environmental Sciences Division, Oak Ridge National Laboratory, Oak Ridge,
TN 37831, USA
S. Mazer • B. Haggerty
Department of Ecology, Evolution, and Marine Biology, University of California,
Santa Barbara, CA 93106, USA
A. Hove
Biology Department, Warren Wilson College, Asheville, NC 28815, USA
G.M. Henebry
Geographic Information Science Center of Excellence, South Dakota State University,
Brookings, SD 57007, USA
L. Barnett
Education Program, USA National Phenology Network, National Coordinating Office,
Tucson, AZ 85721, USA
C.L. Thomas • B.R. Pohlad
Ferrum College, School of Natural Sciences and Mathematics, Ferrum, VA 24088, USA
M.D. Schwartz (ed.), Phenology: An Integrative Environmental Science,DOI 10.1007/978-94-007-6925-0_31, © Springer Science+Business Media B.V. 2013
585
university-level phenological education. We then guide the reader through the
resources that are available for the integration of remote sensing with land-based
phenological monitoring and suggest potential ways of using these resources.
31.1 Introduction
In 1974, Forest Stearns wrote a chapter on “Phenology and Environmental
Education” for the book “Phenology and Seasonality Modeling” edited by Helmut
Lieth. Stearns remarked on the utility of phenology as a theme for every level of
education because it helps to make the complexity of interactions between organisms
and their environment relevant to students (Stearns 1974). However, he found that
there were no articles on phenology in American Biology Teacher and only one in
Science Teacher, the two leading science education journals of the day. Almost
40 years later, the interest in phenology among educators, ecologists, botanists,
zoologists, geographers, climatologists, and amateur naturalists has increased greatly.
As a result, many more phenological education resources are now available online,
including indoor and outdoor activities for audiences ranging from K-12 to college
students to the general public. In the United States, for example, some agencies and
institutions tasked with educating students and the public about climate change have
been developing phenology-themed programs, many of which make use of the
growing number of internet-based public participation programs. Moreover, pheno-
logical education provides a unique opportunity for participants to explore the
relationship between science, nature, and themselves. These educational programs
help students develop critical thinking skills and an understanding of how science and
the natural world affect their daily lives. The program in the U.S. that facilitates the
collection, reporting, and interpretation of phenological data among public participa-
tion programs and across federal, non-governmental, and academic institutions is the
USA National Phenology Network (USA-NPN; www.usanpn.org).
Educational objectives of the USA-NPN include recruiting and training
scientists, students, teachers, outdoor educators, land stewards, and community
members to contribute accurate phenological data to the growing national database
and to participate in its quantitative analysis and interpretation (USA-NPN National
Coordinating Office 2012). Other outcomes for participants include understanding
the importance of phenology as an indicator of the health of our environment,
spending more time engaged in nature, and becoming scientifically literate by
engaging in scientific data collection, analysis, and interpretation. A variety of
education and training materials are available on the USA-NPN’s Education
website (www.usanpn.org/education), both specific to its on-line data collection
interface, Nature’s Notebook, as well as to other phenology programs, including a
suite of “phenological and climate change literacy” resources designed specifically
for K-12, college, and public audiences, created by the Phenology Stewardship
Program at the University of California, Santa Barbara (Mazer lab, Department
of Ecology, Evolution and Marine Biology). The USA-NPN Education Program
586 K.M. de Beurs et al.
is also creating a suite of site-based engagement materials for facilitating
community-based phenological education programs. Additional examples of
well-known and successful public participation programs include the international
Global Learning and Observations to Benefit the Environment (GLOBE) program,
Canada’s PlantWatch, Project Budburst (USA), and the California Phenology
Project (described later in this chapter). Each of these programs offers materials
for educators to incorporate the monitoring of plant phenology into the activities of
traditional and non-traditional classrooms.
Since phenology is an integrative science drawing from numerous scientific
disciplines, there are many topics in environmental science with which to engage
students and the public in learning phenology. The interdisciplinary nature of pheno-
logical research challenges current and new generations of scientists, educators, and
students to learn a variety of Science, Technology, Engineering, and Mathematics
(STEM) skills across several disciplines. However, resources for educating certain
audiences (e.g., college, university) and disciplines (e.g., remote sensing, spatial
analysis) are currently limited. This is especially unfortunate because, while there
has been considerable attention paid to promoting the recording of phenological
observations by younger students (grades K-12) and citizen scientists, the number of
people with requisite skills to use the growing array of sophisticated analytical tools
and collected data is still quite small (Dickinson et al. 2010).
New spatial analysis methods and an increasing amount of satellite data are the
necessary tools for using ground-based measurements to make inferences about larger
ecosystem, continental, and global processes. However, these analytical tools and data
sets are not straightforward to master and training is often necessary (Dickinson et al.
2010). Although a small suite of educational and trainingmaterials has been developed
to address the gaps for undergraduate and post-graduate audiences (described in the
field based section below: Haggerty and Mazer 2009; Haggerty et al. 2012a, b; Hove
et al. 2012a, b), these resources do not directly link ground-level phenological
observations with remotely sensed measurements. Both curricula and training
programs to link these integral components of phenological research are sorely needed.
In this chapter we provide examples of field-based, phenology-themed college-
and university-level education and then guide the reader through resources avail-
able for the integration of remote sensing with land-based phenological monitoring.
We also suggest potential ways of using the resources. As there are many resources
available, it is difficult to be comprehensive. The resources discussed here focus
primarily on ongoing initiatives in North America that have English language web
links. While we are aware of some interesting initiatives going on in other parts of
the world, many of their websites are not available in English.
31.2 Field-Based Activities and Examples
To engage all components of the public in nationwide (and international) pheno-
logical monitoring efforts, it is essential to: expand educational efforts at the college
and university level; provide training in the interpretation of phenological data and
31 Phenology in Higher Education: Ground-Based and Spatial Analysis Tools 587
its link to climate change; expand public outreach efforts; demonstrate real-world
applications of phenology and its relevance to career training and choices; and
include phenological training for pre-service and active teachers enrolled in
credential or professional development programs. Undergraduate training programs
should provide greater breadth and depth particularly in the STEM skills necessary
to train the next generation of scientists interested in the intersection of biology,
ecology, geography, and climatology. To demonstrate the relationships among
these disciplines, undergraduate interdisciplinary programs should promote and
illustrate the use of long-term phenological data in scientific research. Overall,
there are far fewer phenological educational settings aimed at training young
scientists at the undergraduate level than K-12 phenology programs. However,
over the past few years, college-based phenology programs have started to develop
(Chen 2003; Long and Wyse 2012); both the USA-NPN and the CPP now offer
materials appropriate for college settings (http://www.usanpn.org/cpp/education).
Three examples of classroom-based phenology training materials recently
designed for undergraduate and post-graduate audiences include: the PhenologyHandbook (Haggerty and Mazer 2009); the Primer on Herbarium-Based Pheno-logical Research for tracking historical trends in flowering phenology (Haggerty
et al. 2012a), which includes a sample data set and a guided spreadsheet-based
analytical exercise (Haggerty et al. 2012b); and a suite of annotated undergraduate
lectures and seminar modules designed to guide discussions of the primary research
literature (Hove et al. 2012a, b). All of these materials, and others for K-12 and
public audiences, are described and freely available online at the California
Phenology Project’s education website (www.usanpn.org/cpp/education). These
materials may help educators provide a useful entry point into phenological
research for their students by introducing the motivation for phenological monitor-
ing, its history in the U.S. and elsewhere, the ecological interpretation of long-term
phenological shifts, the links between phenology and climate change, the protocols
of the USA-NPN, and the botanical observational skills necessary for the accurate
reporting of the phenological status of individual plants.
31.2.1 California Phenology Project
The California Phenology Project (www.usanpn.org/cpp) is the first statewide
effort to assess the effects of climate change on California’s diverse landscapes.
Established in 2010 with funding from the National Park Service Climate Change
Response Program, the project includes a citizen science program that contributes
data directly to USA-NPN’s Nature’s Notebook. The CPP takes a “train-the-
trainer” approach, where training workshops are delivered primarily for
participants who will themselves deliver continued training sessions for their
staff, for place-based volunteers dedicated to monitoring geo-referenced and
labeled plants at particular national parks, and for the public. The long-term aims
of the CPP include: testing and refining USA-NPN protocols for ground-based
588 K.M. de Beurs et al.
phenological monitoring; creating tools and infrastructure to establish long-term
phenological monitoring in California national parks, University of California
Natural Reserve System, and public lands; informing decisions routinely made by
land managers that depend on the timing of phenological events; and developing
materials to help park staff and educators to communicate to the public how the
seasonal cycles of natural resources in the parks are affected by inter-annual
variation in climate and by climate change.
The CPP was funded initially to establish phenological monitoring programs in
seven national parks and recreation areas in California. These pilot parks range
from those with high visitation from nearby urban populations (e.g., Santa Monica
Mountains National Recreation Area [NRA], Golden Gate NRA, and John Muir
National Historic Site) to remote parks with relatively little visitation and a small
community of volunteers (e.g., Lassen Volcanic National Park). The pilot parks
were also selected to represent a wide range of ecosystems and biogeographic
regions. Coastal region chaparral, prairie, and forests are represented by Santa
Monica Mountains NRA, Golden Gate NRA, John Muir National Historic Site,
and Redwood National and State Parks. Montane plant communities are
represented by Lassen Volcanic National Park and Sequoia & Kings Canyon
National Parks. Desert communities are represented by Joshua Tree National
Park. Several of these parks work actively with outdoor schools and/or local
teachers (e.g., NatureBridge, the National Park Service “Parks as Classrooms”
and Teacher-Ranger-Teacher programs- www.nps.gov/learn/trt/, and regional
school districts) to incorporate phenological monitoring into residential or single-
visit programs.
The CPP offers materials and phenology-themed lesson plans to guide educators
using a variety of approaches, including seminar modules (appropriate for advanced
undergraduate or graduate education, and including guided discussions of the
primary literature), practical instructions for the use of herbarium specimens to
detect historical changes in phenology (targeted towards undergraduates and adult
citizen scientists), annotated lectures (to introduce university students and citizen
scientists to the study of phenology and its link to climate and climate change),
hands-on interactive activities (appropriate for middle-school through adult educa-
tion), outdoor activities (for middle school through adult education), and a step-by-
step guide for the construction and use of native plant gardens designed for
phenological monitoring.
Plant species adapted to Mediterranean, semi-arid, and arid environments, such as
the California chaparral, high- and low-elevation deserts, and the southwestern U.S.
present a number of challenges for phenological monitoringwhether on-the-ground or
remotely sensed. For example, compared to the highly seasonal temperate zone, where
the onset of an individual plant’s growing season can be clearly defined by the opening
of large, dormant, well-protected winter buds and the subsequent synchronous emer-
gence of young leaves, the growing season for many species adapted to Mediterra-
nean, frost-free, and desert environments is poorly defined.Many species of long-lived
perennials, shrubs, and trees adapted to these habitats are semi-deciduous and do not
produce visible vegetative buds that remain dormant until the growing season is
31 Phenology in Higher Education: Ground-Based and Spatial Analysis Tools 589
initiated. Rather, they produce leaves opportunistically from meristematic tissue
(typically located in the axils of leaves or at stem tips) whenever conditions allow,
usually after precipitation events. Consequently, a “growing season” of such plants is
an episodic process that can recur multiple times from spring through autumn. The
total length of the growing season may be determined as much by the temporal
distribution of rainfall events as by the total amount of rain occurring during the wet
season. Compared to the temperate zone, where the end of the growing season is
determined by the onset of cool temperatures and the timing of the first frost, the
termination of annual growth is not well-defined in frost-free environments of the
western and southwestern U.S.
Consequently, participants in phenological monitoring networks who observe
plants in these environments must be counseled that the onset of vegetative growth
may occur multiple times throughout the year, such that capturing all of these
events requires an extended period of vigilance that is not essential in more seasonal
environments. When the California Phenology Project offers training events focus-
ing on these species (e.g., Adenostoma fasciculatum, Baccharis pilularis,Coleogyne ramosissima, Eriogonum fasciculatum, Larrea tridentata, and Mimulusauriantiacus), instructors take care to point out the locations on plants (apical
meristems) where new growth (both vegetative and reproductive) occurs. This
training helps participants to seek evidence for newly occurring leaf growth in
the absence of large, conspicuous buds.
31.2.2 Phenology Gardens and Trails
Phenology gardens are planned landscapes established for the purpose of monitor-
ing plant and animal phenology. Phenology gardens have been planted and
monitored by agricultural climatologists since the 1950s to study and better predict
growing seasons across Europe (International Phenology Gardens) and across the
U.S. (Lilac Phenology Network). Although established with short-term interests in
mind, accumulated data from these projects have helped to form the foundation of
knowledge about long-term phenological responses to climate change in Europe
(Menzel 2000; Chmielewski and Rotzer 2001) and the U.S. (Cayan et al. 2001;
Primack and Miller-Rushing 2009). With careful planning such gardens are able to
distinguish environmentally-induced from genetically-based variation in phenol-
ogy and to detect genetic variation in the phenological response to climate change.
More recently, the educational values of phenology gardens are being identified
and developed. In Phenology Gardens: a practical guide for integrating phenologyinto garden planning and education (Haggerty et al. 2012c), the authors provide
conceptual background and suggestions for planning and establishing phenology
gardens to maximize scientific, educational, ecological, and societal goals (includ-
ing aligning gardens with USA National Phenology Network programs). They also
provide case studies from four native plant phenology gardens established in
southern coastal California in collaboration with the USA-NPN, US Geological
590 K.M. de Beurs et al.
Survey, and US Fish & Wildlife Service. A network of more than 15 phenology
gardens, each containing a similar suite of native plant species, has been established
at schools, community centers, and universities in the region, largely due to
continued efforts by the Ventura office of the US Fish & Wildlife Service.
Phenological data collected in the gardens have been reported to the USA-NPN’s
Nature’s Notebook.The USA-NPN also has developed an implementation guide for creating
Phenology Trails, The Phenology Trail Guide: An experiential education tool forsite-based community engagement (USA-NPN National Coordinating Office 2012).
Phenology Trails are networks of Nature’s Notebook observation sites linked
together to provide participants places to visit, enjoy nature, collect data, and
learn about supporting organizations and their efforts related to phenological
research. Such trails further serve the purpose of collective engagement, meaning-
ful learning, and development of community.
Phenology gardens and trails can be established relatively easily in K-12, college,
or public settings, thereby creating an outdoor classroom that can be revisited easily
over time for phenological monitoring and basic instruction in plant biology. With
some planning, phenology gardens can be integrated into many curricular goals and
topics for all ages. Thus, phenology gardens provide a valuable setting for developing
a broad range of concepts and skills spanning STEM, humanities, and fine arts topics.
As such, phenology gardens can provide a single unifying platform for integrative
environmental education. For example, Haggerty, Hove, and Mazer developed sev-
eral activities that use USA-NPN protocols, including Flight of the Pollinators(Haggerty et al. 2012d), Ethnophenology (Haggerty et al. 2012e), Phenology RelayRace (Haggerty 2012a), and standards-aligned lesson plans (Haggerty 2012b). Theseresources are described and available on the California Phenology Project’s educa-
tion website (www.usanpn.org/cpp/education).
31.2.3 Phenology at Ferrum College
As an illustration we discuss how the study of phenology is integrated into science
instructions at Ferrum College (www.ferrum.edu), a small undergraduate college in
Virginia. Faculty at Ferrum College have introduced phenology into horticulture
and environmental sciences courses by using the Project BudBurst website to teach
phenology and climate change. Here are two examples of class assignments.
31.2.3.1 Making Phenological Observations of Campus Species
This module was used in Introductory Horticulture (HOR/AGR 219) at Ferrum
College in the spring semester of 2010. This introductory class targets both horti-
culture and agriculture majors. The purpose of the exercise is to increase student
awareness of plant cycles by using the plants in the Ferrum Community Arboretum
31 Phenology in Higher Education: Ground-Based and Spatial Analysis Tools 591
for observation. Horticulture and agriculture students must make decisions on plant
management based upon predicted climate change. These decisions may, for
example, include planting dates, germination rate, and pest management. By
completing this exercise and monitoring plant phenological schedules, students
can begin to understand the complexities of plant cycles as they relate to climate
as well as the growth and management of plants in controlled settings. By entering
their data into the national database, students in subsequent courses can use these
data to discuss phenological trends that may be related to climate change.
In lab, students were told they would be doing an exercise on the phenology of
plants. Each student was given a pre-test to determine their familiarity with
phenology, plant identification, and plant growth as it relates to climate change.
Students were then given a handout obtained from the Project Budburst site and
asked to review the information. Following a discussion which focused on phenol-
ogy of the plant species growing on campus and plant life cycles, the class went to
the computer laboratory to log onto the Project BudBurst website (neoninc.org/
budburst). After reading the introductory information, they were instructed to enter
the online BudBurst guide.
31.2.3.2 Using Project Budburst to Study the Effects of Climate Change
on Plant Phenology
The goal of the module developed for this project was to acquaint students with the
impacts of climate change on the seasonal biological cycles by having them
contribute to a worldwide phenological study. The students recorded and reported
their phenological observations using the Project BudBurst website.
Student teams (two students) in Environmental Sciences and Issues inAppalachia (ESC 110) participated in this project by choosing a plant (tree,
shrub, or annual plant) from the Project BudBurst list of plants of interest. Students
made twice-weekly observations and took photos with a digital camera or their cell
phones for 7 weeks during the spring semester of 2010 at Ferrum College. Student
observations and photos were uploaded to ANGEL, the learning management
system at Ferrum College. At the end of the observation period (end of April),
each student team had approximately 14 observations and photos. Some student
teams did not observe first leaf and most did not observe first bud because of the
timing of the spring semester relative to the onset of spring in Ferrum, Virginia
(37�590N, 79�590W, elevation ¼ 437 m) which starts at the very end of the spring
semester. The student collected observations and photos were collated and
summarized at the end of the class project by the student project assistant. The
data were summarized by plant species and phenophase and then entered into the
Project BudBurst database by the student project assistant. Assessment of these
class activities was accomplished by administering a pre-test and a post-test and
making note of number of observations and photos.
592 K.M. de Beurs et al.
31.3 Remote Sensing
There is a place in college-level classes for the analysis of satellite imagery without
the need to provide more than basic knowledge in remote sensing. Students can be
introduced to basic remote sensing principles and the tools to download remotely
sensed data. In addition, they can learn how to interpret image time series with
respect to phenological monitoring. Several resources are available for downloading
and processing of satellite data. In this section we limit our discussion to resources
that focus directly on links between remote sensing and phenological data.
Land surface phenology (LSP) explores how quasi‐periodic events in terrestrial
vegetation (e.g., budburst, leaf out, flowering, senescence) appear when observed
by remote sensing technologies. LSP can be studied by means of vegetation indices
calculated from optical sensors, such as the Advanced Very High Resolution
Radiometer (AVHRR) polar orbiting sensors as well as the newer Moderate
Resolution Imaging Spectroradiometer (MODIS) sensors on the Terra and Aqua
satellites which provide higher spatial resolutions (250–1000m) than the older but
still operational AVHRR series (1–8 km). Land surface phenological metrics are
primarily based on image time series of vegetation indices (VI). These phenological
metrics aim to retrieve onset of greening, timing of the peak of the growing season,
senescence, and the growing season length based on analysis of the VI curve (Reed
et al. 1994; Zhang et al. 2003, 2004; White et al. 2009; de Beurs and Henebry
2010a). Vegetation indices such as the Normalized Difference Vegetation Index
(NDVI) and the Enhanced Vegetation Index (EVI) are surrogate measures for
aboveground net primary production, and in recent years, considerable effort has
been made to link the global NDVI variability to temperature, precipitation, and
atmospheric CO2 (Myneni et al. 1997; Tucker et al. 2001; Lee et al. 2002; Dye and
Tucker 2003; Zhou et al. 2003).
As such, LSP provides an important method for detecting responses to climate
change in terrestrial ecosystems. Changes in LSP (sometimes erroneously called
“greenness”) have often been detected as trends in NDVI products over multiple
years (e.g. Dye and Tucker 2003; Beck et al. 2006; Julien et al. 2006; Bradley et al.
2007; Potter et al. 2007; de Beurs et al. 2009; White et al. 2009; de Beurs and
Henebry 2010b). These changes in the timing or intensity of the phenological signal
over multiple years are frequently interpreted as resulting directly from climate
change, particularly warming or droughts (Potter and Brooks 2001; de Beurs et al.
2009; Brown et al. 2010). Thus, there is great potential for college and graduate
training in LSP and remote sensing to contribute to new generations of climate
change scientists.
Although college-level geography classes generally provide students with an
introduction to remote sensing and training using remote-sensing software
packages such as ERDAS Imagine, PCI Geomatics, or Exelis ENVI, remote sensing
classes do not necessarily discuss land surface phenology and how to link these
observations with ground level observations of individual plants, populations, or
communities. This omission is especially unfortunate given the number of
31 Phenology in Higher Education: Ground-Based and Spatial Analysis Tools 593
resources that are available to facilitate the use and analysis of long-term image
time series. Moreover, even courses that are not specifically focused on remote
sensing may now introduce the analysis of satellite imagery in their programs. The
tools and data sources discussed in the last section of this chapter are provided as a
resource for instructors aiming to enhance their college-level classes by training
students not only to collect and to interpret ground level observations, but also to
link these observations with satellite observations (Table 31.1).
31.3.1 USGS Remote Sensing Phenology
The USGS website Remote Sensing Phenology provides an overview of how remote
sensing can be used to monitor phenology (http://phenology.cr.usgs.gov/index.php).
This resource also provides a short explanation of data, sensors, and methods
available, and offers the opportunity to download remotely sensed phenological
indicators at 1km spatial resolution over the Continental United States (CONUS)
derived from AVHRR data. The data are available from 1989 to 2010. The
downloaded files are available as png images, which can be viewed in any image
viewing program, and as flat binary files in band sequential format that can be opened
with specialized remote sensing programs such as Exelis ENVI, ERDAS Imagine, or
PCI Geomatica, as well as ESRI ArcMap. While there are no specific educational
modules available, the data could be incorporated easily into college classes.
31.3.2 ORNL DAAC (Distributed Active Archive Centerfor Biogeochemical Dynamics)
The National Laboratory Distributed Active Archive Center (ORNL DAAC;
daac.ornl.gov/MODIS/modis.html) provides users with easy-to-use data files in
text or GeoTIFF format of MODIS phenology products for any site on land, user-
selected area from one pixel up to 200 � 200 km, and time period between 2000
and the present (Table 31.2; SanthanaVannan et al. 2009). In addition, the subsets
are online in interactive time series plots that reveal the timing of vegetation
events. The products are thus especially well-suited to be used in a college course
on the monitoring of land surface phenology. Students are able to select a defined
research area using a Google Map interface and then to download subsets of
satellite data up to 4,000 km2. The ORNL DAAC offers the download of most
basic MODIS products including vegetation indices (MOD13Q1), leaf area index
(LAI), fraction of photosynthetically active radiation (FPAR) (MOD15A2), and
gross primary productivity (MOD17A2). The selected data can be downloaded as
GeoTIFF files in their original sinusoidal projection. These images can be
incorporated into any remote sensing program and ESRI’s ArcMap. In addition
594 K.M. de Beurs et al.
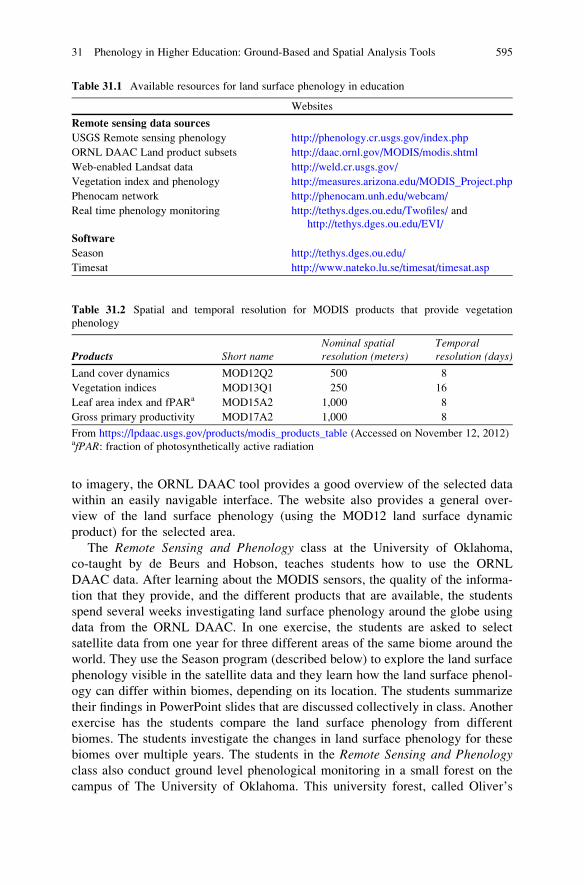
to imagery, the ORNL DAAC tool provides a good overview of the selected data
within an easily navigable interface. The website also provides a general over-
view of the land surface phenology (using the MOD12 land surface dynamic
product) for the selected area.
The Remote Sensing and Phenology class at the University of Oklahoma,
co-taught by de Beurs and Hobson, teaches students how to use the ORNL
DAAC data. After learning about the MODIS sensors, the quality of the informa-
tion that they provide, and the different products that are available, the students
spend several weeks investigating land surface phenology around the globe using
data from the ORNL DAAC. In one exercise, the students are asked to select
satellite data from one year for three different areas of the same biome around the
world. They use the Season program (described below) to explore the land surface
phenology visible in the satellite data and they learn how the land surface phenol-
ogy can differ within biomes, depending on its location. The students summarize
their findings in PowerPoint slides that are discussed collectively in class. Another
exercise has the students compare the land surface phenology from different
biomes. The students investigate the changes in land surface phenology for these
biomes over multiple years. The students in the Remote Sensing and Phenologyclass also conduct ground level phenological monitoring in a small forest on the
campus of The University of Oklahoma. This university forest, called Oliver’s
Table 31.2 Spatial and temporal resolution for MODIS products that provide vegetation
phenology
Products Short nameNominal spatialresolution (meters)
Temporalresolution (days)
Land cover dynamics MOD12Q2 500 8
Vegetation indices MOD13Q1 250 16
Leaf area index and fPARa MOD15A2 1,000 8
Gross primary productivity MOD17A2 1,000 8
From https://lpdaac.usgs.gov/products/modis_products_table (Accessed on November 12, 2012)afPAR: fraction of photosynthetically active radiation
Table 31.1 Available resources for land surface phenology in education
Websites
Remote sensing data sources
USGS Remote sensing phenology http://phenology.cr.usgs.gov/index.php
ORNL DAAC Land product subsets http://daac.ornl.gov/MODIS/modis.shtml
Web-enabled Landsat data http://weld.cr.usgs.gov/
Vegetation index and phenology http://measures.arizona.edu/MODIS_Project.php
Phenocam network http://phenocam.unh.edu/webcam/
Real time phenology monitoring http://tethys.dges.ou.edu/Twofiles/ and
http://tethys.dges.ou.edu/EVI/
Software
Season http://tethys.dges.ou.edu/
Timesat http://www.nateko.lu.se/timesat/timesat.asp
31 Phenology in Higher Education: Ground-Based and Spatial Analysis Tools 595
Woods, contains a trail with more than 100 geo-referenced trees representing more
than 15 different species (oudaily.com/news/2012/may/01/class-collects-informa-
tion-plant-growing-seasons). Students link these ground-based observations with
the MODIS data retrieved from the ORNL DAAC.
31.3.3 Web-Enabled Landsat Data (WELD)
The NASA-funded WELD project provides Landsat 7 ETM + terrain corrected
mosaics at several temporal resolutions for the conterminous United States and
Alaska. The Landsat 7 images offer 30-m resolution, which is finer than the MODIS
(250–500 m) or AVHRR (1–8 km) data that are frequently used for phenological
monitoring. In addition to top of atmosphere (TOA) reflectance data, the project
delivers NDVI data and several quality flags. The ‘what you see is what you get’
ordering system allows the ordering of custom size mosaics that are delivered as
geotiff data and can easily be incorporated into remote sensing software or ESRI
ArcMap. In addition to the ordering of image mosaics, the systems allows for the
ordering of time series from a specific 30 m by 30 m area. These data are delivered
as text files that can be analyzed easily in spreadsheet software. This last option is
particularly interesting for those who do not need entire image mosaics. One
interesting exercise for students is to investigate the land surface phenology over
a given land cover type across a north–south gradient, for example by selecting one
pixel per state from North Dakota to Texas. The data can be plotted in spreadsheet
software to investigate the effect of latitude on the development of land surface
phenology. Another potential exercise is to compare the land surface phenology of
different crop types (e.g., spring wheat, soybeans, corn, and winter wheat), within
and across latitudes or elevations.
31.3.4 PhenoCam Network
The PhenoCam network is a continent-wide monitoring effort in North America
(focused in the U.S.) that provides automated, near-surface remote sensing
through the use of high-resolution webcams. The images are uploaded to the
PhenoCam website every half hour (Richardson et al. 2007; www.oeb.harvard.
edu/faculty/richardson/phenocam.html) and are available for educational and
scientific use after registration (see Chap. 22 in this volume). Although the
PhenoCam network does not offer any specific educational opportunities, it
is not difficult to incorporate these images into college-level education. For
example, when learning how to interpret land surface phenology signals, it is
often beneficial for students to observe how each vegetation index corresponds
to the phenological progress of vegetation on the ground. While a ground-based
investigation close to campus is often ideal, students may supplement these data
with observations from other ecosystems, such as those monitored by the
phenocams.
596 K.M. de Beurs et al.
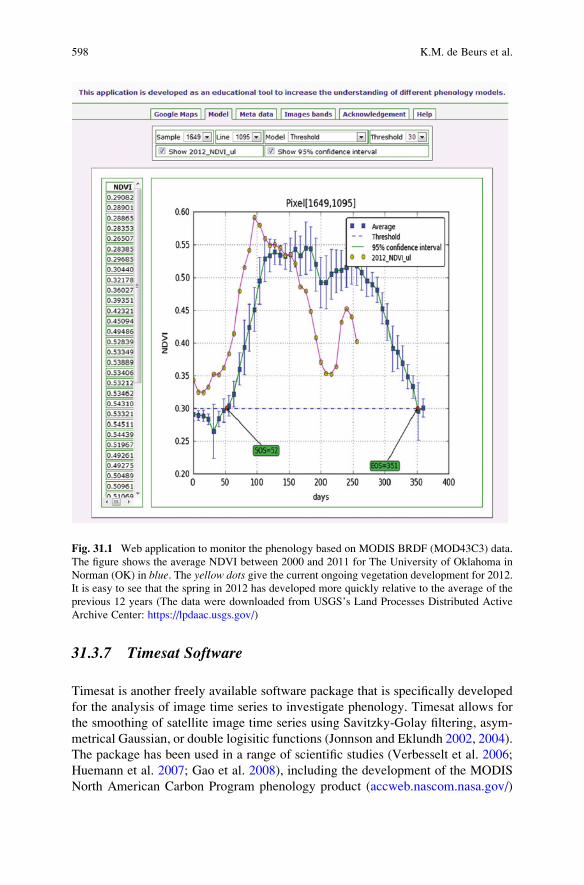
31.3.5 Real Time Phenological Monitoring Application
If we are interested in the analysis of land surface phenology and the coupling of
these remotely sensed observations with ground observations, it may not be
necessary to learn specialized (and relatively expensive) remote sensing soft-
ware packages. A freely available online application (tethys.dges.ou.edu/
Twofiles/) was developed by de Beurs to enable the monitoring of land surface
phenology over North America. The application allows for the selection of one
0.05� by 0.05� area based on a Google Earth map of any location in North
America. Upon selection of an area, the application then reveals the average
land surface phenology of all available years (currently 2000–2011) based on
phenology derived from the MODIS Nadir BRDF-Adjusted Reflectance (NBAR;
MOD43C3). The user can request standard errors for the NDVI values based on
all years to better understand temporal variability, and then compare the pheno-
logical cycle of the current year (now 2012) to that of previous years (Fig. 31.1).
The user may calculate the start and end of the growing season based on satellite
data by experimenting with different thresholds for the midpoint NDVI method
(White et al. 1997). This method was found to be one of the most accurate
methods in a large land surface phenology model evaluation study (White et al.
2009). The users can explore the effect of the different thresholds for the
estimation of the start and the end of the growing season. Data can be exported
as jpeg files and the time series can be transferred to spreadsheets for subsequent
analysis. A similar application is available to compare the standard vegetation
indices NDVI and EVI.
31.3.6 Season Software
The Season program is a freely available custom developed software package
developed by de Beurs (Fig. 31.2) that allows colleges and universities to adopt
remote sensing in classes that address phenology. It can ingest and process data
from the ORNL DAAC and it provides a range of widely used methods to estimate
the start and the end of the growing season. This flexibility enables students to
experiment with a range of different methods to enhance their understanding of the
differences among methods. Students can investigate individual grid cells and
output the information into basic spreadsheet programs or as jpg files that can be
incorporated into written reports (Fig. 31.2). They are also able to investigate a
range of MODIS products including the basic vegetation indices NDVI and EVI,
but also LAI, FPAR, and MODIS land surface temperature. This software was
developed for de Beurs’ Remote Sensing and Phenology classes at Virginia Tech
and at The University of Oklahoma. The program also has been successfully used in
professional workshops on land surface phenology at conferences of the US
Chapter of the International Association for Landscape Ecology (US-IALE) in
2008, 2010, and 2012.
31 Phenology in Higher Education: Ground-Based and Spatial Analysis Tools 597
31.3.7 Timesat Software
Timesat is another freely available software package that is specifically developed
for the analysis of image time series to investigate phenology. Timesat allows for
the smoothing of satellite image time series using Savitzky-Golay filtering, asym-
metrical Gaussian, or double logisitic functions (Jonnson and Eklundh 2002, 2004).
The package has been used in a range of scientific studies (Verbesselt et al. 2006;
Huemann et al. 2007; Gao et al. 2008), including the development of the MODIS
North American Carbon Program phenology product (accweb.nascom.nasa.gov/)
Fig. 31.1 Web application to monitor the phenology based on MODIS BRDF (MOD43C3) data.
The figure shows the average NDVI between 2000 and 2011 for The University of Oklahoma in
Norman (OK) in blue. The yellow dots give the current ongoing vegetation development for 2012.
It is easy to see that the spring in 2012 has developed more quickly relative to the average of the
previous 12 years (The data were downloaded from USGS’s Land Processes Distributed Active
Archive Center: https://lpdaac.usgs.gov/)
598 K.M. de Beurs et al.
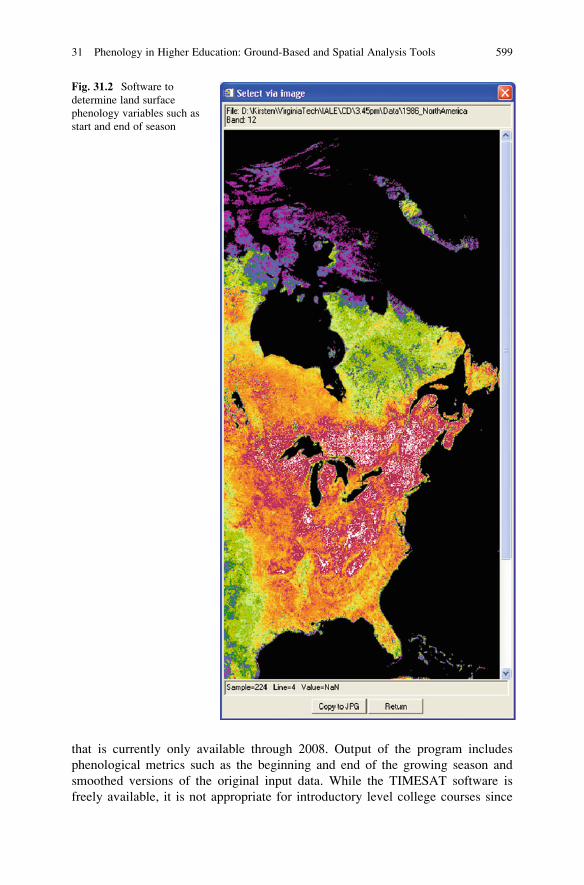
that is currently only available through 2008. Output of the program includes
phenological metrics such as the beginning and end of the growing season and
smoothed versions of the original input data. While the TIMESAT software is
freely available, it is not appropriate for introductory level college courses since
Fig. 31.2 Software to
determine land surface
phenology variables such as
start and end of season
31 Phenology in Higher Education: Ground-Based and Spatial Analysis Tools 599
there is a relatively steep learning curve. In addition, specialized remote sensing
software, such as Exelis ENVI or ERDAS Imagine is necessary to create the input
data for TIMESAT. More advanced students, however, may enjoy experimenting
with the program.
31.4 Conclusions
The interdisciplinary nature of phenological research challenges current and new
generations of scientists, educators, and students to learn a variety of Science,
Technology, Engineering, and Mathematics (STEM) skills across several
disciplines with the goal of developing the critical thinking skills necessary for
understanding human relationships to the natural world. There is an increasing
interest in training college and university students in remote sensing and spatial
analytical methods. Likewise, working with satellite data and spatial analyses are
essential skills for researchers wishing to extrapolate landscape-level processes
from ground-based phenological measurements. Curricula and training programs
linking these vital aspects of phenological research are just beginning to develop
but are sorely needed and can provide post-secondary students engagement in real-
world projects, thus informing career choice.
This chapter has discussed a number of resources for training students to take
field measurements, such as those provided by Project Budburst and the USA
National Phenology Network, as well as tools focused on the analysis of land
surface phenology data.
Acknowledgements We would like to acknowledge Elisabeth Beaubien for her substantial
contributions to an earlier version of this chapter.
References
Beck PSA, Atzberger C, Hogda KA, Johansen B, Skidmore AK (2006) Improved monitoring of
vegetation dynamics at very high latitudes: a new method using MODIS NDVI. Remote Sens
Environ 100(3):321–334
Bradley BA, Jacob RW, Hermance JF, Mustard JF (2007) A curve fitting procedure to derive
intern-annual phenologies from time series of noisy satellite NDVI data. Remote Sens Environ
106:137–145
Brown ME, de Beurs K, Vrieling A (2010) The response of African land surface phenology to
large scale climate oscillations. Remote Sens Environ 114(10):2286–2296. doi:10.1016/j.
rse.2010.05.005
Cayan DR, Kammerdiener SA, Dettinger MA, Caprio JM, Peterson DH (2001) Changes in the
onset of spring in the western United States. Bull Am Meteorol Soc 82:399–415
Chen X (2003) East Asia. In: Schwartz MD (ed) Phenology: an integrative environmental science.
Tasks for vegetation science, vol 39. Kluwer, Dordrecht
Chmielewski FM, Rotzer T (2001) Response of tree phenology to climate change across Europe.
Agr For Meteorol 108:101–112
600 K.M. de Beurs et al.
de Beurs KM, Henebry GM (2010a) Spatio-temporal statistical methods for modelling land
surface phenology. In: Hudson IL, Keatley MR (eds) Phenological research: methods for
environmental and climate change analysis. Springer, Dordrecht. doi:10.1007/978-90-481-
3335-2_9
de Beurs KM, Henebry GM (2010b) A land surface phenology assessment of the northern polar
regions using MODIS reflectance time series. Can J Rem Sens 36:S87–S110
de Beurs KM, Wright CK, Henebry GM (2009) Dual scale trend analysis distinguishes climatic
from anthropogenic effects on the vegetated land surface. Environ Res Lett 4:045012
Dickinson JL, Zuckerberg B, Bonter DN (2010) Citizen science as an ecological research tool:
challenges and benefits. In: Futuyma DJ, Shafer HB, Simberloff D (eds). Annu Rev Ecol Evol
System 41:149–172. Annual Reviews, Palo Alto. doi:10.1146/annurev-ecolsys-102209-
144636
Dye DG, Tucker CJ (2003) Seasonality and trends of snow-cover, vegetation index, and tempera-
ture in northern Eurasia. Geophys Res Lett 30(7):1405. doi:10.1029/2002GL016384
Gao F, Morisette JT, Wolfe RE, Ederer G, Pedelty J, Masuoka E, Myneni R, Tan B, Nightingale JM
(2008) An algorithm to produce temporally and spatially continuous MODIS-LAI time series.
IEEE Trans Geosci Remote Sens 5(1):1–5
Haggerty BP (2012a) Phenology relay race. Activity guide for K-16 and public audiences
reinforcing phenological monitoring protocols of the USA National Phenology Network.
Available online at the California Phenology Project website (www.usanpn.org/cpp/education)
Haggerty BP (2012b) Phenology gardens: lesson plans I & II. Standards-aligned lesson plans for
K-12 audiences to learn USA National Phenology Network monitoring protocols. Available
online at the California Phenology Project website (www.usanpn.org/cpp/education)
Haggerty BP, Mazer SJ (2009) The phenology handbook: a guide to phenological monitoring for
students, teachers, families, and nature enthusiasts. Extended conceptual and historical back-
ground, practical advice, field guides, and educational activities for introducing phenology to a
variety of audiences. Available online at the USA National Phenology Network website www.
usanpn.org/education
Haggerty BP, Hove AA, Mazer SJ (2012a) Primer on herbarium-based phenological research.
Guide for college and public audiences for understanding the use of preserved plants in climate
change research. Available online at the California Phenology Project website www.usanpn.
org/cpp/education
Haggerty BP, Hove AA, Mazer SJ (2012b) Skeletons in the closet: preserved plants reveal
phenological responses to climate change. Guide and practice data set for college and public
audiences for analyzing long-term phenological data. Available online at the California
Phenology Project website www.usanpn.org/cpp/education
Haggerty BP, Hove AA, Mazer SJ (2012c) Phenology gardens: a practical guide for integrating
phenology into garden planning and education. Available online at the California Phenology
Project website www.usanpn.org/cpp/education
Haggerty BP, Hove AA, Mazer SJ (2012d) Flight of the pollinators. Activity guide merging
phenology and pollination biology for K-16 and public audiences. Available online at the
California Phenology Project website www.usanpn.org/cpp/education
Haggerty BP, Hove AA, Mazer SJ (2012e) Ethnophenology. Activity guide merging phenology
and ethnobotany for K-16 and public audiences. Available online at the California Phenology
Project website www.usanpn.org/cpp/education
Hove AA, Mazer SJ, Haggerty BP (2012a) Phenology: the science of the seasons. Three-part
annotated lecture series for undergraduates. Available online at the California Phenology
Project website www.usanpn.org/cpp/education
Hove AA, Mazer SJ, Haggerty BP (2012b) Advanced topics in phenological and climate change
research. Nine-part graduate seminar series with peer-reviewed literature. Available online at
the California Phenology Project website www.usanpn.org/cpp/education
Huemann BW, Seaquist JW, Eklundh L, Jonsson P (2007) AVHRR derived phenological change
in the Sahel and Soudan, Africa, 1982–2005. Remote Sens Environ 108:385–392
Jonsson P, Eklundh L (2002) Seasonality extraction by function fitting to time-series of satellite
sensor data. IEEE Trans Geosci Remote Sens 40(8):1824–1831
31 Phenology in Higher Education: Ground-Based and Spatial Analysis Tools 601
Jonsson P, Eklundh L (2004) TIMESAT - a program for analyzing time-series of satellite sensor
data. Comput Geosci 30:833–845
Julien Y, Sobrino JA, Verhoef W (2006) Changes in land surface temperatures and NDVI values
over Europe between 1982 and 1999. Remote Sens Environ 103:43–55
Lee R, Yu F, Price KP, Ellis J, Shi P (2002) Evaluating vegetation phenological patterns in Inner
Mongolia using NDVI time-series analysis. Int J Remote Sens 23(12):2505–2512
Long T, Wyse S (2012) A season for inquiry: investigating phenology in local campus trees.
Science 335(6071):932–933. doi:10.1126/science.1213528
Menzel A (2000) Trends in phenological phases in Europe between 1951 and 1996. Int J
Biometeorol 44:76–81
Myneni RB, Keeling CD, Tucker CJ, Asrar G, Nemani RR (1997) Increased plant growth in the
northern high latitudes from 1981 to 1991. Nature 386(6626):698–702
USA-NPN National Coordinating Office (2012) The phenology trail guide: an experiential
education tool for site-based community engagement. USA-NPN Programmatic/Technical
Series 2012–001
Potter CS, Brooks V (2001) Global analysis of empirical relations between annual climate and
seasonality of NDVI. Int J Remote Sens 19(15):2921–2948
Potter C, Kumar V, Klooster S, Nemani RR (2007) Recent history of trends in vegetation
greenness and large-scale ecosystem disturbances in Eurasia. Tellus 59B:260–272
Primack RB, Miller-rushing AJ (2009) The role of botanical gardens in climate change research.
New Phytol 182:303–313
Reed BC, Brown JF, VanderZee D, Loveland TR, Merchant JW, Ohlen DO (1994) Measuring
phenological variability from satellite imagery. J Veg Sci 5:703–714
Richardson A, Jenkins J, Braswell B, Hollinger D, Ollinger S, Smith M-L (2007) Use of digital
webcam images to track spring green-up in a deciduous broadleaf forest. Oecologia
152(2):323–334. doi:10.1007/s00442-006-0657-z
SanthanaVannan SK, Cook RB, Holladay SK, Olsen LM, Dadi U, Wilson BE (2009) A web-based
subsetting service for regional scale MODIS land products. IEEE J Sel Top Appl 2
(4):319–328. doi:10.1109/JSTARS.2009.2036585
Stearns FW (1974) Phenology and environmental education. In: Lieth H (ed) Phenology and
seasonality modeling. Springer – Verlag, New York
Tucker CJ, Slayback DA, Pinzon JE, Los SO, Myneni RB, Taylor MG (2001) Higher northern
latitude normalized difference vegetation index and growing season trends from 1982 to 1999.
Int J Biometeorol 45(4):184–190
Verbesselt J, Jonsson P, Lhermitte S, van Aardt J, Coppin P (2006) Evaluating satellite and climate
data derived indices as fire risk indicators in Savanna ecosystems. IEEE Trans Geosci Remote
Sens 44(6):1622–1632
White MA, Thornton PE, Running SW (1997) A continental phenology model for monitoring
vegetation responses to interannual climatic variability. Glob Biogeochem Cycles 11
(2):217–234
White MA, de Beurs KM, Didan K, Inouye DW, Richardson AD, Jensen OP, O’Keefe J, Zhang G,
Nemani RR, van Leeuwen WJD, Brown JF, de Wit A, Schaepman M, Lin X, Dettinger M,
Bailey AS, Kimball JS, Schwartz MD, Baldocchi DD, Lee JT, Lauenroth WK (2009) Inter-
comparison, interpretation, and assessment of spring phenology in North America estimated
from remote sensing for 1982–2006. Glob Change Biol 15(10):2335–2359
Zhang X, Friedl MA, Schaaf CB, Strahler AH, Hodges JCF, Gao F, Reed BC, Huete A (2003)
Monitoring vegetation phenology using MODIS. Remote Sens Environ 84(3):471–475
Zhang X, Friedl MA, Schaaf CB, Strahler AH (2004) Climate controls on vegetation phenological
patterns in northern mid- and high latitudes inferred from MODIS data. Glob Change Biol 10
(7):1133–1145
Zhou L, Kaufmann RK, Tian Y, Myneni RB, Tucker CJ (2003) Relation between interannual
variations in satellite measures of northern forest greenness and climate between 1982 and
1999. J Geophys Res 108(D1):ACL 3-1–3-16. doi:10.1029/2002JD002510
602 K.M. de Beurs et al.