Embed Size (px)
Citation preview

Chapter 3
Industry Structure
March 2014
This chapter should be cited as
ERIA Study on the Development Potential of the Content Industry in East Asia and
ASEAN Region (2014), ‘Industry Structure’ in Koshpasharin, S. and K. Yasue (eds.),
Study on the Development Potential of the Content Industry in East Asia and the
ASEAN Region, ERIA Research Project Report 2012-13, pp.19-31. Jakarta: ERIA.
19
CHAPTER 3
Industry Structure
In this chapter, current status of the content industry structure is presented, to
overview the market revenue and potential growth for each country.
1. Market Size and Growth
1.1. Market Size of Content Industry
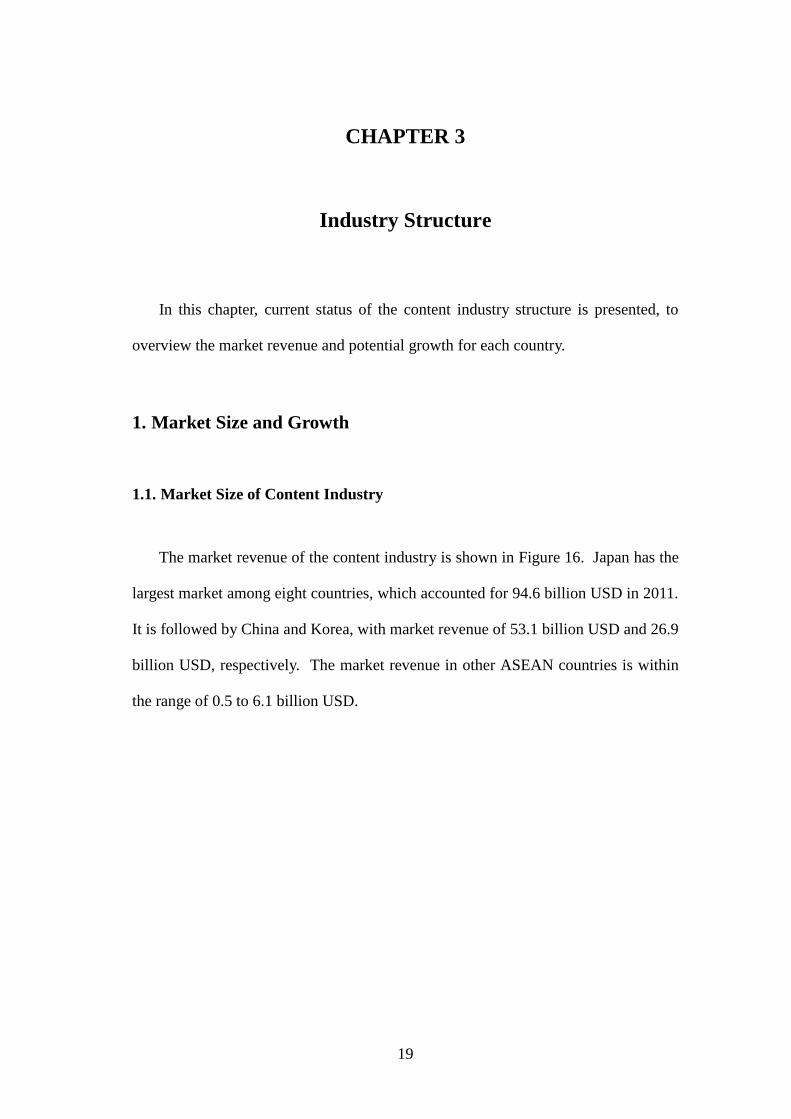
The market revenue of the content industry is shown in Figure 16. Japan has the
largest market among eight countries, which accounted for 94.6 billion USD in 2011.
It is followed by China and Korea, with market revenue of 53.1 billion USD and 26.9
billion USD, respectively. The market revenue in other ASEAN countries is within
the range of 0.5 to 6.1 billion USD.
20
Figure 16: Market Revenue in Each Country (2011)
Note: the vertical axis is different for left and right figure
Japan China Korea Thailand Indonesia Singapore Malaysia Philippines
TV broadcasting 53,114 43,071 11,509 3,585 2,164 2,543 1,567 161
Film 13,127 2,813 3,538 886 761 499 223 138
Animation 1,834** n/A 477 185 n/A n/A*** 127 132
Game 15,480 6,878* 7,946 1,067 453 506 49 50
Music 12,920 348* 3,445 407 518 283 56* 55*
Total 94,641 53,110 26,915 6,129 3,895 3,830 2,021 536
Note:* Quoted from PwC data / ** Included in TV broadcasting and Film / *** Included in
Film
Source: Statistics provided by member countries, PwC (2012).
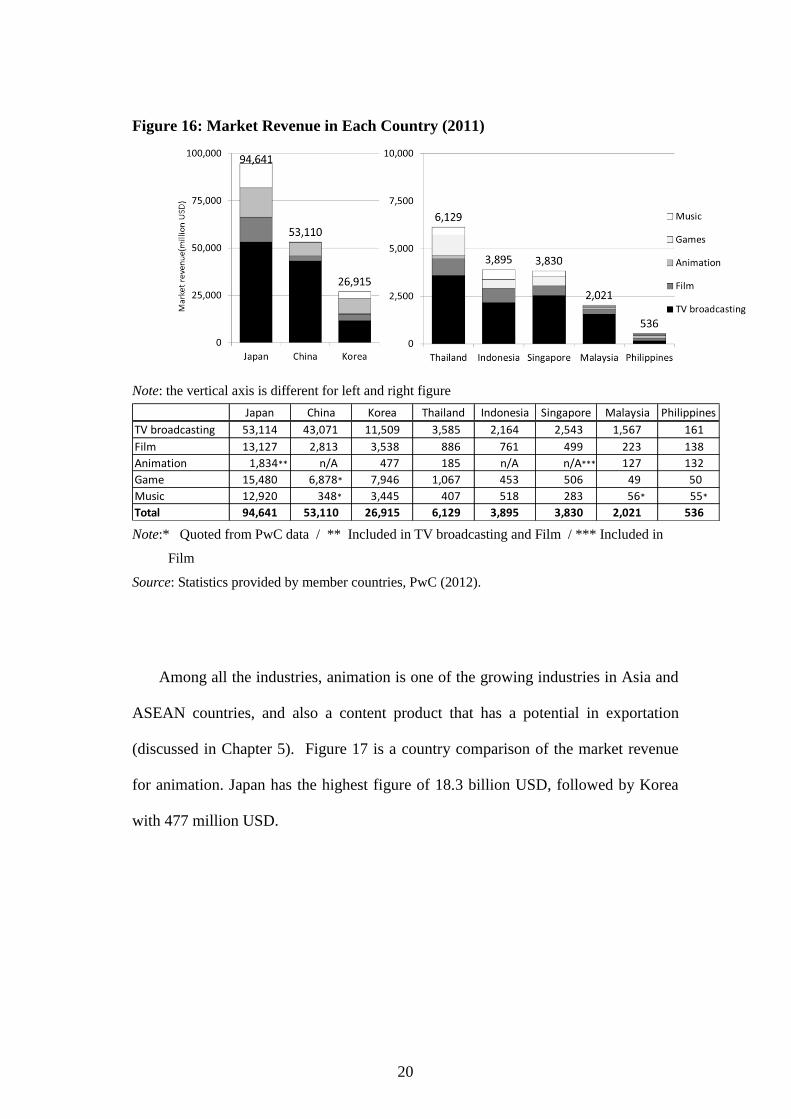
Among all the industries, animation is one of the growing industries in Asia and
ASEAN countries, and also a content product that has a potential in exportation
(discussed in Chapter 5). Figure 17 is a country comparison of the market revenue
for animation. Japan has the highest figure of 18.3 billion USD, followed by Korea
with 477 million USD.
21
Figure 17: Market Revenue for Animation (2011)
Source: Statistics provided by member countries.
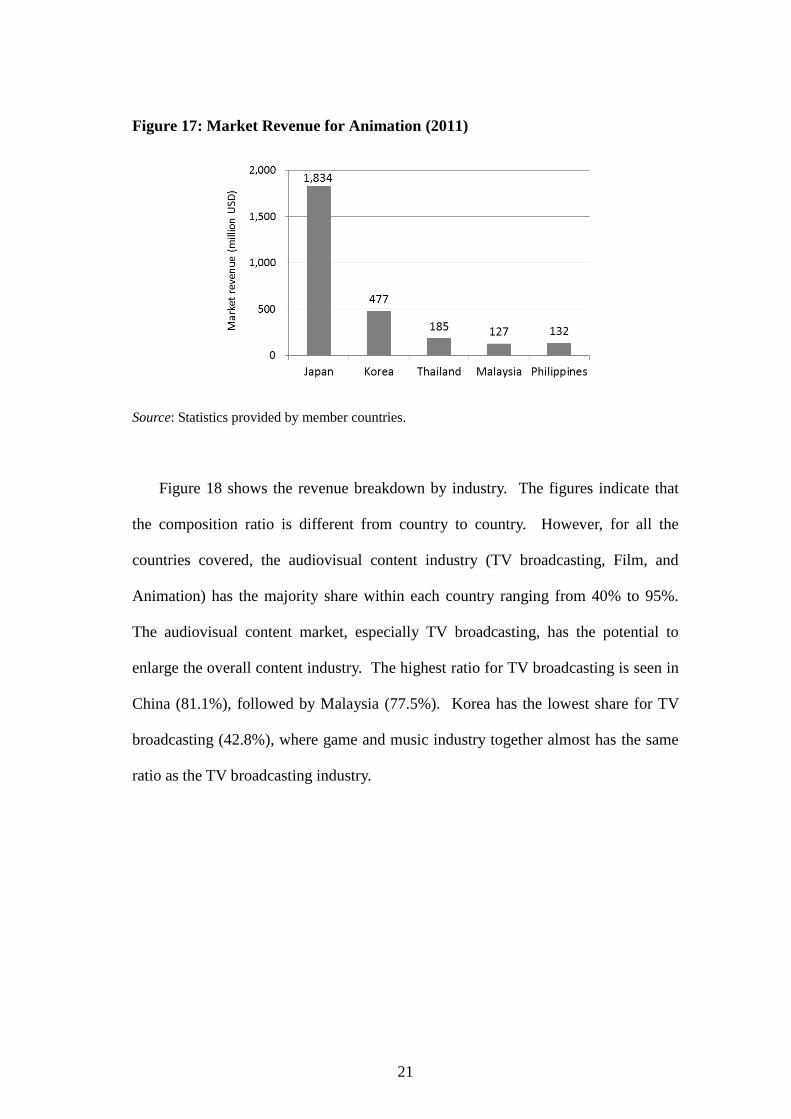
Figure 18 shows the revenue breakdown by industry. The figures indicate that
the composition ratio is different from country to country. However, for all the
countries covered, the audiovisual content industry (TV broadcasting, Film, and
Animation) has the majority share within each country ranging from 40% to 95%.
The audiovisual content market, especially TV broadcasting, has the potential to
enlarge the overall content industry. The highest ratio for TV broadcasting is seen in
China (81.1%), followed by Malaysia (77.5%). Korea has the lowest share for TV
broadcasting (42.8%), where game and music industry together almost has the same
ratio as the TV broadcasting industry.
22
Figure 18: Revenue Breakdowns by Industry (2011)
Source: Statistics provided by member countries, PwC (2012).
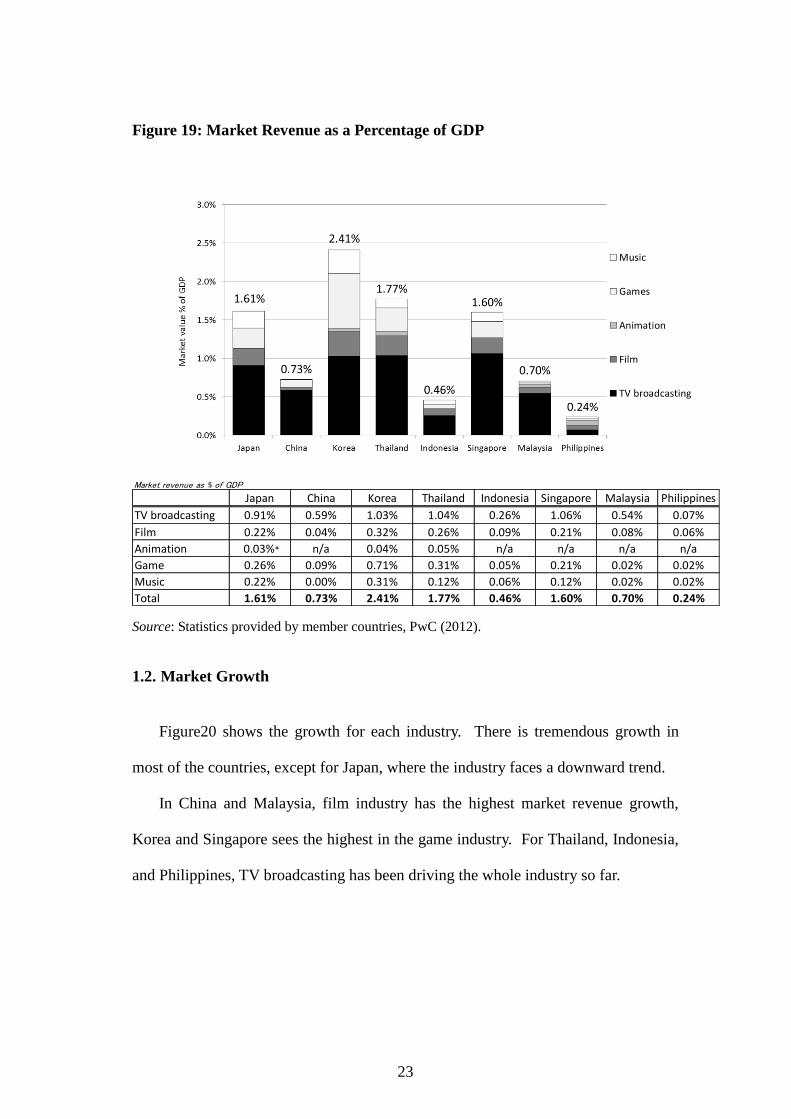
Figure 19 shows the market revenue as a percentage of GDP, or GDP ratio, for
2011. This indicator can be considered as a comparable benchmark as it neutralizes
each country’s economy size. Korea has the highest figure where content industry
accounted for 2.41% of GDP. Thailand has the 2nd highest figure with 1.8%, which
is higher compared to that of Japan, the largest industry by size.
Also, Japan, Korea, Thailand, Singapore has a similar GDP ratio for TV
broadcasting, indicating a common level of contribution to the economy. On top of
that, Korean game and music industry has a higher contribution compared to other
countries, favoring an assumption that ripple effect can be expected within the
industry.
23
Figure 19: Market Revenue as a Percentage of GDP
Market revenue as % of GDP
Japan China Korea Thailand Indonesia Singapore Malaysia Philippines
TV broadcasting 0.91% 0.59% 1.03% 1.04% 0.26% 1.06% 0.54% 0.07%
Film 0.22% 0.04% 0.32% 0.26% 0.09% 0.21% 0.08% 0.06%
Animation 0.03%* n/a 0.04% 0.05% n/a n/a n/a n/a
Game 0.26% 0.09% 0.71% 0.31% 0.05% 0.21% 0.02% 0.02%
Music 0.22% 0.00% 0.31% 0.12% 0.06% 0.12% 0.02% 0.02%
Total 1.61% 0.73% 2.41% 1.77% 0.46% 1.60% 0.70% 0.24%
Source: Statistics provided by member countries, PwC (2012).
1.2. Market Growth
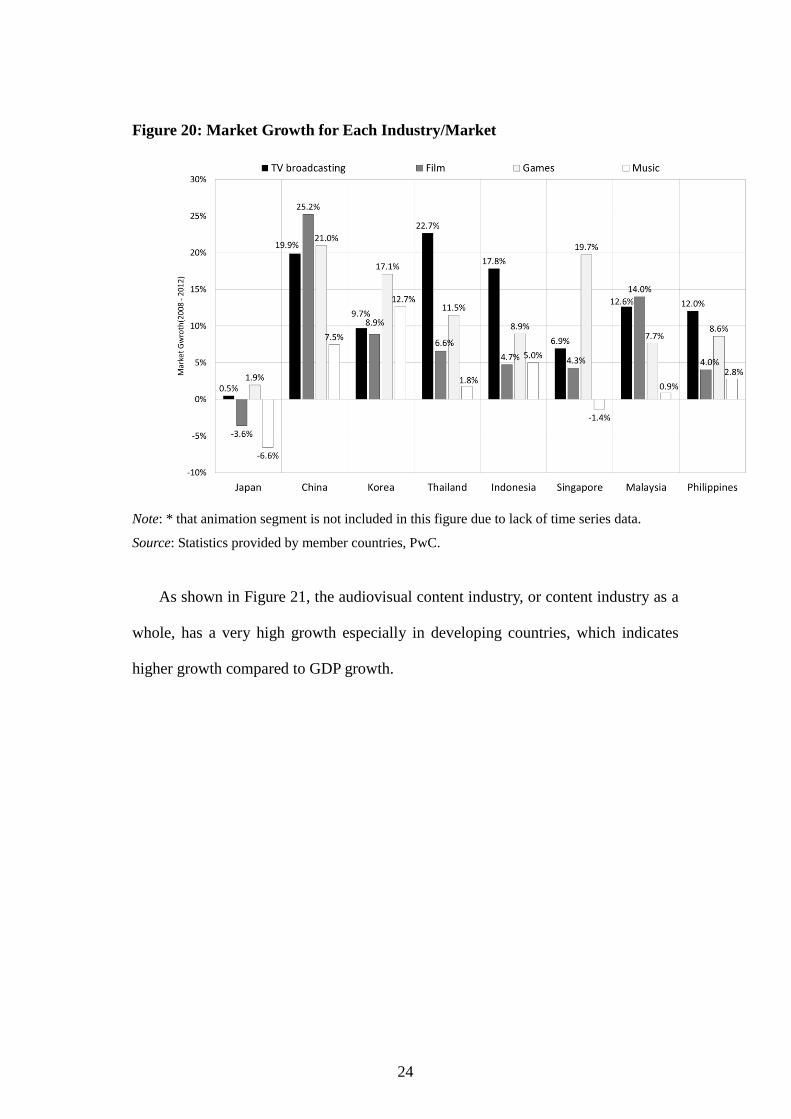
Figure20 shows the growth for each industry. There is tremendous growth in
most of the countries, except for Japan, where the industry faces a downward trend.
In China and Malaysia, film industry has the highest market revenue growth,
Korea and Singapore sees the highest in the game industry. For Thailand, Indonesia,
and Philippines, TV broadcasting has been driving the whole industry so far.
24
Figure 20: Market Growth for Each Industry/Market
Note: * that animation segment is not included in this figure due to lack of time series data.
Source: Statistics provided by member countries, PwC.
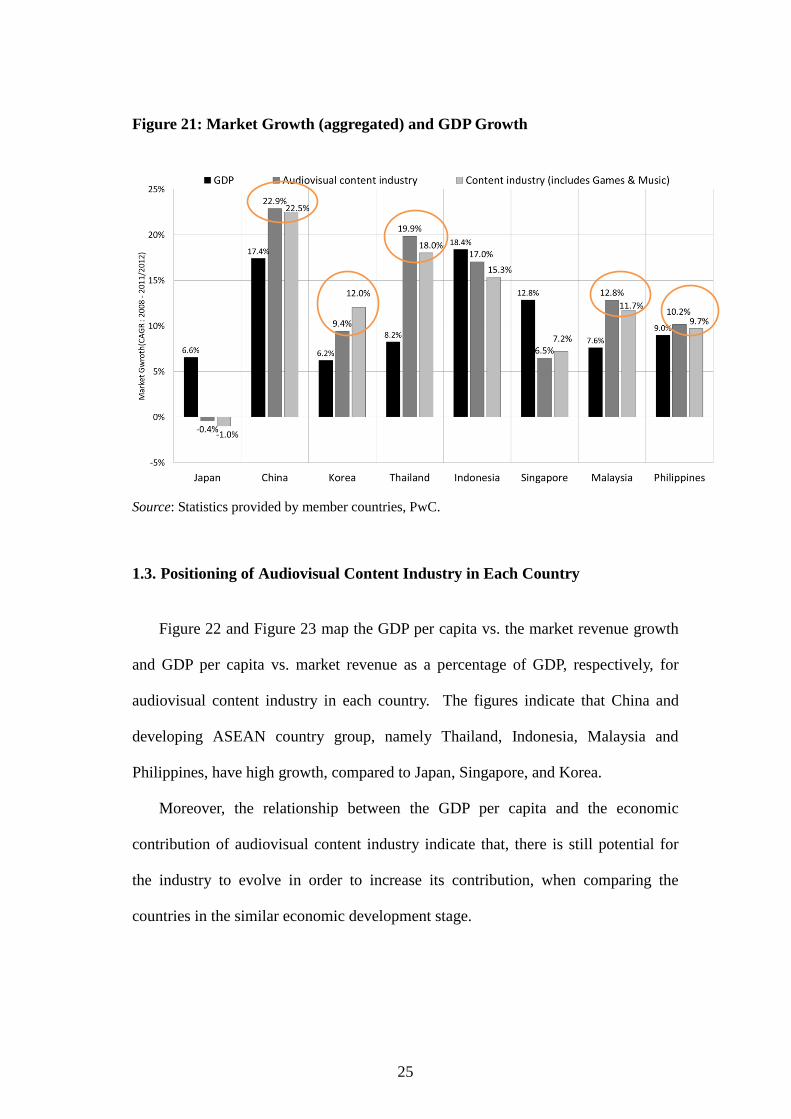
As shown in Figure 21, the audiovisual content industry, or content industry as a
whole, has a very high growth especially in developing countries, which indicates
higher growth compared to GDP growth.
25
Figure 21: Market Growth (aggregated) and GDP Growth
Source: Statistics provided by member countries, PwC.
1.3. Positioning of Audiovisual Content Industry in Each Country
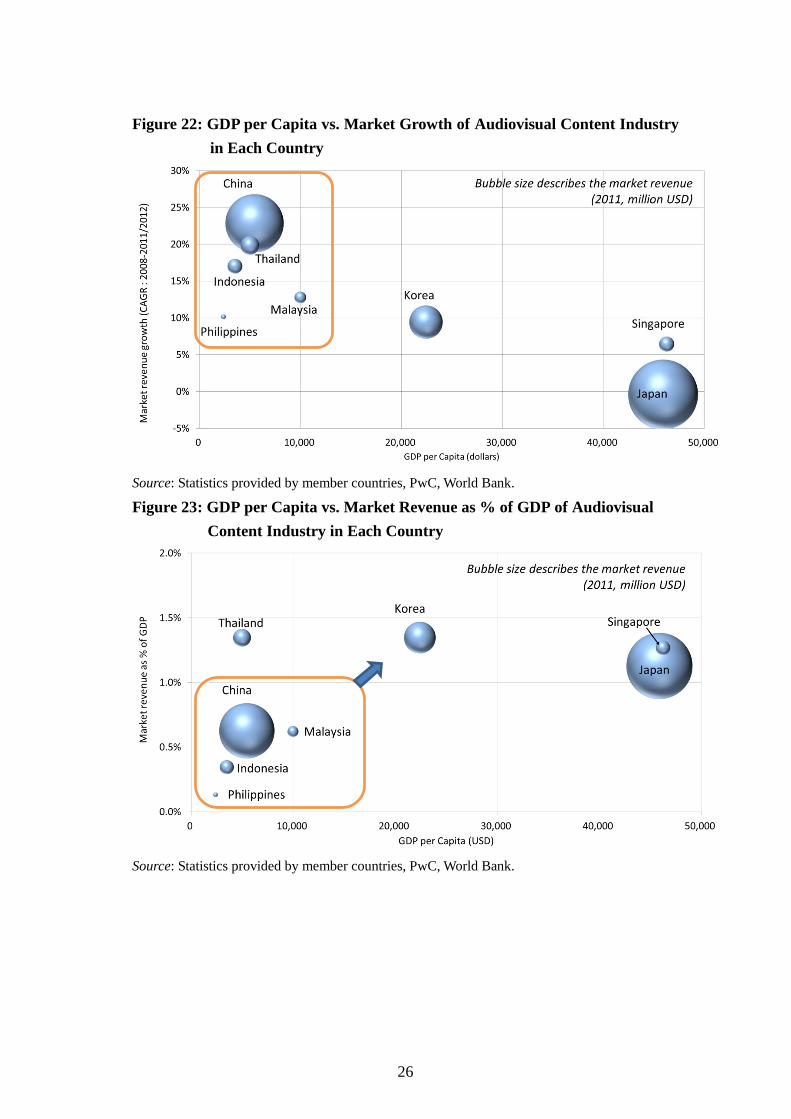
Figure 22 and Figure 23 map the GDP per capita vs. the market revenue growth
and GDP per capita vs. market revenue as a percentage of GDP, respectively, for
audiovisual content industry in each country. The figures indicate that China and
developing ASEAN country group, namely Thailand, Indonesia, Malaysia and
Philippines, have high growth, compared to Japan, Singapore, and Korea.
Moreover, the relationship between the GDP per capita and the economic
contribution of audiovisual content industry indicate that, there is still potential for
the industry to evolve in order to increase its contribution, when comparing the
countries in the similar economic development stage.
26
Figure 22: GDP per Capita vs. Market Growth of Audiovisual Content Industry
in Each Country
Source: Statistics provided by member countries, PwC, World Bank.
Figure 23: GDP per Capita vs. Market Revenue as % of GDP of Audiovisual
Content Industry in Each Country
Source: Statistics provided by member countries, PwC, World Bank.

27
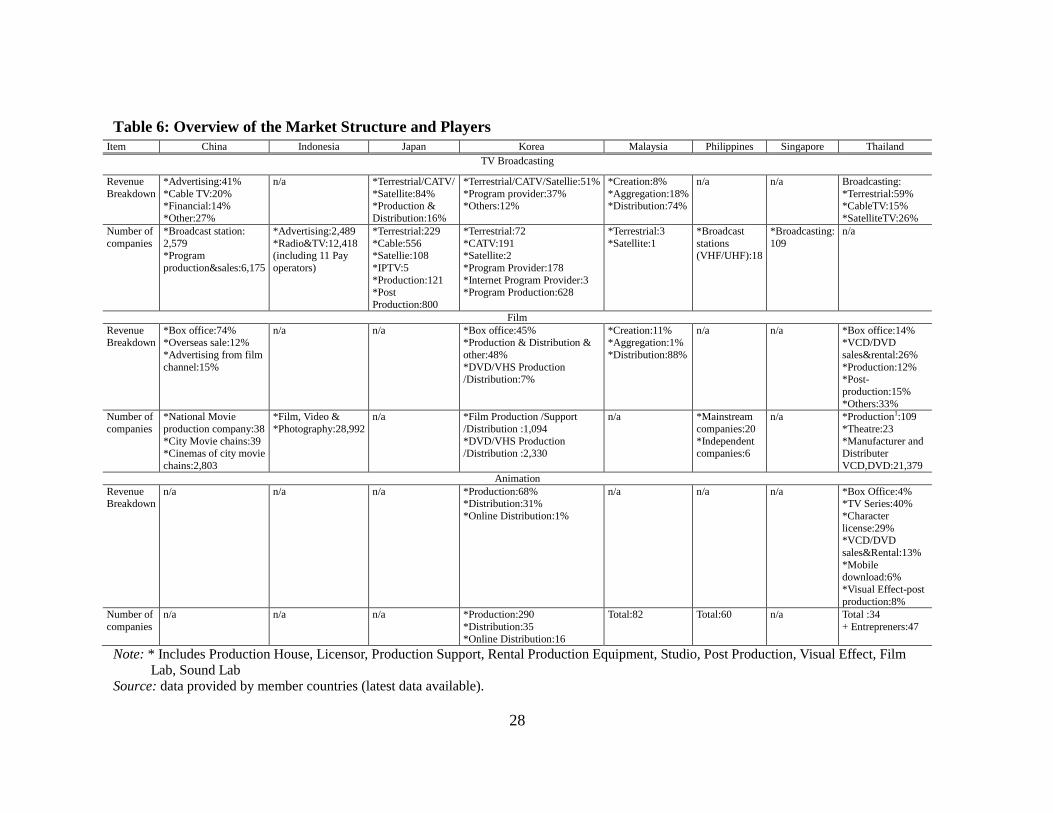
1.3.1. Market Structure and Players
The market revenue breakdown as well as number of players (companies) in TV
broadcasting animation and film industry is summarized in Table 6. Note that the
data is shown for countries with available statistics.
28
Table 6: Overview of the Market Structure and Players
Item China Indonesia Japan Korea Malaysia Philippines Singapore Thailand
TV Broadcasting
Revenue
Breakdown
*Advertising:41%
*Cable TV:20% *Financial:14%
*Other:27%
n/a *Terrestrial/CATV/
*Satellite:84% *Production &
Distribution:16%
*Terrestrial/CATV/Satellie:51%
*Program provider:37% *Others:12%
*Creation:8%
*Aggregation:18% *Distribution:74%
n/a n/a Broadcasting:
*Terrestrial:59% *CableTV:15%
*SatelliteTV:26%
Number of
companies
*Broadcast station:
2,579 *Program
production&sales:6,175
*Advertising:2,489
*Radio&TV:12,418 (including 11 Pay
operators)
*Terrestrial:229
*Cable:556 *Satellie:108
*IPTV:5
*Production:121 *Post
Production:800
*Terrestrial:72
*CATV:191 *Satellite:2
*Program Provider:178
*Internet Program Provider:3 *Program Production:628
*Terrestrial:3
*Satellite:1
*Broadcast
stations (VHF/UHF):18
*Broadcasting:
109
n/a
Film
Revenue Breakdown
*Box office:74% *Overseas sale:12%
*Advertising from film
channel:15%
n/a n/a *Box office:45% *Production & Distribution &
other:48%
*DVD/VHS Production /Distribution:7%
*Creation:11% *Aggregation:1%
*Distribution:88%
n/a n/a *Box office:14% *VCD/DVD
sales&rental:26%
*Production:12% *Post-
production:15%
*Others:33%
Number of
companies
*National Movie
production company:38
*City Movie chains:39
*Cinemas of city movie
chains:2,803
*Film, Video &
*Photography:28,992
n/a *Film Production /Support
/Distribution :1,094
*DVD/VHS Production
/Distribution :2,330
n/a *Mainstream
companies:20
*Independent
companies:6
n/a *Production1:109
*Theatre:23
*Manufacturer and
Distributer
VCD,DVD:21,379
Animation
Revenue Breakdown
n/a n/a n/a *Production:68% *Distribution:31%
*Online Distribution:1%
n/a n/a n/a *Box Office:4% *TV Series:40%
*Character
license:29% *VCD/DVD
sales&Rental:13%
*Mobile download:6%
*Visual Effect-post
production:8%
Number of
companies
n/a n/a n/a *Production:290
*Distribution:35
*Online Distribution:16
Total:82 Total:60 n/a Total :34
+ Entrepreners:47
Note: * Includes Production House, Licensor, Production Support, Rental Production Equipment, Studio, Post Production, Visual Effect, Film
Lab, Sound Lab Source: data provided by member countries (latest data available).
29
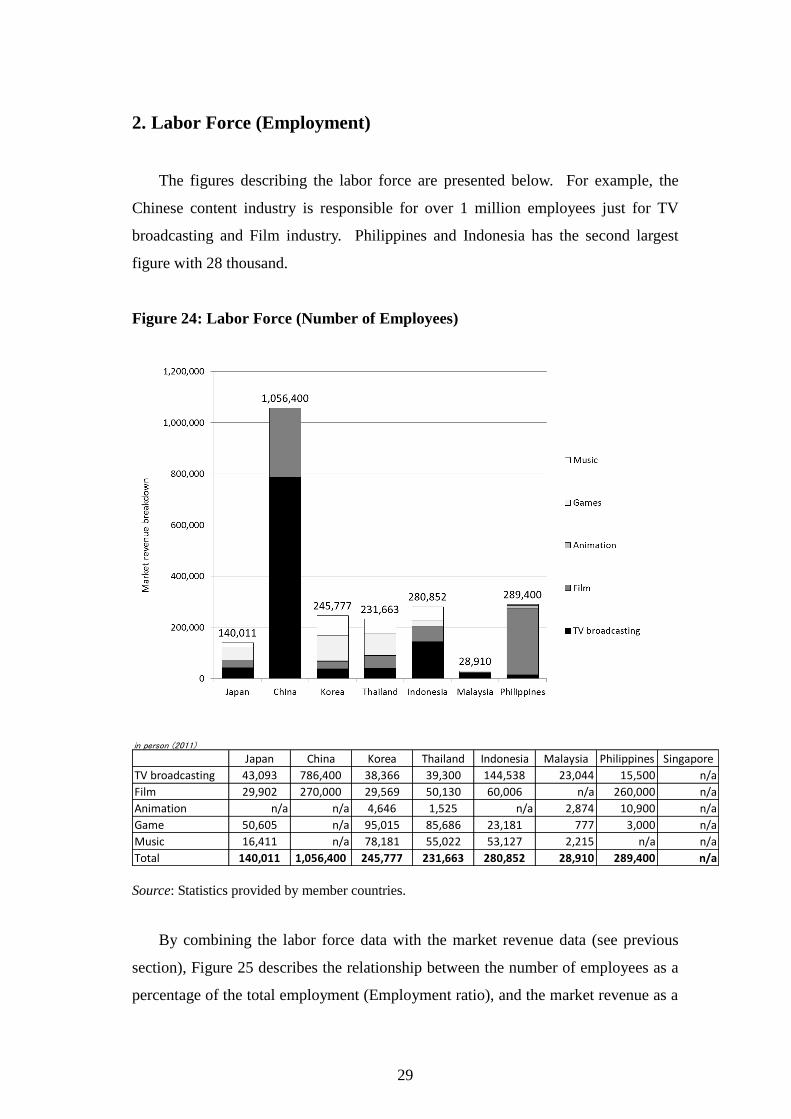
2. Labor Force (Employment)
The figures describing the labor force are presented below. For example, the
Chinese content industry is responsible for over 1 million employees just for TV
broadcasting and Film industry. Philippines and Indonesia has the second largest
figure with 28 thousand.
Figure 24: Labor Force (Number of Employees)
in person (2011)
Japan China Korea Thailand Indonesia Malaysia Philippines Singapore
TV broadcasting 43,093 786,400 38,366 39,300 144,538 23,044 15,500 n/a
Film 29,902 270,000 29,569 50,130 60,006 n/a 260,000 n/a
Animation n/a n/a 4,646 1,525 n/a 2,874 10,900 n/a
Game 50,605 n/a 95,015 85,686 23,181 777 3,000 n/a
Music 16,411 n/a 78,181 55,022 53,127 2,215 n/a n/a
Total 140,011 1,056,400 245,777 231,663 280,852 28,910 289,400 n/a
Source: Statistics provided by member countries.
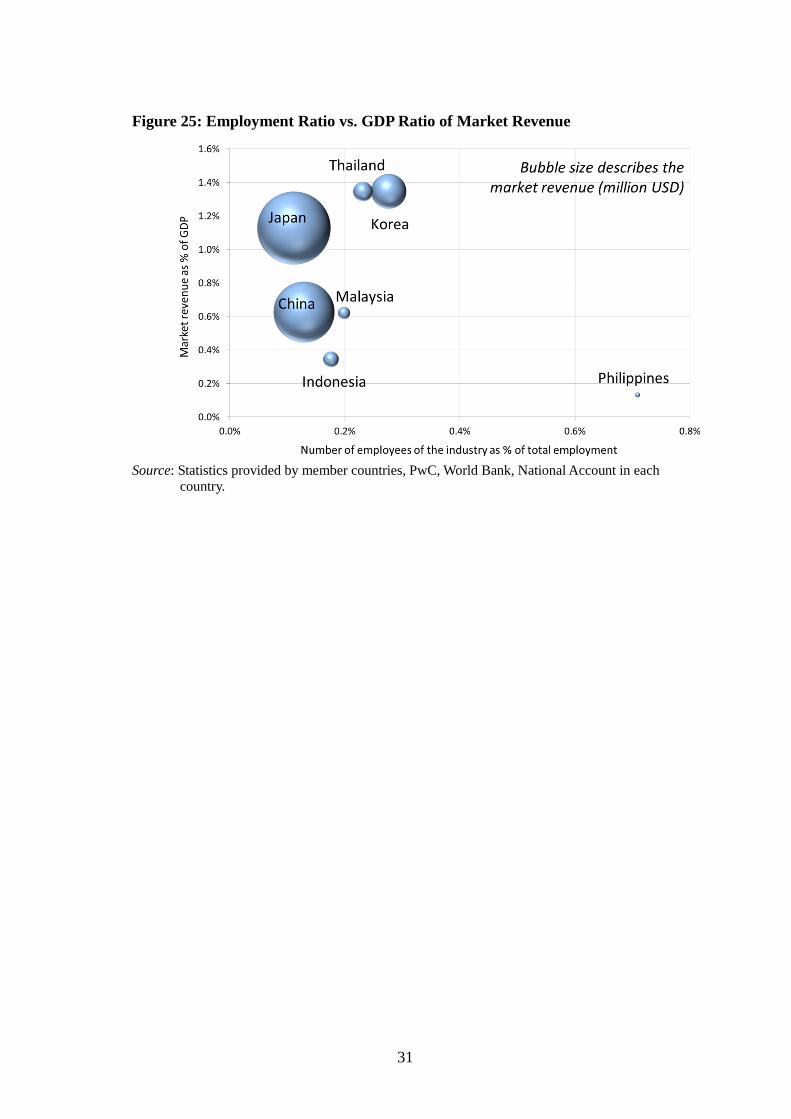
By combining the labor force data with the market revenue data (see previous
section), Figure 25 describes the relationship between the number of employees as a
percentage of the total employment (Employment ratio), and the market revenue as a
30
percentage of GDP (GDP ratio), in each country. Due to the availability of data,
Figure 25 covers only TV broadcasting and film industry; however it is the core of
the content industry in terms of market size, therefore it highlights most of the
characteristics of the content industry as a whole. The higher the GDP ratio (vertical
axis), and the lower the employment ratio (horizontal axis), indicates that the
industry is more productive. For example, Japan has a productive industry, where it
has a relatively high GDP ratio, with the lowest employment ratio among the all
countries. In other words, much of the labor force is utilized to generate adding
value to the economy. However, looking at the opposite way, the figure can be
interpreted as the employment absorption of the content industry, where the
difference in employment ratio indicates how much the industry can employ with the
same level of market size in its economy. In particular, Philippines has low GDP
ratio with high employment ratio compared to other countries, indicating that the
industry employs more labor force in relation to the GDP ratio. It can be said that,
due to its labor-intensive nature, the content industry can create large scale of
employment; therefore by creating a sustainable eco-system within the industry and
expanding its market revenue will contribute to the economy in the long term.
Also, it is worth noting that, Thailand and Korea are relatively close to each
other, hence it can be assumed that the role and structure of the content industry,
within their own economy in terms of revenue and employment, is similar.
31
Figure 25: Employment Ratio vs. GDP Ratio of Market Revenue
Source: Statistics provided by member countries, PwC, World Bank, National Account in each
country.


![Contents [Hide] 1 Paint Market Structure 2 Paint Industry Definitions](https://img.pdfslide.us/doc/110x75/5468d5f8b4af9fd90e8b45fc/contents-hide-1-paint-market-structure-2-paint-industry-definitions.jpg)


