Embed Size (px)
Citation preview

Journal of Economic Cooperation, 28,2 (2007), 99-121
MARKET STRUCTURE AND COMPETITION IN
EMERGING MARKET: EVIDENCE FROM MALAYSIAN ISLAMIC BANKING INDUSTRY∗∗∗∗
Muhamed-Zulkhibri Abdul Majid1 Fadzlan Sufian2
This paper investigates the market structure of Islamic banking industry in Malaysia during 2001-2005 and evaluates the degree of competition using the H-statistic by Panzar and Rosse (1987). The estimated H-statistics for the whole sample periods are positive ranging from 0.38 to 0.62 and the Wald test for the market structure of monopoly or perfect competition is rejected implying that the Islamic banks in Malaysia earned their revenue in the condition of monopolistic competition. 1. Introduction The degree of competition in the banking sector has been at the frontier of research for the past two decades. Knowledge of the market structure is of particular importance to academics and policy makers as well as practitioners. Academics and policy makers seem to accept the view that financial intermediaries play a crucial role in the effective functioning of modern economies, owing to their comparative advantage in terms of information gathering, screening and monitoring - which result in economies of scale and scope (Diamond, 1984). Given the strong links between market structure and the efficiency of a particular
∗ All findings, interpretations and conclusions are solely of the authors’ opinion and do not necessarily represent the views
of the institutions.
1Central Bank of Malaysia
2 Bumiputra-Commerce Bank Berhad (BCB) also Faculty of Bussiness and Accountancy, University of Malaya.

Journal of Economic Cooperation
100
sector, one would expect that the higher the degree of competition in the banking sector, the higher its efficiency in terms of allocating funds and in general operating as an intermediary between lenders and borrowers. Recent research has however indicated that the relationship between competition and banking system performance is more complex and that the view that competition is unambiguously good is more naive in banking than in other industries (Claessen and Leaven, 2004). Recently, Malaysia financial system has changed dramatically. Malaysia has succeeded in implementing a dual banking system and has emerged as the first nation to have a full-fledged Islamic system operating side-by-side with the conventional banking system. The Islamic banking has gained its significance, and has been on a progressive upward trend. Since 2000, the Islamic banking industry has been growing at an average rate of 19% per annum in terms of assets. As at end-2004, total assets of the Islamic banking sector increased to RM94.6 billion, which accounted for 10.5% of the total assets in the banking system. The market share of Islamic deposits and financing increased to 11.2% and 11.3% of the total banking sector deposits and financing respectively. The rapid progress of the domestic Islamic banking system, accentuated by the significant expansion and developments in Islamic banking and finance has become increasingly more important in meeting the changing requirements of the new economy (Bank Negara Malaysia, 2004). As Malaysia is currently vying for recognition as the capital or hub of Islamic banking worldwide, the government has taken measures, among others, to further liberalise the sector. The strategy is to create more competition, to tap new growth opportunities, and to raise the efficiency of the Islamic banking industry as a whole. The government’s commitment is evidenced by the issuance of three more new full-fledged Islamic banks licenses, which were all issued to foreign banks from the Middle East. Among the first full-fledged foreign Islamic bank operating in Malaysia were Kuwait Finance House, Al-Rajhi Banking and Investment Corporation and a consortium led by Qatar Islamic Bank. Given the ongoing liberalisation in the sector, further investigations on the market condition and the degree of competitiveness of the Islamic banking sector are thus warranted. The study in this nature could help the regulatory authorities and bank managers in determining the future course of action to be pursued to further strengthen the Malaysian

Market Structure and Competition In Emerging Market
101
Islamic banking sector, in particular the domestic incorporated Islamic banks, to meet the challenges of foreign banks entry from 2007 onwards3. Table 1 summarised some structural statistics on individual Islamic bank in Malaysia. Table 1: Islamic Banks in Malaysia
Bank Type Total Assets As at
2005 (in RM billion)
% of System Assets
Affin Bank Domestic 3.649 4.0
Alliance Bank Domestic 1.550 1.7
Arab-Malaysian Bank Domestic n.a n.a
EON Bank Domestic 4.284 4.7
Hong Leong Bank Domestic 5.816 6.3
Maybank Domestic 22.815 25.1
Public Bank Domestic 8.046 8.8
RHB Bank Domestic n.a n.a
Southern Bank Domestic 0.816 0.8
Bank Islam Malaysia Domestic 15.848 17.4
Bank Muamalat Domestic 10.269 11.2
RHB Islamic Bank Berhad
Domestic 7.623 8.3
Commerce TIJARI Bank Berhad
Domestic 0.521 0.5
Citibank Foreign 1.074 1.1
Hong Kong Bank Foreign 5.255 5.7
OCBC Foreign 2.349 2.5
Standard Chartered Bank Foreign 1.004 1.1
Total n = 17 90.925 100.0
Note: n.a means not available Source: Bank Negara Malaysia
3 As part of Malaysia’s World Trade Organisation (WTO) commitment to further liberalised the banking
sector and to give the foreign banks completely open access to the Malaysian markets by the end of 2006.

Journal of Economic Cooperation
102
The first stage of liberalization in the Islamic banking had yielded substantial participation from foreign Islamic banks and creation of full-fledged domestic Islamic banks. With the rapid increase in the number of banks, the average asset size of Islamic banks was reduced making the Islamic banking industry less concentrated. Following the step of previous researchers and due to the limited number of banks, this paper used the highest two and five bank deposits and loans as an initial measure of bank concentration. The most frequently applied measures of concentrations, k-bank concentration ratio (CRBkB) and Herfindahl-Herschman Index (HHI) shows that Malaysian Islamic banking industry has become ‘somewhat concentrated market’ between 2001 and 2005. Table 3 presents the trends of the HHI and CRBk from the year 2001 until 2005, where the total deposits and total loans have been taken as the measure of bank size4. Table 2: Market Structure Indicators by Total Deposit and Loan.
Deposit 2001 2002 2003 2004 2005
CR2 0.47 0.46 0.45 0.43 0.44
CR5 0.77 0.74 0.76 0.74 0.73
HHI 1513 1471 1417 1360 1388
Loan 2001 2002 2003 2004 2005
CR2 0.52 0.49 0.50 0.48 0.46
CR5 0.77 0.77 0.78 0.75 0.73
HHI 1664 1628 1725 1638 1541
In general, the concentration ratio shows the declining trend from 2001 until the 2005 during which new banks have entered the market and many of the new foreign banks substantially grew. Concentration ratio in deposit market implies a relatively ‘somewhat concentrated market’
4 The CRk takes the market shares of the k largest banks in the market and ignores the remaining banks in
that market. This index is based on the idea that the behavior of a market is dominated by a small number of
large banks. The Herfindahl-Herschman index (HHI) is defined as the sum of the squared market shares of
all banks in the market. HHI takes market shares as weights, and stress the importance of large banks by
assigning them a greater weight than smaller banks.

Market Structure and Competition In Emerging Market
103
with CR5 recording 0.77% and HHI at 1513 in the 2001. However in 2005, concentration ratio went down with CR5 recording 0.73% and HHI at 1388 due to the entry of new Islamic foreign banks into the market and creation of full-fledged domestic Islamic banks originated from window-based Islamic banks (BNM, 2005). According to the current screening guidelines in U.S.A, this market could be described as a ‘somewhat concentrated market’5. The concentration ratio in the loan market shows similar trend with that in the deposit market with CR5 recording 0.77% and HHI at 1664 in the 2001 while concentration ratio went down with CR5 recording 0.73% and HHI at 1541 in 2005.
These significant development outlined above raised the important policy questions. Did the liberalization of the Malaysian Islamic banking sector lead to increase in competition, in turn, reduce the market concentration and thus positively affect consumer welfare? Alternatively, did the prevailing bank concentration result in greater efficiency in the sector? In addition, what was the precise impact of the introduction of new policy measures particularly with respect to banks behavior and changes in the market structure during the process of liberalization of Malaysian Islamic banking? Given the ongoing liberalisation in the sector, further investigations on the market structure and degree of competition of the Islamic banking sector are thus warranted. The study in this nature could help the regulatory authorities and bank managers in charting the future course of action to be pursued.
In this paper, we employ one of the “Non-Structural Model” approach suggested by Rosse and Panzar (1977) and Panzar and Rosse (1982, 1987), so called H-statistic, which has been widely employed for the examination of the competitive structure of the banking industry in various countries, in order to investigate the market structure of Malaysian Islamic banking industry during the periods of 2001 to 2005. Furthermore, we evaluate whether competition of banks has been indeed increased along with the reduction in market concentration after the Islamic financial market liberalization.
5 Based on the current screening guideline in the U.S, the banking industry is regarded as competitive market
if the HHI is less than 1000, somewhat concentrated market if lies between 1000 and 1800, very
concentrated market if more than 1800.

Journal of Economic Cooperation
104
The paper is structured as follows: Section 2 presents the banking competition model; effectively, this is the framework that theoretically underpins the analysis. The data and the empirical model are discussed in Section 3. The estimation and results are reported in Section 4. Section 5 provides the conclusion. 2. The Panzar -Rosse Approach: Theory and Evidence The Panzar-Rosse (P-R) approach for testing market power relies on the premise that banks will employ different pricing strategies in response to change in input costs depending on the market structure in which they operate. Therefore, whether a bank operates in a competitive market or exercises some monopoly power can be inferred from the analysis of that bank’s total revenue as it responds to changing input prices. The test is derived from a general banking market model, which determines equilibrium output and the equilibrium number of banks by maximizing profits at both the bank level and the industry level. Two critical implications exist for this equilibrium model. First, at the bank level, profit is maximized where marginal revenue is equal to marginal cost: 0) , ,() , ,( =− iii
liii
li qfyCyR υκ (1)
liR is the marginal revenue function, liC is marginal cost function, liy is
the output of bank i, κ is the number of banks, iυ and iq consists of exogenous variables that shift the bank’s revenue and cost functions, respectively and if is a vector of bank i’s factor input prices. The second implication is that the zero profit constraint holds at the industry level:
0) , ,() , ,( ***** =− qfyCyR iii υκ (2)
From these conditions, the H-statistic is formulated as:
∑∂∂=
=
t
x i
xi
xi
i
R
f
f
RH
1*
*
(3)
This is the sum of the factor price elasticities, which indicates how responsive revenue is to percentage change in factor prices.
Market Structure and Competition In Emerging Market
105
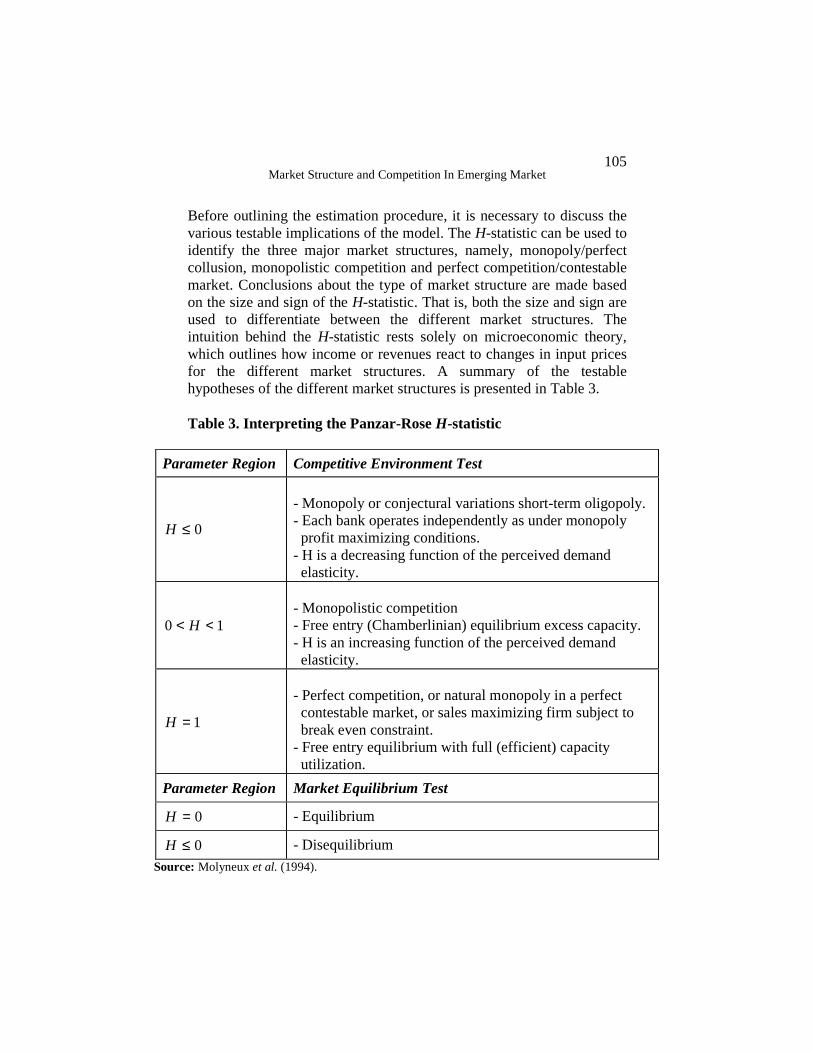
Before outlining the estimation procedure, it is necessary to discuss the various testable implications of the model. The H-statistic can be used to identify the three major market structures, namely, monopoly/perfect collusion, monopolistic competition and perfect competition/contestable market. Conclusions about the type of market structure are made based on the size and sign of the H-statistic. That is, both the size and sign are used to differentiate between the different market structures. The intuition behind the H-statistic rests solely on microeconomic theory, which outlines how income or revenues react to changes in input prices for the different market structures. A summary of the testable hypotheses of the different market structures is presented in Table 3. Table 3. Interpreting the Panzar-Rose H-statistic
Parameter Region Competitive Environment Test
0≤H
- Monopoly or conjectural variations short-term oligopoly. - Each bank operates independently as under monopoly profit maximizing conditions. - H is a decreasing function of the perceived demand elasticity.
10 << H
- Monopolistic competition - Free entry (Chamberlinian) equilibrium excess capacity. - H is an increasing function of the perceived demand elasticity.
1=H
- Perfect competition, or natural monopoly in a perfect contestable market, or sales maximizing firm subject to break even constraint. - Free entry equilibrium with full (efficient) capacity utilization.
Parameter Region Market Equilibrium Test
0=H - Equilibrium
0≤H - Disequilibrium
Source: Molyneux et al. (1994).

Journal of Economic Cooperation
106
Using a simple, single product monopoly model with the assumptions of constant price elasticity and a constant returns to scale Cobb-Douglas technology, P-R further showed that not only is the sign of the H-statistic important, but so too is its size. That is, a larger H-statistic means that the market is more competitive implying that the H-statistic is a continuous measure of competition. In applying the P-R model, it is important to clearly define the production activity of the banks since they are not exactly comparable to other types of firms. The current literature presents two alternative approaches - the “production approach” and the “intermediation approach” – that can be taken in empirical work. Although there is some amount of debate as to which approach should be taken in empirical work, this paper will follow the intermediation approach, which classifies deposits and loans as inputs and outputs, respectively. Many previous studies have examined the competitive structure of the banking industry in various countries by using H-statistics. A summary of previous P-R studies on banking is presented in Table 4. Overall, the previous empirical estimations of P-R model for developed countries show varying results. Very recently, more studies have employed this methodology to quantitatively assess the degree of competition and market structure of banking industry in developing countries. However, none of the studies in banking literature investigated the competitive behaviour and market structure of Islamic banking.

Market Structure and Competition In Emerging Market
107
Table 4: Summary of Other P-R Studies on Banking Industry
Author (s)
Period Countries Findings
Shaffer (1982) 1979 New York MC Nathan and Neave (1989)
1982-84
Canada MC (1983, 1984); PC (1982)
Lloyd-William et al. (1991)
1986-88
Japan MO
Molyneux et al. (1994)
1986-89
France, Germany, Italy, Spain, U.K
MO (Italy); MC (France, Germany, Spain, U.K)
Vessala (1995) 1985-92
Finland MC (except for 1989-90)
Molyneux et al (1996)
1986-88
Japan MO
Hondroyiannis et al. (1999)
1993-95
Greece MC
Bikker and Groeneveld (2000)
1989-96
15 EU countries
MC (all countries)
De Bandt and Davis (2000)
1992-96
France, German, Italy
MC (large bank in all countries and small bank in Italy)
Bikker and Haaf (2002)
1988-98
23 EU and non-EU countries
MC (all countries, competition weaker in small markets and stronger in international market)
Gelos and Roldos (2002)
1994-99
8 European and Latin American countries
MC (all countries except for Argentina and Hungary near PC)
Yildrim and Philappatos (2002)
1992-99
14 Central and South East European and the Russian Federation
MC (Lithuania, Macedonia); PC (Latvia); Neither MC nor PC (other countries)
Murjan and Ruza (2002)
1993-97
Middle Eastern countries
MC (oil-producing countries are less competitive than non-oil producing countries)
Hempell (2002) 2002 Germany MC Coccorese (2004)
1997-99
Italy MC

Journal of Economic Cooperation
108
(Cont. Table 4)
Claessens and Laeven (2004)
1994-2001
50 industrialised and developing countries
MC (largest countries tend to have lower competition)
Weill (2004) 1994-99
12 EU countries
MC (decrease over the period)
Mamatzakis et al. (2005)
1998-2002
7 Southern Eastern European countries
MC
Drakos and Konstantinou (2005)
1992-2000
Central Eastern European and former Soviet Union countries
MC
Al-Muharrami et al. (2006)
1993-2002
Gulf Cooperation Council’s Countries
MC (Bahrain, Qatar); PC (Kuwait, Saudi Arabia, UAE); Neither MC nor PC (Oman)
Perera et al. (2006)
1995-2003
4 South Asian countries
MC
Yuan (2006) 1996-2000
China PC (nearly perfect competition)
PC = perfect competition, MC = monopolistic competition, MO = monopolistic market 3. Data and Model Formulation For the empirical analysis, 17 domestic and foreign Islamic banks from 2001-2005 would be used. Malaysian banks operating in Islamic window environment will also be included in the sample of the analysis. Unconsolidated bank-specific annual data are taken from published balance sheet of annual reports of each individual bank. Table 5 shows the summary statistics from 2001 to 2005.

Market Structure and Competition In Emerging Market
109
Table 5. Summary Statistics of Variables Used in P-R Model (2001-2005)
Variable Maximum Minimum Mean Median Std. Dev.
Total Revenue
741,921 3,407 166,157 79,620 188,588
Total Financing
16,052,758 11,480 2,557,359 1,391,582 3,285,334
Total Deposit 107,775,458 62,266 5,148,302 2,337,053 12,782,165
Total Assets 22,815,494 93,056 4,446,004 3,151,130 4,720,696
Non-Performing Loan
648,030 -436 40,593 19,583 87,042
Shareholder’s Equity
1,806,571 20,000 351,025 213,308 399,771
Personnel Expenses
132,128 389 14,999 2,787 27,618
Operating Expenses
245,351 812 29,476 6,849 50,971
The empirical application of the P-R approach assumes a log-linear marginal cost function (dropping subscripts referring to bank i) following Bikker and Haaf (2002):
COSTj
p
jji
m
ii EXIPOUTMC ∑∑
==+++=
11110 lnlnln γβαα (4)
where OUT is output of the bank, IP are the factor input prices (regarding e.g. funding, personnel expenses and other expenses) and
COSTEX are other variables, exogenous to the cost function liC in
equation (1). Equally, the underlying marginal revenue function has been assumed to be log-linear of the form:
REVk
q
kk EXOUTMR ∑
=++=
110 lnln ϑδδ (5)
where REVEX are variables related to the bank-specific demand function
z in equation (1). For a profit-maximizing bank, marginal costs equal marginal revenues in equilibrium, yielding the equilibrium value for output (denoted by an asterisk):

Journal of Economic Cooperation
110
)/()lnlnln(ln 11111
00* αδϑγβδα −−++−= ∑∑∑
===REXk
q
kkCOSTj
p
jii
m
ii EXEXIPOUT (6)
The reduced-form equation for income or revenues of bank i is the product of the equilibrium values of output of bank i and the common price level, determined by the inverse-demand equation, which reads, in logarithms, as: )ln(ln *
∑+= i iOUTp κξ (7) In the empirical analysis, a methodological choice needs to be made on how to appropriately define a bank’s production process. The approach to input/output definition used in this study follows the intermediation approach, which was originally developed by Sealey and Lindley (1977) and posits that total loans and securities are outputs, whereas deposits along with labour and capital are input to the production process of banks. Specifically, the input variables used in this study are the average cost of labour, deposits and capital. Following Shaffer (1982, 1985), Nathan and Neave (1989), Molyneux et al. (1994), Perera et al. (2006) and Al-Muharrami et al. (2006), the reduced-form total revenue equation is used:
ititjitititit BSFPFPKPLTINC εζαααα +++++= ∑ lnlnlnlnln 3210 (8)
for t = 1,….T, where T is the number of periods observed and I = 1,….I, where I is the total number of banks. Subscripts i and t refer to bank i and at time t. The dependent variable is TINC is the ratio of total revenue to the total assets. The decision to consider the total revenue as proxy to total income is to account for the fact that Islamic banks do not generated interest income. Furthermore, this is to account for dramatic increased of other income from fee-based products and off-balance sheet activities in recent year given the increased level of competition in financial markets (Nathan and Neave, 1989; de Bandt and Davies, 2000). The dependent variable is divided by total assets in order to account for size differences. This study follows previous studies (Molyneux et al.,1994; Perera et al., 2006; Al-Muharrami et al., 2006) assuming that all funds are input in banks’ production function. Under this intermediation approach, banks

Market Structure and Competition In Emerging Market
111
use three inputs, labour, deposit and capital. PL is the ratio of personnel expenses to the total assets, a proxy for cost of labour, PK is the ratio of other operating expenditure to total assets, a proxy for cost of capital and PF is the net profit over total asset, as a proxy of price of funds. This variable is considered to be the price for using the funds under the Islamic banking system. The Islamic banking system denounces its activities from any element of interest and these practices are contradictory to the conventional banking system. Therefore, the Islamic banking system does not permit to give return in the form of interest but instead return is given in the form of mutually agreed profit sharing as the return on deposits and non-deposits liabilities. The input prices are followed by a set of bank-specific factors (BSF) that are relevant to the modern banking business. The BSF includes the ratio of total equity to total assets (EQASST) is included to control for differences in capital structure. The expected coefficient can be positively related to total revenue well-capitalized banks involved in riskier operations and portfolios and in the process tend to hold more equity, voluntarily or involuntarily. However, according to Molyneux et al. (1994) the coefficient can be expected to be negatively related to the total revenue dependent variable since lower capital ratios should lead to higher bank revenue. In addition, the ratio of non-performing loan to total asset (RSKASST) is included to account for a different measure of bank-specific risk (Al-Muharrami et al., 2006). The RSKASST is expected to have a positive impact on revenue. Total assets (ASST) controls for the size of the bank and can be considered as a proxy for economies of scale (De Bandt and Davies, 2000; Shaffer, 2002). However, the effect of this variable is indeterminate on the grounds that any positive influence on revenue may be offset by larger banks capable of diversifying their business and spreading the risk of business. Total financing to total assets (LOANASST), a proxy for degree of intermediation, is expected to be positively related to revenue, as higher proportion of asset on the bank’s book is expected to generate higher revenue, since higher provisions are associated with higher risk and higher expected return. An important feature of the H-statistic is that the tests must be undertaken on observations that are in long-run equilibrium. As suggested in the previous studies (Molyneux et al., 1994; De Bandt and

Journal of Economic Cooperation
112
Davies, 2000; Bikker and Haaf , 2002), the test is based on the proposition that in competitive capital markets risk-adjusted rates of return will be equalized across banks. The equilibrium test can be performed by recalculating the Panzar and Rosse’s H-statistics replacing the dependent variable total revenue over total assets with the natural log of return on assets (ROA). This verification is important for the cases of perfect competition (H=1) and monopolistic competition (H>0), while H<0 is a long-run condition for monopoly. Thus, if the sample is not in the long-run equilibrium, H<0 no longer establishes monopolistic market conditions, but remains true that H>0 disproves monopoly or conjectural variation short-run oligopoly (Shaffer, 1985).
ititjitititit BSFPFPKPLROA εζββββ +++++= ∑ lnlnlnln)( ln 3210 (9)
It should be noted that following Claessens and Laeven (2004), the measure of ROA included in equation (10) is equal to ln (1+ROA) and thus adjusted for small negative values due to banks’ losses in any year. The long-run equilibrium test measures the sum of the elasticity of return on assets with respect to input prices. If the E-statistic
0)( 321 =++ βββ , this implies that the banking market is in long-run equilibrium. If rejected, the market is assumed not to be in equilibrium (Claessens and Laeven, 2004). It should be noted however that equilibrium does not mean that competitive conditions are not allowed to change during the sample period. It only implies that changes in banking are taken gradually. 4. Empirical Results Although previous studies generally employ OLS estimation methodology on the cross section yearly data, this could produce the unstable results. This paper also includes panel regression methodology combining cross section and time series data with the fixed effects estimators, correcting for the effect of any combination of time-invariant variables that have been omitted, knowingly or not, from the regression model. Throughout the study White’s (1980) heteroscedasticity consistent statistics were used. Preliminary investigations of data revealed that there was no severe multicollinearity which hinders efficient estimation of the models. The Wald test which follows an F

Market Structure and Competition In Emerging Market
113
distribution was used in the competition models to test whether or not the calculated H-statistics are statistically different from zero and unity. In order to test competition in the long-run, the estimation results for the competitive position and equilibrium tests for the whole sample periods of 2001 to 2005 are reported in Table 6 by estimating equation 8 and 9. All tests confirm the good fit of the models. The estimated regression equations explain 58 - 62% in the total revenue (TINC) equation and 82 - 92% of the variability in the ROA equation. H-statistics in both equations are positive ranging between 0.375 - 0.616 for TINC equation and 0.824 - 0.883 for ROA equation. This is consistent with the study by Claessens and Laeven (2004) on Malaysia and studies on other developing countries that find H-statistics between zero and one and monopolistic competition (Al-Muharrami et al., 2006; Perera et al., 2006). Models with fixed effect estimations generally yield higher H-statistics The Wald test rejects the hypothesis for the market structure of monopoly or perfect competition at the 1% significance level leading us to conclude that total bank revenues appear to be earned in conditions of monopolistic competition and any form of conjectural variation oligopoly and monopoly can be clearly rejected during the sample periods.

Journal of Economic Cooperation
114
Table 6. Panel Regression Results of Competitive Condition ln TINC ln (1 + ROA)
Variable Pooled OLS Fixed Effects Pooled OLS Fixed Effects
Intercept 6.512** (2.344)
0.983
(0.581)
2.922*** (3.550)
2.577*** (4.905)
ln PL 0.262*** (4.316)
0.452** (2.657)
0.119** (2.678)
0.241 (1.327)
ln PK 0.014 (0.189)
0.012 (0.473)
-0.013*** (0.447)
-0.023 (-0.531)
ln PF 0.099** (2.457)
0.152*** (3.700)
0.718*** (29.419)
0.665*** (13.033)
ln ASST -0.439** (-2.461)
-0.053 (-0.336)
-0.025 (0.444)
0.031 (0.519)
ln EQASST -0.159**
(2.142)
-0.354** (-2.568)
-0.810*** (-7.716)
-0.748*** (-10.841)
ln RSKASST 0.089
(2.142) 0.077
(1.127) 0.026
(0.584) 0.021
(0.454)
ln LOANASST 0.248*** (3.017)
0.574* (1.693)
0.367*** (3.086)
0.274*** (10.133)
Adjusted R2 0.58 0.62 0.82 0.92
F-statistic 8.575*** 4.337*** 27.834*** 25.101***
H-statistic 0.375 0.616 0.824 0.883
Wald test (F-statistic) for H=1
27.46*** 11.41*** - -
Wald test (F-statistic) for H=0
9.88*** 5.39** - -
Equilibrium test:
Wald test (F-statistic) for H=0
- - 12.93*** 0.95
No of observations 74 74 74 74 Notes: The values in parenthesis are t-statistics and were calculated using White’s correction for heteroscedasticity. The Wald test is used to test the H=0 and H=1 hypothesis and follows an F-distribution. *** , ** and * indicate significance at 1%, 5% and 10% levels
Market Structure and Competition In Emerging Market
115
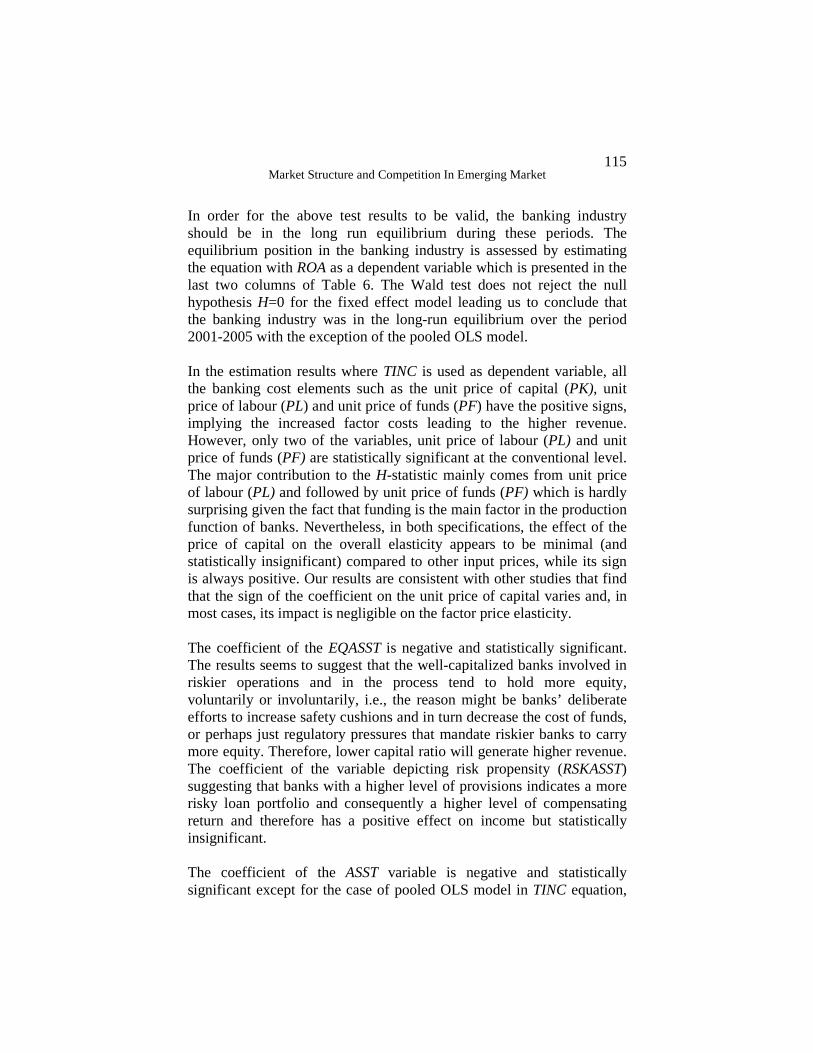
In order for the above test results to be valid, the banking industry should be in the long run equilibrium during these periods. The equilibrium position in the banking industry is assessed by estimating the equation with ROA as a dependent variable which is presented in the last two columns of Table 6. The Wald test does not reject the null hypothesis H=0 for the fixed effect model leading us to conclude that the banking industry was in the long-run equilibrium over the period 2001-2005 with the exception of the pooled OLS model.
In the estimation results where TINC is used as dependent variable, all the banking cost elements such as the unit price of capital (PK), unit price of labour (PL) and unit price of funds (PF) have the positive signs, implying the increased factor costs leading to the higher revenue. However, only two of the variables, unit price of labour (PL) and unit price of funds (PF) are statistically significant at the conventional level. The major contribution to the H-statistic mainly comes from unit price of labour (PL) and followed by unit price of funds (PF) which is hardly surprising given the fact that funding is the main factor in the production function of banks. Nevertheless, in both specifications, the effect of the price of capital on the overall elasticity appears to be minimal (and statistically insignificant) compared to other input prices, while its sign is always positive. Our results are consistent with other studies that find that the sign of the coefficient on the unit price of capital varies and, in most cases, its impact is negligible on the factor price elasticity.
The coefficient of the EQASST is negative and statistically significant. The results seems to suggest that the well-capitalized banks involved in riskier operations and in the process tend to hold more equity, voluntarily or involuntarily, i.e., the reason might be banks’ deliberate efforts to increase safety cushions and in turn decrease the cost of funds, or perhaps just regulatory pressures that mandate riskier banks to carry more equity. Therefore, lower capital ratio will generate higher revenue. The coefficient of the variable depicting risk propensity (RSKASST) suggesting that banks with a higher level of provisions indicates a more risky loan portfolio and consequently a higher level of compensating return and therefore has a positive effect on income but statistically insignificant. The coefficient of the ASST variable is negative and statistically significant except for the case of pooled OLS model in TINC equation,

Journal of Economic Cooperation
116
which suggests that size-induced differences between banks may lead to lower total revenue per unit of assets and that larger banks seem to be less efficient compared to smaller banks. This also suggests that as a whole the Islamic banking market in Malaysia faces diseconomies of scale. Finally, the results show that the ratio of loans to total assets (LOANASST) always has the expected positive sign and is significant in both specifications. This implies that a higher fraction of loans on the total assets’ composition envisages greater interest income and total revenue. 5. Conclusions The study examines the competitive condition of Malaysian Islamic financial sector for the period 2001 to 2005. For the Islamic financial sector in Malaysia, this period correspond to a period characterized by substantial reform to restructure the Islamic banking into a market-driven based economy, and to further liberalize and deregulate sufficiently the systems in order to integrate economically with the international financial market. The basis for the evaluation of competitive conditions is the extant of oligopoly theory in the new industrial organization literature, specifically, the competition model developed by Panzar and Rosse (1987). The estimated values of H-statistics for the sample periods of 2001-2005 are positive ranging from H-statistics in both equations are positive ranging between 0.375 - 0.616 for TINC equation and 0.824 - 0.883 for ROA equation. This is consistent with the study by Claessens and Laeven (2004) on Malaysia and studies on other developing countries that find H-statistics between zero and one and monopolistic competition (Al-Muharrami et al., 2006; Perera et al., 2006). The Wald test rejects the hypothesis for the market structure of monopoly or perfect competition at the 1% significance level leading us to conclude that total bank revenues appear to be earned in conditions of monopolistic competition and any form of conjectural variation oligopoly and monopoly can be clearly rejected during the sample periods. Combined the results of rejection of monopoly and perfect competition market structure we conclude that the degree of market competition in the Islamic banking sector has been increased in the recent years as the conventional index on the market concentration ratio would similarly predict.

Market Structure and Competition In Emerging Market
117
The results of the concentration approach and the results of the emerging contestability literature both suggest that the competitive behaviour of banks is not necessarily related to the number of banks in a market or to their concentration, other factors are also at work. The importance of the role played by open entry has long been acknowledged. A credible threat of entry may induce banks to behave in a competitive manner even when there are few banks in the market. A well-developed financial system also appears to be important, perhaps because banks face competition from other financial firms and markets (Boot and Thakor, 2000). The finding that few restrictions on the activities that banks can undertake is important to contestability may also be related to increasing competition over the entire financial system. References Al-Muharrami, S., Matthews, K. and Khabari, Y., “Market structure and competitive conditions in the Arab GCC banking system”, Journal of Banking and Finance, (2006), in press. Baltagi, B. H., Econometric Analysis of Panel Data, Chichester: John Wiley & Sons Ltd., 2001. Bain, J., “Relation of profit rate to industry concentration: American manufacturing 1939-1940”, Quarterly Journal of Economics, 65 (1951), 293-324. Baumol, W., “Contestable markets: an uprising in the theory of industry structure”, American Economic Review, 72, (1982), 1-15. Baumol, W., Panzar, J. and Willig, R. Contestable markets and the theory of industry structure. Harcourt Brace Jovanovich, San Diego, CA., 1982. Berger, S. A. and Hannan, T., “The price-concentration relationship in banking”, Review of Economics and Statistics, 71 (1989), 291–299. Bikker, J. A. and Groeneveld, J. M., “Competition and concentration in the E.U banking industry”, Kredit und Kapital, 33 (2000), 62-98.

Journal of Economic Cooperation
118
Bikker, J. A. and Haaf, K., “Competition, concentration and their relationship: an empirical analysis of the banking industry”, Journal of Banking and Finance, 26 (2002), 2191-2214. Bresnahan, T. F., “The oligopoly solution is identified”, Economic Letters, 10 (1982), 87-92. Bresnahan, T. F., “Testing and measurement in competition models”, in Krepps, D. M. and Wallis, K. F. (eds), Advances in Economics and Econometrics: Theory and Applications, Seventh World Congress, 3, Cambridge University Press, 1997. Boot, A. W. A and Thakor, A. V., “Can relationship banking survive competition”, Journal of Finance, 2 (2000), 679–713. Claessens, S. and Laeven, L., “What drives bank competition? some international evidence”, Journal of Money, Credit, and Banking, 36 (2004), 563-584. Coccorese, P., “Banking competition and macroeconomic conditions: a disaggregated analysis”, International Financial Markets, Institutions and Money, 14 (2004), 203-219. De Bandt, O. and Davis, E. P., “Competition, contestability and market structure in European banking sectors on the eve of EMU”, Journal of Banking and Finance, 24 (2000), 1045-1066. Demsetz, H., “Industry structure, market rivalry and public policy”, Journal of Law and Economics, 16 (1973), 1–19. Diamond, D., “Financial intermediation and delegated monitoring”. Review of Economic Studies, 51, (1984), 393-414. Gelos, G. and Roldos, J., “Consolidation and market structure in emerging market banking systems”, International Monetary Fund Working Paper, 02/186, (2002). Hempell, H. S., “Testing for competition among German banks”, Deutsche Bundesbank, Economic Research Centre, Discussion Paper 04/02, (2002).

Market Structure and Competition In Emerging Market
119
Hondroyiannis, G., Lolos, S. and Papetrou, E., “Assessing competitive conditions in the Greek banking system”, Journal of International Financial Markets, Institutions and Money, 9 (2002), 377-391. Jackson, W., “The price-concentration relationship in banking: a comment”, Review of Economics and Statistics, 74 (1992), 373-376. Lloyd-Williams, D. M, Molyneux, P. and Thornton, J., “Market structure and performance in Spanish banking”, Journal of Banking and Finance, 18 (1991), 433-443. Mamatzakis, E., Staikouras, C. and Koutsomanoli-Fillipaki, N., “Competition and concentration in the banking sector of the South Eastern European region”, Journal of Emerging Market Review, 6 (2005), 192-209. Molyneux, P., Lloyd-Williams, D. M. and Thornton, J., “Competitive conditions in European banking”, Journal of Banking and Finance, 18 (1994), 445-459. Molyneux, P., Altunbas, Y. and Gardner, E., Efficiency in European banking. London: John Wiley and Sons, 1996. Molyneux, P., Thornton, J. and Lloyd-Williams, D. M., “Competition and market contestability in Japanese commercial banking”, Journal of Economics and Business, 48 (1996), 33-45. Murjan, W. and Ruza, C., “The competitive nature of the Arab Middle Eastern banking markets”, International Advances in Economics, 3 (2002), 267-275. Nathan, A. and Neave, E. H., “Competition and contestability in Canada’s financial system: empirical results”, Canadian Journal of Economics, 22 (1989), 576-594. Panzar, J. and Rosse, J., “Structure, conduct and comparative Statistics”, Bell Laboratories Economic Discussion Paper No 248, (1989). Panzar, J. and Rosse, J., “Testing for monopoly equilibrium”, Journal of Industrial Economics, 35 (1987), 443-456.

Journal of Economic Cooperation
120
Perera, S., Skully, M. and Wickramanayake, J., “Competition and structure of South Asian banking: a revenue behaviour approach”, Applied Financial Economics, 16 (2006), 789-801. Shaffer, S., “A non-structural tests for competition in financial markets”, in Bank Structure and Competition, Conference Proceedings, Federal Reserve Bank of Chicago, Chicago, (1982), 225-243. Sealey, C. and Lindley, J. T., “Inputs, outputs and a theory of production and cost at depository financial institutions”, Journal of Finance, 32 (1977), 1251-1266. Vesala, J., “Testing for competition in banking: behavioural evidence from Finland”, Bank of Finland Studies, E: 1 (1995). Weill, L., “On the relationship between competition and efficiency in the EU banking sector”, Kredit und Kapital, 37 (2004), 329-352. White, H., “A heteroscedasticity-consistent covariance matrix estimator and a direct test for heteroscedasticity”, Econometrica, 48 (1980), 817–838. Yildirim, H. S. and Philippatos, G. C., “Competition and contestability in Central and Eastern European banking markets”, FMA International Annual Meeting, Dublin: Ireland, 2002. Yuan, Y., “The state of competition of the Chinese banking industry”, Journal of Asian Economics, 17 (2006), 519-534.