Embed Size (px)
Citation preview
75
Chapter – 3
Hydrology and Water Assessment
3.0 General
Planning for water resources development in a basin requires careful
assessment of the available water resources and reasonable requirements of the
basin in the foreseeable future for various purposes. Hydrological studies are
required to be carried out to assess the available quantity of water in a given
basin and at diversion sites. This chapter deals with the assessment of water
availability of Damanganga basin as a whole and at proposed Bhugad and
Khargihill dam sites in Damanganga basin and at Pinjal dam site in Vaitarna
basin.
3.1 General Climate and Hydrology
The climate of the Damanganga-Pinjal link project area is characterised
by dryness except in south-west monsoon season. The year may be divided into
four seasons, the cold season from December to February followed by the hot
season from March to May and the south-west monsoon season from June to
September followed by the post-monsoon season from October to November.
The hydrological study of this link project has been carried out by
Hydrological Studies Organisation of Central Water Commission (CWC), New
Delhi. The report submitted by CWC is in three volumes: Volume-I deals with
the water availability study; Volume-II deals with the flood study and Volume-
III deals with the sedimentation study. As per the hydrological studies,
Damanganga river basin at proposed Bhugad and Khargihill dam sites has been
found water surplus at 100 % dependability. As such, after meeting the
ultimate in-basin requirements (by 2050 AD) of Damanganga basin upto these
proposed dam sites and downstream commitments/requirements, surplus
water of 579 Mm3 (Bhugad: 210 & Khargihill 369 Mm
3) has been proposed for
diversion into Pinjal reservoir, which is proposed by Government of
Maharashtra across Pinjal river in Vaitarna basin. Similarly, from the proposed
76
Pinjal reservoir the surplus water of 316 Mm3
has been proposed for diversion.
Thus the combined surplus waters of Damanganga and Pinjal basins to the tune
of 895 Mm3 will be carried further to the Mumbai city for augmentation of its
domestic water requirements. The schematic diagram of Damanganga – Pinjal
link is at Fig. – 3.1.
3.2 General Information about the Region
The Damanganga and Vaitarna basins lie in the Western Ghats and are
bounded on the west by Arabian Sea and on the east by Sahyadri hill range.
The basins receive 97% of annual rainfall during monsoon season from June to
September. The average annual rainfall in Damanganga basin varies from 1657
to 2983 mm whereas the same in Vaitarna basin varies from 1748 to 7798 mm.
There are two meteorological observatories: Dahanu maintained by IMD; and
Valsad maintained by Gujarat Government, located in the vicinity of the
project area. In the region May is the hottest month with the mean daily
maximum temperature at 33.6oC at Dahanu and 32.8
oC at Valsad. The mean
daily minimum temperature in this month is 26.9oC at Dahanu and 25.2
oC at
Valsad. From November onwards temperature decreases and January is the
coldest month with the mean daily minimum temperature at 16.7oC at Dahanu
and 13.1 o
C at Valsad. The mean daily maximum temperature in this month is
27.6oC at Dahanu and 28.2
oC at Valsad. The air is very humid during south-
west monsoon season. In the post-monsoon, cold and summer seasons the air is
dry. The relative humidity increases with the onset of monsoon and attains
higher values upto 88% in the month of August at Dahanu and 89% at Valsad
observatories. The relative humidity is as low as 64% at Dahanu in the month
of February and 42% at Valsad in the month of February. The mean maximum
and minimum wind velocities observed at Dahanu station are 20.4 km/hr in
August and 8.1 km/hr in November and the same for Valsad observatory are
12.33 km/hr in June and 4.3 km/hr in December. The mean maximum cloud
cover is observed during the month of August whereas the minimum cloud
cover is observed during the month of February. The mean monthly
evapotranspiration values observed at Dahanu observatory varies from 124 mm
(December) to 226.3 mm (May) and the same at Valsad observatory varies
from 120.9 mm (December) to 238.7 mm (May).

77
Fig 3.1: schematic diagram of Damanganga – Pinjal link
78
3.3 Specific Information
3.3.1 Drainage Basins
a) Damanganga Basin
The river Damanganga is one of the west flowing rivers in the region
North of Mumbai and South of the Tapi river. The river rises in the Sahyadri
hill ranges near village Ambegaon in Dindori taluka of Nasik district of
Maharashtra State at an elevation of 950 m above MSL and traverses a total
distance of about 131 km before discharging into the Arabian Sea. The
important tributaries of the Damanganga river are Dawan, Shrimant, Val,
Rayte, Lendi, Vagh, Sakartond, Dongarkhadi, Roshni and Dudhni. The
Damanganga basin lies between the North latitudes of 19º 52′ & 20º 26′ and
East longitudes of 72º 50′ & 73º 39′. The total catchment area of Damanganga
basin is 2331 km2 of which 1438 km
2 lies in Maharashtra state; 430 km
2 in
Gujarat state; 393 km2 in Union Territory of Dadra & Nagar Haveli; and 70
km2
in Union Territory of Daman & Diu. The Damanganga basin map showing
drainage network is at Plate - 3.1 in Volume - VI.
b) Vaitarna Basin
The river Vaitarna is also a west flowing river in the region North of Mumbai
and South of the Tapi river. The river originates from the Sahyadri hill range in
the Nasik district of Maharashtra State and after traversing a distance of about
171 km in Maharashtra, joins the Arabian Sea. The Vaitarna basin is flanked by
Ulhas basin in South and Damanganga basin in North. The principal tributaries
of river Vaitarna are Pinjal, Surya and Tansa. The basin lies between the North
latitudes of 19º 23′ & 20º 03′ and East longitudes of 72º 45′ & 73º 35′. The
total catchment area of Vaitarna basin is 3,647 km2, which lies entirely in
Maharashtra state. The Vaitarna basin map showing drainage network is at
Plate 3.2 in Volume - VI.
79
c) Pinjal Sub basin
The Pinjal river is one of the tributaries of Vaitarna river, flows entirely
in Maharashtra state.The river originates at South of Utwad village at RL 1,245
m draining across the plateau and joins Vaitarna river 11 km South of village
Pingepada. The proposed Pinjal dam across Pinjal river is located near village
Khidse in Jawhar taluka of Thane district of Maharashtra state. The location of
the dam is at North latitude of 19º 47′ 00 ″ and East longitude of 73º 13′ 00″.
The catchment area of Pinjal dam is bounded by high hills of the Western
Ghats. The river has a meandering course in the south-west unto its confluence
with Vaitarna river about one km north-west of Alman village (19º 38′ 00″ N,
73º 06′ 00″ E) in Thane district. The catchment area up to Pinjal dam site is
317 km2 which lies entirely in Maharashtra state. The catchment area upto
Pinjal dam is shown in Plate 3.2 in Volume - VI.
3.3.2 Floods and Drainage
The gauge and discharge data are being observed by CWC at Nanipalsan
G&D site across Damanganga river just in the downstream of proposed
Bhugad dam site. The annual maximum flow series is available for the period
from 1982 to 2009 at Nanipalsan G&D site. As per the data the maximum
observed flood at Nanipalsan G&D site was 9500 Cumecs on 3rd
August, 2004.
The CWC is also observing gauge and discharge data at Ozarkhed G&D
site across Vagh river (a tributary of Damanganga River) just in the
downstream of proposed Khargihill dam site. The annual maximum flow
series at the Ozarkhed G&D site is available for the period from 1983 to 2009.
As per the available data the maximum observed flood at Ozarkhed G&D site
was 5420 Cumecs on 4th
August, 2004.
The Government of Gujarat has constructed Madhuban dam across river
Damanganga at the location downstream of the confluence of Vagh and
Damanganga rivers. The details of maximum flood events at Madhuban dam
for the period from 1990 to 2013 have been collected from Damanganga
80
Project Circle, Government of Gujarat, Valsad. As per the available data the
maximum observed flood was 18073 Cumecs on 3rd
August, 2004.
3.3.3 River Geometry
The Damanganga River rises in the Sahyadri hill range near village
Ambegaon in Dindori taluka of Nasik district of Maharashtra State. In the
initial reach Damanganga river traverses in westerly direction for about 5 km
and take turn to south west direction and flows about 6 km and thereafter flows
in the hilly region through a well defined channel up to the existing Madhuban
reservoir. After Madhuban reservoir, the river flows in north- West direction
till it out fall in to Arabian Sea near Daman. The river follows sinuous courses
observing both serpentine and rectangular pattern of meandering, whereas the
tributaries broadly exhibits straight courses. The Damanganga basin map
showing drainage network is at Plate - 3.1 in Volume - VI.
3.3.4 Ground Water Recharge
Damanganga – Pinjal link project has been planned as a water supply
project to augment the domestic water supply to Mumbai city and envisages
diversion of surplus waters of Damanganga basin at proposed Bhugad and
Khargihill reservoirs to proposed Pinjal reservoir in Vaitarna basin. The
diversion of water is through tunnels only. Project does not envisages to
provide irrigation and also no canal network is envisages, as such, recharge of
ground water is expected due to formation of proposed Bhugad and Khargihill
reservoirs only.
3.3.5 Reservoir Area
For facilitating storage and transfer of surplus waters of Damanganga
and Pinjal rivers for augmentation of domestic water supply to Mumbai city,
NWDA has proposed two reservoirs: one at Bhugad across Damanganga river;
and another at Khargihill across Vagh river (a tributary of Damanganga river).
The Water Resource Department of Government of Maharashtra has proposed
81
Pinjal reservoir across river Pinjal (tributary of Vaitarna river). The details of
these reservoirs are described below:
a) Bhugad Reservoir
The Bhugad reservoir is proposed across river Damanganga, which
forms boundary between Maharashtra and Gujarat states near village Bhugad
(20o 12’ 30” N, 73
o 17’ 32” E) in Trimbak taluka of Nasik district of
Maharashtra state on left bank and Modushi village of Kaprada taluka of
Valsad district of Gujarat state on right bank. At Bhugad dam site, the
Damanganga river flows through a well defined channel with a change in
direction from North-East to South-South West. The catchment area of
Damanganga basin upto the proposed Bhugad dam site is 708 km2, of which
567 km2 lies in the Nasik district of Maharashtra and 141 km
2 in Valsad district
of Gujarat state. The length of Damanganga river upto the Bhugad dam site is
about 55 km. The Bhugad reservoir area lies between latitudes 20o 3’ 30” N &
20o 19’ 00” N and longitudes 73
o 17’ 00” E & 73
o 38’ 30” E. The
submergence area of Bhugad reservoir at FRL 163.87 m is 1903 ha of which
290 ha covered by forest area. The submergence area of the reservoir lies in
Kaprada taluka of Valsad district of Gujarat state and Trimbak and Peint taluka
of Nasik district of Maharashtra state. The reservoir extends along
Damanganga river with fetch length of 14 km. A narrow arm of reservoir also
extends along Bila Nala upto Bhadri and along Rasani river upto village
Fanaspada. The deepest bed level of the river Damanganga at the proposed
Bhugad dam site is 101.16 m. The proposed Bhugad dam site is flanked by
steep slope (40º) at the right bank rising up to RL 245 m and forming a
prominent rock scrap between RL 220 m and RL 245 m. On the left bank, the
river is characterised by a narrow river terrace (RL 106 m to 110 m) with a
microscrap (23 m) exposing cross stratified sandy and bouldary river fill.
Beyond the river terrace, the left bank is characterised by a wide spread area of
highly guilled undulating and hummocky topography with hummocks rising to
a maximum height of RL 132 m. The left abutment rises at moderate slopes
(20º) to a level of RL 190 m.

82
The dam is approachable by road from Valsad town of Gujarat state
through Valsad-Dharampur-Nasik state highway upto Statebari village (70 km)
and thereafter through 25 km WBM road through Modushi village situated on
the right bank of the river. The left bank of Bhugad dam is approachable from
Nasik side by Nasik- Harshul- Baphanvihir - Ranapada road (80 km).
b) Khargihill Reservoir
The Khargihill reservoir is proposed across river Vagh (a tributary of
Damanganga river) near village Behadpada (20º 5′ 5” N, 73º 16′ 27″ E) in
Jawhar taluka of Thane district of Maharashtra state and about 1.5 km
upstream of Behadpada-Ozarkhed road crossing across Vagh river. The
catchment area of Vagh river upto its confluence with Damanganga river is 743
km2 and upto the proposed Khargihill dam site is 646 km
2, of which 220 km
2
lies in Nasik and 426 km2 in Thane districts of Maharashtra. The length of
Vagh river upto Khargihill dam site is about 44 km. The Vagh river near
Khargihill dam site flows in northerly direction through a well defined channel
and its deepest bed level is 84.825 m. The principal tributaries of river Vagh
are Val, Rayte, Dhamni, Domihira and Lendi. The reservoir area lies between
latitudes 20º 5′ 24″ N & 19º 58′ 30″ N and longitudes 73º 21′ 00″ E & 73º
13′ 00″ E. The submergence area of Khargihill reservoir is 1558 ha at FRL
154.52 m of which 676 ha is covered by forest area.
Considering the resistance from local people, a study has been made to
relocate the dam site of proposed Khargihill dam by about 3 Km up-stream of
the present site and just down-stream of confluence of Lendi and Vagh rivers.
The catchment area upto alternative dam site is about 635 Km2. At this site also
no field work could be taken up due to public opposition. As such dam axis
finalised by GSI at FR stage has been considered at DPR stage studies.
The reservoir area lies in Trimbak taluka of Nasik district and Jawhar &
Mokhada talukas of Thane district of Maharashtra state. The area is flanked on
the right bank by steep rock-cut slopes attaining a maximum level of RL 185 m
with a prominent 35 m vertical scrap at the crown. On the left bank, beyond
the boundary zone, the channel bed lies as 258 m wide section of alluvial fill
83
characterized by terrace between RL 91 m and RL 96 m and undulatory
topography. The left abutment rises at a slope of 30º and terminates into
plateau with a scarp between RL 147 m and RL 174 m. Further 1.5 km
towards south-west of dam site, the plateau comes down to a level of RL 137 m
forming a prominent saddle at north of village Vavar.
The proposed Khargihill dam site is approachable from Valsad town
through Valsad–Vapi, National Highway No.8 (24 km) and from Vapi through
Silvassa – Chalatwar - Behadpada state highway (83 km). The right bank of
the dam is also approachable from Nasik side through Nasik – Harsul –
Ozarkhed - Behadpada road (85 km).
c) Pinjal Reservoir
The Pinjal reservoir is proposed by Government of Maharashtra across
river Pinjal (a tributary of Vaitarna river) near village Khidse in Jawhar taluka
of Thane district of Maharashtra state. The latitude and longitude of this project
are 19º 47′ 00 ″ N and 73º 13′ 00″ E respectively. The nearest town to this
project is Jawhar, a taluka headquarter of Thane district. The dam site is
approachable from Valsad through Valsad-Vapi-Silvassa – Chalatwad –
Jawhar - Ene road (125 km) and also approachable through Valsad- Charoti
(National Highway No.8)-Jawhar- Ene village (160 km). The nearest railway
station is at Kalyan of Central Railway, which is located 85 km from dam site.
The submergence area of the reservoir lies in Jawhar, Mokhada and Vada
talukas of Thane district of Maharashtra state. The Water Resources
Department, Government of Maharashtra had prepared a Detailed Project
Report for Pinjal project in the year 1981. The required information of this
project has been taken from this DPR.
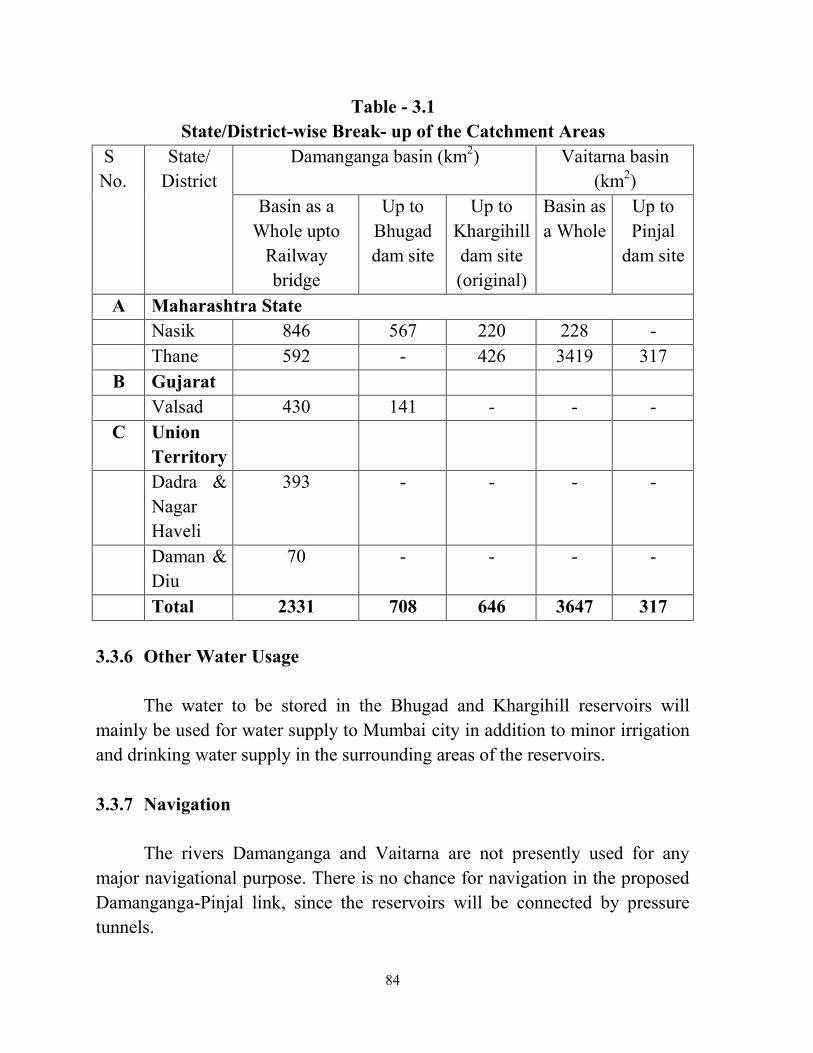
The State/District-wise break -up of the catchment areas of Damanganga
and Vaitarna basins and upto proposed dam sites is given in Table - 3.1 below:
84
Table - 3.1
State/District-wise Break- up of the Catchment Areas
S
No.
State/
District
Damanganga basin (km2) Vaitarna basin
(km2)
Basin as a
Whole upto
Railway
bridge
Up to
Bhugad
dam site
Up to
Khargihill
dam site
(original)
Basin as
a Whole
Up to
Pinjal
dam site
A Maharashtra State
Nasik 846 567 220 228 -
Thane 592 - 426 3419 317
B Gujarat
Valsad 430 141 - - -
C Union
Territory
Dadra &
Nagar
Haveli
393 - - - -
Daman &
Diu
70 - - - -
Total 2331 708 646 3647 317
3.3.6 Other Water Usage
The water to be stored in the Bhugad and Khargihill reservoirs will
mainly be used for water supply to Mumbai city in addition to minor irrigation
and drinking water supply in the surrounding areas of the reservoirs.
3.3.7 Navigation
The rivers Damanganga and Vaitarna are not presently used for any
major navigational purpose. There is no chance for navigation in the proposed
Damanganga-Pinjal link, since the reservoirs will be connected by pressure
tunnels.
85
3.4 Data Availability
3.4.1 Rainfall and Snowfall
There is no snowfall in Damanganga and Vaitarna basins. The
observational network of rainfall data is fairly good in the vicinity of the
project area. There are number of rain-gauge stations and G&D sites in
Damanganga basin and Pinjal sub-basin where long term data is available.
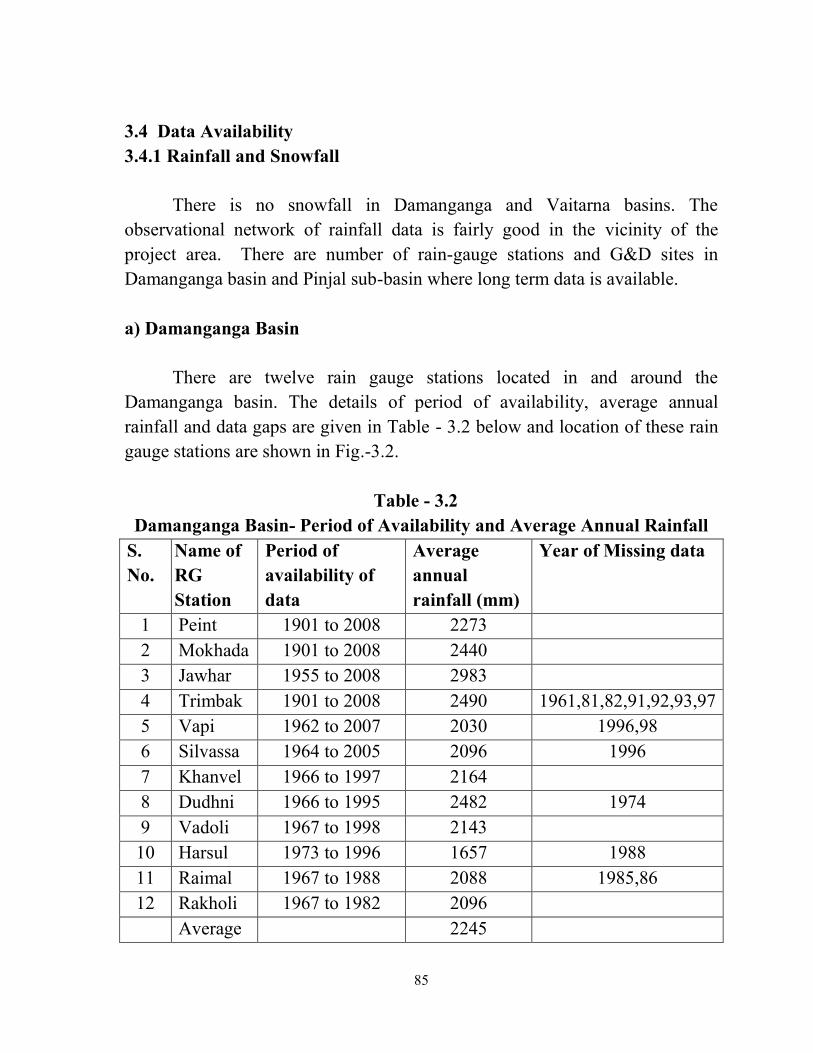
a) Damanganga Basin
There are twelve rain gauge stations located in and around the
Damanganga basin. The details of period of availability, average annual
rainfall and data gaps are given in Table - 3.2 below and location of these rain
gauge stations are shown in Fig.-3.2.
Table - 3.2
Damanganga Basin- Period of Availability and Average Annual Rainfall
S.
No.
Name of
RG
Station
Period of
availability of
data
Average
annual
rainfall (mm)
Year of Missing data
1 Peint 1901 to 2008 2273
2 Mokhada 1901 to 2008 2440
3 Jawhar 1955 to 2008 2983
4 Trimbak 1901 to 2008 2490 1961,81,82,91,92,93,97
5 Vapi 1962 to 2007 2030 1996,98
6 Silvassa 1964 to 2005 2096 1996
7 Khanvel 1966 to 1997 2164
8 Dudhni 1966 to 1995 2482 1974
9 Vadoli 1967 to 1998 2143
10 Harsul 1973 to 1996 1657 1988
11 Raimal 1967 to 1988 2088 1985,86
12 Rakholi 1967 to 1982 2096
Average 2245
86
Fig. – 3.2 : Location of rain gauge stations in Damanganga basin
87
The consistency check of rainfall data of all the stations have been
carried out by CWC using double mass curve technique. The missing data have
been estimated using normal ratio formula.
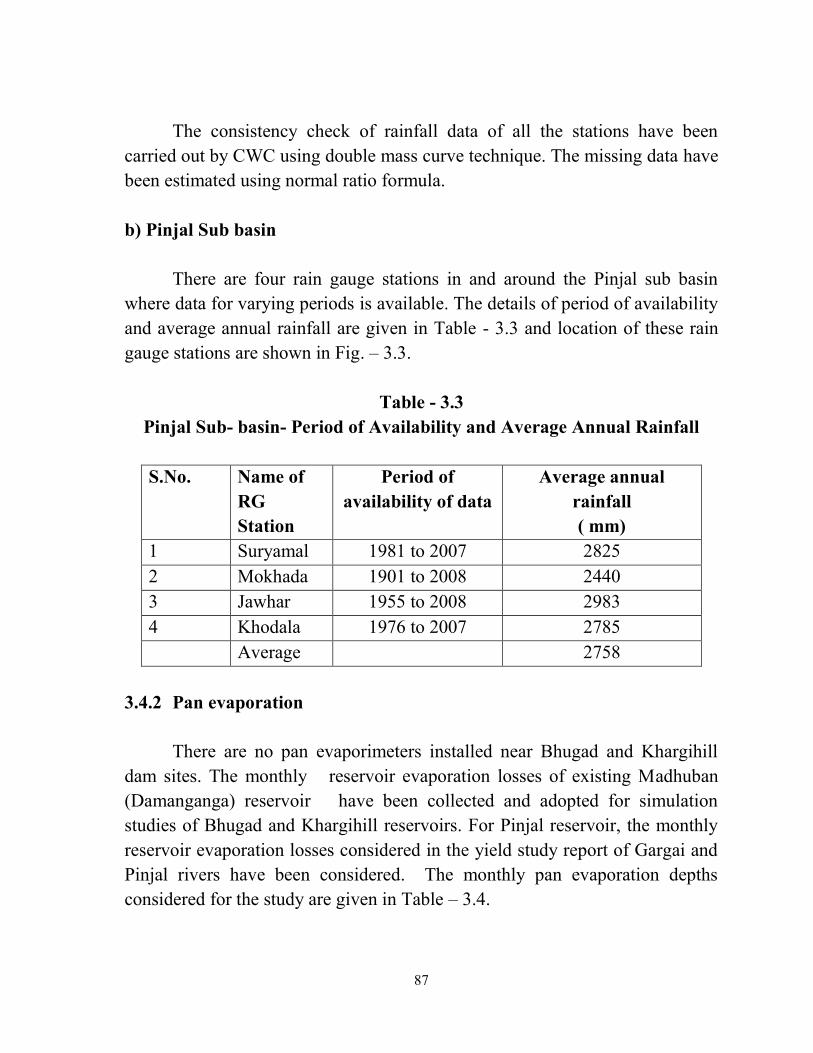
b) Pinjal Sub basin
There are four rain gauge stations in and around the Pinjal sub basin
where data for varying periods is available. The details of period of availability
and average annual rainfall are given in Table - 3.3 and location of these rain
gauge stations are shown in Fig. – 3.3.
Table - 3.3
Pinjal Sub- basin- Period of Availability and Average Annual Rainfall
S.No. Name of
RG
Station
Period of
availability of data
Average annual
rainfall
( mm)
1 Suryamal 1981 to 2007 2825
2 Mokhada 1901 to 2008 2440
3 Jawhar 1955 to 2008 2983
4 Khodala 1976 to 2007 2785
Average 2758
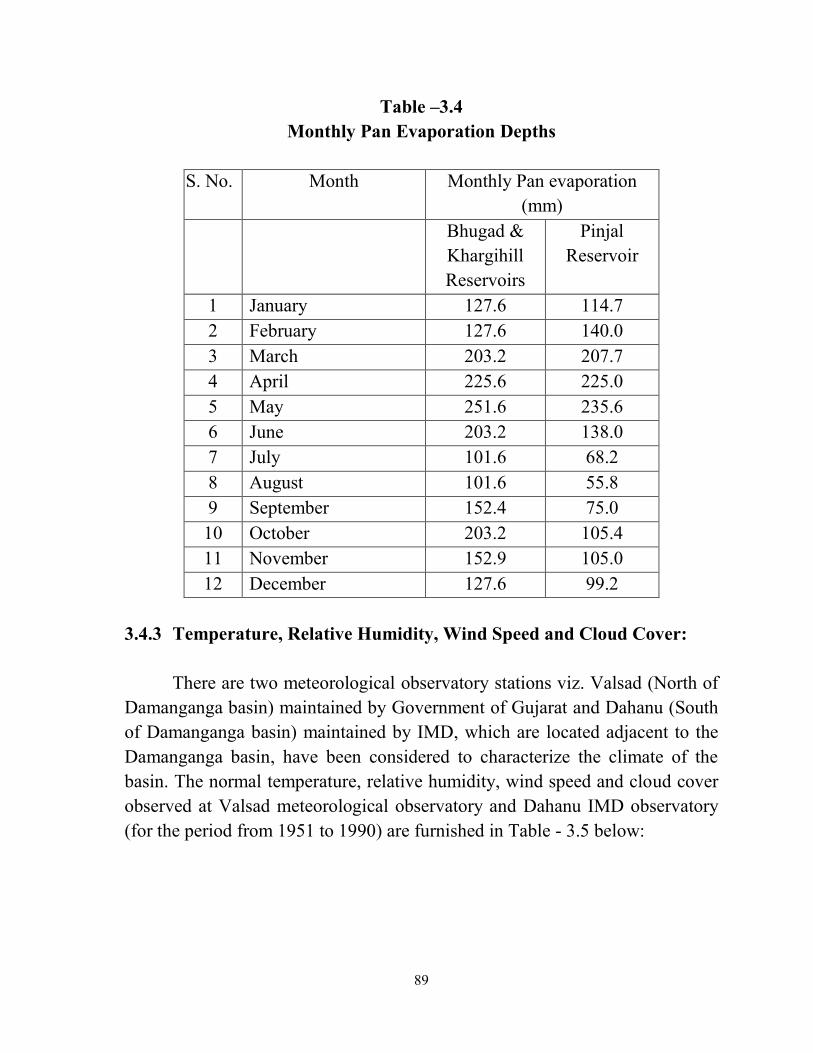
3.4.2 Pan evaporation
There are no pan evaporimeters installed near Bhugad and Khargihill
dam sites. The monthly reservoir evaporation losses of existing Madhuban
(Damanganga) reservoir have been collected and adopted for simulation
studies of Bhugad and Khargihill reservoirs. For Pinjal reservoir, the monthly
reservoir evaporation losses considered in the yield study report of Gargai and
Pinjal rivers have been considered. The monthly pan evaporation depths
considered for the study are given in Table – 3.4.
88
Fig. – 3.3 : Location of rain gauge stations in Pinjal sub-basin
89
Table –3.4
Monthly Pan Evaporation Depths
S. No. Month Monthly Pan evaporation
(mm)
Bhugad &
Khargihill
Reservoirs
Pinjal
Reservoir
1 January 127.6 114.7
2 February 127.6 140.0
3 March 203.2 207.7
4 April 225.6 225.0
5 May 251.6 235.6
6 June 203.2 138.0
7 July 101.6 68.2
8 August 101.6 55.8
9 September 152.4 75.0
10 October 203.2 105.4
11 November 152.9 105.0
12 December 127.6 99.2
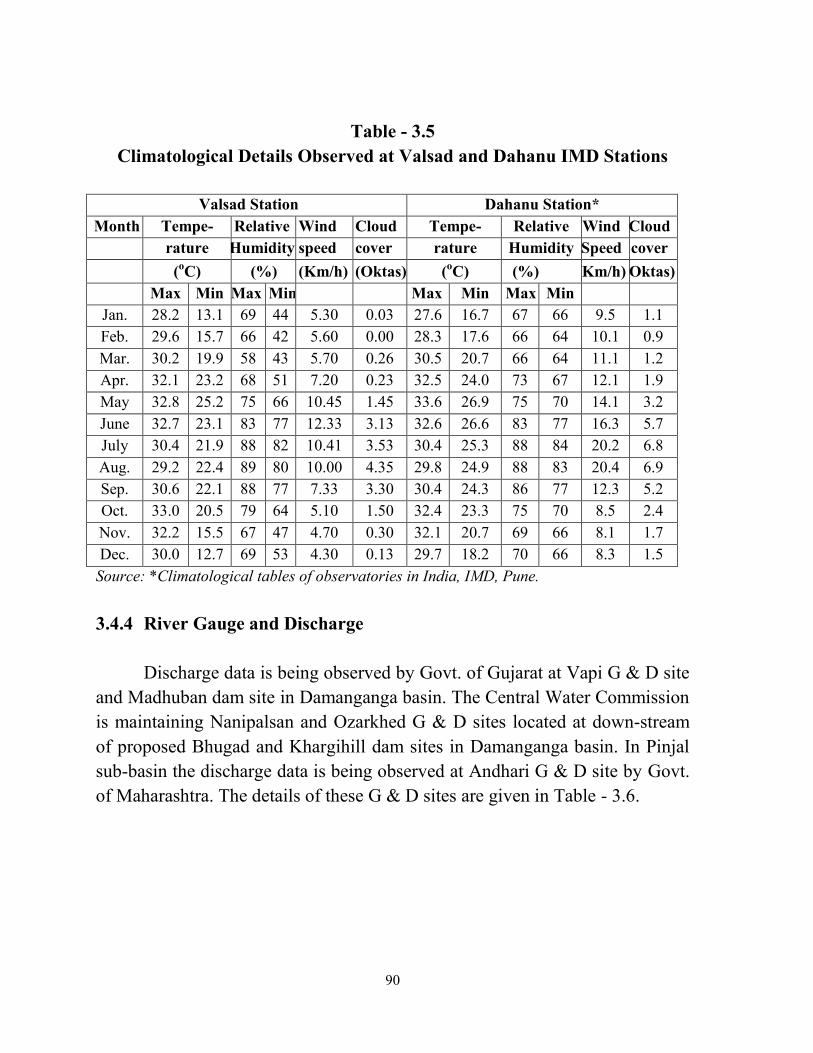
3.4.3 Temperature, Relative Humidity, Wind Speed and Cloud Cover:
There are two meteorological observatory stations viz. Valsad (North of
Damanganga basin) maintained by Government of Gujarat and Dahanu (South
of Damanganga basin) maintained by IMD, which are located adjacent to the
Damanganga basin, have been considered to characterize the climate of the
basin. The normal temperature, relative humidity, wind speed and cloud cover
observed at Valsad meteorological observatory and Dahanu IMD observatory
(for the period from 1951 to 1990) are furnished in Table - 3.5 below:
90
Table - 3.5
Climatological Details Observed at Valsad and Dahanu IMD Stations
Valsad Station Dahanu Station*
Month Tempe- Relative Wind Cloud Tempe- Relative Wind Cloud
rature Humidity speed cover rature Humidity Speed cover
(oC) (%) (Km/h) (Oktas) (
oC) (%) (Km/h) (Oktas)
Max Min Max Min Max Min Max Min
Jan. 28.2 13.1 69 44 5.30 0.03 27.6 16.7 67 66 9.5 1.1
Feb. 29.6 15.7 66 42 5.60 0.00 28.3 17.6 66 64 10.1 0.9
Mar. 30.2 19.9 58 43 5.70 0.26 30.5 20.7 66 64 11.1 1.2
Apr. 32.1 23.2 68 51 7.20 0.23 32.5 24.0 73 67 12.1 1.9
May 32.8 25.2 75 66 10.45 1.45 33.6 26.9 75 70 14.1 3.2
June 32.7 23.1 83 77 12.33 3.13 32.6 26.6 83 77 16.3 5.7
July 30.4 21.9 88 82 10.41 3.53 30.4 25.3 88 84 20.2 6.8
Aug. 29.2 22.4 89 80 10.00 4.35 29.8 24.9 88 83 20.4 6.9
Sep. 30.6 22.1 88 77 7.33 3.30 30.4 24.3 86 77 12.3 5.2
Oct. 33.0 20.5 79 64 5.10 1.50 32.4 23.3 75 70 8.5 2.4
Nov. 32.2 15.5 67 47 4.70 0.30 32.1 20.7 69 66 8.1 1.7
Dec. 30.0 12.7 69 53 4.30 0.13 29.7 18.2 70 66 8.3 1.5
Source: *Climatological tables of observatories in India, IMD, Pune.
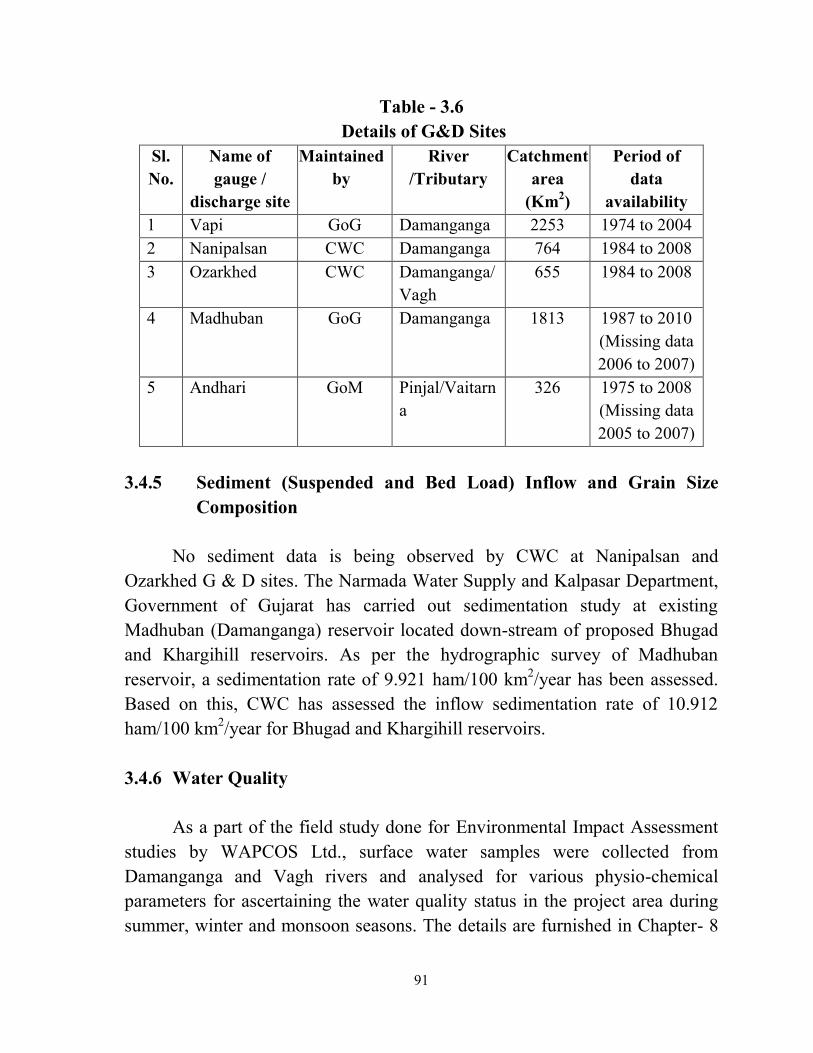
3.4.4 River Gauge and Discharge
Discharge data is being observed by Govt. of Gujarat at Vapi G & D site
and Madhuban dam site in Damanganga basin. The Central Water Commission
is maintaining Nanipalsan and Ozarkhed G & D sites located at down-stream
of proposed Bhugad and Khargihill dam sites in Damanganga basin. In Pinjal
sub-basin the discharge data is being observed at Andhari G & D site by Govt.
of Maharashtra. The details of these G & D sites are given in Table - 3.6.
91
Table - 3.6
Details of G&D Sites
Sl.
No.
Name of
gauge /
discharge site
Maintained
by
River
/Tributary
Catchment
area
(Km2)
Period of
data
availability
1 Vapi GoG Damanganga 2253 1974 to 2004
2 Nanipalsan CWC Damanganga 764 1984 to 2008
3 Ozarkhed CWC Damanganga/
Vagh
655 1984 to 2008
4 Madhuban GoG Damanganga 1813 1987 to 2010
(Missing data
2006 to 2007)
5 Andhari GoM Pinjal/Vaitarn
a
326 1975 to 2008
(Missing data
2005 to 2007)
3.4.5 Sediment (Suspended and Bed Load) Inflow and Grain Size
Composition
No sediment data is being observed by CWC at Nanipalsan and
Ozarkhed G & D sites. The Narmada Water Supply and Kalpasar Department,
Government of Gujarat has carried out sedimentation study at existing
Madhuban (Damanganga) reservoir located down-stream of proposed Bhugad
and Khargihill reservoirs. As per the hydrographic survey of Madhuban
reservoir, a sedimentation rate of 9.921 ham/100 km2/year has been assessed.
Based on this, CWC has assessed the inflow sedimentation rate of 10.912
ham/100 km2/year for Bhugad and Khargihill reservoirs.
3.4.6 Water Quality
As a part of the field study done for Environmental Impact Assessment
studies by WAPCOS Ltd., surface water samples were collected from
Damanganga and Vagh rivers and analysed for various physio-chemical
parameters for ascertaining the water quality status in the project area during
summer, winter and monsoon seasons. The details are furnished in Chapter- 8
92
“Environmental Impact Assessment and Environmental Management Plan”.
The laboratory test results carried out for collected water samples indicate that
the quality of surface water is generally of safe category.
Ground water analysis for EIA studies has been done in the year 2010.
It is found that the quality of ground water is satisfactory in the project area.
Thus, it may be generally said that the ground water in the area is good and fit
for use.
3.5 Hydrological Data Requirements
3.5.1 Alternatives and Classifications
This information is not necessary for the present study
3.6 Type of Inputs
3.6.1 Hydrological Inputs
a) Temporal data
For economic design of any hydraulic structure such as spillways,
barrages etc. estimation of design flood is required. Diversion flood is required
for estimation of carrying capacity of the diversion channel. Guidelines are
available for selection of methodology for estimation of design flood. For
major structures, the design flood is estimated using hydro-meteorological
approach and the diversion flood is estimated mainly by frequency analysis of
non-peak period flood. Hence, short duration rainfall-runoff data are required
for estimation of design flood. Short duration rainfall data are generally
measured at the gauging stations/ Automatic weather stations using self
recording rain gauges. Hourly gauge data are required for estimation of short
duration discharge data and non monsoon peak flow data are required for
estimation of diversion flood.
To estimate the reservoir inflow, daily discharge series are required. In
absence of daily series, ten-daily series can be used. For development of
rainfall-yield relationship, daily/monthly average rainfall and concurrent
stream flow data are required. The inflow to the reservoir is affected by water
93
utilization at the upstream. Hence the utilization of water by the upstream
projects is also required to compute the reservoir inflow. The periodic water
demands and releases from the reservoir, and evaporation rates in the reservoir
area are also required for simulation study of a reservoir.
b) Time Units for Simulation Studies
Two types of simulations are mainly carried out: (a) routing of design
flood through the reservoir to estimate the dam height, (b) reservoir simulation
with series of inflows and demands to estimate the reliability of the reservoir.
For reservoir routing, hourly time unit is used. For reservoir simulation,
monthly time unit is adopted.
3.7 Compilation and Processing of Basic Hydrological Data
3.7.1 Hydrological Investigation
As indicated in Table 3.6 above, the Nanipalsan G & D site across river
Damanganga and Ozarkhed G&D site across Vagh river maintained by CWC are
located about 3 km downstream of the proposed Bhugad and Khargihill dam sites
respectively. The G & D data of these sites are available from 1984 onwards and
has been used to develop the yield series at Bhugad and Khargihill dam sites
respectively.
The data at Vapi G & D site located across river Damanganga river,
maintained by Govt. of Gujarat are available for the period from 1974 to 2004 and
the same has been used for developing the yield series of whole Damanganga
basin.
For generation of yield series at the proposed Pinjal dam site, the G & D
data available for the period from 1975 to 2004 at Andhari G&D site located near
the Pinjal dam site, maintained by Government of Maharashtra have been used.
94
3.7.2 Data from Other Sources
The data used in this study were collected from various agencies.
Rainfall, climatological and evapotranspiration data were collected from IMD.
G&D data was collected form CWC and Water Resources Departments of
Govt. of Maharashtra and Gujarat states. The data related to Water Resources
projects such as location, water utilisation and other salient features were
collected from Water Resources Departments of the concerned State
Governments.
3.7.3 Processing of Data
The time units of available and required time series data are often
different. Further, the short duration discharges are not measured but are
estimated from the gauge records. This requires preliminary processing of the
time series data. Following hydrological variables were processed in this study:
(i) rainfall data (ii) gauge and discharge data.
3.7.3.1 Quality of Data
As indicated in the Table 3.2 and 3.3 above, the rainfall data at above
stations is available for varying periods with some missing records for shorter
durations. These missing record values have been estimated using standard
statistical methods. As indicated in Table 3.6, Gauge & discharge data are
available at Nanipalsan G&D site just down-stream of proposed Bhugad dam
site across river Damanganga river; at Ozarkhed G&D site down-stream of
proposed Khargihill dam site across Vagh river; at Andhari G&D site down-
stream of proposed Pinjal dam site across Pinjal river for varying periods. The
data observed at these sites have been checked for consistency and
homogeneity. Both internal and external consistency checks were made on
discharge data.
95
3.7.3.2 Filling of Short Data Gaps
The rainfall data is mostly available for all the stations from the year
1975 to 2008 and the same has been considered in this study. Still there are
some gaps in the rainfall data and same have been filled using standard
procedure. These gaps are filled by the normal ratio formula as given below:
Px = Nx/m[ P1/N1+ P2/N2+ ……… Pm/Nm]
Where,
Px is estimated rainfall of a station for a particular month and year
Nx is average rainfall of the station for that particular month
P1, P2…… Pm are observed rainfall of nearby stations in that particular month
and period
N1 N2 …….Nm are average rainfall of nearby stations for that particular
month
Using above procedure, gaps in rainfall data have been filled up and the
same has been used for working out the weighted average rainfall of the
catchments.
3.7.4 Consistency of Data
3.7.4.1 Consistency Check of Rainfall Data
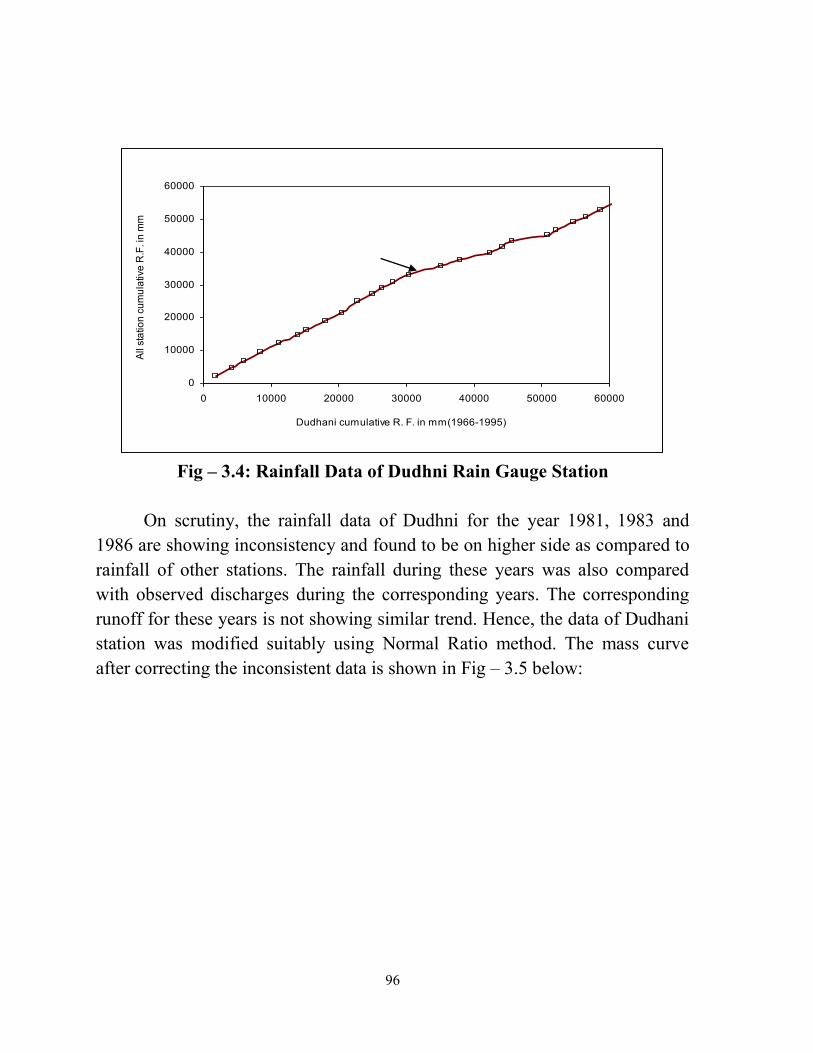
The consistency of rainfall data of all the stations have been checked
using double mass curve technique. Plots of mass curves indicate that the
rainfall data is more or less consistent for almost all the stations. Only the
rainfall data of Dudhni rain gauge station is showing some inconsistency as
indicated in Fig. – 3.4 below:
96
0
10000
20000
30000
40000
50000
60000
0 10000 20000 30000 40000 50000 60000
Dudhani cumulative R. F. in mm(1966-1995)
All
sta
tio
n c
um
ula
tive
R.F
. in
mm
Fig – 3.4: Rainfall Data of Dudhni Rain Gauge Station
On scrutiny, the rainfall data of Dudhni for the year 1981, 1983 and
1986 are showing inconsistency and found to be on higher side as compared to
rainfall of other stations. The rainfall during these years was also compared
with observed discharges during the corresponding years. The corresponding
runoff for these years is not showing similar trend. Hence, the data of Dudhani
station was modified suitably using Normal Ratio method. The mass curve
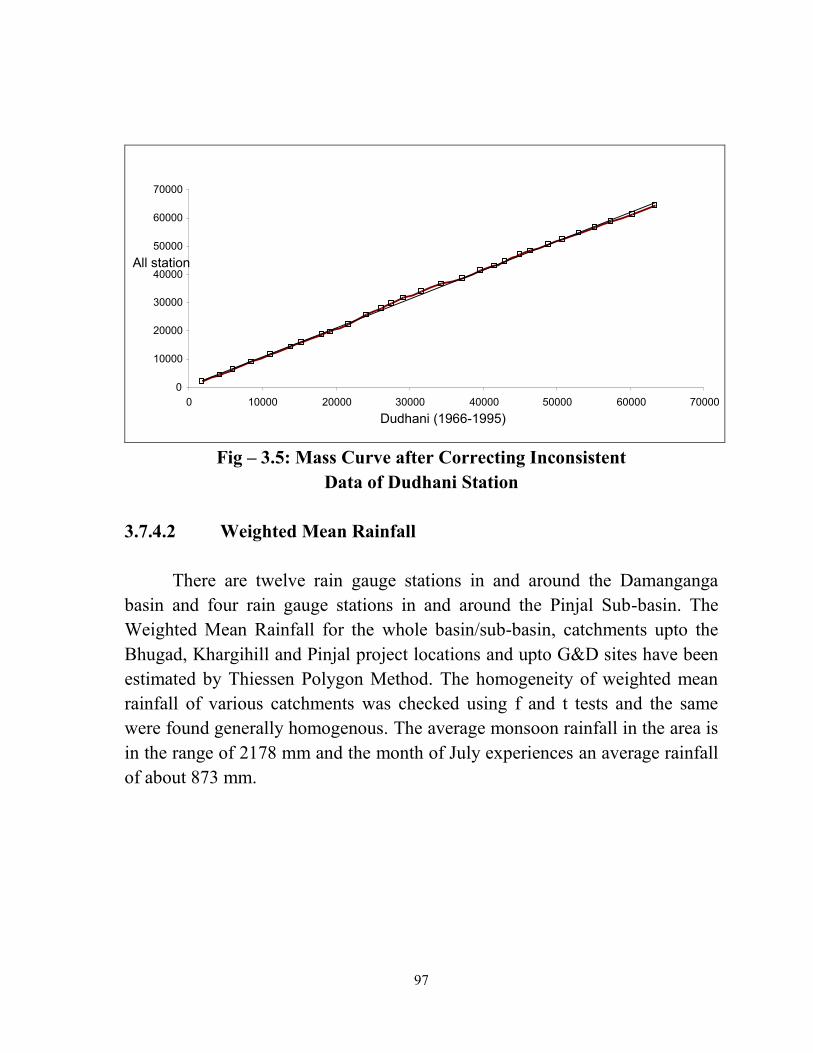
after correcting the inconsistent data is shown in Fig – 3.5 below:
97
Fig – 3.5: Mass Curve after Correcting Inconsistent
Data of Dudhani Station
3.7.4.2 Weighted Mean Rainfall
There are twelve rain gauge stations in and around the Damanganga
basin and four rain gauge stations in and around the Pinjal Sub-basin. The
Weighted Mean Rainfall for the whole basin/sub-basin, catchments upto the
Bhugad, Khargihill and Pinjal project locations and upto G&D sites have been
estimated by Thiessen Polygon Method. The homogeneity of weighted mean
rainfall of various catchments was checked using f and t tests and the same
were found generally homogenous. The average monsoon rainfall in the area is
in the range of 2178 mm and the month of July experiences an average rainfall
of about 873 mm.
0
10000
20000
30000
40000
50000
60000
70000
0 10000 20000 30000 40000 50000 60000 70000
Dudhani (1966-1995)
All station
98
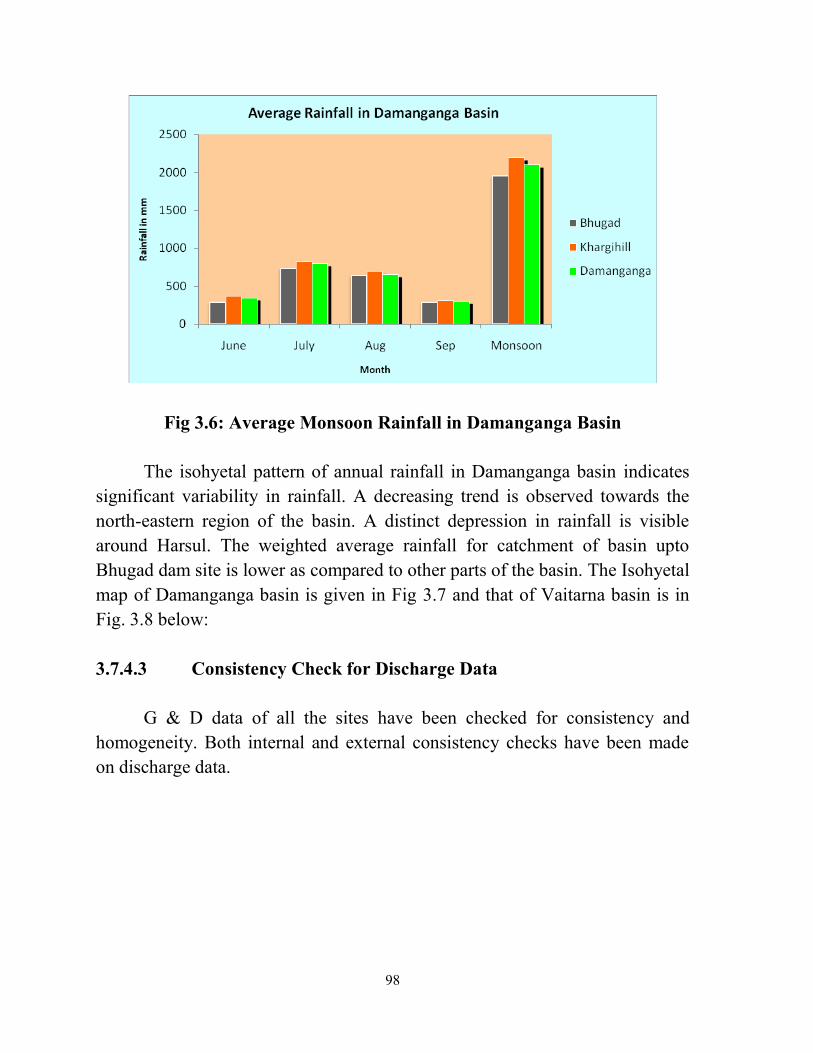
Fig 3.6: Average Monsoon Rainfall in Damanganga Basin
The isohyetal pattern of annual rainfall in Damanganga basin indicates
significant variability in rainfall. A decreasing trend is observed towards the
north-eastern region of the basin. A distinct depression in rainfall is visible
around Harsul. The weighted average rainfall for catchment of basin upto
Bhugad dam site is lower as compared to other parts of the basin. The Isohyetal
map of Damanganga basin is given in Fig 3.7 and that of Vaitarna basin is in
Fig. 3.8 below:
3.7.4.3 Consistency Check for Discharge Data
G & D data of all the sites have been checked for consistency and
homogeneity. Both internal and external consistency checks have been made
on discharge data.
99
Fig 3.7: Isohyetal map of Damanganga basin

100
Fig 3.8: Isohyetal map of Vaitarna basin
101
i) Internal Consistency
(a) Single Mass Curve
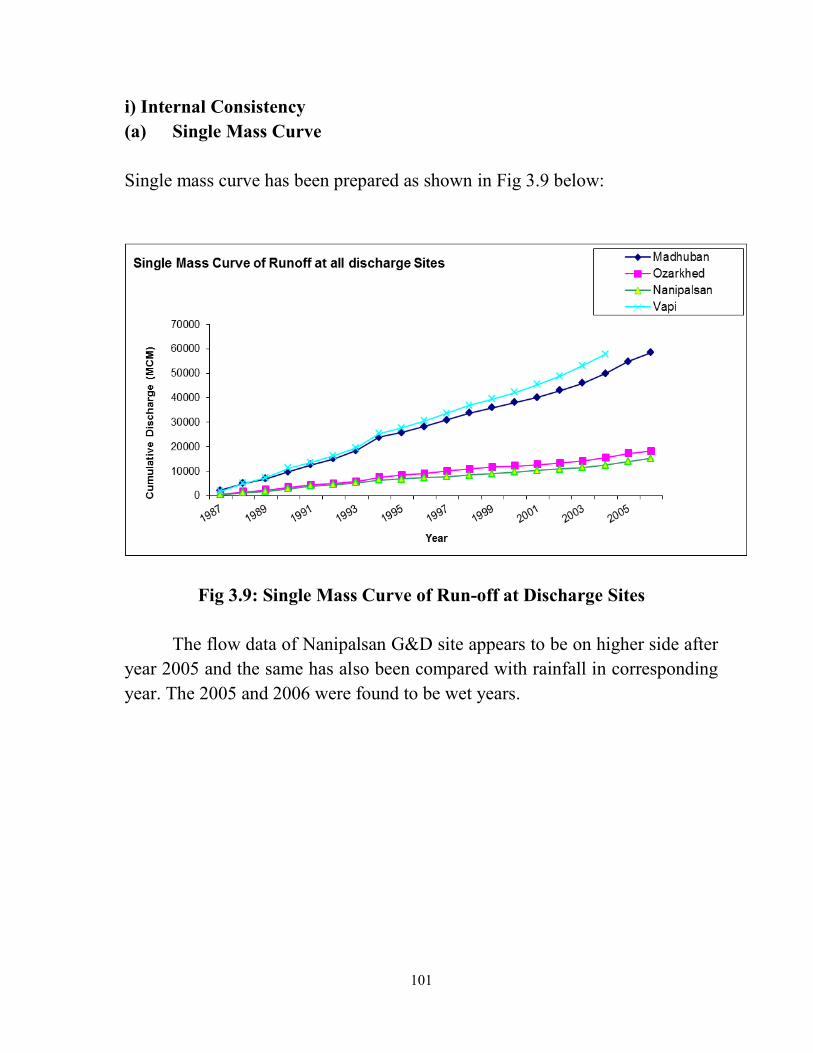
Single mass curve has been prepared as shown in Fig 3.9 below:
Fig 3.9: Single Mass Curve of Run-off at Discharge Sites
The flow data of Nanipalsan G&D site appears to be on higher side after
year 2005 and the same has also been compared with rainfall in corresponding
year. The 2005 and 2006 were found to be wet years.
102
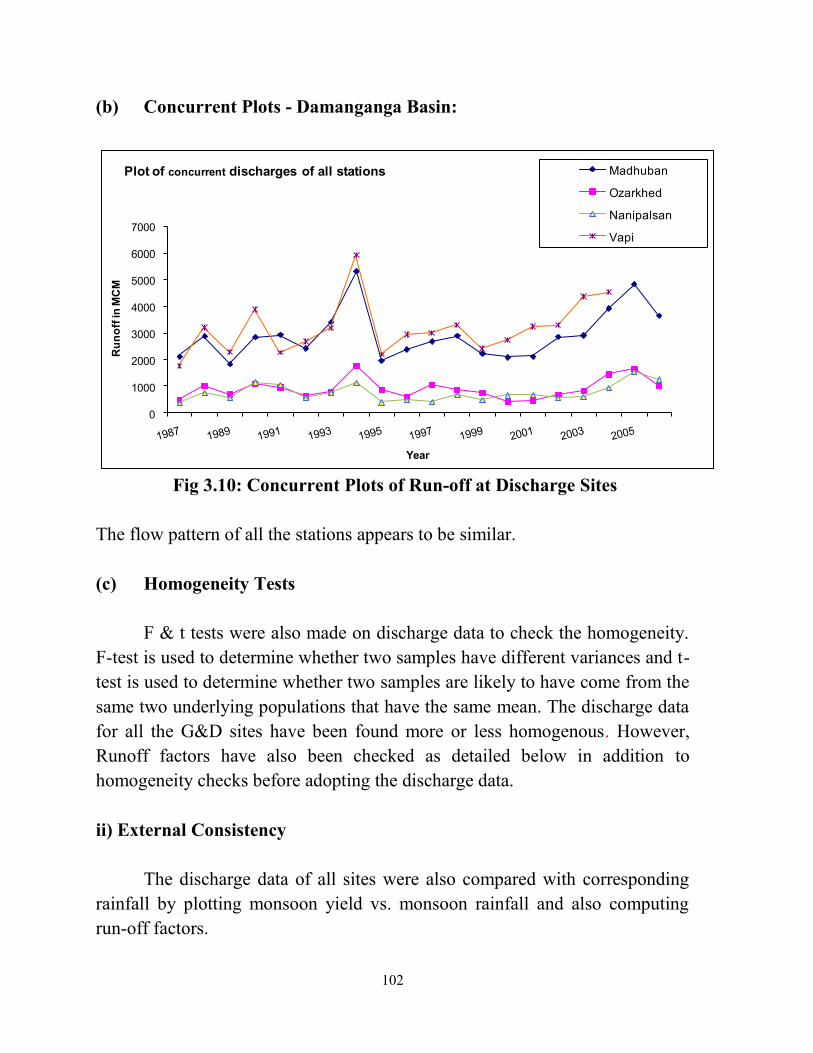
(b) Concurrent Plots - Damanganga Basin:
0
1000
2000
3000
4000
5000
6000
7000
Ru
no
ff in
MC
M
Year
Plot of concurrent discharges of all stations Madhuban
Ozarkhed
Nanipalsan
Vapi
Fig 3.10: Concurrent Plots of Run-off at Discharge Sites
The flow pattern of all the stations appears to be similar.
(c) Homogeneity Tests
F & t tests were also made on discharge data to check the homogeneity.
F-test is used to determine whether two samples have different variances and t-
test is used to determine whether two samples are likely to have come from the
same two underlying populations that have the same mean. The discharge data
for all the G&D sites have been found more or less homogenous. However,
Runoff factors have also been checked as detailed below in addition to
homogeneity checks before adopting the discharge data.
ii) External Consistency
The discharge data of all sites were also compared with corresponding
rainfall by plotting monsoon yield vs. monsoon rainfall and also computing
run-off factors.
103
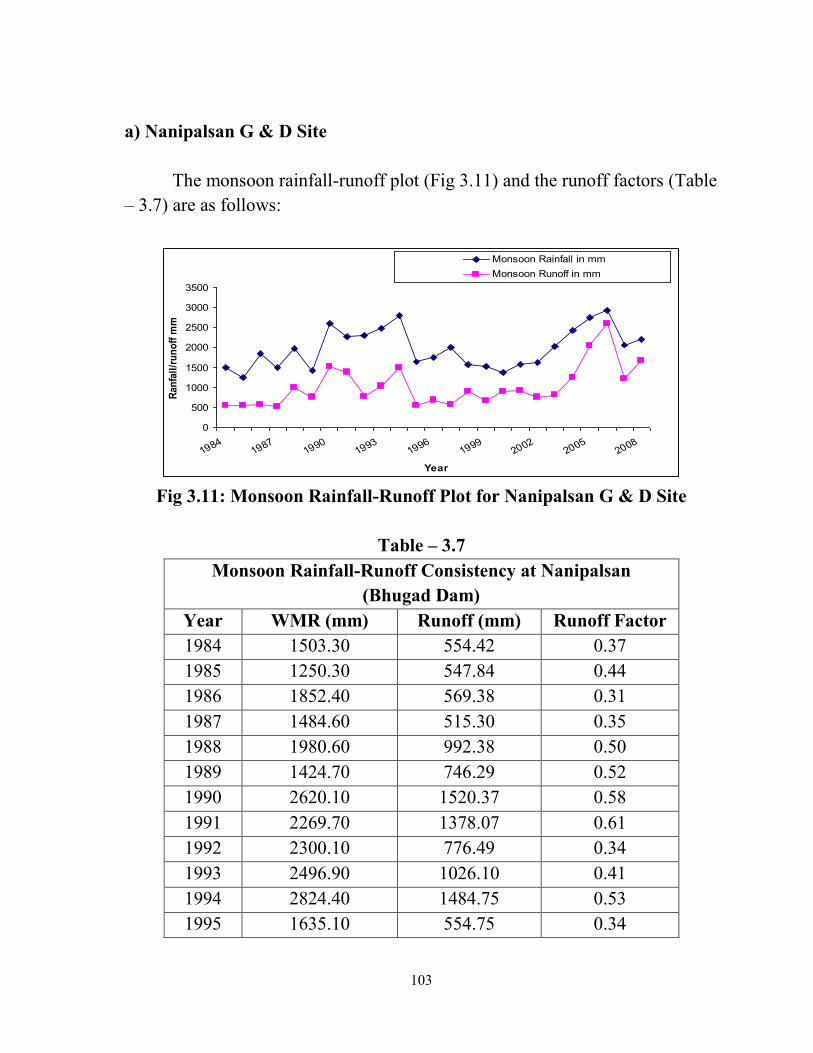
a) Nanipalsan G & D Site
The monsoon rainfall-runoff plot (Fig 3.11) and the runoff factors (Table
– 3.7) are as follows:
0
500
1000
1500
2000
2500
3000
3500
19841987
19901993
19961999
20022005
2008
Year
Ran
fall
/ru
no
ff m
m
Monsoon Rainfall in mm
Monsoon Runoff in mm
Fig 3.11: Monsoon Rainfall-Runoff Plot for Nanipalsan G & D Site
Table – 3.7
Monsoon Rainfall-Runoff Consistency at Nanipalsan
(Bhugad Dam)
Year WMR (mm) Runoff (mm) Runoff Factor
1984 1503.30 554.42 0.37
1985 1250.30 547.84 0.44
1986 1852.40 569.38 0.31
1987 1484.60 515.30 0.35
1988 1980.60 992.38 0.50
1989 1424.70 746.29 0.52
1990 2620.10 1520.37 0.58
1991 2269.70 1378.07 0.61
1992 2300.10 776.49 0.34
1993 2496.90 1026.10 0.41
1994 2824.40 1484.75 0.53
1995 1635.10 554.75 0.34
104
1996 1751.10 681.82 0.39
1997 2020.90 569.90 0.28
1998 1579.60 896.49 0.57
1999 1535.30 663.12 0.43
2000 1372.90 895.01 0.65
2001 1589.30 915.32 0.58
2002 1634.50 755.62 0.46
2003 2036.00 816.47 0.40
2004 2441.60 1251.76 0.51
2005 2758.10 2053.69 0.74
2006 2929.70 2602.74 0.89
2007 2067.90 1217.26 0.59
2008 2214.90 1675.41 0.76
The flow data at Nanipalsan G & D site appears to be consistent with rainfall.
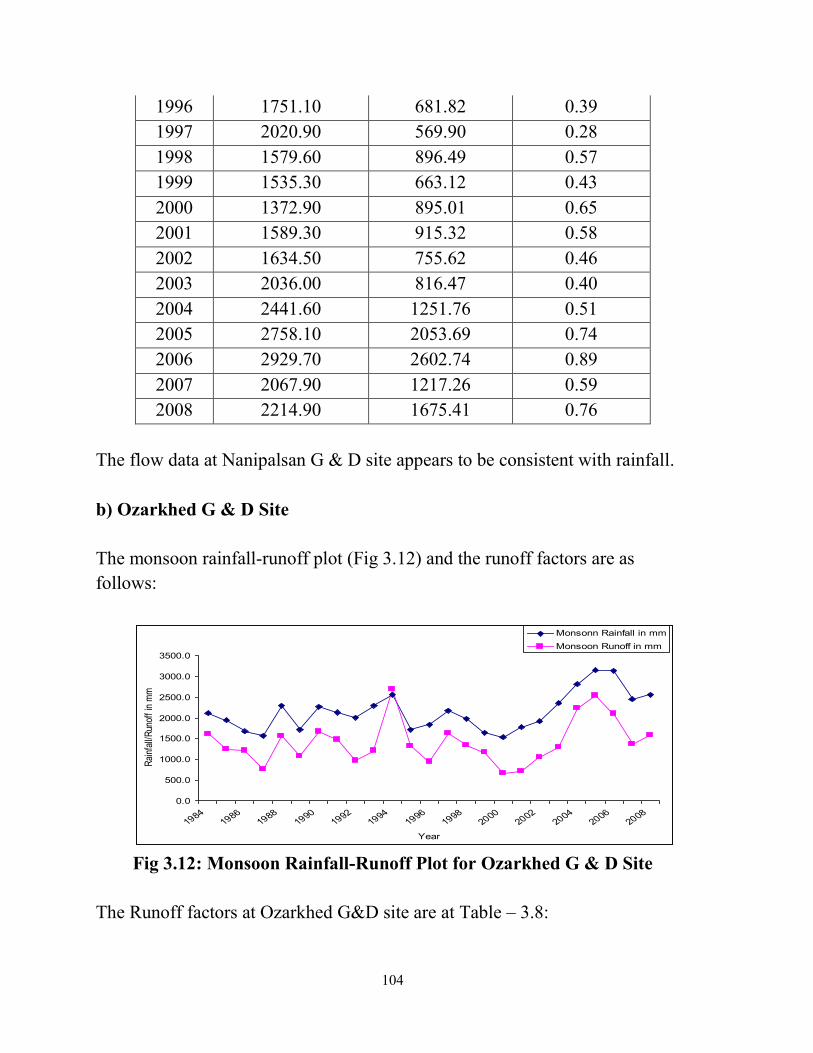
b) Ozarkhed G & D Site
The monsoon rainfall-runoff plot (Fig 3.12) and the runoff factors are as
follows:
0.0
500.0
1000.0
1500.0
2000.0
2500.0
3000.0
3500.0
19841986
19881990
19921994
19961998
20002002
20042006
2008
Year
Rai
nfal
l/Run
off
in m
m
Monsonn Rainfall in mm
Monsoon Runoff in mm
Fig 3.12: Monsoon Rainfall-Runoff Plot for Ozarkhed G & D Site
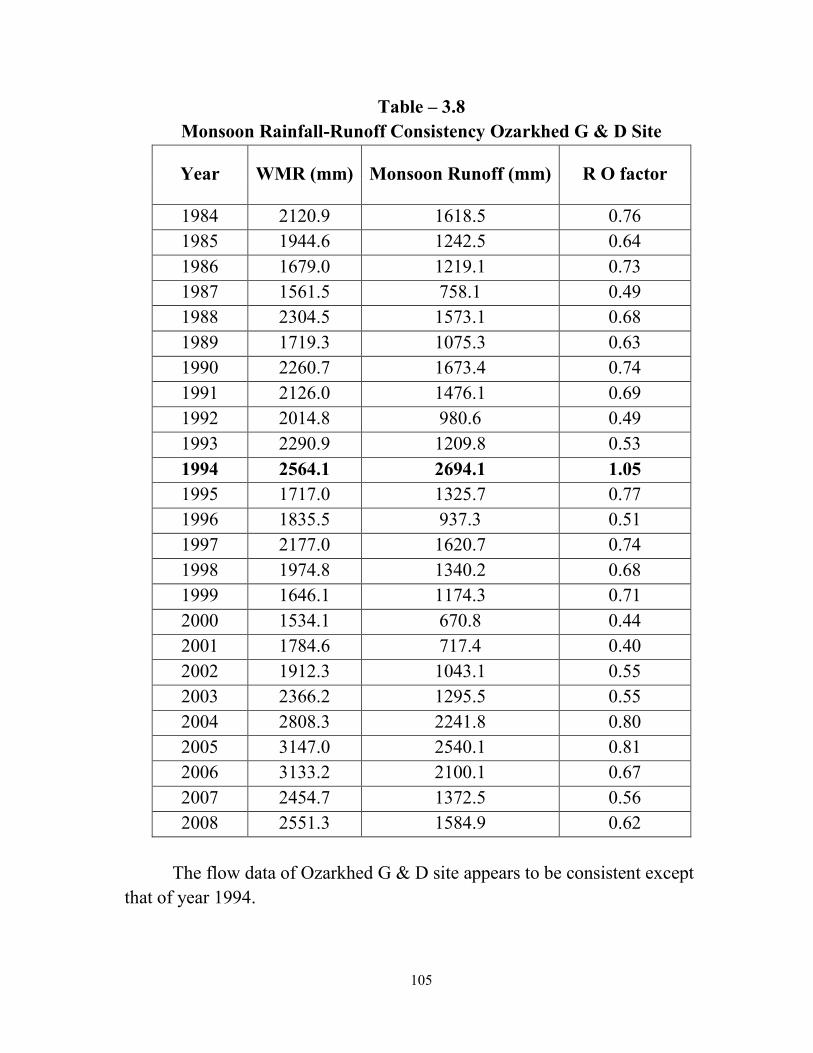
The Runoff factors at Ozarkhed G&D site are at Table – 3.8:
105
Table – 3.8
Monsoon Rainfall-Runoff Consistency Ozarkhed G & D Site
Year WMR (mm) Monsoon Runoff (mm) R O factor
1984 2120.9 1618.5 0.76
1985 1944.6 1242.5 0.64
1986 1679.0 1219.1 0.73
1987 1561.5 758.1 0.49
1988 2304.5 1573.1 0.68
1989 1719.3 1075.3 0.63
1990 2260.7 1673.4 0.74
1991 2126.0 1476.1 0.69
1992 2014.8 980.6 0.49
1993 2290.9 1209.8 0.53
1994 2564.1 2694.1 1.05
1995 1717.0 1325.7 0.77
1996 1835.5 937.3 0.51
1997 2177.0 1620.7 0.74
1998 1974.8 1340.2 0.68
1999 1646.1 1174.3 0.71
2000 1534.1 670.8 0.44
2001 1784.6 717.4 0.40
2002 1912.3 1043.1 0.55
2003 2366.2 1295.5 0.55
2004 2808.3 2241.8 0.80
2005 3147.0 2540.1 0.81
2006 3133.2 2100.1 0.67
2007 2454.7 1372.5 0.56
2008 2551.3 1584.9 0.62
The flow data of Ozarkhed G & D site appears to be consistent except
that of year 1994.
106
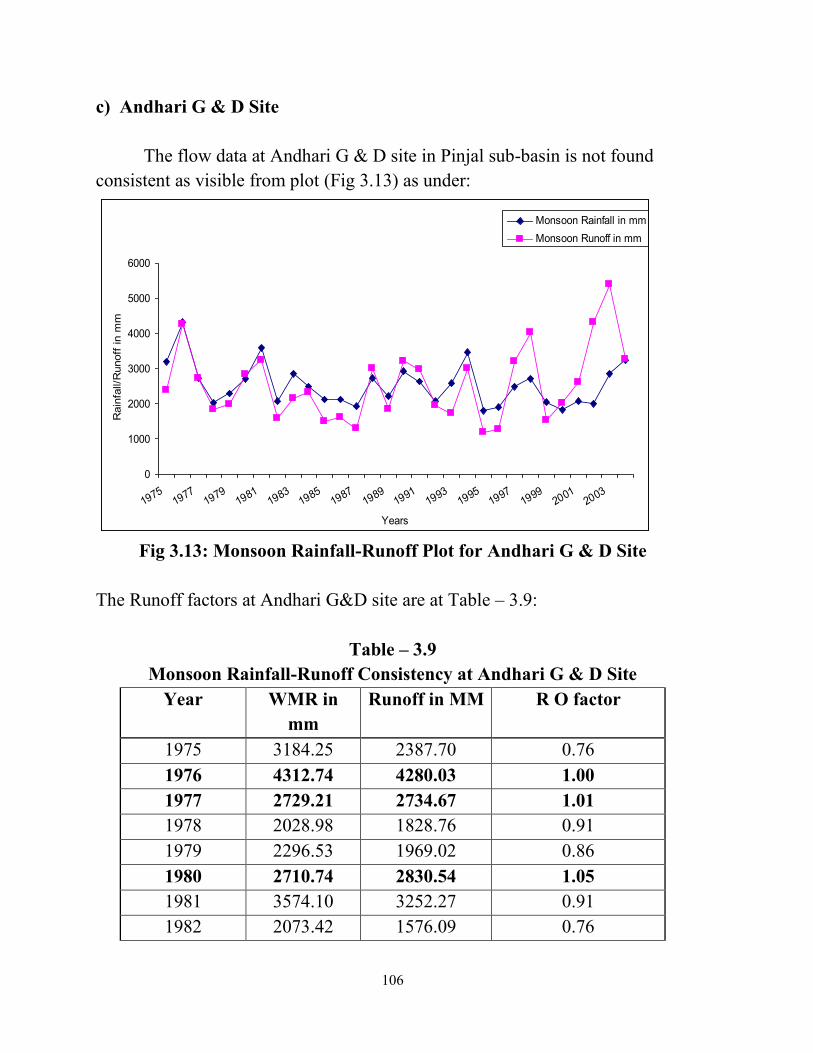
c) Andhari G & D Site
The flow data at Andhari G & D site in Pinjal sub-basin is not found
consistent as visible from plot (Fig 3.13) as under:
0
1000
2000
3000
4000
5000
6000
19751977
19791981
19831985
19871989
19911993
19951997
19992001
2003
Years
Rain
fall/R
unoff
in m
m
Monsoon Rainfall in mm
Monsoon Runoff in mm
Fig 3.13: Monsoon Rainfall-Runoff Plot for Andhari G & D Site
The Runoff factors at Andhari G&D site are at Table – 3.9:
Table – 3.9
Monsoon Rainfall-Runoff Consistency at Andhari G & D Site
Year WMR in
mm
Runoff in MM R O factor
1975 3184.25 2387.70 0.76
1976 4312.74 4280.03 1.00
1977 2729.21 2734.67 1.01
1978 2028.98 1828.76 0.91
1979 2296.53 1969.02 0.86
1980 2710.74 2830.54 1.05
1981 3574.10 3252.27 0.91
1982 2073.42 1576.09 0.76
107
1983 2851.37 2147.12 0.75
1984 2493.55 2319.46 0.93
1985 2129.08 1489.66 0.70
1986 2121.33 1614.94 0.76
1987 1917.21 1300.84 0.68
1988 2732.10 2996.29 1.10
1989 2219.09 1859.74 0.84
1990 2926.52 3215.14 1.10
1991 2626.64 2976.78 1.13
1992 2063.01 1953.71 0.95
1993 2591.61 1740.03 0.67
1994 3456.01 3000.06 0.87
1995 1816.26 1191.43 0.66
1996 1896.69 1258.95 0.66
1997 2487.27 3185.94 1.28
1998 2705.93 4035.54 1.49
1999 2047.46 1543.58 0.75
2000 1826.22 2028.22 1.11
2001 2074.04 2607.00 1.26
2002 1991.90 4326.11 2.17
2003 2848.73 5394.99 1.89
2004 3243.24 3277.86 1.01
The flow data for a number of years is on higher side as compared to
corresponding rainfall. The flow data of these years have been discarded and
same have been estimated using rainfall-runoff modeling.
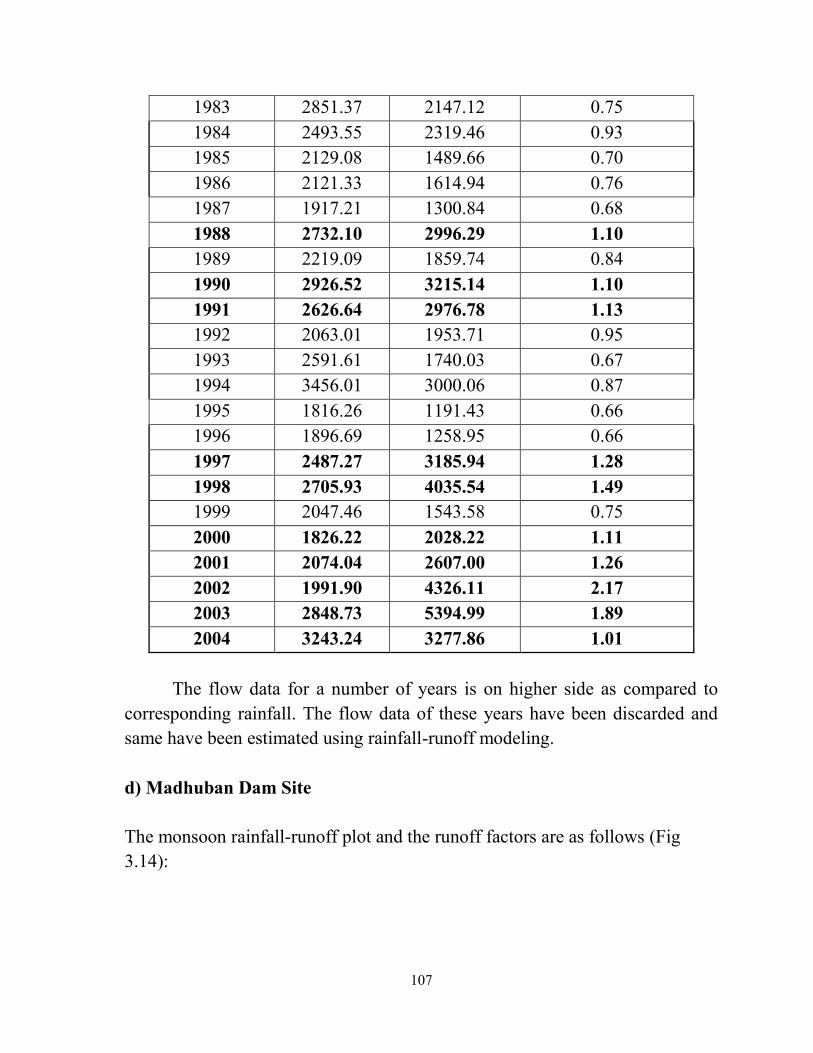
d) Madhuban Dam Site
The monsoon rainfall-runoff plot and the runoff factors are as follows (Fig
3.14):
108
0
500
1000
1500
2000
2500
3000
3500
19881990
19921994
19961998
20002002
2004
Year
Rain
fall/
Runoff m
mMonsoon Rainfall in mm
Monsoon Runoff in mm
Fig 3.14: Monsoon Rainfall-Runoff Plot for Madhuban Dam Site
The Runoff factors at Madhuban Dam site are at Table – 3.10:
Table – 3.10
Monsoon Rainfall-Runoff Consistency at Madhuban Dam Site
Year WMR (mm) Monsoon Runoff
( mm)
Runoff Factor
1988 2219.8 1595.3 0.72
1989 1617.8 1011.4 0.63
1990 2406.0 1574.7 0.65
1991 2205.0 1624.6 0.74
1992 2163.8 1337.9 0.62
1993 2482.2 1883.8 0.76
1994 2788.9 2947.4 1.06
1995 1658.2 1084.6 0.65
1996 1801.7 1319.7 0.73
1997 2098.7 1487.1 0.71
1998 1799.2 1604.5 0.89
1999 1613.5 1236.6 0.77
2000 1494.9 1157.1 0.77
2001 1735.8 1171.6 0.68
2002 1803.6 1583.4 0.88
109
2003 2235.4 1616.1 0.72
2004 2652.6 2178.4 0.82
2005 3009.4 2685.4 0.89
The flow data of year 1994 does not appear consistent with respect to
corresponding rainfall. The same has been discarded (in development of
rainfall-runoff model) and then modified using rainfall-runoff model developed
through consistent rainfall and runoff data. This approach has been adopted for
modifying any inconsistent runoff data.
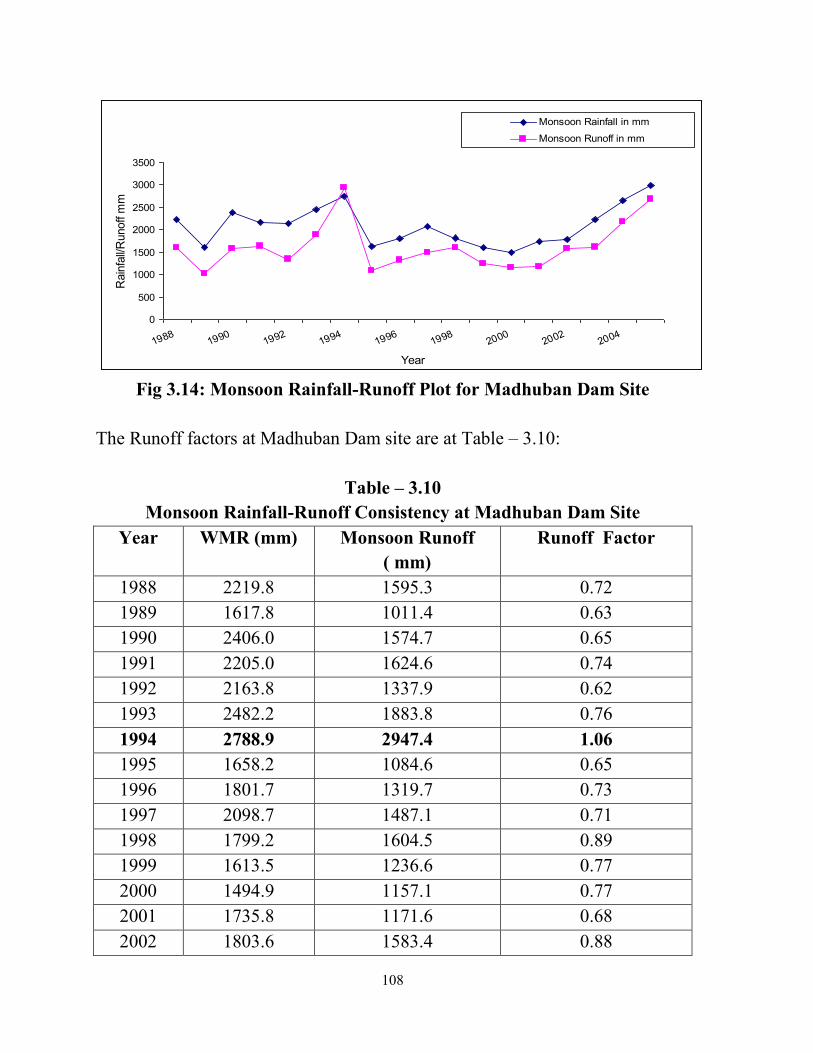
e) Vapi G & D Site
The monsoon rainfall-runoff plot and the runoff factors (Table – 3.11)
are as follows (Fig 3.15):
0
500
1000
1500
2000
2500
3000
3500
19741976
19781980
19821984
19861988
19901992
19941996
19982000
20022004
Year
RF/R
O in
mm
Monsoon Rainfall in mm
Monsoon Runoff in mm
Fig 3.15: Monsoon Rainfall-Runoff Plot for Vapi G & D Site
110
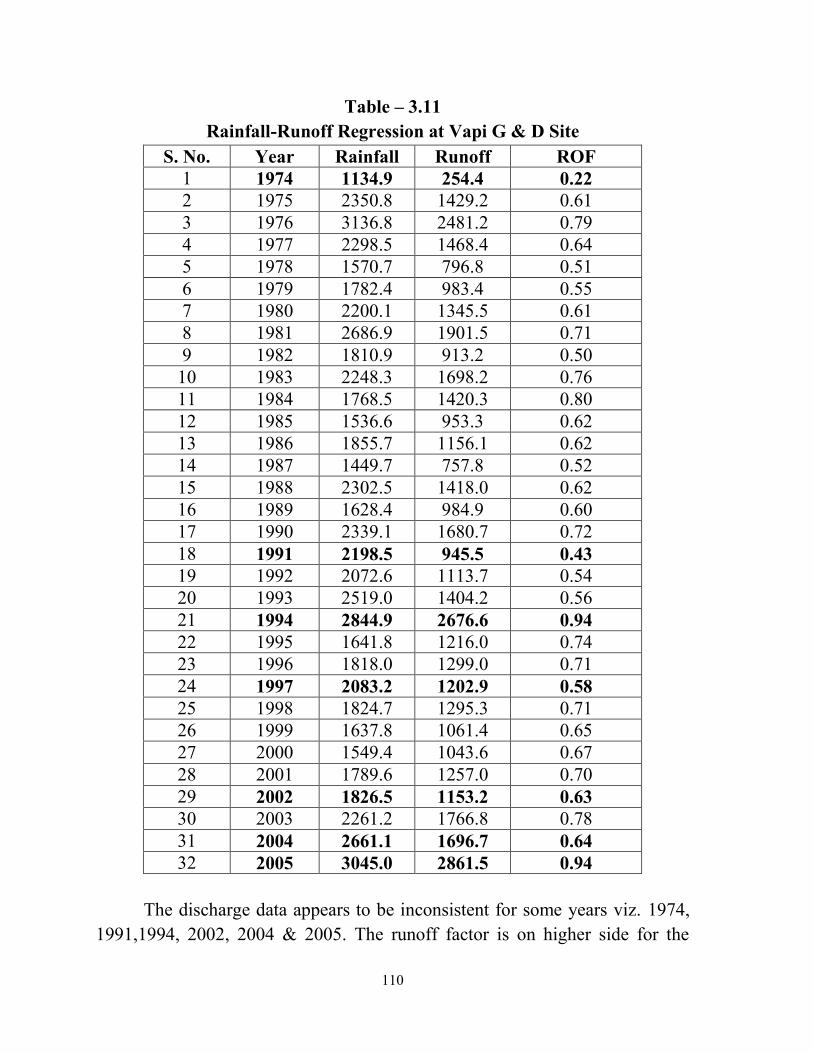
Table – 3.11
Rainfall-Runoff Regression at Vapi G & D Site
S. No. Year Rainfall Runoff ROF
1 1974 1134.9 254.4 0.22
2 1975 2350.8 1429.2 0.61
3 1976 3136.8 2481.2 0.79
4 1977 2298.5 1468.4 0.64
5 1978 1570.7 796.8 0.51
6 1979 1782.4 983.4 0.55
7 1980 2200.1 1345.5 0.61
8 1981 2686.9 1901.5 0.71
9 1982 1810.9 913.2 0.50
10 1983 2248.3 1698.2 0.76
11 1984 1768.5 1420.3 0.80
12 1985 1536.6 953.3 0.62
13 1986 1855.7 1156.1 0.62
14 1987 1449.7 757.8 0.52
15 1988 2302.5 1418.0 0.62
16 1989 1628.4 984.9 0.60
17 1990 2339.1 1680.7 0.72
18 1991 2198.5 945.5 0.43
19 1992 2072.6 1113.7 0.54
20 1993 2519.0 1404.2 0.56
21 1994 2844.9 2676.6 0.94
22 1995 1641.8 1216.0 0.74
23 1996 1818.0 1299.0 0.71
24 1997 2083.2 1202.9 0.58
25 1998 1824.7 1295.3 0.71
26 1999 1637.8 1061.4 0.65
27 2000 1549.4 1043.6 0.67
28 2001 1789.6 1257.0 0.70
29 2002 1826.5 1153.2 0.63
30 2003 2261.2 1766.8 0.78
31 2004 2661.1 1696.7 0.64
32 2005 3045.0 2861.5 0.94
The discharge data appears to be inconsistent for some years viz. 1974,
1991,1994, 2002, 2004 & 2005. The runoff factor is on higher side for the
111
years 1994 & 2005. The G & D data of Vapi site may also be influenced by
tidal back water effect.
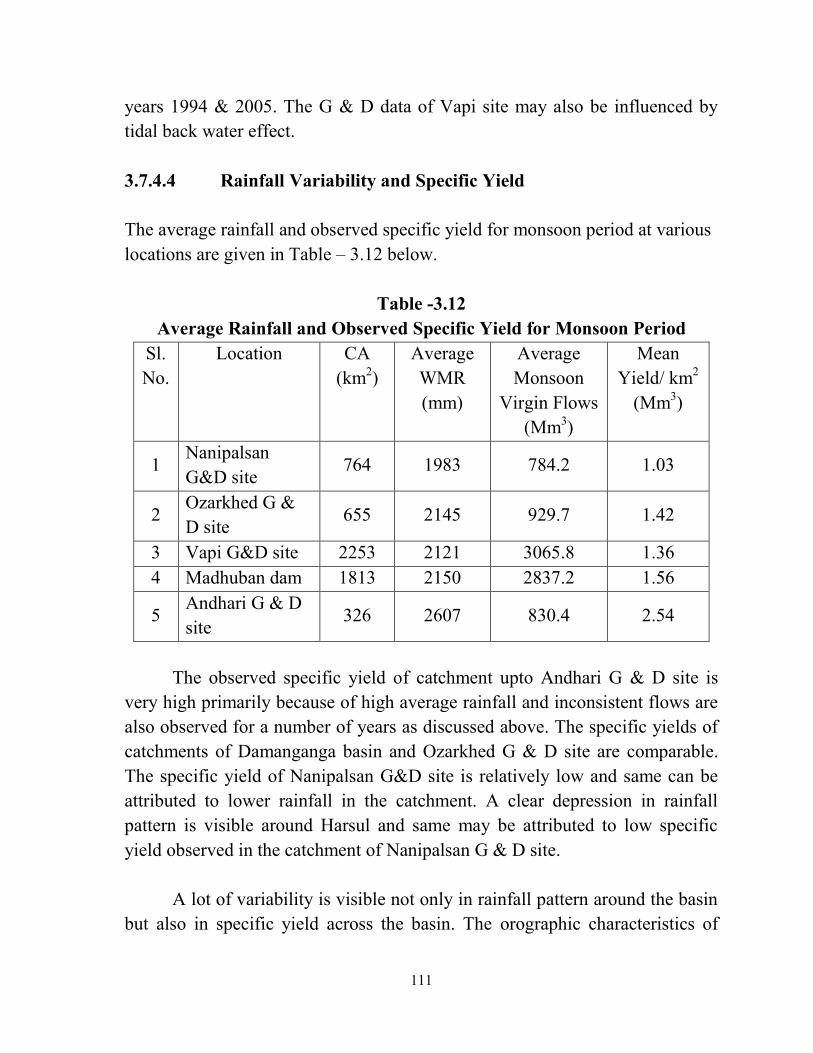
3.7.4.4 Rainfall Variability and Specific Yield
The average rainfall and observed specific yield for monsoon period at various
locations are given in Table – 3.12 below.
Table -3.12
Average Rainfall and Observed Specific Yield for Monsoon Period
Sl.
No.
Location
CA
(km2)
Average
WMR
(mm)
Average
Monsoon
Virgin Flows
(Mm3)
Mean
Yield/ km2
(Mm3)
1 Nanipalsan
G&D site 764 1983 784.2 1.03
2 Ozarkhed G &
D site 655 2145 929.7 1.42
3 Vapi G&D site 2253 2121 3065.8 1.36
4 Madhuban dam 1813 2150 2837.2 1.56
5 Andhari G & D
site 326 2607 830.4 2.54
The observed specific yield of catchment upto Andhari G & D site is
very high primarily because of high average rainfall and inconsistent flows are
also observed for a number of years as discussed above. The specific yields of
catchments of Damanganga basin and Ozarkhed G & D site are comparable.
The specific yield of Nanipalsan G&D site is relatively low and same can be
attributed to lower rainfall in the catchment. A clear depression in rainfall
pattern is visible around Harsul and same may be attributed to low specific
yield observed in the catchment of Nanipalsan G & D site.
A lot of variability is visible not only in rainfall pattern around the basin
but also in specific yield across the basin. The orographic characteristics of
112
basin, particularly the upper portion of the basin, may be attributed to the
variability seen in rainfall as discussed above. The different parts of the basin
receive different rainfall in any given period. As visible in Table - 3.2 above,
the annual normal rainfall varies from 2983 mm at Jawhar station ( highest) to
1657 mm ( Harsul station). The difference between 2983 mm at Jawhar
station ( highest in basin) and 2490 mm at Trimbak ( next highest) is 493 mm
which compares well with the difference of 373 mm between rainfall of 1657
mm at Harsul ( lowest) and that at Vapi ( 2030 mm - next lowest). Thus,
rainfall observations at Harsul appear in order and should not be discarded.
Looking at the rainfall and flow characteristics of the basins and variability
seen across the basins, the use of project specific data, if available, would be
most appropriate in deriving the hydrological design parameters such as water
availability, design flood etc for planning of any project in the basins. As the
data of both Nanipalsan G & D site and Ozarkhed G & D site have been found
consistent both internally and externally, the use of observed data of
Nanipalsan G & D site for yield studies of Bhugad dam and the observed data
of Ozarkhed G & D site for yield studies of Khargihill dam appear to be most
appropriate as the two sites truly represent the catchment of two dams
respectively. For the yield estimation of Damanganga whole basin, data
observed at Vapi G & D site may be used. However, the same may be
associated with some uncertainty as the site is influenced by tidal back water
effect.
3.7.5 Presentation of Data
3.7.5.1 Rainfall Data
For carrying out the hydrological analysis of an area the average rainfall
over that area is required. The rainfall data observed at rain-gauge station
represents only point sampling of the areal distribution of a storm. The point
rainfall values at various stations can be converted into an average value over
the area by three methods: (i) Arithmetic average or mean (AM) method, (ii)
Isohyetal method, and (iii) Thiessen polygon (TP) method. In the present study,
the arithmetic average or mean (AM) method has been used for double mass
curve analysis and Thiessen polygon (TP) method has been used for estimation
113
of average areal rainfall over the study area for rainfall-runoff analysis and
estimation of yields through regression from rainfall.
3.7.5.2 Discharge/ Yield Data
The observed daily discharge data at Nanipalsan G & D site down-
stream of proposed Bhugad dam site and at Ozarkhed G & D site down-stream
of proposed Khargihill dam site are available from 1984 onwards with some
missing records. This daily discharge data have been aggregated to work out
the monthly yield at respective G & D sites.
3.8 Water Availability
3.8.1 Storage Projects
Three storage projects: (i) Bhugad dam across Damanganga river, (ii)
Khargihill dam across Vagh river in Damanganga basin; and (iii) Pinjal dam in
Pinjal Sub-basin are envisaged in Damanganga - Pinjal link project, for which
simulation study has been carried out.
3.8.2 Approach in the Current Study
The observed discharge data available near to the project dam sites has
been used to develop the yield series at the dam sites on catchment area
proportion after checking the consistency of the observed data. The
inconsistent flow data have been discarded and the same have been estimated
using rainfall-runoff modelling. The observed discharge data at Nanipalsan and
Ozarkhed G & D sites are available from 1984 onwards only. However, the
rainfall data is available on long term basis. Therefore, rainfall-runoff models
have also been developed and used to estimate the yield series from 1984 and a
composite yield series from 1975 to 2008 have been developed both at Bhugad
and Khargihill dam sites. For Pinjal dam the observed discharge data at
Andhari G & D site near the Pinjal dam is available for a considerably long
period and as such yield series have been developed for the period from 1975
to 2008 based on observed data after checking the consistency. Thus, yield
114
series for a period of about 30-35 years have been used to estimate the water
availability at various dependabilities.
3.8.3 Hydrological Inputs Required for Simulation
The natural water availability at Bhugad, Khargihill and Pinjal project
locations is mainly confined to monsoon months (June to September) and these
projects are being planned for storages. For such storage projects as per the
“Guidelines for preparation of DPR of Irrigation and Multi Purpose projects,
2010” the minimum length of hydrological inputs required is about 25 years.
Accordingly, the yield series have been generated on monthly basis for 30-35
years period. The contribution of non-monsoon period, which is very nominal,
has been added on lumped basis.
3.8.3.1 Water Inflow in to Storage Reservoirs
The water inflows into proposed reservoirs i.e Bhugad across river
Damanganga river, Khargihill across Vagh river in Damanganga basin; and
Pinjal across Pinjal river in Vaitarna basin were computed by regression
analysis using discharge data of Nanipalsan, Ozarkhed and Andhari G& D sites
respectively and the same have been used for simulation study of the link
project.
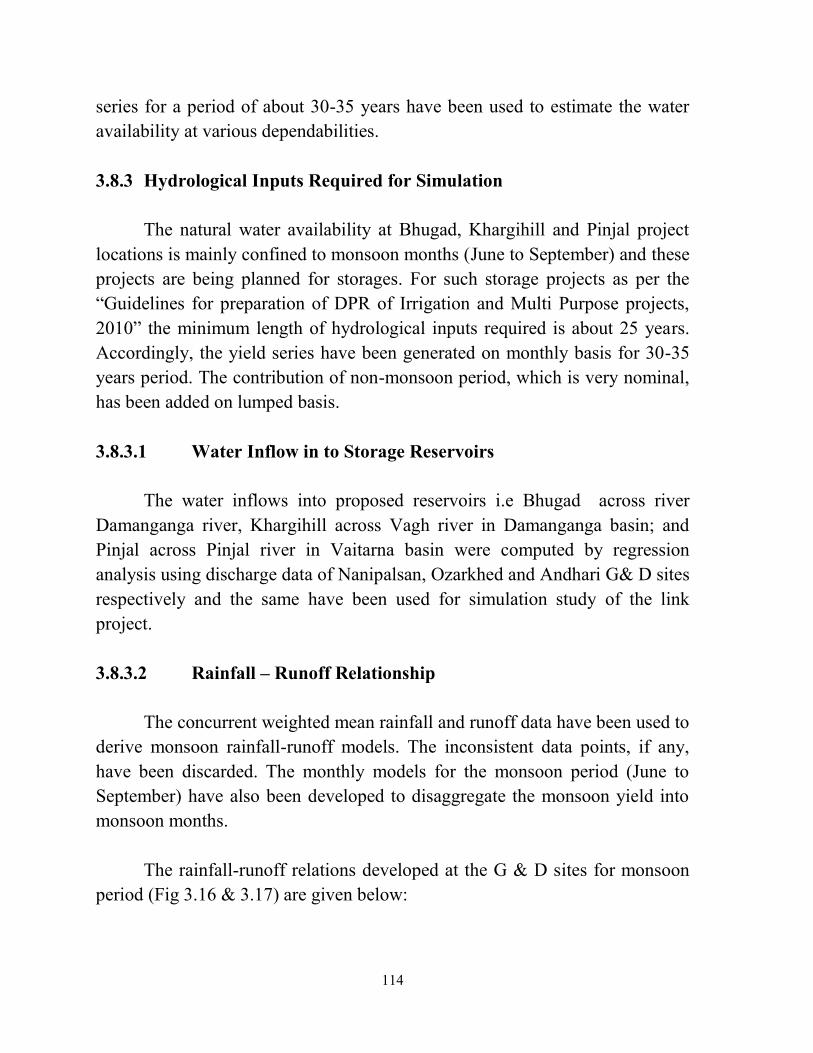
3.8.3.2 Rainfall – Runoff Relationship
The concurrent weighted mean rainfall and runoff data have been used to
derive monsoon rainfall-runoff models. The inconsistent data points, if any,
have been discarded. The monthly models for the monsoon period (June to
September) have also been developed to disaggregate the monsoon yield into
monsoon months.
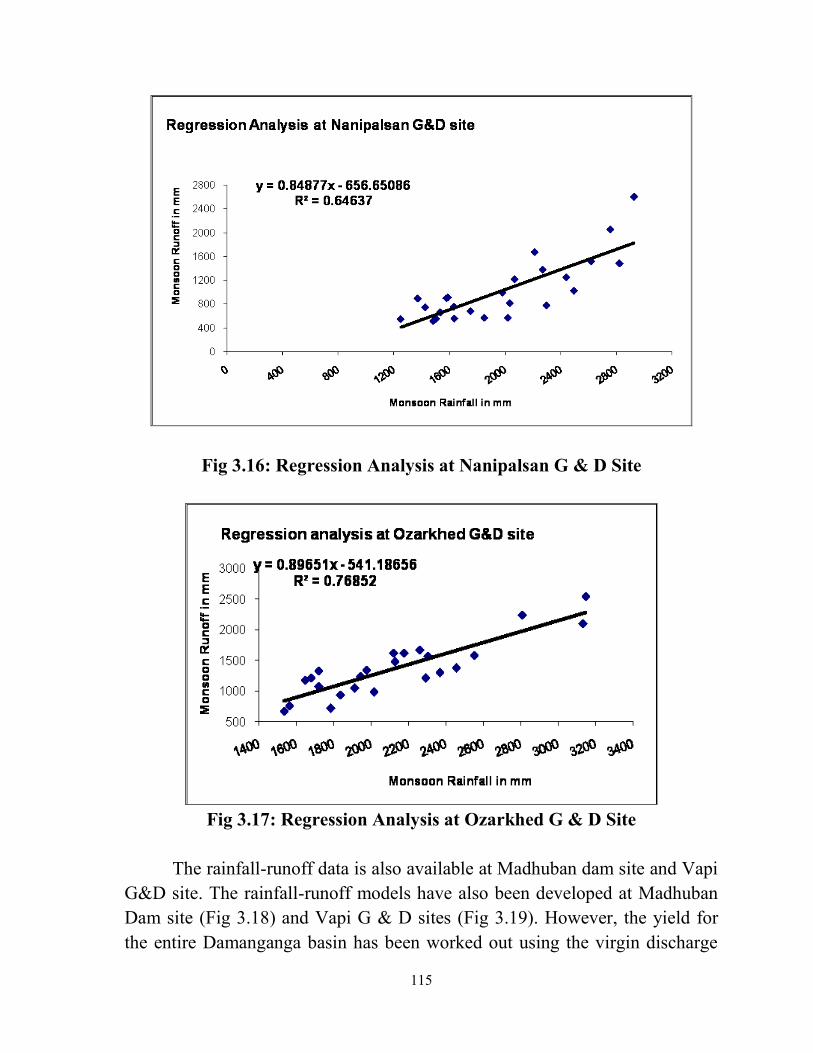
The rainfall-runoff relations developed at the G & D sites for monsoon
period (Fig 3.16 & 3.17) are given below:
115
Fig 3.16: Regression Analysis at Nanipalsan G & D Site
Fig 3.17: Regression Analysis at Ozarkhed G & D Site
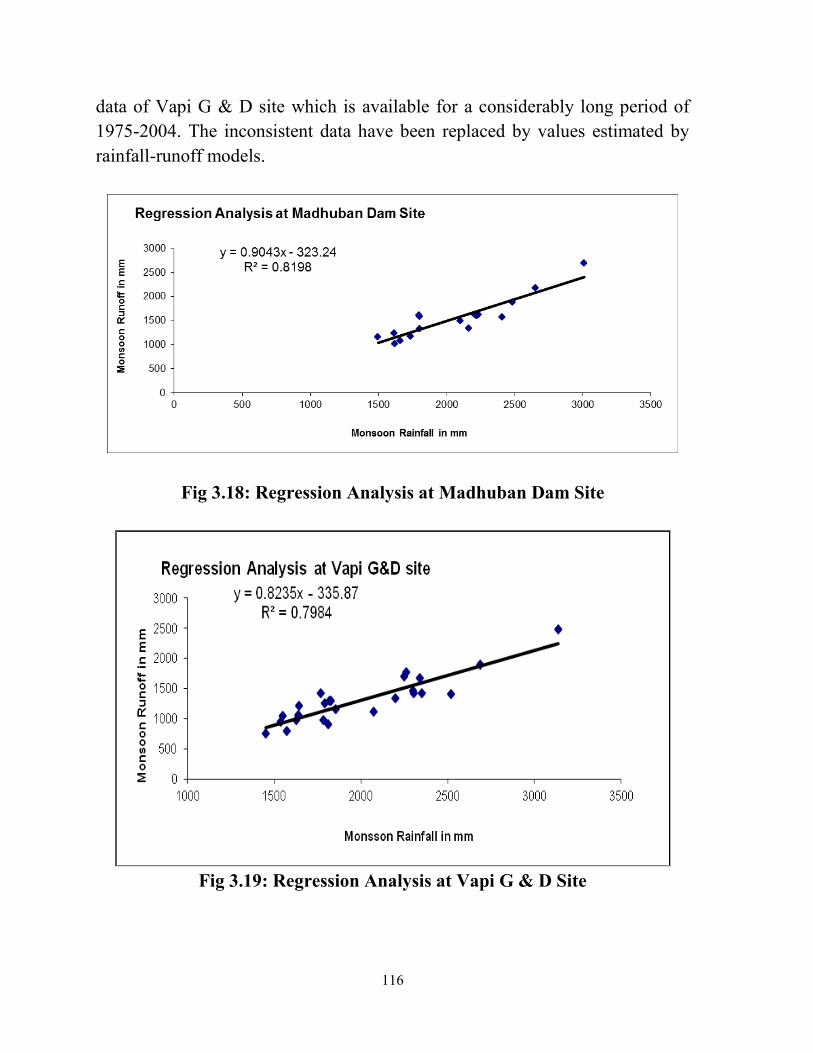
The rainfall-runoff data is also available at Madhuban dam site and Vapi
G&D site. The rainfall-runoff models have also been developed at Madhuban
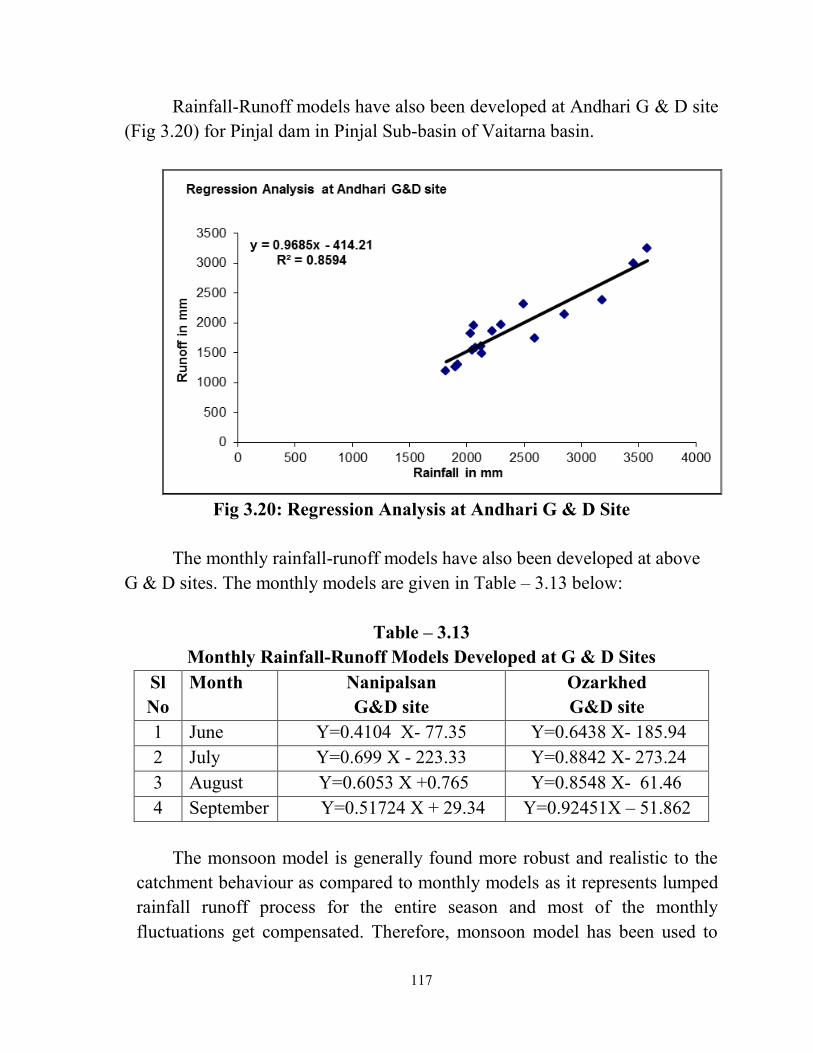
Dam site (Fig 3.18) and Vapi G & D sites (Fig 3.19). However, the yield for
the entire Damanganga basin has been worked out using the virgin discharge
116
data of Vapi G & D site which is available for a considerably long period of
1975-2004. The inconsistent data have been replaced by values estimated by
rainfall-runoff models.
Fig 3.18: Regression Analysis at Madhuban Dam Site
Fig 3.19: Regression Analysis at Vapi G & D Site
117
Rainfall-Runoff models have also been developed at Andhari G & D site
(Fig 3.20) for Pinjal dam in Pinjal Sub-basin of Vaitarna basin.
Fig 3.20: Regression Analysis at Andhari G & D Site
The monthly rainfall-runoff models have also been developed at above
G & D sites. The monthly models are given in Table – 3.13 below:
Table – 3.13
Monthly Rainfall-Runoff Models Developed at G & D Sites
Sl
No
Month Nanipalsan
G&D site
Ozarkhed
G&D site
1 June Y=0.4104 X- 77.35 Y=0.6438 X- 185.94
2 July Y=0.699 X - 223.33 Y=0.8842 X- 273.24
3 August Y=0.6053 X +0.765 Y=0.8548 X- 61.46
4 September Y=0.51724 X + 29.34 Y=0.92451X – 51.862
The monsoon model is generally found more robust and realistic to the
catchment behaviour as compared to monthly models as it represents lumped
rainfall runoff process for the entire season and most of the monthly
fluctuations get compensated. Therefore, monsoon model has been used to
118
derive the monsoon yield. Monthly models have been used to disaggregate
the monsoon yield into monthly yields.
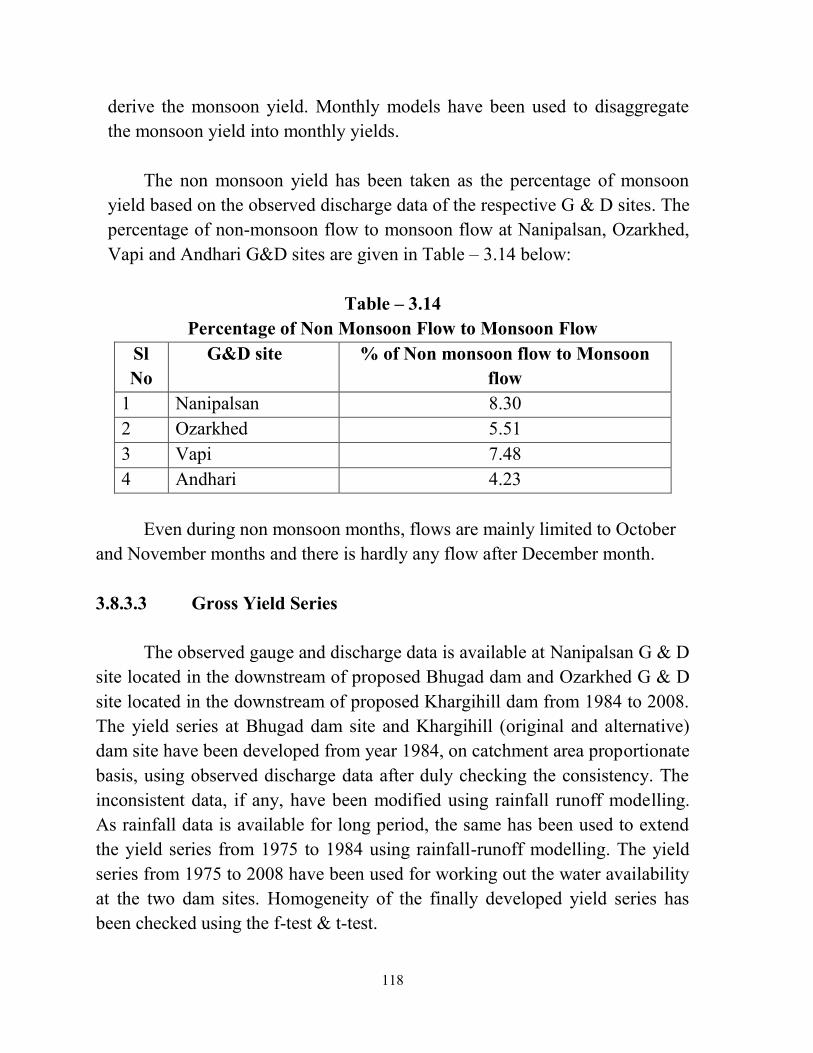
The non monsoon yield has been taken as the percentage of monsoon
yield based on the observed discharge data of the respective G & D sites. The
percentage of non-monsoon flow to monsoon flow at Nanipalsan, Ozarkhed,
Vapi and Andhari G&D sites are given in Table – 3.14 below:
Table – 3.14
Percentage of Non Monsoon Flow to Monsoon Flow
Sl
No
G&D site % of Non monsoon flow to Monsoon
flow
1 Nanipalsan 8.30
2 Ozarkhed 5.51
3 Vapi 7.48
4 Andhari 4.23
Even during non monsoon months, flows are mainly limited to October
and November months and there is hardly any flow after December month.
3.8.3.3 Gross Yield Series
The observed gauge and discharge data is available at Nanipalsan G & D
site located in the downstream of proposed Bhugad dam and Ozarkhed G & D
site located in the downstream of proposed Khargihill dam from 1984 to 2008.
The yield series at Bhugad dam site and Khargihill (original and alternative)
dam site have been developed from year 1984, on catchment area proportionate
basis, using observed discharge data after duly checking the consistency. The
inconsistent data, if any, have been modified using rainfall runoff modelling.
As rainfall data is available for long period, the same has been used to extend
the yield series from 1975 to 1984 using rainfall-runoff modelling. The yield
series from 1975 to 2008 have been used for working out the water availability
at the two dam sites. Homogeneity of the finally developed yield series has
been checked using the f-test & t-test.
119
Though the water availability at Khargihill dam site has been worked out
at both original and alternative locations, but the Khargihill dam site at original
location has been considered for all purposes.
The observed discharge data is available at Vapi G&D site for the period
1975 to 2004. The same has been used after checking the consistency for
developing the yield series from 1975 to 2004 for the whole Damanganga basin
upto Vapi Railway bridge site.
The observed discharge data at Andhari G&D site near proposed Pinjal
dam is available from 1975 to 2004. Accordingly, the yield series at Pinjal dam
site have been generated from 1975 to 2004 on catchment area proportionate
basis, using observed data after duly checking the consistency. The inconsistent
data has been modified using rainfall runoff modelling.
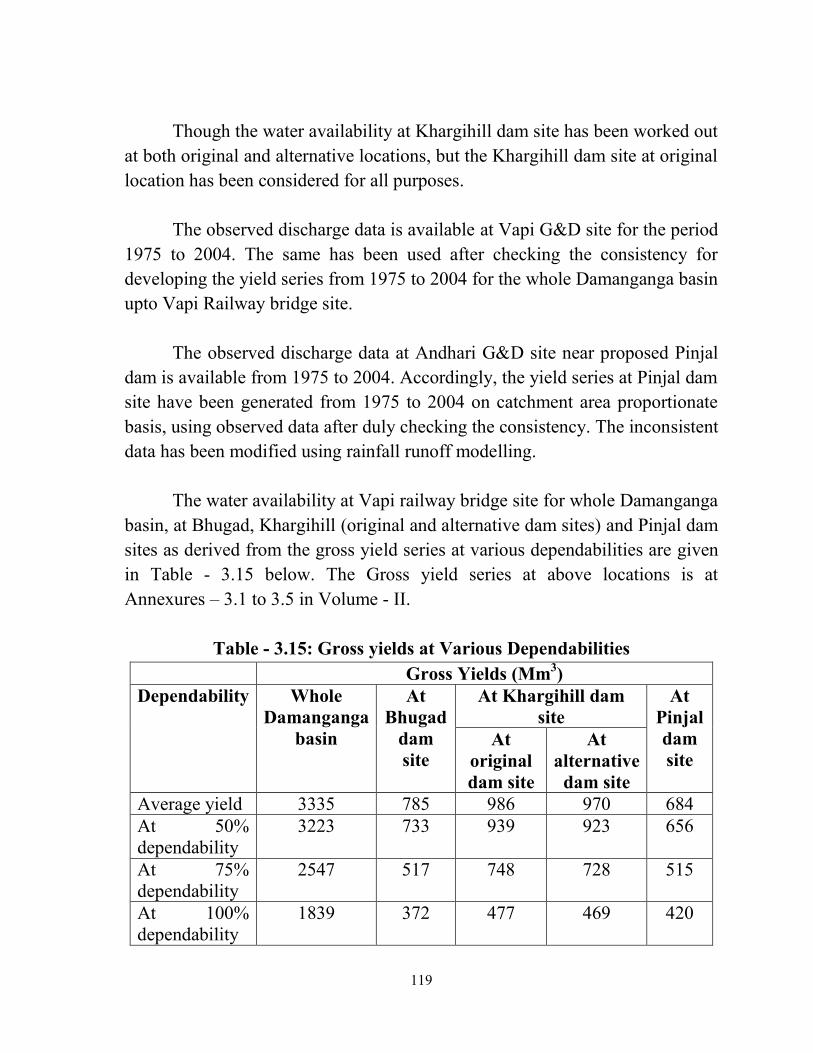
The water availability at Vapi railway bridge site for whole Damanganga
basin, at Bhugad, Khargihill (original and alternative dam sites) and Pinjal dam
sites as derived from the gross yield series at various dependabilities are given
in Table - 3.15 below. The Gross yield series at above locations is at
Annexures – 3.1 to 3.5 in Volume - II.
Table - 3.15: Gross yields at Various Dependabilities
Gross Yields (Mm3)
Dependability Whole
Damanganga
basin
At
Bhugad
dam
site
At Khargihill dam
site
At
Pinjal
dam
site At
original
dam site
At
alternative
dam site
Average yield 3335 785 986 970 684
At 50%
dependability
3223 733 939 923 656
At 75%
dependability
2547 517 748 728 515
At 100%
dependability
1839 372 477 469 420
120
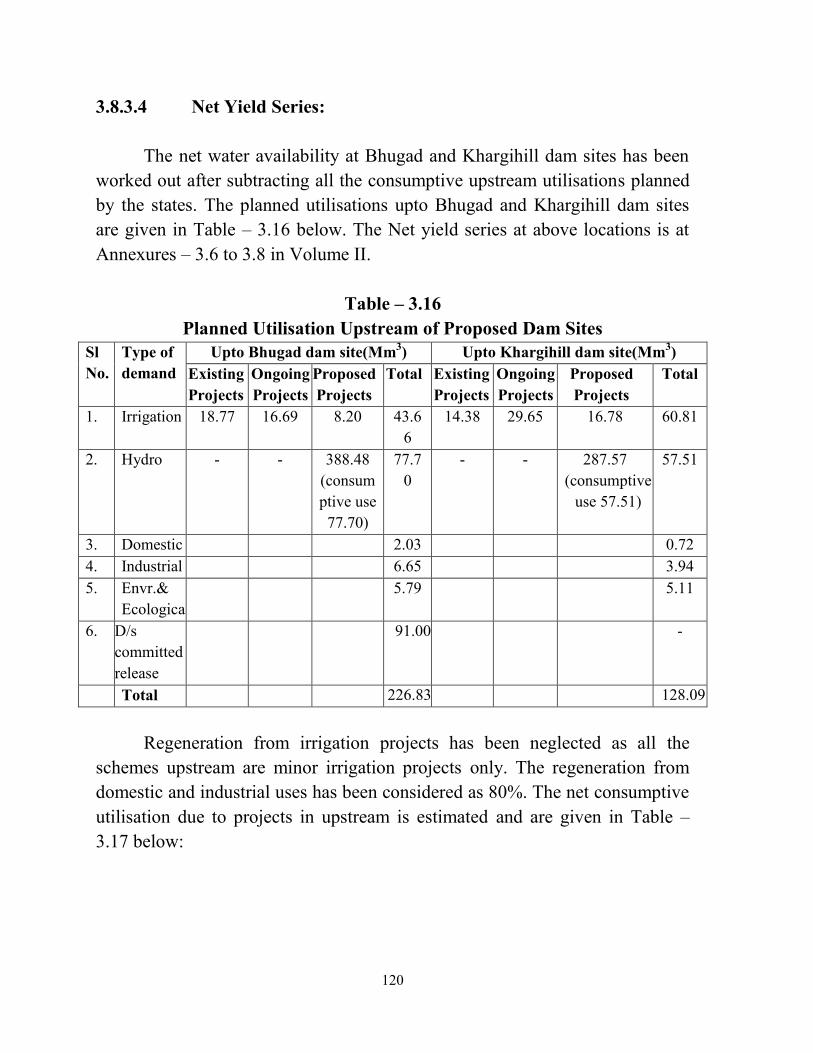
3.8.3.4 Net Yield Series:
The net water availability at Bhugad and Khargihill dam sites has been
worked out after subtracting all the consumptive upstream utilisations planned
by the states. The planned utilisations upto Bhugad and Khargihill dam sites
are given in Table – 3.16 below. The Net yield series at above locations is at
Annexures – 3.6 to 3.8 in Volume II.
Table – 3.16
Planned Utilisation Upstream of Proposed Dam Sites
Sl
No.
Type of
demand
Upto Bhugad dam site(Mm3) Upto Khargihill dam site(Mm
3)
Existing
Projects
Ongoing
Projects
Proposed
Projects
Total Existing
Projects
Ongoing
Projects
Proposed
Projects
Total
1. Irrigation 18.77 16.69 8.20 43.6
6
14.38 29.65 16.78 60.81
2. Hydro - - 388.48
(consum
ptive use
77.70)
77.7
0
- - 287.57
(consumptive
use 57.51)
57.51
3. Domestic 2.03 0.72
4. Industrial 6.65 3.94
5. Envr.&
Ecological
5.79 5.11
6. D/s
committed
release
91.00 -
Total 226.83 128.09
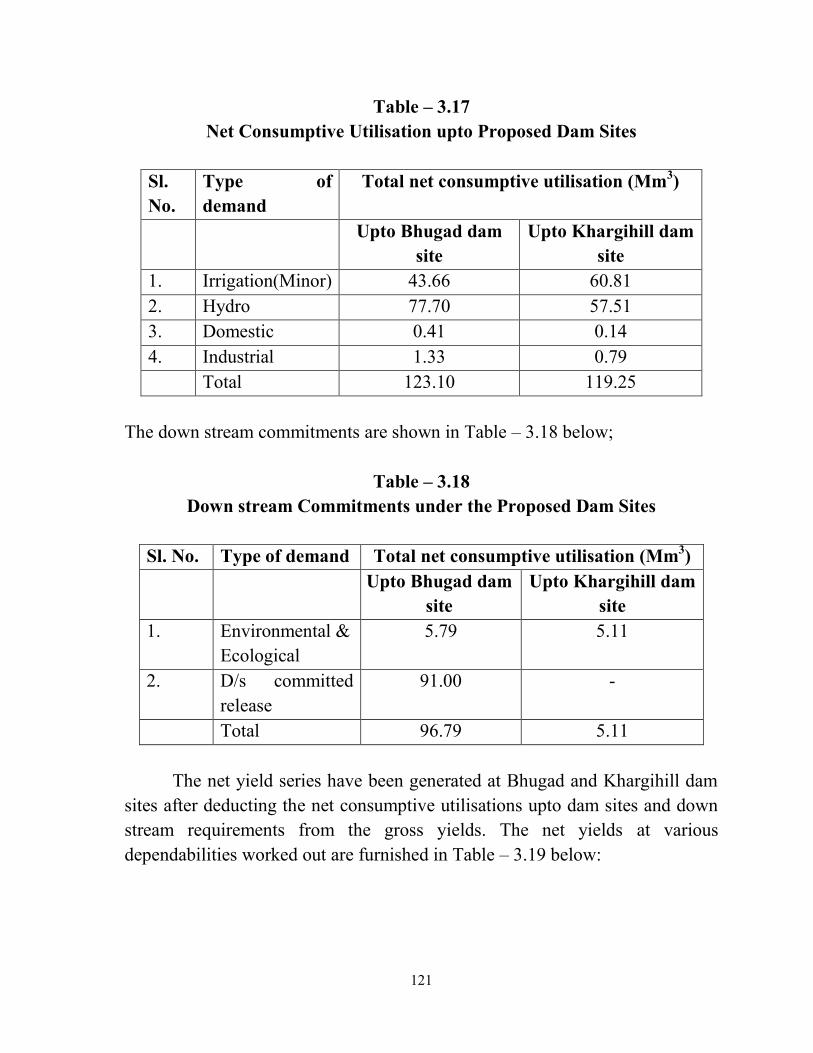
Regeneration from irrigation projects has been neglected as all the
schemes upstream are minor irrigation projects only. The regeneration from
domestic and industrial uses has been considered as 80%. The net consumptive
utilisation due to projects in upstream is estimated and are given in Table –
3.17 below:
121
Table – 3.17
Net Consumptive Utilisation upto Proposed Dam Sites
Sl.
No.
Type of
demand
Total net consumptive utilisation (Mm3)
Upto Bhugad dam
site
Upto Khargihill dam
site
1. Irrigation(Minor) 43.66 60.81
2. Hydro 77.70 57.51
3. Domestic 0.41 0.14
4. Industrial 1.33 0.79
Total 123.10 119.25
The down stream commitments are shown in Table – 3.18 below;
Table – 3.18
Down stream Commitments under the Proposed Dam Sites
Sl. No. Type of demand Total net consumptive utilisation (Mm3)
Upto Bhugad dam
site
Upto Khargihill dam
site
1. Environmental &
Ecological
5.79 5.11
2. D/s committed
release
91.00 -
Total 96.79 5.11
The net yield series have been generated at Bhugad and Khargihill dam
sites after deducting the net consumptive utilisations upto dam sites and down
stream requirements from the gross yields. The net yields at various
dependabilities worked out are furnished in Table – 3.19 below:
122
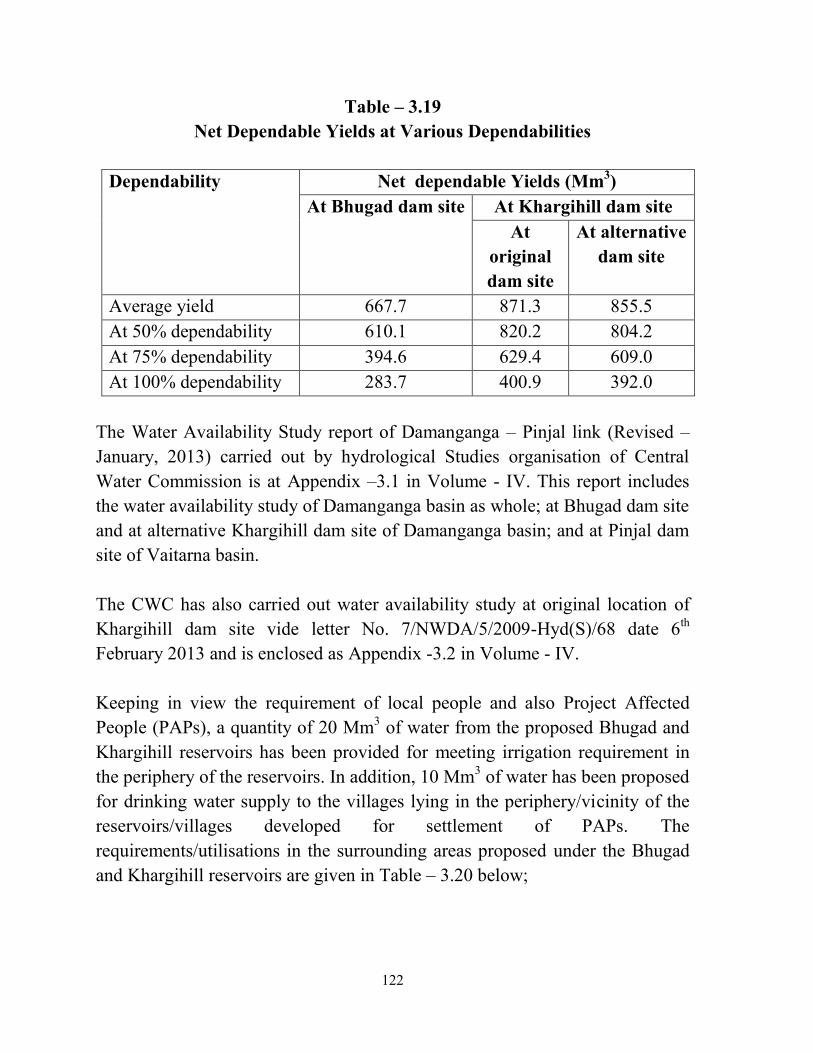
Table – 3.19
Net Dependable Yields at Various Dependabilities
Dependability Net dependable Yields (Mm3)
At Bhugad dam site At Khargihill dam site
At
original
dam site
At alternative
dam site
Average yield 667.7 871.3 855.5
At 50% dependability 610.1 820.2 804.2
At 75% dependability 394.6 629.4 609.0
At 100% dependability 283.7 400.9 392.0
The Water Availability Study report of Damanganga – Pinjal link (Revised –
January, 2013) carried out by hydrological Studies organisation of Central
Water Commission is at Appendix –3.1 in Volume - IV. This report includes
the water availability study of Damanganga basin as whole; at Bhugad dam site
and at alternative Khargihill dam site of Damanganga basin; and at Pinjal dam
site of Vaitarna basin.
The CWC has also carried out water availability study at original location of
Khargihill dam site vide letter No. 7/NWDA/5/2009-Hyd(S)/68 date 6th
February 2013 and is enclosed as Appendix -3.2 in Volume - IV.
Keeping in view the requirement of local people and also Project Affected
People (PAPs), a quantity of 20 Mm3 of water from the proposed Bhugad and
Khargihill reservoirs has been provided for meeting irrigation requirement in
the periphery of the reservoirs. In addition, 10 Mm3 of water has been proposed
for drinking water supply to the villages lying in the periphery/vicinity of the
reservoirs/villages developed for settlement of PAPs. The
requirements/utilisations in the surrounding areas proposed under the Bhugad
and Khargihill reservoirs are given in Table – 3.20 below;
123
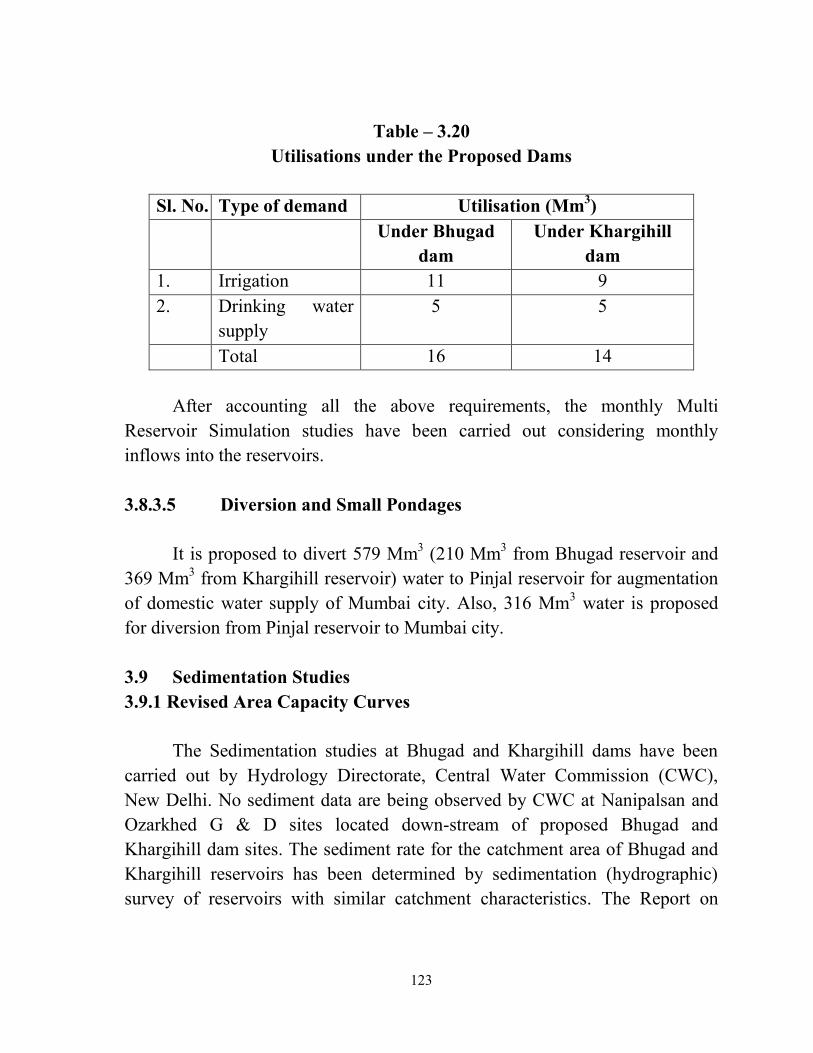
Table – 3.20
Utilisations under the Proposed Dams
Sl. No. Type of demand Utilisation (Mm3)
Under Bhugad
dam
Under Khargihill
dam
1. Irrigation 11 9
2. Drinking water
supply
5 5
Total 16 14
After accounting all the above requirements, the monthly Multi
Reservoir Simulation studies have been carried out considering monthly
inflows into the reservoirs.
3.8.3.5 Diversion and Small Pondages
It is proposed to divert 579 Mm3 (210 Mm
3 from Bhugad reservoir and
369 Mm3 from Khargihill reservoir) water to Pinjal reservoir for augmentation
of domestic water supply of Mumbai city. Also, 316 Mm3 water is proposed
for diversion from Pinjal reservoir to Mumbai city.
3.9 Sedimentation Studies
3.9.1 Revised Area Capacity Curves
The Sedimentation studies at Bhugad and Khargihill dams have been
carried out by Hydrology Directorate, Central Water Commission (CWC),
New Delhi. No sediment data are being observed by CWC at Nanipalsan and
Ozarkhed G & D sites located down-stream of proposed Bhugad and
Khargihill dam sites. The sediment rate for the catchment area of Bhugad and
Khargihill reservoirs has been determined by sedimentation (hydrographic)
survey of reservoirs with similar catchment characteristics. The Report on
124
Sedimentation study of Damanganga – Pinjal Link carried out by CWC is
attached as Appendix –2.15 (Chapter 2) of Appendix Volume – III(B).
Existing Madhuban (Damanganga) reservoir is located across river
Damanganga down-stream of proposed Bhugad and Khargihill reservoirs.
Narmada Water Resources, Water Supply and Kalpasar Department,
Government of Gujarat had carried out the sedimentation study of this
reservoir during November, 2008. As per this study, sedimentation rate of 8.94
ham/100 km2/year has been assessed for Madhuban reservoir. The
sedimentation rate for Bhugad and Khargihill reservoirs has been computed
based on the observed sedimentation rate of Madhuban reservoir.
Using the reservoir sedimentation rate of 8.94 ham/100 km2/year as
above, reservoir capacity and average inflows into reservoir, the inflow
sedimentation rate at Madhuban dam has been back calculated as under:
Average Inflow at Madhuban dam (I)= 3116.06 Mm3
Gross capacity of Madhuban dam at FRL (C) = 567.00 Mm3Capacity-Inflow
ratio (C/I) = 567.0/3116.06 = 0.18196
As per Brune’s curve Trap Efficiency (η) = 90.11 %
Observed sediment rate at Madhuban dam= 8.94 ham/100 km2/year
So, sediment inflow at Madhuban dam = 8.94*100/90.11= 9.921 ham/100
km2/year.
The existing Madhuban and the proposed Bhugad and Khargihill
reservoirs lie on the same river and have similar catchment characteristics and
hence it is assumed to have similar sediment yields. Further, smaller
catchments tend to be more susceptible to higher sedimentation yields than
larger catchments (Clause 2.2 of ICOLD Bulletin 115- Dealing with Reservoir
Sedimentation). As the catchment area of Madhuban reservoir is about three
times more than the catchments of Bhugad and Khargihill Reservoirs, the
inflow sedimentation rate for Bhugad and Khargihill reservoirs has been
assumed to be 10 percent more than the inflow sedimentation rate assessed at
125
Madhuban dam. Accordingly, the inflow sedimentation rate of 10.912 ham/100
km2/year has been taken for Bhugad and Khargihill reservoirs.
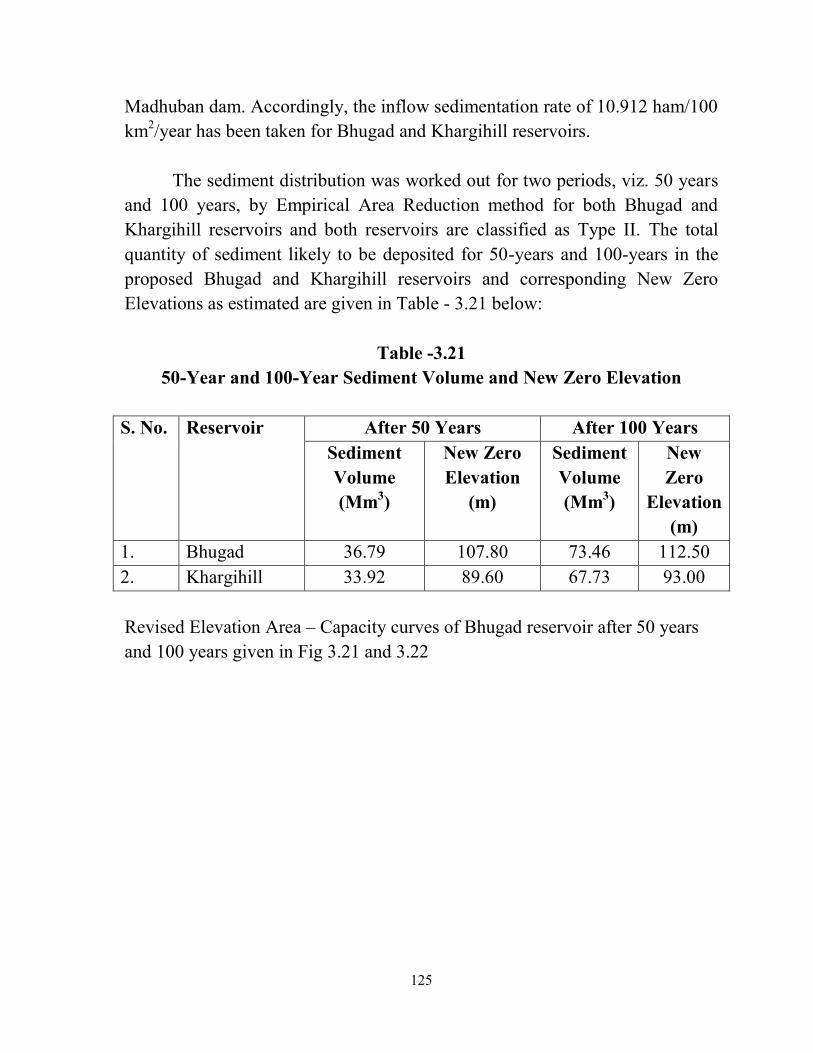
The sediment distribution was worked out for two periods, viz. 50 years
and 100 years, by Empirical Area Reduction method for both Bhugad and
Khargihill reservoirs and both reservoirs are classified as Type II. The total
quantity of sediment likely to be deposited for 50-years and 100-years in the
proposed Bhugad and Khargihill reservoirs and corresponding New Zero
Elevations as estimated are given in Table - 3.21 below:
Table -3.21
50-Year and 100-Year Sediment Volume and New Zero Elevation
S. No. Reservoir After 50 Years After 100 Years
Sediment
Volume
(Mm3)
New Zero
Elevation
(m)
Sediment
Volume
(Mm3)
New
Zero
Elevation
(m)
1. Bhugad 36.79 107.80 73.46 112.50
2. Khargihill 33.92 89.60 67.73 93.00
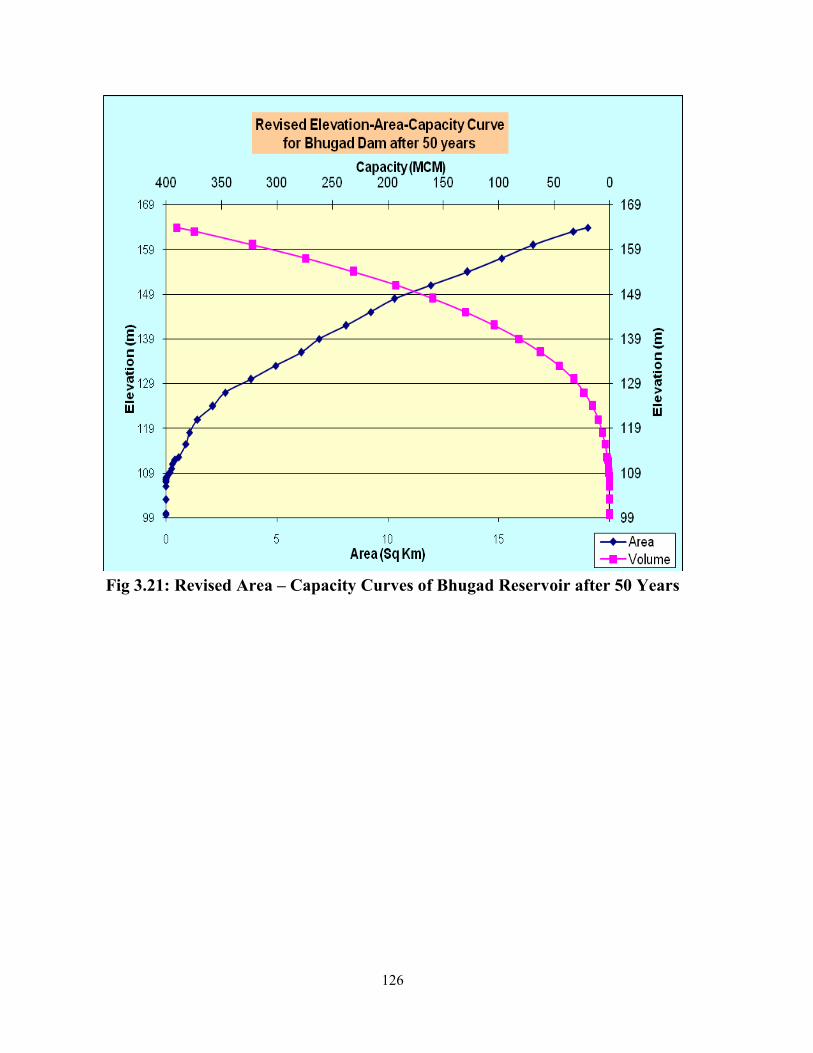
Revised Elevation Area – Capacity curves of Bhugad reservoir after 50 years
and 100 years given in Fig 3.21 and 3.22
126
Fig 3.21: Revised Area – Capacity Curves of Bhugad Reservoir after 50 Years
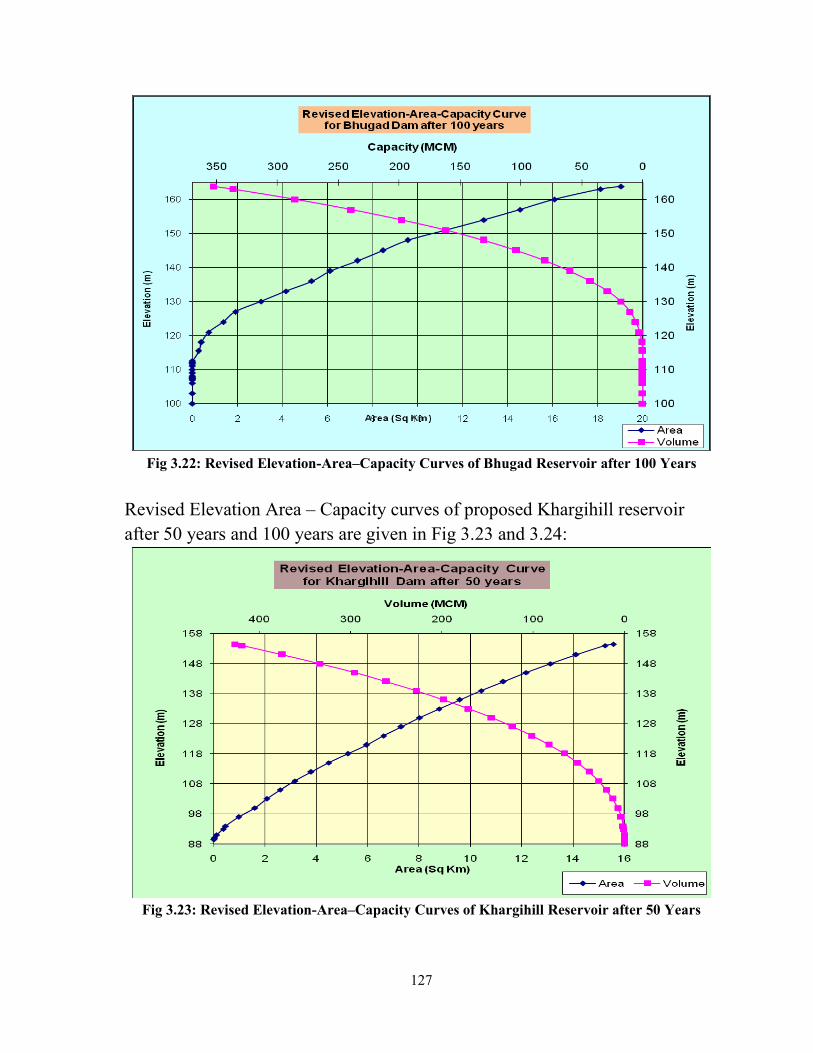
127
Fig 3.22: Revised Elevation-Area–Capacity Curves of Bhugad Reservoir after 100 Years
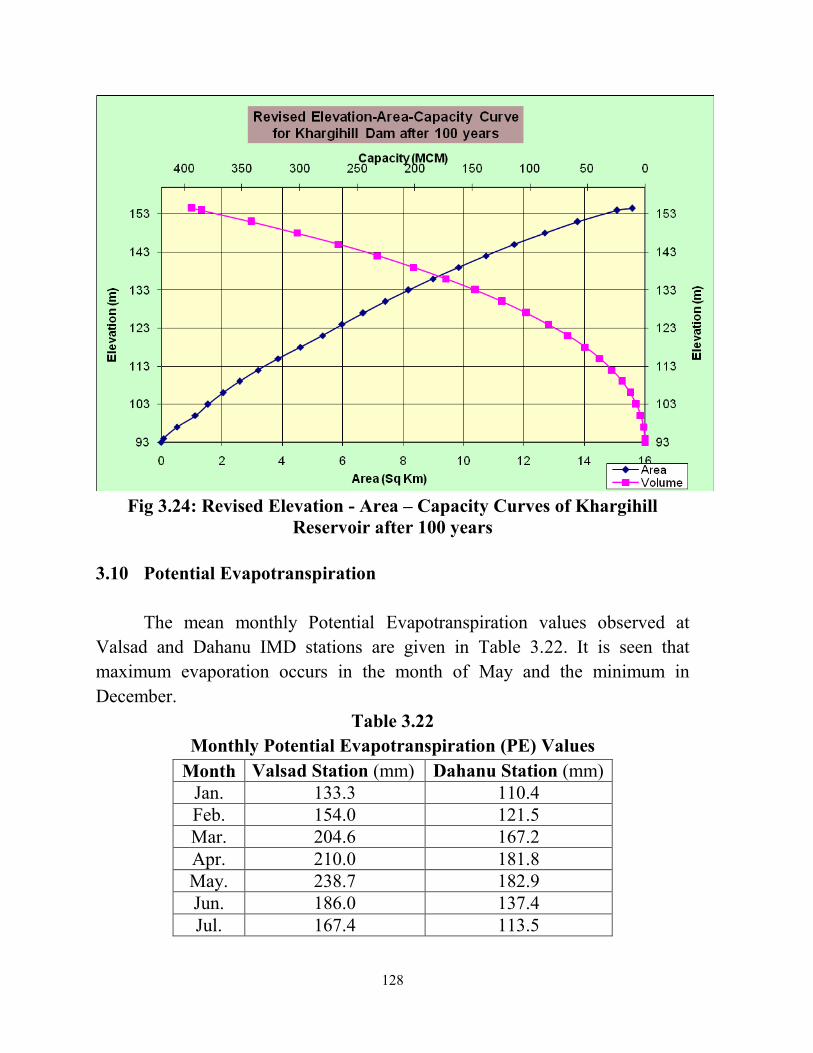
Revised Elevation Area – Capacity curves of proposed Khargihill reservoir
after 50 years and 100 years are given in Fig 3.23 and 3.24:
Fig 3.23: Revised Elevation-Area–Capacity Curves of Khargihill Reservoir after 50 Years
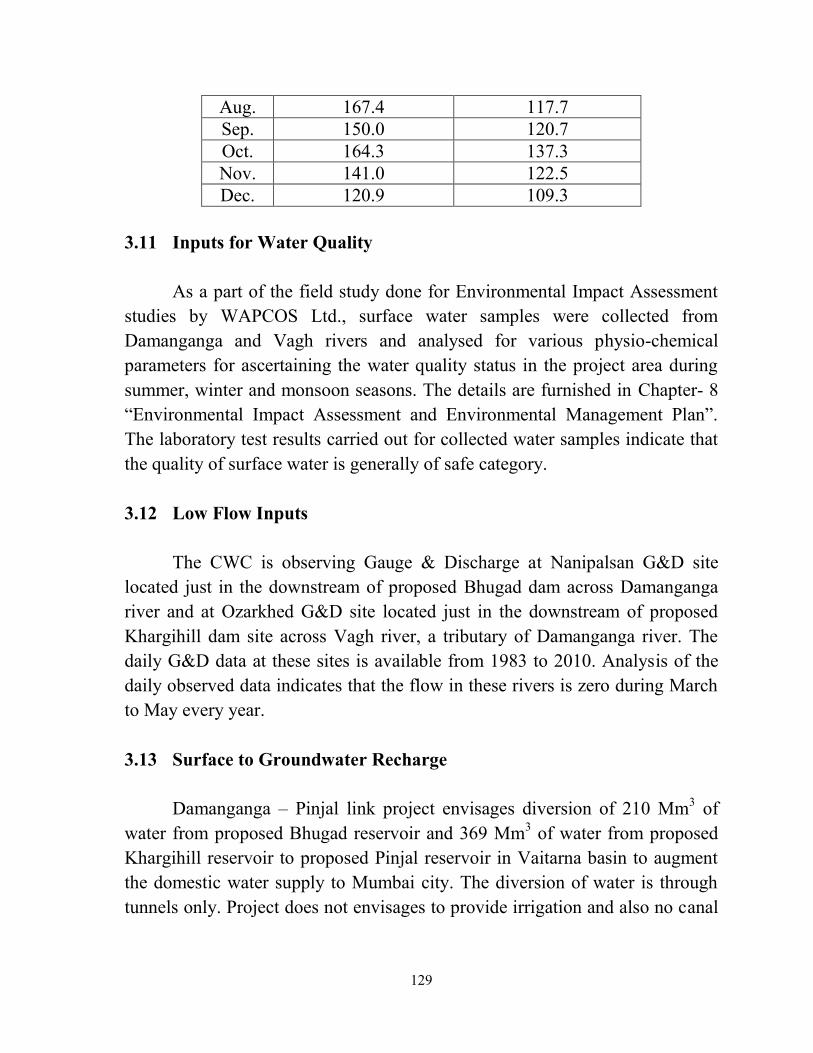
128
Fig 3.24: Revised Elevation - Area – Capacity Curves of Khargihill
Reservoir after 100 years
3.10 Potential Evapotranspiration
The mean monthly Potential Evapotranspiration values observed at
Valsad and Dahanu IMD stations are given in Table 3.22. It is seen that
maximum evaporation occurs in the month of May and the minimum in
December.
Table 3.22
Monthly Potential Evapotranspiration (PE) Values
Month Valsad Station (mm) Dahanu Station (mm)
Jan. 133.3 110.4
Feb. 154.0 121.5
Mar. 204.6 167.2
Apr. 210.0 181.8
May. 238.7 182.9
Jun. 186.0 137.4
Jul. 167.4 113.5
129
Aug. 167.4 117.7
Sep. 150.0 120.7
Oct. 164.3 137.3
Nov. 141.0 122.5
Dec. 120.9 109.3
3.11 Inputs for Water Quality
As a part of the field study done for Environmental Impact Assessment
studies by WAPCOS Ltd., surface water samples were collected from
Damanganga and Vagh rivers and analysed for various physio-chemical
parameters for ascertaining the water quality status in the project area during
summer, winter and monsoon seasons. The details are furnished in Chapter- 8
“Environmental Impact Assessment and Environmental Management Plan”.
The laboratory test results carried out for collected water samples indicate that
the quality of surface water is generally of safe category.
3.12 Low Flow Inputs
The CWC is observing Gauge & Discharge at Nanipalsan G&D site
located just in the downstream of proposed Bhugad dam across Damanganga
river and at Ozarkhed G&D site located just in the downstream of proposed
Khargihill dam site across Vagh river, a tributary of Damanganga river. The
daily G&D data at these sites is available from 1983 to 2010. Analysis of the
daily observed data indicates that the flow in these rivers is zero during March
to May every year.
3.13 Surface to Groundwater Recharge
Damanganga – Pinjal link project envisages diversion of 210 Mm3 of
water from proposed Bhugad reservoir and 369 Mm3 of water from proposed
Khargihill reservoir to proposed Pinjal reservoir in Vaitarna basin to augment
the domestic water supply to Mumbai city. The diversion of water is through
tunnels only. Project does not envisages to provide irrigation and also no canal
130
network is envisages, as such, recharge of ground water is expected due to
formation of proposed Bhugad and Khargihill reservoirs only.
3.14 Data for Studies other than Simulation
3.14.1 Design Flood and Diversion Flood Studies:
The Design Flood and Diversion Flood studies at Bhugad and Khargihill
dams have been carried out by Hydrology Directorate, Central Water
Commission (CWC), New Delhi. The Report on flood study of Damanganga –
Pinjal Link carried out by CWC is attached as Appendix – 3.3 of Appendix
Volume - III. Hydro-meteorological approach has been used for computing
design flood/diversion flood. Moreover, the flood frequency method has also
been used for comparison purpose. The catchment response functions have
been derived using regional Flood estimation report. The short interval
observed discharge data and concurrent rainfall have also been used in
validating/fine-tuning the adopted unit hydrographs for the project catchments.
The storm studies as carried out by IMD, have been used in the study. Only
one day PMP value for Bhugad catchment as estimated by IMD has been
slightly modified based on observed flood event of year 2004. The 100/50 year
return period rainfalls have been adopted from the state-wise isopluvial maps
published by IMD. The time distribution has been supplied by IMD and used in
the study. Loss rate parameters have been taken from Regional Flood
Estimation Report. The base flows have been assessed based on observed flood
events. The design/diversion flood studies for Bhugad and Khargihill dams
carried out as per above approach are briefly described below:
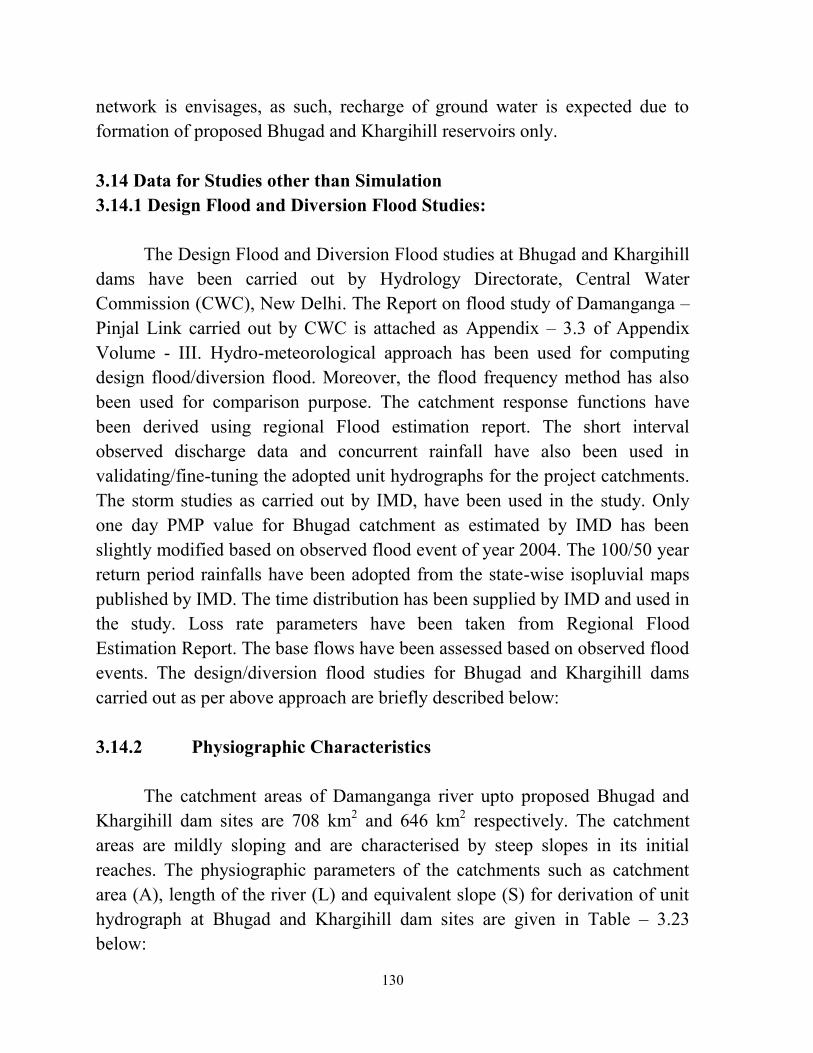
3.14.2 Physiographic Characteristics
The catchment areas of Damanganga river upto proposed Bhugad and
Khargihill dam sites are 708 km2 and 646 km
2 respectively. The catchment
areas are mildly sloping and are characterised by steep slopes in its initial
reaches. The physiographic parameters of the catchments such as catchment
area (A), length of the river (L) and equivalent slope (S) for derivation of unit
hydrograph at Bhugad and Khargihill dam sites are given in Table – 3.23
below:
131
Table - 3.23
Physiographic Parameters
S No. Parameter Unit Bhugad
dam
Khargihill
dam
1. Catchment Area (A) km2 708.00 646
2. Length of the River (L) km 73.80 54.10
3. Equivalent slope (S) m/km 4.46 6.25
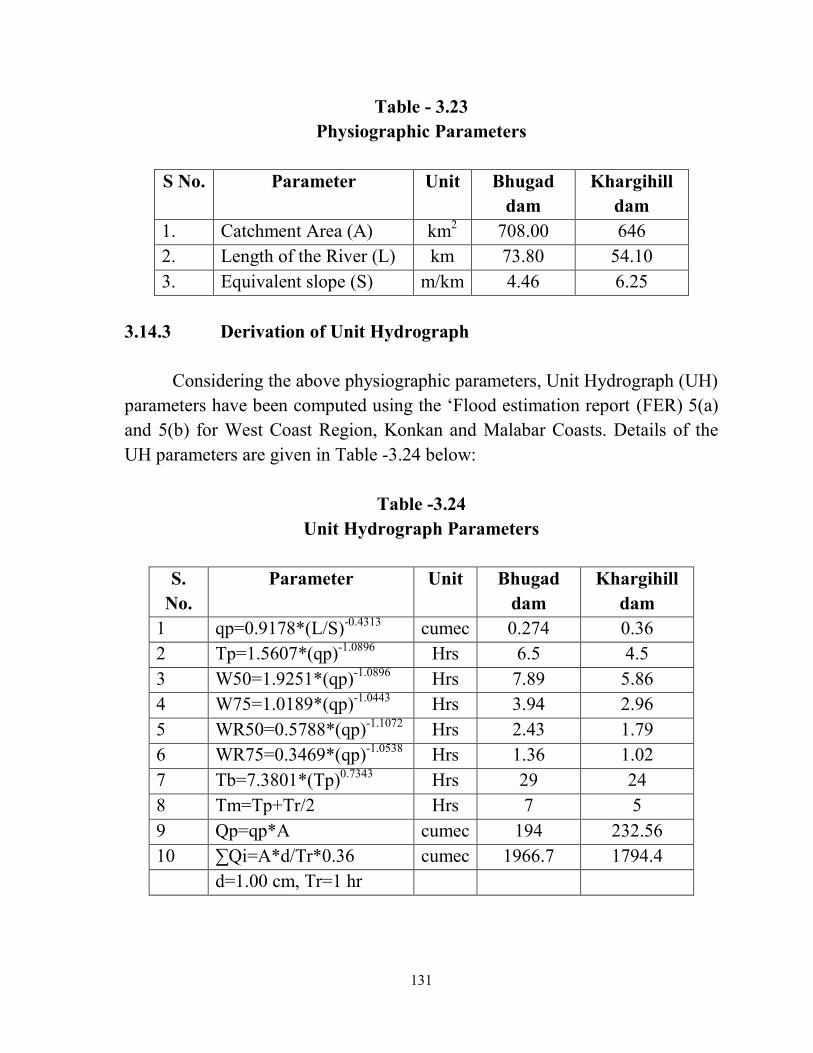
3.14.3 Derivation of Unit Hydrograph
Considering the above physiographic parameters, Unit Hydrograph (UH)
parameters have been computed using the ‘Flood estimation report (FER) 5(a)
and 5(b) for West Coast Region, Konkan and Malabar Coasts. Details of the
UH parameters are given in Table -3.24 below:
Table -3.24
Unit Hydrograph Parameters
S.
No.
Parameter Unit Bhugad
dam
Khargihill
dam
1 qp=0.9178*(L/S)-0.4313
cumec 0.274 0.36
2 Tp=1.5607*(qp)-1.0896
Hrs 6.5 4.5
3 W50=1.9251*(qp)-1.0896
Hrs 7.89 5.86
4 W75=1.0189*(qp)-1.0443
Hrs 3.94 2.96
5 WR50=0.5788*(qp)-1.1072
Hrs 2.43 1.79
6 WR75=0.3469*(qp)-1.0538
Hrs 1.36 1.02
7 Tb=7.3801*(Tp)0.7343
Hrs 29 24
8 Tm=Tp+Tr/2 Hrs 7 5
9 Qp=qp*A cumec 194 232.56
10 ∑Qi=A*d/Tr*0.36 cumec 1966.7 1794.4
d=1.00 cm, Tr=1 hr
132
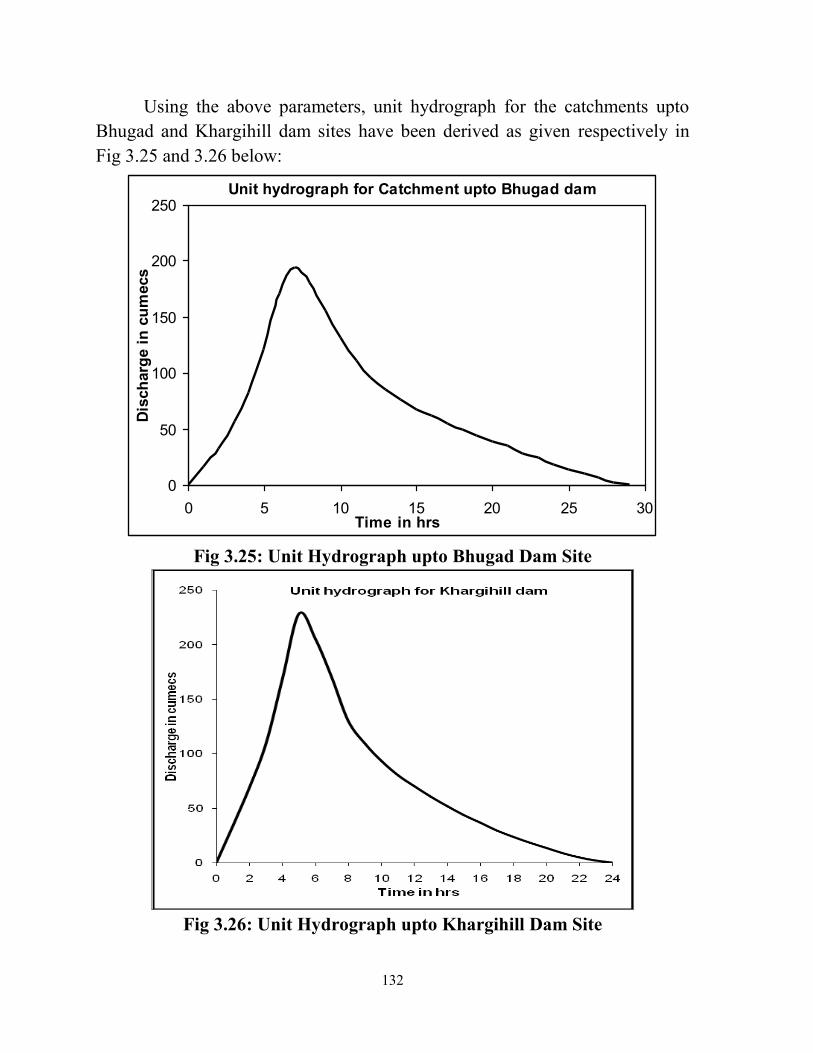
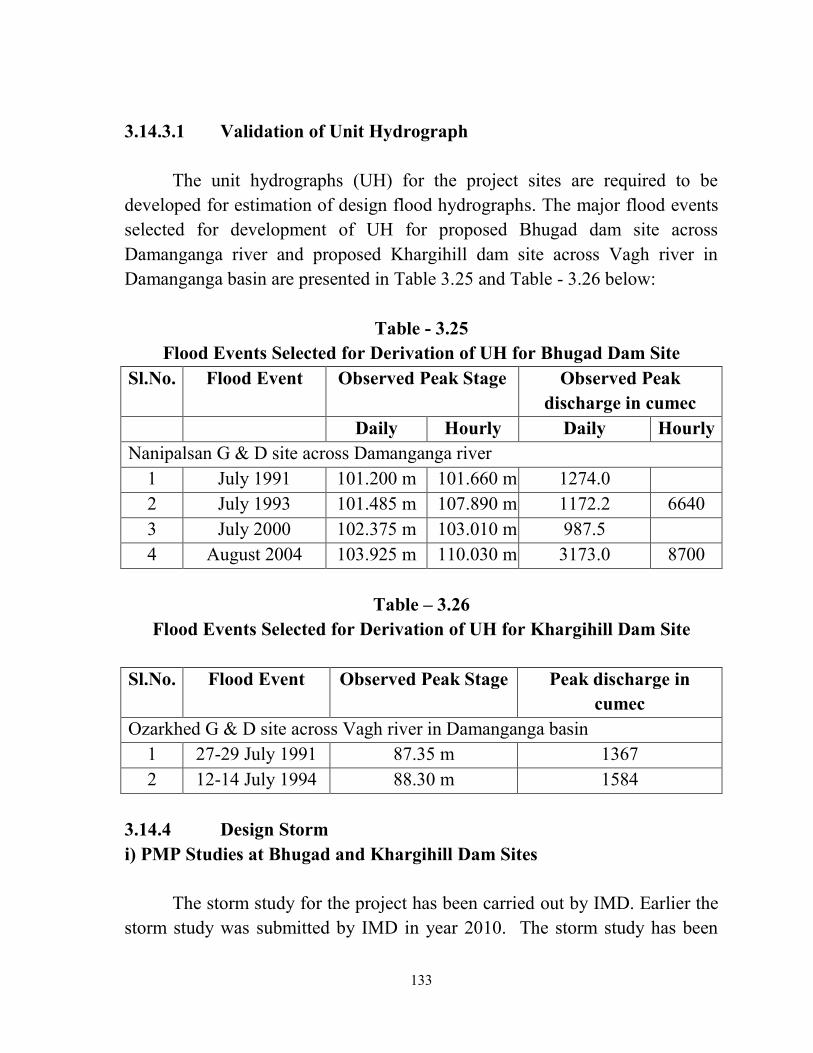
Using the above parameters, unit hydrograph for the catchments upto
Bhugad and Khargihill dam sites have been derived as given respectively in
Fig 3.25 and 3.26 below:
Unit hydrograph for Catchment upto Bhugad dam
0
50
100
150
200
250
0 5 10 15 20 25 30Time in hrs
Dis
ch
arg
e i
n c
um
ecs
Fig 3.25: Unit Hydrograph upto Bhugad Dam Site
Fig 3.26: Unit Hydrograph upto Khargihill Dam Site
133
3.14.3.1 Validation of Unit Hydrograph
The unit hydrographs (UH) for the project sites are required to be
developed for estimation of design flood hydrographs. The major flood events
selected for development of UH for proposed Bhugad dam site across
Damanganga river and proposed Khargihill dam site across Vagh river in
Damanganga basin are presented in Table 3.25 and Table - 3.26 below:
Table - 3.25
Flood Events Selected for Derivation of UH for Bhugad Dam Site
Sl.No. Flood Event Observed Peak Stage Observed Peak
discharge in cumec
Daily Hourly Daily Hourly
Nanipalsan G & D site across Damanganga river
1 July 1991 101.200 m 101.660 m 1274.0
2 July 1993 101.485 m 107.890 m 1172.2 6640
3 July 2000 102.375 m 103.010 m 987.5
4 August 2004 103.925 m 110.030 m 3173.0 8700
Table – 3.26
Flood Events Selected for Derivation of UH for Khargihill Dam Site
Sl.No. Flood Event Observed Peak Stage Peak discharge in
cumec
Ozarkhed G & D site across Vagh river in Damanganga basin
1 27-29 July 1991 87.35 m 1367
2 12-14 July 1994 88.30 m 1584
3.14.4 Design Storm
i) PMP Studies at Bhugad and Khargihill Dam Sites
The storm study for the project has been carried out by IMD. Earlier the
storm study was submitted by IMD in year 2010. The storm study has been
134
reviewed by IMD and revised storm values were received in September, 2011.
The PMP studies have been carried out by IMD and the storm studies report
was received in February, 2012.
The following rainstorms have been considered by IMD in storm studies.
› 1-3 July 1941 (Centered at Dharampur, North – West of Project)
› 9-10 July 1958 (Centered at Ghatghar, South-East of Project)
› 26-28 July 2005 (Centered at Matheran, South of Project)
The rainstorm of 1-3 July 1941 (Centered at Dharampur) has been found
the severe most rainstorm in the vicinity of the project catchment for 1-day and
2-day design storm values. However, looking at the topography of the area,
the Dharampur storm has been moved only in north-south direction (along the
ridge line).
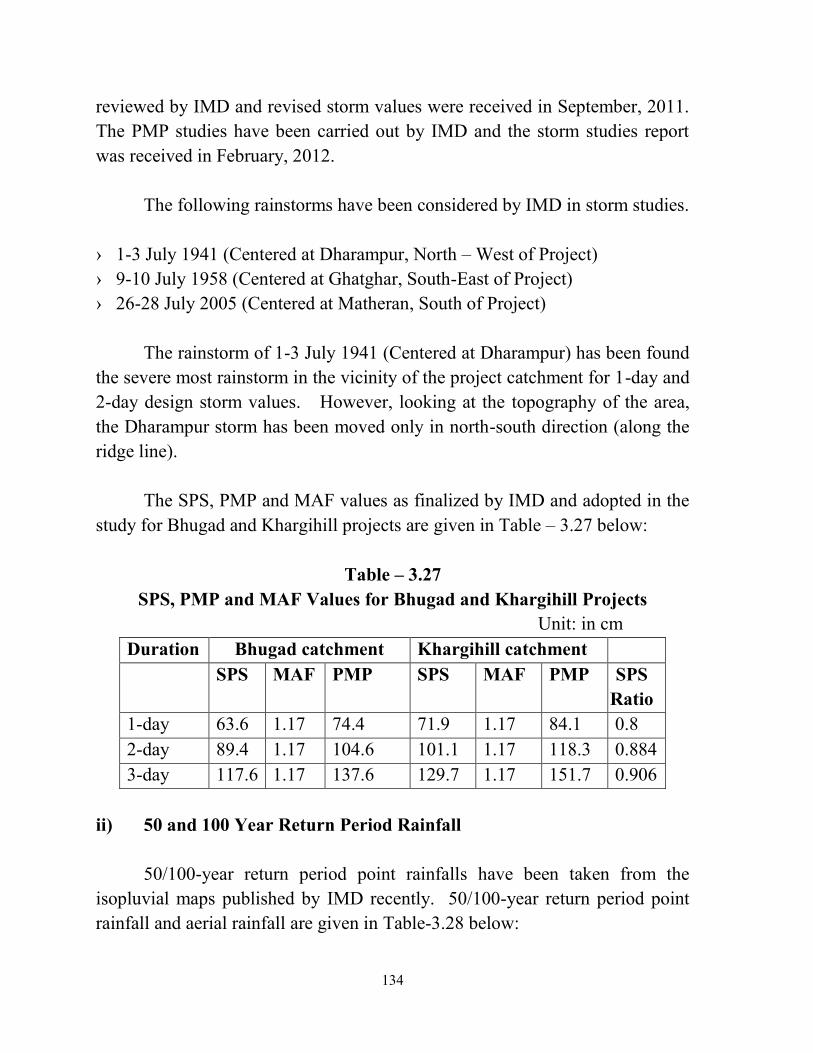
The SPS, PMP and MAF values as finalized by IMD and adopted in the
study for Bhugad and Khargihill projects are given in Table – 3.27 below:
Table – 3.27
SPS, PMP and MAF Values for Bhugad and Khargihill Projects
Unit: in cm
Duration Bhugad catchment Khargihill catchment
SPS MAF PMP SPS MAF PMP SPS
Ratio
1-day 63.6 1.17 74.4 71.9 1.17 84.1 0.8
2-day 89.4 1.17 104.6 101.1 1.17 118.3 0.884
3-day 117.6 1.17 137.6 129.7 1.17 151.7 0.906
ii) 50 and 100 Year Return Period Rainfall
50/100-year return period point rainfalls have been taken from the
isopluvial maps published by IMD recently. 50/100-year return period point
rainfall and aerial rainfall are given in Table-3.28 below:
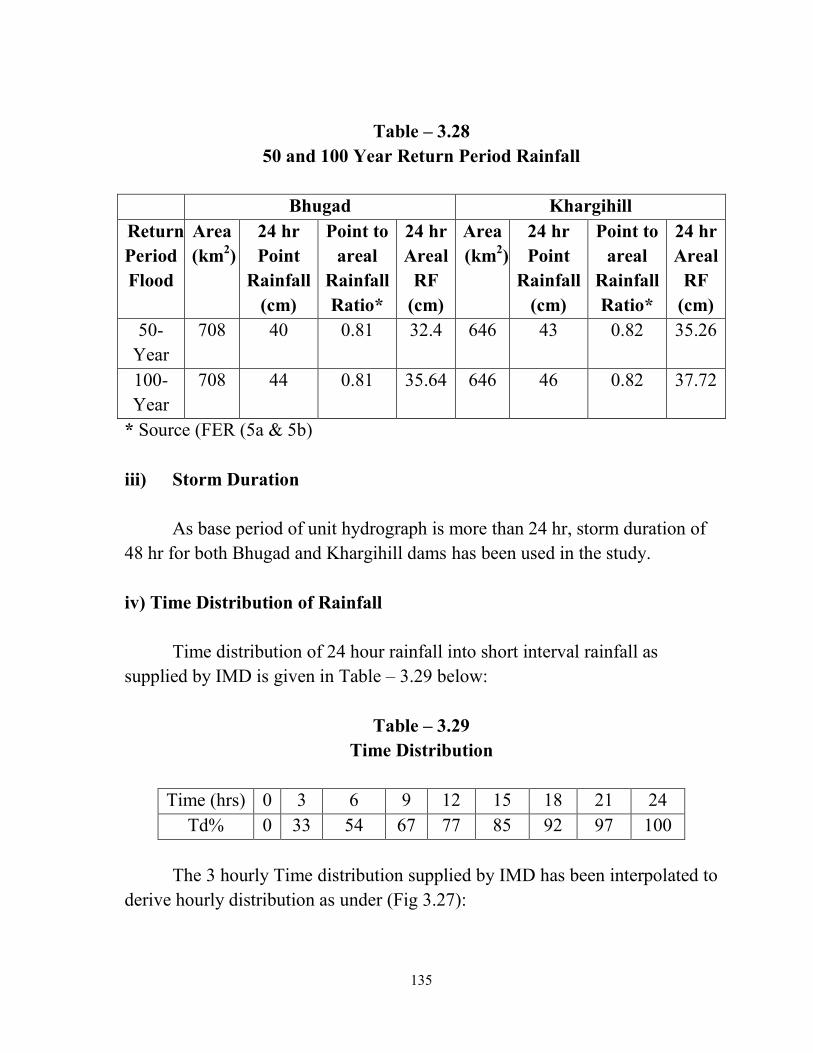
135
Table – 3.28
50 and 100 Year Return Period Rainfall
Bhugad Khargihill
Return
Period
Flood
Area
(km2)
24 hr
Point
Rainfall
(cm)
Point to
areal
Rainfall
Ratio*
24 hr
Areal
RF
(cm)
Area
(km2)
24 hr
Point
Rainfall
(cm)
Point to
areal
Rainfall
Ratio*
24 hr
Areal
RF
(cm)
50-
Year
708 40 0.81 32.4 646 43 0.82 35.26
100-
Year
708 44 0.81 35.64 646 46 0.82 37.72
* Source (FER (5a & 5b)
iii) Storm Duration
As base period of unit hydrograph is more than 24 hr, storm duration of
48 hr for both Bhugad and Khargihill dams has been used in the study.
iv) Time Distribution of Rainfall
Time distribution of 24 hour rainfall into short interval rainfall as
supplied by IMD is given in Table – 3.29 below:
Table – 3.29
Time Distribution
Time (hrs) 0 3 6 9 12 15 18 21 24
Td% 0 33 54 67 77 85 92 97 100
The 3 hourly Time distribution supplied by IMD has been interpolated to
derive hourly distribution as under (Fig 3.27):
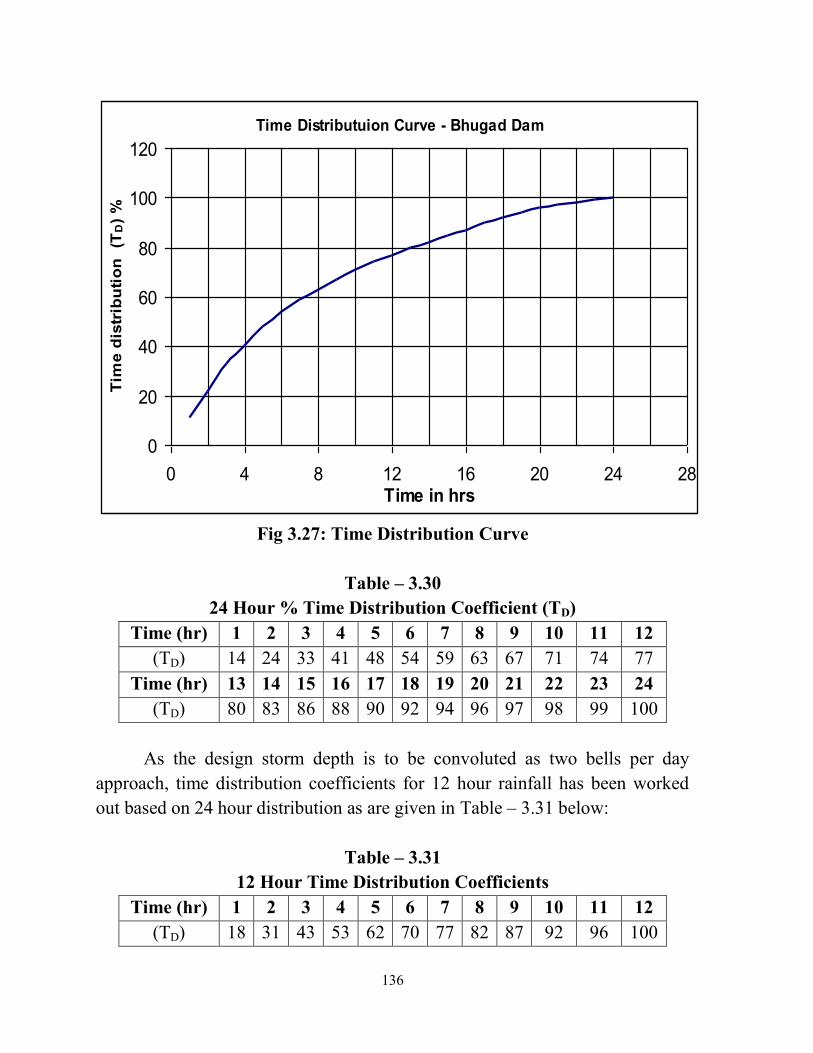
136
Time Distributuion Curve - Bhugad Dam
0
20
40
60
80
100
120
0 4 8 12 16 20 24 28Time in hrs
Tim
e d
istr
ibu
tio
n
(TD)
%
Fig 3.27: Time Distribution Curve
Table – 3.30
24 Hour % Time Distribution Coefficient (TD)
Time (hr) 1 2 3 4 5 6 7 8 9 10 11 12
(TD) 14 24 33 41 48 54 59 63 67 71 74 77
Time (hr) 13 14 15 16 17 18 19 20 21 22 23 24
(TD) 80 83 86 88 90 92 94 96 97 98 99 100
As the design storm depth is to be convoluted as two bells per day
approach, time distribution coefficients for 12 hour rainfall has been worked
out based on 24 hour distribution as are given in Table – 3.31 below:
Table – 3.31
12 Hour Time Distribution Coefficients
Time (hr) 1 2 3 4 5 6 7 8 9 10 11 12
(TD) 18 31 43 53 62 70 77 82 87 92 96 100
137
v) Design Loss Rate
A loss rate 0.19 cm/hr (model loss rate) as recommended in the Flood
Estimation Report for sub zone 5(a) and 5(b) has been adopted for computing
50/100 year return period floods. A lower loss rate of 0.10 cm/hr has been
considered for PMF estimation.
3.14.5 Convolution
The rainfall excesses have been convoluted with the unit hydrograph
developed for Bhugad and Khargihill dams to compute Direct Surface Runoff
Ordinate (DSRO).
A base flow at the rate of 0.15 cumec/km2 has been recommended in the
FER 5(a) & 5(b). However looking at observed event of 2004 for Bhugad and
1991 & 1994 events for Khargihill dam which exhibited base flow of the order
of 200-250 cumec for Bhugad and 192.4 cumec & 142 cumec for Khargihill,
base flow at higher rate of 0.3cumec/km2 has been added to the ordinates of the
DSRO to get the design flood hydrograph ordinates.
3.14.6 Design Flood (PMF)
The design flood hydrograph for Bhugad and Khargihill dams is given
below in Fig 3.28 and 3.29 respectively. The design peak flood works out as
8992 cumec for Bhugad and 10222 cumec for Khargihill.
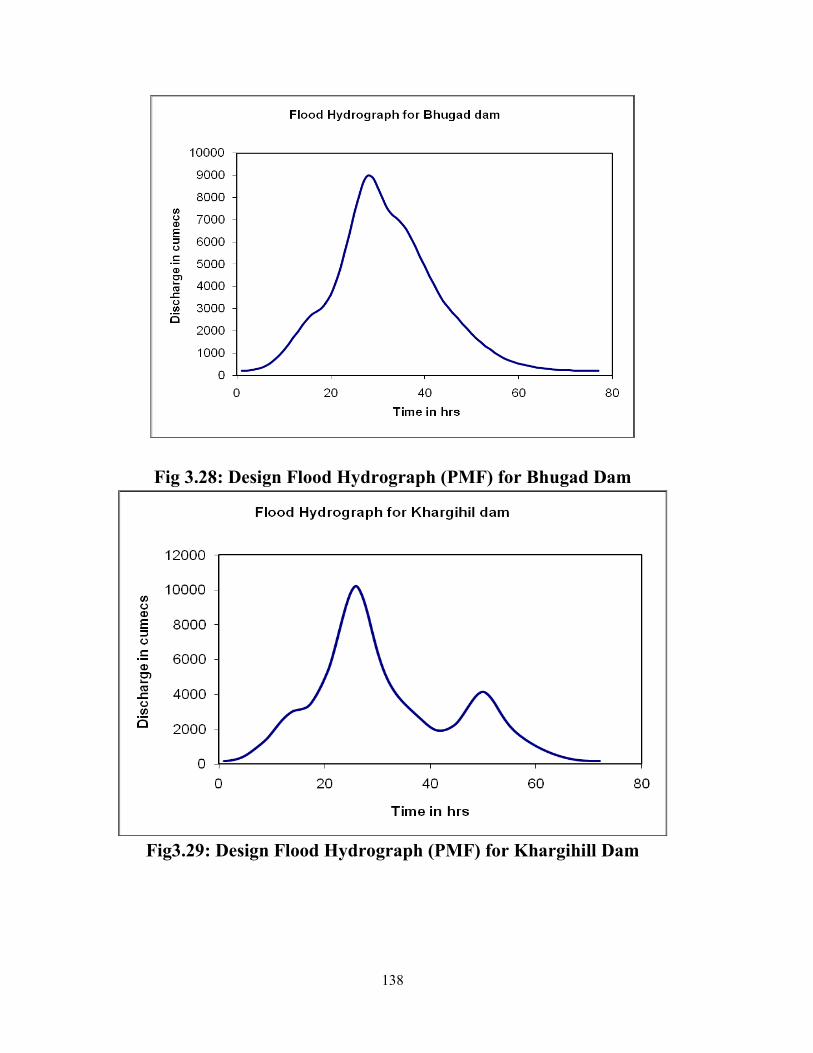
138
Fig 3.28: Design Flood Hydrograph (PMF) for Bhugad Dam
Fig3.29: Design Flood Hydrograph (PMF) for Khargihill Dam
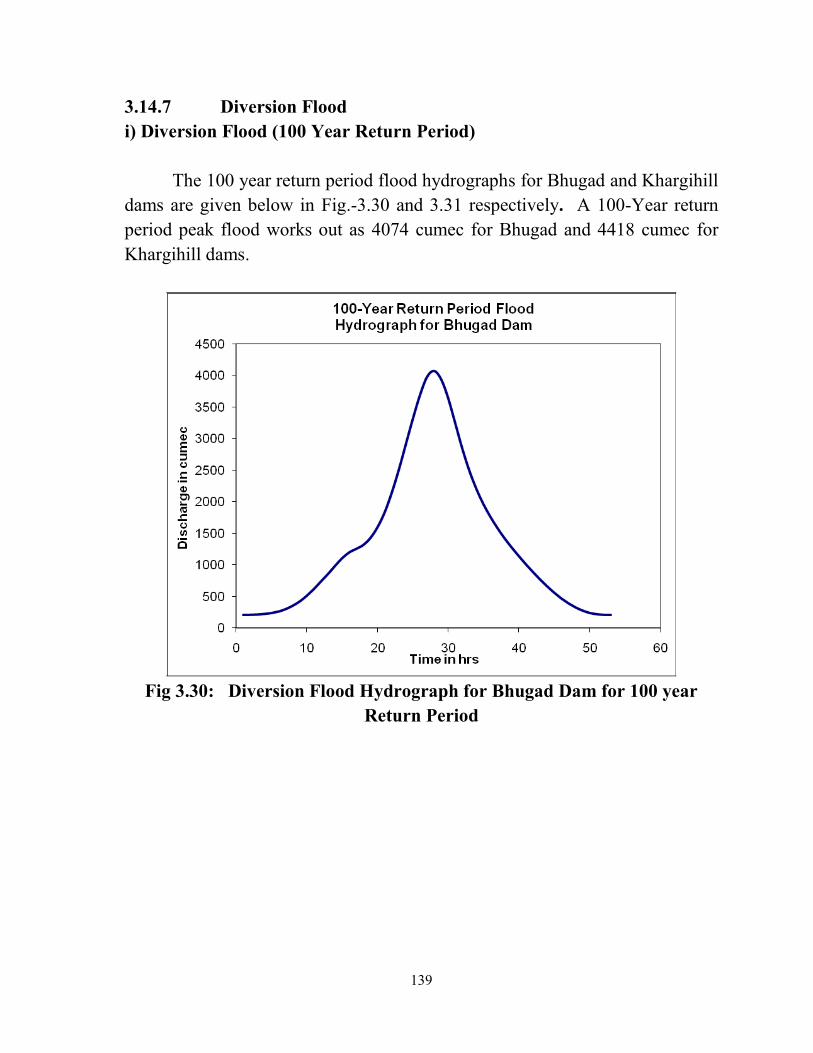
139
3.14.7 Diversion Flood
i) Diversion Flood (100 Year Return Period)
The 100 year return period flood hydrographs for Bhugad and Khargihill
dams are given below in Fig.-3.30 and 3.31 respectively. A 100-Year return
period peak flood works out as 4074 cumec for Bhugad and 4418 cumec for
Khargihill dams.
Fig 3.30: Diversion Flood Hydrograph for Bhugad Dam for 100 year
Return Period
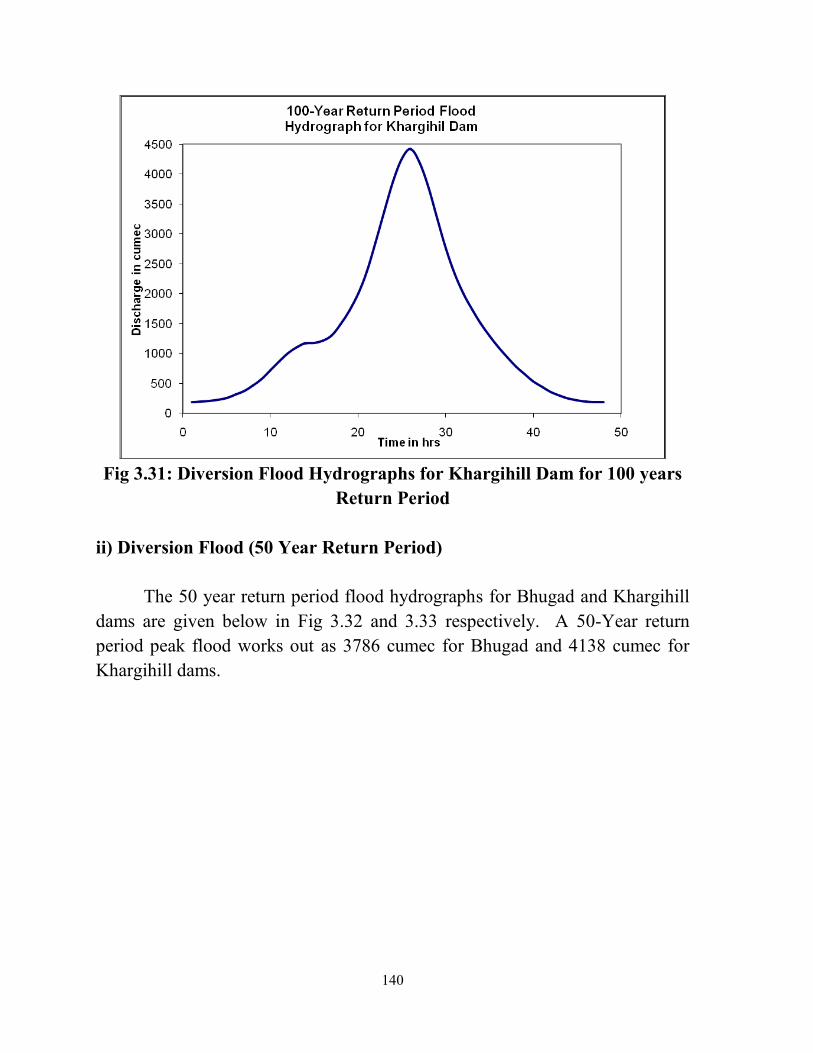
140
Fig 3.31: Diversion Flood Hydrographs for Khargihill Dam for 100 years
Return Period
ii) Diversion Flood (50 Year Return Period)
The 50 year return period flood hydrographs for Bhugad and Khargihill
dams are given below in Fig 3.32 and 3.33 respectively. A 50-Year return
period peak flood works out as 3786 cumec for Bhugad and 4138 cumec for
Khargihill dams.
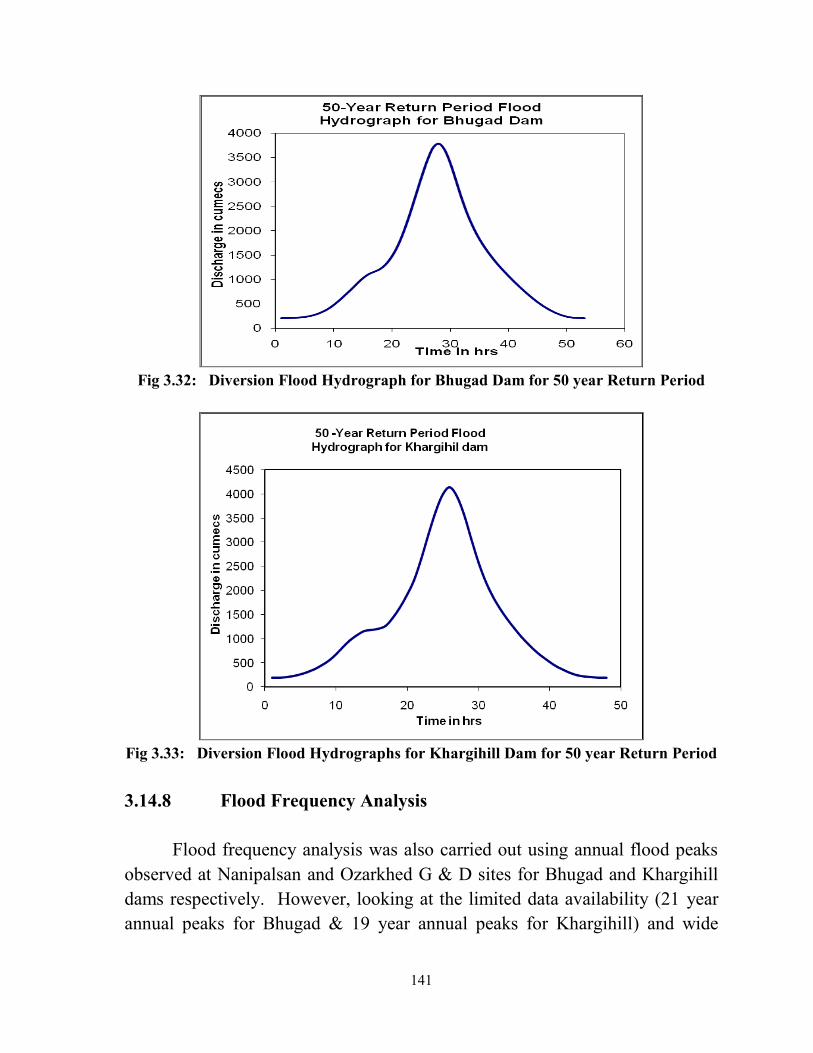
141
Fig 3.32: Diversion Flood Hydrograph for Bhugad Dam for 50 year Return Period
Fig 3.33: Diversion Flood Hydrographs for Khargihill Dam for 50 year Return Period
3.14.8 Flood Frequency Analysis
Flood frequency analysis was also carried out using annual flood peaks
observed at Nanipalsan and Ozarkhed G & D sites for Bhugad and Khargihill
dams respectively. However, looking at the limited data availability (21 year
annual peaks for Bhugad & 19 year annual peaks for Khargihill) and wide
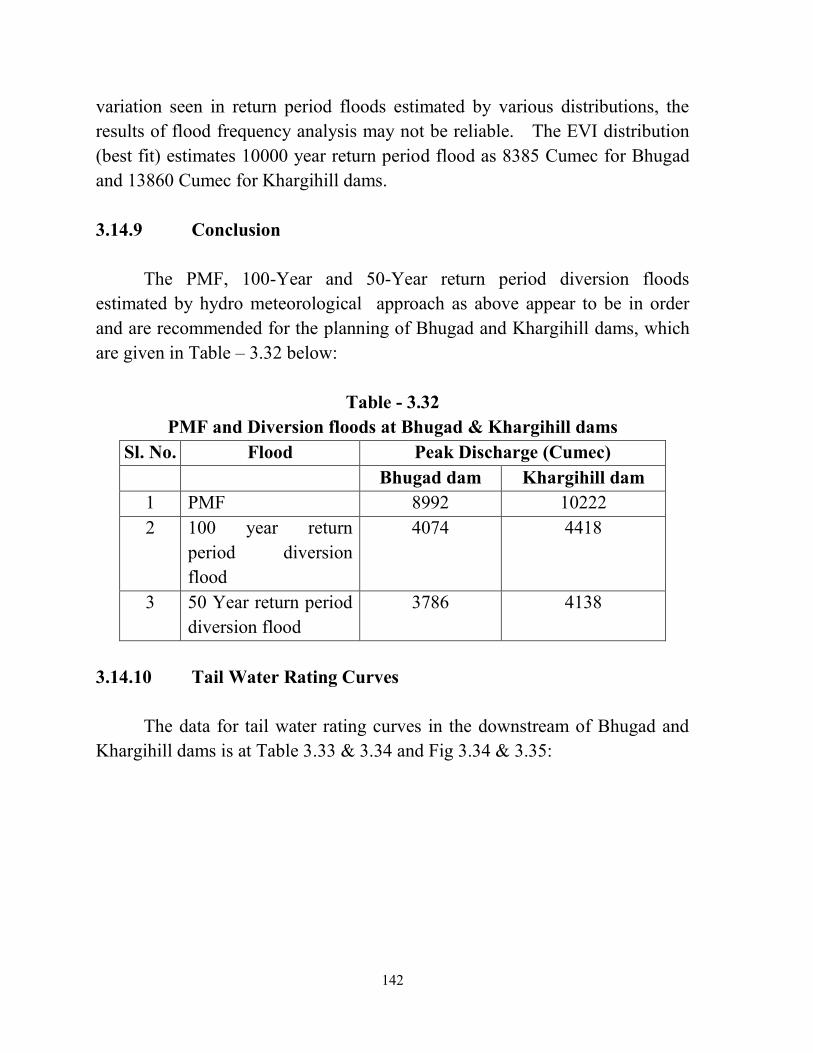
142
variation seen in return period floods estimated by various distributions, the
results of flood frequency analysis may not be reliable. The EVI distribution
(best fit) estimates 10000 year return period flood as 8385 Cumec for Bhugad
and 13860 Cumec for Khargihill dams.
3.14.9 Conclusion
The PMF, 100-Year and 50-Year return period diversion floods
estimated by hydro meteorological approach as above appear to be in order
and are recommended for the planning of Bhugad and Khargihill dams, which
are given in Table – 3.32 below:
Table - 3.32
PMF and Diversion floods at Bhugad & Khargihill dams
Sl. No. Flood Peak Discharge (Cumec)
Bhugad dam Khargihill dam
1 PMF 8992 10222
2 100 year return
period diversion
flood
4074 4418
3 50 Year return period
diversion flood
3786 4138
3.14.10 Tail Water Rating Curves
The data for tail water rating curves in the downstream of Bhugad and
Khargihill dams is at Table 3.33 & 3.34 and Fig 3.34 & 3.35:
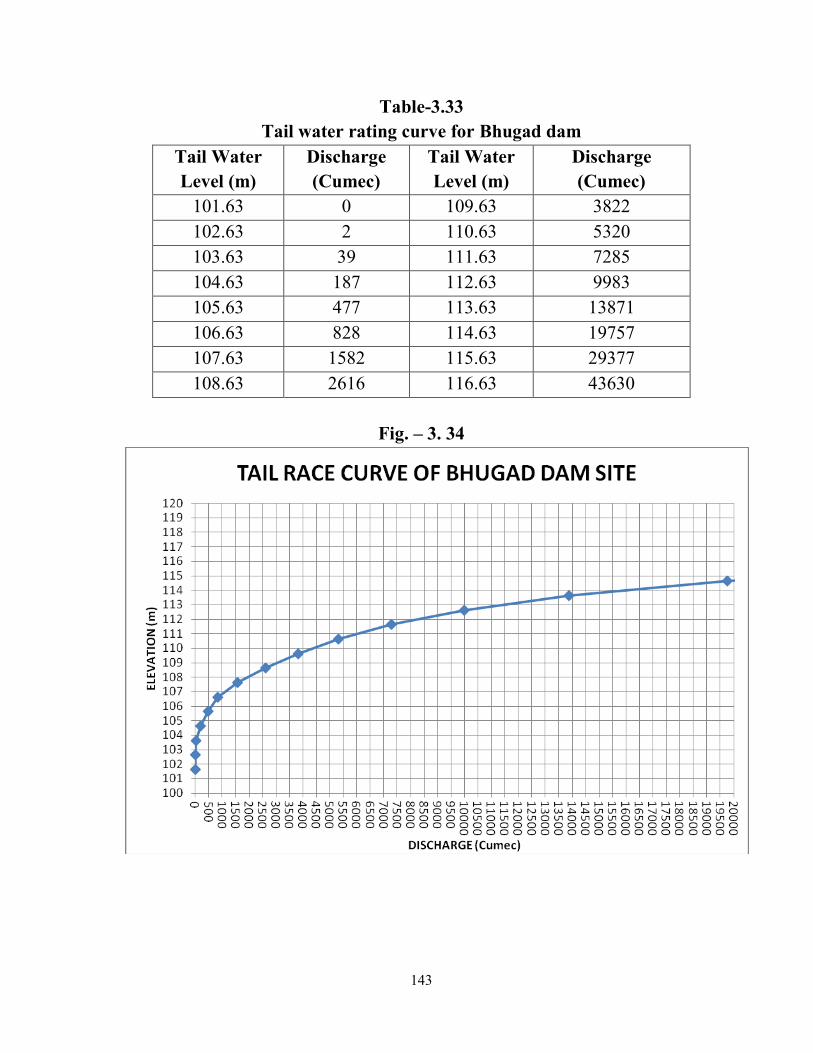
143
Table-3.33
Tail water rating curve for Bhugad dam
Tail Water
Level (m)
Discharge
(Cumec)
Tail Water
Level (m)
Discharge
(Cumec)
101.63 0 109.63 3822
102.63 2 110.63 5320
103.63 39 111.63 7285
104.63 187 112.63 9983
105.63 477 113.63 13871
106.63 828 114.63 19757
107.63 1582 115.63 29377
108.63 2616 116.63 43630
Fig. – 3. 34
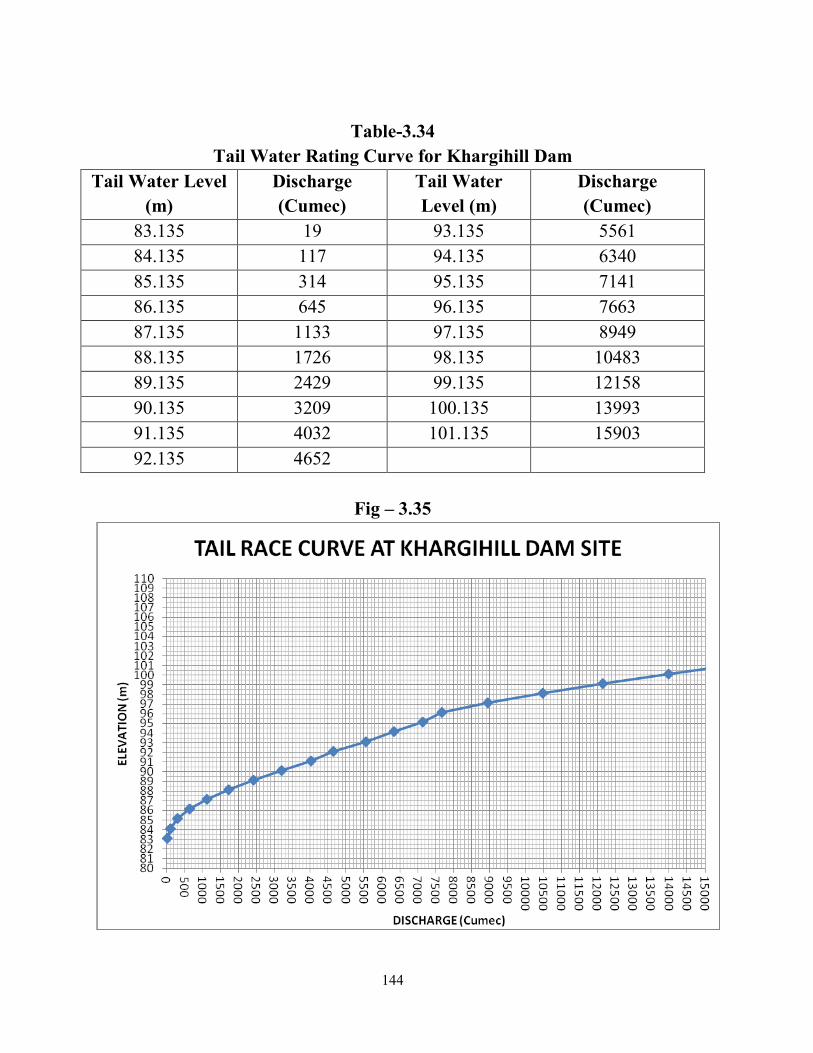
144
Table-3.34
Tail Water Rating Curve for Khargihill Dam
Tail Water Level
(m)
Discharge
(Cumec)
Tail Water
Level (m)
Discharge
(Cumec)
83.135 19 93.135 5561
84.135 117 94.135 6340
85.135 314 95.135 7141
86.135 645 96.135 7663
87.135 1133 97.135 8949
88.135 1726 98.135 10483
89.135 2429 99.135 12158
90.135 3209 100.135 13993
91.135 4032 101.135 15903
92.135 4652
Fig – 3.35
145
3.15 Simulation Studies of the Reservoirs
The Reservoir Simulation studies have been carried out in respect of four
reservoirs viz. proposed Bhugad, Khargihill, Pinjal reservoirs and existing
Madhuban (Damanganga) reservoir involved in Damanganga-Pinjal link
project using the Simulation Programme developed in C++
programme by
NWDA. Simulation study is appended as Appendix – 3.4 in Volume - IV. The
Broad Criteria adopted while carrying out the Simulation studies are as
follows:
3.15.1 Broad Criteria
o The simulation studies have been carried out on monthly basis for a
period of 30 years from 1975 to 2004.
o The minimum flows required for d/s environmental uses are considered
as 10% of the average annual lean season natural flow during October to
May.
o The diversion for Mumbai water supply is proposed in 12 months at
uniform rate.
o The initial storage at the beginning of the simulation (June, 1975) is
considered with 10% of the live storage for each reservoir,
o Upto 10% deficit in meeting a demand on annual basis is considered to
be success, presuming the system to be resilient in coping with such
shortage.
o The Storage capacities at different elevations after 50 years of
sedimentation have been considered for each reservoir.
o No salinity control requirements are considered in the study assuming
that the demand would be met from the yields of downstream catchment
of Madhuban project.
3.15.2 Computation of Net Inflows into Reservoirs
The hydrological studies for Bhugad, Khargihill, Pinjal and Madhuban
reservoirs of Damanganga - Pinjal link have been carried out by CWC, New
146
Delhi. Therefore, the respective month-wise gross yields for monsoon period
(June to September) are considered as per the studies conducted by CWC from
which corresponding annual u/s utilizations (existing, ongoing & proposed)
are deducted to arrive at net inflows at these reservoirs. The year-wise gross
non-monsoon flows as assessed by CWC have been distributed into monthly
flows in proportion to the observed flow data available at the nearest G & D
site viz. Nanipalsan (764 km2) for Bhugad, Ozarkhed (655 km
2) for Khargihill
and Andhari (326 km2) for Pinjal reservoirs.
The net inflows at Bhugad and Khargihill (original location) reservoirs
as worked out above for the period from 1975 to 2008 (month wise for
monsoon period (Jun – September)) are given in Table - 3.35, Table - 3.36 and
the same for Pinjal reservoir for the period from 1975 to 2004 are at Table -
3.37 respectively below:
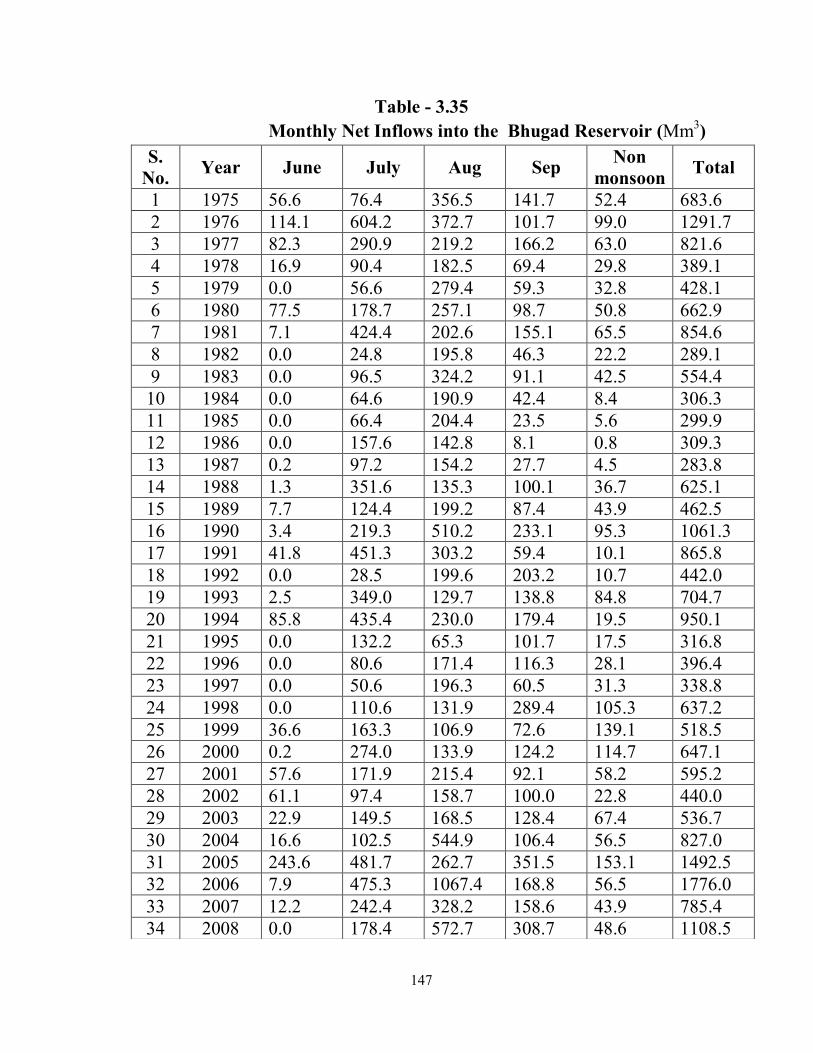
147
Table - 3.35
Monthly Net Inflows into the Bhugad Reservoir (Mm3)
S.
No. Year June July Aug Sep
Non
monsoon Total
1 1975 56.6 76.4 356.5 141.7 52.4 683.6
2 1976 114.1 604.2 372.7 101.7 99.0 1291.7
3 1977 82.3 290.9 219.2 166.2 63.0 821.6
4 1978 16.9 90.4 182.5 69.4 29.8 389.1
5 1979 0.0 56.6 279.4 59.3 32.8 428.1
6 1980 77.5 178.7 257.1 98.7 50.8 662.9
7 1981 7.1 424.4 202.6 155.1 65.5 854.6
8 1982 0.0 24.8 195.8 46.3 22.2 289.1
9 1983 0.0 96.5 324.2 91.1 42.5 554.4
10 1984 0.0 64.6 190.9 42.4 8.4 306.3
11 1985 0.0 66.4 204.4 23.5 5.6 299.9
12 1986 0.0 157.6 142.8 8.1 0.8 309.3
13 1987 0.2 97.2 154.2 27.7 4.5 283.8
14 1988 1.3 351.6 135.3 100.1 36.7 625.1
15 1989 7.7 124.4 199.2 87.4 43.9 462.5
16 1990 3.4 219.3 510.2 233.1 95.3 1061.3
17 1991 41.8 451.3 303.2 59.4 10.1 865.8
18 1992 0.0 28.5 199.6 203.2 10.7 442.0
19 1993 2.5 349.0 129.7 138.8 84.8 704.7
20 1994 85.8 435.4 230.0 179.4 19.5 950.1
21 1995 0.0 132.2 65.3 101.7 17.5 316.8
22 1996 0.0 80.6 171.4 116.3 28.1 396.4
23 1997 0.0 50.6 196.3 60.5 31.3 338.8
24 1998 0.0 110.6 131.9 289.4 105.3 637.2
25 1999 36.6 163.3 106.9 72.6 139.1 518.5
26 2000 0.2 274.0 133.9 124.2 114.7 647.1
27 2001 57.6 171.9 215.4 92.1 58.2 595.2
28 2002 61.1 97.4 158.7 100.0 22.8 440.0
29 2003 22.9 149.5 168.5 128.4 67.4 536.7
30 2004 16.6 102.5 544.9 106.4 56.5 827.0
31 2005 243.6 481.7 262.7 351.5 153.1 1492.5
32 2006 7.9 475.3 1067.4 168.8 56.5 1776.0
33 2007 12.2 242.4 328.2 158.6 43.9 785.4
34 2008 0.0 178.4 572.7 308.7 48.6 1108.5
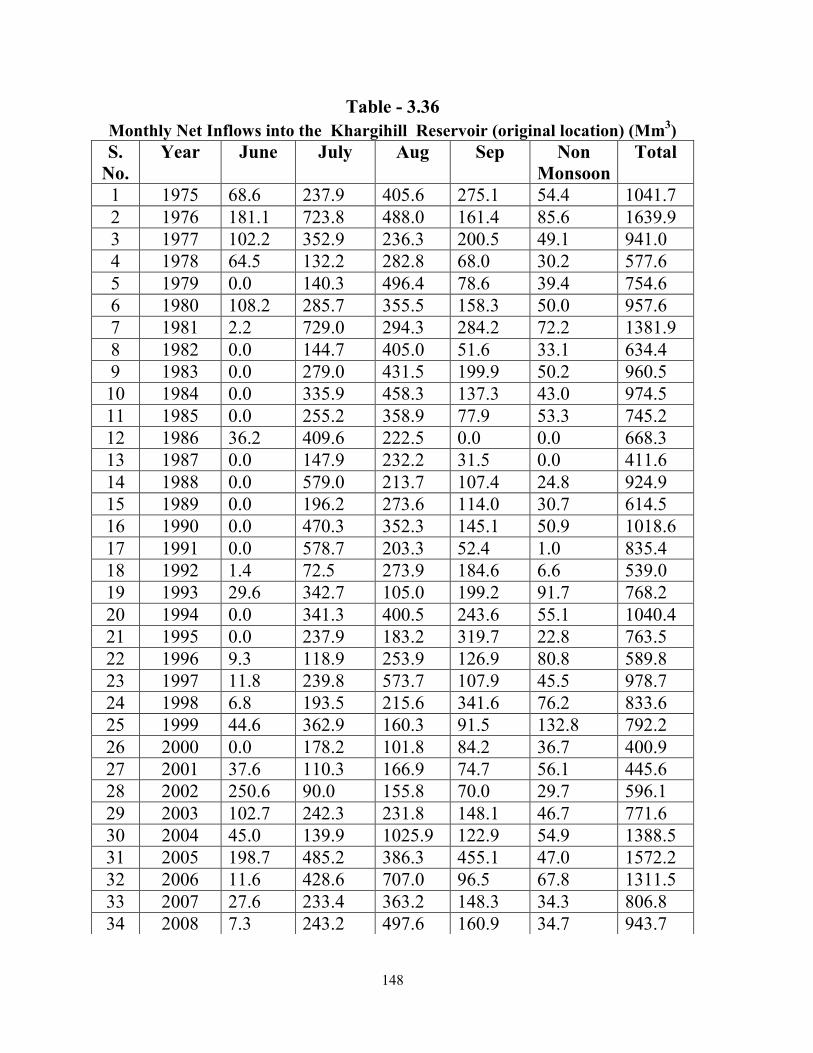
148
Table - 3.36
Monthly Net Inflows into the Khargihill Reservoir (original location) (Mm3)
S.
No.
Year June July Aug Sep Non
Monsoon
Total
1 1975 68.6 237.9 405.6 275.1 54.4 1041.7
2 1976 181.1 723.8 488.0 161.4 85.6 1639.9
3 1977 102.2 352.9 236.3 200.5 49.1 941.0
4 1978 64.5 132.2 282.8 68.0 30.2 577.6
5 1979 0.0 140.3 496.4 78.6 39.4 754.6
6 1980 108.2 285.7 355.5 158.3 50.0 957.6
7 1981 2.2 729.0 294.3 284.2 72.2 1381.9
8 1982 0.0 144.7 405.0 51.6 33.1 634.4
9 1983 0.0 279.0 431.5 199.9 50.2 960.5
10 1984 0.0 335.9 458.3 137.3 43.0 974.5
11 1985 0.0 255.2 358.9 77.9 53.3 745.2
12 1986 36.2 409.6 222.5 0.0 0.0 668.3
13 1987 0.0 147.9 232.2 31.5 0.0 411.6
14 1988 0.0 579.0 213.7 107.4 24.8 924.9
15 1989 0.0 196.2 273.6 114.0 30.7 614.5
16 1990 0.0 470.3 352.3 145.1 50.9 1018.6
17 1991 0.0 578.7 203.3 52.4 1.0 835.4
18 1992 1.4 72.5 273.9 184.6 6.6 539.0
19 1993 29.6 342.7 105.0 199.2 91.7 768.2
20 1994 0.0 341.3 400.5 243.6 55.1 1040.4
21 1995 0.0 237.9 183.2 319.7 22.8 763.5
22 1996 9.3 118.9 253.9 126.9 80.8 589.8
23 1997 11.8 239.8 573.7 107.9 45.5 978.7
24 1998 6.8 193.5 215.6 341.6 76.2 833.6
25 1999 44.6 362.9 160.3 91.5 132.8 792.2
26 2000 0.0 178.2 101.8 84.2 36.7 400.9
27 2001 37.6 110.3 166.9 74.7 56.1 445.6
28 2002 250.6 90.0 155.8 70.0 29.7 596.1
29 2003 102.7 242.3 231.8 148.1 46.7 771.6
30 2004 45.0 139.9 1025.9 122.9 54.9 1388.5
31 2005 198.7 485.2 386.3 455.1 47.0 1572.2
32 2006 11.6 428.6 707.0 96.5 67.8 1311.5
33 2007 27.6 233.4 363.2 148.3 34.3 806.8
34 2008 7.3 243.2 497.6 160.9 34.7 943.7
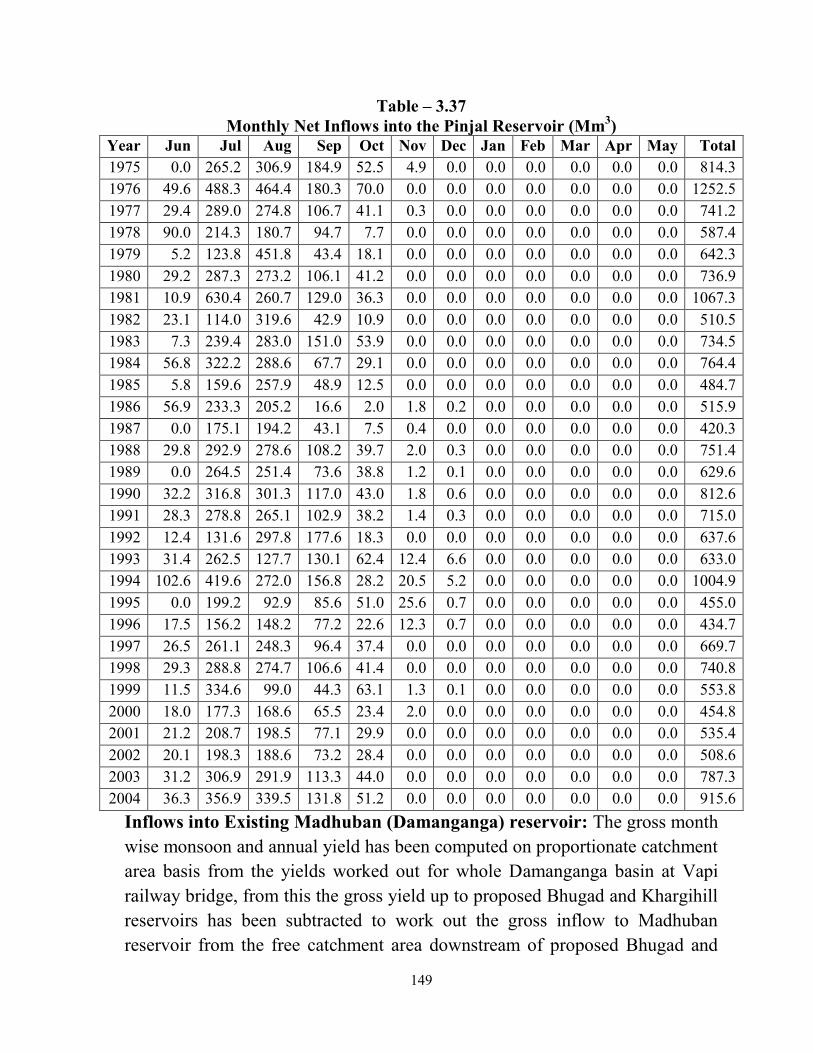
149
Table – 3.37
Monthly Net Inflows into the Pinjal Reservoir (Mm3)
Year Jun Jul Aug Sep Oct Nov Dec Jan Feb Mar Apr May Total
1975 0.0 265.2 306.9 184.9 52.5 4.9 0.0 0.0 0.0 0.0 0.0 0.0 814.3
1976 49.6 488.3 464.4 180.3 70.0 0.0 0.0 0.0 0.0 0.0 0.0 0.0 1252.5
1977 29.4 289.0 274.8 106.7 41.1 0.3 0.0 0.0 0.0 0.0 0.0 0.0 741.2
1978 90.0 214.3 180.7 94.7 7.7 0.0 0.0 0.0 0.0 0.0 0.0 0.0 587.4
1979 5.2 123.8 451.8 43.4 18.1 0.0 0.0 0.0 0.0 0.0 0.0 0.0 642.3
1980 29.2 287.3 273.2 106.1 41.2 0.0 0.0 0.0 0.0 0.0 0.0 0.0 736.9
1981 10.9 630.4 260.7 129.0 36.3 0.0 0.0 0.0 0.0 0.0 0.0 0.0 1067.3
1982 23.1 114.0 319.6 42.9 10.9 0.0 0.0 0.0 0.0 0.0 0.0 0.0 510.5
1983 7.3 239.4 283.0 151.0 53.9 0.0 0.0 0.0 0.0 0.0 0.0 0.0 734.5
1984 56.8 322.2 288.6 67.7 29.1 0.0 0.0 0.0 0.0 0.0 0.0 0.0 764.4
1985 5.8 159.6 257.9 48.9 12.5 0.0 0.0 0.0 0.0 0.0 0.0 0.0 484.7
1986 56.9 233.3 205.2 16.6 2.0 1.8 0.2 0.0 0.0 0.0 0.0 0.0 515.9
1987 0.0 175.1 194.2 43.1 7.5 0.4 0.0 0.0 0.0 0.0 0.0 0.0 420.3
1988 29.8 292.9 278.6 108.2 39.7 2.0 0.3 0.0 0.0 0.0 0.0 0.0 751.4
1989 0.0 264.5 251.4 73.6 38.8 1.2 0.1 0.0 0.0 0.0 0.0 0.0 629.6
1990 32.2 316.8 301.3 117.0 43.0 1.8 0.6 0.0 0.0 0.0 0.0 0.0 812.6
1991 28.3 278.8 265.1 102.9 38.2 1.4 0.3 0.0 0.0 0.0 0.0 0.0 715.0
1992 12.4 131.6 297.8 177.6 18.3 0.0 0.0 0.0 0.0 0.0 0.0 0.0 637.6
1993 31.4 262.5 127.7 130.1 62.4 12.4 6.6 0.0 0.0 0.0 0.0 0.0 633.0
1994 102.6 419.6 272.0 156.8 28.2 20.5 5.2 0.0 0.0 0.0 0.0 0.0 1004.9
1995 0.0 199.2 92.9 85.6 51.0 25.6 0.7 0.0 0.0 0.0 0.0 0.0 455.0
1996 17.5 156.2 148.2 77.2 22.6 12.3 0.7 0.0 0.0 0.0 0.0 0.0 434.7
1997 26.5 261.1 248.3 96.4 37.4 0.0 0.0 0.0 0.0 0.0 0.0 0.0 669.7
1998 29.3 288.8 274.7 106.6 41.4 0.0 0.0 0.0 0.0 0.0 0.0 0.0 740.8
1999 11.5 334.6 99.0 44.3 63.1 1.3 0.1 0.0 0.0 0.0 0.0 0.0 553.8
2000 18.0 177.3 168.6 65.5 23.4 2.0 0.0 0.0 0.0 0.0 0.0 0.0 454.8
2001 21.2 208.7 198.5 77.1 29.9 0.0 0.0 0.0 0.0 0.0 0.0 0.0 535.4
2002 20.1 198.3 188.6 73.2 28.4 0.0 0.0 0.0 0.0 0.0 0.0 0.0 508.6
2003 31.2 306.9 291.9 113.3 44.0 0.0 0.0 0.0 0.0 0.0 0.0 0.0 787.3
2004 36.3 356.9 339.5 131.8 51.2 0.0 0.0 0.0 0.0 0.0 0.0 0.0 915.6
Inflows into Existing Madhuban (Damanganga) reservoir: The gross month
wise monsoon and annual yield has been computed on proportionate catchment
area basis from the yields worked out for whole Damanganga basin at Vapi
railway bridge, from this the gross yield up to proposed Bhugad and Khargihill
reservoirs has been subtracted to work out the gross inflow to Madhuban
reservoir from the free catchment area downstream of proposed Bhugad and
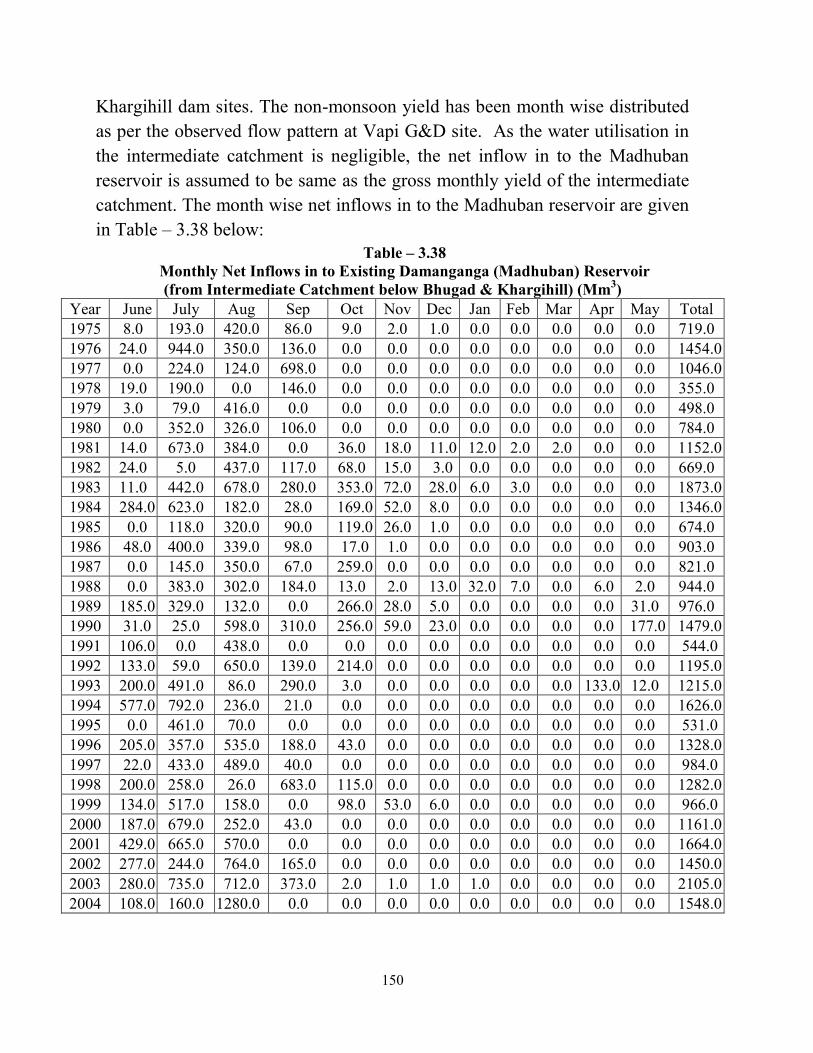
150
Khargihill dam sites. The non-monsoon yield has been month wise distributed
as per the observed flow pattern at Vapi G&D site. As the water utilisation in
the intermediate catchment is negligible, the net inflow in to the Madhuban
reservoir is assumed to be same as the gross monthly yield of the intermediate
catchment. The month wise net inflows in to the Madhuban reservoir are given
in Table – 3.38 below:
Table – 3.38
Monthly Net Inflows in to Existing Damanganga (Madhuban) Reservoir
(from Intermediate Catchment below Bhugad & Khargihill) (Mm3)
Year June July Aug Sep Oct Nov Dec Jan Feb Mar Apr May Total
1975 8.0 193.0 420.0 86.0 9.0 2.0 1.0 0.0 0.0 0.0 0.0 0.0 719.0
1976 24.0 944.0 350.0 136.0 0.0 0.0 0.0 0.0 0.0 0.0 0.0 0.0 1454.0
1977 0.0 224.0 124.0 698.0 0.0 0.0 0.0 0.0 0.0 0.0 0.0 0.0 1046.0
1978 19.0 190.0 0.0 146.0 0.0 0.0 0.0 0.0 0.0 0.0 0.0 0.0 355.0
1979 3.0 79.0 416.0 0.0 0.0 0.0 0.0 0.0 0.0 0.0 0.0 0.0 498.0
1980 0.0 352.0 326.0 106.0 0.0 0.0 0.0 0.0 0.0 0.0 0.0 0.0 784.0
1981 14.0 673.0 384.0 0.0 36.0 18.0 11.0 12.0 2.0 2.0 0.0 0.0 1152.0
1982 24.0 5.0 437.0 117.0 68.0 15.0 3.0 0.0 0.0 0.0 0.0 0.0 669.0
1983 11.0 442.0 678.0 280.0 353.0 72.0 28.0 6.0 3.0 0.0 0.0 0.0 1873.0
1984 284.0 623.0 182.0 28.0 169.0 52.0 8.0 0.0 0.0 0.0 0.0 0.0 1346.0
1985 0.0 118.0 320.0 90.0 119.0 26.0 1.0 0.0 0.0 0.0 0.0 0.0 674.0
1986 48.0 400.0 339.0 98.0 17.0 1.0 0.0 0.0 0.0 0.0 0.0 0.0 903.0
1987 0.0 145.0 350.0 67.0 259.0 0.0 0.0 0.0 0.0 0.0 0.0 0.0 821.0
1988 0.0 383.0 302.0 184.0 13.0 2.0 13.0 32.0 7.0 0.0 6.0 2.0 944.0
1989 185.0 329.0 132.0 0.0 266.0 28.0 5.0 0.0 0.0 0.0 0.0 31.0 976.0
1990 31.0 25.0 598.0 310.0 256.0 59.0 23.0 0.0 0.0 0.0 0.0 177.0 1479.0
1991 106.0 0.0 438.0 0.0 0.0 0.0 0.0 0.0 0.0 0.0 0.0 0.0 544.0
1992 133.0 59.0 650.0 139.0 214.0 0.0 0.0 0.0 0.0 0.0 0.0 0.0 1195.0
1993 200.0 491.0 86.0 290.0 3.0 0.0 0.0 0.0 0.0 0.0 133.0 12.0 1215.0
1994 577.0 792.0 236.0 21.0 0.0 0.0 0.0 0.0 0.0 0.0 0.0 0.0 1626.0
1995 0.0 461.0 70.0 0.0 0.0 0.0 0.0 0.0 0.0 0.0 0.0 0.0 531.0
1996 205.0 357.0 535.0 188.0 43.0 0.0 0.0 0.0 0.0 0.0 0.0 0.0 1328.0
1997 22.0 433.0 489.0 40.0 0.0 0.0 0.0 0.0 0.0 0.0 0.0 0.0 984.0
1998 200.0 258.0 26.0 683.0 115.0 0.0 0.0 0.0 0.0 0.0 0.0 0.0 1282.0
1999 134.0 517.0 158.0 0.0 98.0 53.0 6.0 0.0 0.0 0.0 0.0 0.0 966.0
2000 187.0 679.0 252.0 43.0 0.0 0.0 0.0 0.0 0.0 0.0 0.0 0.0 1161.0
2001 429.0 665.0 570.0 0.0 0.0 0.0 0.0 0.0 0.0 0.0 0.0 0.0 1664.0
2002 277.0 244.0 764.0 165.0 0.0 0.0 0.0 0.0 0.0 0.0 0.0 0.0 1450.0
2003 280.0 735.0 712.0 373.0 2.0 1.0 1.0 1.0 0.0 0.0 0.0 0.0 2105.0
2004 108.0 160.0 1280.0 0.0 0.0 0.0 0.0 0.0 0.0 0.0 0.0 0.0 1548.0
151
3.15.3 Priorities/Operation Policy:
The Reservoir Simulation studies were carried out considering the above
monthly net inflows into the reservoirs and monthly demands to be met from
the reservoirs in the following order of priorities.
3.15.4 Demands
3.15.4.1 Common Demands at Each Reservoir:
i) Evaporation Losses: At each reservoir, evaporation losses (a natural
hydrological process) will have to be first met irrespective of the status of
storage. The pan evaporation data for the Pinjal reservoir is available in the
‘Yield Study report of Garget and Pinjal rivers’. The pan evaporation data for
the Madhuban (Damanganga) reservoir is available in the Damanganga project
working tables which has been applied for Bhugad and Khargihill reservoirs
also.
ii) Environmental Demand: In the order of priority, the next demand
considered at each reservoir is release of minimum flows downstream during
the lean season. The minimum environmental flow demand in the river is
considered as 10% of the average annual lean season natural flows available at
each dam site as given in Table – 3.39 below:
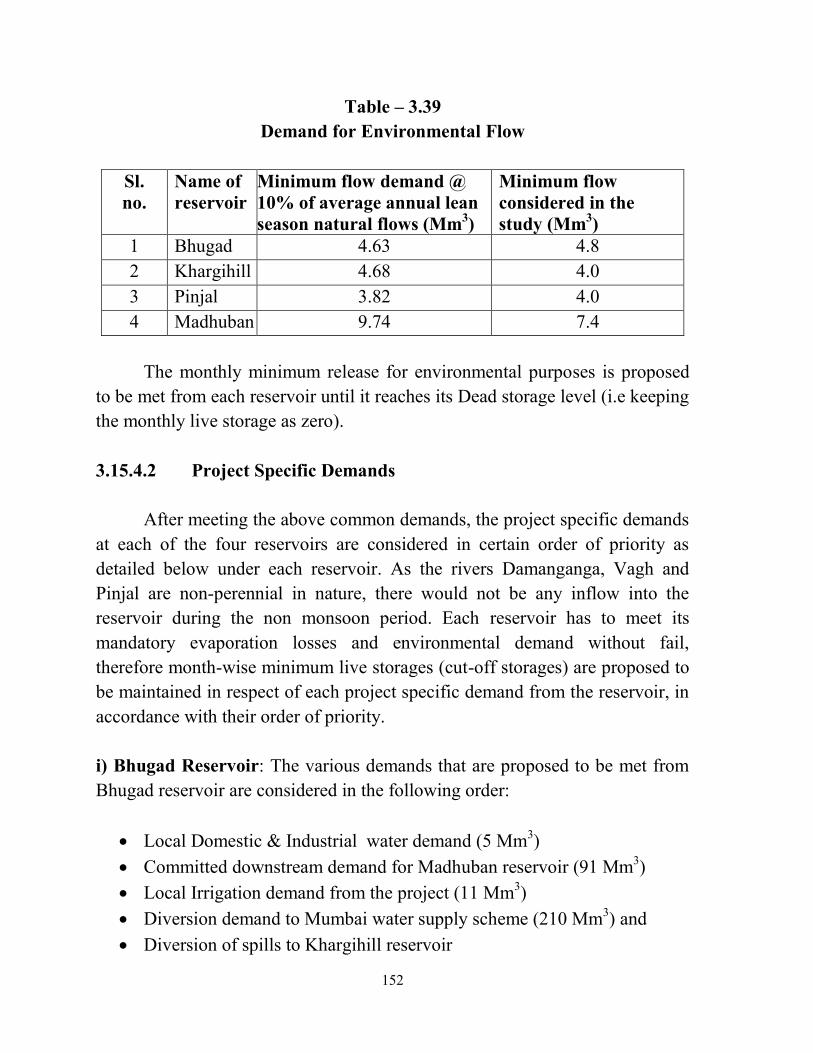
152
Table – 3.39
Demand for Environmental Flow
Sl.
no.
Name of
reservoir
Minimum flow demand @
10% of average annual lean
season natural flows (Mm3)
Minimum flow
considered in the
study (Mm3)
1 Bhugad 4.63 4.8
2 Khargihill 4.68 4.0
3 Pinjal 3.82 4.0
4 Madhuban 9.74 7.4
The monthly minimum release for environmental purposes is proposed
to be met from each reservoir until it reaches its Dead storage level (i.e keeping
the monthly live storage as zero).
3.15.4.2 Project Specific Demands
After meeting the above common demands, the project specific demands
at each of the four reservoirs are considered in certain order of priority as
detailed below under each reservoir. As the rivers Damanganga, Vagh and
Pinjal are non-perennial in nature, there would not be any inflow into the
reservoir during the non monsoon period. Each reservoir has to meet its
mandatory evaporation losses and environmental demand without fail,
therefore month-wise minimum live storages (cut-off storages) are proposed to
be maintained in respect of each project specific demand from the reservoir, in
accordance with their order of priority.
i) Bhugad Reservoir: The various demands that are proposed to be met from
Bhugad reservoir are considered in the following order:
Local Domestic & Industrial water demand (5 Mm3)
Committed downstream demand for Madhuban reservoir (91 Mm3)
Local Irrigation demand from the project (11 Mm3)
Diversion demand to Mumbai water supply scheme (210 Mm3) and
Diversion of spills to Khargihill reservoir
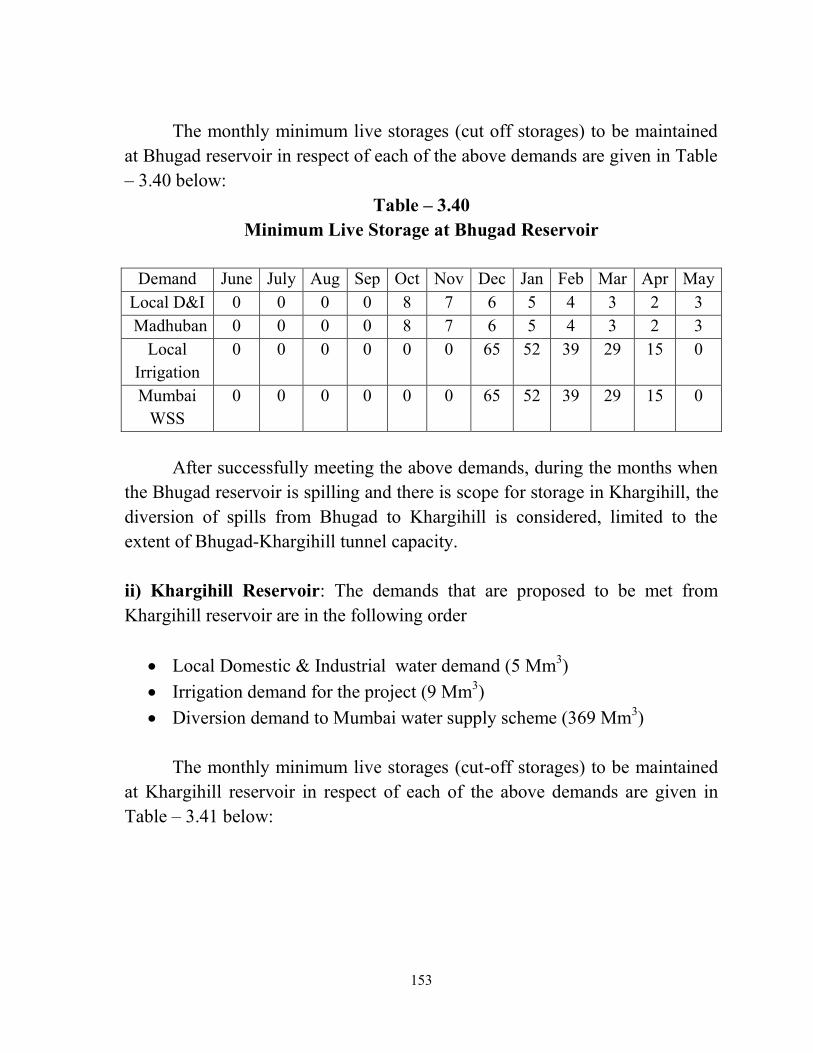
153
The monthly minimum live storages (cut off storages) to be maintained
at Bhugad reservoir in respect of each of the above demands are given in Table
– 3.40 below:
Table – 3.40
Minimum Live Storage at Bhugad Reservoir
Demand June July Aug Sep Oct Nov Dec Jan Feb Mar Apr May
Local D&I 0 0 0 0 8 7 6 5 4 3 2 3
Madhuban 0 0 0 0 8 7 6 5 4 3 2 3
Local
Irrigation
0 0 0 0 0 0 65 52 39 29 15 0
Mumbai
WSS
0 0 0 0 0 0 65 52 39 29 15 0
After successfully meeting the above demands, during the months when
the Bhugad reservoir is spilling and there is scope for storage in Khargihill, the
diversion of spills from Bhugad to Khargihill is considered, limited to the
extent of Bhugad-Khargihill tunnel capacity.
ii) Khargihill Reservoir: The demands that are proposed to be met from
Khargihill reservoir are in the following order
Local Domestic & Industrial water demand (5 Mm3)
Irrigation demand for the project (9 Mm3)
Diversion demand to Mumbai water supply scheme (369 Mm3)
The monthly minimum live storages (cut-off storages) to be maintained
at Khargihill reservoir in respect of each of the above demands are given in
Table – 3.41 below:
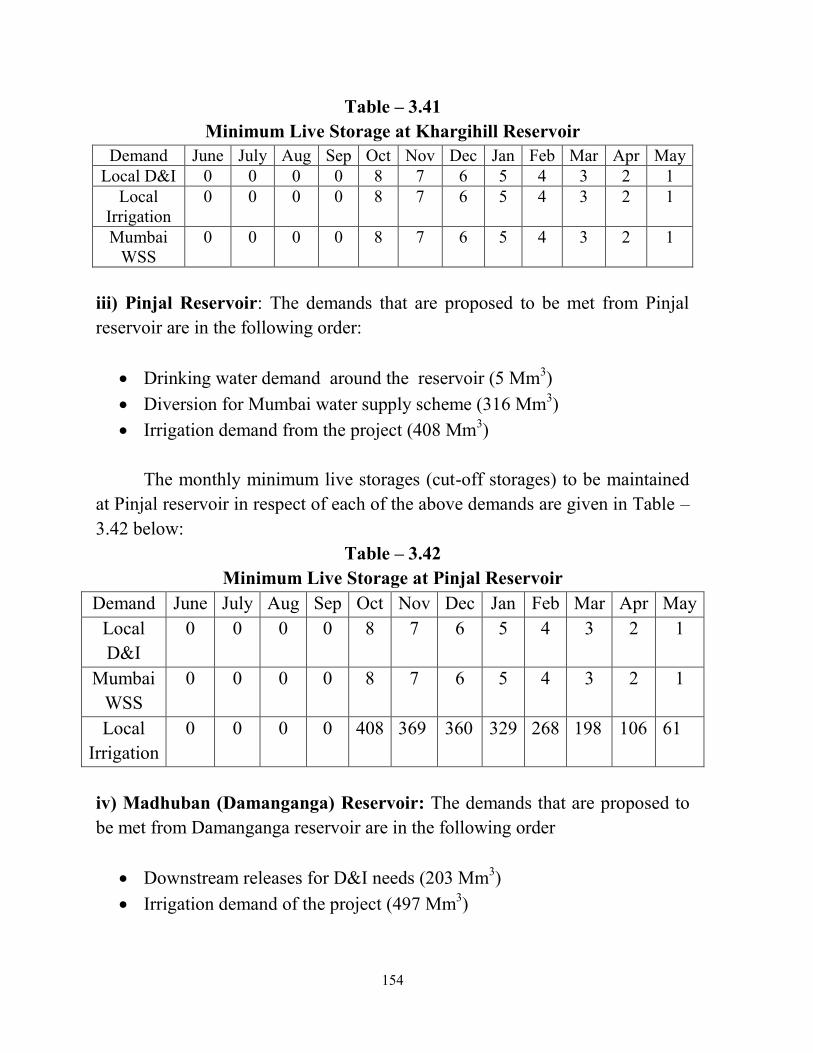
154
Table – 3.41
Minimum Live Storage at Khargihill Reservoir
Demand June July Aug Sep Oct Nov Dec Jan Feb Mar Apr May
Local D&I 0 0 0 0 8 7 6 5 4 3 2 1
Local
Irrigation
0 0 0 0 8 7 6 5 4 3 2 1
Mumbai
WSS
0 0 0 0 8 7 6 5 4 3 2 1
iii) Pinjal Reservoir: The demands that are proposed to be met from Pinjal
reservoir are in the following order:
Drinking water demand around the reservoir (5 Mm3)
Diversion for Mumbai water supply scheme (316 Mm3)
Irrigation demand from the project (408 Mm3)
The monthly minimum live storages (cut-off storages) to be maintained
at Pinjal reservoir in respect of each of the above demands are given in Table –
3.42 below:
Table – 3.42
Minimum Live Storage at Pinjal Reservoir
Demand June July Aug Sep Oct Nov Dec Jan Feb Mar Apr May
Local
D&I
0 0 0 0 8 7 6 5 4 3 2 1
Mumbai
WSS
0 0 0 0 8 7 6 5 4 3 2 1
Local
Irrigation
0 0 0 0 408 369 360 329 268 198 106 61
iv) Madhuban (Damanganga) Reservoir: The demands that are proposed to
be met from Damanganga reservoir are in the following order
Downstream releases for D&I needs (203 Mm3)
Irrigation demand of the project (497 Mm3)
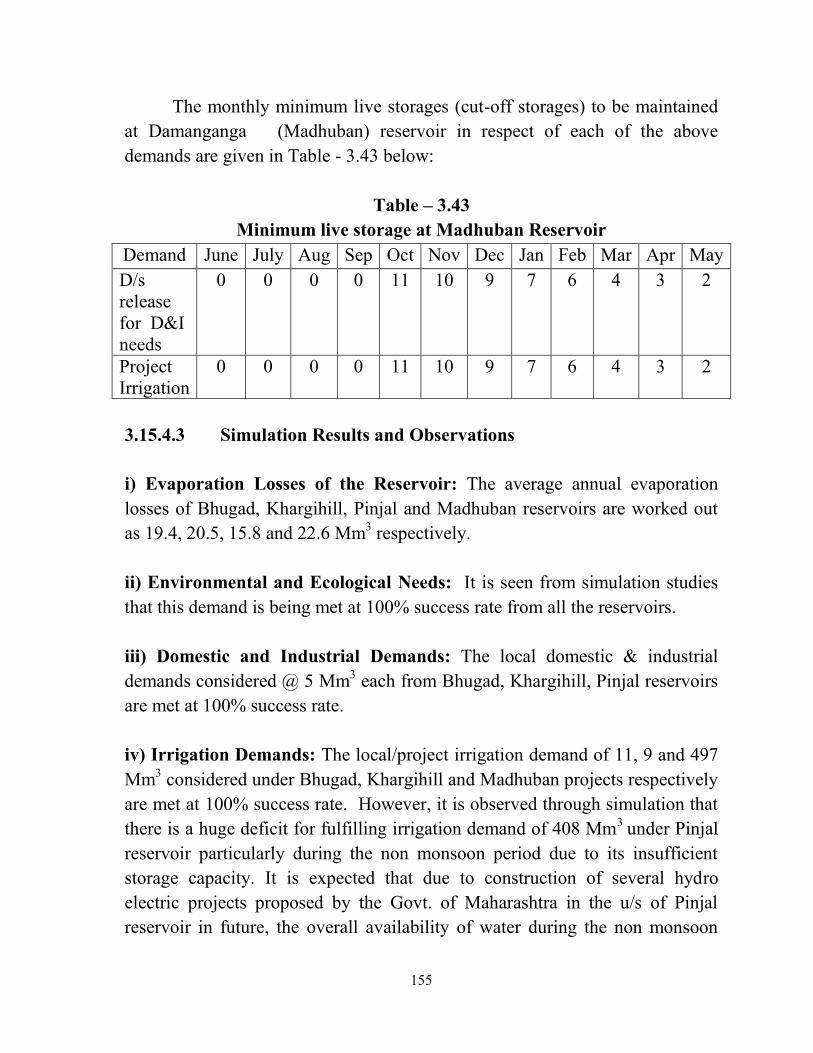
155
The monthly minimum live storages (cut-off storages) to be maintained
at Damanganga (Madhuban) reservoir in respect of each of the above
demands are given in Table - 3.43 below:
Table – 3.43
Minimum live storage at Madhuban Reservoir
Demand June July Aug Sep Oct Nov Dec Jan Feb Mar Apr May
D/s
release
for D&I
needs
0 0 0 0 11 10 9 7 6 4 3 2
Project
Irrigation
0 0 0 0 11 10 9 7 6 4 3 2
3.15.4.3 Simulation Results and Observations
i) Evaporation Losses of the Reservoir: The average annual evaporation
losses of Bhugad, Khargihill, Pinjal and Madhuban reservoirs are worked out
as 19.4, 20.5, 15.8 and 22.6 Mm3 respectively.
ii) Environmental and Ecological Needs: It is seen from simulation studies
that this demand is being met at 100% success rate from all the reservoirs.
iii) Domestic and Industrial Demands: The local domestic & industrial
demands considered @ 5 Mm3 each from Bhugad, Khargihill, Pinjal reservoirs
are met at 100% success rate.
iv) Irrigation Demands: The local/project irrigation demand of 11, 9 and 497
Mm3 considered under Bhugad, Khargihill and Madhuban projects respectively
are met at 100% success rate. However, it is observed through simulation that
there is a huge deficit for fulfilling irrigation demand of 408 Mm3
under Pinjal
reservoir particularly during the non monsoon period due to its insufficient
storage capacity. It is expected that due to construction of several hydro
electric projects proposed by the Govt. of Maharashtra in the u/s of Pinjal
reservoir in future, the overall availability of water during the non monsoon
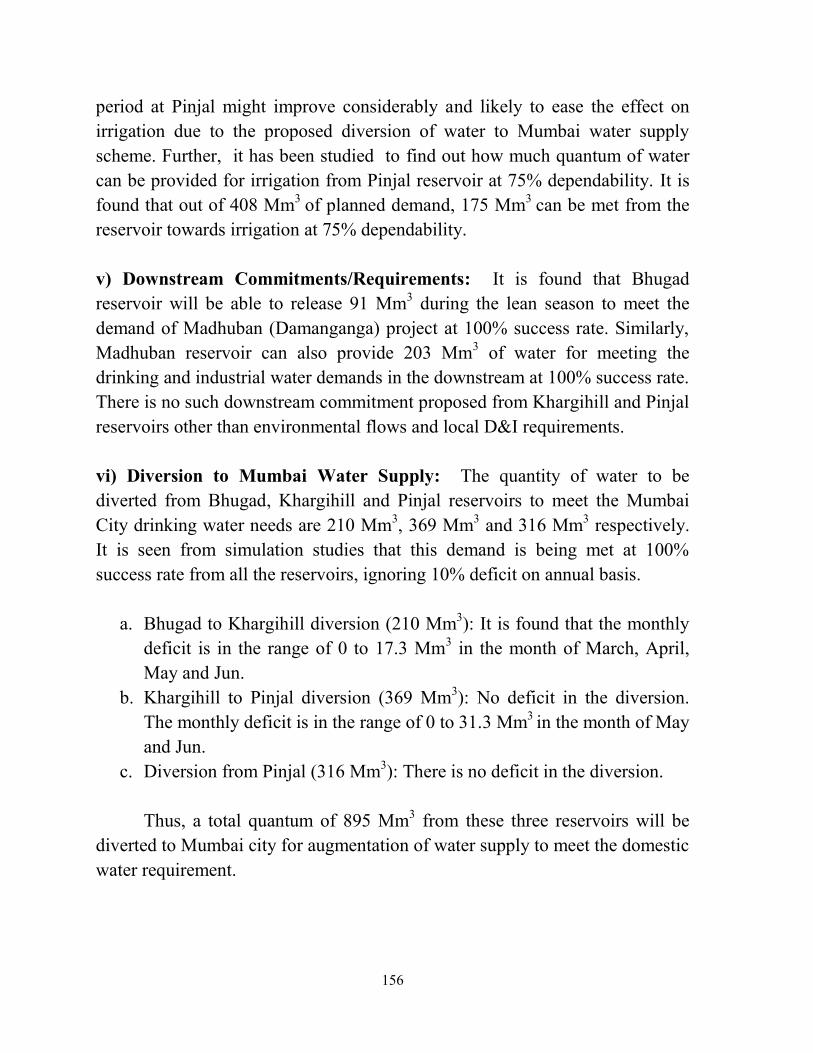
156
period at Pinjal might improve considerably and likely to ease the effect on
irrigation due to the proposed diversion of water to Mumbai water supply
scheme. Further, it has been studied to find out how much quantum of water
can be provided for irrigation from Pinjal reservoir at 75% dependability. It is
found that out of 408 Mm3
of planned demand, 175 Mm3
can be met from the
reservoir towards irrigation at 75% dependability.
v) Downstream Commitments/Requirements: It is found that Bhugad
reservoir will be able to release 91 Mm3 during the lean season to meet the
demand of Madhuban (Damanganga) project at 100% success rate. Similarly,
Madhuban reservoir can also provide 203 Mm3 of water for meeting the
drinking and industrial water demands in the downstream at 100% success rate.
There is no such downstream commitment proposed from Khargihill and Pinjal
reservoirs other than environmental flows and local D&I requirements.
vi) Diversion to Mumbai Water Supply: The quantity of water to be
diverted from Bhugad, Khargihill and Pinjal reservoirs to meet the Mumbai
City drinking water needs are 210 Mm3, 369 Mm
3 and 316 Mm
3 respectively.
It is seen from simulation studies that this demand is being met at 100%
success rate from all the reservoirs, ignoring 10% deficit on annual basis.
a. Bhugad to Khargihill diversion (210 Mm3): It is found that the monthly
deficit is in the range of 0 to 17.3 Mm3 in the month of March, April,
May and Jun.
b. Khargihill to Pinjal diversion (369 Mm3): No deficit in the diversion.
The monthly deficit is in the range of 0 to 31.3 Mm3 in the month of May
and Jun.
c. Diversion from Pinjal (316 Mm3): There is no deficit in the diversion.
Thus, a total quantum of 895 Mm3 from these three reservoirs will be
diverted to Mumbai city for augmentation of water supply to meet the domestic
water requirement.
157
3.15.4.4 Inflows into the Reservoirs: The monthly and annual inflows
into Bhugad, Khargihill, Pinjal and Madhuban reservoirs at different
dependabilities are given in Simulation studies.
3.15.4.5 Spills at the Reservoirs: The annual spills at 75% dependability
from Bhugad, Khargihill, Pinjal and Madhuban reservoirs are found to be 27.5,
206.8, 41 and 615 Mm3 respectively.
3.15.4.6 Tunnel Capacity: The maximum diversion proposed from
Bhugad to Khargihill reservoir for Mumbai water supply is 17.8 Mm3 /month
i.e. 6.5 cumec. Similarly, the maximum diversion proposed from Khargihill to
Pinjal reservoir (for transfer of combined quantity of 579 Mm3) is 49.2 Mm
3
/month i.e. 18.4 cumec.
3.16 Water Allocation and Inter State Aspects
The Damanganga is an inter-state river flowing through the territories of
Maharashtra, Gujarat, Dadra & Nagar Haveli and Daman & Diu. The total
catchment area of Damanganga basin is 2331 km2 of which 1438 km
2 lies in
Maharashtra state, 430 km2 in Gujarat state, 393 km
2 in Union Territory of
Dadra & Nagar Haveli and 70 km2 in Union Territory of Daman & Diu. The
two dams namely Bhugad dam across river Damanganga and Khargihill dam
across river Vagh (a tributary of Damanganga river) are proposed for diversion
of surplus waters of Damanganga basin to Pinjal dam proposed by Government
of Maharashtra in Vaitarna basin for augmentation of drinking water supply for
Mumbai city. The catchment area of Damanganga basin upto proposed
Khargihill dam site is 646 km2 which entirely lies in Maharashtra state. The
catchment area of Damanganga basin upto Bhugad dam site is 708 km2 of
which 567 km2 lies in Maharashtra state and 141 km
2 in Gujarat state.
The Gujarat state has already constructed a dam at Madhuban across
river Damanganga downstream of proposed Bhugad and Khargihill dam sites
and also downstream of confluence of Vagh and Damanganga rivers. The
Government of Gujarat has planned Madhuban dam for utilising the waters
generated from catchment area of Damanganga river lying in Gujarat state. The
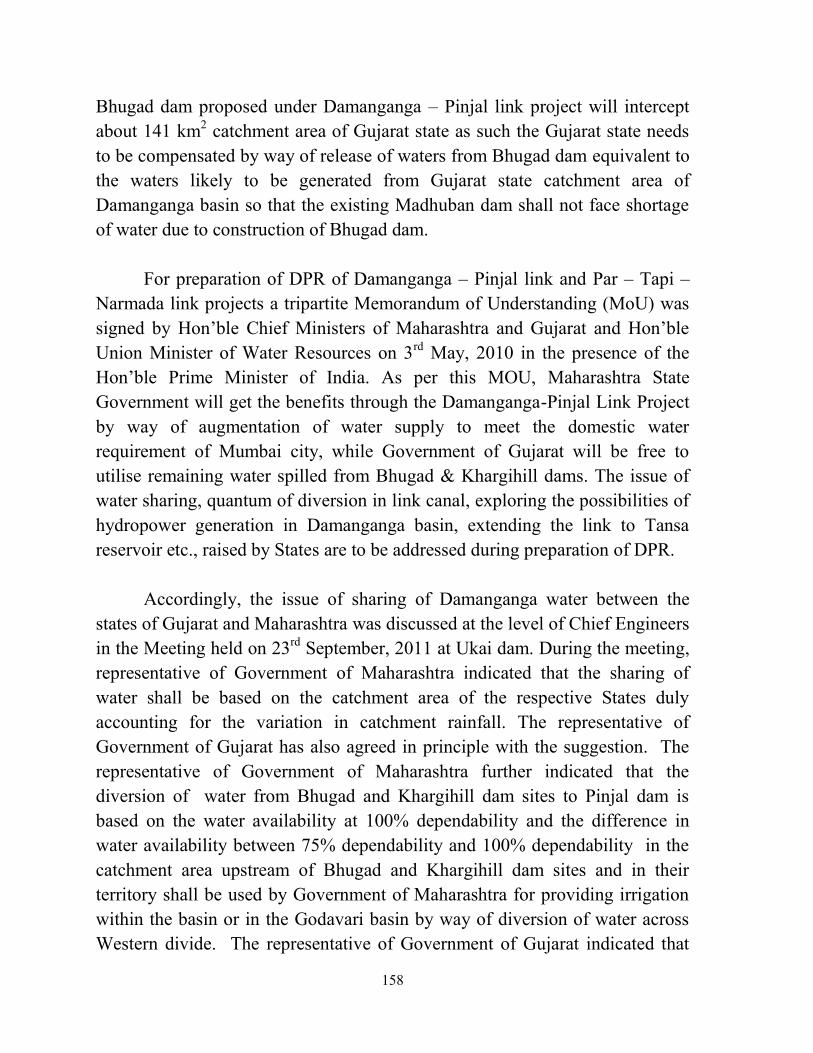
158
Bhugad dam proposed under Damanganga – Pinjal link project will intercept
about 141 km2 catchment area of Gujarat state as such the Gujarat state needs
to be compensated by way of release of waters from Bhugad dam equivalent to
the waters likely to be generated from Gujarat state catchment area of
Damanganga basin so that the existing Madhuban dam shall not face shortage
of water due to construction of Bhugad dam.
For preparation of DPR of Damanganga – Pinjal link and Par – Tapi –
Narmada link projects a tripartite Memorandum of Understanding (MoU) was
signed by Hon’ble Chief Ministers of Maharashtra and Gujarat and Hon’ble
Union Minister of Water Resources on 3rd
May, 2010 in the presence of the
Hon’ble Prime Minister of India. As per this MOU, Maharashtra State
Government will get the benefits through the Damanganga-Pinjal Link Project
by way of augmentation of water supply to meet the domestic water
requirement of Mumbai city, while Government of Gujarat will be free to
utilise remaining water spilled from Bhugad & Khargihill dams. The issue of
water sharing, quantum of diversion in link canal, exploring the possibilities of
hydropower generation in Damanganga basin, extending the link to Tansa
reservoir etc., raised by States are to be addressed during preparation of DPR.
Accordingly, the issue of sharing of Damanganga water between the
states of Gujarat and Maharashtra was discussed at the level of Chief Engineers
in the Meeting held on 23rd
September, 2011 at Ukai dam. During the meeting,
representative of Government of Maharashtra indicated that the sharing of
water shall be based on the catchment area of the respective States duly
accounting for the variation in catchment rainfall. The representative of
Government of Gujarat has also agreed in principle with the suggestion. The
representative of Government of Maharashtra further indicated that the
diversion of water from Bhugad and Khargihill dam sites to Pinjal dam is
based on the water availability at 100% dependability and the difference in
water availability between 75% dependability and 100% dependability in the
catchment area upstream of Bhugad and Khargihill dam sites and in their
territory shall be used by Government of Maharashtra for providing irrigation
within the basin or in the Godavari basin by way of diversion of water across
Western divide. The representative of Government of Gujarat indicated that
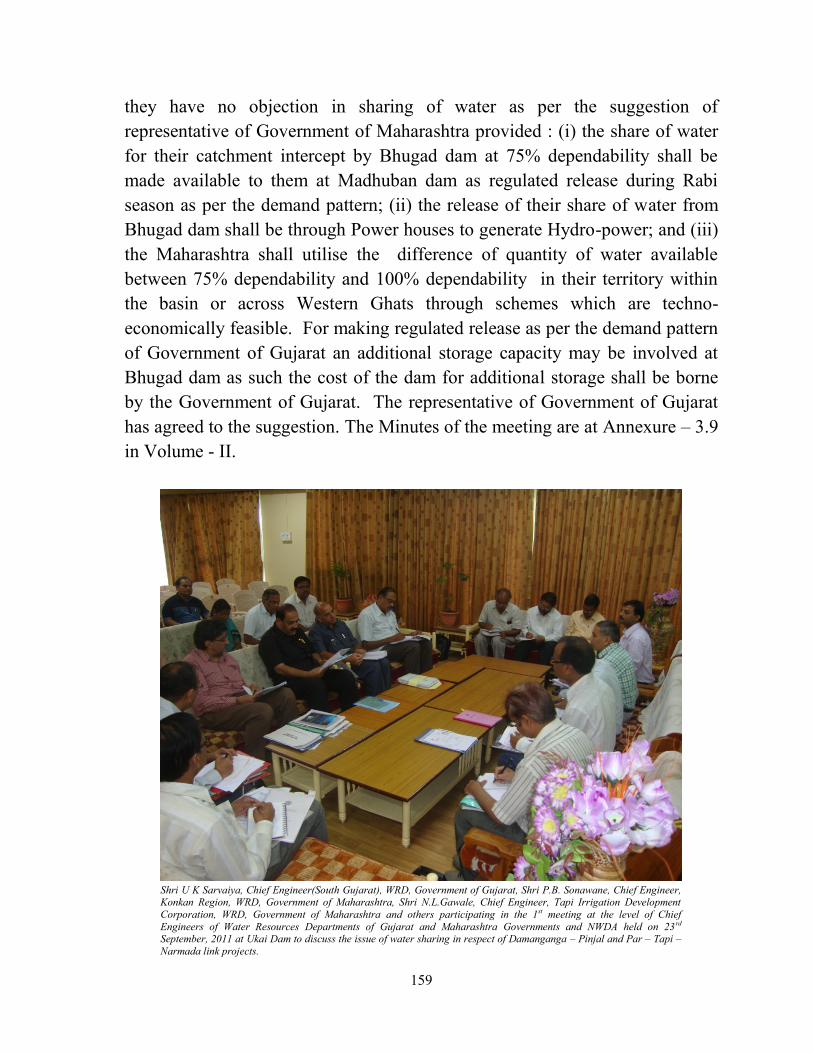
159
they have no objection in sharing of water as per the suggestion of
representative of Government of Maharashtra provided : (i) the share of water
for their catchment intercept by Bhugad dam at 75% dependability shall be
made available to them at Madhuban dam as regulated release during Rabi
season as per the demand pattern; (ii) the release of their share of water from
Bhugad dam shall be through Power houses to generate Hydro-power; and (iii)
the Maharashtra shall utilise the difference of quantity of water available
between 75% dependability and 100% dependability in their territory within
the basin or across Western Ghats through schemes which are techno-
economically feasible. For making regulated release as per the demand pattern
of Government of Gujarat an additional storage capacity may be involved at
Bhugad dam as such the cost of the dam for additional storage shall be borne
by the Government of Gujarat. The representative of Government of Gujarat
has agreed to the suggestion. The Minutes of the meeting are at Annexure – 3.9
in Volume - II.
Shri U K Sarvaiya, Chief Engineer(South Gujarat), WRD, Government of Gujarat, Shri P.B. Sonawane, Chief Engineer, Konkan Region, WRD, Government of Maharashtra, Shri N.L.Gawale, Chief Engineer, Tapi Irrigation Development
Corporation, WRD, Government of Maharashtra and others participating in the 1st meeting at the level of Chief
Engineers of Water Resources Departments of Gujarat and Maharashtra Governments and NWDA held on 23rd September, 2011 at Ukai Dam to discuss the issue of water sharing in respect of Damanganga – Pinjal and Par – Tapi –
Narmada link projects.
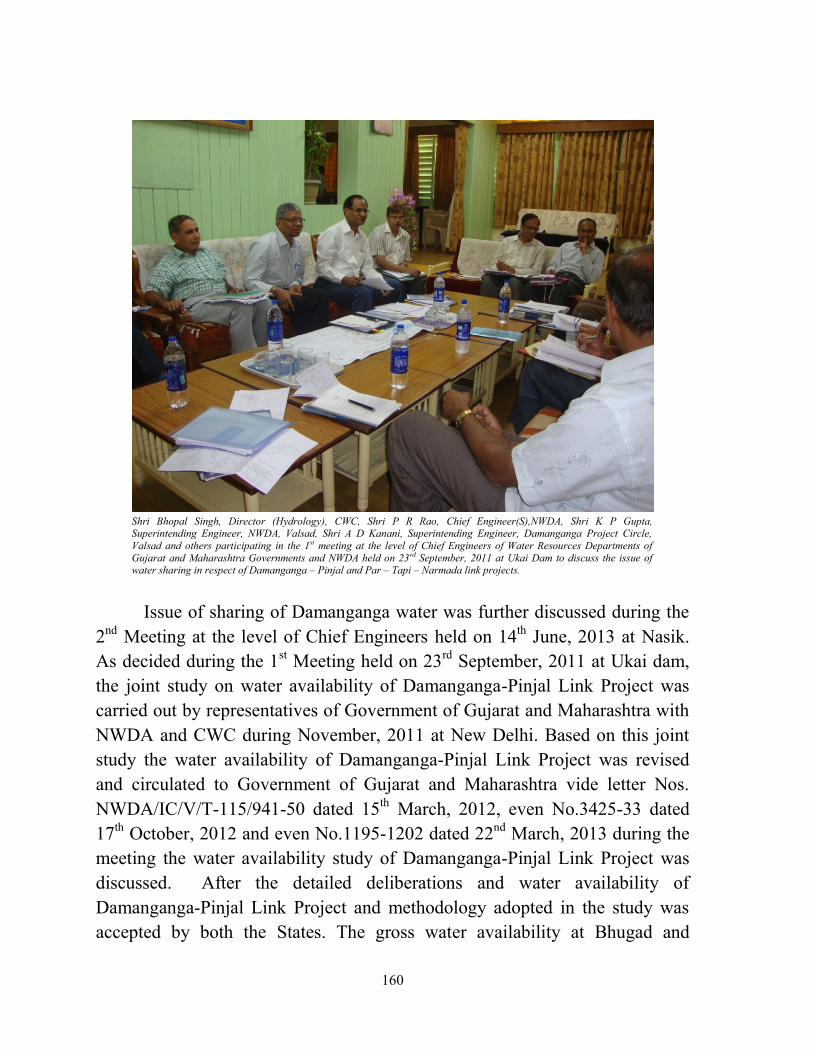
160
Shri Bhopal Singh, Director (Hydrology), CWC, Shri P R Rao, Chief Engineer(S),NWDA, Shri K P Gupta, Superintending Engineer, NWDA, Valsad, Shri A D Kanani, Superintending Engineer, Damanganga Project Circle,
Valsad and others participating in the 1st meeting at the level of Chief Engineers of Water Resources Departments of
Gujarat and Maharashtra Governments and NWDA held on 23rd September, 2011 at Ukai Dam to discuss the issue of water sharing in respect of Damanganga – Pinjal and Par – Tapi – Narmada link projects.
Issue of sharing of Damanganga water was further discussed during the
2nd
Meeting at the level of Chief Engineers held on 14th June, 2013 at Nasik.
As decided during the 1st Meeting held on 23
rd September, 2011 at Ukai dam,
the joint study on water availability of Damanganga-Pinjal Link Project was
carried out by representatives of Government of Gujarat and Maharashtra with
NWDA and CWC during November, 2011 at New Delhi. Based on this joint
study the water availability of Damanganga-Pinjal Link Project was revised
and circulated to Government of Gujarat and Maharashtra vide letter Nos.
NWDA/IC/V/T-115/941-50 dated 15th March, 2012, even No.3425-33 dated
17th October, 2012 and even No.1195-1202 dated 22
nd March, 2013 during the
meeting the water availability study of Damanganga-Pinjal Link Project was
discussed. After the detailed deliberations and water availability of
Damanganga-Pinjal Link Project and methodology adopted in the study was
accepted by both the States. The gross water availability at Bhugad and
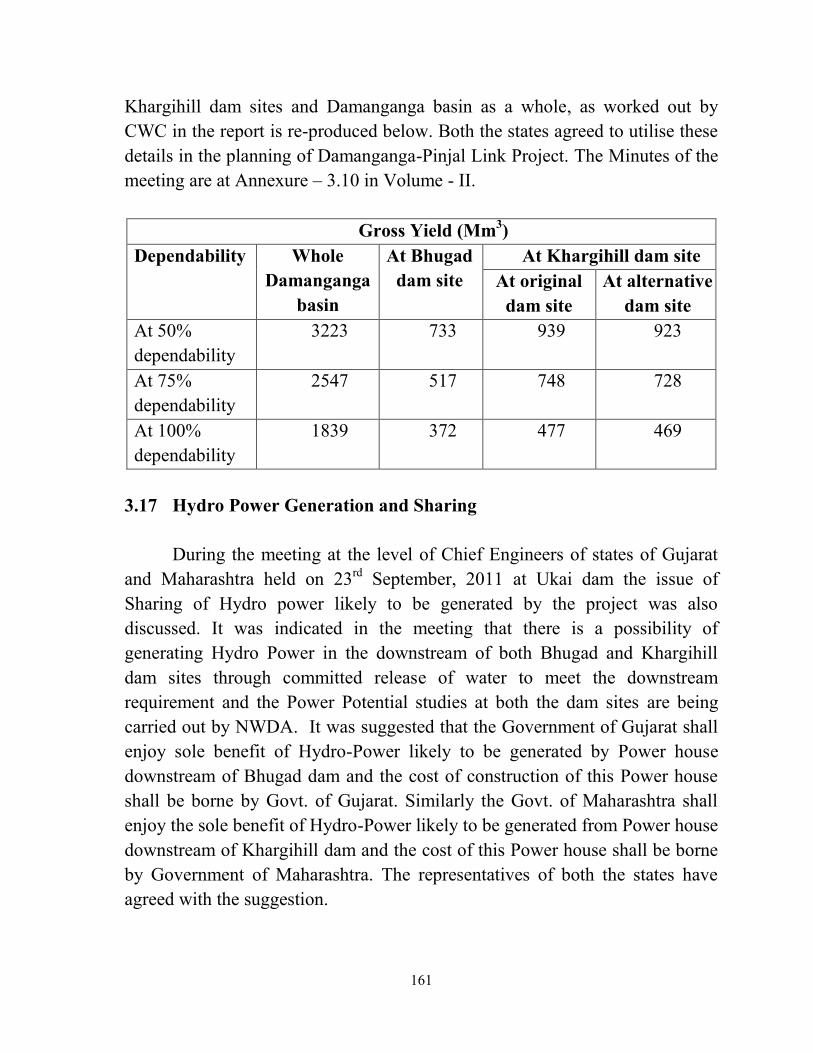
161
Khargihill dam sites and Damanganga basin as a whole, as worked out by
CWC in the report is re-produced below. Both the states agreed to utilise these
details in the planning of Damanganga-Pinjal Link Project. The Minutes of the
meeting are at Annexure – 3.10 in Volume - II.
Gross Yield (Mm3)
Dependability Whole
Damanganga
basin
At Bhugad
dam site
At Khargihill dam site
At original
dam site
At alternative
dam site
At 50%
dependability
3223 733 939 923
At 75%
dependability
2547 517 748 728
At 100%
dependability
1839 372 477 469
3.17 Hydro Power Generation and Sharing
During the meeting at the level of Chief Engineers of states of Gujarat
and Maharashtra held on 23rd
September, 2011 at Ukai dam the issue of
Sharing of Hydro power likely to be generated by the project was also
discussed. It was indicated in the meeting that there is a possibility of
generating Hydro Power in the downstream of both Bhugad and Khargihill
dam sites through committed release of water to meet the downstream
requirement and the Power Potential studies at both the dam sites are being
carried out by NWDA. It was suggested that the Government of Gujarat shall
enjoy sole benefit of Hydro-Power likely to be generated by Power house
downstream of Bhugad dam and the cost of construction of this Power house
shall be borne by Govt. of Gujarat. Similarly the Govt. of Maharashtra shall
enjoy the sole benefit of Hydro-Power likely to be generated from Power house
downstream of Khargihill dam and the cost of this Power house shall be borne
by Government of Maharashtra. The representatives of both the states have
agreed with the suggestion.
162
The Power Potential study at both Bhugad and Khargihill dams of
Damanganga – Pinjal link has been carried out through THDC, Rishikesh.
According to this study the power house in the down stream of proposed
Bhugad dam will have 2 units of 1.0 MW installed capacity each and the power
house in the down stream of proposed Khargihill dam will have 2 units of 1.5
MW installed capacity each.
3.18 Other Aspects
Apart from sharing of benefits from the project, other issues such as
sharing of the cost of the project, suitable mechanism for effective
implementation of the project and its operation are to be decided by the states
of Gujarat and Maharashtra mutually.