Embed Size (px)
Citation preview
CHAPTER 3: EXISTING CONDITIONS IN THE WATERSHEDS
San Diego River System The San Diego River System is comprised of Murray Reservoir, San Vicente
Reservoir, El Capitan Reservoir, Sutherland Reservoir and their respective
watersheds. The effective volumes of these reservoirs comprise over half of the
emergency water storage requirement for the City of San Diego. The reservoirs and
associated facilities are owned and operated by the City of San Diego. The
Alvarado Water Treatment Plant, located adjacent to Murray Reservoir, serves as a
terminus for this system (Figure 2-3.1).
The management of the water supply system typically attempts to restrict the
purchase of imported water and regulates the reservoir levels to maximize the use of
local water. Under all conditions, an emergency supply is maintained in the
reservoirs, should a failure occur to the imported water supply system.
All of the facilities associated with the conveyance of water from the San Diego River
System to the public are mainly natural watercourses which lie in the rural and
remote portions of the watershed. These natural conveyances are not likely to fail
due to age and deterioration. Some problems may be encountered in the pumping
process between the reservoirs and the Alvarado Water Treatment Plant. Since the
pumping process is localized, any problems which may occur can be prevented
through regular maintenance.
Murray Watershed Water Sources -
Murray Reservoir is important to the region for its supply from the SDCWA
Aqueduct System carrying Colorado River and State Project water to the San
Diego area. The primary function of the reservoir is to store imported water
and
Volume 2, Chapter 3 - 39 -Revised 3-1-06
act as the terminal storage reservoir for the water transferred from San
Vicente, El Capitan, and Sutherland Reservoirs via the El Monte Pipeline.
The Reservoir is surrounded by a "first-flush bypass system" which diverts
local runoff from the reservoir except for during large storm events. The
reservoir and associated facilities are owned and operated by the City of San
Diego.
Raw Water Reservoirs -
Murray Reservoir has the smallest capacity of all the reservoirs in the City
system. Murray Dam is a multiple arch, reinforced concrete structure, with a
42-foot-wide un-gated ogee crest spillway. The spillway capacity is 2,025
cubic feet per second (cfs). The dam crest has a length of 870 feet and
stands roughly 112 feet above the streambed. The reservoir has a storage
capacity of 4,818 acre-feet and a surface area of 172 acres at spillway crest
at 536 feet MSL.
Raw Water Intake and Conveyance Facilities -
The reservoir outlet consists of an independent wet tower with eight 30-inch
saucer valves for selective level draft control. Water is released from the
tower through a 48-inch outlet pipe located at the base of the dam. The water
through this outlet pipe is pumped to a bypass structure to the treatment
facility. The pipeline has a maximum draft rate of 90 cfs (58 mgd).
Treated Water Facilities -
All treatment facilities and treated water facilities for Murray Reservoir occur
at and beyond the Alvarado Water Treatment Plant. The plant is located
adjacent to Murray Reservoir and serves the Central area of the City. The
Plant treats imported water and local runoff from the San Diego River system.
The Alvarado Water Treatment Plant currently has 120 mgd capacity is of
conventional design with flocculation, filtration, and disinfection (chloramines).
The plant is operated in compliance with California's Chapter 17: Surface
Water Filtration and Disinfection Treatment Regulations. Alvarado Water
Volume 2, Chapter 3 - 40 -Revised 3-1-06
Treatment Plant is currently undergoing the Phase Two expansion project
scheduled for completion in 2006. This project will increase the capacity of
the plant to 200 mgd.
San Vicente Watershed Water Sources -
San Vicente Reservoir is important to the region for its supply from the
SDCWA Aqueduct System carrying Colorado River and State Project water to
the San Diego area. The primary function of the reservoir is to store imported
water, local runoff water from the surrounding 74.5-square-mile watershed,
and water transferred from Sutherland Reservoir located in the Hodges
Watershed via the Sutherland-San Vicente Pipeline (Figure 2-3.1). The
terminus of the Sutherland-San Vicente Pipeline empties into San Vicente
Creek at Daney Canyon, two miles north of the reservoir. The reservoir and
associated facilities are owned and operated by the City of San Diego. San
Vicente Reservoir can also be filled with water transferred from El Capitan
Reservoir via the Lakeside Pump Station Complex using the El Capitan - San
Vicente pipelines.
Water from San Vicente Reservoir is either transferred to Murray Reservoir or
directly to the Alvarado Water Treatment Plant for immediate use, via the
Lakeside Pump Station Complex using the San Vicente and El Monte
pipelines. In an effort to maximize the use of local water, an agreement
between the City and CWA stipulates that water placed in storage at San
Vicente by CWA is to be delivered to the City only after local water is used,
and that all water owned by CWA is to spill over the dam during a local storm
before any water owned by the City.
Raw Water Reservoirs -
San Vicente Reservoir has the second largest capacity of all the reservoirs in
the City system. San Vicente Dam is a straight concrete gravity structure with
Volume 2, Chapter 3 - 41 -Revised 3-1-06
a 275-foot-wide uncontrolled central over pour spillway. The spillway capacity
is 50,500 cubic feet per second (cfs). The dam crest has a length of 980 feet
and stands roughly 199 feet above the streambed. The reservoir has a
storage capacity of 89,312 acre-feet and a surface area of 1,069 acres at
spillway crest of 650 feet MSL. San Vicente Reservoir is in phase two of
expansion as part of the San Diego County Water Authority Emergency
Storage Project. During phase four scheduled for 2008 – 2012, the dam will
be raised an additional 160 feet.
Raw Water Intake and Conveyance Facilities -
The reservoir outlet consists of a semi-circular wet tower upstream of the dam
face with six 30-inch saucer valves for selective level draft control. Water is
released from the tower through three 36-inch cast iron outlet pipes with 30
inch plug valves located at the base of the dam. One of the 36-inch outlet
pipes enlarges to 42.5 inches and connects to San Vicente Pipeline No. 1.
The other two outlet pipes discharge to San Vicente Pipeline No. 2 (City,
1995(b)). These two pipelines carry water from the reservoir to the Lakeside
Pump Station. The San Vicente Pipelines have a maximum combined draft
rate of 118 cfs (76 million gallons per day (mgd)). From the Lakeside Pump
Station, the El Monte Pipeline carries water to the Alvarado Treatment Plant.
The El Monte Pipeline has a maximum draft rate of 156 cfs (100 mgd).
Treated Water Facilities -
All treatment facilities and treated water facilities for San Vicente Reservoir
occur at, and beyond, the Alvarado Water Treatment Plant.
El Capitan Watershed Water Sources -
El Capitan Reservoir serves as San Diego's largest local runoff storage
facility. The primary function of the reservoir is to store local runoff water from
the surrounding 190-square-mile watershed, and water transferred from Lake
Volume 2, Chapter 3 - 42 -Revised 3-1-06
Cuyamaca via Boulder Creek (Figure 2-3.1). The reservoir and associated
facilities are owned and operated by the City of San Diego.
El Capitan Reservoir can also be filled with water transferred from San
Vicente reservoir via the Lakeside Pump Station Complex, using the El
Capitan & San Vicente pipelines. Water from El Capitan Reservoir is either
transferred to Murray Reservoir or directly to the Alvarado Treatment Plant for
immediate use, via the Lakeside Pump Station Complex using the El Capitan
and El Monte pipelines.
The Lake Cuyamaca Dam, Lake Cuyamaca, and its associated facilities are
owned and operated by Helix Water District (HWD). Lake Cuyamaca is
supplied with local runoff from tributary streams. All water from Lake
Cuyamaca in El Capitan Reservoir belongs to HWD. Helix also has the right
to 27 cfs of Upper San Diego River runoff, which is separate and exclusive of
any water from Lake Cuyamaca. The water in El Capitan Reservoir owned by
HWD is transferred to the R.M. Levy Water Treatment Plant via the El Monte
Pump Station using the El Capitan Pipeline. The R.M. Levy Water Treatment
Plant is owned and operated by HWD. Helix has a right to a minimum flow of
20 mgd (Helix, 1995).
Raw Water Reservoirs -
El Capitan Reservoir has the largest capacity of all the reservoirs in the City
system. El Capitan Dam is a hydraulic fill rock embankment, with an
impervious clay core and a 510-foot-wide over pour spillway. The spillway
capacity is 170,600 cubic feet per second (cfs). The dam crest has a length
of 1,170 feet and stands roughly 217 feet above the streambed. The
reservoir has a storage capacity of 112,807 acre-feet and a surface area of
1,562 acres at spillway crest at 750 feet MSL.
Volume 2, Chapter 3 - 43 -Revised 3-1-06
Lake Cuyamaca maintains a tenth of the capacity of El Capitan Reservoir. Its
purpose is to collect runoff from the natural watercourses of its tributary
areas. Lake Cuyamaca Dam is an earth-fill embankment with a 30-foot-wide
rectangular spillway. The spillway capacity is approximately 4,540 cfs. The
dam crest has a length of 665 feet and stands approximately 33 feet above
the streambed. The reservoir has a storage capacity of 11,756 acre-feet with
a spillway crest at 4,635.6 ft MSL.
Raw Water Intake and Conveyance Facilities -Lake Cuyamaca outlet consists of a 36-inch steel pipeline extending in a
tunnel through the dam. Water is released into a concrete channel
downstream of the dam. Flowing downstream via Boulder Creek, the water is
collected in El Capitan Reservoir.
El Capitan Reservoir outlet consists of an outlet tunnel and a free standing
wet tower with six 30-inch saucer valves for selective level draft control.
Water is released from the tower through two 42-inch and two 36-inch saucer
valves located within the base of the tower. The 48-inch El Capitan Pipeline
extends through a tunnel toward the Lakeside Pump Station. The El Capitan
Pipeline has a maximum discharge rate of 344 cfs (222 mgd).
From the Lakeside Pump Station, the El Monte Pipeline carries water to the
Alvarado Water Treatment Plant. The El Monte Pipeline has a maximum
draft rate of 156 cfs (100 mgd).
Treated Water Facilities -
All treatment facilities and treated water facilities for El Capitan Reservoir
occur at and beyond the Alvarado Water Treatment Plant or the R.M. Levy
Water Treatment Plant (HWD).
Volume 2, Chapter 3 - 44 -Revised 3-1-06
Sutherland Watershed Water Sources -
Sutherland Reservoir is not a practical operational storage site due to its high
elevation and distance from the imported water aqueducts. The primary
function of the reservoir is to impound local runoff from the surrounding 53
square mile watershed and provide emergency storage for Ramona Municipal
Water District (RMWD).The reservoir and associated facilities are owned and
operated by the City of San Diego.
Water from Sutherland Reservoir is usually transferred to San Vicente
Reservoir in the spring, when the San Vicente streambed is wet, to avoid
water losses during transport. Generally, all water above RMWD's contract
pool is released, provided storage capacity is available at San Vicente
Reservoir. The City has contractual obligations to supply water from
Sutherland Reservoir to the Ramona Municipal Water District. Under the
terms of this contract, every October, the District reserves water above the
gauge height of 65 feet, for the upcoming water year.
During the bass spawning season (February through April), the City
schedules water transfers from Sutherland Reservoir to minimize interference
with spawning.
Raw Water Reservoir -
The Sutherland Dam is a multiple-arch, reinforced concrete structure with a
168-foot-long uncontrolled over pour spillway. The concrete-lined, Ogee-type
un-gated spillway is located on the eastern abutment of the dam and has a
design capacity of 41,220 cubic feet per second (cfs). The dam crest has a
length of 1,020 feet (1188 including spillway) and stands roughly 158 feet
(162 feet including 4-foot parapet) above the streambed. The reservoir has a
storage capacity of 29,684 acre-feet and a surface area of 556.8 acres at
spillway crest at 2,057 feet MSL.
Volume 2, Chapter 3 - 45 -Revised 3-1-06
Raw Water Intake and Conveyance Facilities -
The original Sutherland Dam outlet design consisted of a concrete box at the
tenth and eleventh arch, with two 36-inch outlet pipes behind trash racks.
Each outlet line was equipped with a 30-inch gate valve. Each outlet and gate
valve allowed flow to the 36-inch Sutherland-San Vicente Pipeline. A 24-inch
bypass pipeline can be used for a blow off and to control water release into
the downstream creek channel below the dam. The bypass has a 20-inch
plug valve at the end. In 1983, RMWD modified their 36-inch outlet with a
floating flexible line to permit withdrawal from the reservoir at any elevation.
The maximum discharge at Sutherland Reservoir outlet tower is 349 cfs (225
mgd) with blow offs or 101 cfs (65 mgd) without blow offs. The RMWD,
through a water use agreement with the City, drafts impounded water from
Sutherland Reservoir via a service connection off Sutherland-San Vicente
Pipeline.
Treated Water Facilities -
All treatment facilities and treated water facilities for Sutherland Reservoir
occur at and beyond the Alvarado Water Treatment Plant or the John C.
Bargar Water Treatment Plant (RMWD).
Emergency Plans -
There are no written emergency plans addressing accidental or intentional
disposal of contaminants to the raw water supply system for the City.
However, the City does have the following two procedures which are
understood policies, should an emergency occur relating to water quality:
• If a treatment plant cannot treat the water to an approved health standard
level, due to upstream contaminants or treatment plant failures, the treatment
Volume 2, Chapter 3 - 46 -Revised 3-1-06
• plant shall be shut down. Treated water shall then be re-directed to the
downed service area through the distribution system from other treatment
plants.
• If any emergency exists, the City has a chain of communication procedure for
notification of City staff.
Natural Settings Slope -
Slope is recognized as a critical factor in soil slips/landslides. In Southern
California a direct relationship exists between frequency of soil slips and
slope. USGS estimates that 70% of soil slips originate in slopes between 20°
and 36°.These soil slips have the potential to increase sedimentation in
streams and reservoirs.
Water falling on steeply-sloped land runs off with greater velocity and
infiltrates less than water falling on flat land. This response leads to increased
erosion and limits the soils natural ability to absorb contaminants. Information
on slope was derived from a digital elevation model provided by San Diego
Data Processing Corporation and United States Geological Survey (USGS).
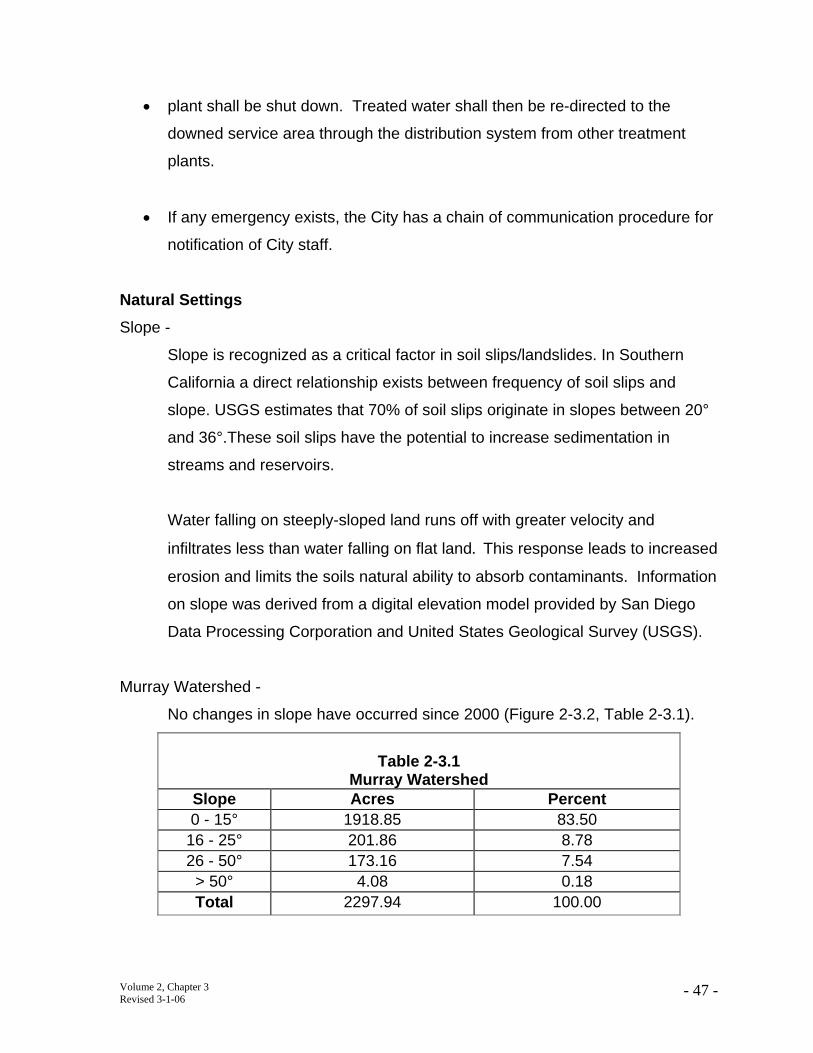
Murray Watershed -
No changes in slope have occurred since 2000 (Figure 2-3.2, Table 2-3.1).
Table 2-3.1 Murray Watershed
Slope Acres Percent 0 - 15° 1918.85 83.50
16 - 25° 201.86 8.78 26 - 50° 173.16 7.54
> 50° 4.08 0.18 Total 2297.94 100.00
Volume 2, Chapter 3 - 47 -Revised 3-1-06
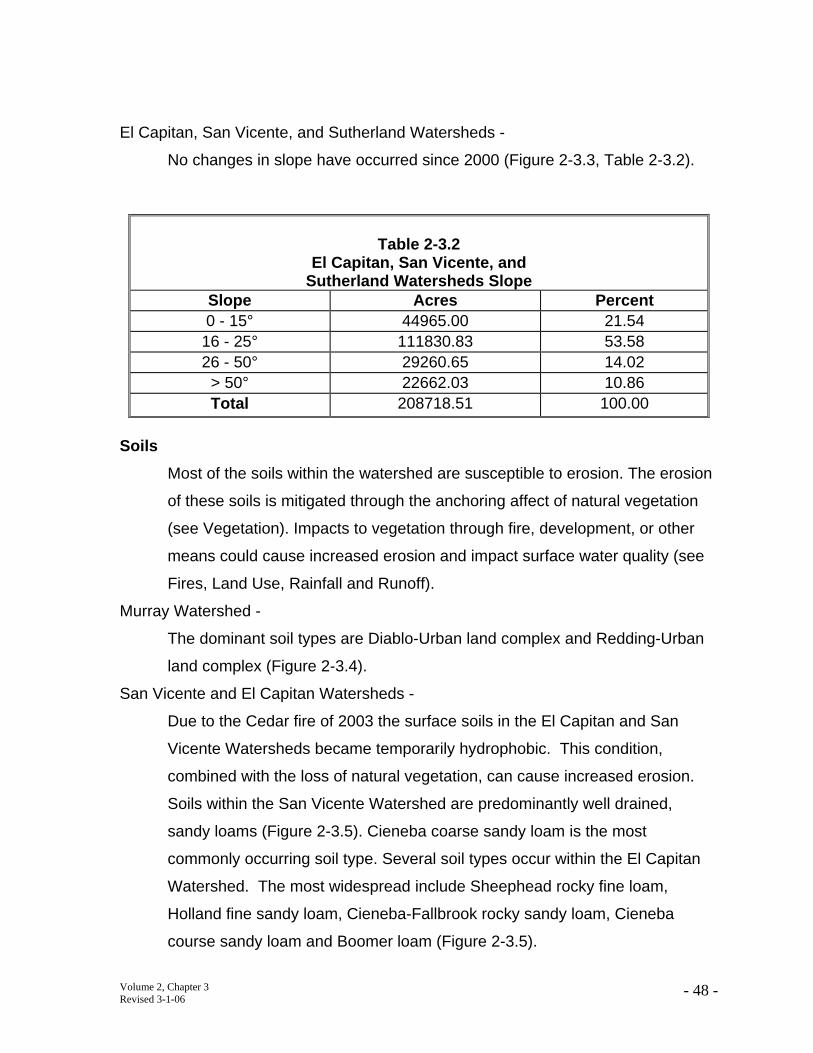
El Capitan, San Vicente, and Sutherland Watersheds -
No changes in slope have occurred since 2000 (Figure 2-3.3, Table 2-3.2).
Table 2-3.2 El Capitan, San Vicente, and
Sutherland Watersheds Slope Slope Acres Percent 0 - 15° 44965.00 21.54 16 - 25° 111830.83 53.58 26 - 50° 29260.65 14.02
> 50° 22662.03 10.86 Total 208718.51 100.00
Soils Most of the soils within the watershed are susceptible to erosion. The erosion
of these soils is mitigated through the anchoring affect of natural vegetation
(see Vegetation). Impacts to vegetation through fire, development, or other
means could cause increased erosion and impact surface water quality (see
Fires, Land Use, Rainfall and Runoff).
Murray Watershed -
The dominant soil types are Diablo-Urban land complex and Redding-Urban
land complex (Figure 2-3.4).
San Vicente and El Capitan Watersheds -
Due to the Cedar fire of 2003 the surface soils in the El Capitan and San
Vicente Watersheds became temporarily hydrophobic. This condition,
combined with the loss of natural vegetation, can cause increased erosion.
Soils within the San Vicente Watershed are predominantly well drained,
sandy loams (Figure 2-3.5). Cieneba coarse sandy loam is the most
commonly occurring soil type. Several soil types occur within the El Capitan
Watershed. The most widespread include Sheephead rocky fine loam,
Holland fine sandy loam, Cieneba-Fallbrook rocky sandy loam, Cieneba
course sandy loam and Boomer loam (Figure 2-3.5).
Volume 2, Chapter 3 - 48 -Revised 3-1-06
Sutherland Watershed -
Soils within the Sutherland Watershed are predominantly well drained, sandy
loams (Figure 2-3.5). The two most widespread soil types are Crouch sandy
loam and Holland fine sandy loam.
Vegetation Vegetation cover provides several ecological services pertinent to water
quality. The root systems of plants anchor soil that could otherwise erode into
streams and reservoirs (see Soils). Wetlands and other riparian plant
communities act as natural filters, removing suspended sediments and
contaminants. Sediments are trapped by densely growing wetland plants,
and many contaminants are absorbed or chemically altered by the vegetation.
The description of the different plant communities found in the watershed
(Sawer and Keeler-Wolf classification, 1995) and their respective response to
fire is from the 2003 Southern California Fires Burned Area Emergency
Stabilization and Rehabilitation Plan prepared by: Interagency Burned Area
Emergency Response Team November, 2003. The maps of vegetation
communities (Figures 2-3.6, 2-3.7, 2-3.8, Tables 2-3.3, 2-3.4, 2-3.5) have
been updated using current SanGIS data.
Oak Woodlands
Vegetation Types:
Oak woodlands typically occur in the foothills and transition into mixed
conifer/oak woodlands at higher elevations. Each community type can vary
from open savannas in broad valleys and rolling hills, to dense woodlands in
canyons and along streams. Oak woodlands are dominated by live oak trees
species that include Black Oak, Coast Live Oak, Engelmann Oak, and
Canyon Live Oak.
Volume 2, Chapter 3 - 49 -Revised 3-1-06
Response to Fire:
Oak woodlands have evolved with fire. Dense woodlands typically experience
low frequency stand destroying fires. Oak trees that experience some canopy
fire often survive unless the ground fire temperature is extreme enough to kill
the root system. The complex of species associated with dense oak
woodlands will either re-sprout or germinate from seed. Frequent or hot fires
can affect the seed bank and the root system of Oak Woodland species,
resulting in degraded habitat that is susceptible to habitat conversion.
Eucalyptus Woodland
Vegetation Types:
Eucalyptus Woodland is a non-native closed canopy community. This
community is typically a monotypic stand of Eucalyptus trees with a thick
mulch of Eucalyptus tree leaves.
Response to Fire:
Eucalyptus stands can be fire retardant to low intensity fires. Low intensity
fires will consume the leaf litter and can be carried into the canopy where
leaves are singed or tops are burned. High intensity fires are typically stand
destroying.
Forests
Vegetation Types:
Coniferous forests occur in the lower to upper montane zone in the Peninsula
Ranges. The lower montane forests typically include the Southern Interior
Cypress Forest, which is intermixed with oak woodlands and chaparral. Upper
montane forests include Coulter Pine Forest, Jeffery Pine Forest, and mixed
Sierran Forest. They range from pure stands of a single species, to mixed
conifer forests intermixed with oak woodlands and chaparral.
Response to Fire:
Montane forests are typically surrounded by chaparral or adjacent to forests
subject to fire, and are therefore susceptible to fire. When fires occur more
Volume 2, Chapter 3 - 50 -Revised 3-1-06
frequently than twenty-five years, Coulter pine habitat conversion to chaparral
may result. Jeffery Pine Forests and Mixed Coniferous Forests historically
experience periodic low-to-moderate intensity fires in the understory. Fuel
buildup due to fire suppression can increase the risk of stand replacing crown
fires.
Chaparral
Vegetation Types:
Chaparral occurs throughout the coastal lowlands, foothills, and montane
region. This community typically forms a dense, almost impenetrable shrub
community with no herbaceous layer. Chaparral is a highly variable plant
community that includes; Chamise Chaparral, Coastal Sage-Chaparral Scrub,
Mixed Chaparral, Montane Chaparral, Semi-desert Chaparral, and Scrub Oak
Chaparral.
Response to Fire:
Chaparral is a fire adapted community, that stump sprouts or germinates from
seed after a low-to–moderate intensity burn. Large fires often result in
homogenous stands of chaparral. Frequent fires and hot fires can burn the
root system and surface seed bank, resulting in a loss of diversity and low
density vegetative communities. For a few years after a fire, annual forbes
germinate and establish on site, until the woody shrubs mature.
Coastal Sage Scrub
Vegetation Types:
Locally, Coastal Sage Scrub consists of low, woody soft-shrubs and is
classified as Diegan Coastal Sage Scrub (DCSS). DCSS is dominated by
California sagebrush and/or flat-topped buckwheat and often intergrades with
Chaparral communities.
Response to Fire:
DCSS species are fire adapted and quickly regenerate from seed after a fire.
However, frequent fires in an area can reduce the seed bank for native shrub
Volume 2, Chapter 3 - 51 -Revised 3-1-06
species and increase the presence of non-native grasses and forbs resulting
in degraded habitat. Once this habitat conversion occurs, DCSS species
typically do not re-colonize the area due to competition from dense
populations of invasive grasses that increase the fire frequency. Areas with
moderate to highly degraded DCSS may convert to non-native grasslands
due to the 2003 fires.
Big Sagebrush Scrub
Vegetation Types:
Locally, big sagebrush is dominated by; flat-topped buckwheat, broom
snakeweed, deerweed, sawtoothed goldenbrush, and includes a variety of
DCSS species.
Response to Fire:
The fire ecology of Big Sagebrush Scrub in eastern San Diego County is not
well documented. Many of the associates in this community occur in DCSS
and are fire adapted. Frequent fire in the vegetative community will result in
habitat conversion to non-native grasslands.
Grasslands
Vegetation Types:
Perennial Grasslands vary among Valley Needlegrass and Valley Sacaton
grasslands. Valley Needle Grassland is dominated by the tussock forming
purple needlegrass, with a variety of native forbs including colar lupin,
rancher’s fireweed, and adobe popcorn-flower; and the native bunchgrasses,
foothill needle grass, and coast range melic. The species composition can
vary as it transitions into the foothills and montane zone. Valley Sacaton
Grassland is dominated by sacton or salt grass. This community typically
occurs in the areas with a high seasonal water table and is often associated
with Alkali Seeps and Alkali Meadows. Non-native grasslands are dominated
by Red brome, Ripgut brome, and Softchess brome. Non native grasslands
often intergrade with open oak woodlands and disturbed DCSS communities.
Volume 2, Chapter 3 - 52 -Revised 3-1-06
Response to Fire:
Grassland communities in San Diego County have evolved with, and are
typically maintained by fire. Fire in non-native grasslands maintains
dominance by invasive grasses and prevents establishment by native shrub
species.
Meadows
Vegetation Types:
Montane Meadows occur in the montane zone and are dense growth of
sedges and perennial herbs that experience wet cold winters. Montane
Meadows are typically interspersed with montane forests. Wildflower Field is
an amorphous community of herbaceous plant species where dominance
varies from site to site and year to year, depending on climatic factors.
Wildflower Field is typically associated with grasslands and oak woodlands in
the valleys and foothills.
Response to Fire:
Wet meadows typically do not burn since the moisture content in the plants
and soils retard fire advance. During drought times and in dry meadows fire
will quickly burn through these communities. Fall fires typically have little
impact on local meadows since most plants are dry and have dispersed their
seed.
Riparian
Vegetation Types:
Riparian communities vary depending on the aquatic system they are
associated with and can have seral stages of community succession. Mulefat
Scrub and Southern Willow Scrub are typically early seral stages for Southern
Cottonwood-Willow Riparian Forest, which develops into Southern Coast Live
Oak Riparian Forest. In steep drainages, Mulefat Scrub and Southern Willow
Scrub may be early stages for Southern Sycamore-Alder Riparian Forest or
White Alder Riparian Forest.
Volume 2, Chapter 3 - 53 -Revised 3-1-06

Response to Fire:
Riparian communities often resist fire since riparian species do not
experience drought. During drought, riparian species become more
susceptible to fire. Stand destroying fires can assimilate flooding events in
that they set communities back to early seral stages. Stump sprouting species
can reestablish in the early successional communities. Most mature trees that
experience high intensity fires will die.
Wetlands
Vegetation Types:
Wetland communities are highly variable. Riparian and Wet Meadows are
communities that can establish in areas with sufficient hydrology to be
considered wetlands. In addition, emergent wetlands occur along seeps and
as emergent wetlands in shallow water. These wetlands include Alkali Seep,
Freshwater Seep, and Freshwater Marsh.
Response to fire:
Historically, fire impacts to wetlands in San Diego County are not
documented. Wetlands typically do not experience fire. Many wetland species
are rhizomous and will likely survive fires. Woody species in scrub and
forested wetlands may recover from fire by epicormic sprouting from stems or
basal sprouting from roots.
Murray Watershed -
Native vegetation identified within the Murray Watershed includes scrub and
chaparral, and grasslands (Figure 2-3.6, Table 2-3.3). The remainder of the
watershed is developed for urban uses, which could negatively impact water
quality (see Land Use, Rainfall and Runoff). Riparian and wetland habitats
identified within the Murray Watershed include a small Freshwater Marsh at
the northern edge of Murray Reservoir, and Willow Scrub east of the
reservoir.
Volume 2, Chapter 3 - 54 -Revised 3-1-06
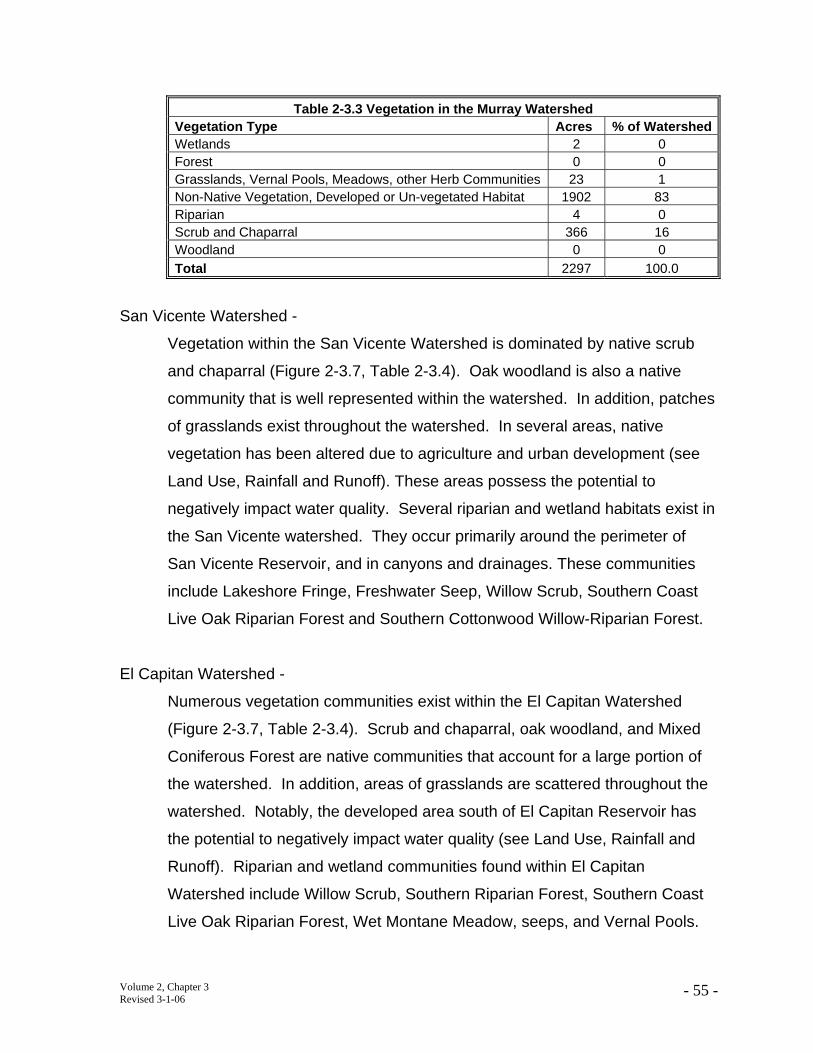
Table 2-3.3 Vegetation in the Murray Watershed Vegetation Type Acres % of Watershed Wetlands 2 0 Forest 0 0 Grasslands, Vernal Pools, Meadows, other Herb Communities 23 1 Non-Native Vegetation, Developed or Un-vegetated Habitat 1902 83 Riparian 4 0 Scrub and Chaparral 366 16 Woodland 0 0 Total 2297 100.0
San Vicente Watershed -
Vegetation within the San Vicente Watershed is dominated by native scrub
and chaparral (Figure 2-3.7, Table 2-3.4). Oak woodland is also a native
community that is well represented within the watershed. In addition, patches
of grasslands exist throughout the watershed. In several areas, native
vegetation has been altered due to agriculture and urban development (see
Land Use, Rainfall and Runoff). These areas possess the potential to
negatively impact water quality. Several riparian and wetland habitats exist in
the San Vicente watershed. They occur primarily around the perimeter of
San Vicente Reservoir, and in canyons and drainages. These communities
include Lakeshore Fringe, Freshwater Seep, Willow Scrub, Southern Coast
Live Oak Riparian Forest and Southern Cottonwood Willow-Riparian Forest.
El Capitan Watershed -
Numerous vegetation communities exist within the El Capitan Watershed
(Figure 2-3.7, Table 2-3.4). Scrub and chaparral, oak woodland, and Mixed
Coniferous Forest are native communities that account for a large portion of
the watershed. In addition, areas of grasslands are scattered throughout the
watershed. Notably, the developed area south of El Capitan Reservoir has
the potential to negatively impact water quality (see Land Use, Rainfall and
Runoff). Riparian and wetland communities found within El Capitan
Watershed include Willow Scrub, Southern Riparian Forest, Southern Coast
Live Oak Riparian Forest, Wet Montane Meadow, seeps, and Vernal Pools.
Volume 2, Chapter 3 - 55 -Revised 3-1-06
These communities are found mostly around the edge of the lake and in
canyons and drainages. Vernal pools exist near the eastern border of the
watershed, near Cuyamaca Reservoir.
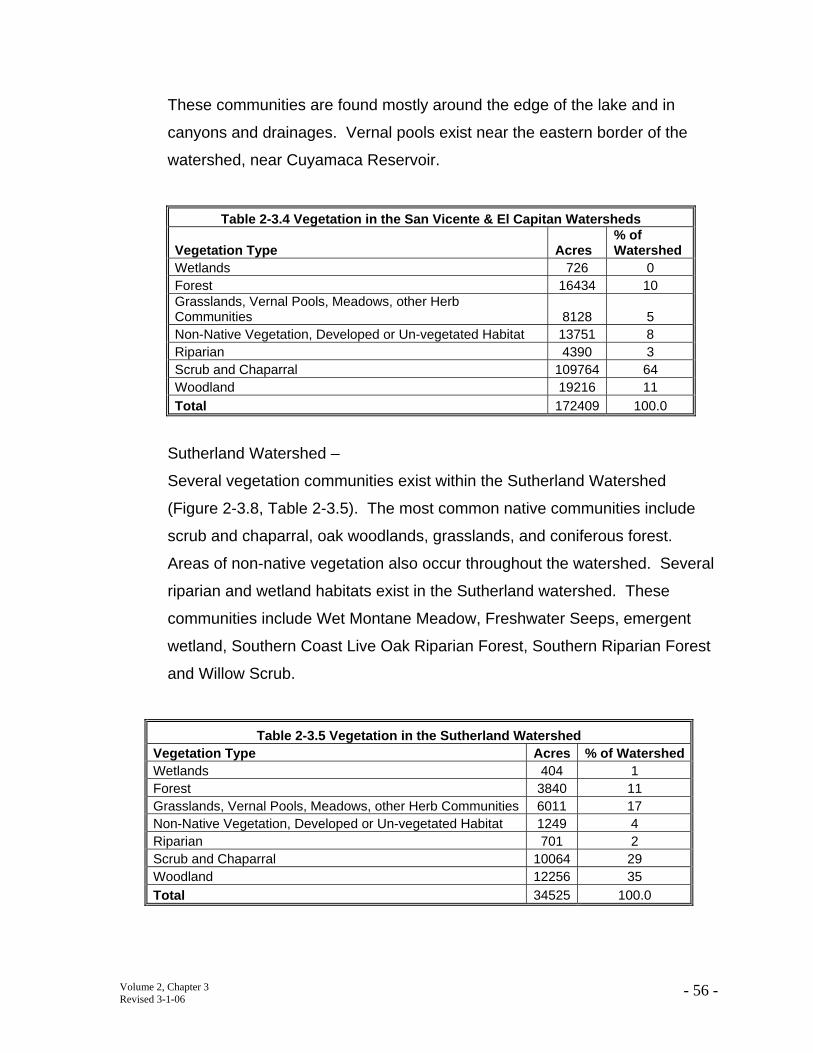
Table 2-3.4 Vegetation in the San Vicente & El Capitan Watersheds
Vegetation Type Acres % of Watershed
Wetlands 726 0 Forest 16434 10 Grasslands, Vernal Pools, Meadows, other Herb Communities 8128 5 Non-Native Vegetation, Developed or Un-vegetated Habitat 13751 8 Riparian 4390 3 Scrub and Chaparral 109764 64 Woodland 19216 11 Total 172409 100.0
Sutherland Watershed –
Several vegetation communities exist within the Sutherland Watershed
(Figure 2-3.8, Table 2-3.5). The most common native communities include
scrub and chaparral, oak woodlands, grasslands, and coniferous forest.
Areas of non-native vegetation also occur throughout the watershed. Several
riparian and wetland habitats exist in the Sutherland watershed. These
communities include Wet Montane Meadow, Freshwater Seeps, emergent
wetland, Southern Coast Live Oak Riparian Forest, Southern Riparian Forest
and Willow Scrub.
Table 2-3.5 Vegetation in the Sutherland Watershed Vegetation Type Acres % of Watershed Wetlands 404 1 Forest 3840 11 Grasslands, Vernal Pools, Meadows, other Herb Communities 6011 17 Non-Native Vegetation, Developed or Un-vegetated Habitat 1249 4 Riparian 701 2 Scrub and Chaparral 10064 29 Woodland 12256 35 Total 34525 100.0
Volume 2, Chapter 3 - 56 -Revised 3-1-06
Rainfall and Runoff The climate of San Diego County is classified as a Mediterranean dry
summer type, where 90% of the annual rainfall occurs between the months of
November and April. Annual precipitation varies from 9 inches at the coast to
25 inches near the mountains. Storm water runoff occurs when water from
rain or snowmelt flows over the ground. Impervious surfaces like driveways,
sidewalks, streets and parking lots prevent the runoff from naturally soaking
into the ground. Storm water runoff can collect debris, sediment, nutrients,
bacteria, pathogens, chemicals and deposit them directly into a lake, stream,
river, wetland, or coastal water.
Rainfall and Runoff information in this section was supplied by the City of San
Diego Water Department, Hydrography Section. Rainfall data is collected at
each reservoir by a weather station. Runoff data is estimated monthly by
measuring the following: amount of rainfall, rain amount on surface of lake,
other inputs, evaporation, draft, leaks, and change in lake level.
San Diego River System Watersheds -
Table 2-3.6 shows annual rainfall and runoff at each of the reservoirs within
the San Diego river watershed. Rainfall totals for years 2001-2003 were
average or below average. The winter of 2004-2005 was the third wettest on
record.
Volume 2, Chapter 3 - 57 -Revised 3-1-06
Table 2-3.6 Rainfall and Estimated Runoff for San Diego River System Reservoirs
Reservoir Year Rainfall (in.) Runoff Entering Reservoirs (M.G.) El Capitan 2001 14.83 1254.2
2002 9.5 38.9 2003 14.35 1356.28 2004 20.33 2875.07 2005 16.05 15595.92
San Vicente 2001 15.18 53.73 2002 8.91 278.31 2003 14.22 586.12 2004 18.17 1996.37 2005 17.5 6051.19
Sutherland 2001 20.65 225.47 2002 12.61 19.91 2003 21.65 219.52 2004 24.73 107.72 2005 24.82 6379.79
Murray 2001 10.92 0 2002 9.38 0 2003 11.48 69.92 2004 14.82 0 2005 15.48 0
Fires The California Department of Forestry (CDF) addresses all large brush fires
within the watershed. The local fire districts handle structural fires only. CDF
has an extensive fire prevention plan which includes three fire safe
guidelines: residential, railway, and electrical power lines. CDF also provides
an evaluation of burned sites and a re-growth plan to prevent erosion
immediately following a fire.
Fire can indiscriminately devastate certain vegetation and wildlife
communities, but is very important to the sage scrub and chaparral
communities. Many taxa of coastal sage scrub plants are adapted to fire by
Volume 2, Chapter 3 - 58 -Revised 3-1-06
stump sprouting or high seed production (Skinner et al., 1994). Similarly,
many chaparral plants are adapted to frequent fires either through resprouting
or seed carry-over (see Vegetation). While these communities are adapted to
fire and usually recover in three to five years following such an event, the
soils are subject to increased erosion immediately following a burn (see
Soils).
Sediment from the burned areas can impact streams and the aquatic
organisms within those streams, ultimately feeding into reservoirs where
sediment loads may affect treatment procedures. Control of large fires is
important from both a preservation perspective as well as a watershed
management perspective.
The fire and water districts in the watershed do not measure the water quality
impacts of the runoff from burned areas (Calhoun, Justice, Bratton, 1995). In
most cases the County Office of Emergency Response or the local Fire
Department contacts the RWQCB to visit the site after the fire is contained.
The RWQCB participates in assessing the impact of the fire on the surface
water quality, and will determine if monitoring is necessary.
Fire information in this report is supplied by the California Department of
Forestry. The current data available from CDF is through December 31, 2004.
San Diego River System Watersheds -
Since 2000, there have been three fires in the San Diego River System
Watersheds (Table 2-3.7). The Peak and Pines fires were relatively small and
located in the outermost regions of the watershed; no effect on the water
quality was observed. On October 25, 2003 the Cedar fire (Figure2-3.9)
started and by the time it was contained it had burned 270,685 acres, which is
Volume 2, Chapter 3 - 59 -Revised 3-1-06
the largest fire in the history of California. The fire burned 98% of the San
Vicente Watershed and 94% of the El Capitan Watershed. The fire destroyed
2,232 residential structures, as well as another 588 outbuildings and other
structures. The staff of the City of San Diego Water Department, which
monitories the water quality of El Capitan, San Vicente and Sutherland
Watersheds, observed significant sedimentation in these Watersheds from
the burn areas (City Staff, personal communication). These effects were
especially evident during the winter of 2004-2005 when San Diego County
experienced near record rainfall. Murray Watershed had no fires since 2000.
Table 2-3.7 San Vicente, El Capitan, and Sutherland Watershed Fires Name Alarm Date Acres Burned Cedar 10/25/2003 160,906 Peak 8/9/2002 245 Pines 7/29/2002 616
SUMMARY OF POTENTIAL CONTAMINANT SOURCES
Land Use -
The section on land use includes; land ownership, category of land use, and
population density.
Land Ownership
The land ownership information discussed in this section is primarily derived
from SanGIS data. SanGIS maintains a database of land ownership
information, by parcel, for San Diego County.
Murray Watershed:
The pattern of land ownership in the Murray Watershed has not changed in
the last five years (Figure 2-3.10, Table 2-3.8). Approximately 44% of the
watershed is privately owned and urbanized.
Volume 2, Chapter 3 - 60 -Revised 3-1-06
Table 2-3.8 Land Ownership in Murray Watershed Ownership Category Area (acres) % of Watershed Indian Reservation 0 0.0 Publicly Owned Local 1251 54.4 State 31 1.3 Federal 1 0.0 Subtotal Publicly owned 1283 55.8 Private 1015 44.2 Total 2298 100
San Vicente Watershed:
Approximately 27% of San Vicente Watershed is currently in public ownership
(Figure 2-3.11, Table 2-3.9). Indian Reservation landownership accounts for
13.5% of the watershed. The San Diego Water Department owns 6.8% of the
land within the watershed.
Table 2-3.9 Land Ownership in San Vicente Watershed
Ownership Category Area (acres) % of Watershed Indian Reservation 6420 13.5 Publicly Owned Local 6187 13.0 State 1422 3.0 Federal 5435 11.4
Subtotal Publicly owned 13044 27.4 Private 28077 59.1 Total 47541 100
El Capitan Watershed:
Approximately 52% of El Capitan Watershed is currently in public ownership
(Figure 2-3.11, Table 2-3.10). Indian Reservation landownership accounts for
13.6% of the watershed. The San Diego Water Department owns 3.3% of the
land within the watershed.
Volume 2, Chapter 3 - 61 -Revised 3-1-06
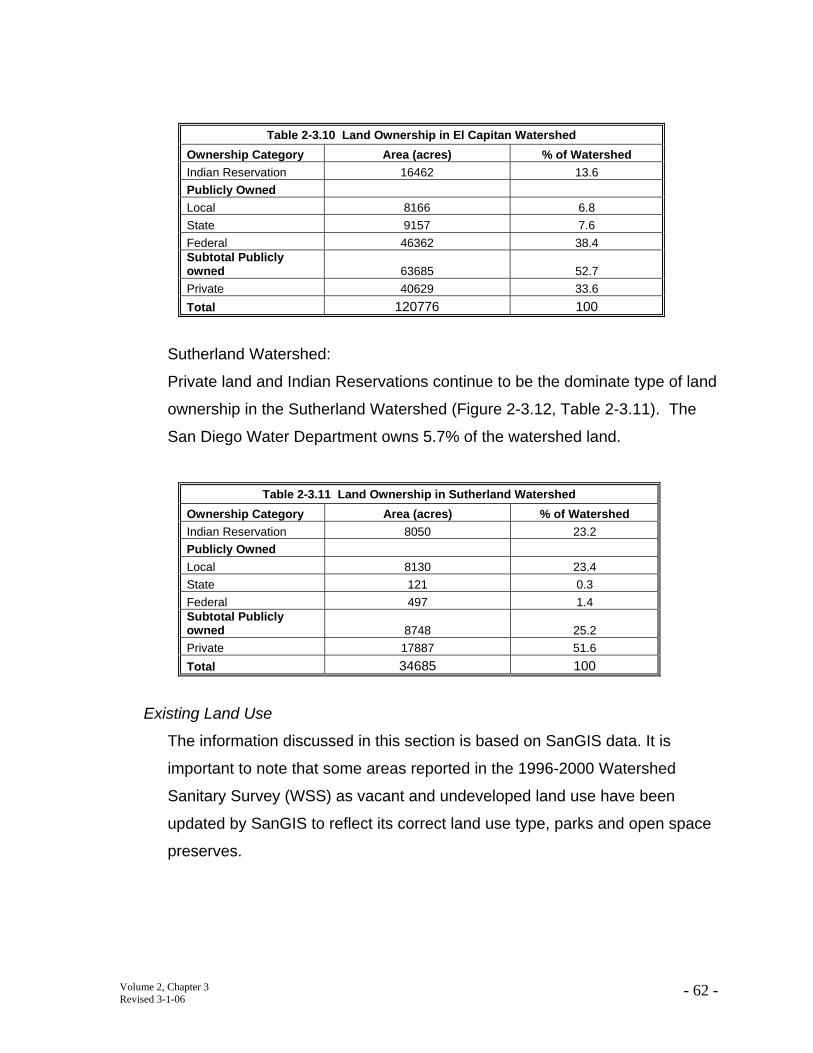
Table 2-3.10 Land Ownership in El Capitan Watershed Ownership Category Area (acres) % of Watershed Indian Reservation 16462 13.6 Publicly Owned Local 8166 6.8 State 9157 7.6 Federal 46362 38.4 Subtotal Publicly owned 63685 52.7 Private 40629 33.6 Total 120776 100
Sutherland Watershed:
Private land and Indian Reservations continue to be the dominate type of land
ownership in the Sutherland Watershed (Figure 2-3.12, Table 2-3.11). The
San Diego Water Department owns 5.7% of the watershed land.
Table 2-3.11 Land Ownership in Sutherland Watershed Ownership Category Area (acres) % of Watershed Indian Reservation 8050 23.2 Publicly Owned Local 8130 23.4 State 121 0.3 Federal 497 1.4 Subtotal Publicly owned 8748 25.2 Private 17887 51.6 Total 34685 100
Existing Land Use
The information discussed in this section is based on SanGIS data. It is
important to note that some areas reported in the 1996-2000 Watershed
Sanitary Survey (WSS) as vacant and undeveloped land use have been
updated by SanGIS to reflect its correct land use type, parks and open space
preserves.
Volume 2, Chapter 3 - 62 -Revised 3-1-06
Murray Watershed:
Land use in the Murray Watershed has experienced little change since 2000
(Figure 2-3.13, Table 2-3.12). Murray Watershed is highly urbanized with
approximately 29% of its land use type fitting into the categories of parks and
open space and water. Approximately 41% of the watershed consists of
residential developments, while commercial, institutional and other types of
urban development comprise an additional 30% (see Rainfall and Runoff). No
commercial agriculture occurs in the Murray Watershed.
Table 2-3.12 Existing Land Use in the Murray Watershed Land Use Category Area (acres) % of Watershed Commercial Recreation 146.02 6.35 Commercial 42.68 1.86 Parks 498.19 21.68 Schools, Hospitals, Public & Private Institutions 105.95 4.61 Multi Family Residential 81.41 3.54 Single Family Residential 854.95 37.21
Transportation, Communication & Utilities 391.15 17.02 Water 177.17 7.71 Subtotal 2297.52 99.98 Vacant & Undeveloped 0.42 0.02 Total 2297.94 100.00
San Vicente Watershed:
Land use in the San Vicente Watershed has experienced little change since
2000 (Figure 2-3.14, Table 2-3.13). San Vicente Watershed is relatively
undeveloped with 84% of its land use type fitting into the following categories:
vacant and undeveloped (60%), parks and open space preserves (22%), and
water (2%). Approximately 10% of the watershed is devoted to residential and
urban uses, which is a 1% increase since 2000. These areas include
residential, commercial, and industrial developments in Ramona and San
Diego Country Estates subdivision (see Rainfall and Runoff). Agriculture
accounts for approximately 4% of the land area in the San Vicente
Watershed.
Volume 2, Chapter 3 - 63 -Revised 3-1-06
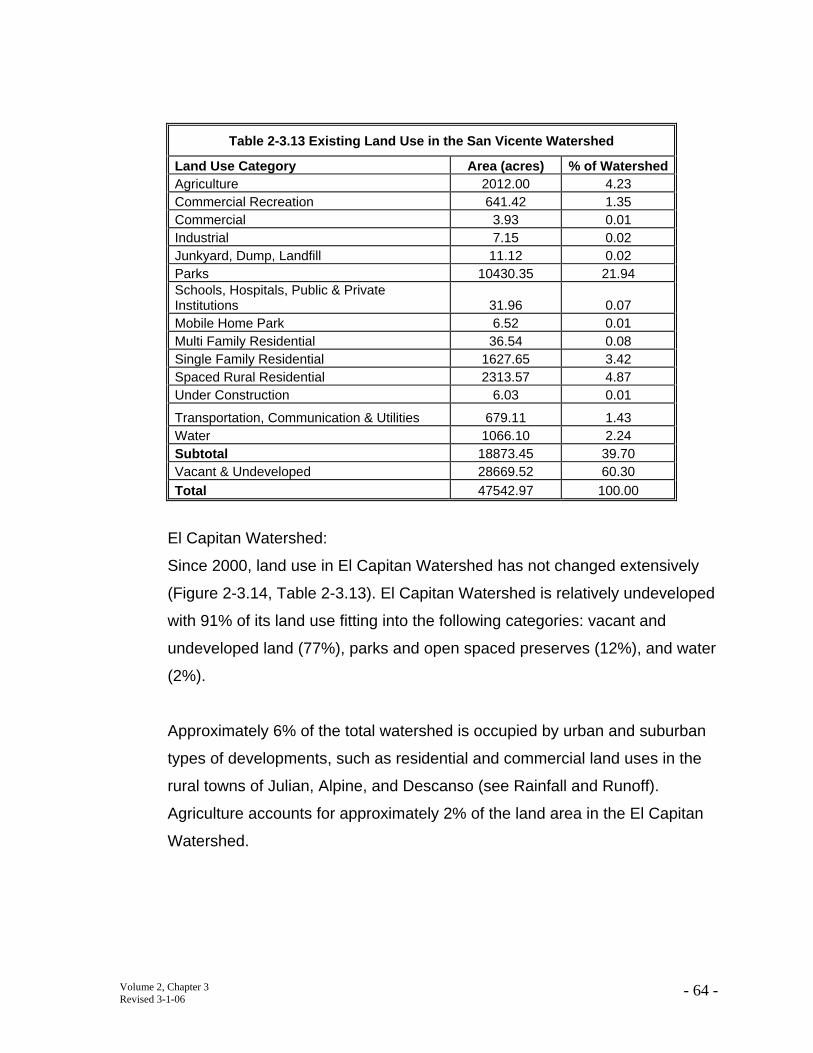
Table 2-3.13 Existing Land Use in the San Vicente Watershed
Land Use Category Area (acres) % of Watershed Agriculture 2012.00 4.23 Commercial Recreation 641.42 1.35 Commercial 3.93 0.01 Industrial 7.15 0.02 Junkyard, Dump, Landfill 11.12 0.02 Parks 10430.35 21.94 Schools, Hospitals, Public & Private Institutions 31.96 0.07 Mobile Home Park 6.52 0.01 Multi Family Residential 36.54 0.08 Single Family Residential 1627.65 3.42 Spaced Rural Residential 2313.57 4.87 Under Construction 6.03 0.01
Transportation, Communication & Utilities 679.11 1.43 Water 1066.10 2.24 Subtotal 18873.45 39.70 Vacant & Undeveloped 28669.52 60.30 Total 47542.97 100.00
El Capitan Watershed:
Since 2000, land use in El Capitan Watershed has not changed extensively
(Figure 2-3.14, Table 2-3.13). El Capitan Watershed is relatively undeveloped
with 91% of its land use fitting into the following categories: vacant and
undeveloped land (77%), parks and open spaced preserves (12%), and water
(2%).
Approximately 6% of the total watershed is occupied by urban and suburban
types of developments, such as residential and commercial land uses in the
rural towns of Julian, Alpine, and Descanso (see Rainfall and Runoff).
Agriculture accounts for approximately 2% of the land area in the El Capitan
Watershed.
Volume 2, Chapter 3 - 64 -Revised 3-1-06
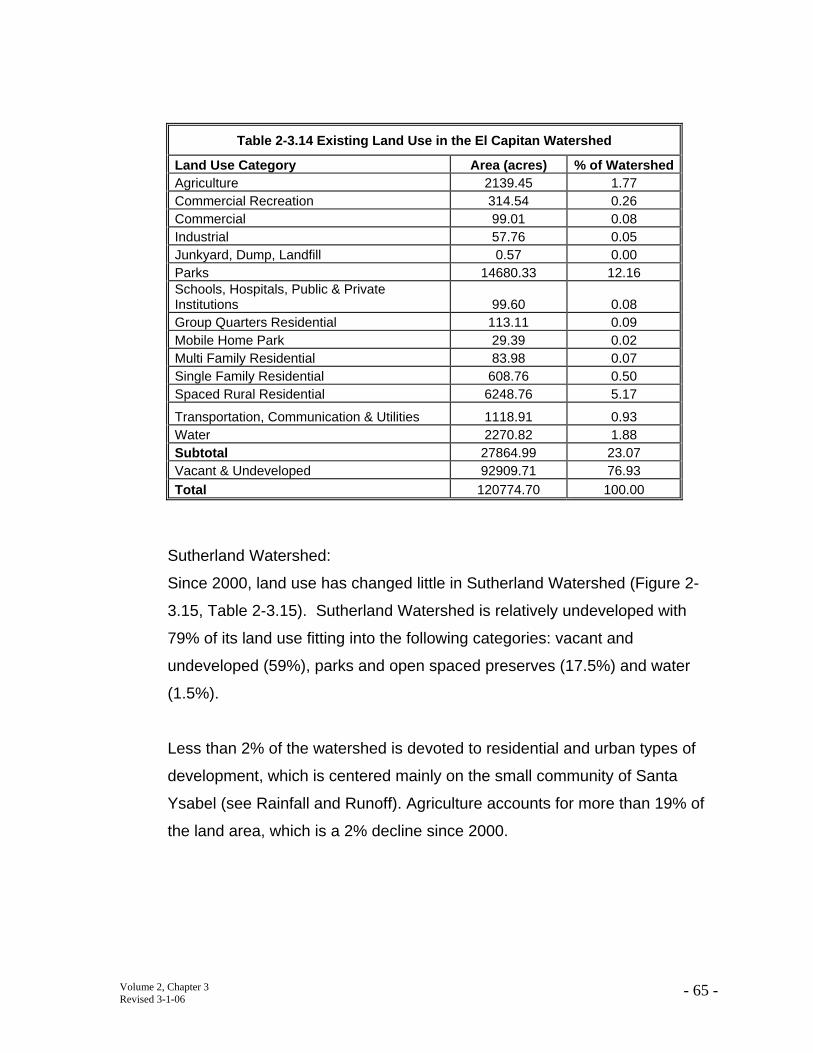
Table 2-3.14 Existing Land Use in the El Capitan Watershed
Land Use Category Area (acres) % of Watershed Agriculture 2139.45 1.77 Commercial Recreation 314.54 0.26 Commercial 99.01 0.08 Industrial 57.76 0.05 Junkyard, Dump, Landfill 0.57 0.00 Parks 14680.33 12.16 Schools, Hospitals, Public & Private Institutions 99.60 0.08 Group Quarters Residential 113.11 0.09 Mobile Home Park 29.39 0.02 Multi Family Residential 83.98 0.07 Single Family Residential 608.76 0.50 Spaced Rural Residential 6248.76 5.17
Transportation, Communication & Utilities 1118.91 0.93 Water 2270.82 1.88 Subtotal 27864.99 23.07 Vacant & Undeveloped 92909.71 76.93 Total 120774.70 100.00
Sutherland Watershed:
Since 2000, land use has changed little in Sutherland Watershed (Figure 2
3.15, Table 2-3.15). Sutherland Watershed is relatively undeveloped with
79% of its land use fitting into the following categories: vacant and
undeveloped (59%), parks and open spaced preserves (17.5%) and water
(1.5%).
Less than 2% of the watershed is devoted to residential and urban types of
development, which is centered mainly on the small community of Santa
Ysabel (see Rainfall and Runoff). Agriculture accounts for more than 19% of
the land area, which is a 2% decline since 2000.
Volume 2, Chapter 3 - 65 -Revised 3-1-06
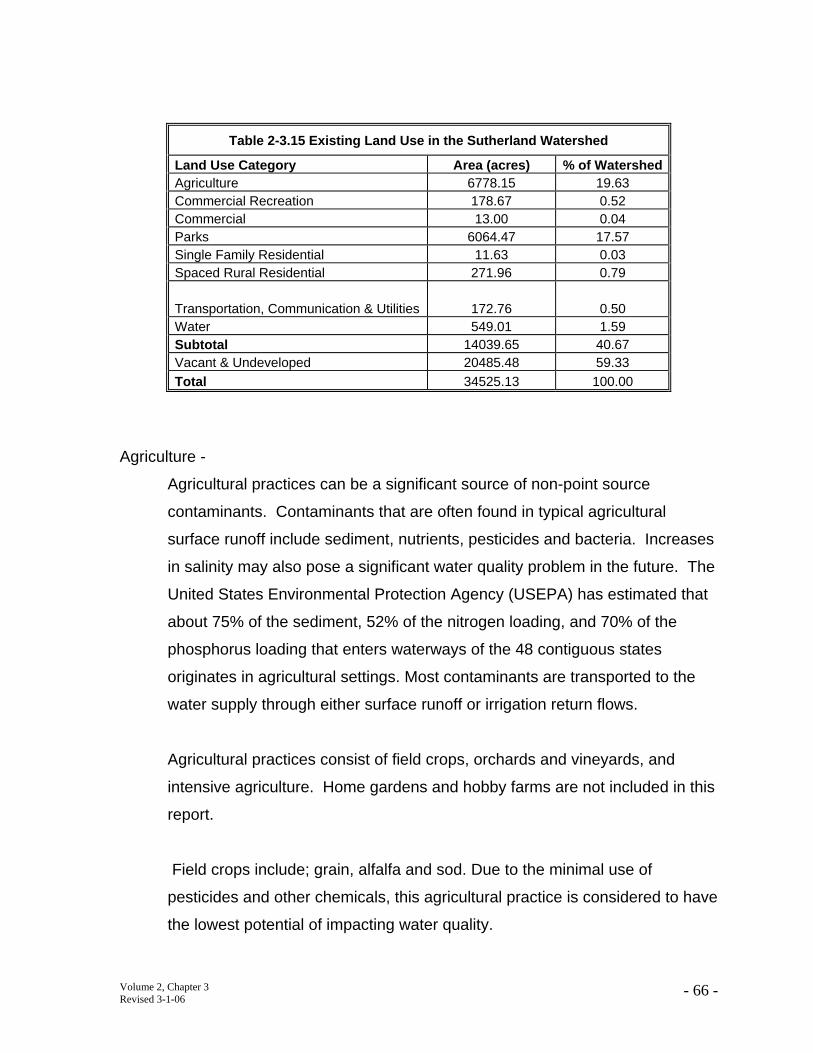
Table 2-3.15 Existing Land Use in the Sutherland Watershed
Land Use Category Area (acres) % of Watershed Agriculture 6778.15 19.63 Commercial Recreation 178.67 0.52 Commercial 13.00 0.04 Parks 6064.47 17.57 Single Family Residential 11.63 0.03 Spaced Rural Residential 271.96 0.79
Transportation, Communication & Utilities 172.76 0.50 Water 549.01 1.59 Subtotal 14039.65 40.67 Vacant & Undeveloped 20485.48 59.33 Total 34525.13 100.00
Agriculture -
Agricultural practices can be a significant source of non-point source
contaminants. Contaminants that are often found in typical agricultural
surface runoff include sediment, nutrients, pesticides and bacteria. Increases
in salinity may also pose a significant water quality problem in the future. The
United States Environmental Protection Agency (USEPA) has estimated that
about 75% of the sediment, 52% of the nitrogen loading, and 70% of the
phosphorus loading that enters waterways of the 48 contiguous states
originates in agricultural settings. Most contaminants are transported to the
water supply through either surface runoff or irrigation return flows.
Agricultural practices consist of field crops, orchards and vineyards, and
intensive agriculture. Home gardens and hobby farms are not included in this
report.
Field crops include; grain, alfalfa and sod. Due to the minimal use of
pesticides and other chemicals, this agricultural practice is considered to have
the lowest potential of impacting water quality.
Volume 2, Chapter 3 - 66 -Revised 3-1-06
Orchards and Vineyards include; apples, avocados, citrus, grapes and other
non-evergreen fruit, while intensive farm plots include; row crops such as
herbs, vegetables, poultry ranches, and dairy farms. Due to their reliance on
pesticides and other chemicals, these practices are considered to have a
greater potential of impacting water quality.
Poultry ranches are regulated by the San Diego County Department of
Environmental Health for fly breeding and facilities are inspected yearly.
Poultry Farms do not discharge a significant amount of wastewater, but
impact to water quality is possible during periods of rain when runoff could
carry manure into nearby drainages. Manure management methods include
frequent cleaning, drying and coning. Manure is generally spread on the
ground to dry, pushed into windrows and then removed from the ranch.
Dairy farms are permitted by the Regional Water Quality Control Board
(RWQCB) and facilities are inspected quarterly. The RWQCB issues orders
specific to individual dairies. These orders contain facility designs, operation
specifications and discharge specifications, along with other guidelines for
complying with the Watershed Basin Plan. Dairy farms are then required to
submit quarterly reports to the RWQCB that describe herd size, manure
disposal, groundwater monitoring results including nitrates and dissolved
solids. Milk cows, corrals and barns are generally washed daily. Dairies
typically have retention ponds for wastewater discharge which, during periods
of rain, could overflow and impact the water quality of nearby streams.
The information discussed in this section is based on SanGIS data and two
layers created by RECON Environmental Consultants using information from
the San Diego County Department of Environmental Health and RWQC.
Volume 2, Chapter 3 - 67 -Revised 3-1-06

Murray Watershed:
Agricultural practices in the Murray Watershed consist only of home gardens
and hobby farms which are not included in this report. No permitted poultry
ranches or dairy farms exist in the Murray Watershed.
San Vicente Watershed:
Since 2000, there has been a slight decrease (278 acres) in lands used for
agriculture within the San Vicente Watershed (Figure 2-3.14, Table 2-3.16).
No permitted poultry ranches or dairy farms exist within the San Vicente
Watershed. However, The John Van Tol Dairy straddles the Hodges and San
Vicente Watershed boundary.
Table 2-3.16 Agriculture in the San Vicente Watershed
Type of Agriculture Acres % of Watershed Orchard 238 0.5%
Intensive 287 0.6%
Field Crops 1486 3%
Total 2011 4.1%
El Capitan Watershed:
Since 2000, there has been a slight decrease (37 acres) in lands used for
agriculture within the El Capitan Watershed (Figure 2-3.14, Table 2-3.17).
There are no permitted poultry ranches or dairy farms within the El Capitan
Watershed.
Table 2-3.17 Agriculture in the El Capitan Watershed
Type of Agriculture Acres % of Watershed
Orchard 600 0.5%
Intensive 43 0.1%
Field Crops 1495 1.2%
Total 2138 1.8%
Volume 2, Chapter 3 - 68 -Revised 3-1-06
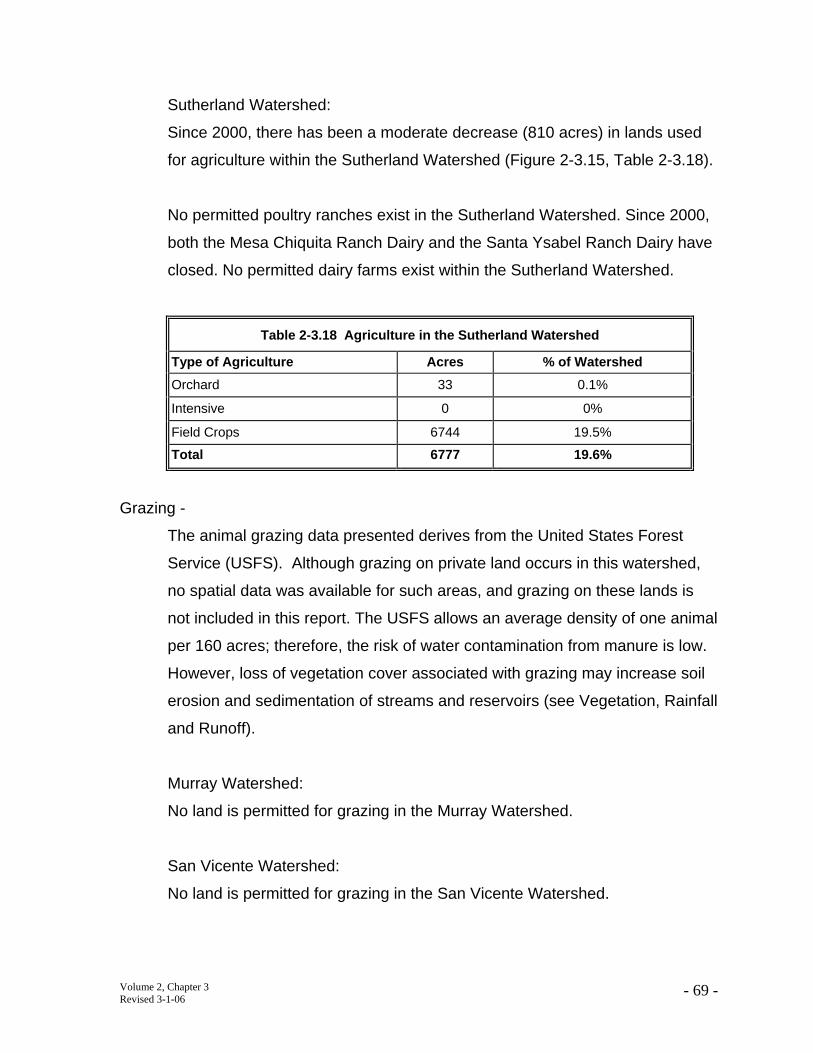
Sutherland Watershed:
Since 2000, there has been a moderate decrease (810 acres) in lands used
for agriculture within the Sutherland Watershed (Figure 2-3.15, Table 2-3.18).
No permitted poultry ranches exist in the Sutherland Watershed. Since 2000,
both the Mesa Chiquita Ranch Dairy and the Santa Ysabel Ranch Dairy have
closed. No permitted dairy farms exist within the Sutherland Watershed.
Table 2-3.18 Agriculture in the Sutherland Watershed
Type of Agriculture Acres % of Watershed Orchard 33 0.1%
Intensive 0 0%
Field Crops 6744 19.5%
Total 6777 19.6%
Grazing -
The animal grazing data presented derives from the United States Forest
Service (USFS). Although grazing on private land occurs in this watershed,
no spatial data was available for such areas, and grazing on these lands is
not included in this report. The USFS allows an average density of one animal
per 160 acres; therefore, the risk of water contamination from manure is low.
However, loss of vegetation cover associated with grazing may increase soil
erosion and sedimentation of streams and reservoirs (see Vegetation, Rainfall
and Runoff).
Murray Watershed:
No land is permitted for grazing in the Murray Watershed.
San Vicente Watershed:
No land is permitted for grazing in the San Vicente Watershed.
Volume 2, Chapter 3 - 69 -Revised 3-1-06
El Capitan Watershed:
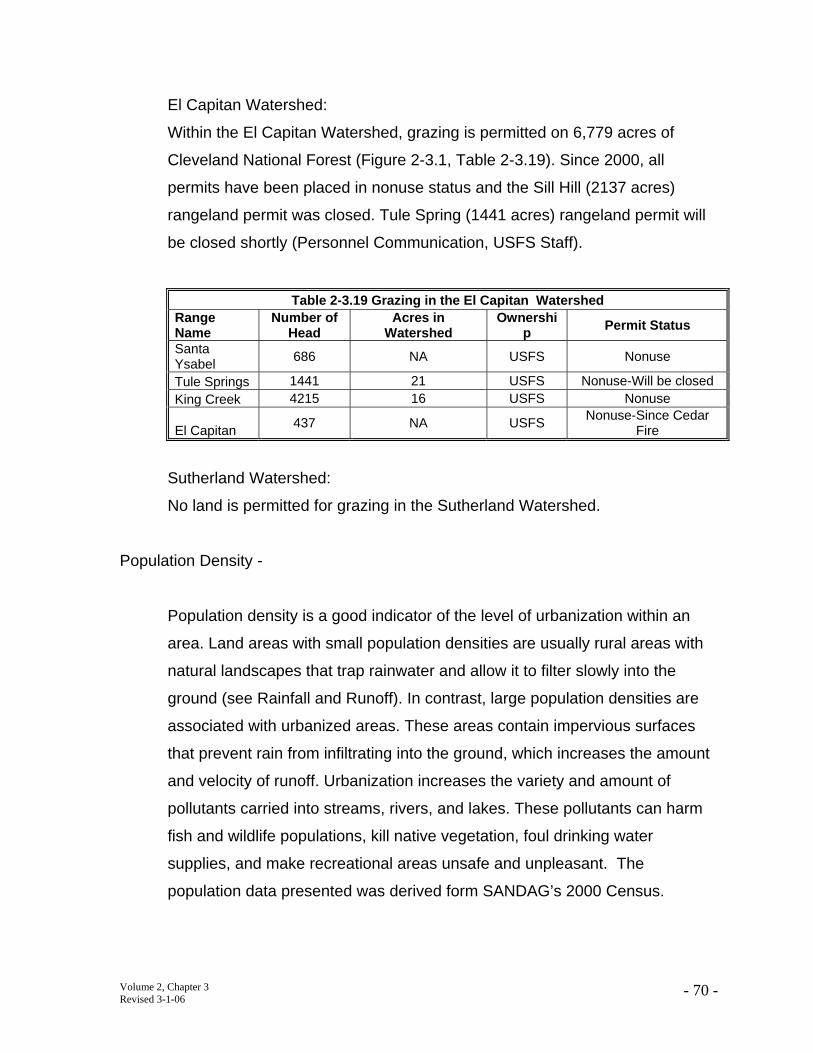
Within the El Capitan Watershed, grazing is permitted on 6,779 acres of
Cleveland National Forest (Figure 2-3.1, Table 2-3.19). Since 2000, all
permits have been placed in nonuse status and the Sill Hill (2137 acres)
rangeland permit was closed. Tule Spring (1441 acres) rangeland permit will
be closed shortly (Personnel Communication, USFS Staff).
Table 2-3.19 Grazing in the El Capitan Watershed Range Name
Number of Head
Acres in Watershed
Ownershi p Permit Status
Santa Ysabel 686 NA USFS Nonuse
Tule Springs 1441 21 USFS Nonuse-Will be closed King Creek 4215 16 USFS Nonuse
El Capitan 437 NA USFS Nonuse-Since Cedar Fire
Sutherland Watershed:
No land is permitted for grazing in the Sutherland Watershed.
Population Density -
Population density is a good indicator of the level of urbanization within an
area. Land areas with small population densities are usually rural areas with
natural landscapes that trap rainwater and allow it to filter slowly into the
ground (see Rainfall and Runoff). In contrast, large population densities are
associated with urbanized areas. These areas contain impervious surfaces
that prevent rain from infiltrating into the ground, which increases the amount
and velocity of runoff. Urbanization increases the variety and amount of
pollutants carried into streams, rivers, and lakes. These pollutants can harm
fish and wildlife populations, kill native vegetation, foul drinking water
supplies, and make recreational areas unsafe and unpleasant. The
population data presented was derived form SANDAG’s 2000 Census.
Volume 2, Chapter 3 - 70 -Revised 3-1-06
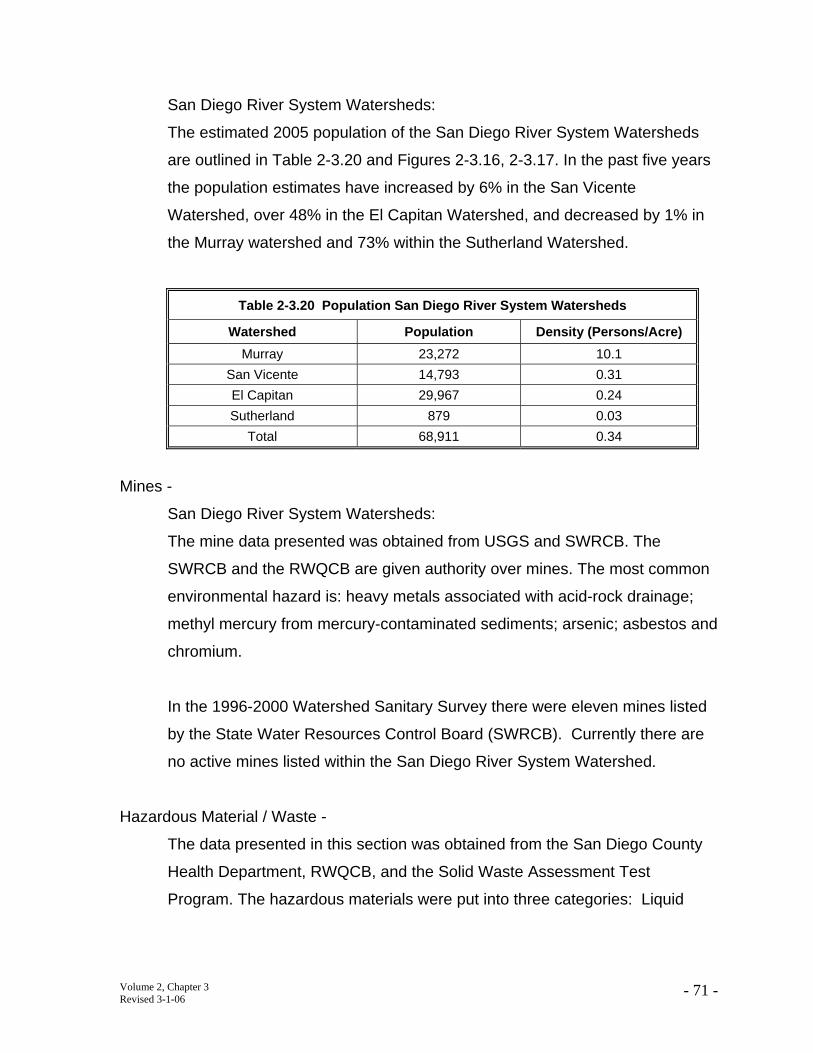
San Diego River System Watersheds:
The estimated 2005 population of the San Diego River System Watersheds
are outlined in Table 2-3.20 and Figures 2-3.16, 2-3.17. In the past five years
the population estimates have increased by 6% in the San Vicente
Watershed, over 48% in the El Capitan Watershed, and decreased by 1% in
the Murray watershed and 73% within the Sutherland Watershed.
Table 2-3.20 Population San Diego River System Watersheds
Watershed Population Density (Persons/Acre) Murray 23,272 10.1
San Vicente 14,793 0.31 El Capitan 29,967 0.24 Sutherland 879 0.03
Total 68,911 0.34
Mines -
San Diego River System Watersheds:
The mine data presented was obtained from USGS and SWRCB. The
SWRCB and the RWQCB are given authority over mines. The most common
environmental hazard is: heavy metals associated with acid-rock drainage;
methyl mercury from mercury-contaminated sediments; arsenic; asbestos and
chromium.
In the 1996-2000 Watershed Sanitary Survey there were eleven mines listed
by the State Water Resources Control Board (SWRCB). Currently there are
no active mines listed within the San Diego River System Watershed.
Hazardous Material / Waste -
The data presented in this section was obtained from the San Diego County
Health Department, RWQCB, and the Solid Waste Assessment Test
Program. The hazardous materials were put into three categories: Liquid
Volume 2, Chapter 3 - 71 -Revised 3-1-06
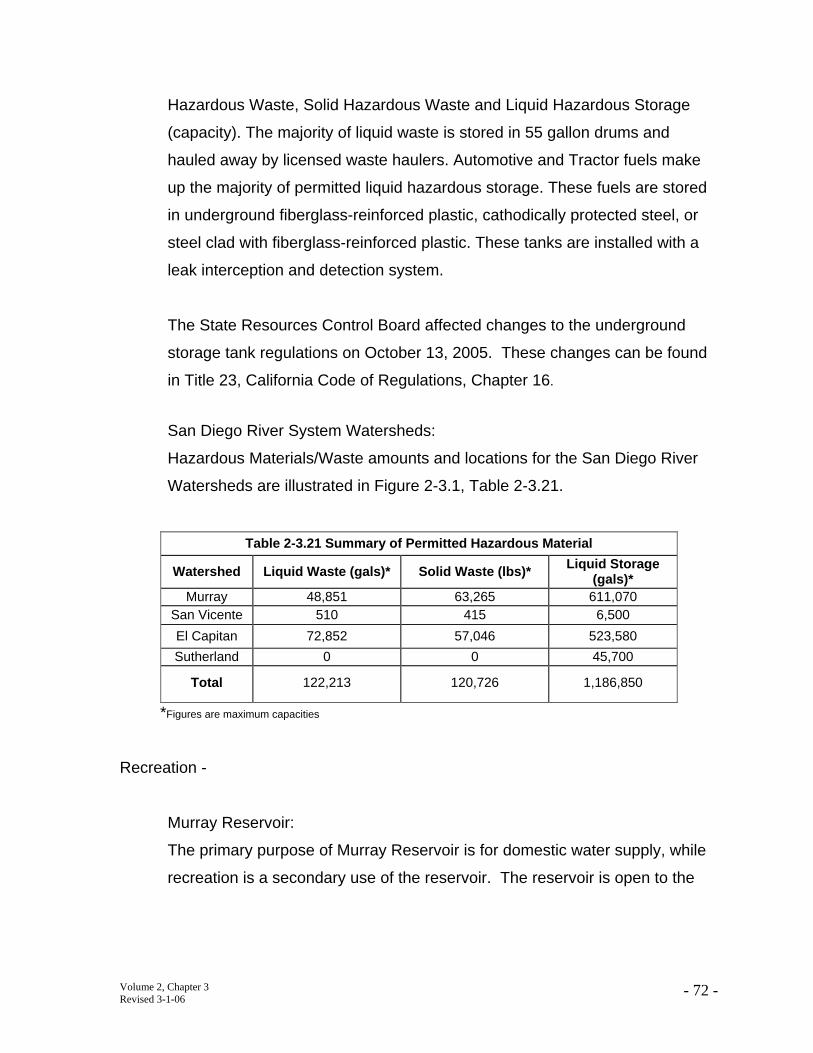
Hazardous Waste, Solid Hazardous Waste and Liquid Hazardous Storage
(capacity). The majority of liquid waste is stored in 55 gallon drums and
hauled away by licensed waste haulers. Automotive and Tractor fuels make
up the majority of permitted liquid hazardous storage. These fuels are stored
in underground fiberglass-reinforced plastic, cathodically protected steel, or
steel clad with fiberglass-reinforced plastic. These tanks are installed with a
leak interception and detection system.
The State Resources Control Board affected changes to the underground
storage tank regulations on October 13, 2005. These changes can be found
in Title 23, California Code of Regulations, Chapter 16.
San Diego River System Watersheds:
Hazardous Materials/Waste amounts and locations for the San Diego River
Watersheds are illustrated in Figure 2-3.1, Table 2-3.21.
Table 2-3.21 Summary of Permitted Hazardous Material
Watershed Liquid Waste (gals)* Solid Waste (lbs)* Liquid Storage (gals)*
Murray 48,851 63,265 611,070 San Vicente 510 415 6,500 El Capitan 72,852 57,046 523,580 Sutherland 0 0 45,700
Total 122,213 120,726 1,186,850
*Figures are maximum capacities
Recreation -
Murray Reservoir:
The primary purpose of Murray Reservoir is for domestic water supply, while
recreation is a secondary use of the reservoir. The reservoir is open to the
Volume 2, Chapter 3 - 72 -Revised 3-1-06
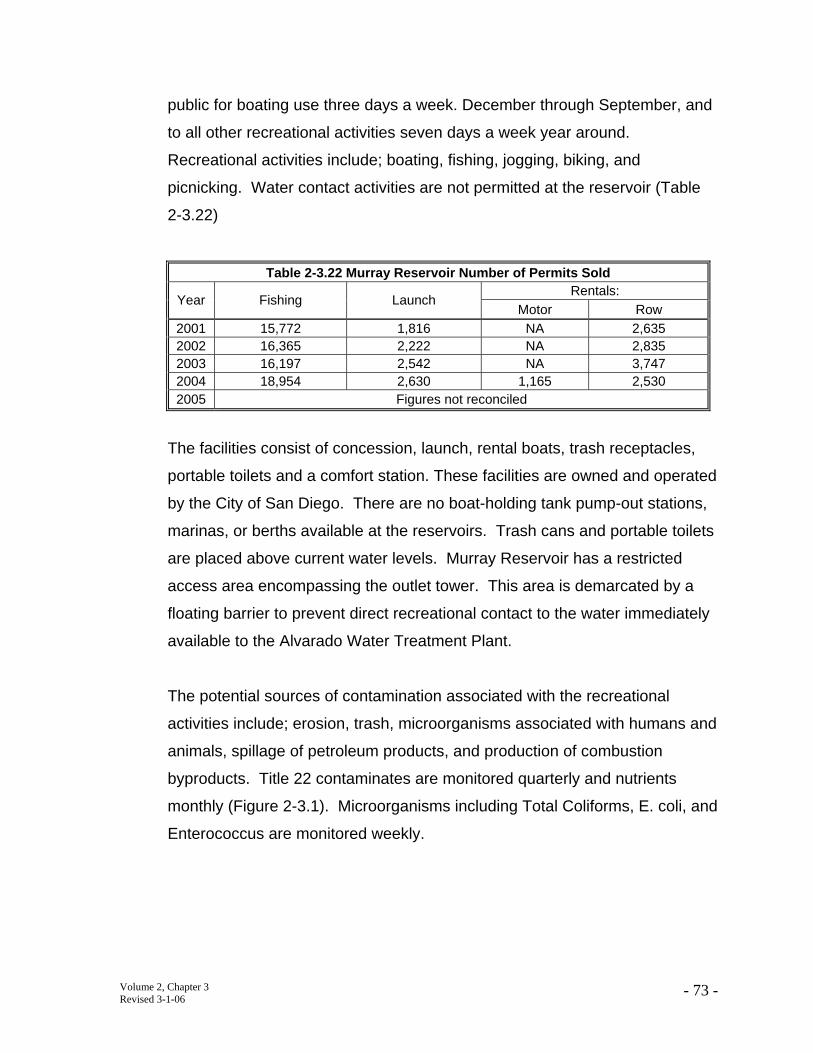
public for boating use three days a week. December through September, and
to all other recreational activities seven days a week year around.
Recreational activities include; boating, fishing, jogging, biking, and
picnicking. Water contact activities are not permitted at the reservoir (Table
2-3.22)
Table 2-3.22 Murray Reservoir Number of Permits Sold
Year Fishing Launch Rentals:
Motor Row 2001 15,772 1,816 NA 2,635 2002 16,365 2,222 NA 2,835 2003 16,197 2,542 NA 3,747 2004 18,954 2,630 1,165 2,530 2005 Figures not reconciled
The facilities consist of concession, launch, rental boats, trash receptacles,
portable toilets and a comfort station. These facilities are owned and operated
by the City of San Diego. There are no boat-holding tank pump-out stations,
marinas, or berths available at the reservoirs. Trash cans and portable toilets
are placed above current water levels. Murray Reservoir has a restricted
access area encompassing the outlet tower. This area is demarcated by a
floating barrier to prevent direct recreational contact to the water immediately
available to the Alvarado Water Treatment Plant.
The potential sources of contamination associated with the recreational
activities include; erosion, trash, microorganisms associated with humans and
animals, spillage of petroleum products, and production of combustion
byproducts. Title 22 contaminates are monitored quarterly and nutrients
monthly (Figure 2-3.1). Microorganisms including Total Coliforms, E. coli, and
Enterococcus are monitored weekly.
Volume 2, Chapter 3 - 73 -Revised 3-1-06
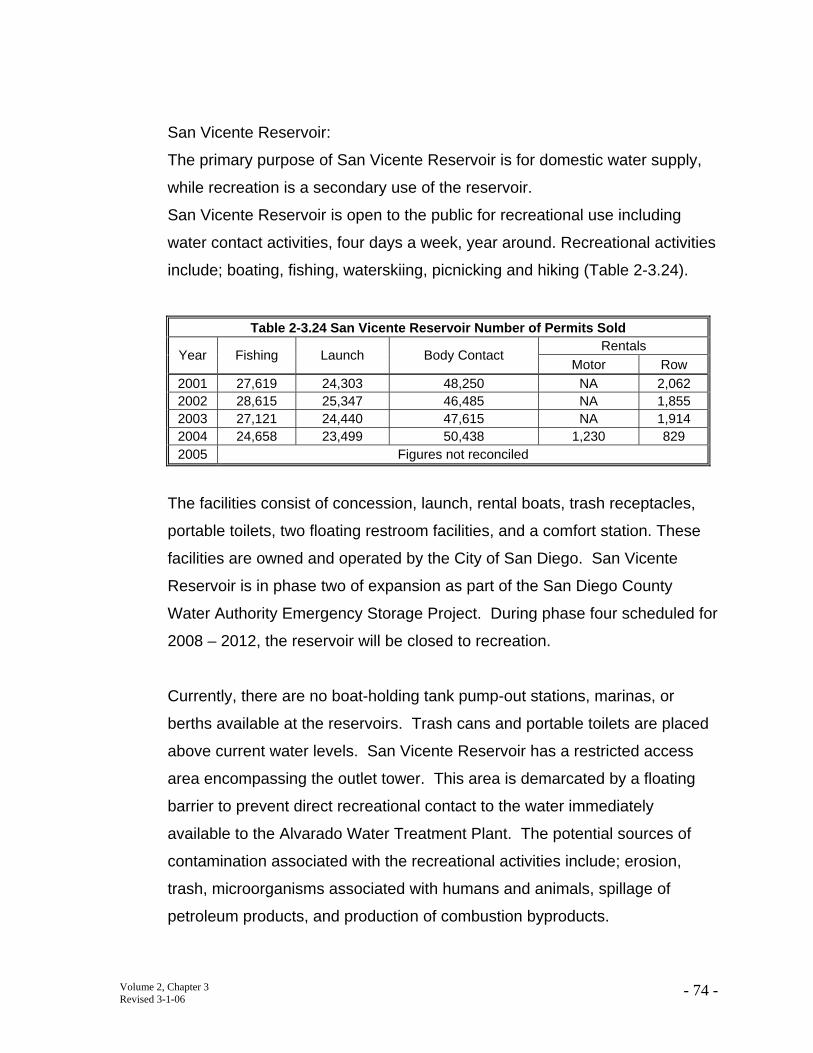
San Vicente Reservoir:
The primary purpose of San Vicente Reservoir is for domestic water supply,
while recreation is a secondary use of the reservoir.
San Vicente Reservoir is open to the public for recreational use including
water contact activities, four days a week, year around. Recreational activities
include; boating, fishing, waterskiing, picnicking and hiking (Table 2-3.24).
Table 2-3.24 San Vicente Reservoir Number of Permits Sold
Year Fishing Launch Body Contact Rentals
Motor Row 2001 27,619 24,303 48,250 NA 2,062 2002 28,615 25,347 46,485 NA 1,855 2003 27,121 24,440 47,615 NA 1,914 2004 24,658 23,499 50,438 1,230 829 2005 Figures not reconciled
The facilities consist of concession, launch, rental boats, trash receptacles,
portable toilets, two floating restroom facilities, and a comfort station. These
facilities are owned and operated by the City of San Diego. San Vicente
Reservoir is in phase two of expansion as part of the San Diego County
Water Authority Emergency Storage Project. During phase four scheduled for
2008 – 2012, the reservoir will be closed to recreation.
Currently, there are no boat-holding tank pump-out stations, marinas, or
berths available at the reservoirs. Trash cans and portable toilets are placed
above current water levels. San Vicente Reservoir has a restricted access
area encompassing the outlet tower. This area is demarcated by a floating
barrier to prevent direct recreational contact to the water immediately
available to the Alvarado Water Treatment Plant. The potential sources of
contamination associated with the recreational activities include; erosion,
trash, microorganisms associated with humans and animals, spillage of
petroleum products, and production of combustion byproducts.
Volume 2, Chapter 3 - 74 -Revised 3-1-06
Title 22 contaminates are monitored quarterly and nutrients monthly (Figure
2-3.1). Microorganisms including Total Coliforms, E. coli, and Enterococcus
are monitored weekly.
El Capitan Reservoir:
The primary purpose of El Capitan Reservoir is for domestic water supply,
while recreation is a secondary use of the reservoir. El Capitan Reservoir is
open to the public for recreational use, including water contact activities use,
three days a week, February through October. Recreational activities include;
boating, fishing, waterskiing, picnicking and hiking (Table 2-3.25).
Table 2-3.25 El Capitan Reservoir Number of Permits Sold
Year Fishing Launch Body Contact Rentals
Motor Row
2001 18,595 12,206 6,768 NA 1,55 5
2002 12,179 7,936 8,538 NA 885 2003 12,048 8,115 5,038 NA 691 2004 12,447 8,271 5,888 719 362 2005 Figures not reconciled
The facilities consist of launch, rental boats, trash receptacles, pre-fabricated
restroom facility, portable toilets, floating restroom facility, and a comfort
station. These facilities are owned and operated by the City of San Diego.
There are no boat-holding tank pump-out stations, marinas, or berths
available at the reservoirs. Trash cans and portable toilets are placed above
current water levels. El Capitan Reservoir has a restricted access area
encompassing the outlet tower. This area is demarcated by a floating barrier
to prevent direct recreational contact to the water immediately available to the
Alvarado Water Treatment Plant.
The potential sources of contamination associated with the recreational
activities include; erosion, trash, microorganisms associated with humans and
Volume 2, Chapter 3 - 75 -Revised 3-1-06
animals, spillage of petroleum products, and production of combustion
byproducts.
Title 22 contaminates are monitored quarterly and nutrients monthly (Figure
2-3.1). Microorganisms including Total Coliforms, E. coli, and Enterococcus
are monitored weekly.
Sutherland Reservoir:
The primary purpose of Sutherland Reservoir is for domestic water supply,
while recreation is a secondary use of the reservoir. Sutherland Reservoir is
open to the public for recreational use three days a week, March through
September, and two days a week, October through January. Recreational
activities include; boating, fishing, hunting, picnicking and hiking (Table 2
3.26).
Table 2-3.26 Sutherland Reservoir Number of Permits Sold
Year Fishing Hunting Launch Camp Hope
Body Contact Rentals
Motor Row 2001 7,161 222 1,727 NA NA 646 2002 6,381 195 1,370 NA NA 641 2003 4,260 191 694 125* NA 411 2004 3,731 185 476 125* 198 163 2005 Figures not reconciled 75* Figures not reconciled
* Figures are estimates provided by the City of San Diego
The facilities consist of concession, launch, rental boats, trash receptacles,
portable toilets, floating restroom facility, and a comfort station. These
facilities are owned and operated by the City of San Diego. There are no
boat-holding tank pump-out stations, marinas, or berths available at the
reservoirs. Trash cans and portable toilets are placed above current water
levels. The potential sources of contamination associated with the
Volume 2, Chapter 3 - 76 -Revised 3-1-06
recreational activities include; erosion, trash, microorganisms associated with
humans and animals, spillage of petroleum products, and production of
combustion byproducts. Title 22 contaminates are monitored quarterly
(Figure 2-3.1). Microorganisms including Total Coliforms, E. Coli, and
Enterococcus are monitored monthly.
In 2003 the Camp Hope Program was initiated. This program allows water
contact activities five days a week June through September (Table 2-3.26).
During this period, Title 22 contaminates are monitored quarterly.
Microorganisms including Total Coliforms, E. coli, and Enterococcus are
monitored weekly while Cryptosproidim and Giardia are monitored monthly.
Wastewater / Reclaimed water -
The Wastewater / Reclaimed water treatment facilities permitted by the
RWQCB in the San Diego River System Watersheds are identified in Figure
2-3.1 and Table 2-3.27.
Table 2-3.27 Wastewater/ Reclaimed Water Facilities
Watersh ed
RCQCB Facility
I.D. Facility Name Address
Highest level of
Treatment Dischar ge To:
Land Dispos
al Order
#
San Vicente
90000000 76
San Vicente WRP
2278 San
Vicente Rd
Tertiary
Recycled Water Use,
Spray Field
93-003
El Capitan
90000001 09 Julian WPCF
2936 State Rte
79
Undisinfected Secondary
Percolati on
Ponds 83-009
El Capitan
90000001 22
Heise Park Campground
4945 Heise
Park Rd
Undisinfected Secondary
Percolati on
Ponds 93-009
El Capitan NA
Lake Cuyamaca Public Rec
Area
15027 State Rte
79
Septic Tank Effluent
Leach Field
R920040015
San Vicente NA Barona
WWTP
1932 Wildcat Canyon
Rd
Tertiary Spray Field NA
Volume 2, Chapter 3 - 77 -Revised 3-1-06
San Vicente Watershed
San Vicente Water Reclamation Plant (WRP):
The Ramona Municipal Water District (RMWD) is the agency responsible for
this facility. RWQCB Order No. 93-003 establishes the discharge
specifications for the San Vicente WRP (Table 2-3.28).
The treatment system is comprised of; headwork’s facility, two oxidation
basins, four clarifiers, return activated biosolids pump station, reverse
osmosis facility, and a chlorine contact chamber. The plant effluent is
discharged to reclaimed water holding ponds located at the facility. The
RWQCB requirements (Order No. 93-03, Addendum No. 2) certify an average
daily design flow of up to 0.75 mgd. The Design Certification Report prepared
for the RMWD in 2005 indicates that the San Vicente facilities are designed to
provide preliminary, secondary, and tertiary treatment for an ultimate annual
average flow of 0.80 mgd
The recipients of reclaimed water from the San Vicente Water Reclamation
Facility are the Spangler Peak Ranch and the San Vicente Golf Course. The
Spangler Peak Ranch is located at the end of Creelman Lane, and uses an
average 14.5 million gallons per month, with higher usage during summer
months and lower during winter months. The San Vicente Golf Course is
located on San Vicente Road and uses on average 4.5 million gallons per
month with a similar seasonal demand.
Volume 2, Chapter 3 - 78 -Revised 3-1-06
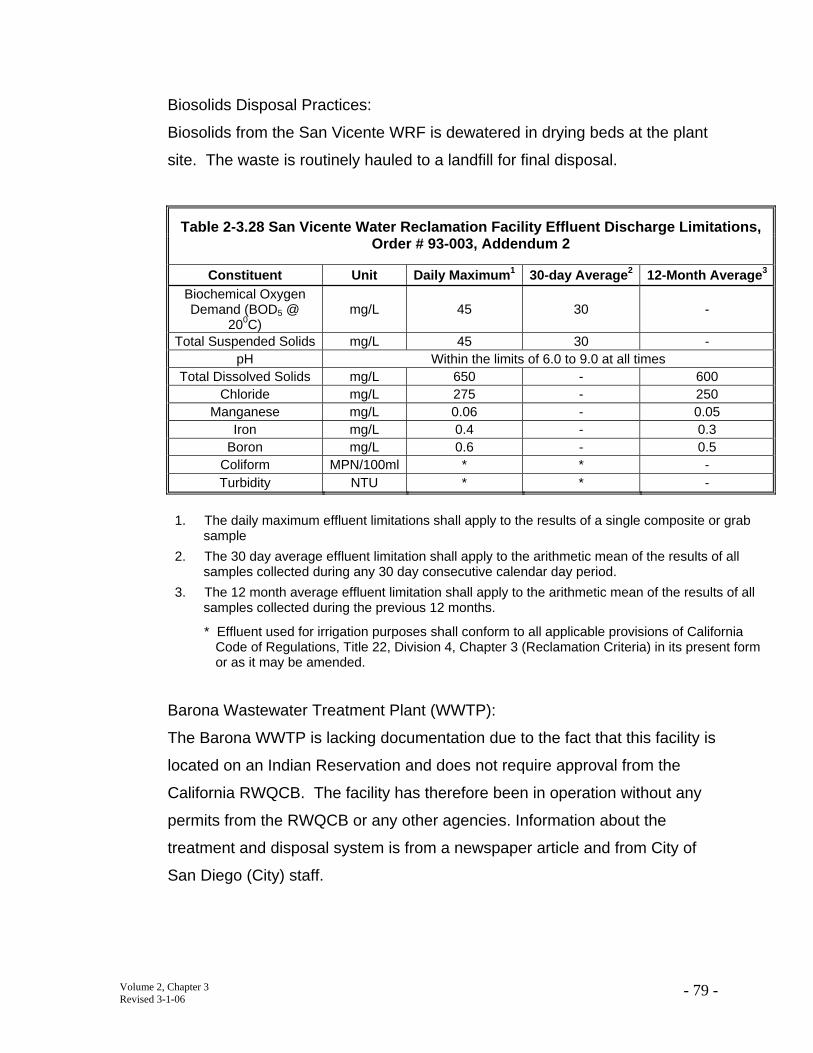
Biosolids Disposal Practices:
Biosolids from the San Vicente WRF is dewatered in drying beds at the plant
site. The waste is routinely hauled to a landfill for final disposal.
Table 2-3.28 San Vicente Water Reclamation Facility Effluent Discharge Limitations, Order # 93-003, Addendum 2
Constituent Unit Daily Maximum1 30-day Average2 12-Month Average3
Biochemical Oxygen Demand (BOD5 @
200C) mg/L 45 30 -
Total Suspended Solids mg/L 45 30 -pH Within the limits of 6.0 to 9.0 at all times
Total Dissolved Solids mg/L 650 - 600 Chloride mg/L 275 - 250
Manganese mg/L 0.06 - 0.05 Iron mg/L 0.4 - 0.3
Boron mg/L 0.6 - 0.5 Coliform MPN/100ml * * -Turbidity NTU * * -
1. The daily maximum effluent limitations shall apply to the results of a single composite or grab sample
2. The 30 day average effluent limitation shall apply to the arithmetic mean of the results of all samples collected during any 30 day consecutive calendar day period.
3. The 12 month average effluent limitation shall apply to the arithmetic mean of the results of all samples collected during the previous 12 months.
* Effluent used for irrigation purposes shall conform to all applicable provisions of California Code of Regulations, Title 22, Division 4, Chapter 3 (Reclamation Criteria) in its present form or as it may be amended.
Barona Wastewater Treatment Plant (WWTP):
The Barona WWTP is lacking documentation due to the fact that this facility is
located on an Indian Reservation and does not require approval from the
California RWQCB. The facility has therefore been in operation without any
permits from the RWQCB or any other agencies. Information about the
treatment and disposal system is from a newspaper article and from City of
San Diego (City) staff.
Volume 2, Chapter 3 - 79 -Revised 3-1-06
The Barona WWTP serves the Barona Casino facilities located on the Barona
Indian Reservation. The compact package treatment plant is capable of
tertiary treatment. The plant effluent is currently stored in 50,000 and 25,000
gallon tanks and disposed of on spray fields located on the Reservation.
El Capitan Watershed
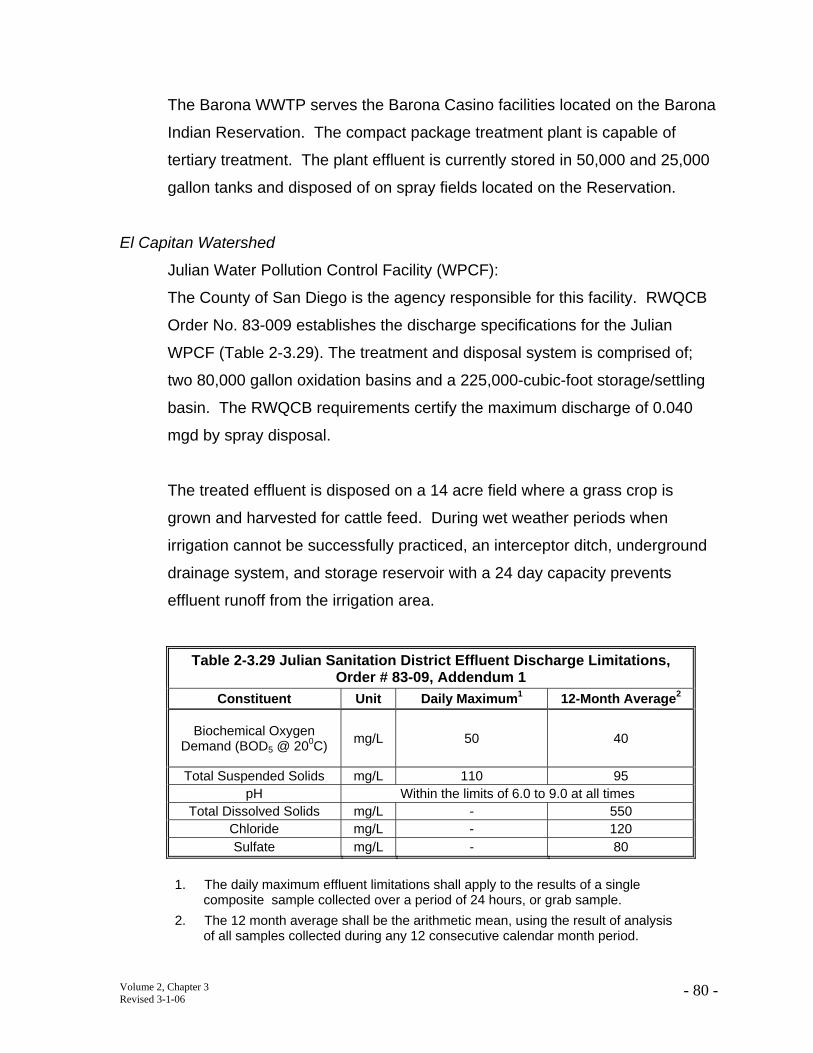
Julian Water Pollution Control Facility (WPCF):
The County of San Diego is the agency responsible for this facility. RWQCB
Order No. 83-009 establishes the discharge specifications for the Julian
WPCF (Table 2-3.29). The treatment and disposal system is comprised of;
two 80,000 gallon oxidation basins and a 225,000-cubic-foot storage/settling
basin. The RWQCB requirements certify the maximum discharge of 0.040
mgd by spray disposal.
The treated effluent is disposed on a 14 acre field where a grass crop is
grown and harvested for cattle feed. During wet weather periods when
irrigation cannot be successfully practiced, an interceptor ditch, underground
drainage system, and storage reservoir with a 24 day capacity prevents
effluent runoff from the irrigation area.
Table 2-3.29 Julian Sanitation District Effluent Discharge Limitations, Order # 83-09, Addendum 1
Constituent Unit Daily Maximum1 12-Month Average2
Biochemical Oxygen Demand (BOD5 @ 200C) mg/L 50 40
Total Suspended Solids mg/L 110 95 pH Within the limits of 6.0 to 9.0 at all times
Total Dissolved Solids mg/L - 550 Chloride mg/L - 120 Sulfate mg/L - 80
1. The daily maximum effluent limitations shall apply to the results of a single composite sample collected over a period of 24 hours, or grab sample.
2. The 12 month average shall be the arithmetic mean, using the result of analysis of all samples collected during any 12 consecutive calendar month period.
Volume 2, Chapter 3 - 80 -Revised 3-1-06
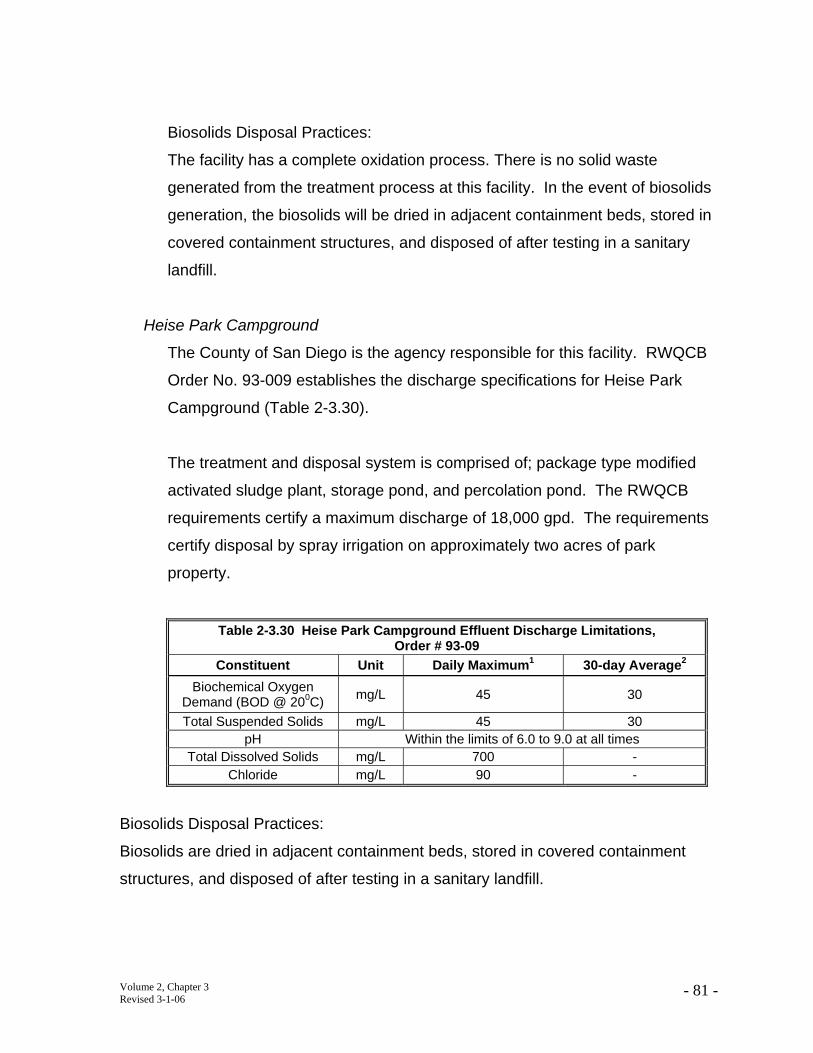
Biosolids Disposal Practices:
The facility has a complete oxidation process. There is no solid waste
generated from the treatment process at this facility. In the event of biosolids
generation, the biosolids will be dried in adjacent containment beds, stored in
covered containment structures, and disposed of after testing in a sanitary
landfill.
Heise Park Campground
The County of San Diego is the agency responsible for this facility. RWQCB
Order No. 93-009 establishes the discharge specifications for Heise Park
Campground (Table 2-3.30).
The treatment and disposal system is comprised of; package type modified
activated sludge plant, storage pond, and percolation pond. The RWQCB
requirements certify a maximum discharge of 18,000 gpd. The requirements
certify disposal by spray irrigation on approximately two acres of park
property.
Table 2-3.30 Heise Park Campground Effluent Discharge Limitations, Order # 93-09
Constituent Unit Daily Maximum1 30-day Average2
Biochemical Oxygen Demand (BOD @ 200C) mg/L 45 30
Total Suspended Solids mg/L 45 30 pH Within the limits of 6.0 to 9.0 at all times
Total Dissolved Solids mg/L 700 -Chloride mg/L 90 -
Biosolids Disposal Practices:
Biosolids are dried in adjacent containment beds, stored in covered containment
structures, and disposed of after testing in a sanitary landfill.
Volume 2, Chapter 3 - 81 -Revised 3-1-06
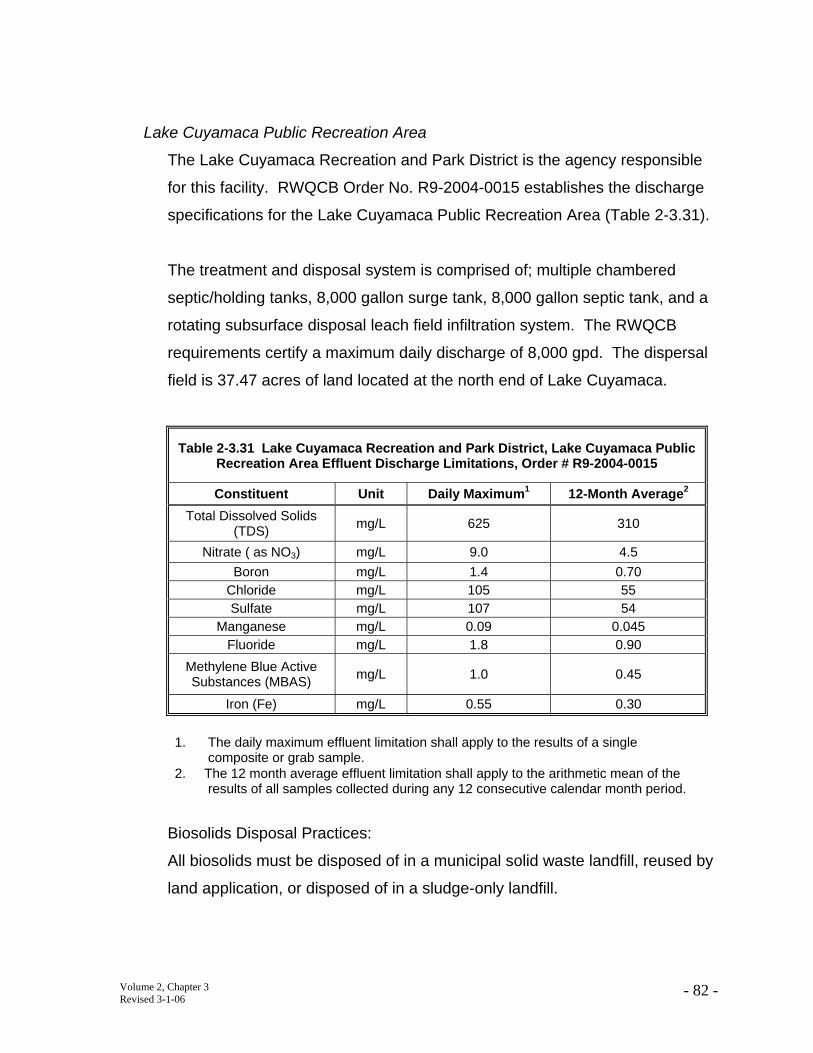
Lake Cuyamaca Public Recreation Area
The Lake Cuyamaca Recreation and Park District is the agency responsible
for this facility. RWQCB Order No. R9-2004-0015 establishes the discharge
specifications for the Lake Cuyamaca Public Recreation Area (Table 2-3.31).
The treatment and disposal system is comprised of; multiple chambered
septic/holding tanks, 8,000 gallon surge tank, 8,000 gallon septic tank, and a
rotating subsurface disposal leach field infiltration system. The RWQCB
requirements certify a maximum daily discharge of 8,000 gpd. The dispersal
field is 37.47 acres of land located at the north end of Lake Cuyamaca.
Table 2-3.31 Lake Cuyamaca Recreation and Park District, Lake Cuyamaca Public Recreation Area Effluent Discharge Limitations, Order # R9-2004-0015
Constituent Unit Daily Maximum1 12-Month Average2
Total Dissolved Solids (TDS) mg/L 625 310
Nitrate ( as NO3) mg/L 9.0 4.5 Boron mg/L 1.4 0.70
Chloride mg/L 105 55 Sulfate mg/L 107 54
Manganese mg/L 0.09 0.045 Fluoride mg/L 1.8 0.90
Methylene Blue Active Substances (MBAS) mg/L 1.0 0.45
Iron (Fe) mg/L 0.55 0.30
1. The daily maximum effluent limitation shall apply to the results of a single composite or grab sample.
2. The 12 month average effluent limitation shall apply to the arithmetic mean of the results of all samples collected during any 12 consecutive calendar month period.
Biosolids Disposal Practices:
All biosolids must be disposed of in a municipal solid waste landfill, reused by
land application, or disposed of in a sludge-only landfill.
Volume 2, Chapter 3 - 82 -Revised 3-1-06
Septic Systems San Diego River System Watershed -
The primary goal in this section is to identify areas where septic systems may pose a
threat to water quality. Septic systems treat and disperse relatively small volumes of
wastewater from individual or small numbers of homes and commercial buildings.
Poorly managed systems have been named as a concern by nearly every federal
and state program that deals with water resource issues.
San Diego County’s Department of Environmental Health maintains records of septic
tank permits at their San Marcos and El Cajon offices. Prior to 2002 no electronic
database existed to query the location, type, etc. of these permits. There are an
estimated 90,000-100,000 homes county-wide on septic systems.
Estimates of septic system density for the 1996-2000 WSS were calculated by using
the 1990 census tract data to determine population density with in each watershed.
Next, a data layer of sewered and un-sewered areas was created from the City data
base and from SanGIS community plan data. The sewered areas layer was overlaid
with population density to create a new data layer. This data layer was queried to
pull out polygons that were un-sewered with a population density greater than zero.
Graduated color was applied to the septic density field to enable visual assessment
of high potential concentrations of septic tanks.
In 2002 the County of San Diego Department of Environmental Health initiated an
electronic database to track septic system permits issued throughout the County.
The database does not contain historical permits issued before 2002, so an exact
number of permits in a given community cannot be determined. However, the
database indicates where new permits are being issued and if these permits are for
new construction, repair, fire rebuild, etc. In addition, the permit records the
hydrologic sub area where the septic system is located.
Volume 2, Chapter 3 - 83 -Revised 3-1-06
A data layer of the hydrologic sub areas of San Diego County was obtained from
SanGIS. Numbers of permits issued in each hydrologic sub area was determined
from the Counties database. Graduated colors were applied to the hydrologic sub
area within each watershed to enable visual assessment of high issuant of septic
system permits (Figure 2-3.18).Table 2-3.32 lists the communities within the
watershed along with the number and type of septic system permits issued since
2002.. No septic systems are in the Murray Watershed, a fully developed sewer
system serves this area.
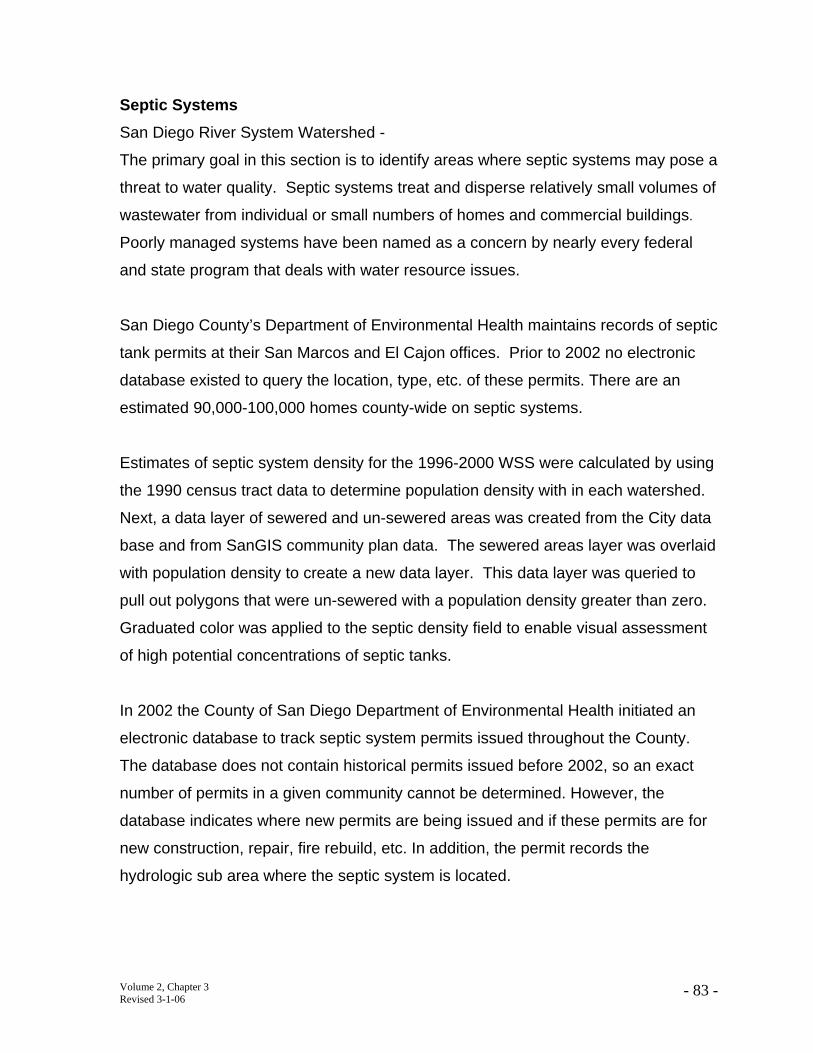
Table 2-3.32 Number and Type of Septic System Permits in the El Capitan, San Vicente and Sutherland Watershed
Type of System Community New Repair or Modified Fire Rebuild Other
Alpine 74 54 4 2 Ramona/Fernbrook 63 33 10 0
Julian 52 47 16 0 Descanso 9 2 0 0 Lakeside 8 8 4 1 El Cajon 3 0 0 0
Harrison Park 1 2 1 0
Sanitary Sewer Overflows
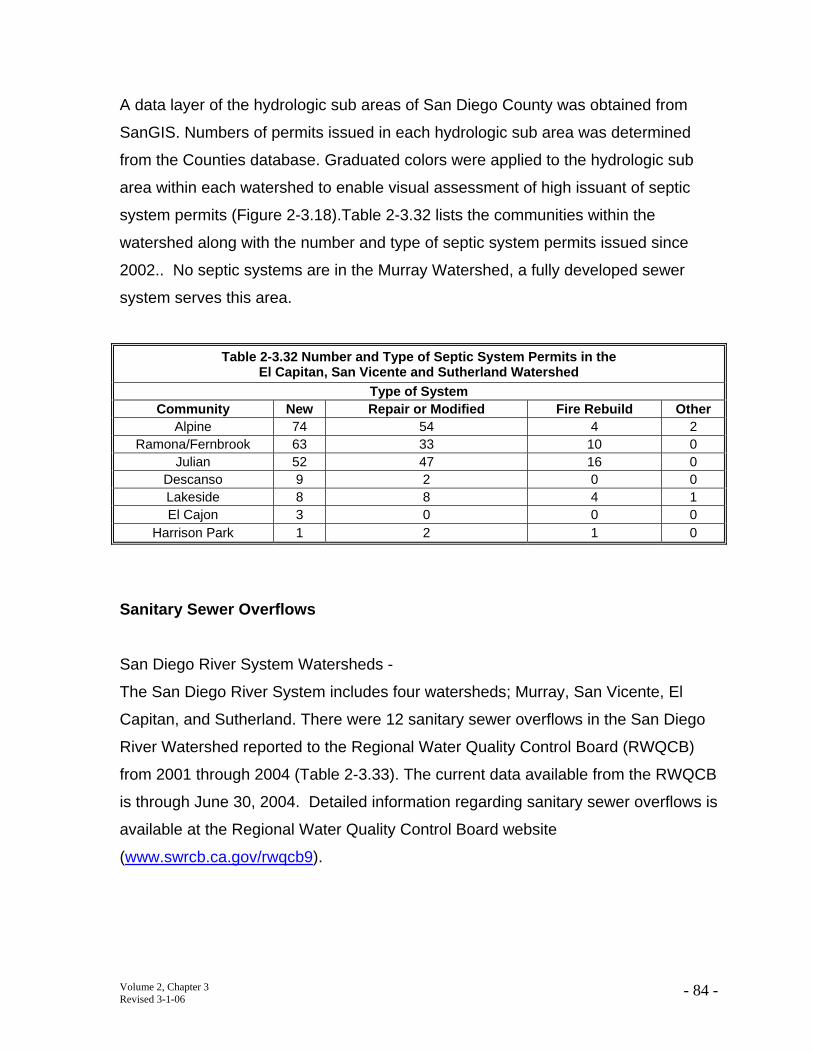
San Diego River System Watersheds -
The San Diego River System includes four watersheds; Murray, San Vicente, El
Capitan, and Sutherland. There were 12 sanitary sewer overflows in the San Diego
River Watershed reported to the Regional Water Quality Control Board (RWQCB)
from 2001 through 2004 (Table 2-3.33). The current data available from the RWQCB
is through June 30, 2004. Detailed information regarding sanitary sewer overflows is
available at the Regional Water Quality Control Board website
(www.swrcb.ca.gov/rwqcb9).
Volume 2, Chapter 3 - 84 -Revised 3-1-06
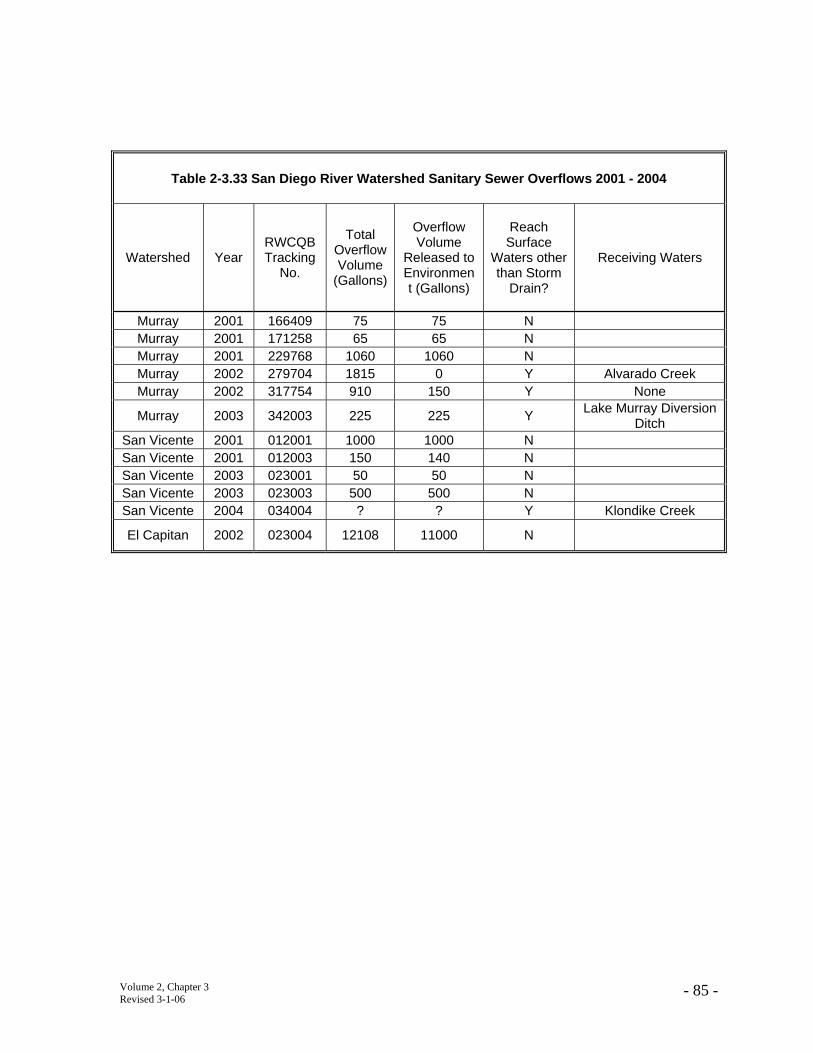
Table 2-3.33 San Diego River Watershed Sanitary Sewer Overflows 2001 - 2004
Watershed Year RWCQB Tracking
No.
Total Overflow Volume
(Gallons)
Overflow Volume
Released to Environmen t (Gallons)
Reach Surface
Waters other than Storm
Drain?
Receiving Waters
Murray 2001 166409 75 75 N Murray 2001 171258 65 65 N Murray 2001 229768 1060 1060 N Murray 2002 279704 1815 0 Y Alvarado Creek Murray 2002 317754 910 150 Y None
Murray 2003 342003 225 225 Y Lake Murray Diversion Ditch
San Vicente 2001 012001 1000 1000 N San Vicente 2001 012003 150 140 N San Vicente 2003 023001 50 50 N San Vicente 2003 023003 500 500 N San Vicente 2004 034004 ? ? Y Klondike Creek
El Capitan 2002 023004 12108 11000 N
Volume 2, Chapter 3 - 85 -Revised 3-1-06
Volume 2, Chapter 3 - 86 -Revised 3-1-06
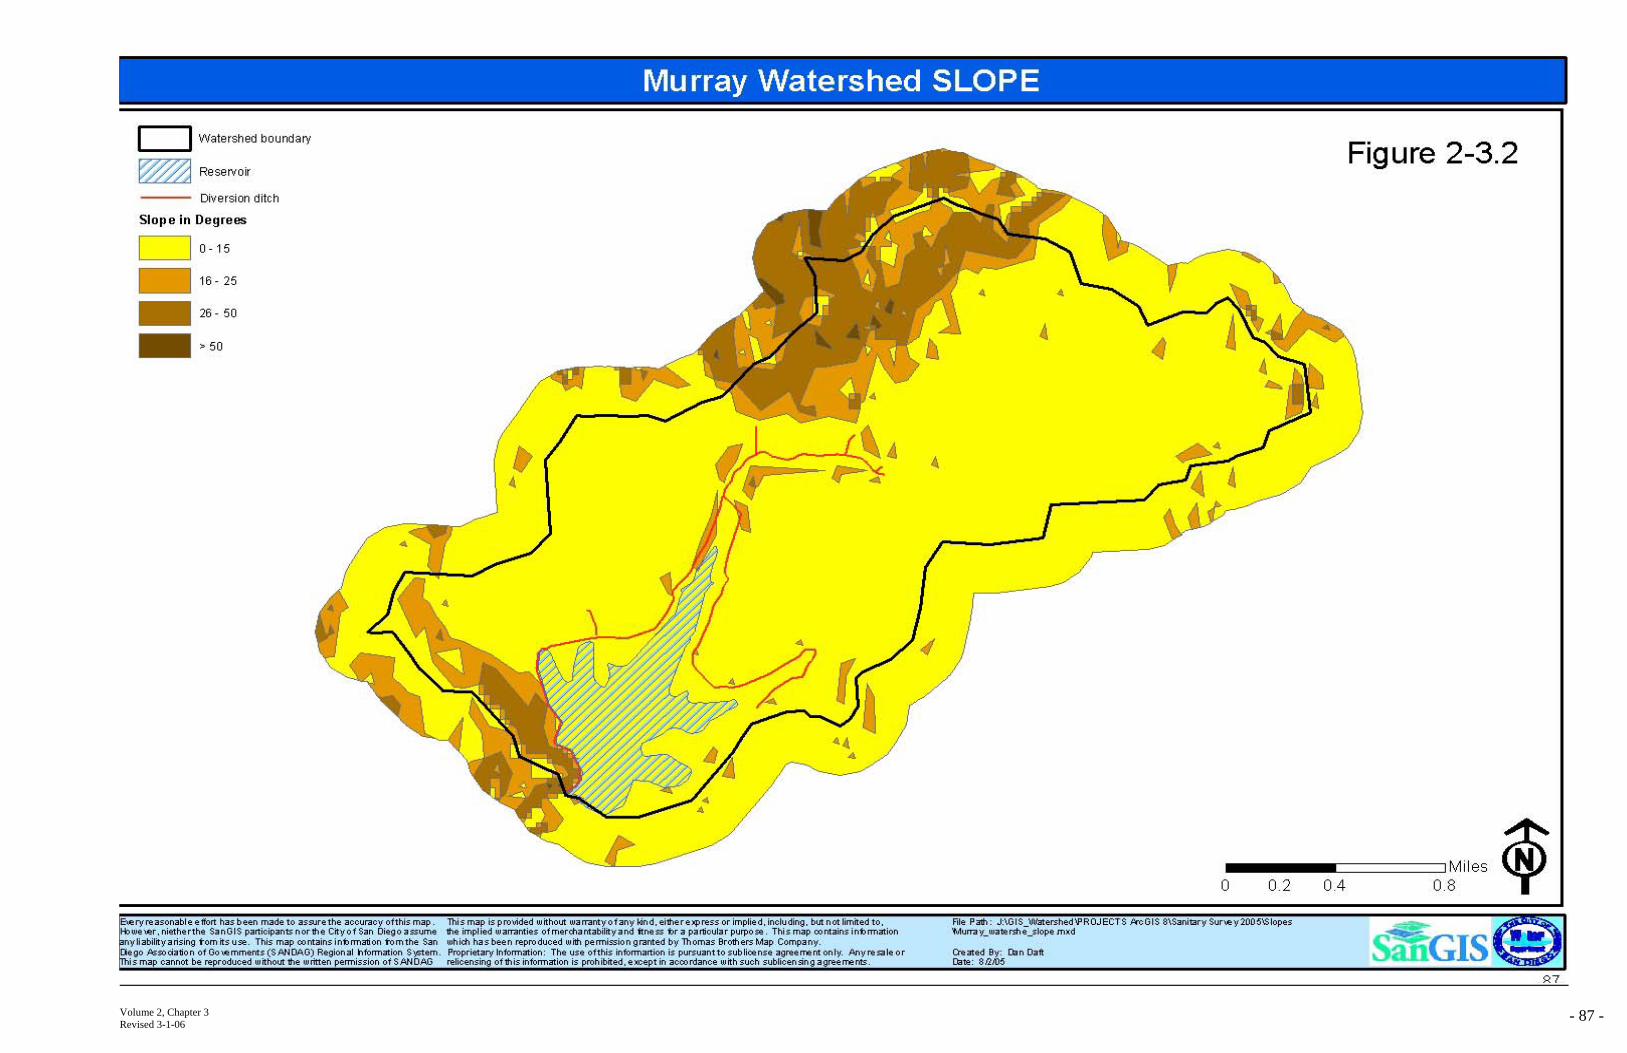
Volume 2, Chapter 3 - 87 -Revised 3-1-06
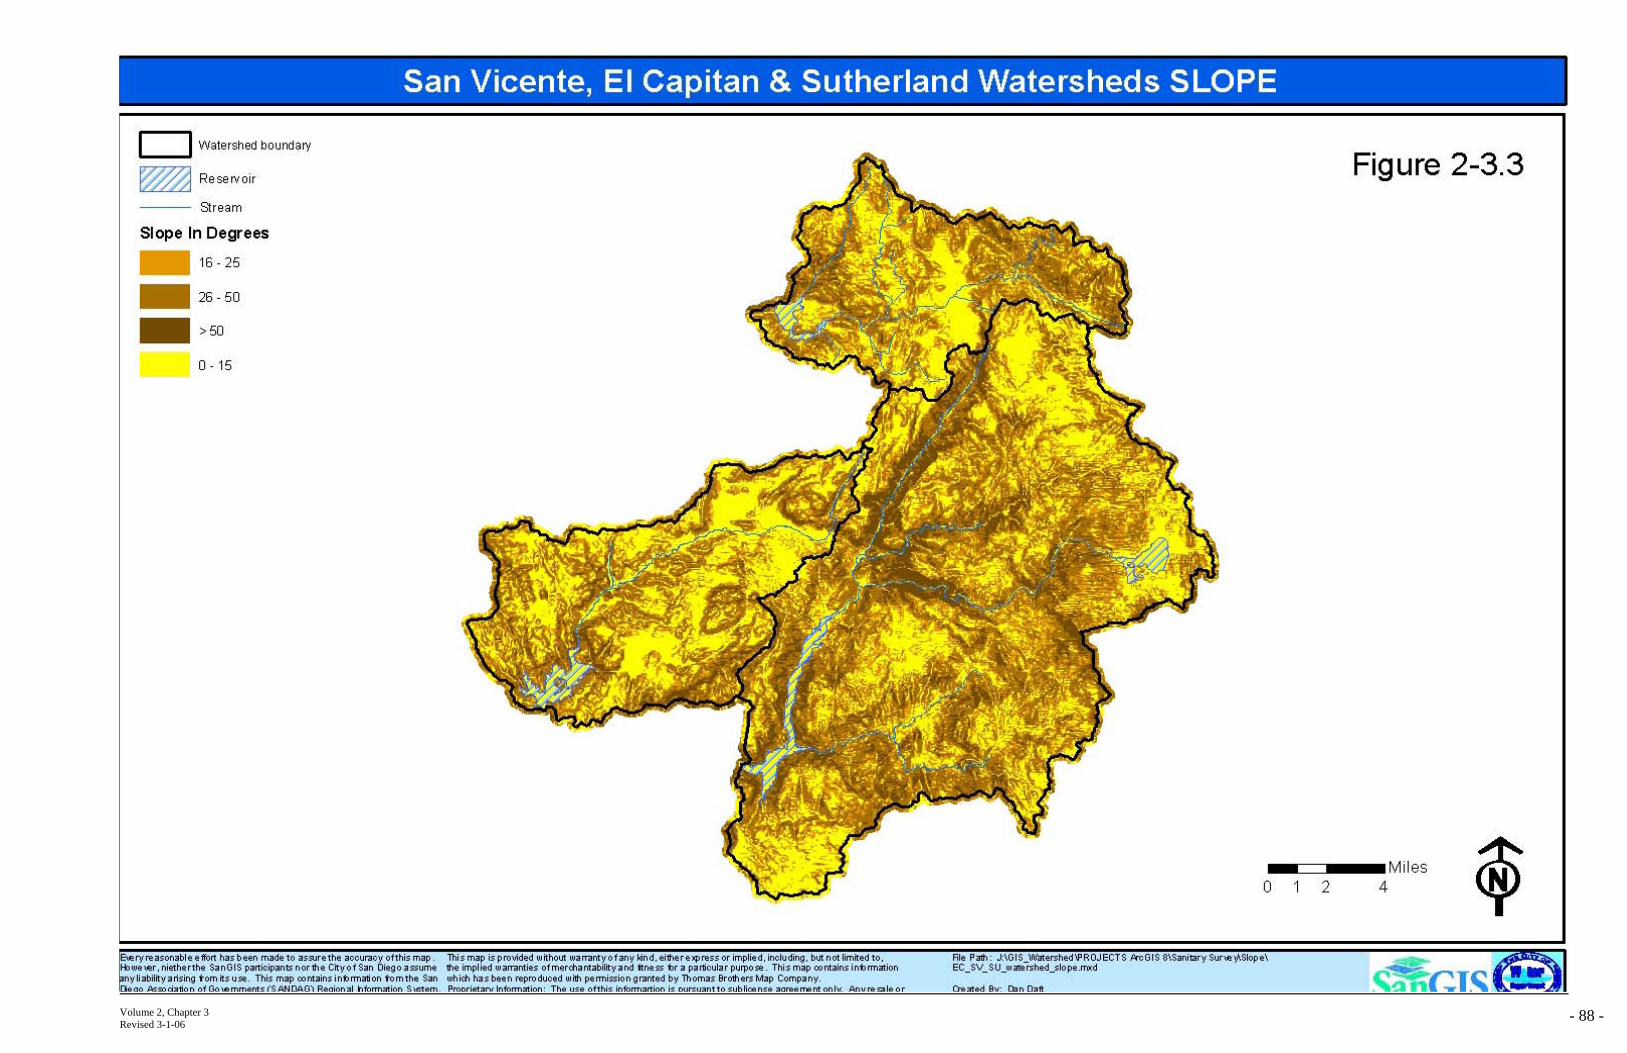
Volume 2, Chapter 3 - 88 -Revised 3-1-06

Volume 2, Chapter 3 - 89 -Revised 3-1-06
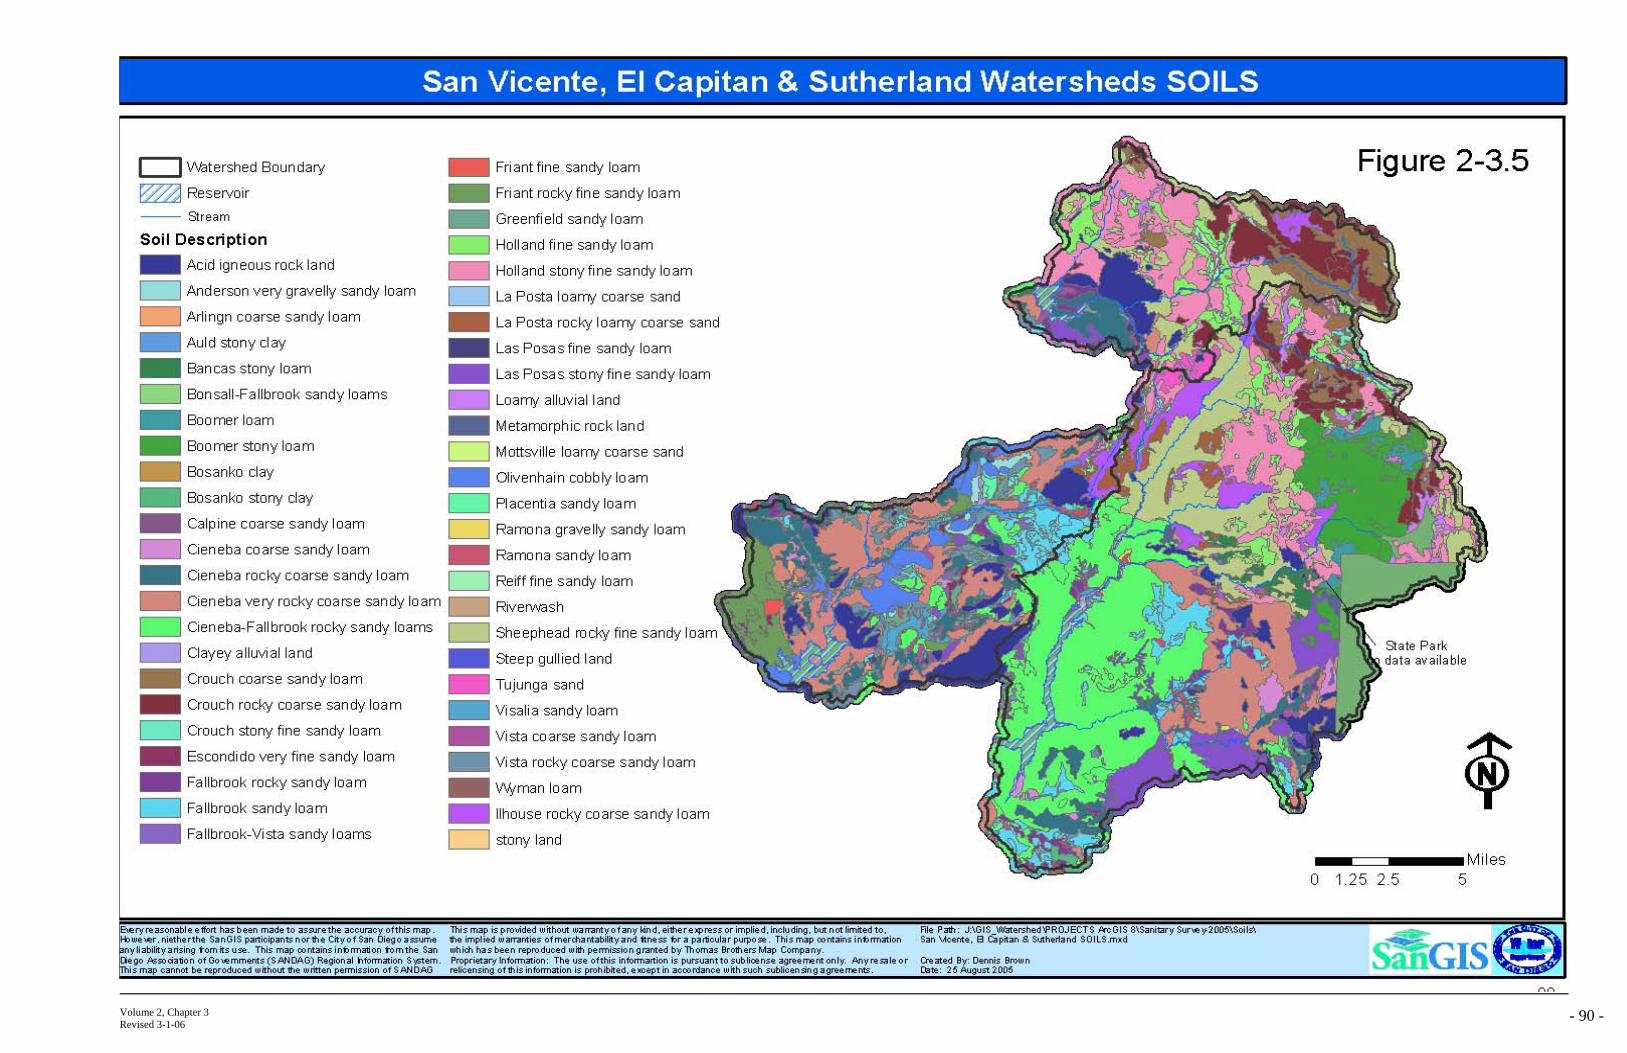
Volume 2, Chapter 3 - 90 -Revised 3-1-06
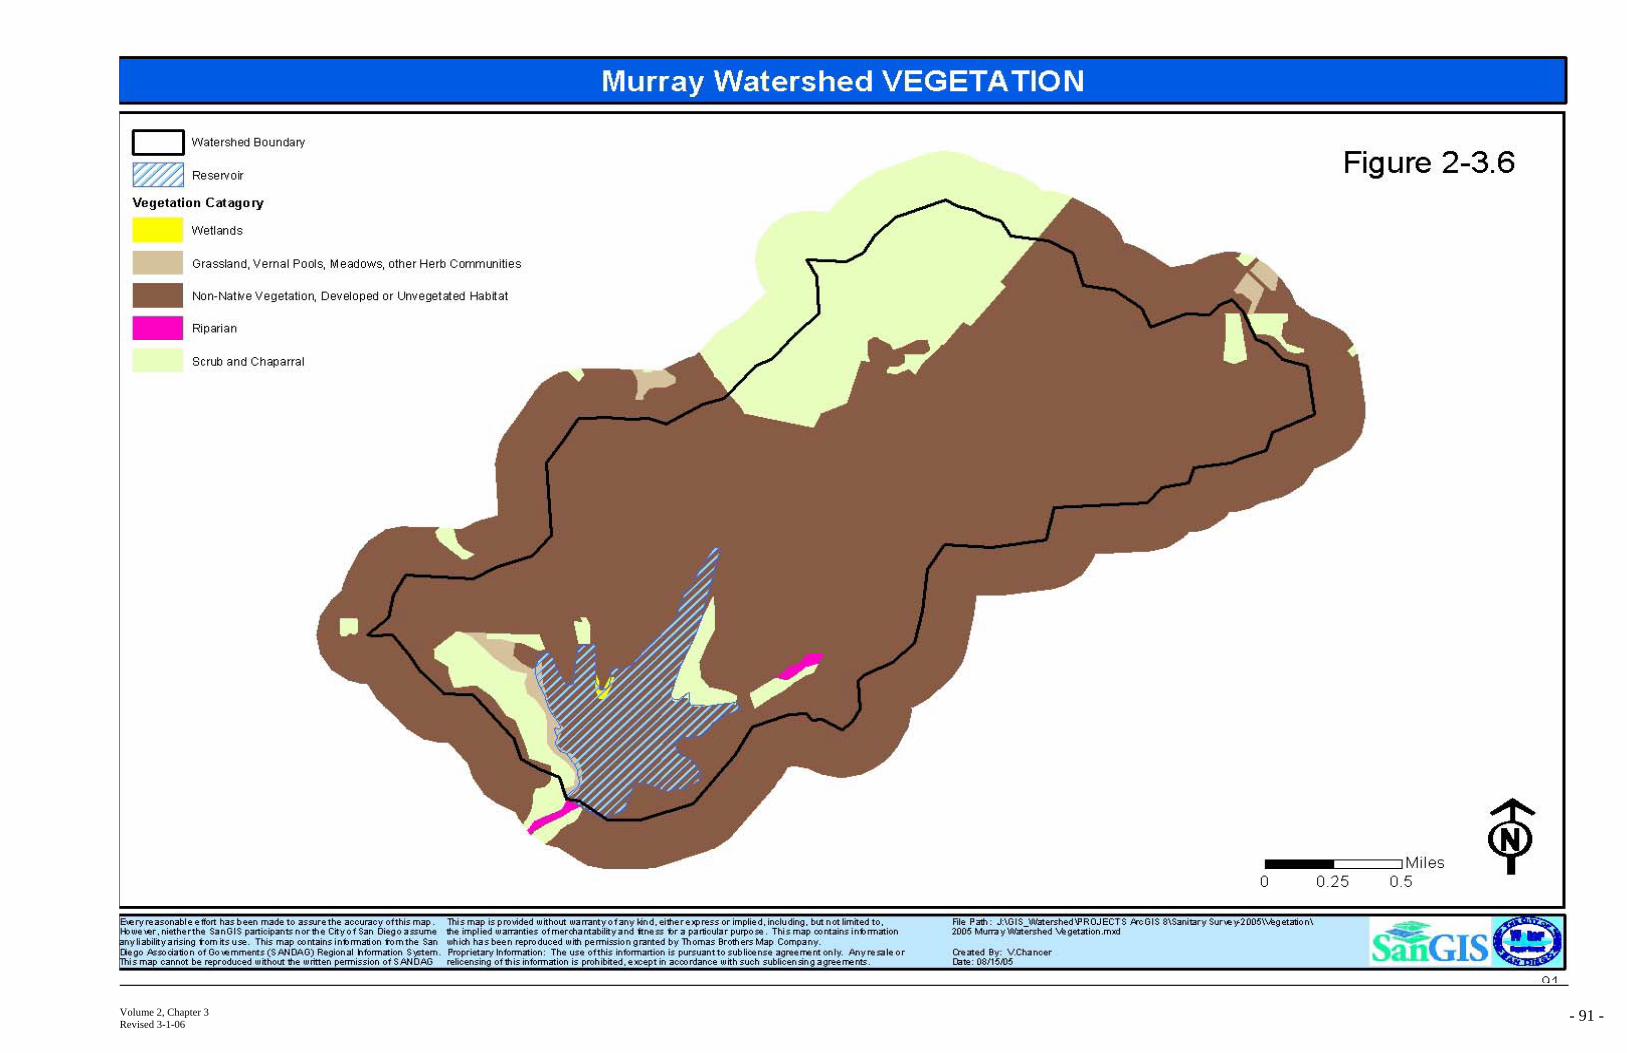
Volume 2, Chapter 3 - 91 -Revised 3-1-06
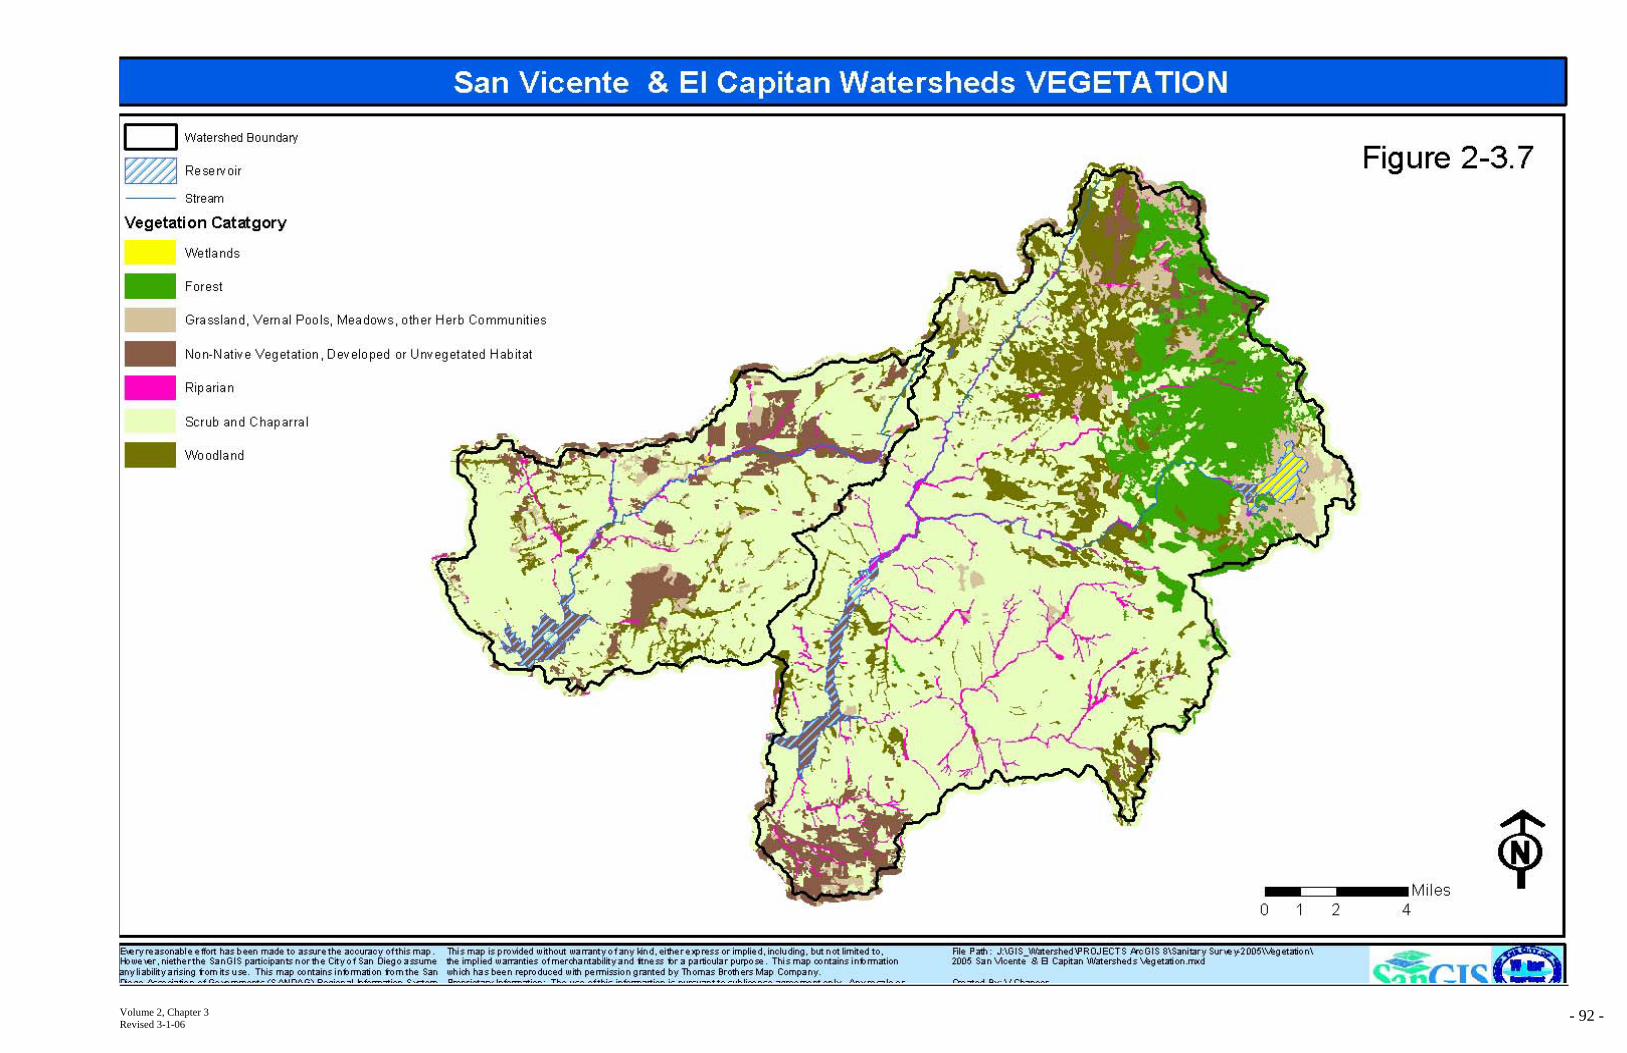
Volume 2, Chapter 3 - 92 -Revised 3-1-06
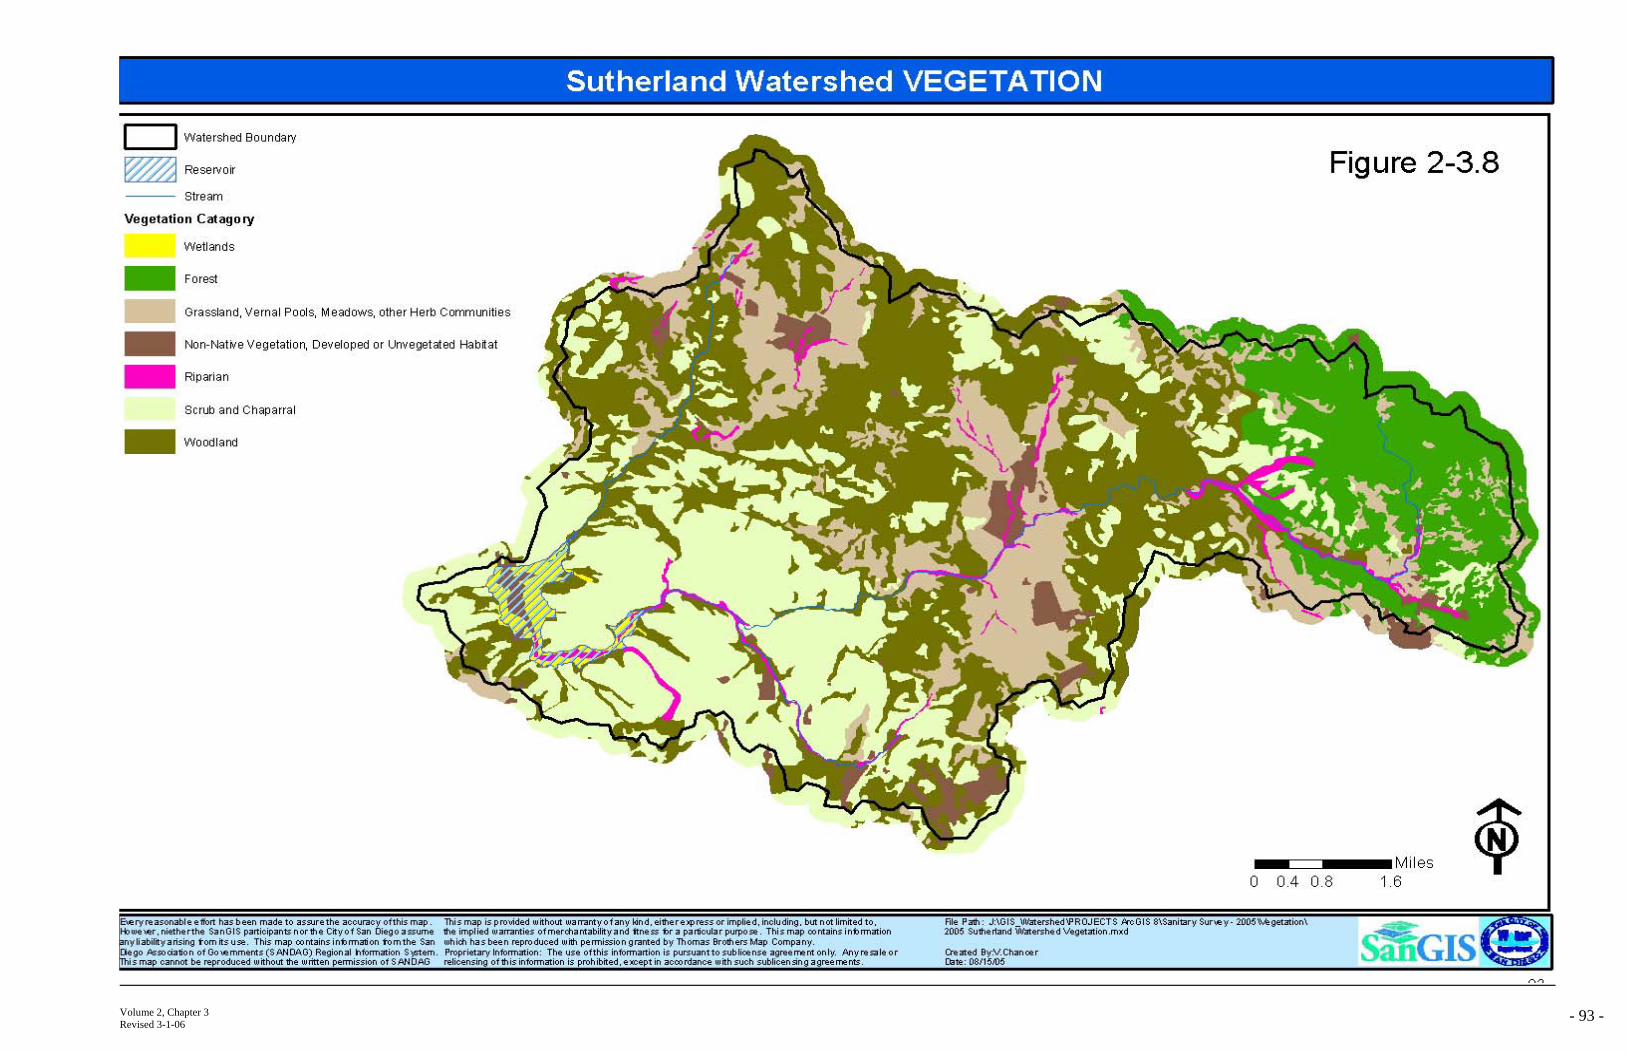
Volume 2, Chapter 3 - 93 -Revised 3-1-06
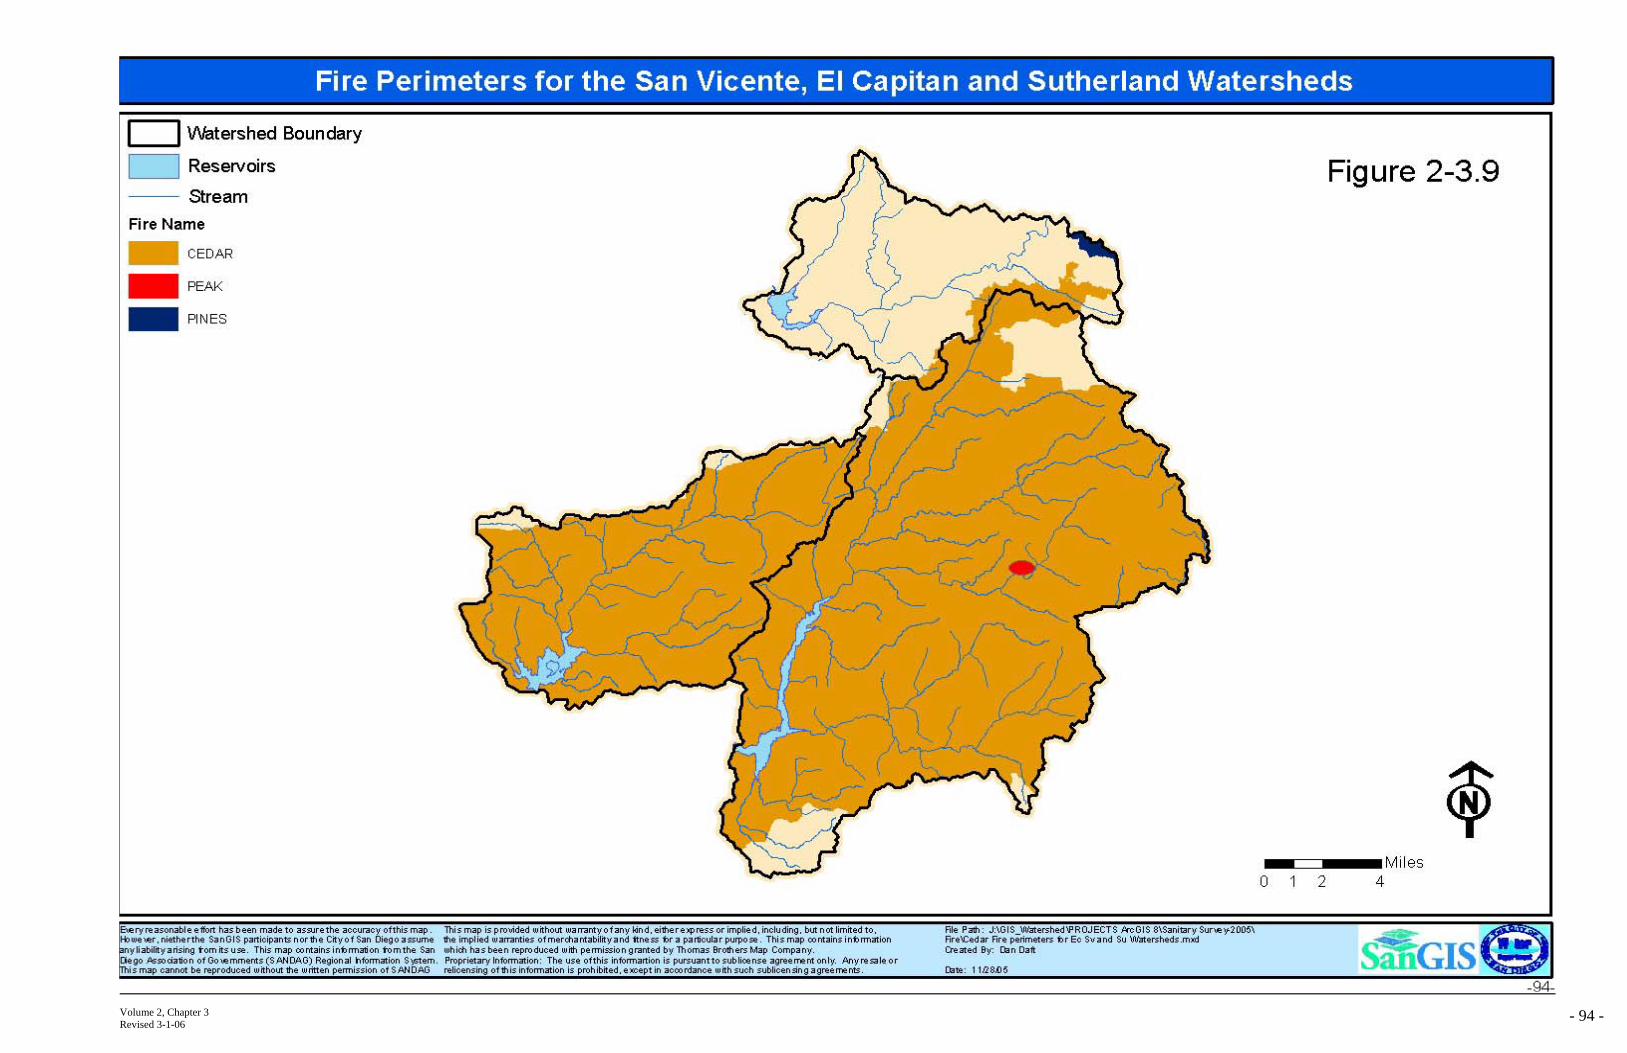
Volume 2, Chapter 3 - 94 -Revised 3-1-06
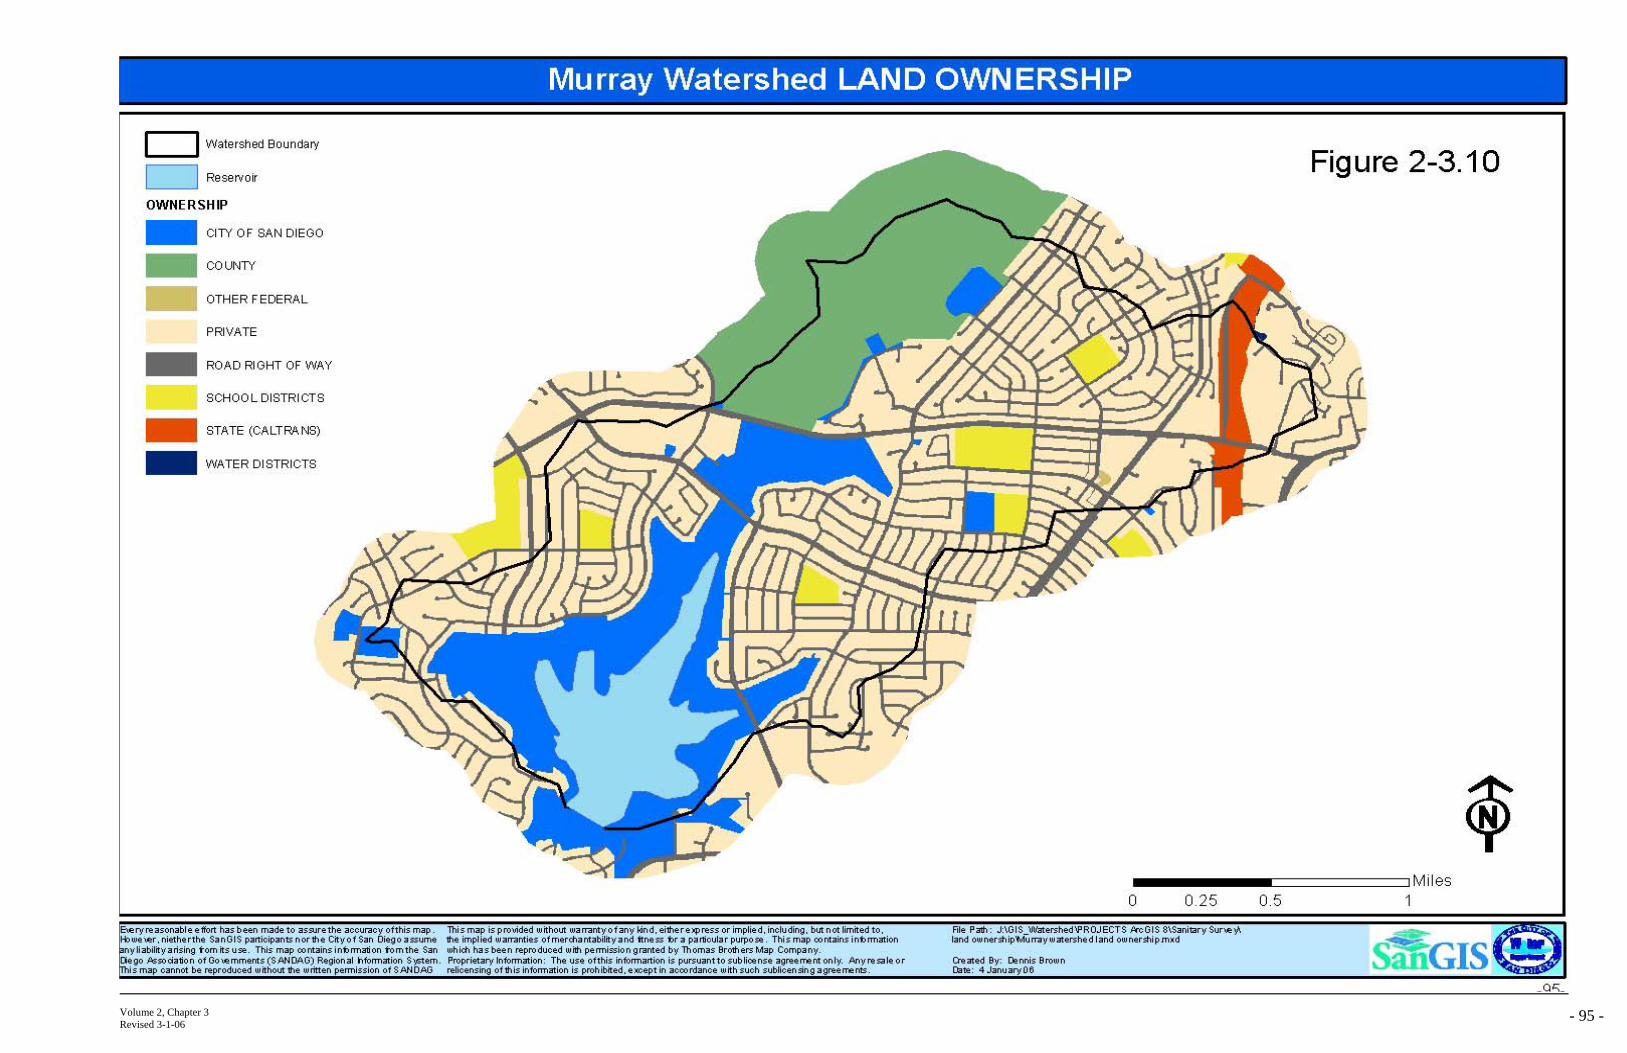
Volume 2, Chapter 3 - 95 -Revised 3-1-06
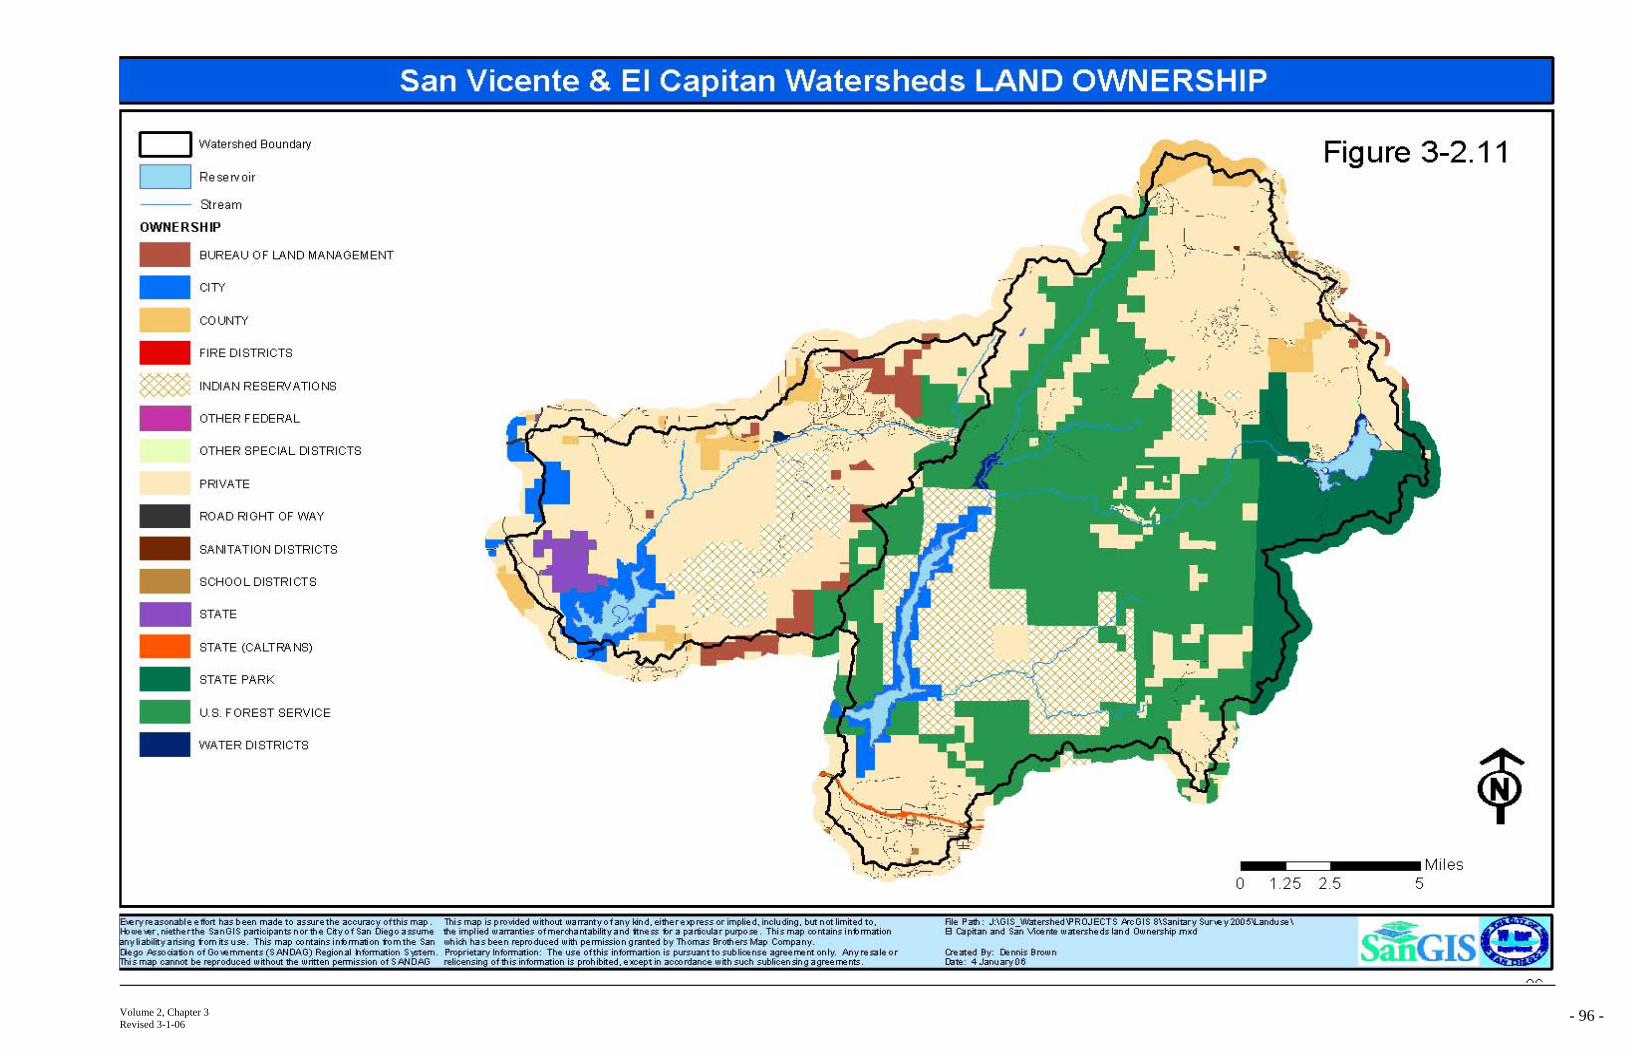
Volume 2, Chapter 3 - 96 -Revised 3-1-06
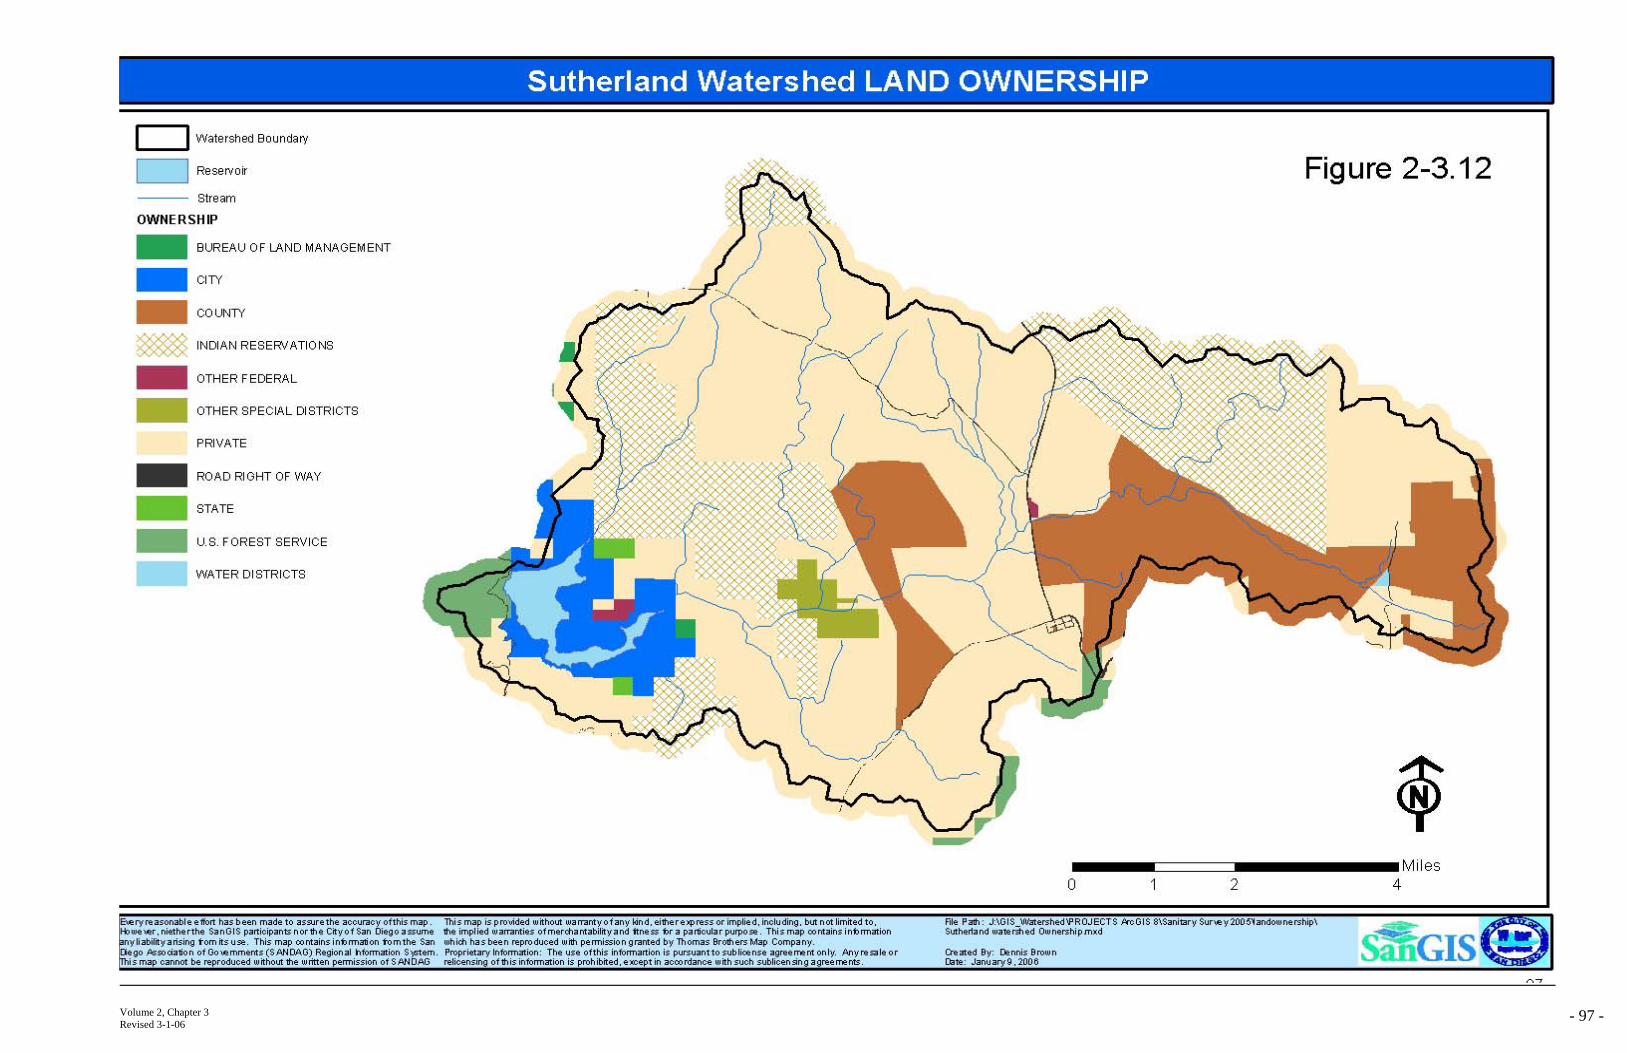
Volume 2, Chapter 3 - 97 -Revised 3-1-06
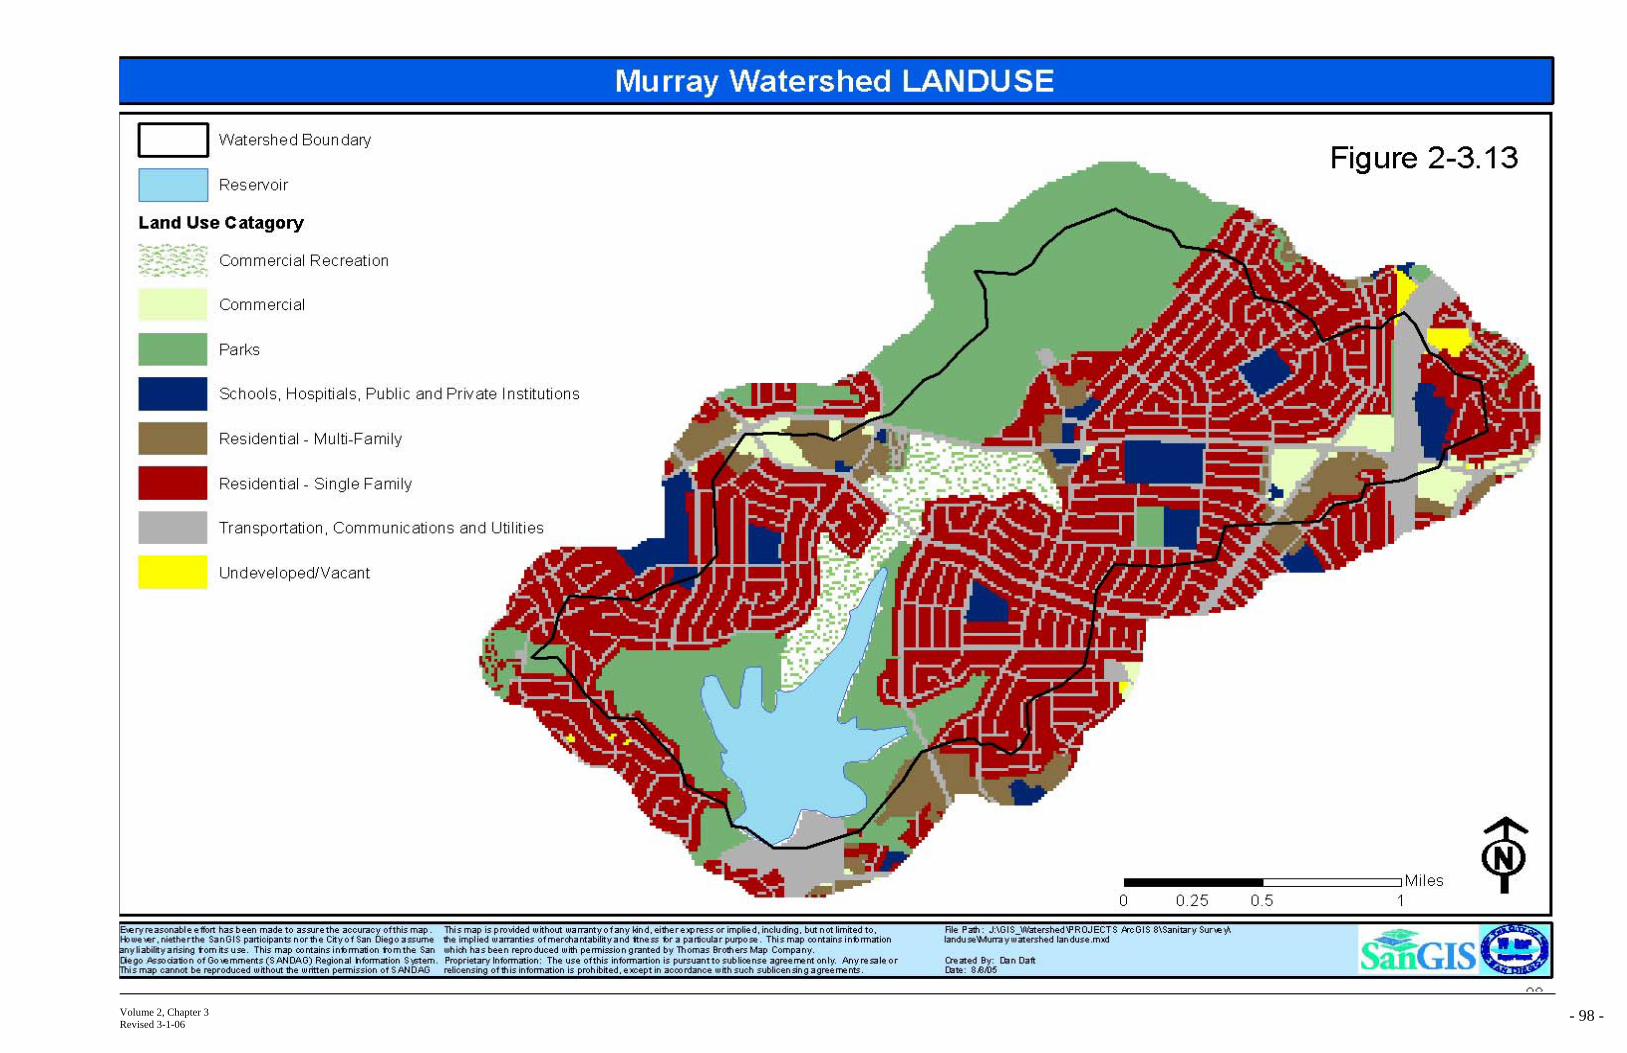
Volume 2, Chapter 3 - 98 -Revised 3-1-06
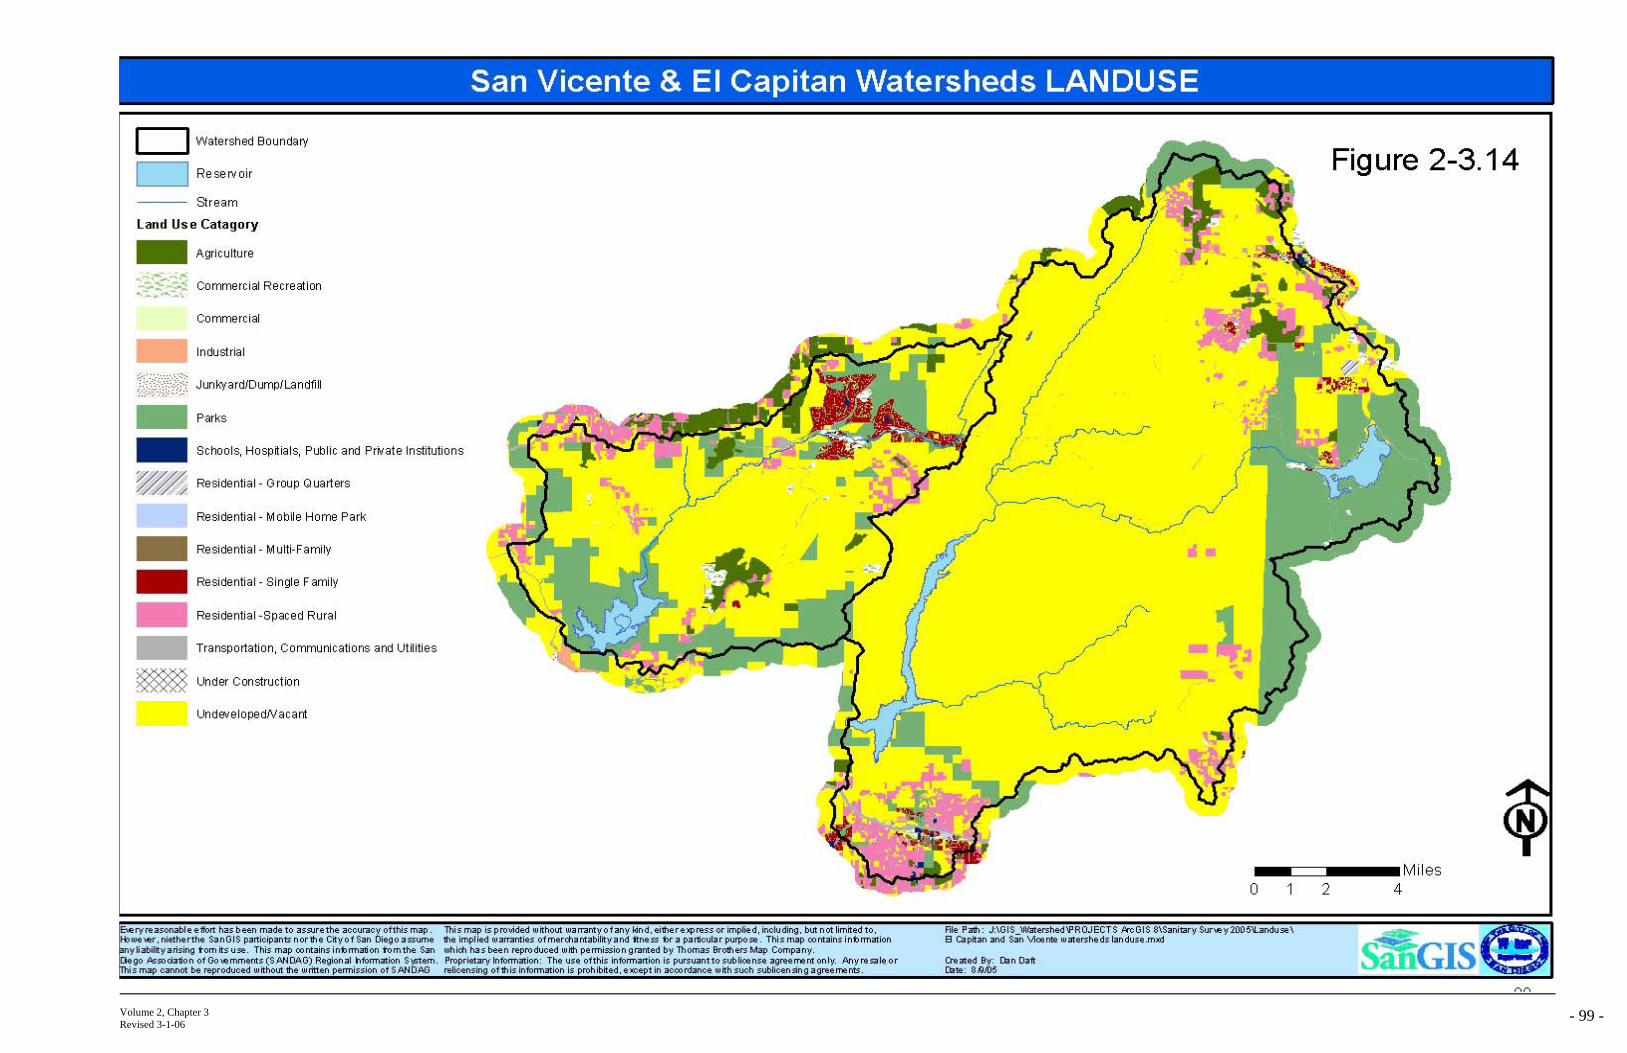
Volume 2, Chapter 3 - 99 -Revised 3-1-06
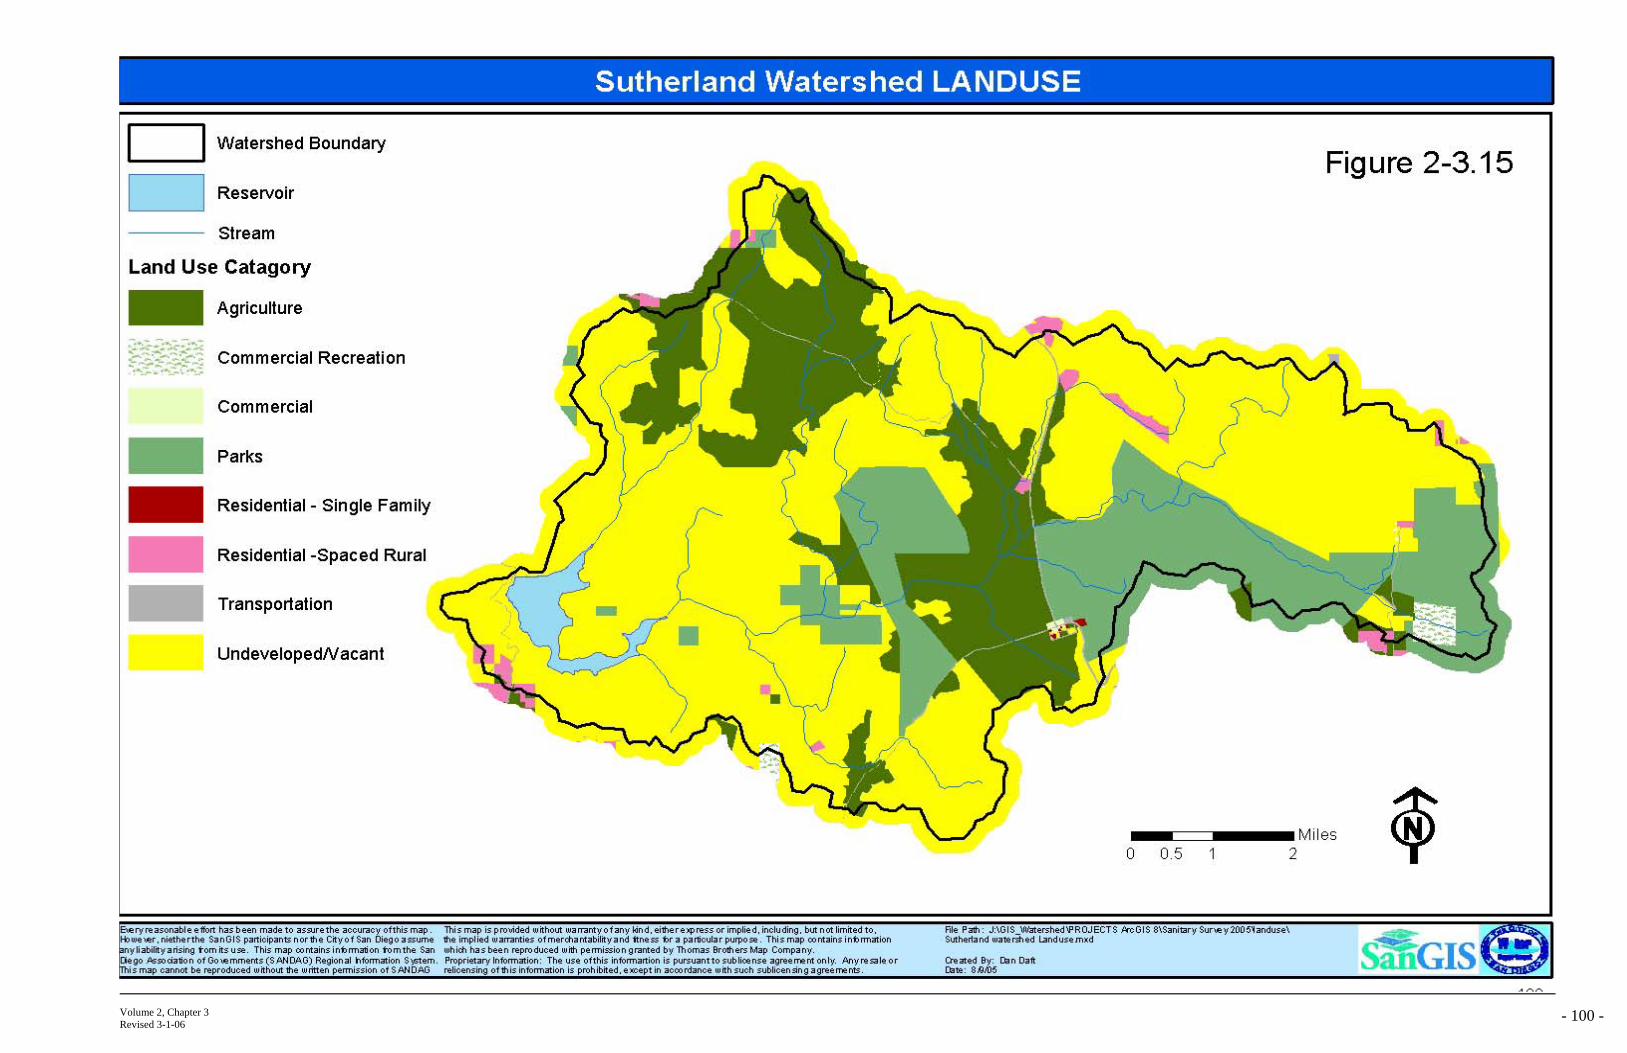
Volume 2, Chapter 3 - 100 -Revised 3-1-06
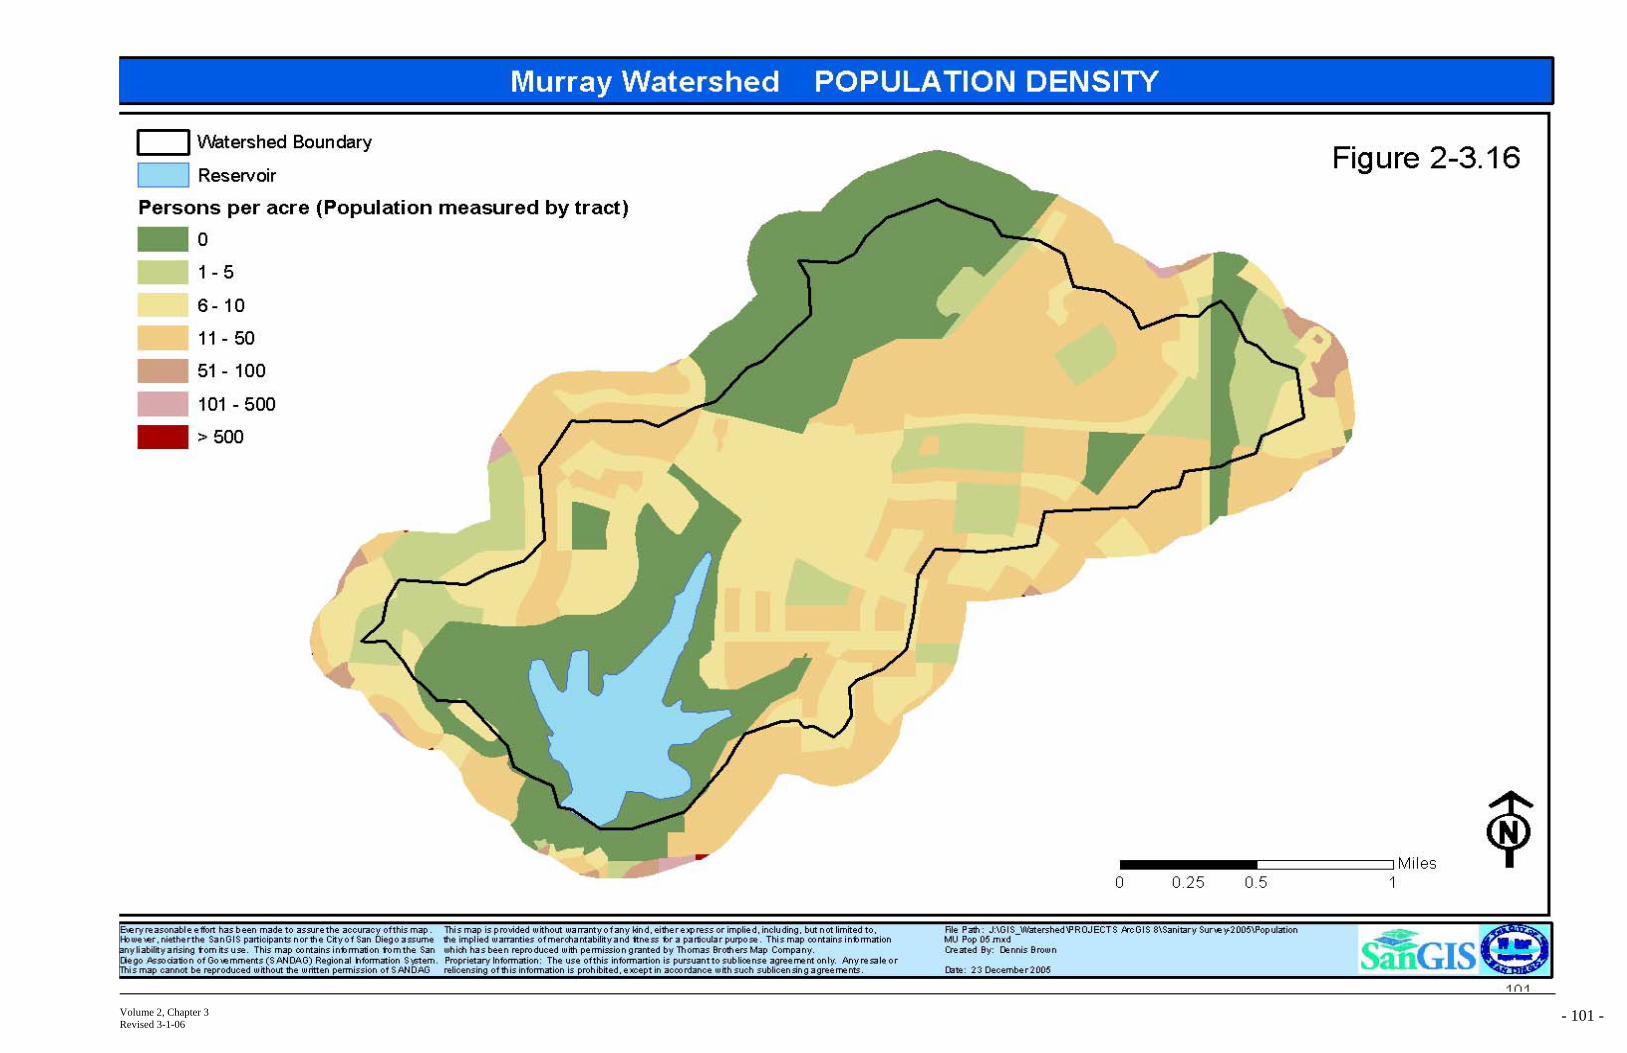
Volume 2, Chapter 3 - 101 -Revised 3-1-06
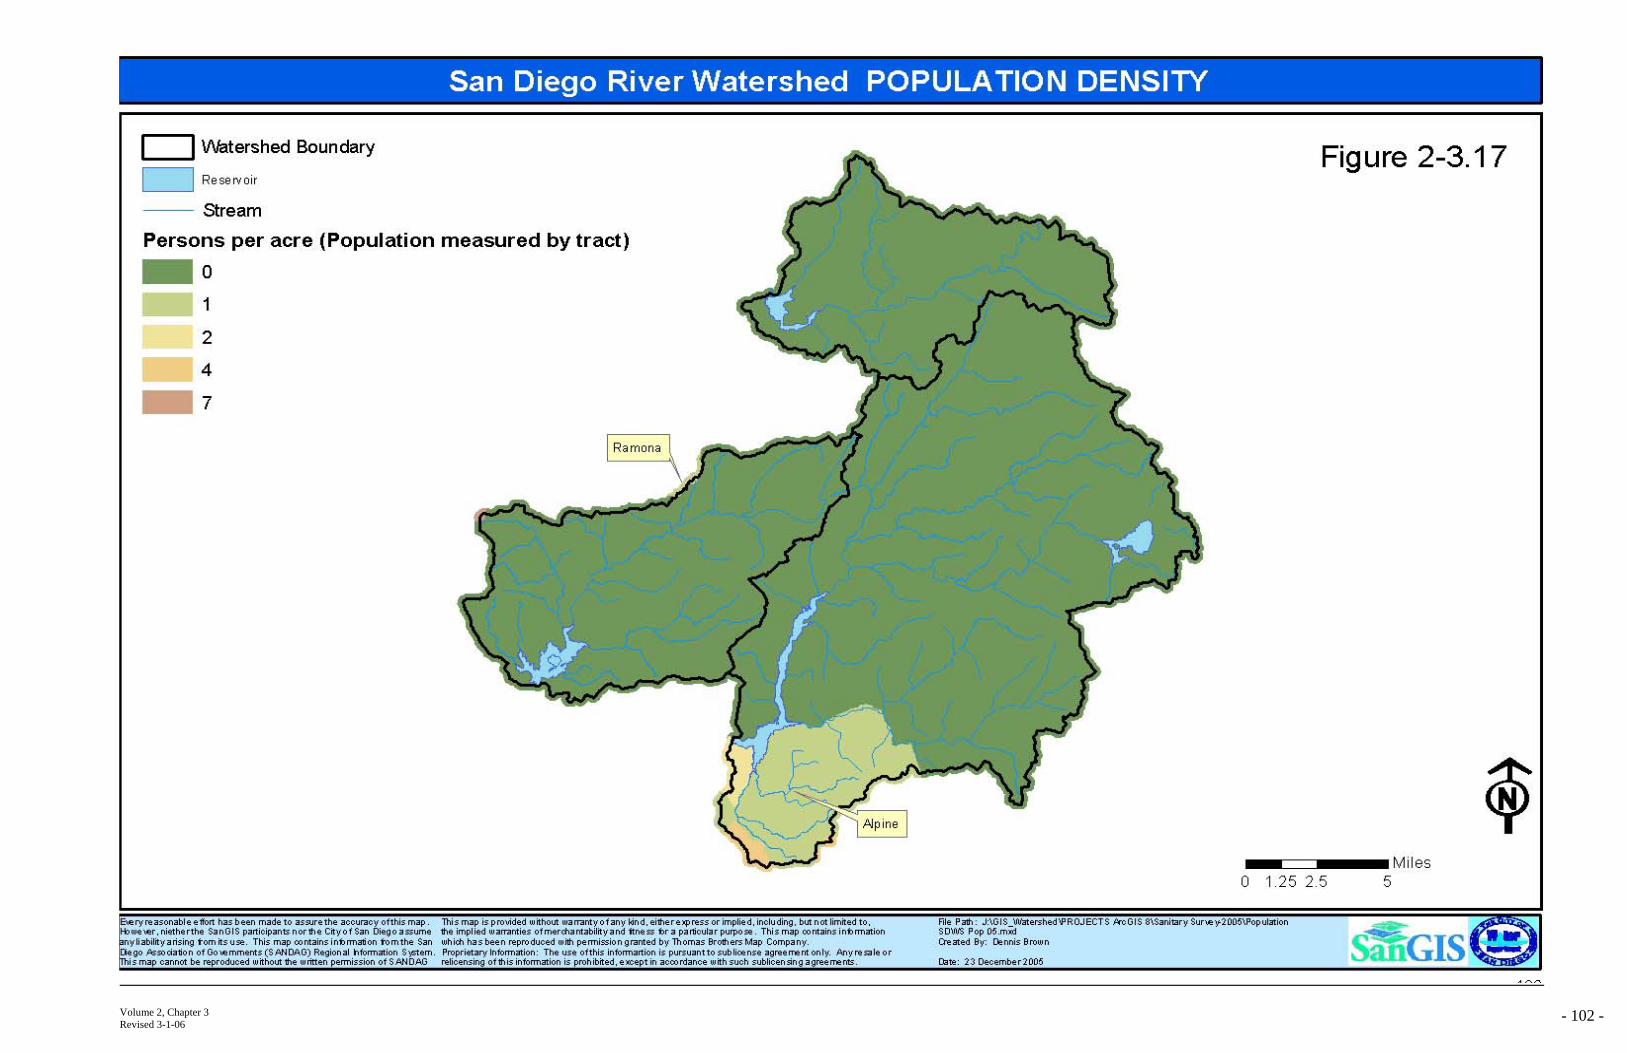
Volume 2, Chapter 3 - 102 -Revised 3-1-06
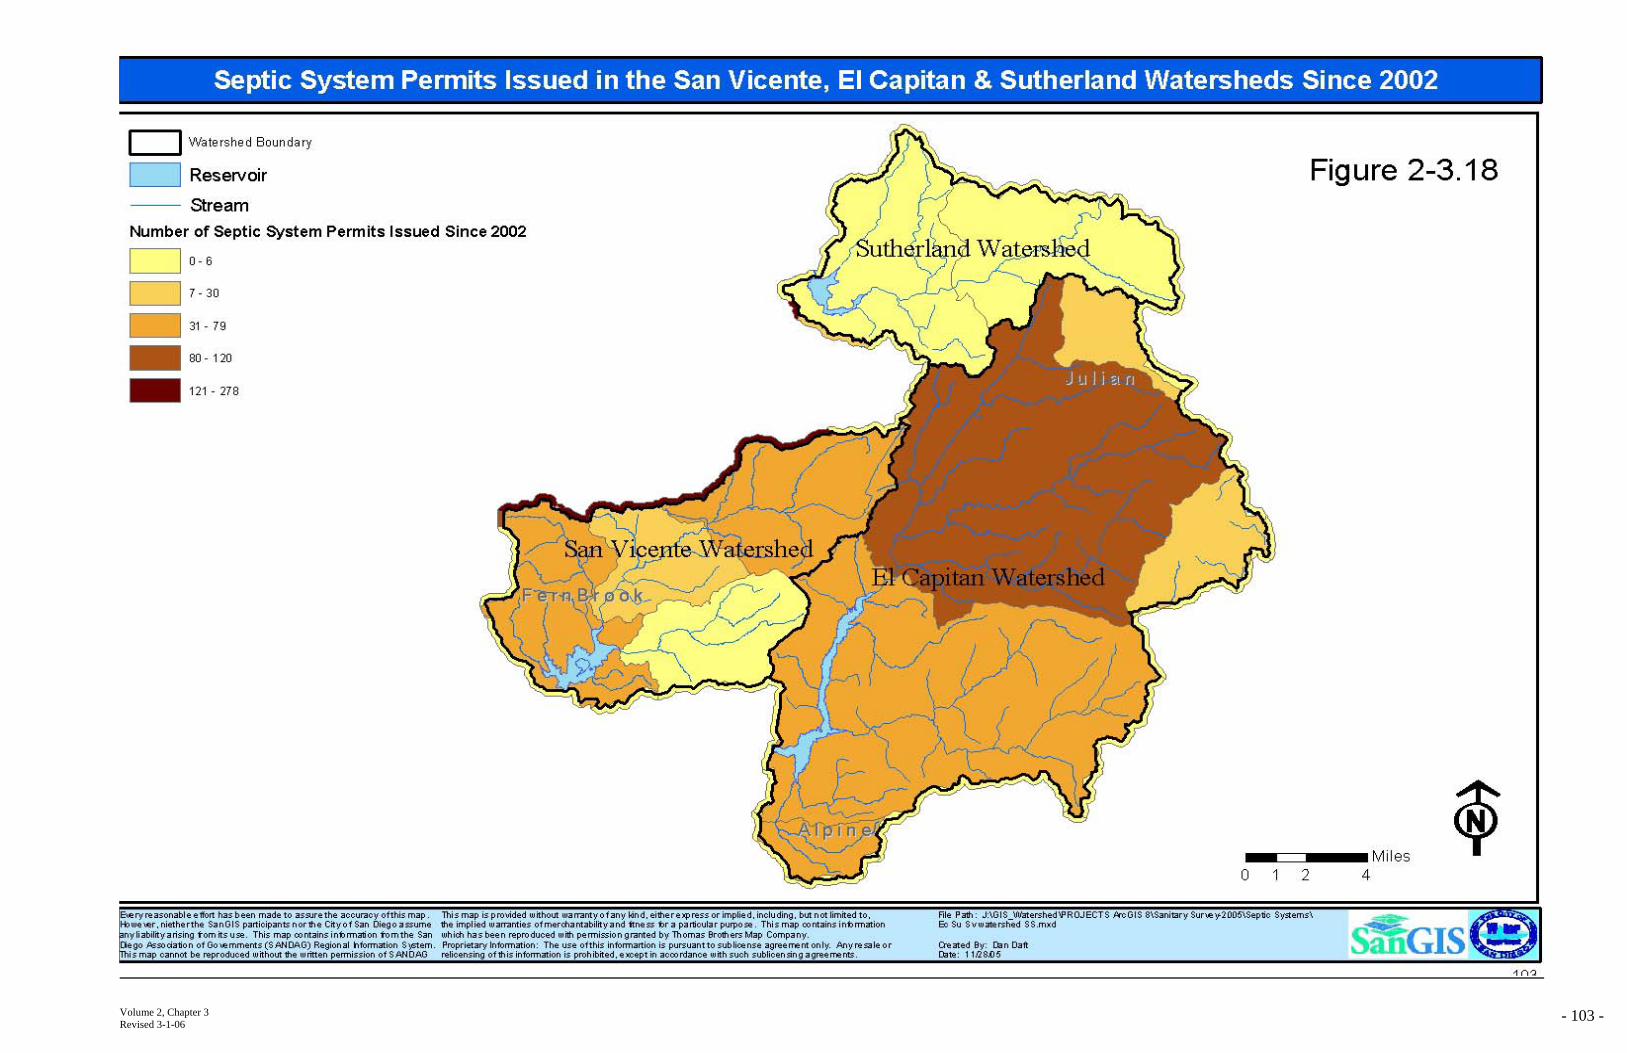
Volume 2, Chapter 3 - 103 -Revised 3-1-06