Embed Size (px)
Citation preview
CHAPTER 2
SOCIO-ECONOMIC CONDITION IN INDONESIA AND IN THE STUDY AREA
2 - 1
CHAPTER 2 : SOCIO-ECONOMIC CONDITION IN INDONESIA AND IN THE STUDY AREA 2.1 Socio-Economic Background
2.1.1 Economic Crisis and Recovery
(1) Economic Crisis
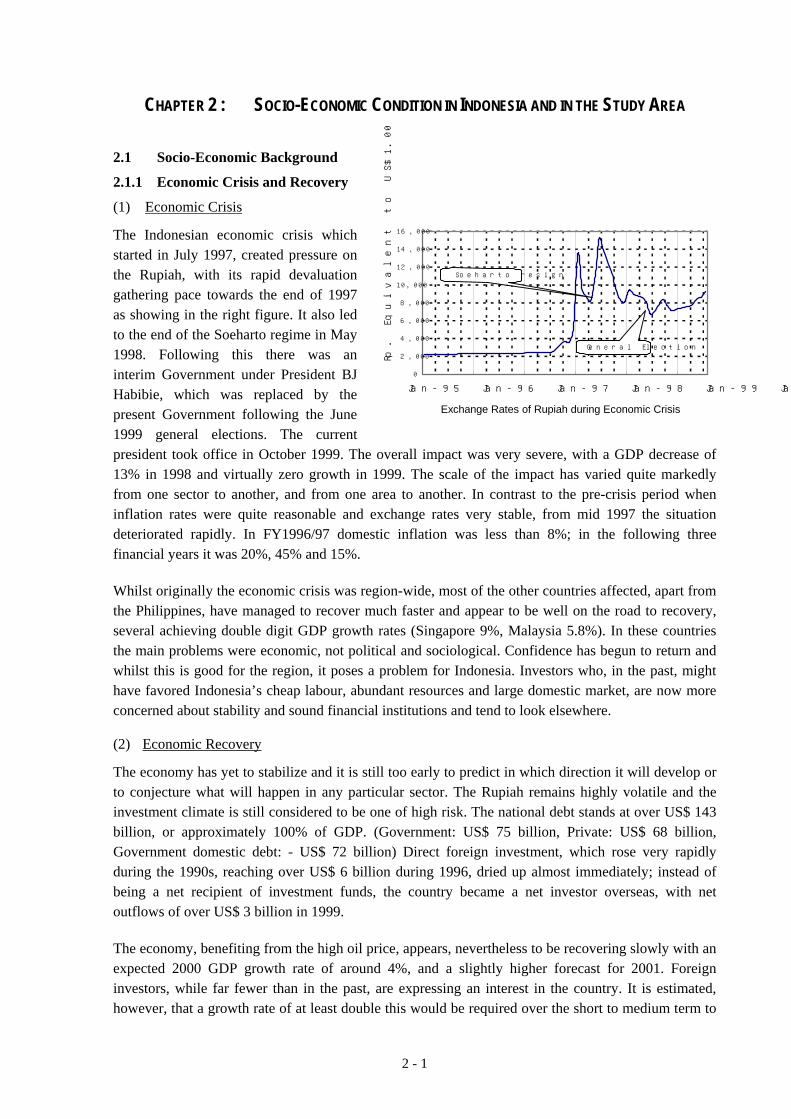
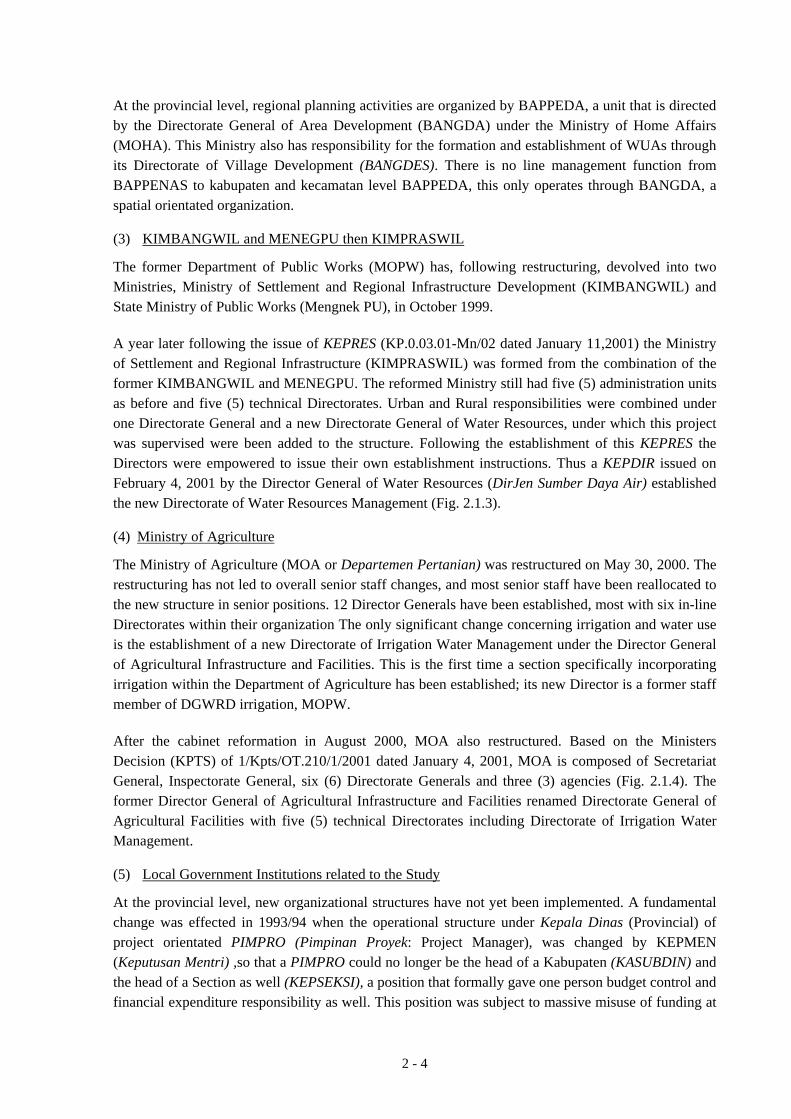
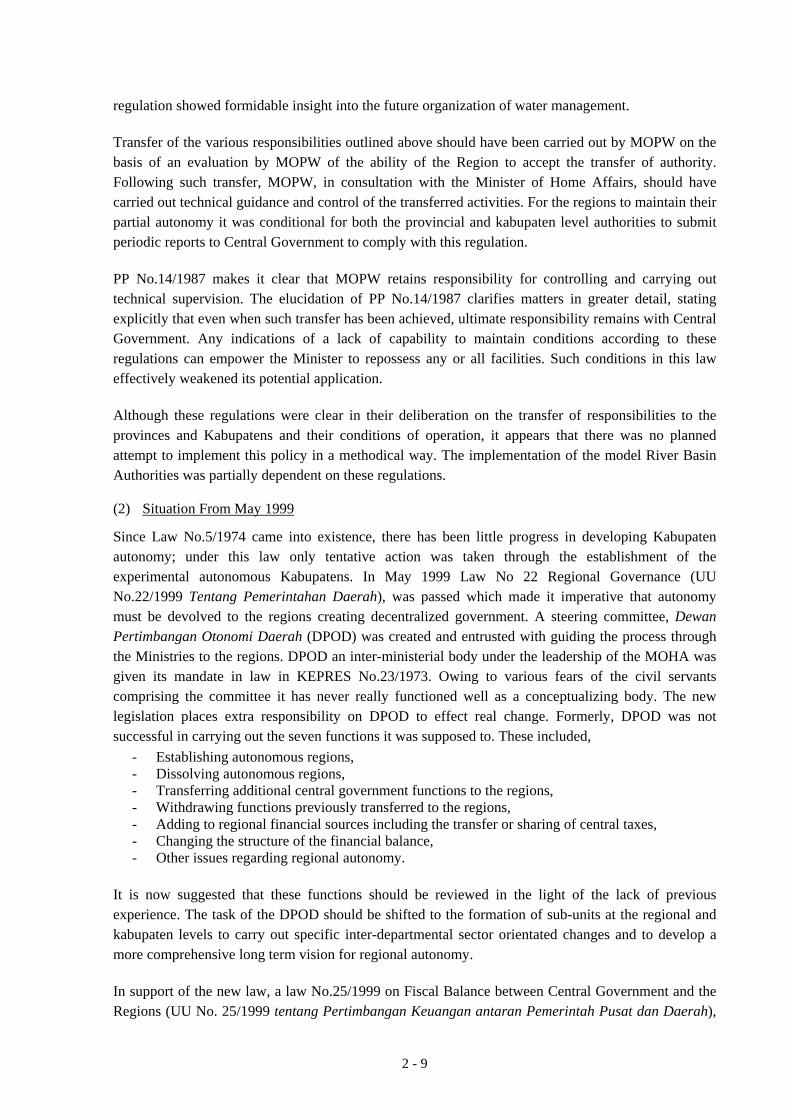
The Indonesian economic crisis which started in July 1997, created pressure on the Rupiah, with its rapid devaluation gathering pace towards the end of 1997 as showing in the right figure. It also led to the end of the Soeharto regime in May 1998. Following this there was an interim Government under President BJ Habibie, which was replaced by the present Government following the June 1999 general elections. The current president took office in October 1999. The overall impact was very severe, with a GDP decrease of 13% in 1998 and virtually zero growth in 1999. The scale of the impact has varied quite markedly from one sector to another, and from one area to another. In contrast to the pre-crisis period when inflation rates were quite reasonable and exchange rates very stable, from mid 1997 the situation deteriorated rapidly. In FY1996/97 domestic inflation was less than 8%; in the following three financial years it was 20%, 45% and 15%. Whilst originally the economic crisis was region-wide, most of the other countries affected, apart from the Philippines, have managed to recover much faster and appear to be well on the road to recovery, several achieving double digit GDP growth rates (Singapore 9%, Malaysia 5.8%). In these countries the main problems were economic, not political and sociological. Confidence has begun to return and whilst this is good for the region, it poses a problem for Indonesia. Investors who, in the past, might have favored Indonesia’s cheap labour, abundant resources and large domestic market, are now more concerned about stability and sound financial institutions and tend to look elsewhere. (2) Economic Recovery
The economy has yet to stabilize and it is still too early to predict in which direction it will develop or to conjecture what will happen in any particular sector. The Rupiah remains highly volatile and the investment climate is still considered to be one of high risk. The national debt stands at over US$ 143 billion, or approximately 100% of GDP. (Government: US$ 75 billion, Private: US$ 68 billion, Government domestic debt: - US$ 72 billion) Direct foreign investment, which rose very rapidly during the 1990s, reaching over US$ 6 billion during 1996, dried up almost immediately; instead of being a net recipient of investment funds, the country became a net investor overseas, with net outflows of over US$ 3 billion in 1999. The economy, benefiting from the high oil price, appears, nevertheless to be recovering slowly with an expected 2000 GDP growth rate of around 4%, and a slightly higher forecast for 2001. Foreign investors, while far fewer than in the past, are expressing an interest in the country. It is estimated, however, that a growth rate of at least double this would be required over the short to medium term to
Exchange Rates of Rupiah during Economic Crisis
0
2,000
4,000
6,000
8,000
10,000
12,000
14,000
16,000
Jan-95 Jan-96 Jan-97 Jan-98 Jan-99 Jan-00R
p. E
quiv
alent
to U
S$1.0
0
General Election
Soeharto resign
2 - 2
create sufficient employment opportunities for those who are currently un- or under-employed and those who will be seeking work for the first time. It is estimated, at current growth rates, that approximately 1.6 million new job opportunities will be created annually; approximately 2 million newcomers enter the job market annually. Although such growth rates would indicate very strong growth if they applied to some of the world’s more developed economies, they do not represent strong economic growth in the Indonesian context. (3) Agriculture under the Crisis
Whilst the overall picture is not particularly bright, with regard to the sector with which this particular Study is concerned, the prospects are generally better. The development of the irrigated food production sector is not heavily dependant on economic activities within other sectors. Being a provider of the basic food commodities destined for domestic consumption, there is little doubt that there will always be a ready market for the commonly grown food products. Whilst the ready availability of crop inputs may not keep pace with past trends, it is unlikely that any serious shortfalls in essential inputs will occur. The economic advantages of providing basic inputs, such as fertilizers, are very evident and it is normal for governments to ensure that such requirements are given priority status. Fortunately Indonesia produces plentiful supplies of urea, although it has to rely on imported materials for the production of phosphatic and potassic fertilizers. Tractor availability is an area where problems have already arisen, but this is not considered to be of major importance as there are alternative means of cultivation. The only real potential danger facing the irrigated cropping sector concerns the sustainability of the irrigation infrastructure. Whilst this is unlikely to be a serious problem in the short turn, any prolonged failure to maintain the condition of this infrastructure could have severe long-term consequences, in terms of reduced food production, reduced farm incomes and increased rehabilitation costs. Although attempts have been made over a number of years to shift the responsibility for O&M from Government to the farmer, the results have been fairly insignificant. It would appear that the rate at which the condition of irrigation systems is declining is greater at present than it has been for many years. In the longer term, the decentralization policy may prove to be advantageous to the irrigation sector. It is difficult, however, to envisage that particular as there is the impending changes are likely to yield many short-term benefits to the irrigation sector over the current situation, in terms of fund availability for O&M, the strengthening of WUAs or for rehabilitation. There is already some concern that the imposition of local taxes on the inter-provincial movement of produce will hamper the operation of the relatively free market in food products, possibility of multiple taxes. There is no guarantee, when the kabupaten begin to sort out their revenue sources, that they will give high priority to irrigation; they could well find themselves being obliged to place more emphasis on other, more pressing, issues as they take on control of education, health, transport, land rights and investment proposals. The current guidelines on local revenue collection are that 80% of revenue from mining, forestry and fisheries, 30% from gas and 15% from oil were go to the region. It is perhaps somewhat unfortunate that the implementation of the decentralization program has reached the stage that it has, coinciding with this period of political and economic instability.
2 - 3
2.1.2 Institutional Reform
(1) General
Weak and corrupt institutions prior to the 1997 economic crisis virtually demanded a review and reformation of the New Order structure. Reforms, based on a four-pronged strategy effecting the macro-economy, financial restructuring, acknowledgement of the need for poverty alleviation and the reform of economic institutions have slowly been developed and are currently still being implemented. The IMF and the main donor agencies, including bilateral agencies, have assisted and are still assisting in the restructuring, adjustment and reform programs. Decrees of the Peoples Consultative Committee within the House of Representative (MPR, October 1998) have been based on the principles of decentralized government and local community empowerment, state revenue sharing, transparency and democracy. Regional development will be organized on a system of regional autonomy and involve the following:
- provision of balanced finances, - transparent management of natural resources and responsibility for environmental conservation, - just allocation of natural resources, including land for agri-business management, with priority
given to small and medium enterprises and cooperatives, - priority attention towards small undercapitalized enterprises to develop autonomous status, - abolition of all forms of centralized powers and ownership.
The Government has completely restructured its main cabinet. The main changes were made through the interim ‘Reformasi’ government of Mr. B. J. Habibie. The newly elected government (May 1998) of ‘Persatuan Indonesia’1 under the Presidency of Abdurrahaman Wahid has largely confirmed these changes with some policy modification, but with a similar agenda. The reformed cabinet contains three Coordinating Ministries,
- for politics and security affairs with four ministries, - for economic financial and industrial affairs, with seven economic ministries, and - for peoples’ welfare and poverty eradication, with five social ministries.
In addition, 13 state ministries have been established covering all sectors of the State’s requirements: the tasks and functions of these State Ministries are outlined briefly in KEPRES No.134 of 1999 (Fig.2.1.1). Having served their purpose and designed new policy covering their special fields of influence State Ministries were reabsorbed into their coordinating Ministry as of January 2001 and with a few exceptions no longer exist (Fig. 2.1.2). The reformed new Ministries such as KIMPRASWIL have from the middle of the year received instructions that they will receive reduced budgets to encourage them to streamline their staff structure and number of personnel. (2) BAPPENAS, Provincial/Kabupaten BAPPEDA
The National Development Planning Agency (BAPPENAS), which is charged with ratifying all national development works’ proposals in both the public and private sectors. The newly structured BAPPENAS has five Sector Deputies, each comprising six Bureaus. Within the Production, Trade and Infrastructure Sector, the Bureau of Food, Agriculture and Irrigation, provides a representative to the Study’s Steering Committee. 1 National Unity Government
2 - 4
At the provincial level, regional planning activities are organized by BAPPEDA, a unit that is directed by the Directorate General of Area Development (BANGDA) under the Ministry of Home Affairs (MOHA). This Ministry also has responsibility for the formation and establishment of WUAs through its Directorate of Village Development (BANGDES). There is no line management function from BAPPENAS to kabupaten and kecamatan level BAPPEDA, this only operates through BANGDA, a spatial orientated organization. (3) KIMBANGWIL and MENEGPU then KIMPRASWIL
The former Department of Public Works (MOPW) has, following restructuring, devolved into two Ministries, Ministry of Settlement and Regional Infrastructure Development (KIMBANGWIL) and State Ministry of Public Works (Mengnek PU), in October 1999. A year later following the issue of KEPRES (KP.0.03.01-Mn/02 dated January 11,2001) the Ministry of Settlement and Regional Infrastructure (KIMPRASWIL) was formed from the combination of the former KIMBANGWIL and MENEGPU. The reformed Ministry still had five (5) administration units as before and five (5) technical Directorates. Urban and Rural responsibilities were combined under one Directorate General and a new Directorate General of Water Resources, under which this project was supervised were been added to the structure. Following the establishment of this KEPRES the Directors were empowered to issue their own establishment instructions. Thus a KEPDIR issued on February 4, 2001 by the Director General of Water Resources (DirJen Sumber Daya Air) established the new Directorate of Water Resources Management (Fig. 2.1.3). (4) Ministry of Agriculture
The Ministry of Agriculture (MOA or Departemen Pertanian) was restructured on May 30, 2000. The restructuring has not led to overall senior staff changes, and most senior staff have been reallocated to the new structure in senior positions. 12 Director Generals have been established, most with six in-line Directorates within their organization The only significant change concerning irrigation and water use is the establishment of a new Directorate of Irrigation Water Management under the Director General of Agricultural Infrastructure and Facilities. This is the first time a section specifically incorporating irrigation within the Department of Agriculture has been established; its new Director is a former staff member of DGWRD irrigation, MOPW. After the cabinet reformation in August 2000, MOA also restructured. Based on the Ministers Decision (KPTS) of 1/Kpts/OT.210/1/2001 dated January 4, 2001, MOA is composed of Secretariat General, Inspectorate General, six (6) Directorate Generals and three (3) agencies (Fig. 2.1.4). The former Director General of Agricultural Infrastructure and Facilities renamed Directorate General of Agricultural Facilities with five (5) technical Directorates including Directorate of Irrigation Water Management. (5) Local Government Institutions related to the Study
At the provincial level, new organizational structures have not yet been implemented. A fundamental change was effected in 1993/94 when the operational structure under Kepala Dinas (Provincial) of project orientated PIMPRO (Pimpinan Proyek: Project Manager), was changed by KEPMEN (Keputusan Mentri) ,so that a PIMPRO could no longer be the head of a Kabupaten (KASUBDIN) and the head of a Section as well (KEPSEKSI), a position that formally gave one person budget control and financial expenditure responsibility as well. This position was subject to massive misuse of funding at
2 - 5
the field level, particularly where construction and rehabilitation projects were the main field programs. This single change in task and function of this position has led to greater transparency at the district levels. The system of Provincial level management of central government funds was formerly done through the offices of the central government’s representative offices in each Province (KANWIL). Since the establishment of KIMBANGWIL in early 2000 the KANWIL has ceased to operate tuning their funds over to Dinas PUP. 2.1.3 National Food Security and Agriculture
(1) Food Consumption Trends
In Indonesia, it appears that the people had just started to diversify their food consumption patterns as a consequence of the remarkable economic growth experienced during the last decade. It is expected that the following trends will accelerate in the future, even though the trends fell off temporarily in 1998 as a result of the economic crisis.
- rice is still the dominant food, but average per capita consumption levels did not change significantly after 1990;
- wheat and soybean consumption has increased remarkably, - in contrast, root crops consumption has decreased, - maize utilization is increasing, primarily as livestock feed. in terms of human consumption the
trend is steady or slightly declining. - consumption of other foods, except milk, shows substantial increases.
Government is aware of these trends in food consumption and has taken them into account in the agricultural development policy mentioned below. (2) Food Security Policy and Rice Policy
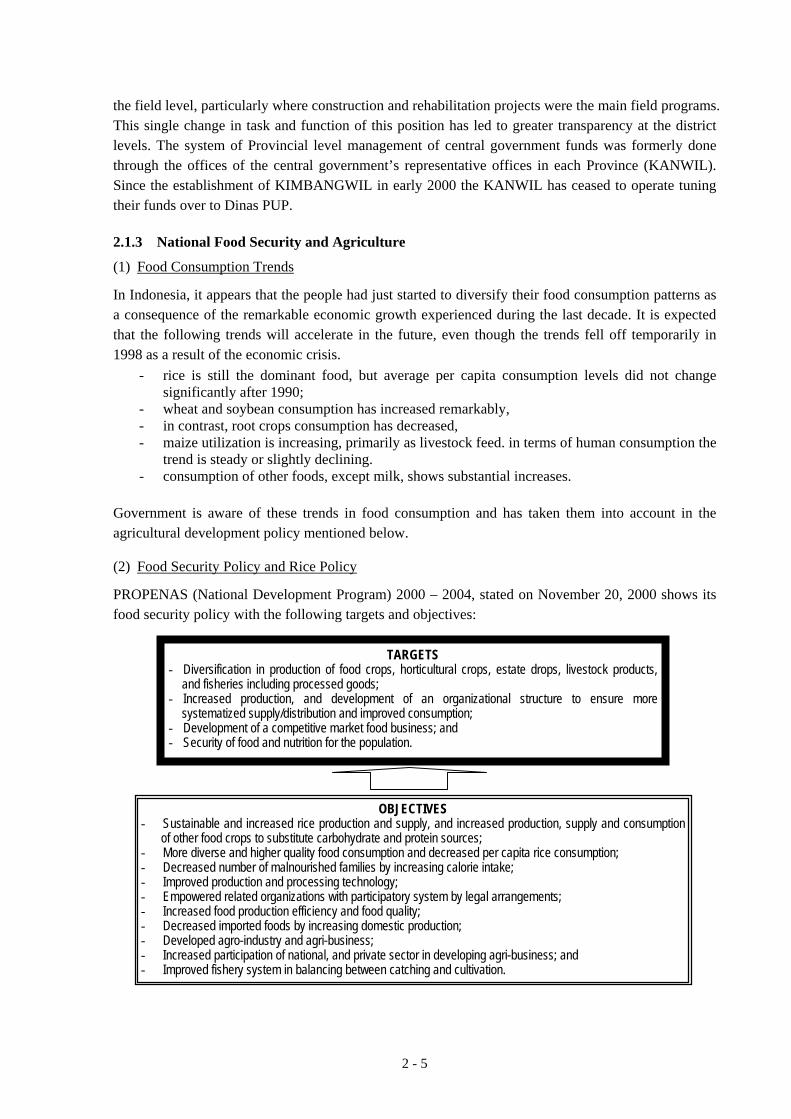
PROPENAS (National Development Program) 2000 – 2004, stated on November 20, 2000 shows its food security policy with the following targets and objectives:
TARGETS - Diversification in production of food crops, horticultural crops, estate drops, livestock products,
and fisheries including processed goods; - Increased production, and development of an organizational structure to ensure more
systematized supply/distribution and improved consumption; - Development of a competitive market food business; and - Security of food and nutrition for the population.
OBJECTIVES - Sustainable and increased rice production and supply, and increased production, supply and consumption
of other food crops to substitute carbohydrate and protein sources; - More diverse and higher quality food consumption and decreased per capita rice consumption; - Decreased number of malnourished families by increasing calorie intake; - Improved production and processing technology; - Empowered related organizations with participatory system by legal arrangements; - Increased food production efficiency and food quality; - Decreased imported foods by increasing domestic production; - Developed agro-industry and agri-business; - Increased participation of national, and private sector in developing agri-business; and - Improved fishery system in balancing between catching and cultivation.
2 - 6
PROPENAS indicates that Government intends to emphasize food diversification to reduce the burden on rice, even though it mentions the need for increased rice production and supply. PROPENAS also intends to develop a balanced food security system not only aiming at increasing production but also at developing a sound distribution system, through the improvement of market channels and reserves. The intention of establishing the balanced food security system seems to be very reasonable. It is generally considered that a food security system, without an attention to smooth and equitable distribution, does not contribute to a national food security, even though a domestic food production is well secured. The rice crisis in 1998 in Indonesia revealed that a disordered rice distribution system had a stronger negative impact upon the food security than the poor harvest caused by El Nino.
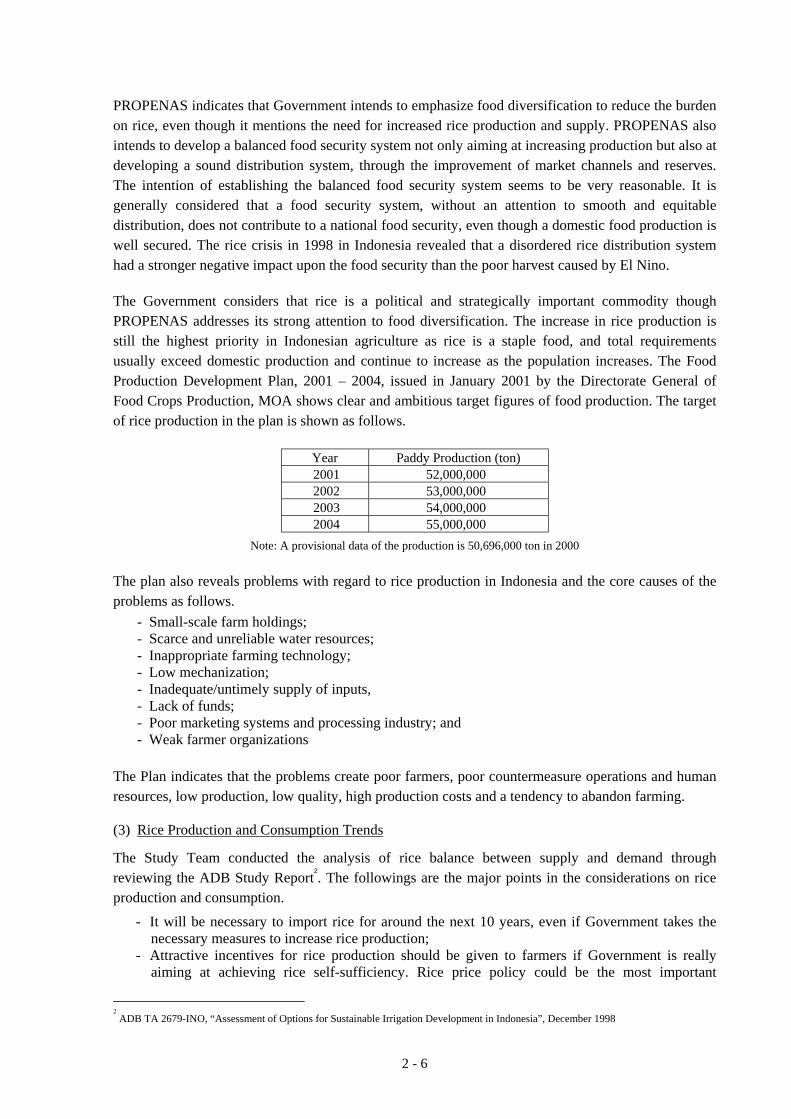
The Government considers that rice is a political and strategically important commodity though PROPENAS addresses its strong attention to food diversification. The increase in rice production is still the highest priority in Indonesian agriculture as rice is a staple food, and total requirements usually exceed domestic production and continue to increase as the population increases. The Food Production Development Plan, 2001 – 2004, issued in January 2001 by the Directorate General of Food Crops Production, MOA shows clear and ambitious target figures of food production. The target of rice production in the plan is shown as follows.
Year Paddy Production (ton) 2001 52,000,000 2002 53,000,000 2003 54,000,000 2004 55,000,000
Note: A provisional data of the production is 50,696,000 ton in 2000 The plan also reveals problems with regard to rice production in Indonesia and the core causes of the problems as follows.
- Small-scale farm holdings; - Scarce and unreliable water resources; - Inappropriate farming technology; - Low mechanization; - Inadequate/untimely supply of inputs, - Lack of funds; - Poor marketing systems and processing industry; and - Weak farmer organizations
The Plan indicates that the problems create poor farmers, poor countermeasure operations and human resources, low production, low quality, high production costs and a tendency to abandon farming. (3) Rice Production and Consumption Trends
The Study Team conducted the analysis of rice balance between supply and demand through reviewing the ADB Study Report2. The followings are the major points in the considerations on rice production and consumption.
- It will be necessary to import rice for around the next 10 years, even if Government takes the necessary measures to increase rice production;
- Attractive incentives for rice production should be given to farmers if Government is really aiming at achieving rice self-sufficiency. Rice price policy could be the most important
2 ADB TA 2679-INO, “Assessment of Options for Sustainable Irrigation Development in Indonesia”, December 1998
2 - 7
incentive; - Government should shift its interest in rice production policy from on-Java to off-Java. It is
assumed that Java will phase its presence in rice production out with the economic development;
- Per capita rice consumption is influenced by economic growth and is likely to decrease with the anticipated increase of per capita GDP within a few years. The rate of decrease is likely to accelerate once the downward-tend commences. Small changes in per capita consumption would have a marked impact on overall consumption;
- Indonesia could have a substantial rice surplus after 15 to 20 years if rice production increases steadily as a result of positive Government incentives. It would, however, be difficult to sell the surplus profitably on the international market without reducing rice production costs through the improvement in farming efficiency;
- As it is expected that the trends of rice consumption and production will rapidly change with the economic development trend, Government should set up a monitoring system on the trends by using related data3 and information for maintaining the balance of rice supply and demand within an acceptable range. Government should establish a practical and flexible rice security policy based on a reliable data and information.
According to the experience during the economic crisis in 1998, there is no doubt that Government should secure first a stable supply of rice for national food security. In consideration of the importance of rice and the future demand, rice production increase should have higher priority over all other agricultural commodity production in the irrigated areas. As well as rice production, Government should pay particular attention to strengthen a total rice security system as declared in “Act of the Republic of Indonesia No.7 of 1996 on Food”. The JBIC (former OECF)4 report to investigate the rice crisis in 1998 in Indonesia revealed that a disorganized rice distribution system during the economic crisis made a strong negative impact upon the rice crisis. Government should develop a fair and reasonable rice trading system and should empower a strategic reserve policy of rice. Rice trade policy is a very important and complicated issue to consider in relation to the food security situation in Indonesia. Indonesia could give up its rice self-sufficiency policy because the international rice price is cheaper than Indonesian rice, and farmers would then start to grow more profitable crops in search of higher incomes. That is indeed a matter of national policy to be decided by Government. It is, however, considered that it would be preferable to keep flexibility in rice trade policy. According to the Study Team’s assumption, Indonesia will need to import rice for around 10 years, and then it might have a substantial surplus of rice after 15 to 20 years (details available in Annex A), if rice production increases steadily in line with the implementation of favorable Government policy. The surplus might occur earlier if there were to be a rapid per capita consumption decrease resulting from a rapid increase in per capita GDP. Government needs to have in place an easy adjustment system to help balance the supply and demand of rice, when it reaches a transition period from deficit to surplus
3 Many doubts were expressed concerning the reliability of statistical data in Indonesia including rice production and consumption. There are many discrepancies between data from one source and another source. To obtain reasonable monitoring results, a comprehensive review must be made of the data collection system in rice production and consumption. According to the Jakarta Post on Oct 17, 2000, the Director General for Food Crops, Ministry of Agriculture and Forestry stated that Indonesia had become self-sufficient in rice after years of falling production, because rice production this year amounts to 50 million tons in paddy, equivalent to 30 million tons in milled rice. That is very welcome news if it is true. It is, however, difficult to explain the substantial volume of rice imports during the in last three years, if 50 million tons of paddy is considered as a self-sufficiency level. Paddy production was 49.4 million tons, 49.2 million tons and 50.4 million tons in 1997, 1998 and 1999 respectively according to the government statistical data. It is not an important matter whether 50 million tons of paddy is enough for the self-sufficiency or not at this time; the important thing is how Government is to establish a reliable and transparent monitoring system to avoid confusing or misleading rice policies
4 “Current Situation of Rice Distribution System in Indonesia”, Dec. 1999, JBIC
2 - 8
2.1.4 Decentralization and Autonomy of Regional Government
(1) Situation to April 1999
Early legislation established that responsibility for water in the regions could have been delegated from MOPW to regional government; two main regulations empowered the Minister with this task.
- PP 22 of 1982 known as the Water Management Regulation is pursuant on Article 5 of the Constitution, Law No.5/1960 Basic Agrarian Rules, Law No.5/1974 Local Government Administration, Law No.11/1974 Water Resources Development, and Law No.4/1982 Principle of Environmental Management.
- PP No.14/1987, the Transfer of Partial Government Administration in Public Works Sector to the Regional Level. This regulation is pursuant on the same part of the constitution as referenced above and Law No.5/1974, Law No.11/1974 as referred to above and to another law No.13/1980, on Roads.
PP 22/1982 authorized the management of water at the regional levels on the basis of water basins and it also specified that two or more natural drainage basins could form a river basin for the purposes of planning or management. Authority may be delegated from MOPW to the regional/local government for river basins, which are in their jurisdiction, except where prior legislation exists. Priority of use and the right of use is given to drinking water and the individual. Article 15 stipulates, “in the case of water users community should be licensed to abstract water from a specified intake on the river or canal and that allocation of water among the members of the community should be arranged by the concerned group based on guidelines provided by the Governor” Under this law clear instruction of the delegation of authority from center to region and below to water basin level was given. Instruction was also given to delegate authority to the Governor to license water user groups to abstract water from specific locations. This aspect of these regulations has never been enacted owing perhaps to the centralist policies and thinking of the time (March 1982) and also owing to the interpretation of capabilities at the provincial and kabupaten levels. PP 14/1987 is much more specific in its content concerning the construction element of public works at the regional and local level. Ten items of water resource development are presented under this law comprising,
- Instruction on plans for irrigation supply, - Implementation of irrigation supply, - Permission to utilize water for irrigation supply, - Determination of irrigation supply for allocating water effectively, - Determination of priority of irrigation water supply, concomitant with local conditions, - Construction and improvement of main and supporting irrigation networks, - Operation and maintenance of the irrigation network from source to within 50m of the tertiary
outlet, - Securing sustainable actions for the irrigation network function and supporting facilities, - Issue of permits for modification, clearance and cleaning of channels in the network, - Issue of permits for construction of other structures modifying, clearing or crossing the network .
The law also states that parts of the sector may be entrusted to the kabupaten government level. Here, specifically, the establishment and development of WUAs, organizationally, technically, and financially are viewed as being capable of being entrusted with the task and obligation for construction, rehabilitation, operation and maintenance, of the irrigation networks. In 1987, the preparation of this
2 - 9
regulation showed formidable insight into the future organization of water management. Transfer of the various responsibilities outlined above should have been carried out by MOPW on the basis of an evaluation by MOPW of the ability of the Region to accept the transfer of authority. Following such transfer, MOPW, in consultation with the Minister of Home Affairs, should have carried out technical guidance and control of the transferred activities. For the regions to maintain their partial autonomy it was conditional for both the provincial and kabupaten level authorities to submit periodic reports to Central Government to comply with this regulation. PP No.14/1987 makes it clear that MOPW retains responsibility for controlling and carrying out technical supervision. The elucidation of PP No.14/1987 clarifies matters in greater detail, stating explicitly that even when such transfer has been achieved, ultimate responsibility remains with Central Government. Any indications of a lack of capability to maintain conditions according to these regulations can empower the Minister to repossess any or all facilities. Such conditions in this law effectively weakened its potential application. Although these regulations were clear in their deliberation on the transfer of responsibilities to the provinces and Kabupatens and their conditions of operation, it appears that there was no planned attempt to implement this policy in a methodical way. The implementation of the model River Basin Authorities was partially dependent on these regulations. (2) Situation From May 1999
Since Law No.5/1974 came into existence, there has been little progress in developing Kabupaten autonomy; under this law only tentative action was taken through the establishment of the experimental autonomous Kabupatens. In May 1999 Law No 22 Regional Governance (UU No.22/1999 Tentang Pemerintahan Daerah), was passed which made it imperative that autonomy must be devolved to the regions creating decentralized government. A steering committee, Dewan Pertimbangan Otonomi Daerah (DPOD) was created and entrusted with guiding the process through the Ministries to the regions. DPOD an inter-ministerial body under the leadership of the MOHA was given its mandate in law in KEPRES No.23/1973. Owing to various fears of the civil servants comprising the committee it has never really functioned well as a conceptualizing body. The new legislation places extra responsibility on DPOD to effect real change. Formerly, DPOD was not successful in carrying out the seven functions it was supposed to. These included,
- Establishing autonomous regions, - Dissolving autonomous regions, - Transferring additional central government functions to the regions, - Withdrawing functions previously transferred to the regions, - Adding to regional financial sources including the transfer or sharing of central taxes, - Changing the structure of the financial balance, - Other issues regarding regional autonomy.
It is now suggested that these functions should be reviewed in the light of the lack of previous experience. The task of the DPOD should be shifted to the formation of sub-units at the regional and kabupaten levels to carry out specific inter-departmental sector orientated changes and to develop a more comprehensive long term vision for regional autonomy. In support of the new law, a law No.25/1999 on Fiscal Balance between Central Government and the Regions (UU No. 25/1999 tentang Pertimbangan Keuangan antaran Pemerintah Pusat dan Daerah),
2 - 10
was prepared which changed the influence and previous inter-government relationship. This law is an attempt to clarify the division of revenues between region and center and center and region. Even by June 2000 many of these changes have yet to be implemented. In particular regulation No 18/97 on taxation has to be revised to accommodate the provincial demands. Progressive elements of the regional law include making the executive more accountable to the regional legislature, stipulating that Bupati will now be elected by DPRD and including regulations which will be enacted to give more authority to the regional and kabupaten levels. The regions will have the power and be responsible for electing their own officials; formally most have been direct appointees. It was reported in the Indonesian Observer - June 29th, 2000 that the Head of State Administrative Reform, Freddy Numberi, had specified that these regulations would be in place by the end of July 2000. The Coordinating Ministry for Development and Administrative Reform holds the mandate to effect these changes through Presidential Decree No. 67/1999. A program of support and long term capacity building has been put in place to assist the implementation of these measures in the Kabupatens. Both UU No.22/1999 and the fiscal enabling UU No.25/1999 have sponsored reaction within the Central Government but little has been achieved during the first year owing to the concern and confusion allied to the reorganization of the central government institution. Once this had been achieved (this only occurred in some Ministries as late as May 2000, for example with Agriculture) the new organizations were then free to enact measures to decentralize authority and support. A second piece of necessary legislation was, however, necessary to delineate authority to regional autonomy, and set the targets to be met. Government Regulation No 25 of 2000, released on 6th May 2000, divided authority between Central Government and the Provinces into 23 sub sectors, including public administration, development of regional autonomy, fiscal balance; irrigation was not, however, identified separately (refer Fig. 2.1.5). The issue of this Government Regulation and its target of devolving authority to the regions by the beginning of year 2001 has sponsored a high level of activity from the inter-ministerial bodies entrusted with conceptualizing the necessary regulations. Law No.22/1999 on Regional Governance came into effect on 7th May 1999. It stipulates that all implementation and restructuring, as set out in the law, must be complete within two years and that enabling regulations relating to the law must be enacted within one year of the date of the law. This law revokes all previous laws on Regional Governance (Law No.5/1974) and village administration (Law No.5/1979). Provision is also made for other regulations, which may contradict or not be in accordance with this law, to be adjusted. This Law No.22/1999 also provides for the division of the territory of Indonesia into provinces, Kabupatens, and municipalities (kotamadya). These are authorized to manage and regulate their own affairs, and are independent and unrelated to one another. A partnership of the Regional Council (DPRD), the legislative body of the region, and the regional government (pemerintah daerah) will carry out governance. The law makes it quite clear that the regional council does not form part of the regional government but acts as a partner together with the regional government in carrying out the governance of the region. It is particularly lucid about the requirements that regional and local governments must;
- have accountable autonomy, - be responsible for maintaining harmonious relations with the national government and other
regional governments, - be responsible for improving the role and function of the regional legislative assemblies and
2 - 11
their public administration, - empower regions, kabupatens and desas to participate in public administration projects which
effect them. Here then is the basis for empowering desas to determine their own duly elected WUA groups on whatever basis is chosen by the desa. Proper account must also be made of the new fiscal balance between the central government and the provinces and Kabupatens. Law 25/1999 requires regional and kabupaten governments to:
- Be free from corruption, collusion, and nepotism - Be efficient and effective in designing and implementing governance and public services - Employ financing systems that are, just, rational, transparent, participatory accountable and well
managed. - Be prudent in management allocation and monitoring of finances - Consult with the people on spending priorities
2.2 Social Conditions
2.2.1 Traditional Community Organizations5
(1) Initiation
A rural community usually originated from a single ascendant pioneering a settlement and surrounding area considered to be the mostly supporting natural environment for their existence and the allowed followers. This may cover a territory that is, more or less, comparable with the current villages, but no accurate borders could be identified so far to make sure the exact boundaries. The mentioned remark concluded upon the collected references and field visits to the five study Provinces indicates that an indigenous community, therefore, was mostly genealogical territory-based, and traditionally headed by a patron elected from the lineage groups of descendants. (2) Social Structure
It is also apparent that basically two social stratifications was evident in the community, namely a) the ‘founding father(s)’ and their groups of descendants that dominantly represent the noble class, and b) the followers and new comers that represent the common people class. The patron was responsible to provide livelihood, security and other necessities of the included people independently in isolation with the other indigenous communities. A leader, therefore, was usually supported by a local community council, sub-community leaders and executing task-force (responsible for spiritual rites, security, water usage, etc). And above all they developed their own language, belief, customary laws, behavior, and armed system as required maintaining their community and territorial independencies. (3) Musyawarah
Musyawarah is a manner the indigenous community traditionally practiced by which the solutions of faced problems were explored by the concerned parties and the mostly accepted decisions were made correspondingly by the leader on wisdom basis. At village level musyawarah was traditionally institutionalized into Rembug Desa (Java), Karapatan Nagari (Minang), etc that integrally includes the entire social stratification, hence represents the mostly important element of leadership in the 5 Source: (1) Ensiklopedi Suku Bangsa di Indonesia, M Yunus Melalatoa, Dep Pendidikan dan Kebudayaan 1995, (2) Primary Data of JICA Study 2000.
2 - 12
genealogical based communities. (4) Gotong-royong
A mutually supporting actions so-called gotong-royong was also traditionally implemented by the concerned parties to encounter the faced problem really beyond capacity of the respective individual to overcome. Accordingly when the problem was solved (hence the remaining things are within the respective individuals’ capacity to manage) a gotong-royong is no more required and, therefore, ceases automatically. The gotong-royong may take place in various ways due to the scopes and kinds of the problems faced by the concerned parties. It may address the problems of individual necessities (fund rising, house building, farm works, life cycle ceremonies, etc., thus represents a social insurance system), or public utilities (road, irrigation, clean water supply etc).
2.2.2 Farmers’ Organization
There are two major farmers organizations other than WUA concerning agriculture in Indonesia. One is the KUD (Koperasi Unit Desa) and the other is the Farmers’ Group (Kelonpok Tani). (1) KUD (Koperasi unit desa, Village unit Cooperative)
A KUD is a cooperative unit designed to have multi-purpose business functions in rural areas. Though the majority of member consists of farmers, the membership is open for all people in rural areas. The State Ministry for Cooperatives and Small/Medium Enterprises is responsible for promoting and nurturing cooperative activities during their formation period. Thereafter Government expects the KUD to perform the following functions:
- To realize economic development based on people’s participation and solidarity to implement economic democracy;
- To create activities that could achieve equitable distribution of welfare; - To be used as a mechanism for poverty alleviation.
KUD has the following three major functions, though their activities are not limited to them.
- Distribution of farm inputs; - Providing, allocating and distributing credit; - Collecting, processing and marketing member’s products, especially rice
KUD is expected to play an important role in the national rice price policy as the nearest procurement point to farmers, with Government providing a commission and other incentives to KUD. According to the State Ministry for Cooperatives and Small/Medium Enterprises there were around 8,400 KUD with almost 10 million members at the end of 1997. This is approximately twice the number of Kecamatan, of which there are around 4,000. In spite of the high-minded concept behind the formation of KUD, many do not function well. Inputs supplied to KUD often arrived late and service was not optimal. Procured rice often was not paid the government floor price and payment was often late. Many farmers do not trust KUD because of non-democratic and non-transparent management, and many of the incentives provided by Government to KUD do not reach the members. Farmers often consider that private traders and merchants are enjoying their business under a name of KUD. Few farmers see the KUD as a farmers’ institution. In July 1998, having appreciated the problems surrounding the KUDs, Government declared a presidential decree on a new policy, acknowledging that rural cooperatives, other than KUD, should be
2 - 13
officially recognized. Since the declaration, new cooperatives are being established, but there are still some doubts about the level of success. In some instances, the only impact has been to change the KUD signboard. Farmers and Government have to seriously face up to the problems of cooperative formation. (2) Farmer Group (Kelompok Tani and Others)
Kelompok Tani (KT) was originally organized as an instrument of agricultural extension system through which agricultural extension workers (PPL) could channel their activities, particularly those concerned with rice intensification programs. Such programs contributed to remarkable rice production increases in the last decades. In some areas, farmers attempt to develop KT into new rural cooperative body (Koperasi Tani). There are currently 347,514 KT, 46,259 women farmers group, 29,184 youth farmers group, 48,184 small farmers group and 19,419 farmers’ cooperatives. In general a KT consists of :
- head of farmer group (Kontak Tani), - social section, - secretary, - marketing section, - treasurer, - community self help section - integrated pest management section, - irrigation section
It is generally recognized that KT function much better than KUD. KT usually function solely as receivers of information, technology and guidance from the PPL. Farmers do not need to be involved in constructive social and business activities through KT even though such activities would empower the KT. If KT were expected to function as a rural cooperative body, they would face many of the same problems facing the KUD. There are many cases where KT has failed when attempting to get involved in group tractor ownership or other group activities. 2.2.3 Land Tenure
(1) General
The collected secondary data and field visits indicate that currently there are two kinds of juridical basis of land-rights in the country and the five study Provinces in particular, i.e. a) Adat laws and b) government agrarian laws established (1960) and prevailed by taking the Adat laws into account
6.
Accordingly there are currently two kinds of land status. First is adat land, that is mostly local community based: the landholder is individual or community institution entitlements, and the mentioned land holding and land utilizations are controlled under local adat land rights. And second is state land that covers the entire state territory and the ownership could be held and used by state, community institutions (adat and non-adat institutions), private company and individuals under prevailing state laws and regulations. (2) Government Laws
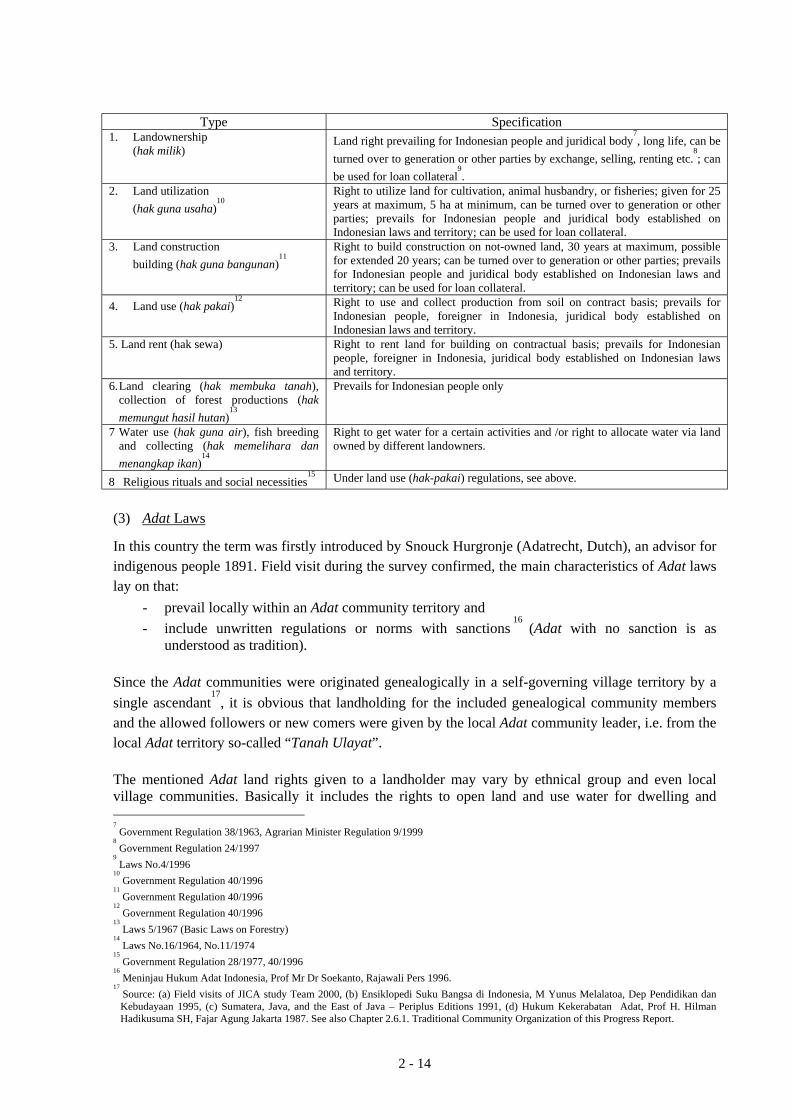
The mentioned state laws include a set of land rights as specified below (the right for air space utilization is included):
6 Agrarian Laws no. 5 1960, see also Hukum Agraria Indonesia, Prof Boedi Harsono, Djambatan 2000
2 - 14
Type Specification
1. Landownership (hak milik)
Land right prevailing for Indonesian people and juridical body7, long life, can be
turned over to generation or other parties by exchange, selling, renting etc.8; can
be used for loan collateral9.
2. Land utilization (hak guna usaha)
10
Right to utilize land for cultivation, animal husbandry, or fisheries; given for 25 years at maximum, 5 ha at minimum, can be turned over to generation or other parties; prevails for Indonesian people and juridical body established on Indonesian laws and territory; can be used for loan collateral.
3. Land construction building (hak guna bangunan)
11
Right to build construction on not-owned land, 30 years at maximum, possible for extended 20 years; can be turned over to generation or other parties; prevails for Indonesian people and juridical body established on Indonesian laws and territory; can be used for loan collateral.
4. Land use (hak pakai)12
Right to use and collect production from soil on contract basis; prevails for Indonesian people, foreigner in Indonesia, juridical body established on Indonesian laws and territory.
5. Land rent (hak sewa) Right to rent land for building on contractual basis; prevails for Indonesian people, foreigner in Indonesia, juridical body established on Indonesian laws and territory.
6. Land clearing (hak membuka tanah), collection of forest productions (hak memungut hasil hutan)
13
Prevails for Indonesian people only
7 Water use (hak guna air), fish breeding and collecting (hak memelihara dan menangkap ikan)
14
Right to get water for a certain activities and /or right to allocate water via land owned by different landowners.
8 Religious rituals and social necessities15
Under land use (hak-pakai) regulations, see above.
(3) Adat Laws
In this country the term was firstly introduced by Snouck Hurgronje (Adatrecht, Dutch), an advisor for indigenous people 1891. Field visit during the survey confirmed, the main characteristics of Adat laws lay on that:
- prevail locally within an Adat community territory and - include unwritten regulations or norms with sanctions
16 (Adat with no sanction is as
understood as tradition). Since the Adat communities were originated genealogically in a self-governing village territory by a single ascendant
17, it is obvious that landholding for the included genealogical community members
and the allowed followers or new comers were given by the local Adat community leader, i.e. from the local Adat territory so-called “Tanah Ulayat”.
The mentioned Adat land rights given to a landholder may vary by ethnical group and even local village communities. Basically it includes the rights to open land and use water for dwelling and 7 Government Regulation 38/1963, Agrarian Minister Regulation 9/1999
8 Government Regulation 24/1997
9 Laws No.4/1996
10 Government Regulation 40/1996
11 Government Regulation 40/1996
12 Government Regulation 40/1996
13 Laws 5/1967 (Basic Laws on Forestry)
14 Laws No.16/1964, No.11/1974
15 Government Regulation 28/1977, 40/1996
16 Meninjau Hukum Adat Indonesia, Prof Mr Dr Soekanto, Rajawali Pers 1996.
17 Source: (a) Field visits of JICA study Team 2000, (b) Ensiklopedi Suku Bangsa di Indonesia, M Yunus Melalatoa, Dep Pendidikan dan Kebudayaan 1995, (c) Sumatera, Java, and the East of Java – Periplus Editions 1991, (d) Hukum Kekerabatan Adat, Prof H. Hilman Hadikusuma SH, Fajar Agung Jakarta 1987. See also Chapter 2.6.1. Traditional Community Organization of this Progress Report.
2 - 15
cropping, and collect forest productions including hunting and fishing under local Adat conditions. Accordingly a land rights may be fully given for individual owned-land (tanah milik), hence permeable for inherited, rented, share-cropped, collateral for loan, etc. But exchanging, selling or collateral making for loan to outsider can be made on local community permitting basis. Recently the remaining Tanah Ulayat takes place mainly on lands functioned for local village government income (tanah bengkok, tanah kas desa), meeting hall, mosque, grave, market and other public utilities. This type of ulayat lands is entitled under local village community institution and unchangeable for other uses without any approval of the local village institution. 2.2.4 Gender Issues
Fast change were evident in the past development acceleration which regards to gender aspect, and a noteworthy progress probably will be possible in the coming years due to reformation and democratisation. The rural areas, however, represent different perspectives than the urban areas. The collected references
18 and visits to the five study Provinces confirm the following features.
- Basically women have traditionally placed their position and role in reproductive and productive activities, while men are responsible to maintain their properties and communities.
- Although nucleus family prevails and husband is the head of family responsible for his wife and children, women are remaining in their main position and role for domestic affairs. Women assume their primary responsibility concerns with their children, household economy and, hence, day-to-day family decisions.
- While men cultivate land for their families and maintain the local communities, women involve in crop planting, maintenance, harvesting, processing and marketing etc. as a part of their domestic works.
- The practice may take place in many ways when women are increasingly active in non-domestic activities due to wider education and job opportunities, but it has never replaced their main role on day-to-day domestic responsibilities.
- Due to the prevailing job division as mentioned above it is likely that everyday women usually spend time longer than men for their activities.
- It is therefore evident that due to the same reason women are usually quite familiar with all details related to their domestic works such as water for paddy planting, maintenance and harvesting. They also know as well processing values, storage losses, consumptions patterns, available market etc.
- Above all women have a very different set of information than do men about related resource availability, optimal use and management practices. Women may benefit differently from an activity than men, hence have different perceptions and strategies on related development program that are not commonly understood or of interest to men.
2.3 Agriculture in Indonesia
2.3.1 Agricultural Production
(1) Food Crops (Rice, Palawija and Vegetables)
Rice is the dominant food crop in Indonesia and in terms of harvested area, occupies about 60% of the major food crops area. Total harvested area of rice has been approximately 11.5 million ha, producing around 50.0 million tons of paddy in recent years. Palawija crops are still dominant in dryland areas. They are shifting their major position from human food to livestock feed but substantial quantities are consumed as rice substitutes, especially among low 18
Ensiklopedi Suku Bangsa di Indonesia, M Yunus Melalatoa, Dep Pendidikan dan Kebudayaan 1995. Sumatera, Java, and the East of Java – Periplus Editions 1991. Hukum Kekerabatan Adat, Prof H. Hilman Hadikusuma SH, Fajar Agung jakarta 1987.
2 - 16
income people. Palawija production tended to increase until the mid-1990s, but has decreased in recent years, particularly sweet potatoes, groundnuts and soybeans. Total harvested area of palawija has been around 6.5 to 7.0 million ha in recent years. Vegetables are expected to be a major income generator in the future because of their profitability and increased demand. The harvested area and production of the six main vegetables, however, have remained stagnant in recent years. The harvested area of the 20 main vegetables is around 0.9 million ha, which represents less than 5% of the total area of major food crops. Data regarding horticultural products are somewhat inadequate, making it difficult to obtain a clear picture of the situation. (2) Estate Crops
Even it is expected that estate crops contribute to farmers’ income more or less in Indonesia it is difficult to get clear pictures about their production because of insufficient data. 2.3.2 Agricultural Supporting System
(1) Agricultural Extension Service
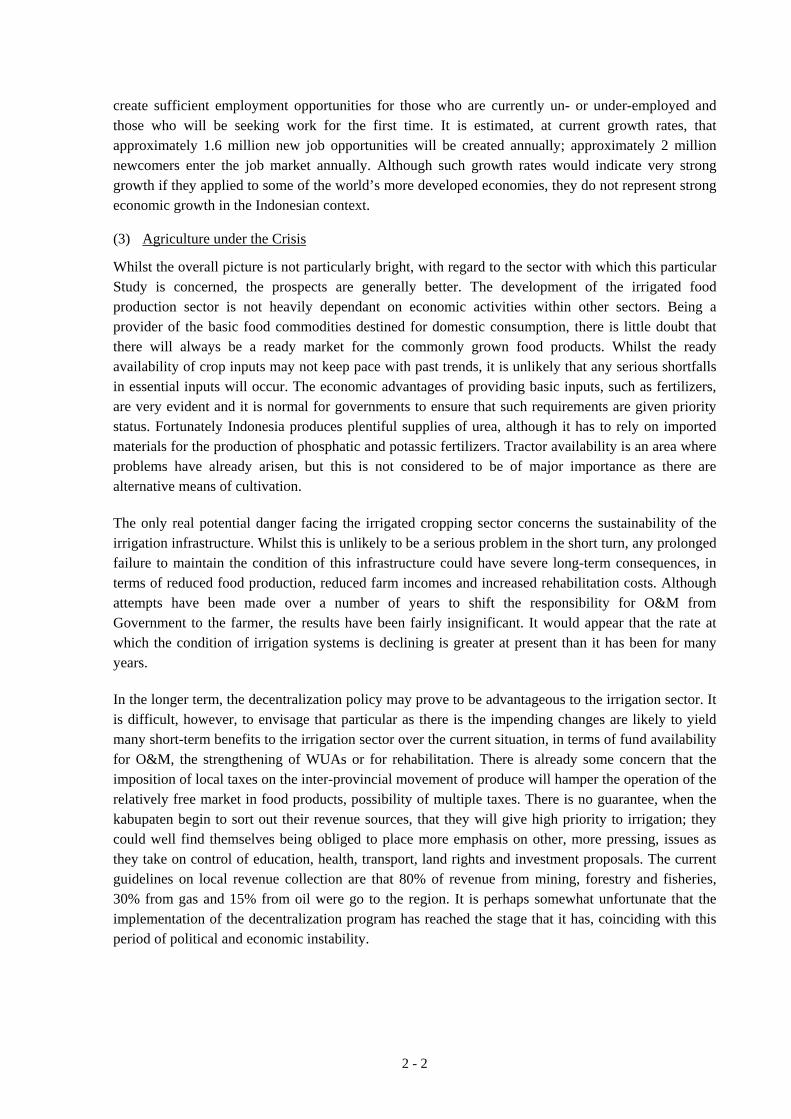
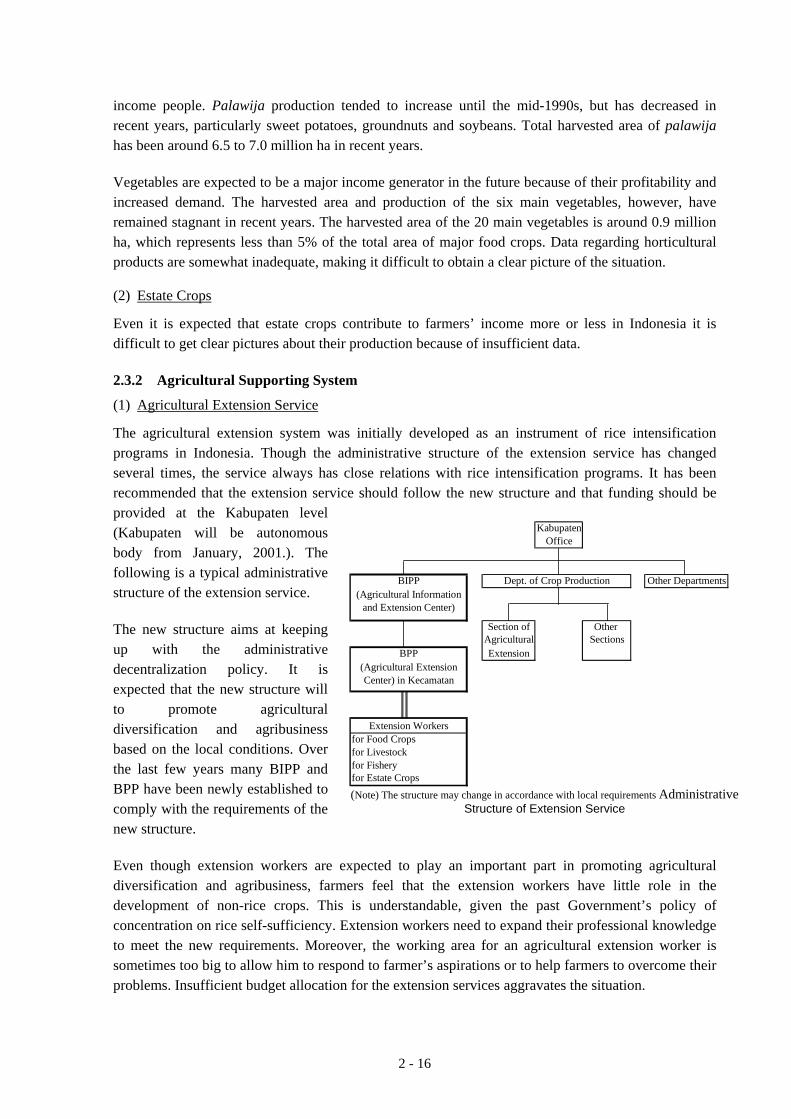
The agricultural extension system was initially developed as an instrument of rice intensification programs in Indonesia. Though the administrative structure of the extension service has changed several times, the service always has close relations with rice intensification programs. It has been recommended that the extension service should follow the new structure and that funding should be provided at the Kabupaten level (Kabupaten will be autonomous body from January, 2001.). The following is a typical administrative structure of the extension service. The new structure aims at keeping up with the administrative decentralization policy. It is expected that the new structure will to promote agricultural diversification and agribusiness based on the local conditions. Over the last few years many BIPP and BPP have been newly established to comply with the requirements of the new structure. Even though extension workers are expected to play an important part in promoting agricultural diversification and agribusiness, farmers feel that the extension workers have little role in the development of non-rice crops. This is understandable, given the past Government’s policy of concentration on rice self-sufficiency. Extension workers need to expand their professional knowledge to meet the new requirements. Moreover, the working area for an agricultural extension worker is sometimes too big to allow him to respond to farmer’s aspirations or to help farmers to overcome their problems. Insufficient budget allocation for the extension services aggravates the situation.
KabupatenOffice
BIPP Other Departments(Agricultural Information
and Extension Center)
Section of Other Agricultural Sections
BPP Extension(Agricultural ExtensionCenter) in Kecamatan
Extension Workersfor Food Cropsfor Livestockfor Fisheryfor Estate Crops
Dept. of Crop Production
(Note) The structure may change in accordance with local requirements Administrative
Structure of Extension Service
2 - 17
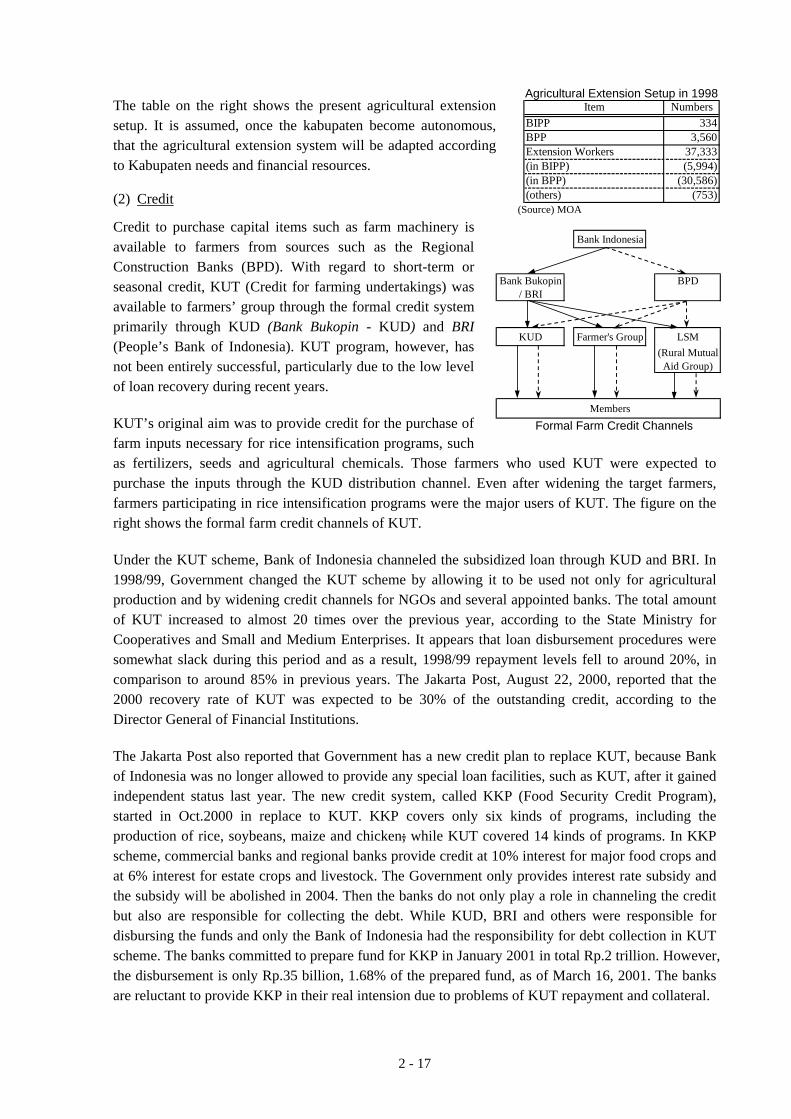
The table on the right shows the present agricultural extension setup. It is assumed, once the kabupaten become autonomous, that the agricultural extension system will be adapted according to Kabupaten needs and financial resources. (2) Credit
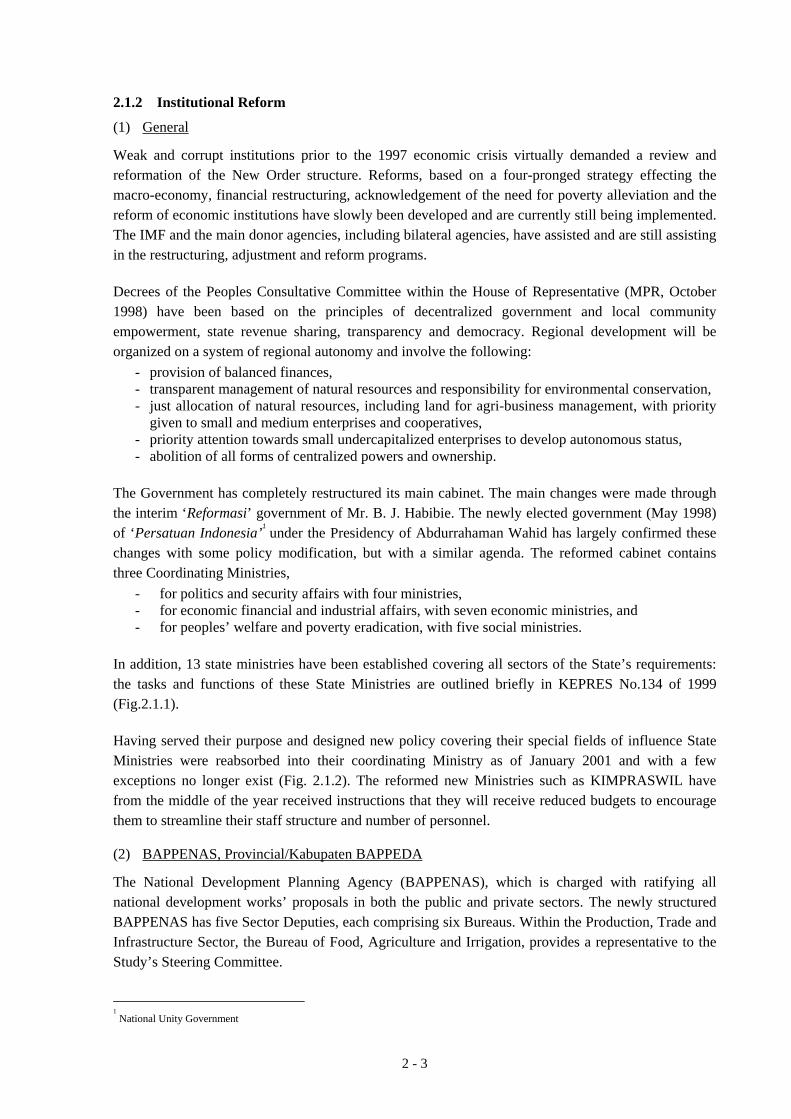
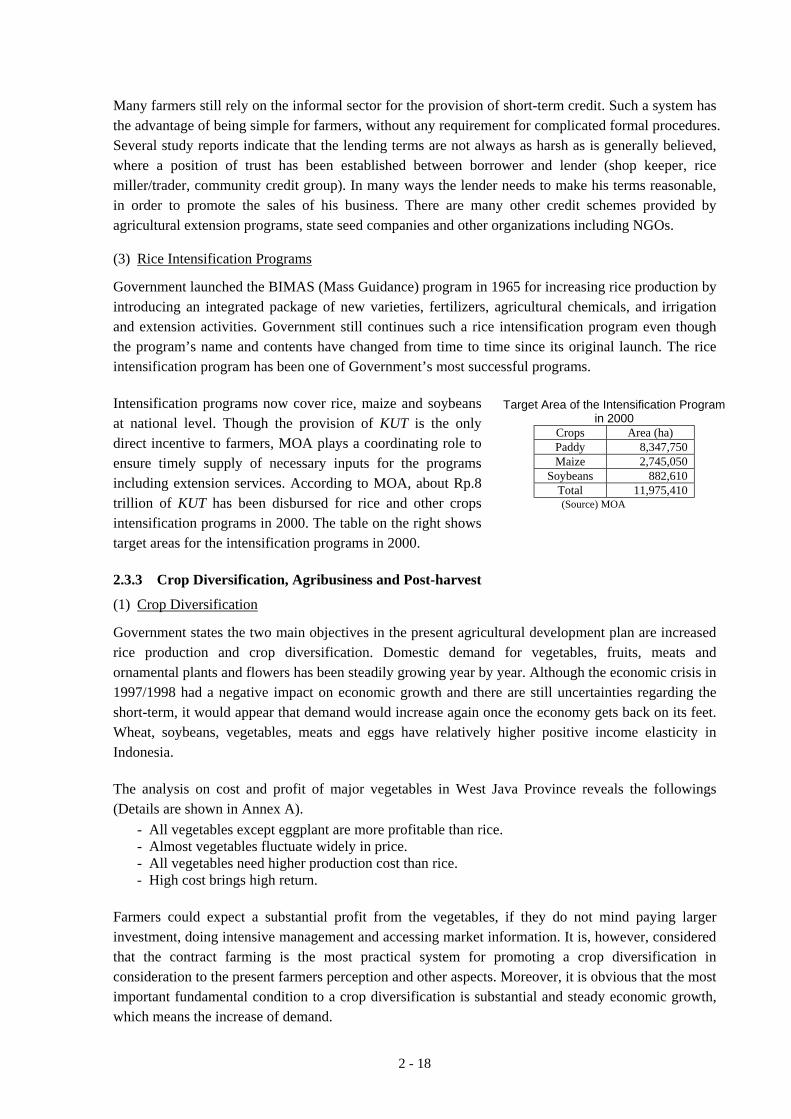
Credit to purchase capital items such as farm machinery is available to farmers from sources such as the Regional Construction Banks (BPD). With regard to short-term or seasonal credit, KUT (Credit for farming undertakings) was available to farmers’ group through the formal credit system primarily through KUD (Bank Bukopin - KUD) and BRI (People’s Bank of Indonesia). KUT program, however, has not been entirely successful, particularly due to the low level of loan recovery during recent years. KUT’s original aim was to provide credit for the purchase of farm inputs necessary for rice intensification programs, such as fertilizers, seeds and agricultural chemicals. Those farmers who used KUT were expected to purchase the inputs through the KUD distribution channel. Even after widening the target farmers, farmers participating in rice intensification programs were the major users of KUT. The figure on the right shows the formal farm credit channels of KUT. Under the KUT scheme, Bank of Indonesia channeled the subsidized loan through KUD and BRI. In 1998/99, Government changed the KUT scheme by allowing it to be used not only for agricultural production and by widening credit channels for NGOs and several appointed banks. The total amount of KUT increased to almost 20 times over the previous year, according to the State Ministry for Cooperatives and Small and Medium Enterprises. It appears that loan disbursement procedures were somewhat slack during this period and as a result, 1998/99 repayment levels fell to around 20%, in comparison to around 85% in previous years. The Jakarta Post, August 22, 2000, reported that the 2000 recovery rate of KUT was expected to be 30% of the outstanding credit, according to the Director General of Financial Institutions. The Jakarta Post also reported that Government has a new credit plan to replace KUT, because Bank of Indonesia was no longer allowed to provide any special loan facilities, such as KUT, after it gained independent status last year. The new credit system, called KKP (Food Security Credit Program), started in Oct.2000 in replace to KUT. KKP covers only six kinds of programs, including the production of rice, soybeans, maize and chicken; while KUT covered 14 kinds of programs. In KKP scheme, commercial banks and regional banks provide credit at 10% interest for major food crops and at 6% interest for estate crops and livestock. The Government only provides interest rate subsidy and the subsidy will be abolished in 2004. Then the banks do not only play a role in channeling the credit but also are responsible for collecting the debt. While KUD, BRI and others were responsible for disbursing the funds and only the Bank of Indonesia had the responsibility for debt collection in KUT scheme. The banks committed to prepare fund for KKP in January 2001 in total Rp.2 trillion. However, the disbursement is only Rp.35 billion, 1.68% of the prepared fund, as of March 16, 2001. The banks are reluctant to provide KKP in their real intension due to problems of KUT repayment and collateral.
Agricultural Extension Setup in 1998 Item Numbers
BIPP 334BPP 3,560Extension Workers 37,333(in BIPP) (5,994)(in BPP) (30,586)(others) (753)
(Source) MOA
Bank Indonesia
Bank Bukopin BPD/ BRI
KUD Farmer's Group LSM(Rural MutualAid Group)
Members Formal Farm Credit Channels
2 - 18
Many farmers still rely on the informal sector for the provision of short-term credit. Such a system has the advantage of being simple for farmers, without any requirement for complicated formal procedures. Several study reports indicate that the lending terms are not always as harsh as is generally believed, where a position of trust has been established between borrower and lender (shop keeper, rice miller/trader, community credit group). In many ways the lender needs to make his terms reasonable, in order to promote the sales of his business. There are many other credit schemes provided by agricultural extension programs, state seed companies and other organizations including NGOs. (3) Rice Intensification Programs
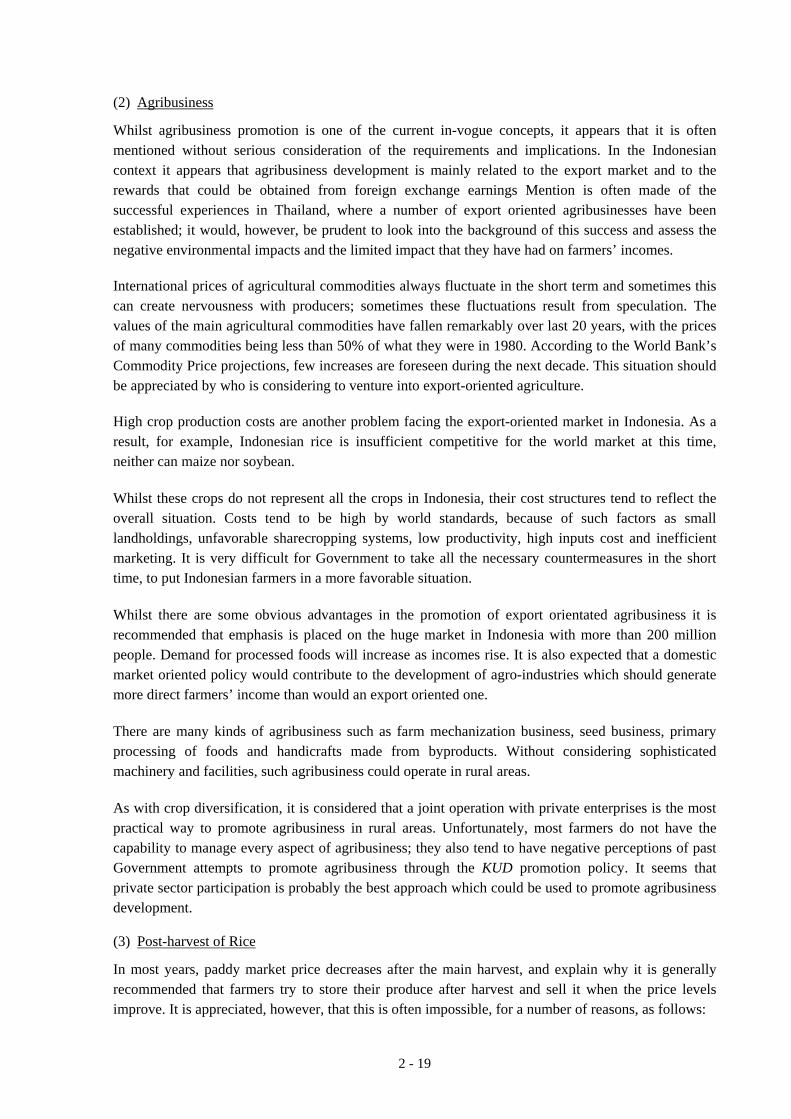
Government launched the BIMAS (Mass Guidance) program in 1965 for increasing rice production by introducing an integrated package of new varieties, fertilizers, agricultural chemicals, and irrigation and extension activities. Government still continues such a rice intensification program even though the program’s name and contents have changed from time to time since its original launch. The rice intensification program has been one of Government’s most successful programs. Intensification programs now cover rice, maize and soybeans at national level. Though the provision of KUT is the only direct incentive to farmers, MOA plays a coordinating role to ensure timely supply of necessary inputs for the programs including extension services. According to MOA, about Rp.8 trillion of KUT has been disbursed for rice and other crops intensification programs in 2000. The table on the right shows target areas for the intensification programs in 2000. 2.3.3 Crop Diversification, Agribusiness and Post-harvest
(1) Crop Diversification
Government states the two main objectives in the present agricultural development plan are increased rice production and crop diversification. Domestic demand for vegetables, fruits, meats and ornamental plants and flowers has been steadily growing year by year. Although the economic crisis in 1997/1998 had a negative impact on economic growth and there are still uncertainties regarding the short-term, it would appear that demand would increase again once the economy gets back on its feet. Wheat, soybeans, vegetables, meats and eggs have relatively higher positive income elasticity in Indonesia. The analysis on cost and profit of major vegetables in West Java Province reveals the followings (Details are shown in Annex A).
- All vegetables except eggplant are more profitable than rice. - Almost vegetables fluctuate widely in price. - All vegetables need higher production cost than rice. - High cost brings high return.
Farmers could expect a substantial profit from the vegetables, if they do not mind paying larger investment, doing intensive management and accessing market information. It is, however, considered that the contract farming is the most practical system for promoting a crop diversification in consideration to the present farmers perception and other aspects. Moreover, it is obvious that the most important fundamental condition to a crop diversification is substantial and steady economic growth, which means the increase of demand.
Target Area of the Intensification Program in 2000
Crops Area (ha) Paddy 8,347,750 Maize 2,745,050
Soybeans 882,610 Total 11,975,410 (Source) MOA
2 - 19
(2) Agribusiness
Whilst agribusiness promotion is one of the current in-vogue concepts, it appears that it is often mentioned without serious consideration of the requirements and implications. In the Indonesian context it appears that agribusiness development is mainly related to the export market and to the rewards that could be obtained from foreign exchange earnings Mention is often made of the successful experiences in Thailand, where a number of export oriented agribusinesses have been established; it would, however, be prudent to look into the background of this success and assess the negative environmental impacts and the limited impact that they have had on farmers’ incomes.
International prices of agricultural commodities always fluctuate in the short term and sometimes this can create nervousness with producers; sometimes these fluctuations result from speculation. The values of the main agricultural commodities have fallen remarkably over last 20 years, with the prices of many commodities being less than 50% of what they were in 1980. According to the World Bank’s Commodity Price projections, few increases are foreseen during the next decade. This situation should be appreciated by who is considering to venture into export-oriented agriculture. High crop production costs are another problem facing the export-oriented market in Indonesia. As a result, for example, Indonesian rice is insufficient competitive for the world market at this time, neither can maize nor soybean. Whilst these crops do not represent all the crops in Indonesia, their cost structures tend to reflect the overall situation. Costs tend to be high by world standards, because of such factors as small landholdings, unfavorable sharecropping systems, low productivity, high inputs cost and inefficient marketing. It is very difficult for Government to take all the necessary countermeasures in the short time, to put Indonesian farmers in a more favorable situation. Whilst there are some obvious advantages in the promotion of export orientated agribusiness it is recommended that emphasis is placed on the huge market in Indonesia with more than 200 million people. Demand for processed foods will increase as incomes rise. It is also expected that a domestic market oriented policy would contribute to the development of agro-industries which should generate more direct farmers’ income than would an export oriented one. There are many kinds of agribusiness such as farm mechanization business, seed business, primary processing of foods and handicrafts made from byproducts. Without considering sophisticated machinery and facilities, such agribusiness could operate in rural areas. As with crop diversification, it is considered that a joint operation with private enterprises is the most practical way to promote agribusiness in rural areas. Unfortunately, most farmers do not have the capability to manage every aspect of agribusiness; they also tend to have negative perceptions of past Government attempts to promote agribusiness through the KUD promotion policy. It seems that private sector participation is probably the best approach which could be used to promote agribusiness development. (3) Post-harvest of Rice
In most years, paddy market price decreases after the main harvest, and explain why it is generally recommended that farmers try to store their produce after harvest and sell it when the price levels improve. It is appreciated, however, that this is often impossible, for a number of reasons, as follows:
2 - 20
- Farmers are very busy harvesting rice and other crops, and preparation for the next crop. - During the harvesting season there can be substantial rains, which make it difficult for farmers
to dry and clean the harvested paddy. - Farmers do not have enough space or the facilities to dry and store paddy for long time.
The government gives farmers a price incentive for their post-harvest activities. The paddy floor price is classified into 3 categories, GKP (un-dried and un-cleaned), GKS (half-dried and half-cleaned) and GKG (well-dried and well-cleaned) price difference between GKP and GKG is Rp.380/kg at present (Table A.2.4 in Annex A). Then KUD is (was?) expected to function as a center for post-harvest including storing and marketing activities. However, actual KUD’s activities are far weaker than was expected and provide little service. Despite the above difficulties and constraints, the improvement of post-harvest activities of farmers is one sure way to increase their income. This not only requires guidance from the Government; farmers, themselves need to make the effort to improve their post-harvest activity, as means of counteracting low prices of rice. 2.3.4 Farm and Household Economy
(1) Use of Farm Inputs for Rice and Their Effect
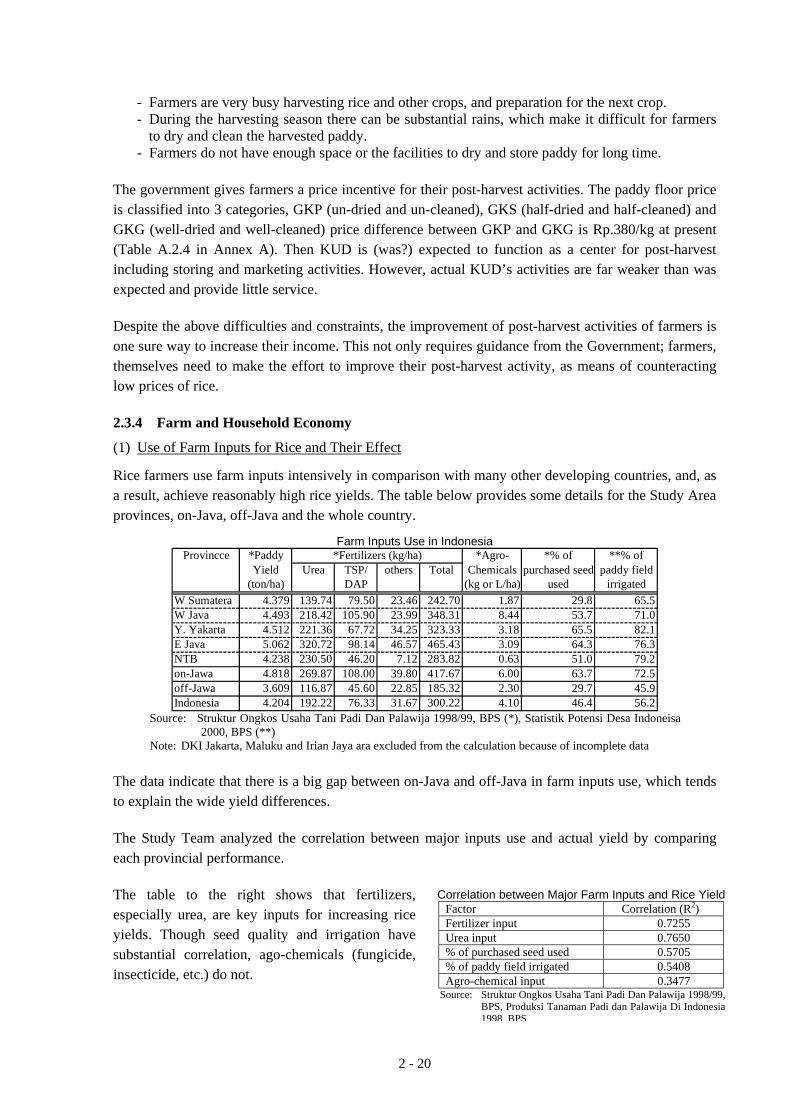
Rice farmers use farm inputs intensively in comparison with many other developing countries, and, as a result, achieve reasonably high rice yields. The table below provides some details for the Study Area provinces, on-Java, off-Java and the whole country.
Farm Inputs Use in Indonesia Provincce *Paddy *Agro- *% of **% of
Yield Urea TSP/ others Total Chemicals purchased seed paddy field(ton/ha) DAP (kg or L/ha) used irrigated
W Sumatera 4.379 139.74 79.50 23.46 242.70 1.87 29.8 65.5W Java 4.493 218.42 105.90 23.99 348.31 8.44 53.7 71.0Y. Yakarta 4.512 221.36 67.72 34.25 323.33 3.18 65.5 82.1E Java 5.062 320.72 98.14 46.57 465.43 3.09 64.3 76.3NTB 4.238 230.50 46.20 7.12 283.82 0.63 51.0 79.2on-Jawa 4.818 269.87 108.00 39.80 417.67 6.00 63.7 72.5off-Jawa 3.609 116.87 45.60 22.85 185.32 2.30 29.7 45.9Indonesia 4.204 192.22 76.33 31.67 300.22 4.10 46.4 56.2
*Fertilizers (kg/ha)
Source: Struktur Ongkos Usaha Tani Padi Dan Palawija 1998/99, BPS (*), Statistik Potensi Desa Indoneisa
2000, BPS (**) Note: DKI Jakarta, Maluku and Irian Jaya ara excluded from the calculation because of incomplete data
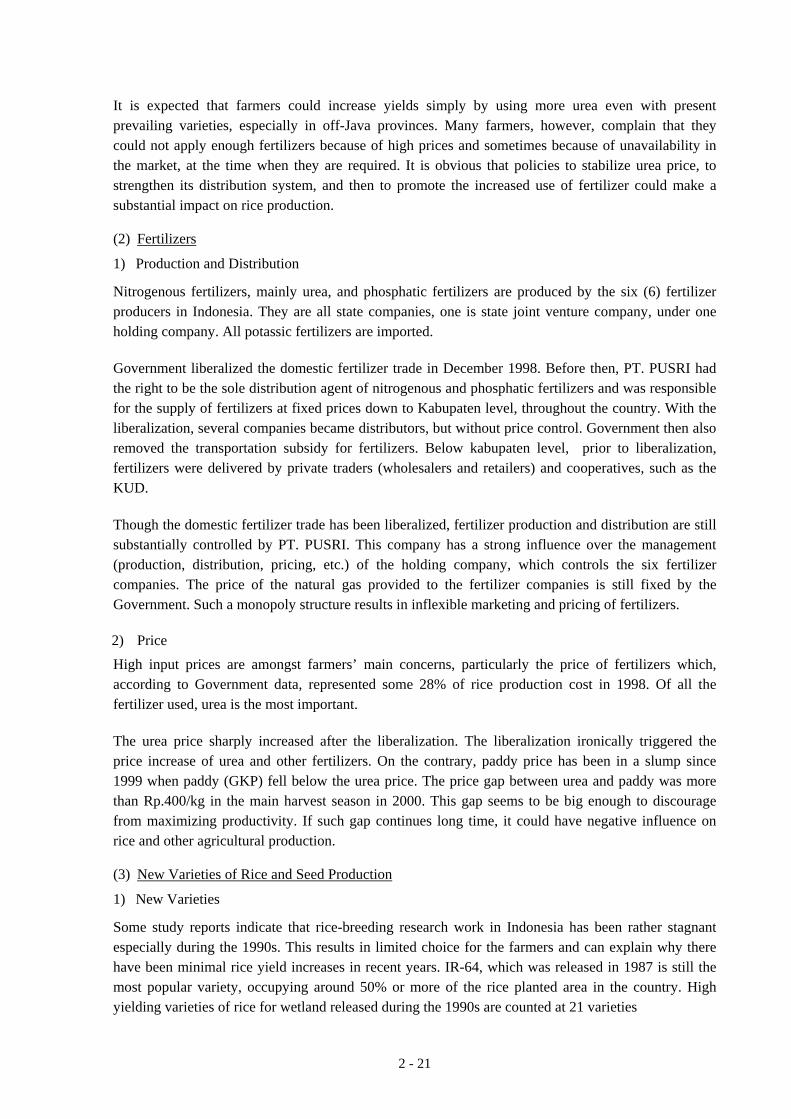
The data indicate that there is a big gap between on-Java and off-Java in farm inputs use, which tends to explain the wide yield differences. The Study Team analyzed the correlation between major inputs use and actual yield by comparing each provincial performance. The table to the right shows that fertilizers, especially urea, are key inputs for increasing rice yields. Though seed quality and irrigation have substantial correlation, ago-chemicals (fungicide, insecticide, etc.) do not.
Correlation between Major Farm Inputs and Rice Yield Factor Correlation (R2) Fertilizer input 0.7255 Urea input 0.7650 % of purchased seed used 0.5705 % of paddy field irrigated 0.5408 Agro-chemical input 0.3477
Source: Struktur Ongkos Usaha Tani Padi Dan Palawija 1998/99, BPS, Produksi Tanaman Padi dan Palawija Di Indonesia 1998 BPS
2 - 21
It is expected that farmers could increase yields simply by using more urea even with present prevailing varieties, especially in off-Java provinces. Many farmers, however, complain that they could not apply enough fertilizers because of high prices and sometimes because of unavailability in the market, at the time when they are required. It is obvious that policies to stabilize urea price, to strengthen its distribution system, and then to promote the increased use of fertilizer could make a substantial impact on rice production. (2) Fertilizers
1) Production and Distribution
Nitrogenous fertilizers, mainly urea, and phosphatic fertilizers are produced by the six (6) fertilizer producers in Indonesia. They are all state companies, one is state joint venture company, under one holding company. All potassic fertilizers are imported. Government liberalized the domestic fertilizer trade in December 1998. Before then, PT. PUSRI had the right to be the sole distribution agent of nitrogenous and phosphatic fertilizers and was responsible for the supply of fertilizers at fixed prices down to Kabupaten level, throughout the country. With the liberalization, several companies became distributors, but without price control. Government then also removed the transportation subsidy for fertilizers. Below kabupaten level, prior to liberalization, fertilizers were delivered by private traders (wholesalers and retailers) and cooperatives, such as the KUD. Though the domestic fertilizer trade has been liberalized, fertilizer production and distribution are still substantially controlled by PT. PUSRI. This company has a strong influence over the management (production, distribution, pricing, etc.) of the holding company, which controls the six fertilizer companies. The price of the natural gas provided to the fertilizer companies is still fixed by the Government. Such a monopoly structure results in inflexible marketing and pricing of fertilizers.
2) Price High input prices are amongst farmers’ main concerns, particularly the price of fertilizers which, according to Government data, represented some 28% of rice production cost in 1998. Of all the fertilizer used, urea is the most important. The urea price sharply increased after the liberalization. The liberalization ironically triggered the price increase of urea and other fertilizers. On the contrary, paddy price has been in a slump since 1999 when paddy (GKP) fell below the urea price. The price gap between urea and paddy was more than Rp.400/kg in the main harvest season in 2000. This gap seems to be big enough to discourage from maximizing productivity. If such gap continues long time, it could have negative influence on rice and other agricultural production. (3) New Varieties of Rice and Seed Production
1) New Varieties
Some study reports indicate that rice-breeding research work in Indonesia has been rather stagnant especially during the 1990s. This results in limited choice for the farmers and can explain why there have been minimal rice yield increases in recent years. IR-64, which was released in 1987 is still the most popular variety, occupying around 50% or more of the rice planted area in the country. High yielding varieties of rice for wetland released during the 1990s are counted at 21 varieties
2 - 22
In spite of the dominant position of IR-64, some new varieties released from the Central Rice Research Institute have become popular with farmers. The commendable performance of rice breeders in Indonesia should be properly acknowledged, even though they have been unable to provide new varieties superior to IR-64 during the past decade. According to the Central Rice Research Institute, they have several panicle weight type strains with potential yields of 10 tons/ha. Some of these are promising, having advanced resistance to tungro virus, bacterial leaf bright, blast, brown plant hopper, and some being adaptable to iron excess soils and high acidity soils. These characteristics are particularly important in the off-Java context. 2) Seed Production
Two state seed companies, PT. SANG HYANG SERI and PT. PERTANI, mainly produce improved rice seeds. They use contracted seed growers to multiply certified seeds provided to the farmers, and then process the seeds at their processing plants. They also have distribution networks. According to MOA, 135,422 tons and 170,284 tons of extension seeds were produced in 1999 and 2000, respectively. In terms of quantity, sufficient amount of seeds were produced in both years to satisfy demand. Farmers, however, indicated there were problems regarding seed quality. MOA also recognizes a number of other problems on rice seed production and distribution, as follows:
- Distribution networks are not well developed in remote areas. - There are mismatches between the varieties of seeds produced seeds and the varieties
demanded by the farmers. - Seed availability is not always assured at the time of peak demand.
(4) Agricultural Chemicals
Whilst many farmers indicated that their crops were damaged by pests and disease, in general the resulting losses did not appear to be a critical problem for rice production. Rice yields have steadily increased even after Government completely removed the subsidy to agricultural chemicals, when it began to promote the successful IPM (Integrated Pest Management) program in January 1988. Farmers tend to overestimate the damages, because they are directly visible in the field and, in the past, there was a tendency to over-apply agricultural chemicals. The IPM program has resulted in considerably lower use of agricultural chemicals. (5) Farm Mechanization
Tractor (hand tractor) hire service is becoming popular and many farmers show a positive intention to introduce hand tractors for land preparation. Some farmers indicate a problem of labor shortage during the land preparation period. The number of tractors, however, does not match farmers’ requirements and according to the tractor manufacturers, demand for hand tractor is still increasing. It is estimated that the total number of hand tractors required would be about 273,500 units; at present there are 110,000 units operating. To minimize land preparation costs, estimated at around 13% of total rice production costs, and to maximize land utilization by shortening the land preparation period, mechanization is desirable. In present circumstances, hand tractors appear to be the most appropriate. Hand tractors are generally too expensive for normal individual farmers, and there would appear to be promising opportunities for farmer group operation. The manufacturing company, however, warned
2 - 23
against such activity as there were too many problems involved. The other alternative is for individuals, using their own capital or credit, to provide a contractor service. Harvesting is another big burden to rice farmers. The harvesting cost of rice, including wages, represents around 20% of total production cost, according to Government statistics. In East Java, there is a mobile threshing service available, with a power thresher mounted on a vehicle which visits farmers in a given area; it can provide a cheaper service than the traditional one. However, the traditional harvesting Bawon19 system appears to stands in the way of promoting the mobile threshing service. Bawon still prevails in rural area even though the conditions differ from area to area, and many people depend on this to provide a substantial part of their income, especially in areas where there are few alternative employment opportunities for small farmers or farm laborers. (6) Cropping Patterns and Intensities
As with farmers everywhere, incomes range widely depending on the prevailing conditions. In the Study Area it is possible to identify a limited number of scenarios which provide a reasonable indication of the range within which most farmers’ incomes will be found. The main interest is with irrigated areas where farmers almost always grow a wet season rice crop. This crop is generally successful, unless there are major floods or pest attacks. Water shortages can occur, but are generally not highly significant. Most farmers plant HYVs and apply reasonable levels of fertilizers and can expect to obtain yields of between 4.5 and 5.5 tones of dry paddy (gabah kering giling – GKG). Activities during the remaining eight months of the year vary widely; if water is reasonably plentiful farmers will grow at least one further rice crop and maybe two. Success depends primarily on the water supply situation, although, of course, the other potential hazards can also cause losses. If, as is often the case, the supply of water is somewhat constrained, farmers can adopt a number of planting options. They can attempt to utilize the whole of the irrigated area by restricting the areas of high water demanding cropping, primarily rice, and by planting other less water-demanding crops such as soybean, groundnuts, green gram or maize in the remaining area. Alternatively, they can utilize all the water to produce rice, and leave the remaining area fallow. Although it is generally expected that most irrigation systems have been designed to allow most farmers to achieve at least a 200% cropping intensity, in four years out of five, in reality there is not always sufficient water available to allow farmers to double crop rice. It is normal for part of the second season crop to be non-rice, and for most of the area to be planted. In the third season, the driest season, many farmers cannot grow rice and they tend to either produce a palawija crop or leave all or part of their land fallow. To achieve 300% rice cropping, even if water conditions are favorable, is difficult; such intensities require a very quick turn around between crops. Except where there is stored water, the dry season water supply situation cannot be guaranteed. Because most holdings are very small and farmers are generally poor, they tend to take risks and to
19
Neighboring farmers and farm laborers gather around a paddy field just before harvesting, and then they participate in the harvesting and threshing. Rice farmers basically accept, every person come to the field. The participants are given a part of paddy grain harvested and threshed in reward for their works. It seems that this system originally started among farmers with a spirit of “Gotong Royong” to share a work burden in the peak-harvesting season. However, it comes to be the substantial income source for small-scale farmers or farm laborers. In some cases, voluntary platoons for “Bawon” move around wide area in rice harvesting season and sometimes force an rice farmer to start harvest based on their moving schedule.
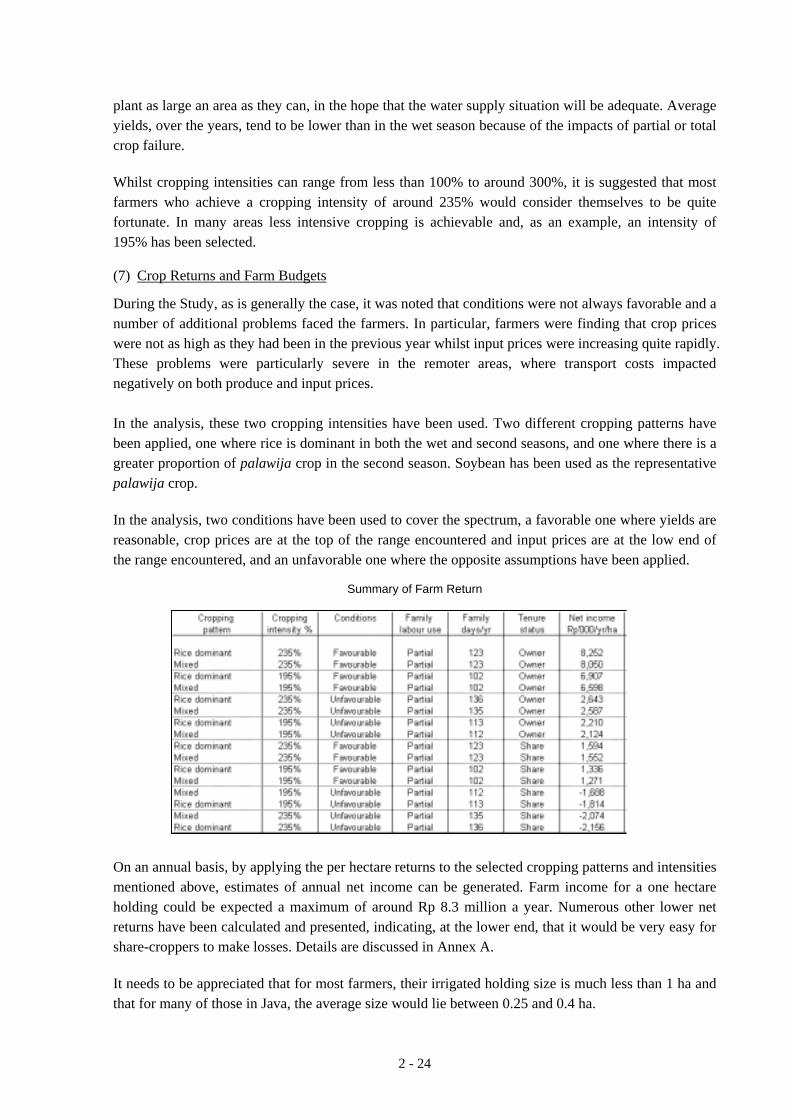
2 - 24
plant as large an area as they can, in the hope that the water supply situation will be adequate. Average yields, over the years, tend to be lower than in the wet season because of the impacts of partial or total crop failure. Whilst cropping intensities can range from less than 100% to around 300%, it is suggested that most farmers who achieve a cropping intensity of around 235% would consider themselves to be quite fortunate. In many areas less intensive cropping is achievable and, as an example, an intensity of 195% has been selected. (7) Crop Returns and Farm Budgets
During the Study, as is generally the case, it was noted that conditions were not always favorable and a number of additional problems faced the farmers. In particular, farmers were finding that crop prices were not as high as they had been in the previous year whilst input prices were increasing quite rapidly. These problems were particularly severe in the remoter areas, where transport costs impacted negatively on both produce and input prices. In the analysis, these two cropping intensities have been used. Two different cropping patterns have been applied, one where rice is dominant in both the wet and second seasons, and one where there is a greater proportion of palawija crop in the second season. Soybean has been used as the representative palawija crop. In the analysis, two conditions have been used to cover the spectrum, a favorable one where yields are reasonable, crop prices are at the top of the range encountered and input prices are at the low end of the range encountered, and an unfavorable one where the opposite assumptions have been applied.
Summary of Farm Return On an annual basis, by applying the per hectare returns to the selected cropping patterns and intensities mentioned above, estimates of annual net income can be generated. Farm income for a one hectare holding could be expected a maximum of around Rp 8.3 million a year. Numerous other lower net returns have been calculated and presented, indicating, at the lower end, that it would be very easy for share-croppers to make losses. Details are discussed in Annex A. It needs to be appreciated that for most farmers, their irrigated holding size is much less than 1 ha and that for many of those in Java, the average size would lie between 0.25 and 0.4 ha.
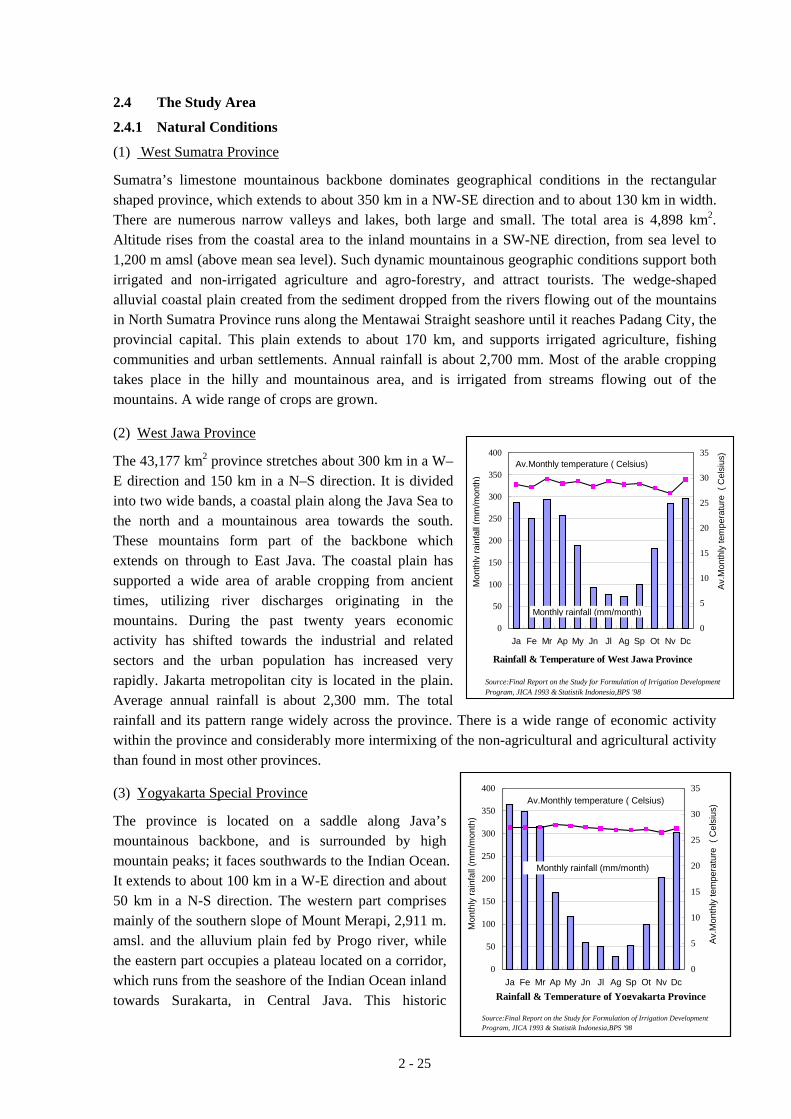
2 - 25
0
50
100
150
200
250
300
350
400
Ja Fe Mr Ap My Jn Jl Ag Sp Ot Nv Dc0
5
10
15
20
25
30
35
Av.M
onth
ly te
mpe
ratu
re (
Cel
sius
)
Rainfall & Temperature of West Jawa Province
Mon
thly
rain
fall
(mm
/mon
th)
Av.Monthly temperature ( Celsius)
Monthly rainfall (mm/month)
Source:Final Report on the Study for Formulation of Irrigation DevelopmentProgram, JICA 1993 & Statistik Indonesia,BPS '98
0
50
100
150
200
250
300
350
400
Ja Fe Mr Ap My Jn Jl Ag Sp Ot Nv Dc0
5
10
15
20
25
30
35
Monthly rainfall (mm/month)
Av.Monthly temperature ( Celsius)
Av.M
onth
ly te
mpe
ratu
re (
Cel
sius
)
Mon
thly
rain
fall
(mm
/mon
th)
Rainfall & Temperature of Yogyakarta Province
Source:Final Report on the Study for Formulation of Irrigation DevelopmentProgram, JICA 1993 & Statistik Indonesia,BPS '98
2.4 The Study Area
2.4.1 Natural Conditions
(1) West Sumatra Province
Sumatra’s limestone mountainous backbone dominates geographical conditions in the rectangular shaped province, which extends to about 350 km in a NW-SE direction and to about 130 km in width. There are numerous narrow valleys and lakes, both large and small. The total area is 4,898 km2. Altitude rises from the coastal area to the inland mountains in a SW-NE direction, from sea level to 1,200 m amsl (above mean sea level). Such dynamic mountainous geographic conditions support both irrigated and non-irrigated agriculture and agro-forestry, and attract tourists. The wedge-shaped alluvial coastal plain created from the sediment dropped from the rivers flowing out of the mountains in North Sumatra Province runs along the Mentawai Straight seashore until it reaches Padang City, the provincial capital. This plain extends to about 170 km, and supports irrigated agriculture, fishing communities and urban settlements. Annual rainfall is about 2,700 mm. Most of the arable cropping takes place in the hilly and mountainous area, and is irrigated from streams flowing out of the mountains. A wide range of crops are grown. (2) West Jawa Province
The 43,177 km2 province stretches about 300 km in a W–E direction and 150 km in a N–S direction. It is divided into two wide bands, a coastal plain along the Java Sea to the north and a mountainous area towards the south. These mountains form part of the backbone which extends on through to East Java. The coastal plain has supported a wide area of arable cropping from ancient times, utilizing river discharges originating in the mountains. During the past twenty years economic activity has shifted towards the industrial and related sectors and the urban population has increased very rapidly. Jakarta metropolitan city is located in the plain. Average annual rainfall is about 2,300 mm. The total rainfall and its pattern range widely across the province. There is a wide range of economic activity within the province and considerably more intermixing of the non-agricultural and agricultural activity than found in most other provinces. (3) Yogyakarta Special Province
The province is located on a saddle along Java’s mountainous backbone, and is surrounded by high mountain peaks; it faces southwards to the Indian Ocean. It extends to about 100 km in a W-E direction and about 50 km in a N-S direction. The western part comprises mainly of the southern slope of Mount Merapi, 2,911 m. amsl. and the alluvium plain fed by Progo river, while the eastern part occupies a plateau located on a corridor, which runs from the seashore of the Indian Ocean inland towards Surakarta, in Central Java. This historic
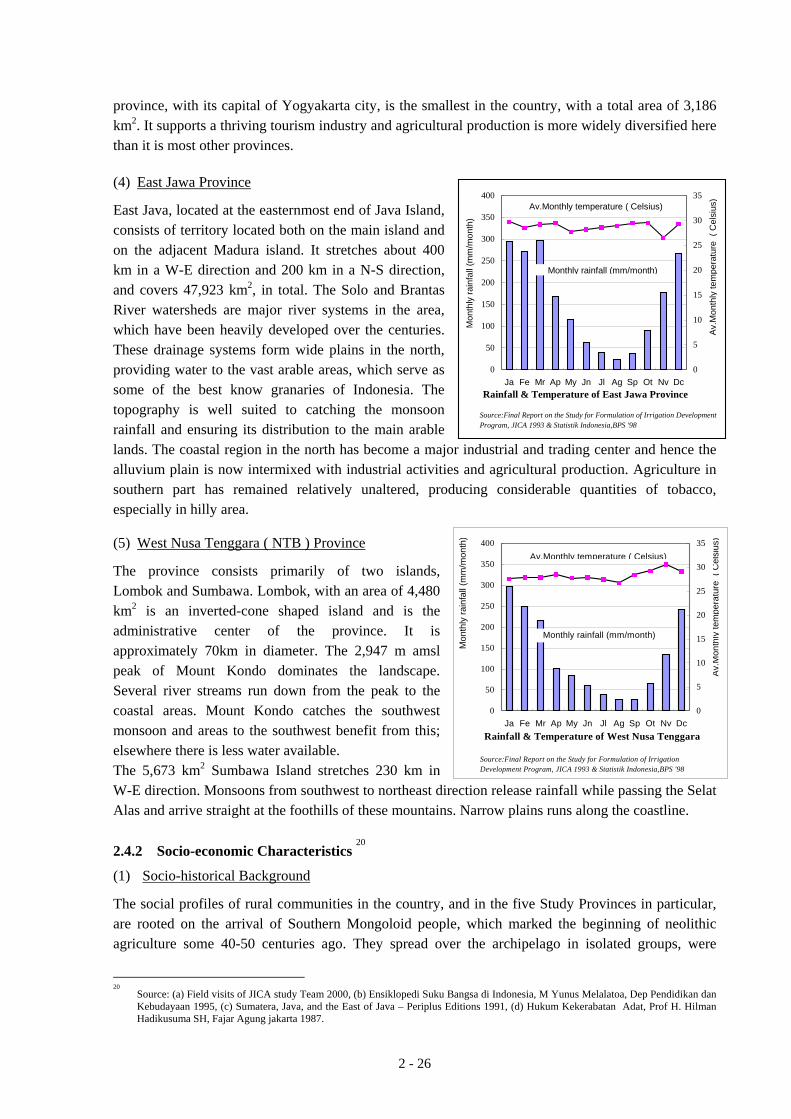
2 - 26
0
50
100
150
200
250
300
350
400
Ja Fe Mr Ap My Jn Jl Ag Sp Ot Nv Dc0
5
10
15
20
25
30
35
Source:Final Report on the Study for Formulation of Irrigation DevelopmentProgram, JICA 1993 & Statistik Indonesia,BPS '98
Rainfall & Temperature of East Jawa Province
Av.M
onth
ly te
mpe
ratu
re (
Cel
sius
)
Mon
thly
rain
fall
(mm
/mon
th)
Av.Monthly temperature ( Celsius)
Monthly rainfall (mm/month)
0
50
100
150
200
250
300
350
400
Ja Fe Mr Ap My Jn Jl Ag Sp Ot Nv Dc0
5
10
15
20
25
30
35
Rainfall & Temperature of West Nusa Tenggara
Source:Final Report on the Study for Formulation of IrrigationDevelopment Program, JICA 1993 & Statistik Indonesia,BPS '98
Mon
thly
rain
fall
(mm
/mon
th)
Av.M
onth
ly te
mpe
ratu
re (
Cel
sius
)
Monthly rainfall (mm/month)
Av.Monthly temperature ( Celsius)
province, with its capital of Yogyakarta city, is the smallest in the country, with a total area of 3,186 km2. It supports a thriving tourism industry and agricultural production is more widely diversified here than it is most other provinces. (4) East Jawa Province
East Java, located at the easternmost end of Java Island, consists of territory located both on the main island and on the adjacent Madura island. It stretches about 400 km in a W-E direction and 200 km in a N-S direction, and covers 47,923 km2, in total. The Solo and Brantas River watersheds are major river systems in the area, which have been heavily developed over the centuries. These drainage systems form wide plains in the north, providing water to the vast arable areas, which serve as some of the best know granaries of Indonesia. The topography is well suited to catching the monsoon rainfall and ensuring its distribution to the main arable lands. The coastal region in the north has become a major industrial and trading center and hence the alluvium plain is now intermixed with industrial activities and agricultural production. Agriculture in southern part has remained relatively unaltered, producing considerable quantities of tobacco, especially in hilly area. (5) West Nusa Tenggara ( NTB ) Province
The province consists primarily of two islands, Lombok and Sumbawa. Lombok, with an area of 4,480 km2 is an inverted-cone shaped island and is the administrative center of the province. It is approximately 70km in diameter. The 2,947 m amsl peak of Mount Kondo dominates the landscape. Several river streams run down from the peak to the coastal areas. Mount Kondo catches the southwest monsoon and areas to the southwest benefit from this; elsewhere there is less water available. The 5,673 km2 Sumbawa Island stretches 230 km in W-E direction. Monsoons from southwest to northeast direction release rainfall while passing the Selat Alas and arrive straight at the foothills of these mountains. Narrow plains runs along the coastline. 2.4.2 Socio-economic Characteristics
20
(1) Socio-historical Background
The social profiles of rural communities in the country, and in the five Study Provinces in particular, are rooted on the arrival of Southern Mongoloid people, which marked the beginning of neolithic agriculture some 40-50 centuries ago. They spread over the archipelago in isolated groups, were
20
Source: (a) Field visits of JICA study Team 2000, (b) Ensiklopedi Suku Bangsa di Indonesia, M Yunus Melalatoa, Dep Pendidikan dan Kebudayaan 1995, (c) Sumatera, Java, and the East of Java – Periplus Editions 1991, (d) Hukum Kekerabatan Adat, Prof H. Hilman Hadikusuma SH, Fajar Agung jakarta 1987.
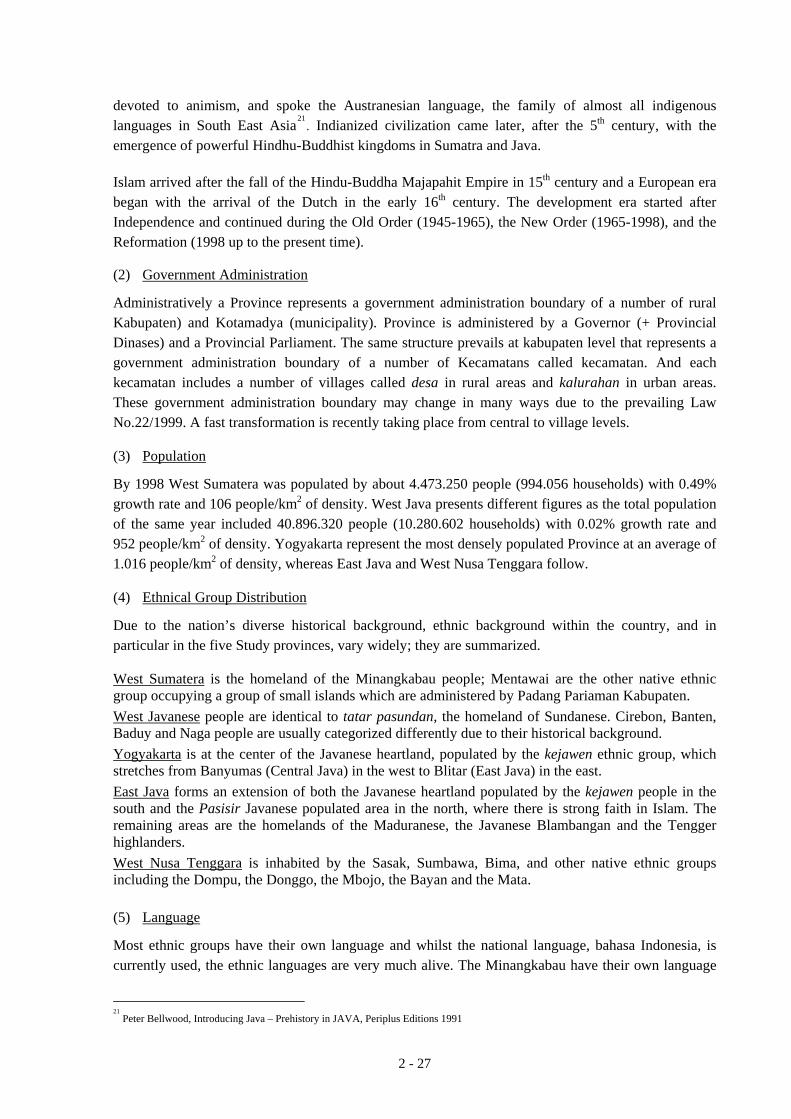
2 - 27
devoted to animism, and spoke the Austranesian language, the family of almost all indigenous languages in South East Asia21
. Indianized civilization came later, after the 5th century, with the emergence of powerful Hindhu-Buddhist kingdoms in Sumatra and Java. Islam arrived after the fall of the Hindu-Buddha Majapahit Empire in 15th century and a European era began with the arrival of the Dutch in the early 16th century. The development era started after Independence and continued during the Old Order (1945-1965), the New Order (1965-1998), and the Reformation (1998 up to the present time). (2) Government Administration
Administratively a Province represents a government administration boundary of a number of rural Kabupaten) and Kotamadya (municipality). Province is administered by a Governor (+ Provincial Dinases) and a Provincial Parliament. The same structure prevails at kabupaten level that represents a government administration boundary of a number of Kecamatans called kecamatan. And each kecamatan includes a number of villages called desa in rural areas and kalurahan in urban areas. These government administration boundary may change in many ways due to the prevailing Law No.22/1999. A fast transformation is recently taking place from central to village levels. (3) Population
By 1998 West Sumatera was populated by about 4.473.250 people (994.056 households) with 0.49% growth rate and 106 people/km2 of density. West Java presents different figures as the total population of the same year included 40.896.320 people (10.280.602 households) with 0.02% growth rate and 952 people/km2 of density. Yogyakarta represent the most densely populated Province at an average of 1.016 people/km2 of density, whereas East Java and West Nusa Tenggara follow. (4) Ethnical Group Distribution
Due to the nation’s diverse historical background, ethnic background within the country, and in particular in the five Study provinces, vary widely; they are summarized. West Sumatera is the homeland of the Minangkabau people; Mentawai are the other native ethnic group occupying a group of small islands which are administered by Padang Pariaman Kabupaten. West Javanese people are identical to tatar pasundan, the homeland of Sundanese. Cirebon, Banten, Baduy and Naga people are usually categorized differently due to their historical background. Yogyakarta is at the center of the Javanese heartland, populated by the kejawen ethnic group, which stretches from Banyumas (Central Java) in the west to Blitar (East Java) in the east. East Java forms an extension of both the Javanese heartland populated by the kejawen people in the south and the Pasisir Javanese populated area in the north, where there is strong faith in Islam. The remaining areas are the homelands of the Maduranese, the Javanese Blambangan and the Tengger highlanders. West Nusa Tenggara is inhabited by the Sasak, Sumbawa, Bima, and other native ethnic groups including the Dompu, the Donggo, the Mbojo, the Bayan and the Mata. (5) Language
Most ethnic groups have their own language and whilst the national language, bahasa Indonesia, is currently used, the ethnic languages are very much alive. The Minangkabau have their own language
21
Peter Bellwood, Introducing Java – Prehistory in JAVA, Periplus Editions 1991
2 - 28
that extends from Aceh Selatan and Muko-Muko Bangkulu. The Sundanese language that probably has links with the languages of Aceh, Batak, Melayu, Mentawai, Sasak and Tagalog in South Philippines. The Banten and Cirebon people, however, use both Sundanese and Javanese languages, and hence they are usually categorized differently by ethnicity. The Yogya and East Java ethnical groups speak Javanese language, unless they are Maduranese speakers. The Sasak and West Sumbawa languages are close to Sundanese, Javanese and Balinese. In East Sumbawa, Bima, however, there are different linguistic groups, which extend into the islands of Sumba and Flores. The Bajo, a sea-fishing people, speak a Samal language originating from the Philippines. (6) Religion
Islam is the main religion in most parts of the country and in the five Study Provinces. In some places, traditional customs and pre-Islamic rituals are still evident. The Minangkabau have strong faith in both Islam and Adat. The Adat practices, however, have currently changed due to the increasing renewed perceptions on Islam. In contrast, the Mentawai were Sabulungan animist; this practice was prohibited by Government in 1964 and they changed to Christian.Some Sabulungan rituals have, however, remained. In West Java more than 75% of the population are Moslem, but pre-Islamic rituals are also still evident. The people of Yogyakarta are mostly Javanist Islam who prefer the wayang epic and native customs, tempered by mystical devotion, rather than Quran and drum. Accordingly, the palace heirlooms (pusaka) are ritually cleaned with holy water, and a pre-Islamic harvest feast, called Asmaweddha, is incorporated into the Grebeg Maulud procession. East Javanese are mostly Moslem, but the Javanese heartland culture, kejawen, dominates the center and the south. The remaining areas have strong faith in Islam. In the west of Nusa Tenggara the Sasak are Islam, although some practice Wetu Telu, a combination of pre-Hindu, Hindu and Islam faiths. The Sumbawa and Bima people follow Islam, but pre-Islamic rituals are also still evident. (7) Kinship
Kinship in the Study Provinces shows vary as shown below: Province Kinship West Sumatera Matrilineal; exogamous; changing towards nuclear family West Java Parental; endogamous; nuclear family DI. Yogyakarta Parental; endogamous; nuclear family East Java Parental; endogamous; nuclear family NTB Patrilineal, parental; endogamous; nuclear family
Traditionally Minang were exogamous as they were not permitted to marry within their own clan or lineage. After marriage the wife remained with her maternal relatives, while the husband lived in a different place (mosque, his mother’s house) and was responsible more for his sisters’ children than for his own. Women play the mostly important role within the Minang communities. Women controlled the property, whilst men conducted the village affairs. In the remaining provinces, kinship was usually considered upon the same descendant lineage which mostly was parental. Marriage tended to be endogamous to keep the inherited properties within the family. After marriage a husband would live in his wife’s house (matrilocal), unless a house was prepared individually (neolocal). The husband is the head of family responsible primarily for his own wife and children, and accordingly decisions were generally made by the father rather than by the mother. Basically the property of the husband and of the wife before marriage and the any other
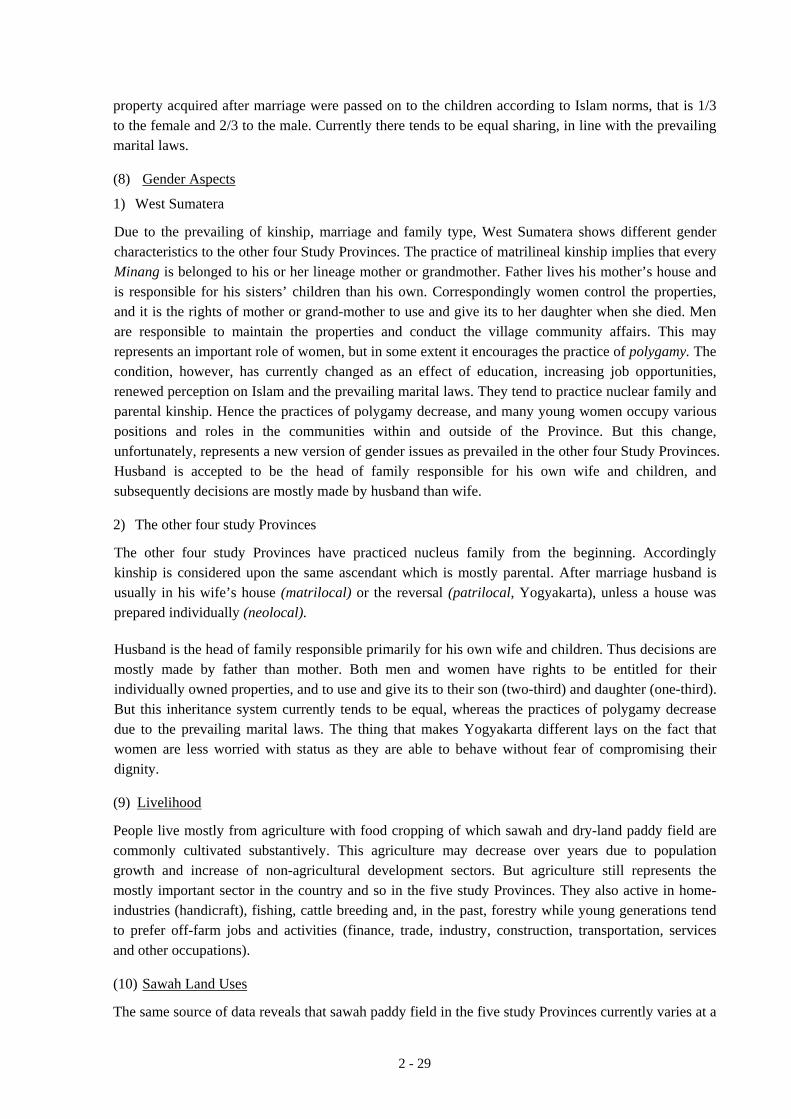
2 - 29
property acquired after marriage were passed on to the children according to Islam norms, that is 1/3 to the female and 2/3 to the male. Currently there tends to be equal sharing, in line with the prevailing marital laws. (8) Gender Aspects
1) West Sumatera
Due to the prevailing of kinship, marriage and family type, West Sumatera shows different gender characteristics to the other four Study Provinces. The practice of matrilineal kinship implies that every Minang is belonged to his or her lineage mother or grandmother. Father lives his mother’s house and is responsible for his sisters’ children than his own. Correspondingly women control the properties, and it is the rights of mother or grand-mother to use and give its to her daughter when she died. Men are responsible to maintain the properties and conduct the village community affairs. This may represents an important role of women, but in some extent it encourages the practice of polygamy. The condition, however, has currently changed as an effect of education, increasing job opportunities, renewed perception on Islam and the prevailing marital laws. They tend to practice nuclear family and parental kinship. Hence the practices of polygamy decrease, and many young women occupy various positions and roles in the communities within and outside of the Province. But this change, unfortunately, represents a new version of gender issues as prevailed in the other four Study Provinces. Husband is accepted to be the head of family responsible for his own wife and children, and subsequently decisions are mostly made by husband than wife. 2) The other four study Provinces
The other four study Provinces have practiced nucleus family from the beginning. Accordingly kinship is considered upon the same ascendant which is mostly parental. After marriage husband is usually in his wife’s house (matrilocal) or the reversal (patrilocal, Yogyakarta), unless a house was prepared individually (neolocal). Husband is the head of family responsible primarily for his own wife and children. Thus decisions are mostly made by father than mother. Both men and women have rights to be entitled for their individually owned properties, and to use and give its to their son (two-third) and daughter (one-third). But this inheritance system currently tends to be equal, whereas the practices of polygamy decrease due to the prevailing marital laws. The thing that makes Yogyakarta different lays on the fact that women are less worried with status as they are able to behave without fear of compromising their dignity. (9) Livelihood
People live mostly from agriculture with food cropping of which sawah and dry-land paddy field are commonly cultivated substantively. This agriculture may decrease over years due to population growth and increase of non-agricultural development sectors. But agriculture still represents the mostly important sector in the country and so in the five study Provinces. They also active in home-industries (handicraft), fishing, cattle breeding and, in the past, forestry while young generations tend to prefer off-farm jobs and activities (finance, trade, industry, construction, transportation, services and other occupations). (10) Sawah Land Uses
The same source of data reveals that sawah paddy field in the five study Provinces currently varies at a
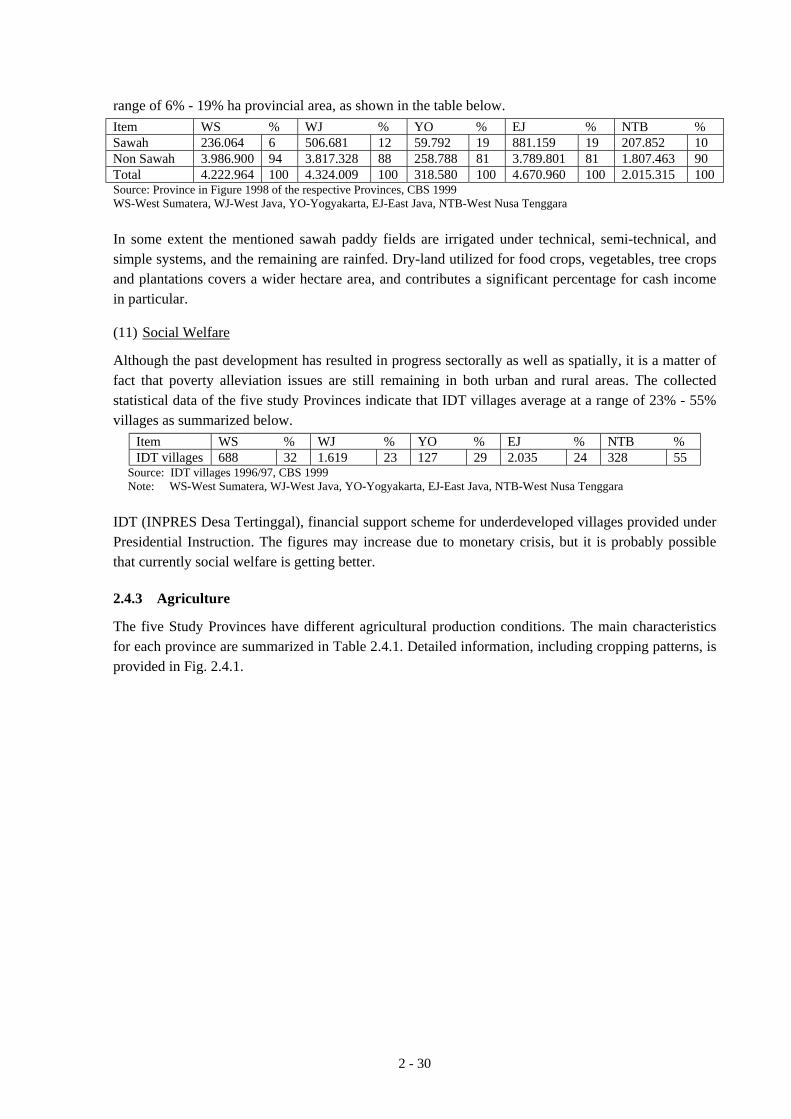
2 - 30
range of 6% - 19% ha provincial area, as shown in the table below. Item WS % WJ % YO % EJ % NTB % Sawah 236.064 6 506.681 12 59.792 19 881.159 19 207.852 10 Non Sawah 3.986.900 94 3.817.328 88 258.788 81 3.789.801 81 1.807.463 90 Total 4.222.964 100 4.324.009 100 318.580 100 4.670.960 100 2.015.315 100 Source: Province in Figure 1998 of the respective Provinces, CBS 1999 WS-West Sumatera, WJ-West Java, YO-Yogyakarta, EJ-East Java, NTB-West Nusa Tenggara In some extent the mentioned sawah paddy fields are irrigated under technical, semi-technical, and simple systems, and the remaining are rainfed. Dry-land utilized for food crops, vegetables, tree crops and plantations covers a wider hectare area, and contributes a significant percentage for cash income in particular. (11) Social Welfare
Although the past development has resulted in progress sectorally as well as spatially, it is a matter of fact that poverty alleviation issues are still remaining in both urban and rural areas. The collected statistical data of the five study Provinces indicate that IDT villages average at a range of 23% - 55% villages as summarized below.
Item WS % WJ % YO % EJ % NTB % IDT villages 688 32 1.619 23 127 29 2.035 24 328 55
Source: IDT villages 1996/97, CBS 1999 Note: WS-West Sumatera, WJ-West Java, YO-Yogyakarta, EJ-East Java, NTB-West Nusa Tenggara
IDT (INPRES Desa Tertinggal), financial support scheme for underdeveloped villages provided under Presidential Instruction. The figures may increase due to monetary crisis, but it is probably possible that currently social welfare is getting better. 2.4.3 Agriculture
The five Study Provinces have different agricultural production conditions. The main characteristics for each province are summarized in Table 2.4.1. Detailed information, including cropping patterns, is provided in Fig. 2.4.1.
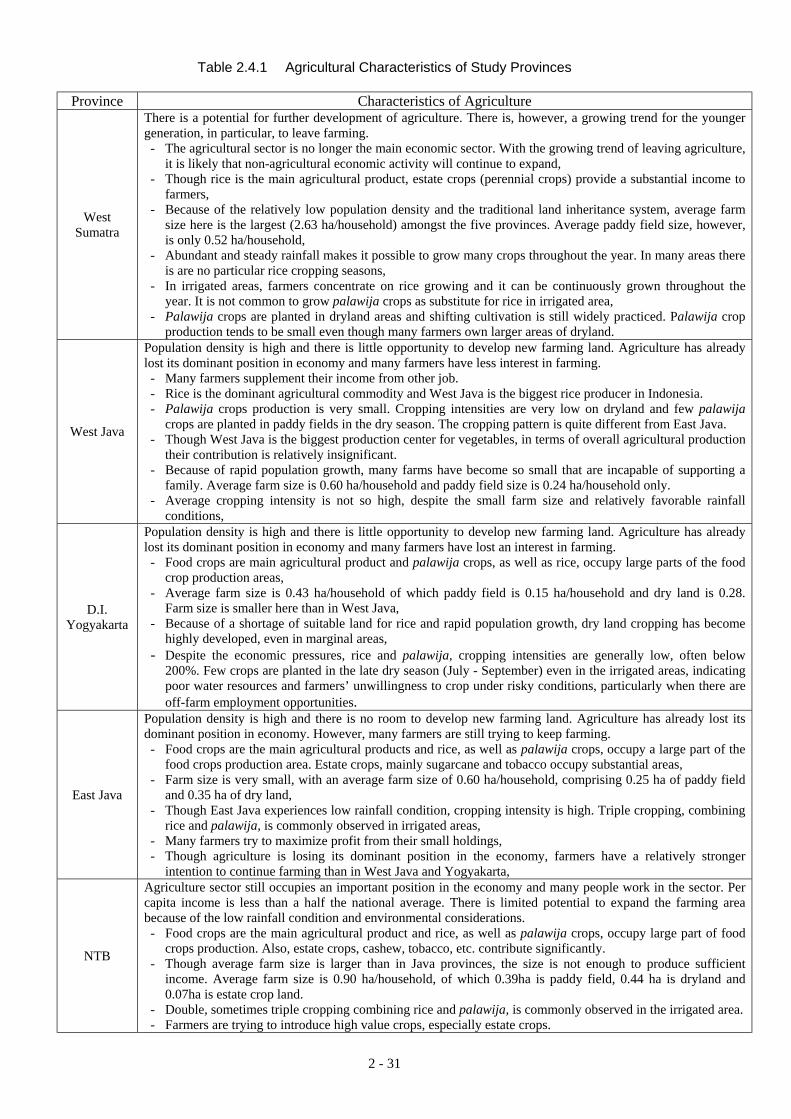
2 - 31
Table 2.4.1 Agricultural Characteristics of Study Provinces
Province Characteristics of Agriculture
West Sumatra
There is a potential for further development of agriculture. There is, however, a growing trend for the younger generation, in particular, to leave farming. - The agricultural sector is no longer the main economic sector. With the growing trend of leaving agriculture,
it is likely that non-agricultural economic activity will continue to expand, - Though rice is the main agricultural product, estate crops (perennial crops) provide a substantial income to
farmers, - Because of the relatively low population density and the traditional land inheritance system, average farm
size here is the largest (2.63 ha/household) amongst the five provinces. Average paddy field size, however, is only 0.52 ha/household,
- Abundant and steady rainfall makes it possible to grow many crops throughout the year. In many areas there is are no particular rice cropping seasons,
- In irrigated areas, farmers concentrate on rice growing and it can be continuously grown throughout the year. It is not common to grow palawija crops as substitute for rice in irrigated area,
- Palawija crops are planted in dryland areas and shifting cultivation is still widely practiced. Palawija crop production tends to be small even though many farmers own larger areas of dryland.
West Java
Population density is high and there is little opportunity to develop new farming land. Agriculture has already lost its dominant position in economy and many farmers have less interest in farming. - Many farmers supplement their income from other job. - Rice is the dominant agricultural commodity and West Java is the biggest rice producer in Indonesia. - Palawija crops production is very small. Cropping intensities are very low on dryland and few palawija
crops are planted in paddy fields in the dry season. The cropping pattern is quite different from East Java. - Though West Java is the biggest production center for vegetables, in terms of overall agricultural production
their contribution is relatively insignificant. - Because of rapid population growth, many farms have become so small that are incapable of supporting a
family. Average farm size is 0.60 ha/household and paddy field size is 0.24 ha/household only. - Average cropping intensity is not so high, despite the small farm size and relatively favorable rainfall
conditions,
D.I. Yogyakarta
Population density is high and there is little opportunity to develop new farming land. Agriculture has already lost its dominant position in economy and many farmers have lost an interest in farming. - Food crops are main agricultural product and palawija crops, as well as rice, occupy large parts of the food
crop production areas, - Average farm size is 0.43 ha/household of which paddy field is 0.15 ha/household and dry land is 0.28.
Farm size is smaller here than in West Java, - Because of a shortage of suitable land for rice and rapid population growth, dry land cropping has become
highly developed, even in marginal areas, - Despite the economic pressures, rice and palawija, cropping intensities are generally low, often below
200%. Few crops are planted in the late dry season (July - September) even in the irrigated areas, indicating poor water resources and farmers’ unwillingness to crop under risky conditions, particularly when there are off-farm employment opportunities.
East Java
Population density is high and there is no room to develop new farming land. Agriculture has already lost its dominant position in economy. However, many farmers are still trying to keep farming. - Food crops are the main agricultural products and rice, as well as palawija crops, occupy a large part of the
food crops production area. Estate crops, mainly sugarcane and tobacco occupy substantial areas, - Farm size is very small, with an average farm size of 0.60 ha/household, comprising 0.25 ha of paddy field
and 0.35 ha of dry land, - Though East Java experiences low rainfall condition, cropping intensity is high. Triple cropping, combining
rice and palawija, is commonly observed in irrigated areas, - Many farmers try to maximize profit from their small holdings, - Though agriculture is losing its dominant position in the economy, farmers have a relatively stronger
intention to continue farming than in West Java and Yogyakarta,
NTB
Agriculture sector still occupies an important position in the economy and many people work in the sector. Per capita income is less than a half the national average. There is limited potential to expand the farming area because of the low rainfall condition and environmental considerations. - Food crops are the main agricultural product and rice, as well as palawija crops, occupy large part of food
crops production. Also, estate crops, cashew, tobacco, etc. contribute significantly. - Though average farm size is larger than in Java provinces, the size is not enough to produce sufficient
income. Average farm size is 0.90 ha/household, of which 0.39ha is paddy field, 0.44 ha is dryland and 0.07ha is estate crop land.
- Double, sometimes triple cropping combining rice and palawija, is commonly observed in the irrigated area. - Farmers are trying to introduce high value crops, especially estate crops.
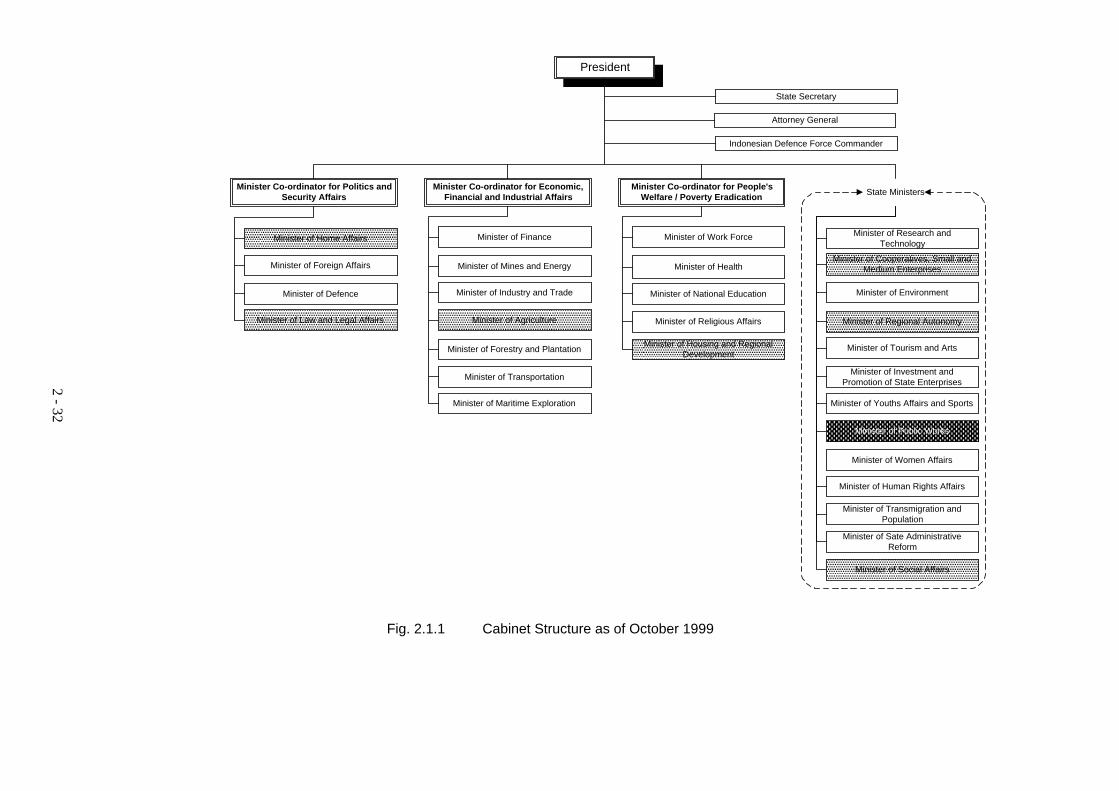
2 - 32
President
Minister Co-ordinator for Politics andSecurity Affairs
���������������������������������������������������������������� ����������������������������������� Minister of Home Affairs
���������������������������������������������������������������� ����������������������������������� Minister of Law and Legal Affairs
Minister of Defence
Minister Co-ordinator for Economic,Financial and Industrial Affairs
Minister of Finance
��������������������������������������������������������������������������������������������������� Minister of Agriculture
Minister of Industry and Trade
Minister of Mines and Energy
Minister Co-ordinator for People'sWelfare / Poverty Eradication
Minister of Work Force
Minister of Religious Affairs
Minister of National Education
Minister of Health
Minister of Research andTechnology
��������������������� �������������������� �������������������� ������������������������������ ������������������� Minister of Regional Autonomy
Minister of Environment
������������������� ������������������ ������������������ ��������������������������� �����������������
Minister of Cooperatives, Small andMedium Enterprises
Minister of Forestry and Plantation
Minister of Transportation
Minister of Maritime Exploration
���������������������������� ��������������������������� ��������������������������������������������
Minister of Housing and RegionalDevelopment
Minister of Tourism and Arts
Minister of Investment andPromotion of State Enterprises
Minister of Youths Affairs and Sports
������������������� ������������������ ������������������ ��������������������������� ����������������� Minister of Public Works
Minister of Women Affairs
Minister of Human Rights Affairs
Minister of Sate AdministrativeReform ����������
����������� �������������������� �������������������� ������������������������������ ������������������� Minister of Social Affairs
Minister of Transmigration andPopulation
Attorney General
State Secretary
Indonesian Defence Force Commander
State Ministers
Minister of Foreign Affairs
Cabinet Structure
Fig. 2.1.1 Cabinet Structure as of October 1999
2 - 32
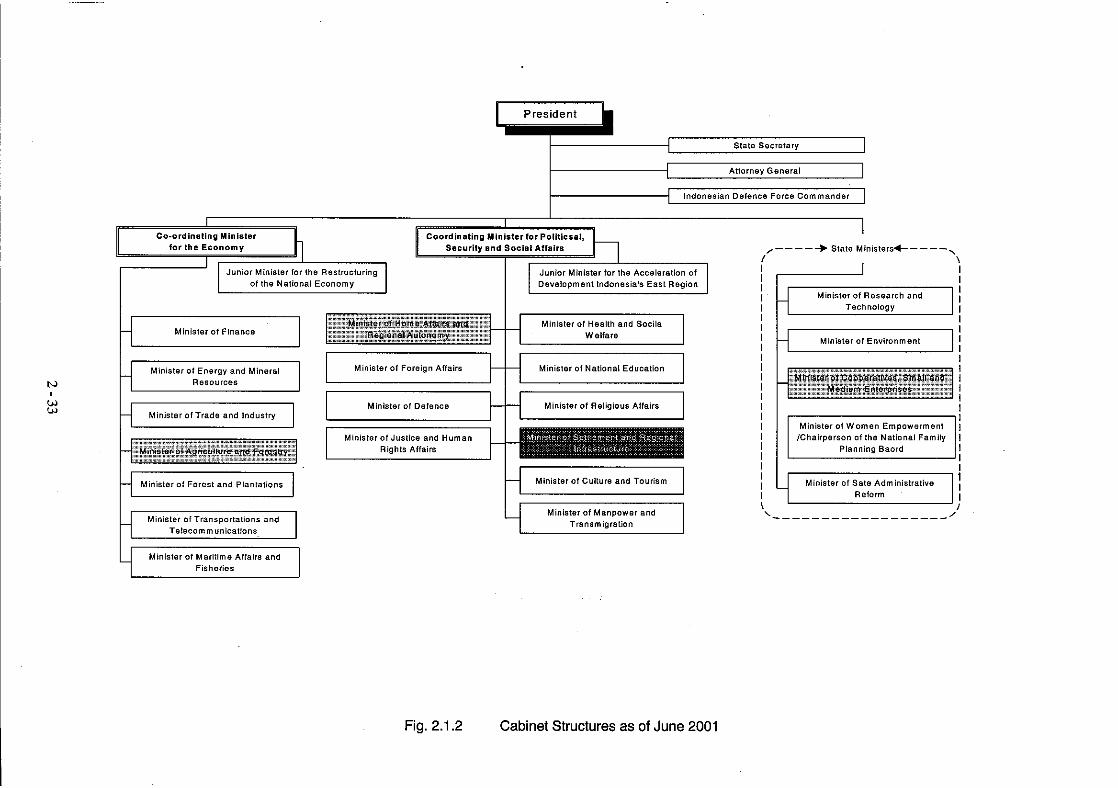
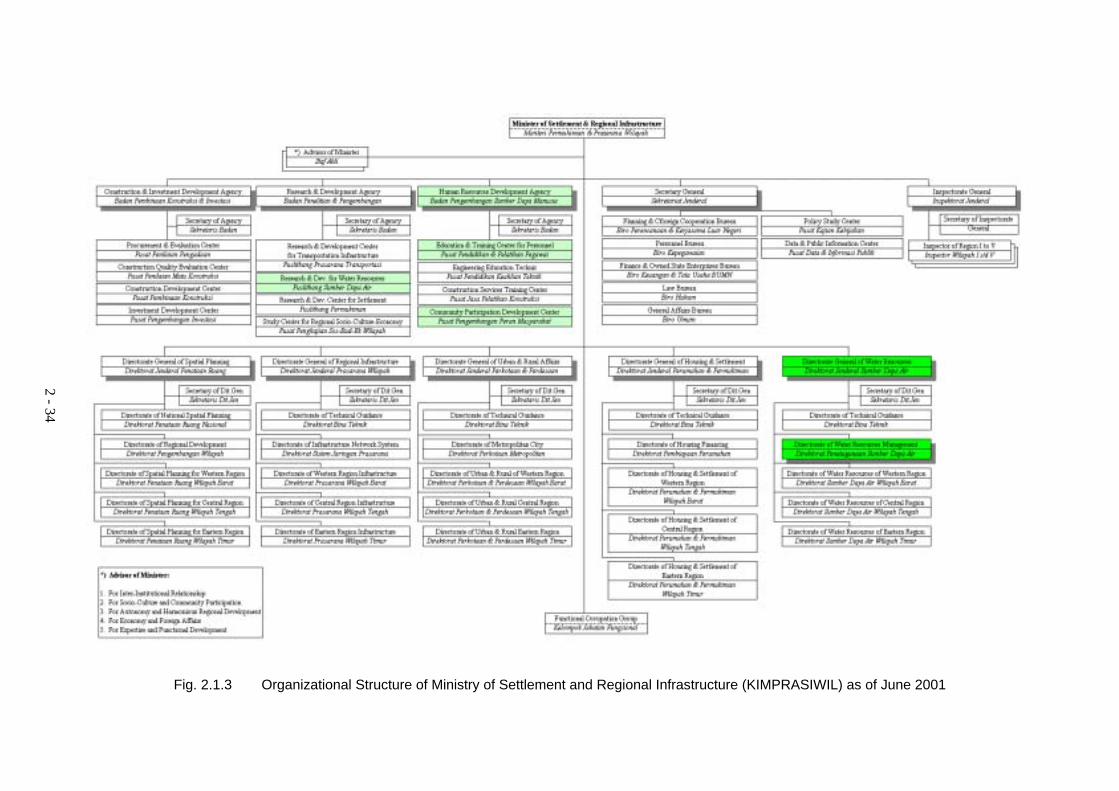
2 - 34
Fig. 2.1.3 Organizational Structure of Ministry of Settlement and Regional Infrastructure (KIMPRASIWIL) as of June 2001
2 - 34
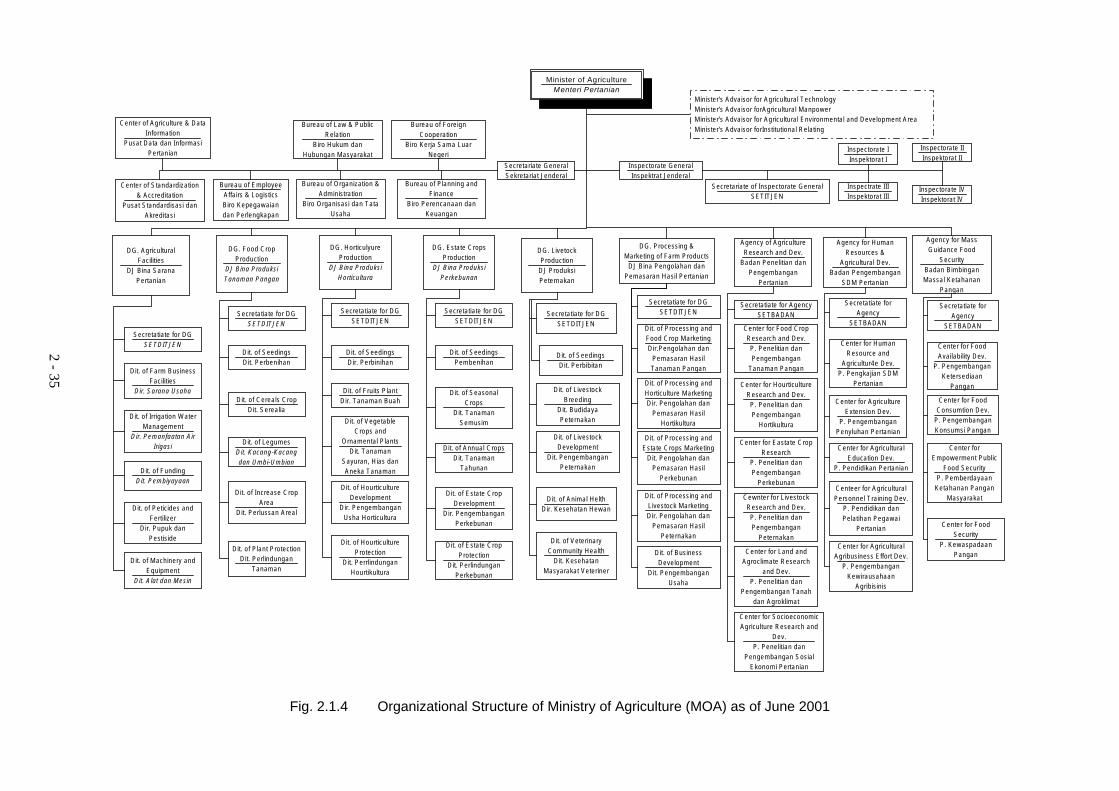
2 - 35
Fig. 2.1.4 Organizational Structure of Ministry of Agriculture (MOA) as of June 2001
DG. Agricu ltura lFacilities
DJ B ina SaranaPertanian
Secretatia te for DGSETDITJEN
Dit. o f M achinery andEquipm ent
Dit. A lat dan M esin
Dit. o f Peticides andFertilizer
D ir. Pupuk danPestiside
D it. o f FundingDit. Pem biyayaan
Dit. o f Irrigation W aterM anagem ent
Dir. Pem anfaatan A irIrigasi
Dit. o f Farm BusinessFacilities
Dir. Sarana Usaha
DG. Food CropProduction
DJ B ina ProduksiTanam an Pangan
Secretatia te for DGSETDITJEN
Dit. o f P lant ProtectionD it. Perlindungan
Tanam an
D it. o f Increase CropArea
D it. Perlussan Areal
D it. o f Legum esDit. Kacang-Kacangdan Um bi-Um bian
Dit. o f Cereals CropD it. Serealia
D it. o f SeedingsD it. Perbenihan
DG. Horticu lyureProduction
DJ B ina ProduksiHorticu ltura
Secretatia te for DGSETDITJEN
Dit. o f Hourticu ltureProtection
D it. PerrlindunganHourtikultura
D it. o f Hourticu ltureDevelopm ent
D ir. Pengem banganUsha Horticu ltura
D it. o f VegetableCrops and
O rnam ental P lantsD it. Tanam an
Sayuran, H ias danAneka Tanam an
D it. o f F ru its P lantD ir. Tanam an Buah
D it. o f SeedingsD ir. Perb in ihan
DG. Estate CropsProduction
DJ B ina ProduksiPerkebunan
Secretatia te for DGSETDITJEN
Dit. o f Estate CropProtection
D it. PerlindunganPerkebunan
D it. o f Estate CropDevelopm ent
D ir. Pengem banganPerkebunan
D it. o f Annual C ropsD it. Tanam an
Tahunan
D it. o f SeasonalCrops
D it. Tanam anSem usim
Dit. o f SeedingsPem benihan
DG. LivetockProduction
DJ ProduksiPeternakan
Secretatia te for DGSETDITJEN
Dit. o f VeterinaryCom m unity Health
D it. KesehatanM asyarakat Veteriner
D it. o f Anim al HelthD ir. Kesehatan Hewan
D it. o f L ivestockDevelopm ent
D it. Pengem banganPeternakan
D it. o f L ivestockBreeding
D it. BudidayaPeternakan
DG. Processing &M arketing of Farm Products
DJ B ina Pengolahan danPem asaran Hasil Pertanian
Secretatia te for DGSETDITJEN
Dit. o f BusinessDevelopm ent
D it. Pengem banganUsaha
D it. o f P rocessing andLivestock M arketingD ir. Pengolahan dan
Pem asaran HasilPeternakan
D it. o f P rocessing andEstate Crops M arketing
D it. Pengolahan danPem asaran Hasil
Perkebunan
D it. o f P rocessing andHorticu lture M arketingD ir. Pengolahan dan
Pem asaran HasilHortiku ltura
D it. o f P rocessing andFood Crop M arketingD ir.Pengolahan dan
Pem asaran HasilTanam an Pangan
Agency of Agricu ltureResearch and Dev.
Badan Penelitian danPengem bangan
Pertanian
Secretatia te for AgencySETBADAN
Center for Land andAgroclim ate Research
and Dev.P. Penelitian dan
Pengem bangan Tanahdan Agroklim at
Cewnter for LivestockResearch and Dev.
P. Penelitian danPengem bangan
Peternakan
Center for Eastate CropResearch
P. Penelitian danPengem bangan
Perkebunan
Center for Hourticu ltureResearch and Dev.
P. Penelitian danPengem bangan
Hortiku ltura
Center for Food CropResearch and Dev.
P. Penelitian danPengem bangan
Tanam an Pangan
Agency for Hum anResources &
Agricu ltural Dev.Badan Pengem bangan
SDM Pertanian
Secretatia te forAgency
SETBADAN
Center for Agricu ltura lAgribusiness Effort Dev.
P. Pengem banganKew irausahaan
Agrib isin is
Centeer for Agricu ltura lPersonnel Train ing Dev.
P. Pendidikan danPelatihan Pegawai
Pertanian
Center for Agricu ltura lEducation Dev.
P. Pendidikan Pertanian
Center for Agricu ltureExtension Dev.
P. Pengem banganPenyluhan Pertanian
Center for Hum anResource and
Agricu ltur4e Dev.P. Pengkajian SDM
Pertanian
Agency for M assG uidance Food
SecurityBadan B im binganM assal Ketahanan
Pangan
Secretatia te forAgency
SETBADAN
Center for FoodSecurity
P. KewaspadaanPangan
Center forEm powerm ent Public
Food SecurityP. Pem berdayaan
Ketahanan PanganM asyarakat
Center for FoodConsum tion Dev.
P. Pengem banganKonsum si Pangan
Center for FoodAvailab ility Dev.
P. Pengem banganKetersediaan
Pangan
D it. o f SeedingsD it. Perbib itan
Center for Socioeconom icAgricu lture Research and
Dev.P. Penelitian dan
Pengem bangan SosialEkonom i Pertanian
Inspectorate GeneralInspektrat Jenderal
Secretaria te of Inspectorate G eneralSETITJEN
Inspectrate IIIInspektorat III
Inspectorate IVInspektorat IV
Inspectorate IInspektorat I
Bureau of Fore ignCooperation
Biro Kerja Sam a LuarNegeri
Bureau of Em ployeeAffa irs & LogisticsB iro Kepegawaiandan Perlengkapan
Bureau of Law & PublicRelation
Biro Hukum danHubungan M asyarakat
Center of S tandardization& Accreditation
Pusat S tandardisasi danAkreditasi
Center of Agricu lture & DataInform ation
Pusat Data dan Inform asiPertanian
Bureau of Organization &Adm inistration
Biro Organisasi dan TataUsaha
Bureau of P lanning andFinance
Biro Perencanaan danKeuangan
Secretaria te G eneralSekretaria t Jenderal
Minister of AgricultureMenteri Pertanian
Inspectorate IIInspektorat II
M in ister's Advaisor for Agricu ltura l TechnologyM inister's Advaisor forAgricu ltura l M anpowerM in ister's Advaisor for Agricu ltura l Environm enta l and Developm ent A reaM inister's Advaisor forInstitu tional Relating
2 - 35
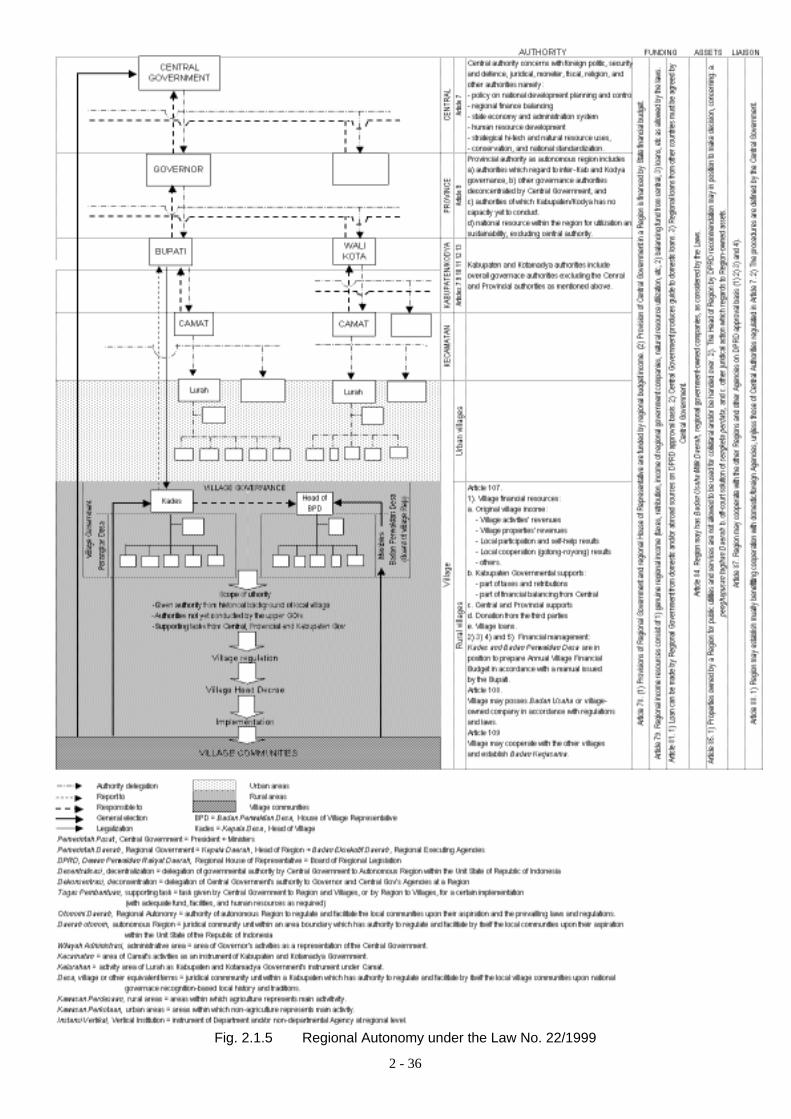
2 - 36
Fig. 2.1.5 Regional Autonomy under the Law No. 22/1999
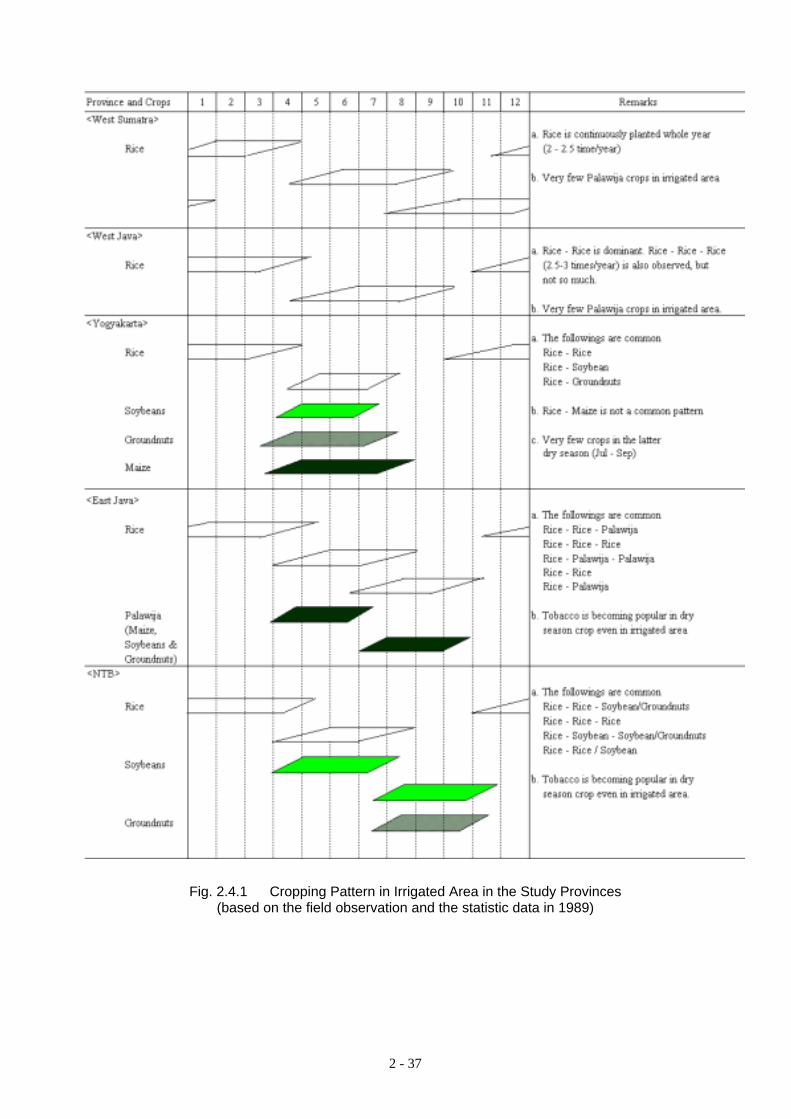
2 - 37
Fig. 2.4.1 Cropping Pattern in Irrigated Area in the Study Provinces
(based on the field observation and the statistic data in 1989)