Embed Size (px)
Citation preview
International Education Studies; Vol. 8, No. 12; 2015 ISSN 1913-9020 E-ISSN 1913-9039
Published by Canadian Center of Science and Education
218
Socio-Economic Factors on Indonesia Education Disparity
Yuni Azzizah1
1 International Post Graduate Program in Human Security, Graduate School of International Cultural Study, Tohoku University, Japan
Correspondence: Yuni Azzizah, International Post Graduate Program in Human Security, Graduate School of International Cultural Study, Tohoku University, 41 Kawauchi, Aoba-ku, Sendai, Miyagi 980-8576, Japan. E-mail: [email protected]
Received: June 1, 2015 Accepted: July 2, 2015 Online Published: November 26, 2015
doi:10.5539/ies.v8n12p218 URL: http://dx.doi.org/10.5539/ies.v8n12p218
Abstract Since 1998, regional governments in Indonesia have had greater autonomy due to the commencement of a reformation movement across Indonesia. Large portions of education management were delegated to the regional governments. Because of this, the education level varies strongly across Indonesia’ provinces. Referring to the data provided by the Indonesian Bureau of Statistics, it is found that Eastern Indonesia generally has a higher rate of uneducated than Western Indonesia. We review the current condition of Indonesian education in terms of regional disparity among eastern and western provinces and study the correlation between inequality in education and other related aspects, such as social and economic conditions. We find that inequality issues on socio-economic conditions are reflected in the education disparity between Eastern and Western Indonesia. By employing panel data with provinces as units of observations, we find that the difference in regional development among Indonesian provinces influences education issues. By evaluating the standard deviation of the statistic we were able to identify socio-economic factors that influence the regional education disparity.
Keywords: Indonesia, education; inequality, human security, regional disparity
1. Introduction 2014 marked the end of the United Nations Decade of Education for Sustainable Development (DESD).The objective was the sustainable development of all aspects of education and learning in order to address the social, economic, cultural and environmental issues we face in the 21st century. In order to implement this agenda Indonesia, as a multicultural country, is exposed to a conflict of interest between the national system and the regional system. In 1998, regional provinces in Indonesia received greater autonomy due to the commencement of a reformation movement across Indonesia. Large portions of education management were delegated to regional governments with the objective of empowering these regional governments to manage education in their area, especially from the levels of preschool to high school.
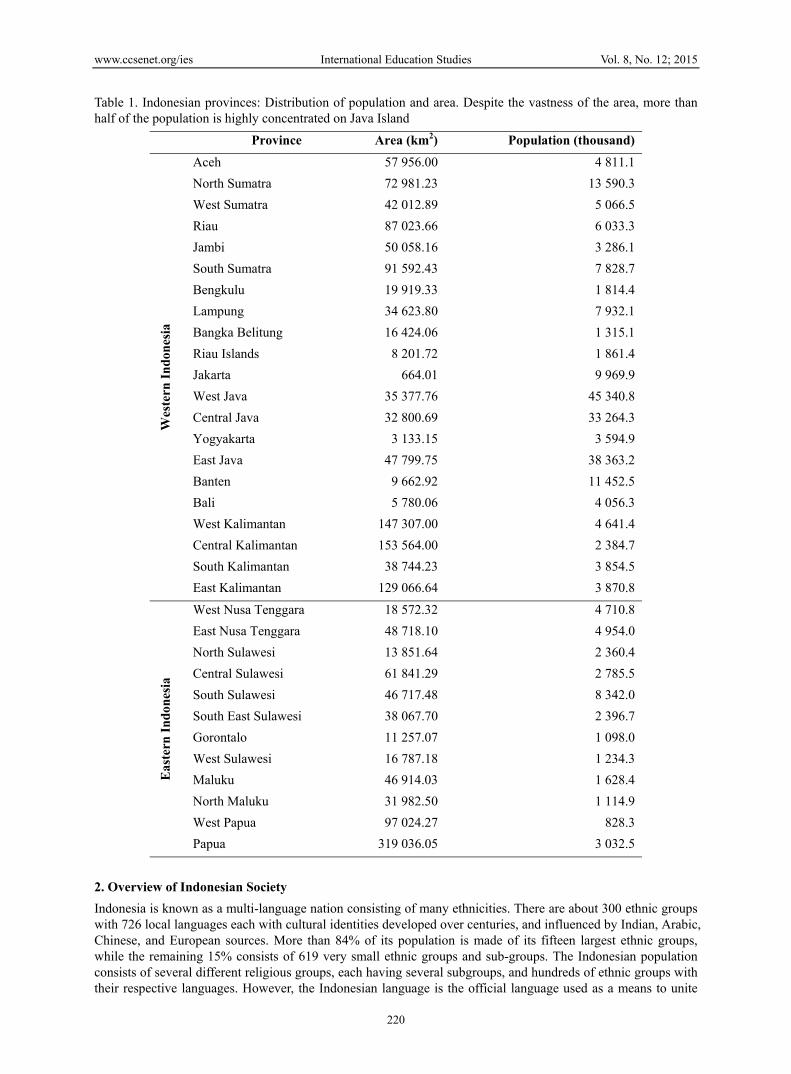
Under the vision of “Developing the national education system into a strong and respected social institution which empowers all citizens of Indonesia to become enlightened human beings who are able to keep abreast of the challenges of the time”, various policies have been developed by the Indonesian government. However these policies are still not well implemented or well distributed. The education level varies unevenly across Indonesia’s provinces. Suryadharma in 2006 explained that there are two types of regional segregation in Indonesia: Java and Bali versus outside Java and Bali and Western Indonesia versus Eastern Indonesia. Western Indonesia consists of Java, Bali, Sumatra and Kalimantan, while Eastern Indonesia is made up of Sulawesi, Nusa Tenggara Archipelago, Maluku Archipelago, and Papua. Western Indonesia, especially Java and Bali, are significantly more developed than Eastern Indonesia in terms of economic activity, infrastructure, and population. In addition, he also disaggregates the country into urban and rural areas. The population distribution of the provinces is shown in Table 1.
In this study, we discuss the unequal education development in western and eastern Indonesia. We aim to point out the major issues that influence the inequality between the western and eastern parts of Indonesia. We utilize data from Statistics Indonesia (Biro PusatStatistik, or BPS). BPS is an Indonesian government bureau responsible for conducting surveys on Indonesian citizens and collecting socio-demographic data. The data we took from Statistics Indonesia originated from one of Statistics Indonesia’s surveys, the Susenas. Suryadharmaet.
www.ccsenet.org/ies International Education Studies Vol. 8, No. 12; 2015
219
al. (2005) explains comprehensively about Susenas in their paper. Susenas is a nationally representative household survey by Statistics Indonesia that covers all areas of the country. It has two types of surveys, the “core” and the “module”. Core Susenas is conducted every year (usually in February) and collects demographic and socio-economic conditions of Indonesian household members. Module Susenas is also conducted every year, but it rotates between three modules: health, social & cultural, and consumption. More specifically, our study utilizes net enrollment ratio data from Susenas 2003-2013, which were compiled and published as singular tables by Statistics Indonesia.
In its 2012 report, UNICEF showed that children from poor family were four times more likely to drop out of school than the rich family counterpart. In investigating the socio-economy factor, we use the poverty definition defined by Statistics Indonesia for the poverty indicators, which is the inability of a person (or family) to fulfill their “basic needs”. The fulfillment of basic needs is measured by per capita expenditure for food and other needs, in which if a person’s expenditure is lower than the average minimum amount needed to fulfill the basic needs in that province, then the person is considered poor. We utilize the poverty rate data from the core and consumption modules of Susenas that simplify the headcount of the number of people living below the poverty line. Aside from data and figures from Susenas, we also utilize other data published by Statistics Indonesia, such as the regional Gini index for each province in Indonesia, and the Regional Gross Domestic Product growth rate. Regional Gini index data are actually based on Susenas data as well, but it has been analyzed further and compiled in a Welfare Indicators publication by Statistics Indonesia. We also divide the provinces into 2 categories: east and west. The east group consists of provinces in Sulawesi, Nusa Tenggara Archipelago, Maluku Archipelago, Papua regions, while the west group consists of provinces residing in Java, Bali, Sumatra and Kalimantan.
www.ccsenet.org/ies International Education Studies Vol. 8, No. 12; 2015
220
Table 1. Indonesian provinces: Distribution of population and area. Despite the vastness of the area, more than half of the population is highly concentrated on Java Island
Province Area (km2) Population (thousand)
Wes
tern
Indo
nesia
Aceh 57 956.00 4 811.1
North Sumatra 72 981.23 13 590.3
West Sumatra 42 012.89 5 066.5
Riau 87 023.66 6 033.3
Jambi 50 058.16 3 286.1
South Sumatra 91 592.43 7 828.7
Bengkulu 19 919.33 1 814.4
Lampung 34 623.80 7 932.1
Bangka Belitung 16 424.06 1 315.1
Riau Islands 8 201.72 1 861.4
Jakarta 664.01 9 969.9
West Java 35 377.76 45 340.8
Central Java 32 800.69 33 264.3
Yogyakarta 3 133.15 3 594.9
East Java 47 799.75 38 363.2
Banten 9 662.92 11 452.5
Bali 5 780.06 4 056.3
West Kalimantan 147 307.00 4 641.4
Central Kalimantan 153 564.00 2 384.7
South Kalimantan 38 744.23 3 854.5
East Kalimantan 129 066.64 3 870.8
East
ern
Indo
nesia
West Nusa Tenggara 18 572.32 4 710.8
East Nusa Tenggara 48 718.10 4 954.0
North Sulawesi 13 851.64 2 360.4
Central Sulawesi 61 841.29 2 785.5
South Sulawesi 46 717.48 8 342.0
South East Sulawesi 38 067.70 2 396.7
Gorontalo 11 257.07 1 098.0
West Sulawesi 16 787.18 1 234.3
Maluku 46 914.03 1 628.4
North Maluku 31 982.50 1 114.9
West Papua 97 024.27 828.3
Papua 319 036.05 3 032.5
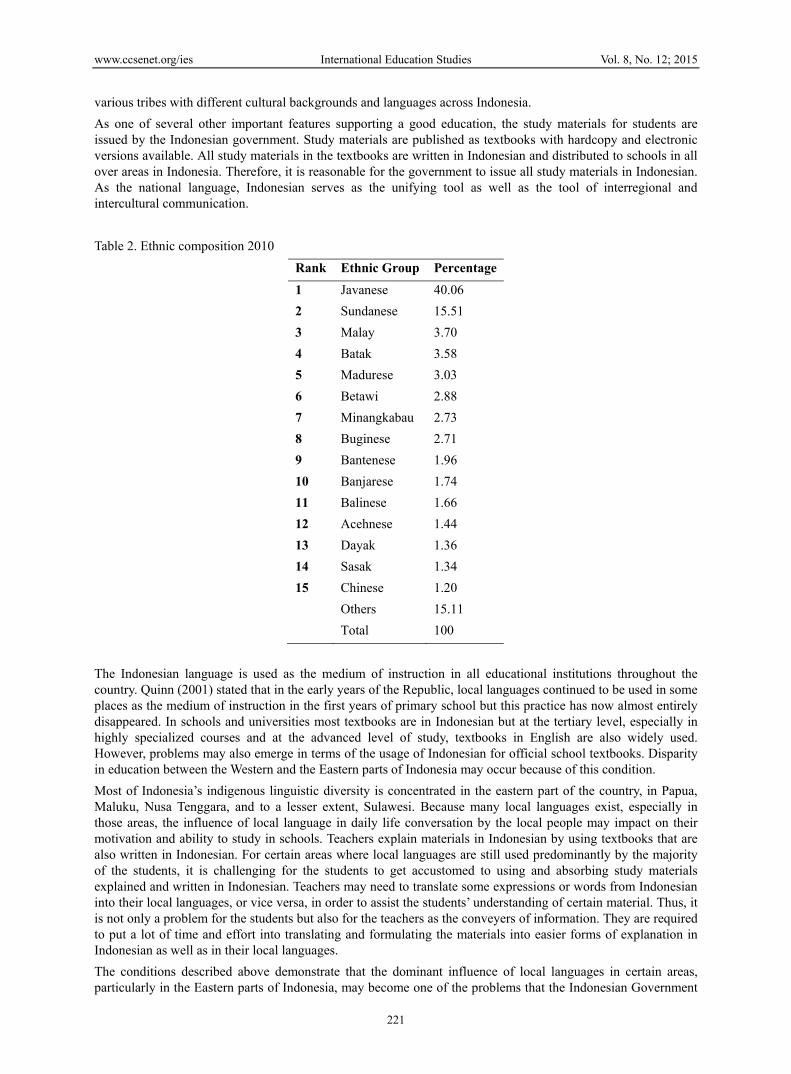
2. Overview of Indonesian Society Indonesia is known as a multi-language nation consisting of many ethnicities. There are about 300 ethnic groups with 726 local languages each with cultural identities developed over centuries, and influenced by Indian, Arabic, Chinese, and European sources. More than 84% of its population is made of its fifteen largest ethnic groups, while the remaining 15% consists of 619 very small ethnic groups and sub-groups. The Indonesian population consists of several different religious groups, each having several subgroups, and hundreds of ethnic groups with their respective languages. However, the Indonesian language is the official language used as a means to unite
www.ccsenet.org/ies International Education Studies Vol. 8, No. 12; 2015
221
various tribes with different cultural backgrounds and languages across Indonesia.
As one of several other important features supporting a good education, the study materials for students are issued by the Indonesian government. Study materials are published as textbooks with hardcopy and electronic versions available. All study materials in the textbooks are written in Indonesian and distributed to schools in all over areas in Indonesia. Therefore, it is reasonable for the government to issue all study materials in Indonesian. As the national language, Indonesian serves as the unifying tool as well as the tool of interregional and intercultural communication.
Table 2. Ethnic composition 2010
Rank Ethnic Group Percentage1 Javanese 40.06
2 Sundanese 15.51
3 Malay 3.70
4 Batak 3.58
5 Madurese 3.03
6 Betawi 2.88
7 Minangkabau 2.73
8 Buginese 2.71
9 Bantenese 1.96
10 Banjarese 1.74
11 Balinese 1.66
12 Acehnese 1.44
13 Dayak 1.36
14 Sasak 1.34
15 Chinese 1.20
Others 15.11
Total 100
The Indonesian language is used as the medium of instruction in all educational institutions throughout the country. Quinn (2001) stated that in the early years of the Republic, local languages continued to be used in some places as the medium of instruction in the first years of primary school but this practice has now almost entirely disappeared. In schools and universities most textbooks are in Indonesian but at the tertiary level, especially in highly specialized courses and at the advanced level of study, textbooks in English are also widely used. However, problems may also emerge in terms of the usage of Indonesian for official school textbooks. Disparity in education between the Western and the Eastern parts of Indonesia may occur because of this condition.
Most of Indonesia’s indigenous linguistic diversity is concentrated in the eastern part of the country, in Papua, Maluku, Nusa Tenggara, and to a lesser extent, Sulawesi. Because many local languages exist, especially in those areas, the influence of local language in daily life conversation by the local people may impact on their motivation and ability to study in schools. Teachers explain materials in Indonesian by using textbooks that are also written in Indonesian. For certain areas where local languages are still used predominantly by the majority of the students, it is challenging for the students to get accustomed to using and absorbing study materials explained and written in Indonesian. Teachers may need to translate some expressions or words from Indonesian into their local languages, or vice versa, in order to assist the students’ understanding of certain material. Thus, it is not only a problem for the students but also for the teachers as the conveyers of information. They are required to put a lot of time and effort into translating and formulating the materials into easier forms of explanation in Indonesian as well as in their local languages.
The conditions described above demonstrate that the dominant influence of local languages in certain areas, particularly in the Eastern parts of Indonesia, may become one of the problems that the Indonesian Government

www.ccsenet.org/ies International Education Studies Vol. 8, No. 12; 2015
222
must overcome and pay more attention to. The inadequate infrastructure and the forest typography in Eastern Indonesia have constrained the deployment of teachers and study materials to these areas. The study materials written in Indonesian that are distributed to the eastern areas can be problematic if the teachers who hold the key to the students’ education, do not have the capability to teach and explain the important parts of the study materials to the students. The teachers’ ability to master Indonesian and understand the local languages at the same time may be a great help to minimize the disparity of education between the people in the western and eastern parts of Indonesia.
2.1 Importance of Education for Indonesian Regional Development
In the last two decades an enormous amount of literature on the measurement of disparities has been published, both in Indonesia and internationally. Disparity between provinces in Indonesia is still severe especially in terms of economic and education aspects. This condition has been the real problem, particularly between the Western and Eastern parts of Indonesia. The picture of disparity in education, for example, can obviously be seen in the facilities available in some regions and not others. According to Samosir (2008), it is common to see a primary school with a permanent building, good tables and chairs in Medan (capital city of North Sumatra), while in East Nusa Tenggara the students might have to be satisfied with a school building with an old roof, leakages and limited adequate tables and chairs.
Looking at the Human Development Index (HDI) of Indonesian Provinces in Figure 1 we can see that eastern Indonesia generally has low HDI compared to western Indonesia. The lowest value has been held by Papua Province since 2005. In 2011 that value was 65.36, while the highest HDI among Indonesia Provinces was the special capital city district of Jakarta at 77.97. The national average Human Development Index was 72.77.The HDI of a region is affected by various factors. Here we compare the rate of uneducated and HDI of the provinces. We first assume that the HDI of Indonesian provinces can be modeled by following equation,
log(HDI) = a0+(a1+a2×EW) × log(UNEDU) (1)
Where UNEDU is the uneducated rate, EW is a dummy variable which has value 1 for the western provinces and 0 for the eastern provinces, a0 is a constant, a1 is a coefficient that represents the dependency of HDI to UNEDU, and a2 is a coefficient that represents the east-west disparity. By utilizing regression analysis we estimate those values:
Table 3. HDI vs uneducated rate regression coefficient
Values Std. Error t Stat P-value
a0 1.8781 0.0045 416 5.6 10a1 -0.0432 0.0060 -7.1 6.0 10a2 0.0219 0.0057 3.8 6.1 10
The equation is illustrated in Figure 2. The low value of P-value indicates that there is indeed a gap between western and eastern Indonesia. By reducing the uneducated rate to half of its value the HDI of eastern provinces will increase by 2.8%, while it will increase the HDI of western provinces by 1.4%.Any change in the rate of uneducated will affect the development of eastern provinces more than it affects their western counterparts.

www.ccsen
Figure 1Provinc
capital city
Figure 2.rate of un
2.2 Educat
Facilities aeducation.improve eqEastern Ingrades hav
The effortnumber of
net.org/ies
1. The Human ce, the second y district of Ja
. Graph of Humneducated. A m
(blue)
tion Infrastruc
and educators The lack of qquity educatio
ndonesia. In sove to be squeez
t by the goverf primary scho
Development lowest is the W
akarta at about Papua prov
man Developmmore educated r) and eastern In
cture
are two of thquality and quan between the
ome sub distrized into two or
rnment to equool teachers (se
Internation
Index (HDI) oWest Nusa Ten78. The nation
vince has the lo
ment Index (HDregion tends tondonesia (red)
he most imporantity in theseWest and Eas
icts in North Sr three classes
ualize educatioee Figure 3). B
nal Education Stu
223
of Indonesian pnggara Provincnal average HDowest Human
DI) of Indoneso have larger H. Solid lines sh
rtant features nareas has becot of Indonesia.Sulawesi and Pbecause they d
on nationally By comparing
udies
provinces. Thece. The highestDI is 72.77. AmDevelopment
sian provinces HDI. There is ahow the estima
necessary to reome big issues. The first issuPapua, primardo not have en
can be seen ithe number o
e lowest value t value is of comong the provIndex
as a function oa gap between ated regression
each the goal s for the gover
ue is the availabry school studenough teachers
in the recent f teachers with
Vol. 8, No. 12;
is held by Papourse the specivinces of Indon
of their respectwestern Indon
n
of providing rnment as it tribility of teacheents from diffs.
distribution oh the populatio
2015
pua al
nesia,
tive nesia
good ies to ers in ferent
f the on of
www.ccsen
Indonesianto populatiwe find tha
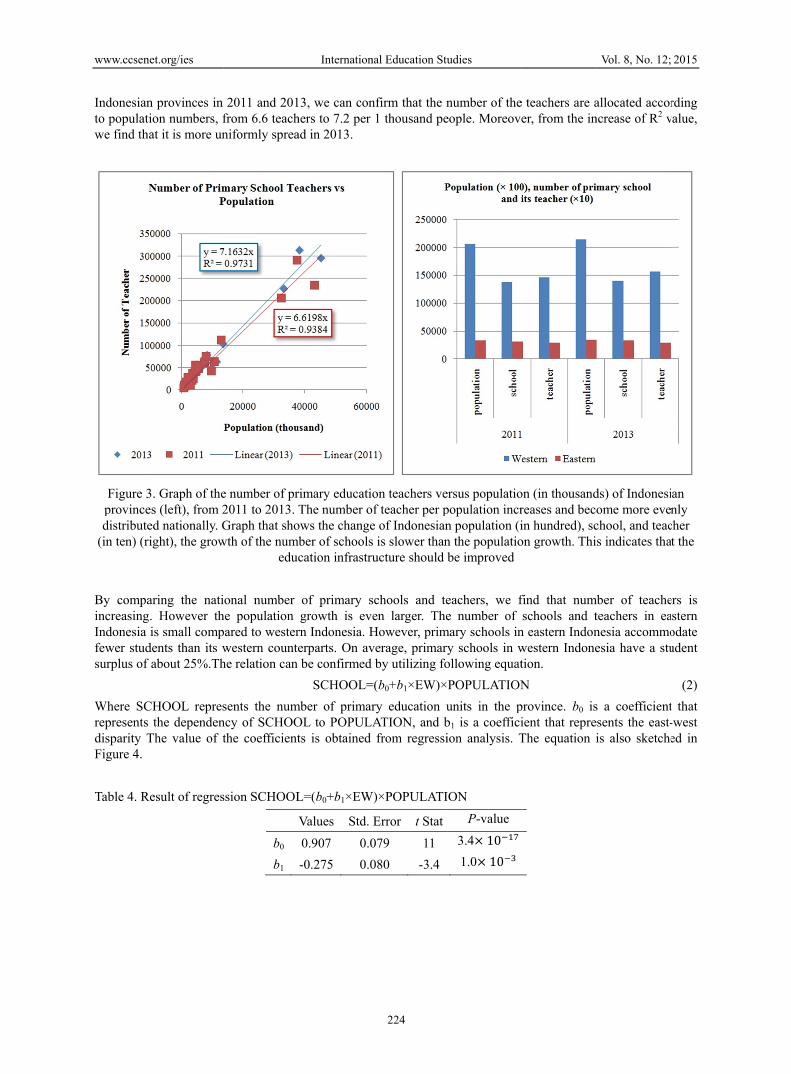
Figure 3provincedistribute
(in ten) (ri
By compaincreasingIndonesia fewer studsurplus of
Where SCrepresents disparity TFigure 4.
Table 4. R
net.org/ies
n provinces in ion numbers, fat it is more un
3. Graph of thees (left), from 2ed nationally. Gight), the grow
aring the nati. However this small comp
dents than its wabout 25%.Th
CHOOL represthe dependen
The value of t
Result of regres
2011 and 201from 6.6 teachniformly sprea
e number of pr2011 to 2013. Graph that sho
wth of the numeduc
ional number he population pared to westerwestern countehe relation can
sents the numncy of SCHOOthe coefficient
ssion SCHOOL
b0
b1
Internation
13, we can conhers to 7.2 per ad in 2013.
rimary educatioThe number o
ows the changember of schools
cation infrastru
of primary sgrowth is eve
rn Indonesia. Herparts. On avbe confirmed
SCHOOL=
mber of primarOL to POPULAts is obtained
L=(b0+b1×EW
Values Std.
0.907 0.0
-0.275 0.0
nal Education Stu
224
nfirm that the n1 thousand pe
on teachers vef teacher per pe of Indonesians is slower thanucture should
schools and teen larger. TheHowever, primverage, primary
by utilizing fo
=(b0+b1×EW)×
ry education uATION, and bfrom regressi
W)×POPULATI
Error t Stat
079 11
080 -3.4
udies
number of theeople. Moreove
ersus populatiopopulation incrn population (in the populatiobe improved
eachers, we fe number of
mary schools iny schools in wollowing equat
POPULATION
units in the pb1 is a coefficiion analysis. T
ION
P-value
3.4 101.0 10
e teachers are aer, from the in
on (in thousandreases and becin hundred), scon growth. Thi
find that numschools and t
n eastern Indonwestern Indonetion.
N
province. b0 isient that repreThe equation i
Vol. 8, No. 12;
allocated accorncrease of R2 v
ds) of Indonesiome more evechool, and teacs indicates tha
mber of teacheteachers in eanesia accommoesia have a stu
s a coefficientesents the east-is also sketche
2015
rding value,
ian nly
cher at the
ers is astern odate udent
(2)
t that -west ed in

www.ccsen
Figure
Aside fromnumber ofcoefficientincreased 0Teachers irecent dyn
Where TEdependentthat represandc2 repr
Table 5. R
From 2011and easternsurplus of in eastern influence t
net.org/ies
e 4. Graph of n
m the number f teachers. Byts. As shown i0.54 teachers pin eastern Ind
namics by follo
EACHER refert variable, YEAsents the ratio oesents the grow
Result of regres
1 to 2013, the nn Indonesia isabout 30%. TIndonesia is
the low attenda
number of schoaccommodate
of schools, ony evaluating tin Figure 5, thper 1000 popuonesia still se
owing model.
TEACHER
rs to the numbAR is a dummof TEACHERwth in 2 years.
ssion TEACHE
V
c0
c1
c2
number of teacs still remains. he smallness oworsened by
ance in school
Internation
ools versus pope a smaller pop
ne can evaluatthe following he result indicaulation. Howeverve fewer stu
= (c0+c1×EW
ber of primarymy parameter wR to POPULAT
. The coefficie
ER =(c0+c1×EW
Values Std.
8.6 0.
-2.0 0.
0.54 0.
cher increases On average, pof the number
low school al.
nal Education Stu
225
pulation (thouspulation than it
te the conditioequation wit
ates that natiover there is stiludents than the
W+c2×YEAR)
y education teawhich has valuTION,c1 is a coents can be eva
W+c2×YEAR)
Error t Stat
83 10
83 -2.4
27 2.0
by 0.54 per 10primary schooof people that
attendance. In
udies
sand): Primaryts western coun
n of educationth regression onally, the ratiol a gap betweeeir western co
× POPULATI
acher in each ue 1 for 2013 aoefficient that raluated using re
) ×POPULATI
P-value
4.2 101.9 105.0 10
000 people. Hol teachers in w
are accommo the next sect
y schools in eanterparts
n infrastructureanalysis, we o of primary sen eastern and ounterparts. W
ION
province, whiand 0 for 2011represents the egression anal
ION
owever, the gawestern Indonedated by primtion we discu
Vol. 8, No. 12;
stern Indonesi
e by looking acan determine
school teacherwestern provi
We can evaluat
ich is set to b1.c0 is a coeffieast-west displysis:
ap between weesia have a stu
mary education uss the factors
2015
a
at the e the s has nces. e the
(3)
e the icient arity,
estern udent units
s that

www.ccsen
Figure 5.
3. EducatiIn the prevseen in theeconomic estimate thdata availaanalyzing approach iRavallion between ed
Where NEwhich is egrowth ratinclude in and 0 for tof NER todisparity. IPOOR, GD
net.org/ies
Number of tea
ion and Sociovious section we net enrollmenconditions bethe relationshipability in a dethe data. Theis similar to thand Datt (199ducation and s
ER represents tequivalent to ete of the proviour analysis th
the eastern proo, POOR, GDPIn our modelsDPG and GINI
achers versus p
o Economy facwe discussed tnt rate (see Figtween western p, a vast amoueveloping counerefore, we dehe approach e
98). Moreover socio-economy
NE
NER
log(
the net school lementary schince, GINI is he variable EW
ovinces.d0, e0, fPG, and GINI , we set net enI.
Internation
population. TeaI
ctor the current congure 6). In this and eastern In
unt of time serintry is not in cided to empl
employed by Sby analyzing
y factors. The m
ER = d0 + (d1
R = e0 + (e1+
(NER) = f0 +
enrollment ratool. POOR is the gini index
W, which is a df0 are constantrespectively, a
nrollment ratio
nal Education Stu
226
achers in easteIndonesia
ndition of the rs section we dindonesia, and ies data over aour favor, we
loy panel dataSuryahadi (200it in such a w
model that we
1+d2×EW) ×
e2×EW)×log G
+ (f1+f2×EW)
tio of the peopthe poverty ra
x of the provindummy variabts, d1, e1, and fand d2, e2, ando (NER) as a d
udies
ern Indonesia s
regional gap iniscuss the relateducation enro
a sufficiently le have to resoa with provinc09), which its
way, we are abuse can be wr
POOR
GDPG
×GINI
le in a provincate in the provnce. Aside frole that gives a
f1 are coefficiend f2 are coefficdependent and
serve less peop
n Indonesia. Ttionship betweollment. In ordong period is
ort to some altces as units ofself was inspirble to determinritten in the fol
ce up to the SDvince, GDPG isom these three
value of 1 fornts that represe
cients that reprd set three inde
Vol. 8, No. 12;
ple than in wes
The gap can alseen the gap in sder to approprirequired. Sincternative meanf observation. red by the wone the regionallowing equati
D/MI/Paket A ls the regional variables, we
r western provent the dependresent the east-ependent varia
2015
stern
so be socio iately ce the ns of This
rk of l gap on:
(4)
(5)
(6)
level, GDP
e also inces
dency -west ables:

www.ccsen
Figure 6
As noticedseparate mthe separatgrowth) anis similar teconomic coefficient
Table 6. R
net.org/ies
. Net enrollme
d in our modemodels for sepately effects of nd the income to the treatmengrowth rates
ts d0, d1, d2, e0,
Result of regres
ent rate (NER)
els, we decidearate estimatio
f the poverty rainequality (m
nt of variables in separate m
, e1, e2, f0, f1, f2
ssion of socio-e
Vd0 d1 -
d2 0
e0 e1 e2 f0 2
f1 -
f2 0
Internation
of Indonesia pWest
ed to put eachons. Our argumate (POOR), reeasured by ginin Suryahadi,
models so thaf2 using regress
economy varia
Values Std. E97.6 1
-0.420 0.0
0.323 0.0
85.7 2
7.65 2.
5.7 1
2.026 0.0
-0.162 0.0
0.052 0.0
nal Education Stu
227
provinces. Eastern Indonesia
h of the three vment for this tregional economni index) on thet. al. (2009),
at those can bsion analysis. T
able’s coefficie
Error t Stat.3 77
084 -4.9
087 3.7
2.5 34
76 2.8
.6 3.6
039 52
097 -1.7
019 2.7
udies
stern Indonesia
variables (POreatment is thamic developm
he school enrolin which they
be evaluated sThe result can
ents
t P-value4.5 103.2 108.8 101.4 109.5 101.1 104.6 101.1 101.0 10
a generally has
OR, GDP groat we are inter
ments (measurellment ratio in
y put various mseparately. Webe seen in the
Vol. 8, No. 12;
s lower NER th
owth, and GINrested in evalued by regional n the province.measures of sece can estimatefollowing tabl
2015
han
NI) in uating
GDP This
ctoral e the le.

www.ccsenet.org/ies International Education Studies Vol. 8, No. 12; 2015
228
3.1 Poverty Rate
Based on the above table, we can see that all P-values are small, leading us to conclude that significant differences in the model exist between provinces in the east group and west group. The school enrollment ratios in the east group provinces are significantly lower than the ratios in the west group. However, since |d1|>|d1+d2|, the NER of the eastern provinces will increase significantly more than the eastern provinces. For the variable POOR, the negative sign of d1 indicates that the change of poverty ratios will increase the NER. When POOR grows by 1 point, NER of east Indonesia will drop 0.420 point, on the other hand, NER of west Indonesia will drop only 0.097. This result implies that the poverty rate has a rather huge influence on the rate of school enrollment, particularly in the eastern provinces. One thing that we can infer from this relationship is that the bigger the poverty rate in a province is, the harder it is for its families to afford school, thus lowering the enrollment rate. Poverty should be seen as a situation filled with various deprivations due to a lack of empowerment and command over resources.
3.2 GDP Growth
Next is the GDP growth. Although it is known that poorer provinces tend to have lower nominal regional GDP and higher growth rate on its regional GDP than its much wealthier neighbors, the positive sign of e1 suggests that the growth rate of regional GDP will increase NER. However, since |e1|<|e1+e2| GDP growth will influence the growth of NER in western provinces more than the eastern provinces. If GDPG doubles, the NER of east Indonesia will increase by 2.3 points while the NER of west Indonesia will increase by 4.0 point. Overall, we are able to conclude that there are disparity issues in both the education and socio-economic conditions between the provinces in the east group and the west group. It means that observing equality through income alone is extremely inadequate. Income information does not inform about the dynamics of life expenses and the feeling of financial security.
3.3 Gini Index
Lastly, the Gini index measures the degree of income inequality between the rich and the poor, in which a bigger amount means higher income inequality or a wider gap between the rich and the poor. The negative sign of the f1 in variable GINI leads us to conclude that the growth of income inequality will reduce the NER in the east group provinces less than that of the west group provinces. The relatively large P-value of f1 indicates that it is statistically less significant in influencing the rate of school enrollment. Even though the relationship is not significant, we found that there is a gap between western and eastern provinces. Since |f1|>|f1+f2|, the change of income equality will affect the NER of eastern provinces more than that of the western provinces. The increase of GINI by 1 point will decrease the NER of eastern Indonesia by 31%, on the other hand NER of western Indonesia will decrease by 22%. The fact that the growth of Gini index has a less significant influence on school enrollment than the others may also imply that having equality in economic terms, which in this case, can be represented by income equality i.e. low Gini index, does not necessarily mean the education level in that particular province will also be good. People may have equal income, but may also be equally poor, in which case good education will be hard to achieve. Thus, the income equality has no effect whatsoever in the school enrollment ratio.
4. Conclusion To conclude we review the current condition of Indonesian education in term of regional disparity among eastern and western provinces. We pointed out the importance of education to the eastern region of Indonesia. By including a dummy variable differentiate of the western/eastern province into the regression analysis, we were able to point out the apparent gap in Indonesia. Strictly speaking, in order to appropriately estimate the equations, a vast amount of time series data over a sufficiently long period is required. Unfortunately, the data availability in a developing country is not in our favor, therefore we have to resort to some alternative means of analyzing the data by employing a panel data with provinces as unit of observations. By evaluating the standard deviation of the statistic we were able to identify three factors that may reduce the gap. The most influencing factor was poverty rate, next is the regional gross domestic product growth, and the last was the income inequality which is represented by Gini index. To solve the inequality in Indonesia education nationally, it is important to reduce poverty, the major socio-economic issue in a developing country, because gross domestic product growth and the income inequality are more or less influenced by poverty. Poverty and education are intertwined issues beyond regional borders. Last but not least, people on the border of Papua province have the same right to education as the people in the capital city of Jakarta.

www.ccsenet.org/ies International Education Studies Vol. 8, No. 12; 2015
229
Acknowledgements Yuni Azzizah was supported by a Japanese Ministry of Education Culture, Sports, Science and Technology (MEXT) Scholarship Grant.
References Ananta, A., Arifin, E. N., Hasbullah, M. S., Handayani, N. B., & Pramono, A. (2013). Changing Ethnic
Composition in Indonesia: 2000-2010. XXVII IUSSP International Population Conference. International Union for the Scientific Study of Population.
Aritenang, A. F. (2008). A Study on Indonesia Regions Disparity: Post Decentralization. N-AERUS Workshop. Edinburg: University College London.
Bowden. (2012). Local identity, local languages, regional Malay, and the endangerment of local languages in eastern Indonesia. The Sixteenth International Symposium On Malay/Indonesian Linguistics. Kelaniya, Sri Lanka.
BPS Indonesia. (n.d.). Human Development Index (HDI) by Province and National, 1996-2012. Retrieved August 7, 2014, from http://www.bps.go.id/eng/tab_sub/view.php?kat=1&tabel=1&daftar=1&id_subyek= 26& notab=2
Datt, G., & Ravallion, M. (1998). Why Have Some Indian States Done Better than Others at Reducing Rural Poverty? Economica, 65, 17-38. http://dx.doi.org/10.1111/1468-0335.00112
Embassy of Indonesia. (2008). About Indonesia: Basic fact. Retrieved October 6, 2013, from http://www.embassyofindonesia.org/about/basicfacts.htm
Garcia, J. G., & Soelistianingsih, L. (1998). Why Do Differences in Provincial Incomes Persists in Indonesia? Bulletin of Indonesian Economic Studies, 34(1). http://dx.doi.org/10.1080/00074919812331337290
Handayani, I. P. (2012, February 13). Beyond statistics of poverty. The Jakarta Post .
Legge, J. (1990). Review: Indonesia’s Diversity Revisited. Indonesia, 49, 127-131. http://dx.doi.org/10.2307/3351057
Mulyana, D. (2012). Cultures and Communication: An Indonesian Scholar’s Perspective. Bandung: PT. Remaja Rosdakarya.
Quinn, G. (2001). The Learner’s Dictionary of Today’s Indonesian. Sydney: Allen & Unwin.
Riza, H. (2008). Resources Report on Languages of Indonesia. The 6th Workshop on Asian Language Resources.
Samosir, M. (2008). The Effects of Decentralization on Education in Indonesia: Education for All? (Master thesis, Maastrich University).
Setyawati, R. (2013). Bahasa Indonesia sebagai Jati Diri Bangsa Indonesia. Retrieved from http://publikasiilmiah.ums.ac.id/handle/123456789/3483
Suryadarma, D., Widyanti, W., Suryahadi, A., & Sumarto, S. (2006, May). From Access to Income: Regional and Ethnic Inequality in Indonesia. SMERU Working Paper.
Suryadharma, D., Artha, D., Suryahadi, A., & Sumarto, S. (2005, January). A Reassessment of Inequality and Its Role in Poverty Reduction in Indonesia. SMERU Working Paper.
Suryahadi, A., Suryadarma, D., & Sumarto, S. (2009). The Effects of Location and Sectoral Components of Economic Growth on Poverty: Evidence from Indonesia. Journal of Development Economics, 89, 109-117. http://dx.doi.org/10.1016/j.jdeveco.2008.08.003
UNICEF. (2013). Indonesia Laporan Tahunan 2012. Retrieved June 28, 2015, from http://unicef.org/indonesia/id/UNICEF_Annual_Report_(Ind)_130731.pdf
United Nations, Scientific and Cultural Organization. (n.d.). Three Terms and One Goal. Retrieved August 7, 2014, from http://www.unesco.org/new/en/education/themes/leading-the-international-agenda/education-for -sustainable-development/three-terms-one-goal

www.ccsenet.org/ies International Education Studies Vol. 8, No. 12; 2015
230
Copyrights Copyright for this article is retained by the author(s), with first publication rights granted to the journal.
This is an open-access article distributed under the terms and conditions of the Creative Commons Attribution license (http://creativecommons.org/licenses/by/3.0/).