Embed Size (px)
Citation preview
53
CHAPTER 2
Review of Literature
2.1 Introduction
In this Chapter, the researcher has made an attempt to study and understand the
complex concepts of Customer Satisfaction. This attempt includes, understanding the
basic concepts of Customer satisfaction, analysing research studies made by earlier
researchers in respect of Customer Satisfaction in Cellular Phone Industry, various
Customer Satisfaction Models and various Methods of Measurement of Customer
Satisfaction. For this, the researcher has used various books, research Journals and
websites. The detailed list is further elaborated in the Bibliography. Through this
Literature Survey researcher wants to find out which are the important parameters of
Customer Satisfaction in respect of Cellular Phone Subscribers in Pune City.
Pune presently is one of the most modern cities of Maharashtra. It is the Head Quarter
of the Indian Army's Southern Command, Air base for Indian Air Force, and a Military
Cantonment. It is the home of Gopal Krishna Gokhale, Maharshi Dhondo Keshav
Karve, Wrangler P.R. Paranjape, and Mahatma Jyotiba Phule. The University of Pune
offers courses in languages, basic sciences, social sciences, law, and management.
Pune is thus a city of political leaders, reformers, educationists, revolutionaries, and
scientists.
2.2 Customer Satisfaction
Last few decades have witnessed dramatic changes in market environment
characterized by unprecedented levels of diversity, knowledge richness and turbulence.
The turbulence in environment has created by macro environmental changes, namely,
technological advances and globalization. The technological changes have made the
traditional economic concept of scale, scope and structure irrelevant in the new
economy removing the time and place barriers of doing business. Technological
advances combined with forces of globalization have resulted in the transformation of
the economy, industries, markets and customers, resulting in a connected knowledge
economy, borderless global economy, globalizing, converging and consolidating
54
industries, fragmenting and frictionless markets and active, connected, informed and
demanding customers.[1] Organizations’ attempts to adapt to these changing
environmental realities have effected changes in the focus, emphasis and scope of
marketing. Today’s customers demand choice and convenience. Customers mix and
match according to their needs for product or service. Customer “satisfaction presents a
versatile cross-channel metric to gauge the service provider’s strengths and weaknesses
from the customer’s point of view. The concept of customer satisfaction occupies a
central position in marketing thought and practice.
Satisfaction is a major outcome of marketing activity and service to link processes
culminating in purchase and consumption with post purchase phenomenon such as
attitudinal change, repeat purchase and brand loyalty. It is a feeling, which a customer
gets from a process of evaluating what was received against that expected, the purchase
decision itself and the fulfilment of needs and want. The key to customer satisfaction
lies in meeting these expectations.
Expectations are created in the customer mind from a variety of causes and reasons like
past- experience, promotional claims, word of mouth and third party information.
Kotler[2] also noted that satisfaction is a function of perceived performance and
expectations that identifies feelings of a person resulting from comparing a products
perceived performance in relation to his/her expectations.
Customer satisfaction is multi-dimensional in nature and lies with multiple experiences
with the service provider.
Customer satisfaction is a business term, which is used to capture the idea of measuring
how, satisfied an enterprise customers are with the organizations efforts. During the
past decades, customer satisfaction has emerged as a strategic imperative for most
firms. In the 1980’s, achieving a higher satisfaction became a goal in itself. During the
1990’s, there was a widespread realization that satisfaction is a strategic goal for all
organization involved in the delivery of customer service. Satisfied customers usually
return and buy more, they tell people about their experiences, and they may well pay a
premium for the privilege of using service product of the organization.
______________________________________________________________________ [1] Thomas and Gupta, Marketing Theory & Practice: Evolving through turbulent times, Global Business Review, 2005, Vol.6,
Issue 1
[2] Kotler, Philip, Marketing Management, 12e, 12th Edition, Pearson Education, New Delhi, 2006, p 136-137
55
Since satisfaction drives behaviour, a more thorough understanding of what drives
customer satisfaction will give service providers the insights they need to influence
customer behaviour in the short-term and long-term. The centrality of the concept is
reflected by its inclusion in the marketing concept that high customer satisfaction
ratings are widely believed to be the best indicator of a company’s future profit[3].
Because, satisfied customers are more willing to pay for the benefits they receive and
are more likely to be tolerant of increases in price. This implies high margins and
customer loyalty. Otherwise, it will lead to customer turn over, high replacement costs
and high customer acquisition costs[4]. This is a means to strategic ends such as
customer retention that directly affect profits.
Customer satisfaction is generally described as a judgment that a customer develops
after the act of purchase of a product/service. The determinant to customer satisfaction
includes product quality, product packaging, keeping delivery commitments, price and
responsiveness and ability to resolve complaints and overall communication,
accessibility and attitude. Most firms realize that the more competitive the market, the
more important the level of customer satisfaction. In this context it is very important to
provide-customers with outstanding value, i.e. quality, service and price to achieve
sustained customer satisfaction and loyalty.
Improving quality and customer satisfaction reduces costs associated with defective
services such as warranty costs, field service, and reworking and handling or managing
complaints. Word-of-mouth from satisfied customers lowers the cost of attracting new
customers and enhances the firm’s overall reputation, while that of dissatisfied
customers are naturally has the opposite effect.
The constantly changing environment forces enterprises to identify new opportunity for
claiming competitive advantages and to adapt these intense and environmental factors
become more hostile; the concern for service quality grows. Quality has been
considered to be one of the management’s topmost competitive priorities and a
prerequisite for sustenance and growth of firms. The quest for quality improvement has
become a highly desired objective in today’s intense competitive market.
______________________________________________________________________ [3] Anderson et al. Customer Satisfaction, Productivity and Profitability: Difference between Goods and services, Marketing
Sciences, 1997, 16, 2, p 129-145. [4] Anderson et al., Customer Satisfaction, Market Share and Profitability: Findings from Sweden, Journal of Marketing, 1994, 58,
p 53-66
56
Though service quality and customer satisfaction is conceptually different, but there
exists a high relationship between them. The perceived service quality is an antecedent
to satisfaction and leads to customer satisfaction. Firms that are clearly interested in
providing outstanding customer value would be expected to have culture that reinforces
high quality. A high quality service can level the customer’s perception and exception
towards an offering. Quality has to satisfy, and preferably exceed, the needs and
expectations of the customers. That is why; service quality is widely seen as a key
antecedent to successful customer relationships. A service offer, which is inferior or
indistinct, may lead to greater problems in attracting and retaining satisfied
customers.[5]
In recent years, customer satisfaction has grown much more important to business
firms. of all types because of increased customer requirements, new technological
possibilities and the ongoing globalization mean that a focus on quality improvements
are necessary for all organizations, who want to strengthen their competitiveness on the
world market. Keeping this fact in the mind, all firms are paying greater attention to
service quality and customer satisfaction in this increased competitive and deregulated
market.
2.3 Analytical study of performance of Telecom industry (Market Dynamics)
The world is rapidly moving toward an economic system based on the continuous and
ubiquitous availability of information. Recent development in telecommunications
technology has been an important vehicle in permitting information exchange to
develop as a valuable commodity. With the use of telephone, productivity has
increased in all industries. As compared to other infrastructure investments,
Investments in telecommunication has increased the demand for the goods and services
used in production and increased in national output. Such investment has increased
employment through both direct and indirect effects stated by Alleman et al (20O2)[6].
______________________________________________________________________ [5] Ennew et el, The impact of Service quality and Service characteristics on customer Retention: Small Business and their Banks
in the UK, British Journal of Management, 1996, Vol. 7, p219-230. [6] Alleman, Telecommunications and Economic development: Empirical evidence from South Africa, international
Communication Society, Sydney, 2002, Retrieved from www.colorado.edu/ engineering/alleman/print files/soafrica paper. PDF
57
Hardy (1980)[7] found the impact of telecommunication on growth taking 45 countries
data into consideration. It was found that telecommunication has largest effect in the
least developed countries and the smallest effect in the developed countries.
Shridhar & Sridhar (2004)[8] observed that telecommunication infrastructure
development and economic growth proceed together taking 68 countries data in the
study for analysis. It was found that a significant impact of cellular Services on
national output. The impact of telecom penetration on total output is significantly lower
for developing countries.
Maximum time telephones were used for economic purposes such as finding out
employment opportunities, price of a product, land transactions, remittances and other
business opportunities. The average prices of the agricultural commodities were higher
in villages with phones than without phones found by Bayes et al (1999)[9].
Telecommunications can create market through information dissemination to local
people and improve the standard of living leading -to growth has stated by Eggleston et
al (2002)[10].
Fink et al (2003)[11] analyses the impact of policy reform in telecommunication for 86
developing countries over the period from 1985 to 1999. The study concludes that both
privatization and competition leads to significant improvements in performance. Due to
the reform process, the level of productivity has increased compared to years of partial
and no reform.
It was noted by the researchers that to become at par with developed countries,
developing countries where telephone penetration rates are extremely low has meant
investment in wireless and cellular mobile systems.
______________________________________________________________________ [7] Hardy, Andrew, The role of the telephone in economic development, Telecommunications Policy, 1980, Vol.4, Issue 4, pp 278-
286 [8] Srldhar, S.K; Sridhar, V, Telecommunications and Growth- Causal Model, Quantitative and Qualitative Evidence, Economic
and Political Weekly, June 2006 [9] Bayes, Abdul; Braun, J.V; Akhter. R, Village pay phone and poverty reduction: Insights from a Grameen Bank initiative in
Bangladesh, 1999, Center for Development Research (AEF), Universitat Bonn, Bonn, Germany, Discussion Papers on development policy no.8, Retrieved from www.zef.de/p 1999.0.html
[10] Eggleston, KR, Jensen & R. Zeckhauser, Information Technology, Markets and Economic Development, Department of Economics, 2002, Working Paper, Tuffs University, Retrieved from www.ase.tuffs.edu/ecore/research/documents/2002/ papers03.pdf
[11] Fink, Carsten; Mattoo, Aaditya; Rathindran, Randeep, An Assessment of telecommunications reform in developing countries, information Economics & Policy, December 2003, Vol. 15, Issue 4, p 443
58
For developing countries, cellular services are becoming a very significant proportion
of the overall telecom infrastructure. The reason for growth of cellular services in
developing countries is due to technology availability, low line cost and cellular mobile
systems.
The economic conditions, market structure, policies regarding tariffs and interconnect
agreements and customer/customer characteristics are significant forces affecting the
growth of cellular service. R. C. Natarajan (2OO6)[12] stated that the regulated
monopoly enjoyed by the department of telecommunications has entered the stage of
deregulated market e competition. Cellular service providers are attracted towards
Indian market due to low tele-density demand from middle class and the rapid change
in customer behavior towards this sector.
Advanced Technology and globalization are the two major influential elements that
forces change in the market function and firms relate to customers. Globalization has
powerful influence on the homogenization of different markets. This has changed
customer choice and permanently altered the competitive landscape of business across
the globe. JeffI Thomas and Rajen K. Gupta (2OO5)[13] attempted to identify that
organizations adapt to those changing environmental realities that changes in value
distribution to value creation, customer acquisition to customer retention and
immediate customer to value chain of marketing. The shifts are from a goods-cantered
view to service cantered view and co-creating valued customer experience.
Prahlad and Ramaswamy (2000)[14] have rightly states that consumers/customers are
changing the dynamics of the marketplace. The market has become a forum in which
customers play an active role in creating and competing for value. Customers are
becoming a new source of competence for the corporation. The competence that
customers bring is a function of the knowledge, skills and their willingness to learn and
experiment and ability to engage in an active dialogue.
______________________________________________________________________ [12] Natarajan, R C, Perception of Mobile Telephone among Youth: An Exploratory Study among the students of Manipal, The
ICFAI Journal of Management, April 2006, vol.5, Issue 4, p 7 [13] Thomas, Joffi; Gupta Rajen K, Marketing Theory and Practice: Evolving through Turbulent times, Global Business Review,
2005, vol. 6, Issue 1, pp 95-112 [14] Prahlad, C.K; Ramaswamy, Venkaitram, Co-opting Customer competence, Harvard Business Review, January/ February
2000, Vol. 78, Issue 1, pp 79-87
59
[16] Pakola J; Pietila, M; Svento. R, An investigation of Customer Behaviour in Mobile Phone Markets in Finland, 2003, proceedings of 32nd EMAC. Conference, Track: New technologies and E-marketing, accessed on September 2007. Retrieved from
From the above literature review, it is seen that telecommunications have grown faster
than the economy as a whole during the period. The previous studies presented an
analytical framework for analysing the market dynamics of telecom industry including
mobile telephony. It has helped the researcher to understand the importance of
operating environment and various external forces that governs the growth of industry.
2.4 Analysis of Customer’s purchasing motives of Telecom Services
Common sense suggests that increase in purchasing power also increases demand for
Service. Chatterjee et al (1998)[15] pointed out that income patterns decide the purchase
power for telecommunication Services and in turn the growth of services.
Pakola et al. (2003)[16] surveyed 397 Finnish customer-purchasing motives on one hand
and factors affecting operator choice on the other and the result indicates that
audibility; price and other related factors are regarded as the most- important in the
choice of the mobile phone service provider.
Kesti and Ristola (20O3)[17] investigates customer intentions to use different mobile
services. The services were divided into three groups such as personal communication,
guidance service and mobile advertisements. The group of personal communication
differed from the other two groups in a way that the users could not test all these
services in the field trials. The main findings of the study indicated that the perceptions
users got from testing mobile services in the future. The test users regarded the
guidance services such as to know the location of stores, public services, product
search etc., as the most important, followed by mobile ads and communication
services.
______________________________________________________________________ [15] Chatterjee, S; Thachenkary, C.S; Katz, J.L, Modeling the Economic Impacts, of Broadband Residential Services, Computer
Networks and ISDN Systems, 1998, Vol. 30, No. 14, pp 1295-1310
www.oasis.oulu,fi/publications/emac03-jp.pdf [17] Kesti, M: Ristola, A Tracking customer Intention to use Mobile Services: Empirical Evidence from a Field Trial in Finland,
2003, accessed on September 2007, Retrieved from www.rotuaari.net
60
Firms has to differentiate their offer that of competitor by providing something unique
that is valuable to the buyer to influence them to choose the product over others.
Krishna and Shylajan (2007)[18] stated that brand awareness and brand visibility plays
an important role along with product features. It is concluded that for most of the
products, brand awareness is a significant determinant for buying behaviour.
Kennedy & Schneider (2000)[19] states, that in the changing economy, knowledge is as
important as product / Service which is becoming globally standardized. Companies
gain competitive advantage through constant innovation; better targeting customers and
additional service. Customer satisfaction has been an important aspect for every
organization due to constant innovation in components or service.
The studies have shown that cellular phone usage has permeated across various
economic classes as well as professional categories. Customer buying behaviour and
purchasing power is changing· due to fierce competition. It has helped researcher to
understand the need for a greater understanding of behaviour, which is more
demanding in nature.
2.5 What’s Customer Satisfaction?
Customer buying behaviour is important to be studied by the cellular mobile service
providers because customer satisfaction determines the market share for the
organization. Oliver (1997)[20] has given a famous comment stating, "Every one knows
what satisfaction is, until asked to give a definition. Then, it seems, nobody knows."
Oliver (1999)[21] defined, "Satisfaction as pleasurable fulfilment. Satisfaction is the
customer’s sense that consumption provides outcomes against a standard of pleasure
versus displeasure.
_________________________________________________________________________________________________________
[18] Radha Krishna, G; Shylaian, C.S, Determinants of Habitual Buying Behaviour: A study of Branded Apparels, The lCFAl Journal of Marketing Management, August 2007, Vol. 6, No. 3, pp 6- 21
[19] McColl-Kennedy, J; Schneider, U, Measuring customer satisfaction: why, what and how, Total Quality Management, 2000, Vol. 11, No. 7, pp 883-896
[20] Oliver, Richard L; Kumar Anand, Cognitive Appraisals, Customer Emotions, and Customer Response, Advances in Customer Research, 1997, Vol. 24, Issue 1, pp 17-18
[21] Oliver, Richard L, Whence Customer Loyalty, Journal of Marketing, Special Issue 1999, Vol. 63, pp 33-44
61
It is judgment that a product or service feature, or the product or service itself, provides
a pleasurable level of consumption related fulfilment." Furse et al (1994)[22] refers,
"Satisfaction as the measurement of one or more variety of customer opinions
including ratings of service quality, ‘future behavioural intentions, customer’s self
assessment of outcome and satisfaction?
Boulding et al (1993)[23] stated another perspective of customer satisfaction, which
deals with the difference between transaction specific and cumulative customer
satisfaction. Customer satisfaction is viewed as a post-purchase evaluative judgment of
a specific purchase occasion according to transaction-specific perspective. Cumulative
customer satisfaction is an overall evaluation based on the total purchase and
consumption experience with goods or service over tome. Cumulative satisfaction is a
more fundamental indicator of the firm’s past, current and future performance and its
cumulative satisfaction that motivates a firm’s investment in customer satisfaction.
Kotler and Armstrong (1993)[24] stated that consumer/customer satisfaction is
determined by the relationship between the customer’s expectations and product’s
perceived performance.
Customer satisfaction is important because a company earns sales from new customers
and retained customers. Satisfied customers buy a product again, talk favourably to
others about the product, pay less attention to competing brands and advertising.
Bitner et al (1996)[25] defined, satisfaction is the customers evaluation of a product or
service in terms of whether that product or service has met their needs and
expectations.
_________________________________________________________________________________________________________
[22] Furse, David H, Burcham, Michael R; Rose, Robin L; Oliver, Richard W, Leveraging the Value of Customer Satisfaction Information Marketplace Insights, Fall 1994, Vol. 14, NO. 3,
[23] Boulding, William; Karla, Ajay; Staelin, R; Zeithaml, V.A, A Dynamic Model of Service Quality; From Expectations to Behavioural intentions, Journal of Marketing Research, 1993, Vol. 30, pp 7-27
[24] Koller, Philip; Armstrong, Gary, Principles of Marketing; 8th Edition, 1993 Prentice-HalI of India Private Limited, New Delhi [25] Bitner, M.J; Faranda, W.T; Hubbert, AR; Zeithaml, V.A, Quality & Productivity in Service Experiences: The Customer Role,
Quality in Services (QUIS), 5th international Conference, 1996, pp 289-298
62
Fe and Ikova (2004)[26] added that the perception of the word "satisfaction" influences
the activities, which a customer conduct to achieve it. Researchers have also identified
customer satisfaction as a multi dimensional in nature and viewed overall satisfaction
as a function of satisfaction with multiple experiences with the service provider. Giese
& Cote (2000)[27] studied various literatures and indicated that customer satisfaction is
a response (emotional or cognitive), the response pertains to a particular focus
(expectations, product, consumption experience, etc) and the response occurs at a
particular time (after consumption, after choice, based on accumulated experience, etc).
2.6 Various studies in Customer Satisfaction
Firms must appropriately modify these components of customer satisfaction to develop
a context-specific definition that should give to measure satisfaction. This
measurement process will lead to understand customer more closely and to make better
managerial decision.
Halstead, Hartman and Shmidt (1994)[28] found that customer satisfaction is a
transaction-specific affective response resulting from the customer’s comparison of
product performance to some pre-purchase standard.
Webbrook and Oliver (1991)[29] described customer satisfaction is a post choice
evaluative judgment concerning a specific purchase selection.
Oliver (1987)[30] examined whether satisfaction was an emotion and concluded that
satisfaction is a summary attribute phenomenon coexisting with other consumption
emotions.
______________________________________________________________________ [26] Fe, I; lkova, C, An Index method for measuring of customer satisfaction, The Total Quality Management, 2004, Vol. 16, Issue
1, pp 57-66 [27] Giese, Joan L; Cote, Joseph A, Defining Customer Satisfaction, Academy bf Marketing Science Review, 2002, Vol. 2000,
Issue1, Available on www.amsreview.org/articles/giese01-2000-pdf, [28] Halstead, D; Hartman, D; & Schmidt, S, L, Multisource Effects on the Satisfaction Formation Process. Journal of the
Academy of Marketing Science, 1994, Vol. 22, Issue 2, pp 114-129 [29] Westbrook, R.A; Oliver, R.L, The Dimensionality of Consumption Emotion Patterns and Customer Satisfaction, Journal of
Customer Research, 1991, Vol. 18, pp 84-91 [30] Oliver, Richard L, An investigation of the interrelationship between customer (Dis) satisfaction and complaint Reports,
1987,_Vol. 14, issue 1, pp 218-222
63
Tse and Wilton (1998)[31] stated customer satisfaction as the customer’s response to the
evaluation of the perceived discrepancy between prior expectations (or some norm of
performance) and the actual performance of the product as perceived after its
consumption.
Mano and Oliver (1993)[32] examined the three aspects of the post consumption
experience- product evaluation, product elicited affect and product satisfaction. Product
satisfaction is best characterized as an attitude-like post consumption evaluative
judgment (Hunt, 1977) with the evaluative aspect of that judgment varying along the
hedonic continuum (Oliver 1989; Westbrook and Oliver 1991)
Kumar and Oliver (1997)[33] indicated that satisfaction was associated with customers
expectations being met, feeling they got "fair" value and feeling contented.
Oliver (1987)[34] defined customer satisfaction as an outcome of a purchase/ usage
experience would appear to be an important variable in the chain of purchase
experience linking product selection with other post purchase phenomena including
favourable word-of-mouth and customer loyalty.
Cadotte et al (1987)[35] conceptualized customer satisfaction is la widely accepted as a view of the process by which customers develops feeling from an evaluation of the use experience.
Cote, Foxman and Bob (1989)[36] suggest that satisfaction is determined at the time the
evaluation occurs. In some cases, satisfaction assessment may be a naturally occurring,
internal response such as after consumption, or prior to repurchase. In some case of the
assessment of satisfaction may be externally driven.
Kotler has explained the concept of value and satisfaction as stated by Gita Parimal
(20O6)[37].
______________________________________________________________________ [31] Tse, David K; Wilton, Peter C, Models of Customer Satisfaction Formation: An extension, Journal of Marketing Research,
May 1988, Vol. 25, pp 204-212 [32] Mano, Hain; Oliver, Richard L, Assessing the Dimensionality and Structure of the Consumption Experience: Evaluations
Feeling, and Satisfaction, Journal of Customer Research, 1993, Vol. 20, pp 451-466 [33] Kumar Anand; Oliver, Richard L, Cognitive Appraisals, Customer Emotions, and Customer Response, Advances in Customer
Research, 1997, Vol. 24, Issue 1, pp 17-18 [34] Oliver, Richard L, An investigation of the interrelationship between customer (Dis) satisfaction and complaint Reports, 1987,
Vol. 14, Issue 1, pp 218-222 [35] Cadotte, Ernest R; Woodruff, Robert B; Jenkins, Roger L, Expectations and Norms in Models of Customer Satisfaction,
Journal of Marketing Research, August 1987, Vol. 24, ISSUE 3. DP ` 305—314 [36] Cote, Joseph; Foxman, Ellen R; Bob D, Selecting an Appropriate standard of Comparison for post-purchase Evaluation,
Advances in Customer Research, 1989, Vol. 16, issue 1, pp 502 506 [37] Parlmal, Gita, Philip Kotlen-the future is already here, The Smart Manager, 2006, val. 5, Issue 5, p 46
64
It has been stated that customers, when faced with a variety of products, make their
choice based on perceived value to themselves, not to the marketing company. Value
thus depends on how well the offering-be it a product or service or other good- will
satisfy a need, want or demand, regardless of what the selling party perceives value to
be. Satisfaction, then, is the extent to which actual value realized by the purchase or
acquisition of the product matches the pre-purchase assessment of value. If actual value
is equal to or greater than perceived value, satisfaction will result, if not, then
dissatisfaction will result.
Kristensen et al. (1999)[38] states customer/customer satisfaction is an evaluative
response of the product purchase and consumption experience resulting from a
comparison of what was expected and what is received. The overall conclusion from
his study is that expectations influence customer satisfaction and the effect can be
positive, negative or non-existent.
The review of this literature indicates definition of customer satisfaction. Customer
satisfaction is very important in the light of the fact that customers are the primary
source of most firms’ revenue. It is understood from the above literatures that customer
satisfaction is determined by a cognitive process of comparing what customers receive
against what they pay for getting the service.
2.7 Customer Satisfaction studies in Telecom Industry
Customer satisfaction is a multidimensional nature and viewed overall satisfaction as a
function of satisfaction with multiple experiences with the service provider. Munnukka
(2005)[39] discovered that price sensitivity is one of the key factors affecting
companies pricing choices. Yet in mobile services sector business, practitioners are
facing problems in pricing decisions as they are short of knowledge on their customers'
price sensitivity levels and dynamics.
________________________________________________________________ [38] Kristensen, Kai; Martensen, Anne; Grenholdt, Lars, Measuring the impact of Buying Behaviour on customer satisfaction,
Total quality Management, July 1999, Vol, 10, Issue 4/5, p 602 [39] Munnukka, Juha, Dynamics of Price Sensitivity among mobile service customers, Journal of Product & Brand Management,
2005, Vol. 14, Issue 1, pp 65-73
65
Mobile service customers differ significantly in their price sensitivity levels; customers
with moderate usage of mobile services are least price sensitive, while intensive and
low-end users are most sensitive to price changes. Important was also the notion that
customer' price perceptions and innovativeness levels were accurate indicators of their
price sensitivity.
Customer satisfaction and customer service has been critical factors of the cellular
industry (Assaari & Karia, 2OOO)[40]. Cellular service providers need to ensure about
the technology that provides customer service best in the industry. It is stated that
investment in people and in technology helps in providing best customer service for
today and for the future. One common ground that most carriers and customers agree
on is that good customer service can have a key impact on how a customer views
firm’s services and company.
Goodman et al (1995)[41] examined the relationships among levels of involvement
between customers and suppliers, customers evaluations of core and peripheral factors
in their transactions and customers and overall those less involved. Peripheral aspects,
such as supplier responsiveness to customer inquiries, appeared to influence how
customers evaluated a core product as well as their overall satisfaction.
Pakola et al (2003)[42] surveyed and results indicated that price and properties were the
major influential factors affecting the purchase of a new mobile phone, where as
audibility, price and friends were regarded as the most important in choice of the
mobile phone operators. Customers have certain amount of self-knowledge i.e.
telephone features, connection fee, access cost, mobile-to-mobile phone rates, call rates
and free calls which are related to mobile phone purchasing respondents had to
important rate while choosing a mobile phone service. Many researchers found that
customers with prior experience about a product could be able predict their choices
relatively well but tend to overestimate the importance of a monthly access fee, mobile-
to-mobile g rates and connection fees.
______________________________________________________________________ [40] Assaari, Muhammad Hasmi; Karia, Noorliza, Churn Management towards Customer Satisfaction; A Case of Cellular
operations in Malaysia, A paper presented at International Conference on E-Commerce (ETEC 2000): Emerging Trends in E-Commerce, Kuala Lumpur, pp21-23
[41] Goodman, Paul S; Fichman, Mark; Lench, F Javer, Snyder, Pamela R, Customer Firm Relationships, Involvement, And Customer Satisfaction, Academy of Management Journal, 1995, Vol.38, Issue 5, pp 1310-1324
[42] Pakola J; Pietila, M; Svento, R, An investigation of Customer Behaviour in Mobile Phone Markets in Finland, 2003, proceedings of 32nd EMAC Conference, Track: New technologies and E-marketing, accessed on September 2007, Retrieved from www.oasis.oulu.fi/publications/emac03-jp.pdf
66
Ka-Shing Woo & Henry (1999)[43] studied the determinants of satisfaction among mobile phone users. Based on the results of an exploratory factor analysis of 20 attributes, four determinants in order of importance were envisaged:
• Transmission quality and network coverage
• Pricing Policy
• Staff competence
• Customer/Customer service
The result suggested that network providers should focus more on transmission quality
and network coverage as the core attributes of their service offering and formulate
appropriate pricing policy, rather than competing or, customer service and other
supplementary services. Palkar (2004)[44] studied the relationship between the service
quality, customer satisfaction and payment equity for the services provided by cellular
mobile service providers. He argues that there are five factors such as service qualify,
usage pattern, billing and service support determines customer satisfaction. He also
argues that customer satisfaction influences on payment equity i.e. customers’
perceived fairness of the price paid for the firms products and services.
High customer satisfaction leads several benefits to the firm has stated Fornell
(1992)[45]. These benefits include current customer’s loyalty, insulation of customers
from competitive efforts, future transactions, low failure cost, low cost in creating new
customers and an enhanced goodwill for the firm. Customer satisfaction has direct
impact on the primary source of future revenue streams for most companies.
_________________________________________________________________________________________________________
[43] Ka-Shing Woo; Fock, Henry K.Y, Customer Satisfaction in the Hong Kong Mobile Phone Industry, Service Industries Journal, July 1999, Vol. 19, issue 3, pp 162-174
[44] Palkar, Dr. Apoorva, Determinants of Customer Satisfaction for Cellular Service Providers, Udyog Pragati, January-March 2004, \/ol.28, issue 1, pp 1-10
[45] Fornell, Claes, A National Customer Satisfaction Barometer: The Swedish Experience, Journal of Marketing, January 1992, Vol. 56, pp 6-21
67
Customer satisfaction is a concern for any businesses throughout the world. Raja,
Sharma and Shashikala (2006)[46] discussed customer/customer satisfaction in the
context of perceived values of the mobile commerce, service attribute’s, product
quality, service support, product distribution, service personnel, information about the
service and corporate brand equity are the underlying factors of customer satisfaction.
Business transactions involve trust, investment, social bond and structural bonds that
hold the parties together in a relationship. The overall satisfaction with the relationship
may not be high but so long as the product performance satisfaction is high the
customer may be retained. Soni, Wilson and Keeffee (1996)[47] argued that being
committed to the partner in a buying-selling relationship is an important predictor of
retention. Customer satisfaction has the largest impact on commitment.
Trust facilitates the development of the transaction specific investments in both assets
and knowledge that creates the structural bonds that hold the relationship together.
Bhave (2002)[48] studied the link between customer satisfaction and customer retention.
Customer’s perception towards service and quality of a product determines the success
of that product or service in the market. With better understanding of customers’
perceptions, firm can determine the suitable actions to meet the needs of customers.
Firm’s can identify their own strengths and weaknesses in comparison to their
competitors. Major attributes that influence customer satisfaction are product quality,
packaging, delivery commitments, price, responsiveness and ability to resolve
complaints and overall communication, accessibility and attitude failing short creates
dissatisfaction. Customer loyalty is an important strategic objective for all organization.
Bruce Cooli et al (2O07)[49] investigated the relationships between customer
satisfaction and loyalty in various contexts taking Canadian Banking industry into
consideration. They found that customer satisfaction changes on changes in the share
of benefits provided to customers and effect of customer age, income, education,
expertise and length of relationship. _________________________________________________________________________________________________________
[46] Raja, KC; Sharma, Uma; Shashikala, R, Measuring Customer Satisfaction among Mobile · Handset End Users: An Empirical Stsudy, The Icfain Journal of Management Research, 2006, Vol. 5, issue 2, pp 31-39
[47] Soni, Praveen K; Wilson, David T; O’Keeffe, Michael, Beyond Customer Satisfaction: Customer Commitment, Institute for the Study of Business Markets Report 234996, 1996, retrieved from, www.smeal.psu.edu/isbm/database/documents/wp96/23-1996.pdf.
[48] Bhave, Ashish, Customer Satisfaction Measurement, Quality & Productive Journal, February 2002, retrieved from www.symphonytech.com
[49] Cooli, Bruce; Keiningham, Timothy L; Aksoy, Lezzan; Hsu, Michael, A longitudinal Analysis of Customer satisfaction and Share of Wallet: investigating the moderating effect of customer characteristics, Journal of Marketing, 2007, vol. 71, pp 67-83
68
Reddy (20O5)[50] states that it is not enough if the product meets the l functional
requirements of the customer; it should meet certain other customer expectations like
behaviour/attitude of the person who provides service. Customer satisfaction is the
combination of both technical features and human behavioural aspects.
Dubrovski (2001)[51] has concluded from the satisfaction model that the customer
satisfaction directs the scope of finding success/failure of certain products/companies
in the market. This is very much important in strategic marketing analysis. It has also
stated that only relying of producer’s own views could cause great damage to the
company in long run. The company could achieve a better place if they were aware of
differences between the customers’ opinion about the product and their own. Customer
satisfaction is the most efficient and also least expensive source of communication, as a
satisfied customer will spread the word of satisfaction to the other people and
recommend the product to potential customers. It is understood from the previous study
that customer satisfaction is influenced by various external and personal factors. The
factors like quality, price, employee who deliver service, self knowledge and various
demographic factors can be analysed to ensure customer satisfaction.
There is significant evidence in the study of Luo and Homburg (2007)[52] that
customer/customer satisfaction is an important driver of firm profitability. It has also
been explained that customer satisfaction generates free word-of-mouth advertising and
saves marketing costs.
Customer satisfaction should be the major yardstick for every organization in today’s
work environment because customers are the 9 driving force for a business. Hockin
(1990)[53] states the following points what customer/customer satisfaction means to one
organization.
______________________________________________________________________ [50] Reddy, M. Madhukar, Customer Satisfaction Management in Service Industry, Published in Beacon-NIQR, Bangalore, July-
September 2005, pp 1-4 [51] Dubrovski, Drago, The Role of Customer Satisfaction in achieving Business Excellence, Total Quality Management,
December 2001, vol. 12, Issue 7, pp 920-925 [52] Luo, Xueming; Homburg, Christian, Neglected outcomes of Customer Satisfaction, Journal of Marketing, April 2007, Vol.
71, Issue 2, pp 133-149 [53] Hockin, Robert J, Simplifying the complexities of customer satisfaction, Management Review, 1990, Vol. 79, Issue 7, p 64
69
• Define a vision of customer satisfaction for the organization.
• Identify the appropriate customers.
• Measure customer satisfaction regularly and consistently.
• Create an interactive customer information system.
• Create a viable plan to incorporate customer information into action for the entire organization.
Customer satisfaction might be linked to individual loyalty, aggregate retention rate,
market share and profits showed in the study of Rust and Zahorik (1993)[54].
The only thing counts is that what the customer wants as stated by Kitaeff (1993)[55].
There are following steps suggested to increase customer satisfaction, as it is not the
latest fad, but a concept that is likely to be remaining an important force.
• Always to have a complete understanding of the attributes of the product or service that the customer believes to be important.
• Know the perception of the decision maker and collect the information regarding actual purchase behaviour.
Despite of the claim that satisfaction is linked to repurchase behaviour, few attempts
can be found that relate satisfaction to actual purchase behaviour. Mittal & Kamakura
(2001)[56] represented a conceptual model for relating satisfaction and repurchase
behaviour. Results showed that customers with different characteristics have different
thresholds such that, at the same level of rated satisfaction, repurchase rates are
systematically different among different customer groups.
Banumathy and Kalivani (2006)[57] found that customer attitude towards cell phone
service could be useful to service providers to formulate new strategies, policies and
market their services in a better way.
______________________________________________________________________ [54] Rust, Roland; Zahorik, Anthony J, Customer Satisfaction, Customer Retention and Market Share, Journal of Retailing,
Summer 1993,Vol. 69, Issue 2, p 193 [55] Kitaeff, Richard, Customer satisfaction: An integrative Approach, Marketing Research, Spring 93, Vol. 5, Issue 2, pp 4-4 [56] Mittal, Vikas, kamakura, Wayner A, Satisfaction, Repurchase Intent, and repurchase Behaviour: Investigating the moderating
effect of customer characteristics, Journal of marketing research, February 2001, Vol.38, pp 131-142 [57] Banumathy, S; Kalavani, S, Customers’ Attitude towards Cellphone Services in Communication System, Indian Journal of
Marketing, March 2006, pp 31-36
70
Customer attitude measures the credibility of services provided by any service
provider. According to Karimpal (2006)[58], Retaining customer loyalty is the most
important factor in the growth stage of the Indian mobile industry. The company has to
look into the changing expectations of the evolving cellular users to maintain customer
loyalty in mobile telephony. Marketing scholars emphasize the influence of customer
satisfaction on retention. Gustafsson et al (2005)[59] conducted the research from the
sample of customers of a large Swedish telecommunications company about the effect
of customer satisfaction on retention and found that customer satisfaction has a
consistent positive effect on retention.
Researcher identified from the above literature that customer satisfaction is important
to all companies because of the repetitive nature of the business. Customer satisfaction
has a significant influence on customer retention, brand loyalty and repeat purchases
that varies across customers
[58] Karimpanal, Abraham, The Mobile Customer; Retaining Customer loyalty in Mobile Telephony, July 2006,
.
2.8 Factors influencing Customer’s Level of Satisfaction
Terblanche & Boshoff (2001)[60] assessed the influence of certain factors on customer’s
level of satisfaction in their study. It has been found that service quality, product
quality and product varieties are the three dimensions that influence customer
satisfaction.
Fornell et al (1996)[61] has introduced the American Customer Satisfaction Index
(ACSI), a new type of customer-based measurement system for evaluating the
performance of firms, industries, economic sectors and national economies. ACSI
measures the quality of the goods and services as experienced by the customers. They
found that customer satisfaction is determined by customization. Customer
expectations and quality drives customer satisfaction that value or price.
____________________________________________________________________________
www.estrategicmarketingcom/smjan-feb3/art3.html [59] Gustafsson, Anders; Johnsons, Michael D; Roos, Inger, The Effects of Customer Satisfaction, relationship Commitment
Dimensions and Triggers on Customer Retention, Journal of Marketing, October 2005, Vol. 69, issue 4, pp 210-218 [60] Terblanche, N,S; Boshoff, C, Measuring Customer Satisfaction with some of the controllable elements of the total retail
experiences; An exploratory study, South African Journal of Business Management, June 2001, Vol. 32,lssue 2, p 35 [61] Fornell, Claes; Johnson, Michael d; Anderson, Eugen W; Cha, Jaesung; Byrant, Barbara Everitt, The American Customer
Satisfaction Index: Nature, Purpose and Findings, Journal of, A Marketing, October 1996, Vol. 60, Issue 7, p 18
71
Turel and Serenko (2004)[62] studied validation of American Customer Satisfaction
Model in mobile telecommunication sector and found that there is a positive
association between perceived customer expectations, perceived quality, value and
satisfaction and a negative link between satisfaction and customer complaints.
Pothas et al (2001)[63] proposed an unconventional way of monitoring customer
satisfaction based upon promoting the expressing of customer perceptions from the
frame of reference of the customers, not from the frame of reference of the investigator.
Churchill, Jr. & Suprenant (1982)[64] investigated whether it was necessary to include
disconfirmation as van intervening variable affecting satisfaction as was commonly
argued, or whether the effect of disconfirmation was adequately captured by
expectation and perceived performance. Further, they modelled the process for two
types of products using experimental procedures in which three levels of expectations
and three levels of performance were manipulated for each product in a factorial
design. Each subject’s perceived expectations, performance evaluations,
disconfirmation, and satisfaction were subsequently measured by using multiple
measures for each construct. The results suggested that the effects were different for
the two products. For the non-durable good, the relationships were as typically
hypothesized. The results for the durable good were different in important respects.
First, neither the disconfirmation experience nor subjects initial expectations affected
subjects’ satisfaction with it. Further, their satisfaction was determined solely by the
performance of the durable good. Expectations did combine with performance to affect
disconfirmation, though the magnitude of the disconfirmation experience did not
translate into an impact on satisfaction. Finally, the direct performance satisfaction link
accounts for most of the variation in satisfaction.
_________________________________________________________________________________________________________
[62] Turel, Ofir; Serenko, Alexander, User satisfaction with Mobile Services in Canada, Proceedings of the Third International Conference on Mobile Business, M-Business, 2004
[63] Pothas, Anne-Marie; Wet, Andries G.De; Johannes, Marthinus De, Customer Satisfaction: Keeping tabs on the issues that matter, Total Quality Management, December 2001, Vol, 12, Issue 1, pp 83-94
[64] Clhurbhill Jr, Gilbert A; Carol Suprenant, An Investigation into the Determinants or Customer satisfaction, Journal or Marketing Research, November 1982, Vol. 19, No. 4, Special Issue on Causal Modelling, pp 491-504
72
Ganesh et al (2000)[65] note that investigations of overall satisfaction provide useful
insights into the various customer groups, further exploration, of satisfaction with
service dimensions provide a more detailed look into the factors that drive customer
satisfaction.
Many researchers have suggested that satisfaction with specific service attributes
should be measured routinely when customer satisfaction and switching behaviour are
investigated. The reason behind such advice relies on the multidimensional nature of
perceptions of service quality and satisfaction, such that some dimensions may be
perceived as more important than others in determining overall satisfaction and
intentions to repatronise or switch.
2.9 Service Quality: the Key Influence in Customer Satisfaction
Ching-chow Yang (2003)[66] stated that customer satisfaction measurement highlights
the strength and the area of improvement in the quality of product. Continuous
improvement is considered one of the important quality activities for a firm to pursue
the best quality for its products. Through the continuous improvement actions, the
enterprise can increase customer satisfaction and raise profits.
Woodside et al (1989)[67] found from the research study that customer judgment of
service quality is positively associated with overall satisfaction with the service
encounter. The overall satisfaction varies with the service quality and customer
satisfaction. Overall customer satisfaction with the service encounter-is associated with
behavioural intention to return to the same service provider.
Now, quality is an important factor in determining the customer satisfaction. Service
quality and customer satisfaction are important concept as a means of creating
competitive advantages and customer loyalty. According to Berry et al (1997)[68],
service quality has become a significant differentiator and the most powerful
competitive weapon, which all the service organizations want to possess.
______________________________________________________________________ [65] Ganesh, Jaishankar; Arnold, Mark J; Reynolds, Kristy E, Understanding the Customer Base of Service Providers: An
examination of the Differences Between Switchers and Stayer, Jourqal of Marketing. 2000. Vol. 64. pp 65-87 [66] Yang, Ching-Chow, improvement actions based on the Customers' satisfaction survey, TQM & Business Excellence, October
2003, Vol.14, Issue 8, pp 919-930 [67] Woodside, Arch G; Frey, Lisa L; Daly, Robert Timoth, Linking Service Quality, Customer Satisfaction and Behavioural
intentions, Journal of Healthcare Marketing, December 1989, Vol. 9, No. 4, pp 5-17 [68] Berry, Leonard L; Parasuraman, A, Listening to the customer- The concept of a Service Quality information system, Sloan
Management Review, Spring 1997, Vol. 38, issue 3, pp 65-76
73
Jain & Hundal (2OO6)[69] revealed in their study that the choice of service provider
was affected by facilitating factor followed by coverage, quality of services, and easy
availability of connection and bill payment. Lt was stated that neighbours choice had
affected the respondent’s choice to a great extent.
Zeithaml, Berry and Parasuraman (1996)[70] study shows that companies offering
superior service achieve higher than normal market Share growth. Zeithmal et al
(1996)[71] developed a conceptual framework of the behavioural and financial
consequences of service quality. Superior (inferior) service quality is related to
favourable (unfavourable) behaviour intentions.
McCune (1989)[72] suggested that due to increased public desire for improved services
with the dramatic growth in the service industry, companies has led to assess quality of
service for an increased customer satisfaction.
Service quality and customer satisfaction are widely recognized as key influences in
the formation of customers purchase intentions in service environment. From the study
of Taylor and Baker (1994)[73], it appears that customer decision-making which
includes the interaction of satisfaction and service quality provided a better
understanding of customer purchase intentions.
Rust et al (1999)[74] have developed the concept of the Return on Service Quality
model that looks at investments in service as a chain of effects with the following
characteristics:
• Improvement in service will produce an increased level of customer
satisfaction at the process of an attribute level.
______________________________________________________________________ [69] Jain, Abhaya; Hundal, B.S, Factors influencing the Adoption of Cell Phone Services in Rural Areas, The ICFAI Journal of
Management Research , April 2006, vol. 5, Issue 4, p 22 [70] Zeithaml, Valarie A; Berry, Leonard L; Parasuraman, A, The Behavioural Consequences of Service Quality, Journal of
Marketing, April 1996, Vol. 60, pp 31-46 [71] Ibid [72] McCune, Joseph T, Customer Satisfaction as a strategic weapon; The implications for Performance Management Human
Resource Planning, 1989, Vol. 12, Issue 3, pp 195-204 [73] Taylor, Steven A; Baker, Thomas L, An Assessment of the relationship between Service Quality and Customer Satisfaction in
the Formation of customers' purchase intentions, Journal of Retailing [74] Rust, Roland T; lnman, Jeffrey; Jia, Jaanmin; Zahorik, Anthony, What you don’t know about Customer-Perceived Quality:
The Role of Customer Expectation Distributions. Marketing Science, 1999, Vol.18, Issue 1, pp 77-92
74
• Increased customer satisfaction at the process or attribute level will lead to
increased overall customer satisfaction.
• Higher overall service quality or customer satisfaction will lead to increased
behavioural intention, such as greater repurchase intention and intention to
increase usage.
• Increased behavioural intention will lead to behavioural impact, · including
repurchase or customer retention, positive word of mouth and increased usage.
Service is characterized and distinguished by intangibility, inseparability of production
and consumption, heterogeneity and perishability (Parasuraman et al, 1985)[75]. Harvey
(1995)[76] identified quality is behavior an attitude- that says, "you will never settle for
anything less that the best in service for your stakeholders, whether they are customers,
the community, your stockholders or colleagues with whom you work every day."
Zeithaml and Berry (1996)[77] has made attempts to understand the characteristics of
services and what providers should possess in order to project a high quality service
articulated by their customers. They made a conclusion that customers’ provided
service quality is a different concept from their satisfaction level and service quality
can be known by measuring the gaps between customers’ expectations and their
performance.
Cronin and Taylor (1992)[78], however, argue that the conceptualization of service
quality as a gap between expectations and performance is inadequate. According to
them, the concept of satisfaction defined as a gap between expectations and
performance of disconfirmation of expectations.
Gronroos (1984)[79] created a service quality model to illustrate how customers
perceive the quality of a given service. It divides customer’s perception of any
particular service into two dimensions: _________________________________________________________________________________________________________
[75] Parasuraman, A; Zeithaml, V.A; Berry, Leonard L, A Conceptual Model of Service quality & its implications for Future research, Journal of Marketing, Fall 1985, Vol. 49, pp 41-50
[76] Harvey, T, Quality; the only profit strategy, Bank Marketing, 1995, pp.43 [77] Zeithaml, Valarie A; Berry, Leonard L; Parasuraman, A, The Behavioural Consequences of Service Quality, Journal of
Marketing, April 1996, Vol. 60, pp 31-46 1 [78] Cronin, J. Joseph; Taylor, Steven A, Measuring Service Quality: A reexamination and extension, Journal of Marketing, 1992,
Vol. 56, pp,55-68 [79] Gronroos, Christian, A service quality Model and its Marketing Implications, European Journal of Marketing, 1984, Vol. 18,
Issue 4
75
• Technical quality- what the customer receives.
• Functional quality- how the customer receives the technical outcome.
Parasuraman et al[80] published a conceptual paper in 1985 identifying customer
perceptions of quality are influenced by five gaps such as not knowing what customers
expect, not selecting the right service design, not delivering to service standards, not
matching performance to promises and perceived service quality occurring in the
internal process of service delivery. Parasuraman et al (1985)[81] has designed a method
called SERVQUAL instrumentation to measure service quality in a variety of different
business. Service providers of different business were evaluated on the basis of quality
perceptuaI dimensions such as tangibles, reliability, assurance and empathy.
Noh et al (I2004)[81] has suggested that telecommunication service exists to fulfil the needs of users. Therefore, it is important to specify and measure the quantity of service that accurately, concisely and consistently express user’s satisfaction.
Goode et al (2005)[82] found that customer satisfaction for mobile phones determined
by experience with a mobile phone’s product quality, the level of call charges, the level
of service charges and satisfaction with the service provider. One could argue in the
case of mobile phones that the customer satisfaction is likely to be dependent on
attribute importance related to physical product as well as on attribute related to the
service offered by the service provider.
Agus (2004)[83] found from a research study that every organization should focus in
meeting the unlimited expectations of its customers. Quality can make customer
satisfaction the number one priority, where an emphasis should be placed on meeting
or exceeding the customer expectation in every transaction. Therefore, the organization
must know and understand the customer’s needs to ensure that the customer’s quality is
met.
______________________________________________________________________ [80] Parasuraman, A; Zeithaml, V.A; Berry, Leonard L, A Conceptual Model of Service quality & its implication for Future
research, Journal of Marketing, Fall 1985, Vol. 49, pp 41-50 [81] Noh, Seung J; Park, Hee-Sok; Park, Min-Yong, Multidimensional Quality Assessment of Multimedia Telecommunications
systems for Enhancing Customer Satisfaction, Total Quality Management & Business Excellence, 2004, Vol. 15, Issue 7, pp 899-908
[82] Goode, Mark M.H; Davies, Fino; Moutinho, L; Jamal, Ahmad, Determining Customer Satisfaction From Mobile Phones: A Neural Network Approach, Journal of Marketing Management, 2005, Vol. 21, pp 755-778
[83] Agus, Arawati, TQM as a focus for Improving overall service performance and customer satisfaction, Total Quality Management & Business Excellence, JuIy/ August 2004, Vol. 15, lssue 5/6, pp 615-628
76
Cronin Jr, Brady and Hult (20O0)[84] studied the relationships between quality, value,
satisfaction and behavioural intentions. They suggested that the customer decision-
making process for service product is modeled as a complex system that incorporates
both direct and indirect effects on behavioural intentions. Tam (2004)[85] suggested that
increasing customer’s perceptions of service quality could result in high customer
satisfaction and perceived value.
Bolton (1998)[86] indicates that customer satisfaction is positively related to the
duration of the relationship. The strength of the relationship between duration times
and satisfaction levels depends on the length of customer’s prior experience with the
organization.
Customers who have a many months’ experience with the organization weigh prior
cumulative satisfaction more heavily. The duration of the service provider-customer
relationship depends on whether customers experienced service transactions or failures.
Satisfying customers is a challenge for any service company. Taylor (2002)[87] stated
that company should stay focus on delivering services quickly and consistently so that
it reaches to customer fast.
The paper of Bou-Llusar et al (2001)[88] provides empirical evidence on the relationship
between firm perceived quality and overall customer satisfaction on purchase
intentions. It can be stated that firm perceived quality exerts an important influence on
purchase intentions. It has also seen that customer satisfaction acts, as a mediating
variable that moderates perceived quality and purchase intention.
______________________________________________________________________ [84] Cronin Jr, Joseph J; Brady, MK; Hult, G. Thomas K, Assessing the effects of Quality, Value and Customer Satisfaction on
Customer Behavioural intentions in Service Environments, Journal of Retailing, 2000, Vol. 76, Issue 2, pp 193-218
[85] Tam, Jackie L.M, Customer Satisfaction, Service Quality and Perceived Value An Integrative Model, Journal of Marketing
Management, September 2004, Vol. 20, Issue 7/8, pp 897-917
[86] Bolton, Ruth N, A Dynamic model of the Duration of the Customer’s Relationship with a continuous Service Provider: The
Role of Satisfaction, Marketing Science, 1998, Vol. 17, Issue 1, p45
[87] Taylor, Andy, Driving Customer Satisfaction, July 2002, Vol. 80, Issue 7, pp 24-25
[88] Bou-llusar, Juan Carlos; Camison-Zornoza, Cesar; Escrig-Tena, Ana Belen, Total Quality Management, December 2001, Vol
12, Issue 6, pp 719-734
77
Anderson et al. (1994)[89] states that when quality and expectations increase, there is a
positive effect on customer satisfaction in the long run, but increased expectations may
have a negative impact in the short run. Expectations have a positive effect on
customer satisfaction in the long run because they capture the accumulated memory of
the market concerning all past quality information and experience.
Customer satisfaction is based on an understanding of customer value- from the
customer’s perspective, the ratio of the expected benefits of a product or service to the
expected outlays (Naumann et al, 2001)[90].
Any organization must be able to deliver high levels of all the three critical factors such
as cost of service, outcome of service and perceived quality found from the study of
Furse et al (1994)[91]. The best providers Q Y would be those who can able to deliver
and manage information about the critical factors.
Wisniewski (2001)[92] found an overall conclusion from the study that SERVQUAL
approach is conceptually attractive and operationally useful.
It offers a cost-effective way of ensuring that services remains customer focused and
helps to identify the gap between performance and customer expectations about a
service that will result in improvement.
Bruce Cooli et al (2007)[93] has investigated the relationship between customer
satisfaction and lo alt in various contexts. Researchers have co found on the intuitive
relationship between customer satisfaction and business outcomes in two key ways:
• Changes in satisfaction are positively and non-linearly related to the share of
wallet a customer allocates to a particular service provider over time.
_________________________________________________________________________________________________________
[89] Anderson, Eugene W; Fornell, Claes; Lehman, Donald R, Customer Satisfaction, Market Share and Profitability; Findings from Sweden, Journal of Marketing, July 1994, Vol. 58, issue 3, p 53
[90] Naumann, earl; Jackson Jr, Donald W; Ronenbaum, Mark S, How to Implement a customer satisfaction program, Business Horzon, January 2001/ February 2001, Vol. 44, Issue 1, p 37
[91] Furse, David H, Burcham, Michael R; Rose, Robin L; Oliver, Richard W, Leveraging the Value of Customer Satisfaction Information, Marketplace Insights, Fall 1994, Vol. 14, No. 3, pp 16-20
[92] Wisniewski, Mik, Assessing Customer satisfaction with local authority services using SERVQUAL, Total Quality Management, December 2001, Vol. 12, Issue 7, pp 995-1002
[93] Cooli, Bruce; Keintngham, Timothy L; Aksoy, Leazang Hsu, Michael, A Longitudinal Analysis Of Customer Satisfaction and Share of Wallet: Investigating the moderating effect of customer characteristics, 2007, Vol. 71, pp 67-83
78
• The relationship between satisfaction and share of wallet is moderated by both
demographic and situational customer - characteristics. In particular, income
and length of relationship are significant predictors.
P. Chandiran (2005)[94] states that company’s positioning and differentiation strategy
changes as the product, market and competitors change over time. Mobile telephony
has a life cycle asserts four things:
• These services have a limited life because of technology.
• Service sales pass through distinct stages.
• Profit rise and fall at different stages.
• These services require different marketing strategies at different stages.
Ennew and Binks (1996)[95] state in the study that service quality is seen as a key
antecedent to successful customer relationships. Arguably, this is particularly so in the
service sector where quality can be difficult to imitate and as such can potentially
provide the basis for a sustainable competitive edge. Offering a superior service, which
the competition cannot match, provides customers with a reason for selecting and
remaining with a particular provider.
Anderson and Sullivan (1993)[96] have investigated the antecedents and consequences
of customer/customer satisfaction by analyzing a representative survey of 22,300
customers of a variety of products and service s in Sweden in 189-90. This paper has
the following important implications.
• Firms, which consistently provide high-quality products, should have a more
satisfied customer base and one that is more likely to be retained.
• An important component of managing satisfaction is the ability to control the
impact of negative disconfirmation through complaint handling and effective
customer service.
• The firm’s future profitability depends on satisfying customers in the present.
______________________________________________________________________
[94] Chandiran, P, Product Life Cycle and Promotion Strategies in Cellular Telecom Industry, Indian Journal of Marketing, November 2005, Vol.35, Issue 11
[95] Ennew, Christine T; Binks, Martin R, The Impact of Service Quality and Service Characteristics on Customer Retention : Small Business and their Banks in the UK, British Journal of Management, September 1996, Vol. 7, Issue3
[96] Anderson, Eugene W; Sullivan, Marry W, The Antecedents and Consequences of Customer Satisfaction for Firms, Marketing Science, 1993, Vol. 12, Issue 2, pp 125-143
79
Achieving the full profit potential of each customer relationship is Vital for the
organization. Grant and Schlesinger (1995)[97] stated that profits from customer
relationships are the lifeblood of all businesses. Profits can be increased by acquiring
new customers- to increase the number of people who use a product or service and
enhance the profitability of existing customers- to motivate people to engage in
behaviours that generate higher returns. The company must examine customer
behaviours such as share of use, costs of service, price paid and referrals for studying
full potential of target customers.
This above review of literature described the relationship between perceived value,
customer expectations, and customer satisfaction. It’s observed that the perceived
value, expectations are determinants of customer satisfaction. Accordance to the
review of literature, it is hypothesized that ‘perceived value’ customer ·expectations
and ‘factors’ will directly influence customer satisfaction.
_________________________________________________________________________________________________________
[97] Grant, W.H; Sclesinger, Leonard A, Realise your Customer’s Full Profit Potential, Harvard Business Review, September-October 1995, pp 59-72
80
2.10 Customer Satisfaction Models
Customer satisfaction, a term frequently used in marketing, is a measure of how
products and services supplied by a company meet or surpass customer expectation.
Customer satisfaction is defined as "the number of customers, or percentage of total
customers, whose reported experience with a firm, its products, or its services (ratings)
exceeds specified satisfaction goals."[1]
It is seen as a key performance indicator within business and is often part of a Balanced
Scorecard. In a competitive marketplace where businesses compete for customers,
customer satisfaction is seen as a key differentiator and increasingly has become a key
element of business strategy.[2]
Within organizations, customer satisfaction ratings can have powerful effects. They
focus employees on the importance of fulfilling customers’ expectations. Furthermore,
when these ratings dip, they warn of problems that can affect sales and profitability.
These metrics quantify an important dynamic. When a brand has loyal customers, it
gains positive word-of-mouth marketing, which is both free and highly effective.[1]
Therefore, it is essential for businesses to effectively manage customer satisfaction. To
be able do this, firms need reliable and representative measures of satisfaction. In
researching satisfaction, firms generally ask customers whether their product or service
has met or exceeded expectations. Thus, expectations are a key factor behind
satisfaction. When customers have high expectations and the reality falls short, they
will be disappointed and will likely rate their experience as less than satisfying. For this
reason, a luxury resort, for example, might receive a lower satisfaction rating than a
budget motel-even though its facilities and service would be deemed superior in
“absolute” terms.[1]
_______________________________________________________________ 1. ^ a b c d e f g h i Farris, Paul W.; Neil T. Bendle; Phillip E. Pfeiffer; David J. Reibstein (2010). Marketing Metrics: The Definitive
Guide to Measuring Marketing Performance. Upper Saddle River, New Jersey: Pearson Education, Inc. ISBN 0137058292.
The Marketing Accountability Standards Board (MASB) endorses the definitions, purposes, and constructs of classes of
measures that appear in Marketing Metrics as part of its ongoing Common Language: Marketing Activities and Metrics Project.
2. ^ Gitman, Lawrence J.; Carl D. McDaniel (2005). The Future of Business: The Essentials. Mason, Ohio: South-
Western. ISBN 0324320280.
81
The importance of customer satisfaction diminishes when a firm has increased
bargaining power. For example, cell phone plan providers, such as AT&T and Verizon,
participate in an industry that is an oligopoly, where only a few suppliers of a certain
product or service exist. As such, many cell phone plan contracts have a lot of fine
print with provisions that they would never get away if there were, say, a hundred cell
phone plan providers, because customer satisfaction would be way too low, and
customers would easily have the option of leaving for a better contract offer.
There is a substantial body of empirical literature that establishes the benefits of
customer satisfaction for firms.
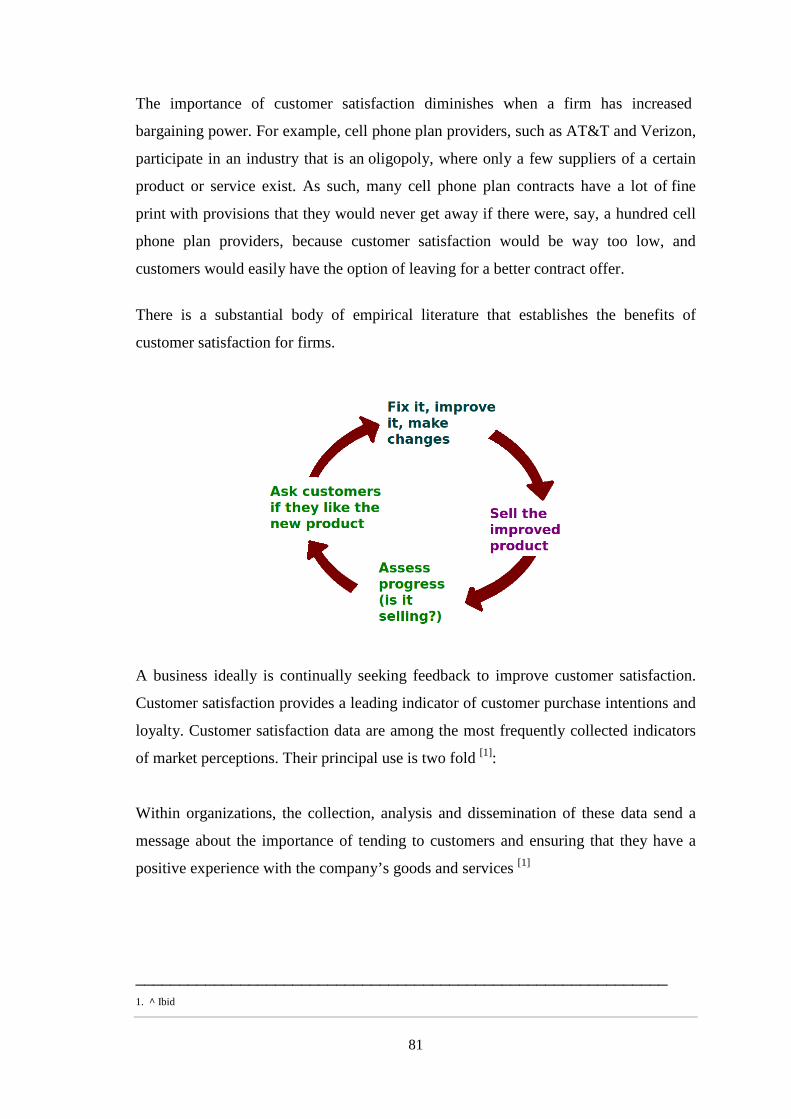
A business ideally is continually seeking feedback to improve customer satisfaction.
Customer satisfaction provides a leading indicator of customer purchase intentions and
loyalty. Customer satisfaction data are among the most frequently collected indicators
of market perceptions. Their principal use is two fold [1]:
Within organizations, the collection, analysis and dissemination of these data send a
message about the importance of tending to customers and ensuring that they have a
positive experience with the company’s goods and services [1]
_____________________________________________________________ 1. ^ Ibid
82
Although sales or market share can indicate how well a firm is performing currently,
satisfaction is an indicator of how likely it is that the firm’s customers will make
further purchases in the future. Much research has focused on the relationship between
customer satisfaction and retention. Studies indicate that the ramifications of
satisfaction are most strongly realized at the extremes. On a five-point scale,
individuals who rate their satisfaction level as “5” are likely to become return
customers and might even evangelize for the firm. (A second important metric related
to satisfaction is willingness to recommend. This metric is defined as "The percentage
of surveyed customers who indicate that they would recommend a brand to friends."
When a customer is satisfied with a product, he or she might recommend it to friends,
relatives and colleagues. This can be a powerful marketing advantage.) Individuals
who rate their satisfaction level as “1,” by contrast, are unlikely to return. Further, they
can hurt the firm by making negative comments about it to prospective customers.
Willingness to recommend is a key metric relating to customer satisfaction.[1]
2.10.1 Measuring customer satisfaction
Organizations need to retain existing customers while targeting non-customers.[3]
Measuring customer satisfaction provides an indication of how successful the
organization is at providing products and or services to the marketplace.
Customer satisfaction is measured at the individual level, but it is almost always
reported at an aggregate level. It can be, and often is, measured along various
dimensions. A hotel, for example, might ask customers to rate their experience with its
front desk and check-in service, with the room, with the amenities in the room, with the
restaurants, and so on. Additionally, in a holistic sense, the hotel might ask about
overall satisfaction “with your stay.”[1]
______________________________________________________________________ 1. ^ Ibid
3. ^ John, Joby (2003). Fundamentals of Customer-Focused Management: Competing Through Service. Westport, Conn.: Praeger.
ISBN 9781567205640.
83
As research on consumption experiences grows, evidence suggests that customers
purchase goods and services for a combination of two types of benefits: hedonic and
utilitarian. Hedonic benefits are associated with the sensory and experiential attributes
of the product. Utilitarian benefits of a product are associated with the more
instrumental and functional attributes of the product (Batra and Athola 1990)[4].
Customer satisfaction is an ambiguous and abstract concept and the actual
manifestation of the state of satisfaction will vary from person to person and
product/service to product/service. The state of satisfaction depends on a number of
both psychological and physical variables which correlate with satisfaction behaviors
such as return and recommend rate. The level of satisfaction can also vary depending
on other options the customer may have and other products against which the customer
can compare the organization's products.
Work done by Parasuraman, Zeithaml and Berry (Leonard L)[5] between 1985 and
1988 provides the basis for the measurement of customer satisfaction with a service by
using the gap between the customer's expectation of performance and their perceived
experience of performance. This provides the measurer with a satisfaction "gap" which
is objective and quantitative in nature. Work done by Cronin and Taylor propose the
"confirmation/disconfirmation" theory of combining the "gap" described by
Parasuraman, Zeithaml and Berry as two different measures (perception and
expectation of performance) into a single measurement of performance according to
expectation. The usual measures of customer satisfaction involve a survey[6] with a set
of statements using a Likert Technique or scale. The customer is asked to evaluate each
statement and in term of their perception and expectation of performance of the
organization being measured. Their satisfaction is generally measured on a five-point
scale.
4. ^ Batra, Rajeev and Olli T. Athola (1990), “Measuring the Hedonic and Utilitarian Sources of Customer Attitudes,” Marketing
Letters, 2 (2), 159-70.
5. ^ Berry, Leonard L.; A. Parasuraman (1991). Marketing Services: Competing Through Quality. New York: Free Press. ISBN 9780029030790.
6. ^ Kessler, Sheila (2003). Customer satisfaction toolkit for ISO 9001:2000. Milwaukee, Wis.: ASQ Quality Press. ISBN 0873895592.
84
Customer satisfaction data can also be collected on a 10-point scale.[1]
Regardless of the scale used, the objective is to measure customers’ perceived
satisfaction with their experience of a firm’s offerings. It is essential for firms to
effectively manage customer satisfaction. To be able do this, we need accurate
measurement of satisfaction.[7]
Good quality measures need to have high satisfaction loadings, good reliability, and
low error variances. In an empirical study comparing commonly used satisfaction
measures it was found that two multi-item semantic differential scales performed best
across both hedonic and utilitarian service consumption contexts. According to studies
by Wirtz & Lee (2003)[8], they identified a six-item 7-point semantic differential scale
(e.g., Oliver and Swan 1983), which is a six-item 7-point bipolar scale, that
consistently performed best across both hedonic and utilitarian services. It loaded most
highly on satisfaction, had the highest item reliability, and had by far the lowest error
variance across both studies. In the study[8], the six items asked respondents’ evaluation
of their most recent experience with ATM services and ice cream restaurant, along
seven points within these six items: “please me to displeased me”,
“contented with to disgusted with”, “very satisfied with to very dissatisfied with”, “did
a good job for me to did a poor job for me”, “wise choice to poor choice” and
“happy with to unhappy with”.
A semantic differential (4 items) scale (e.g., Eroglu and Machleit 1990)[9], which is a
four-item 7-point bipolar scale, was the second best performing measure, which was
again consistent across both contexts. In the study, respondents were asked to evaluate
their experience with both products, along seven points within these four items:
“satisfied to dissatisfied”, “favourable to unfavourable”, “pleasant to unpleasant” and
“I like it very much to I didn’t like it at all”.[8]
________________________________________________________________ 1. ^ Ibid
7. ^ Wirtz, Jochen and John E. G. Bateson (1995), “An Experimental Investigation of Halo Effects in Satisfaction Measures of Service Attributes,” International Journal of Service Industry Management, 6 (3), 84-102.
8. ^ a b c d e f Wirtz, Jochen; Chung Lee, Meng (2003), “An Empirical Study on The Quality and Context-specific Applicability of
Commonly Used Customer Satisfaction Measures,” Journal of Service Research, Vol. 5, No. 4, 345-355.
9. ^ Eroglu, Sergin A. and Karen A. Machleit (1990), “An Empirical Study of Retail Crowding: Antecedents and Consequences,”
Journal of Retailing, 66 (Summer), 201-21.
85
The third best scale was single-item percentage measure, a one-item 7-point bipolar
scale (e.g., Westbrook 1980)[10]. Again, the respondents were asked to evaluate their
experience on both ATM services and ice cream restaurants, along seven points within
“delighted to terrible”.[8]
It seems that dependent on a trade-off between length of the questionnaire and quality
of satisfaction measure, these scales seem to be good options for measuring customer
satisfaction in academic and applied studies research alike. All other measures tested
consistently performed worse than the top three measures, and/or their performance
varied significantly across the two service contexts in their study. These results suggest
that more careful pre-testing would be prudent should these measures be used.[8]
Finally, all measures captured both affective and cognitive aspects of satisfaction,
independent of their scale anchors.[8] Affective measures capture a customer’s attitude
(liking/disliking) towards a product, which can result from any product information or
experience. On the other hand, cognitive element is defined as an appraisal or
conclusion on how the product’s performance compared against expectations (or
exceeded or fell short of expectations), was useful (or not useful), fit the situation (or
did not fit), exceeded the requirements of the situation (or did not exceed).[11]
2.10.2 Methodologies
American Customer Satisfaction Index (ACSI) is a scientific standard of customer
satisfaction. Academic research has shown that the national ACSI score is a strong
predictor of Gross Domestic Product (GDP) growth, and an even stronger predictor
of Personal Consumption Expenditure (PCE) growth. On the microeconomic level,
academic studies have shown that ACSI data is related to a firm's financial
performance in terms of return on investment (ROI), sales, long-term firm value
(Tobin's q), cash flow, cash flow volatility, capital performance, portfolio returns,
debt financing, risk, and customer spending.[12]
____________________________________________________________________ 10. ^ Westbrook, Robert A. (1980), “A Rating Scale for Measuring Product/Service Satisfaction,” Journal of Marketing, 44 (Fall),
68-72.
8. ^ Ibid 11. ^ Retrieved from: “Customer Satisfaction Measurement.” 12. ^ Vikas Mittal; Carly Frennea (2010). "Customer Satisfaction: A Strategic Review and Guidelines for Managers." Marketing
Science Institute: MSI Fast Forward (10-701).
86
Increasing ACSI scores has been shown to predict loyalty, word-of-mouth
recommendations, and purchase behavior. The ACSI measures customer satisfaction
annually for more than 200 companies in 43 industries and 10 economic sectors. In
addition to quarterly reports, the ACSI methodology can be applied to private sector
companies and government agencies in order to improve loyalty and purchase intent.
Two companies have been licensed to apply the methodology of the ACSI for both the
private and public sector: CFI Group, Inc. and Foresee Results apply the ACSI to
websites and other online initiatives. ASCI scores have also been calculated by
independent researchers, for example, for the mobile phones sector,[13] higher
education,[14] and electronic mail.[15]
The Kano model is a theory of product development and customer satisfaction
developed in the 1980s by Professor Noriaki Kano that classifies customer preferences
into five categories: Attractive, One-Dimensional, Must-Be, Indifferent, Reverse. The
Kano model offers some insight into the product attributes which are perceived to be
important to customers.
POSE Analysis [16] offers an alternative to customer satisfaction. Instead of evaluating
satisfaction with a proposition, POSE Analysis determines both the positioning and
strength of a proposition. POSE Analysis thus offers a competitive perspective to
customer satisfaction.
SERVQUAL or RATER
13.
is a service-quality framework that has been incorporated into customer-satisfaction surveys (e.g., the revised Norwegian Customer Satisfaction
Barometer[17]) to indicate the gap between customer expectations and experience.
________________________________________________________________ ^ Turel, Ofir; Alexander Serenko (2006). "Satisfaction with mobile services in Canada: An empirical
investigation". Telecommunications Policy 30 (5-6): 314–331. doi:10.1016/ j.telpol.2005.10.003. 14. ^ Serenko, Alexander (2010). "Student satisfaction with Canadian music programs: The application of the American Customer
Satisfaction Model in higher education". Assessment and Evaluation in Higher Education 35 (4). 15. ^ Dow, Kevin; Alexander Serenko, Ofir Turel, Jeff Wong (2006). "Antecedents and consequences of user satisfaction with e-
mail systems". International Journal of e-Collaboration 2 (2): 46–64. doi:10.4018/jec.2006040103. 16. ^ POSE Analysis explained 17. ^ Johnson, Michael D.; Anders Gustafssonb, Tor Wallin Andreassenc, Line Lervikc and Jaesung Cha (2001). "The evolution
and future of national customer satisfaction index models". Journal of Economic Psychology 22 (2): 217–245. doi:10.1016/S0167-4870(01)00030-7. ISSN 0167-4870.
87
Top-Box J.D. Power and Associates approach by provides another measure of
customer satisfaction, known for its top-box approach and automotive industry
rankings. J.D. Power and Associates' marketing research consists primarily of customer
surveys and is publicly known for the value of its product awards.
Other research and consulting firms have customer satisfaction solutions as well. These
include A.T. Kearney's Customer Satisfaction Audit
For Business to Business (B2B) surveys there is the Info Quest box.
process,[18] which incorporates the
Stages of Excellence framework and which helps define a company’s status against
eight critically identified dimensions.
[19] This has been
used internationally since 1989 on more than 110,000 surveys (Nov '09) with an
average response rate of 72.74%. The box is targeted at "the most important"
customers and avoids the need for a blanket survey.
In the European Union member states, many methods for measuring impact and
satisfaction of e-government services are in use, which the eGovMoNet project sought
to compare and harmonize [20].
These customer satisfaction methodologies have not been independently audited by
the Marketing Accountability Standards Board (MASB) according to MMAP
(Marketing Metric Audit Protocol)
_________________________________________________________________________________________________________
18. ^ Ibid 19. ^ Customer Satisfaction Surveys - InfoQuest worldwide B2B customer satisfaction surveys 20 ^ European Commission: eGovMoNet: eGovernment Monitor Network.
88
2.11 Customer Satisfaction Measurement Models
Customer satisfaction is the most common of all marketing surveys and is part of the
“big three” research studies in marketing that include market segmentation and concept
testing. Measuring satisfaction and building a satisfaction survey requires a basic
knowledge of the satisfaction measurement literature, combined with your own
customer satisfaction experiences.
This brief provides an introduction to the theoretical and methodological
underpinnings of satisfaction research by first defining the concept of customer
satisfaction and how satisfaction is used in business.. This satisfaction research
attempts to provide the basis for understanding what measures should be included in
satisfaction surveys and why those measures are of value to any business.
Three very different approach Models:
2.11.1 Post Purchase Evaluation Model
Satisfaction feedback is obtained from the individual customer at the time of product
or service delivery (or shortly afterwards). This type of satisfaction survey is typically
used as part of a CRM (Customer Relationship Management System) and focuses on
having a long term relationship with the individual customer
2.11.2 Periodic Satisfaction Survey Model:
Satisfaction feedback from groups of customers at periodic intervals to provide an
occasional snapshot of customer experiences and expectations.
2.11.3 Continuous Satisfaction Tracking Model:
Satisfaction feedback is obtained from the individual customer at the time of product
or service delivery (or shortly afterwards). Satisfaction tracking surveys are often part
of a management initiative to assure quality is at high levels over time.
Satisfaction surveys are developed to provide an understanding of customers'
expectations and satisfaction. Satisfaction surveys typically require multiple questions
that address different dimensions of the satisfaction concept.
89
Satisfaction measurement includes measures of overall satisfaction, satisfaction with
individual product and service attributes, and satisfaction with the benefits of purchase.
Satisfaction measurement is like peeling away layers of an onion-each layer reveals yet
another deeper layer, closer to the core.
All three models of conducting satisfaction surveys are helpful models to:
Obtain customer feedback for assessing overall accomplishments,
degree of success, and areas for improvement.
Customer Satisfaction Survey Measures
Customer satisfaction surveys often include multiple measures of satisfaction,
including:
Overall measures of customer satisfaction
Affective measures of customer satisfaction
Cognitive measures of customer satisfaction
Behavioural measures of customer satisfaction
Expectancy value measures of customer satisfaction
General Measures that are part of a customer satisfaction analysis usually involve
product fulfilment and will often include product use scenarios where and how is the
product used?
2.11.4 Satisfaction Measurement: Overall Measures of Satisfaction
Satisfaction measures involve three psychological elements for evaluation of the
product or service experience: cognitive (thinking/evaluation), affective (emotional-
feeling/like-dislike) and behavioural (current/future actions).
Customer satisfaction usually leads to customer loyalty and product repurchase. But
measuring satisfaction is not the same as measuring loyalty. Satisfaction measurement
questions typically include items like:
90
1. An overall satisfaction measure (emotional):
Overall, how satisfied are you with “Amul” fresh Dahi”?
Satisfaction is a result of a product related experience and this question opinion of a
customer’s experience with the product’s performance. Note that it is meaningful to
measure attitudes towards a product that a customer has never used, but not satisfaction
for a product or brand that has never been used.
2. A loyalty measure (affective, behavioural):
Would you recommend “Amul” to your family and friends?
3. A series of attribute satisfaction measures (affective and cognitive):
How satisfied are you with the “taste” of Amul fresh Dahi?
How important is “taste” to you in selecting Amul fresh Dahi?
Satisfaction and attitude are closely related concepts. The psychological concepts of
attitude and satisfaction may both be defined as the evaluation of an object and the
individual’s relationship to it. The distinction is that satisfaction is a "post experience"
evaluation of the satisfaction produced by the product’s quality or value.
4. Intentions to repurchase (behavioural measures):
Do you intend to repurchase Amul fresh Dahi?
Satisfaction can influence post-purchase/post-experience actions other than usage (such
as word of mouth communications and repeat purchase behaviour). Additional post-
experience actions might include product or information search activity, changes in
shopping behaviour and trial of associated products.
As shown in Figure 1, Customer satisfaction is influenced by perceived quality of
product and service attributes, features and benefits, and is moderated by customer
expectations regarding the product or service. Each of these constructs that influence
customer satisfaction need to be defined.
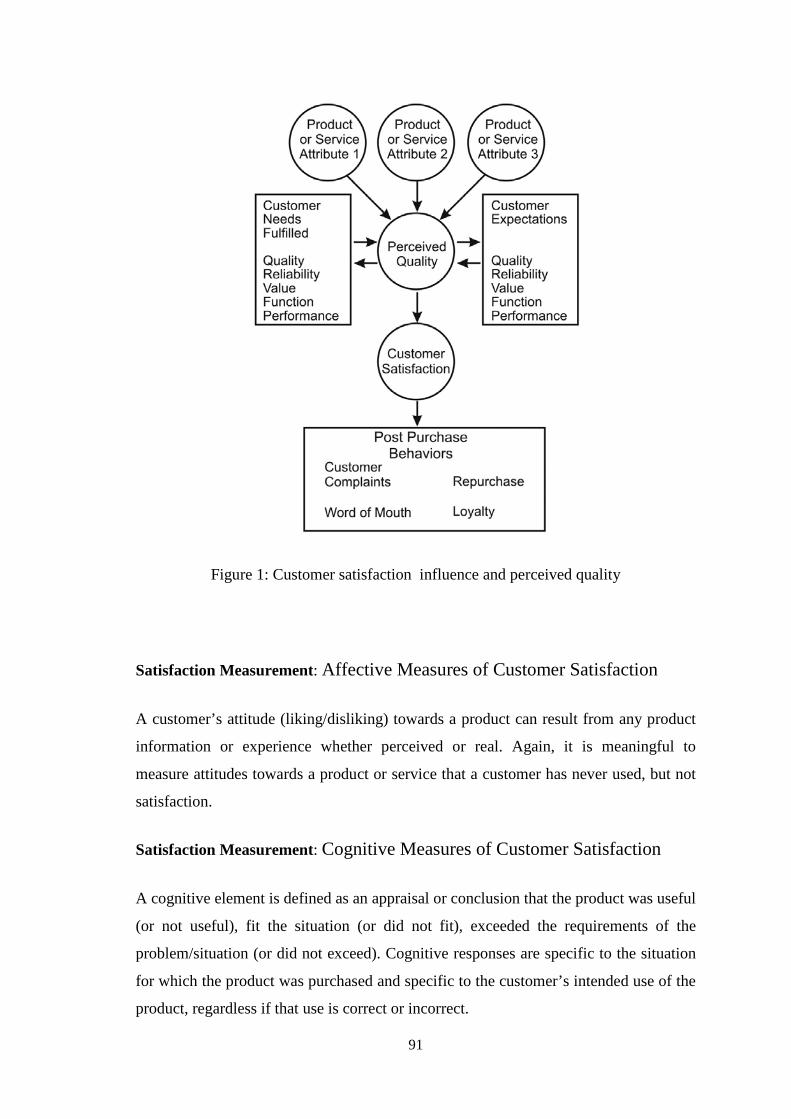
91
Figure 1: Customer satisfaction influence and perceived quality
Satisfaction Measurement: Affective Measures of Customer Satisfaction
A customer’s attitude (liking/disliking) towards a product can result from any product
information or experience whether perceived or real. Again, it is meaningful to
measure attitudes towards a product or service that a customer has never used, but not
satisfaction.
Satisfaction Measurement: Cognitive Measures of Customer Satisfaction
A cognitive element is defined as an appraisal or conclusion that the product was useful
(or not useful), fit the situation (or did not fit), exceeded the requirements of the
problem/situation (or did not exceed). Cognitive responses are specific to the situation
for which the product was purchased and specific to the customer’s intended use of the
product, regardless if that use is correct or incorrect.
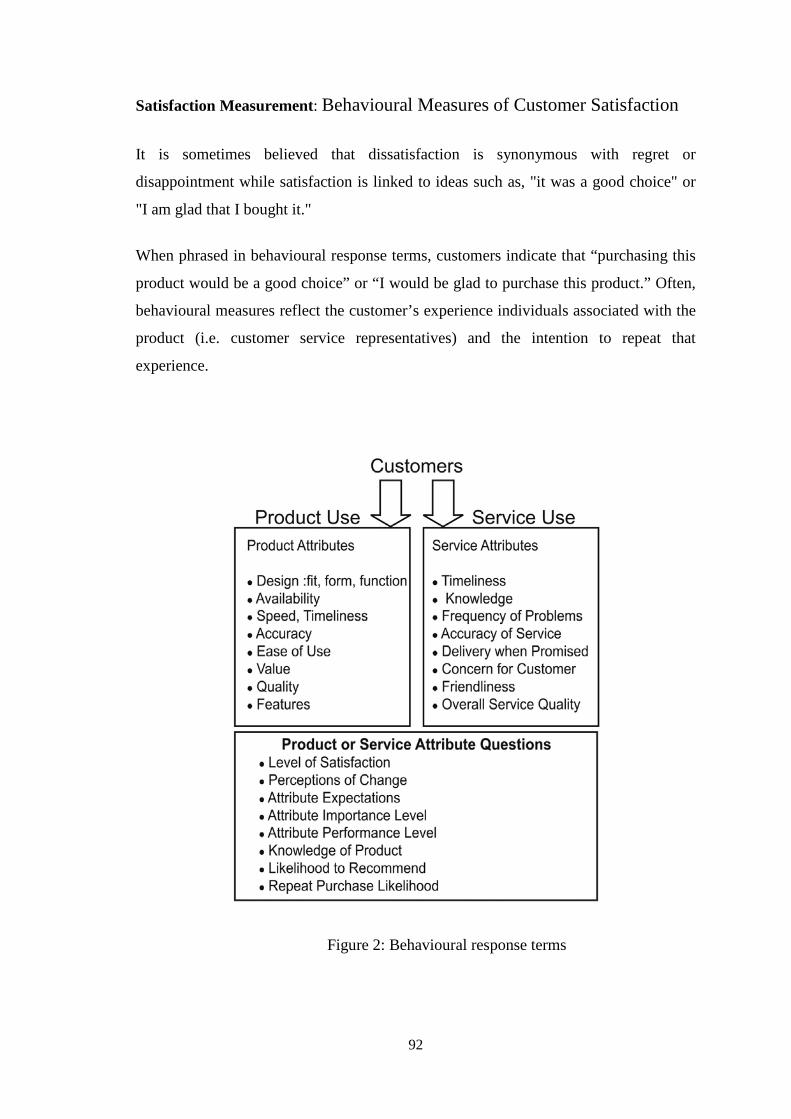
92
Satisfaction Measurement: Behavioural Measures of Customer Satisfaction
It is sometimes believed that dissatisfaction is synonymous with regret or
disappointment while satisfaction is linked to ideas such as, "it was a good choice" or
"I am glad that I bought it."
When phrased in behavioural response terms, customers indicate that “purchasing this
product would be a good choice” or “I would be glad to purchase this product.” Often,
behavioural measures reflect the customer’s experience individuals associated with the
product (i.e. customer service representatives) and the intention to repeat that
experience.
Figure 2: Behavioural response terms
93
Satisfaction Measurement: Expectations Measures
Many different approaches to measuring satisfaction exist in the customer behaviour
literature. Leonard Berry in 2002 expanded previous research to refine ten dimensions
of satisfaction, including: Quality, Value, Timeliness, Efficiency, Ease of Access,
Environment, Interdepartmental Teamwork, Front line Service Behaviors,
Commitment to the Customer and Innovation. Berry’s dimensions are often used to
develop an evaluative set of satisfaction measurement questions that focus on each of
the dimensions of customer satisfaction in a service environment.
A diagnostic approach to satisfaction measurement is to examine the gap between the
customer's expectation of performance and their perceived experience of performance.
This “satisfaction gap" involves measuring both perception of performance and
expectation of performance along specific product or service attributes dimensions.
Customer satisfaction is largely a reflection of the expectations and experiences that the
customer has with a product or service. However expectations also reflect that
influences the evaluation of the product or service. When we make major purchases,
we research the product or service and gain information from the advertising,
salespersons, and word-of-mouth from friends and associates. This information
influences our expectations and ability to evaluate quality, value, and the ability of the
product or service to meet our needs.
2.11.5 Types of Customer Expectations that Influence Satisfaction
Customer performance expectations for attributes, features and benefits of products and
services may be identified as both explicit and implicit expectation questions.
Explicit expectations are mental targets for product performance, such as well
identified performance standards. For example, if expectations for a color printer were
for 11 pages per minute and high quality color printing, but the product actually
delivered 3 pages per minute and good quality color printing, then the cognitive
evaluation comparing product performance and expectations would be 11 PPM – 3
PPM + High – Good, with each item weighted by their associated importance.
94
Implicit expectations represent the norms of performance that reflect accepted
standards established by business in general, other companies, industries, and even
cultures.
Static performance expectations address how performance and quality for a specific
application are defined. Each system’s performance measures are unique, though
general expectations relate to quality of outcome and may include those researched by
Berry, or others such as: accessibility, customization, dependability, timeliness, and
accuracy, tangible cues which augment the application, options, cutting edge
technology, flexibility, and user friendly interfaces. Static performance expectations are
the visible part of the iceberg; they are the performance we see and -- often erroneously
-- assume are all that exist.
Dynamic performance expectations are about how the product or service evolves over
time and includes the changes in support and product or service enhancement needed to
meet future business or use environments. Dynamic performance expectations may
help to “static” performance expectations as new uses, integrations, or system
requirements develop.
Technological expectations focus on the evolving state of the product category. For
example, mobile phones are continually evolving. Mobile service providers, in an
effort to deal with the desire to switch to new technology phones, market rate plans
with high cancellation penalties. The availability of low profile phones with email,
camera, MP3, email, and blue tooth technology changes technology expectations as
well as the static and dynamic performance expectations of the product. These highly
involving products enhance perceptions of status, ego, self-image, and can even invoke
fear when the product is not available.
Interpersonal expectations involve the relationship between the customer and the
product or service provider. Person to person relationships are increasingly important,
especially where products require support for proper use and functioning. Expectations
for interpersonal support include technical knowledge and ability to solve the problem,
ability to communicate, time to problem resolution, courtesy, patience, enthusiasm,
helpfulness, understood my situation and problem, communication skills, and customer
perceptions regarding professionalism of conduct, often including image, appearance.
95
In building a customer satisfaction survey, it is also helpful to consider reasons why
pre-purchase expectations or post-purchase satisfaction may or may not be fulfilled or
even measurable.
1. Expectations may not reflect unanticipated service attributes;
2. Expectations may be quite vague, creating wide latitudes of acceptability in
performance and expected satisfaction;
3. Expectation and product performance evaluations may be sensory and not cognitive,
as in taste, style or image;
4. The product use may attract so little attention as to produce no conscious affect or
cognition (evaluation), and result in meaningless satisfaction or dissatisfaction
measures;
5. There may have been unanticipated benefits or consequences of purchasing or using
the product (such as a use or feature not anticipated with purchase);
6. The original expectations may have been unrealistically high or low;
7. The product purchaser, influencer and user may have been different individuals,
each having different expectations.
For each of these types of expectations that when fulfilled result in customer
satisfaction (or when not delivered, result in dissatisfaction and complaining
behaviour), the perceived quality and value are critical and directly influence intention
to repurchase and loyalty.
Satisfaction Measurement: Perceived Quality Measures
Perceived quality is often measured through three measures: overall quality, perceived
reliability, and the extent to which a product or service meets the customer’s needs.
Customer perceptions of quality are the single greatest predictor of customer
satisfaction.
96
Satisfaction Measurement: Perceived Value Measures
Perceived value may conceptually refer to the overall price divided by quality or the
overall quality divided by price. Perceived value is measured in many ways including
overall evaluation of value, expectations of price that would be paid, and more rigorous
methodologies including the Van Westendorp pricing analysis, and conjoint analysis
The customer behaviour literature shows that price is a primary indicator of quality
when other attributes and benefits are relatively unknown. However when repeat
purchases are made in some product categories, price may be reduced in importance.
Satisfaction Measurement: Customer Loyalty Measures
Customer loyalty reflects the likelihood of repurchasing products or services. Customer
satisfaction is a major predictor of repurchase, but is strongly influenced by explicit
performance evaluations of product performance, quality, and value.
2.11.6 Models of Expectations and Customer Satisfaction
Expectations are beliefs (likelihood or probability) that a product or service
(with certain attributes, features or characteristics) will produce certain outcomes
(benefits-values). These expectations are based on previous affective, cognitive and
behavioural experiences.
Expectations are seen as related to satisfaction and can be measured in the following
ways:
1. Importance-Value of the product/service fulfilling the expectation;
2. Overall Affect-Satisfaction Expectations: The (liking/disliking) of the
product/service;
3. Fulfilment of Expectations: the expected level of performance vs. the desired
expectations. This is “Predictive Fulfilment” and is a respondent specific index of the
performance level necessary to satisfy.
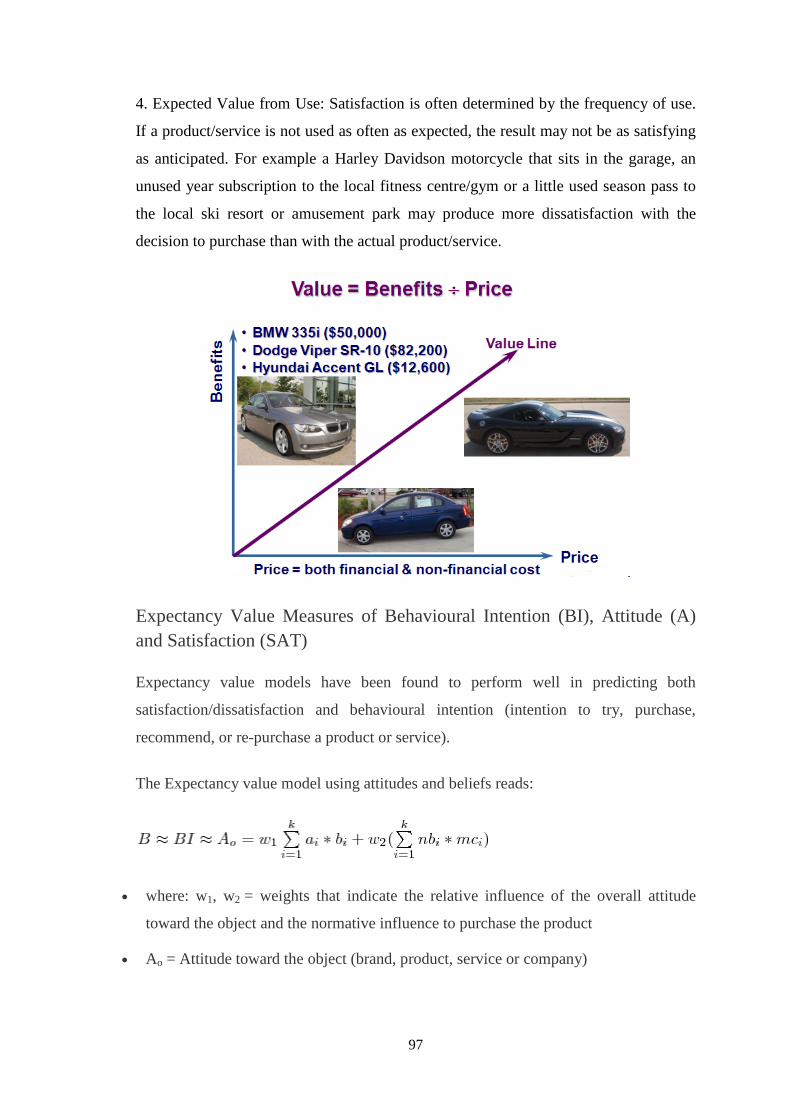
97
4. Expected Value from Use: Satisfaction is often determined by the frequency of use.
If a product/service is not used as often as expected, the result may not be as satisfying
as anticipated. For example a Harley Davidson motorcycle that sits in the garage, an
unused year subscription to the local fitness centre/gym or a little used season pass to
the local ski resort or amusement park may produce more dissatisfaction with the
decision to purchase than with the actual product/service.
Expectancy Value Measures of Behavioural Intention (BI), Attitude (A) and Satisfaction (SAT)
Expectancy value models have been found to perform well in predicting both
satisfaction/dissatisfaction and behavioural intention (intention to try, purchase,
recommend, or re-purchase a product or service).
The Expectancy value model using attitudes and beliefs reads:
• where: w1, w2 = weights that indicate the relative influence of the overall attitude
toward the object and the normative influence to purchase the product
• Ao = Attitude toward the object (brand, product, service or company)
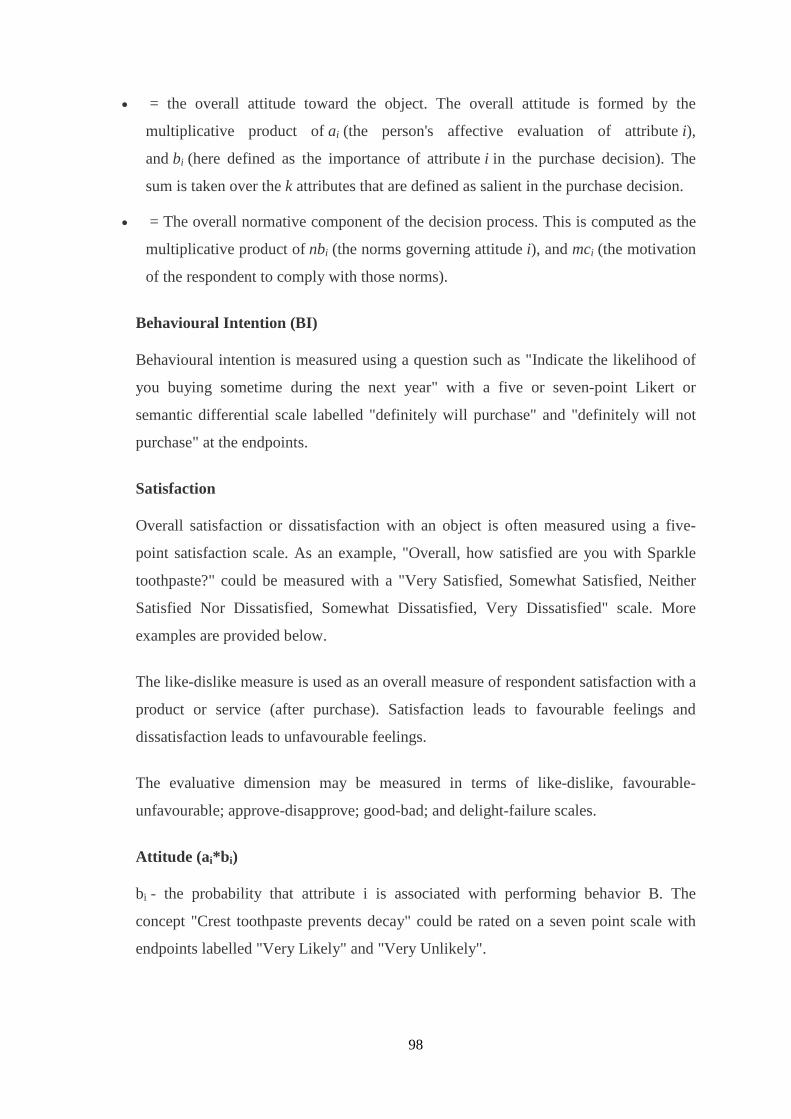
98
• = the overall attitude toward the object. The overall attitude is formed by the
multiplicative product of ai (the person's affective evaluation of attribute i),
and bi (here defined as the importance of attribute i in the purchase decision). The
sum is taken over the k attributes that are defined as salient in the purchase decision.
• = The overall normative component of the decision process. This is computed as the
multiplicative product of nbi (the norms governing attitude i), and mci (the motivation
of the respondent to comply with those norms).
Behavioural Intention (BI)
Behavioural intention is measured using a question such as "Indicate the likelihood of
you buying sometime during the next year" with a five or seven-point Likert or
semantic differential scale labelled "definitely will purchase" and "definitely will not
purchase" at the endpoints.
Satisfaction
Overall satisfaction or dissatisfaction with an object is often measured using a five-
point satisfaction scale. As an example, "Overall, how satisfied are you with Sparkle
toothpaste?" could be measured with a "Very Satisfied, Somewhat Satisfied, Neither
Satisfied Nor Dissatisfied, Somewhat Dissatisfied, Very Dissatisfied" scale. More
examples are provided below.
The like-dislike measure is used as an overall measure of respondent satisfaction with a
product or service (after purchase). Satisfaction leads to favourable feelings and
dissatisfaction leads to unfavourable feelings.
The evaluative dimension may be measured in terms of like-dislike, favourable-
unfavourable; approve-disapprove; good-bad; and delight-failure scales.
Attitude (ai*bi)
bi - the probability that attribute i is associated with performing behavior B. The
concept "Crest toothpaste prevents decay" could be rated on a seven point scale with
endpoints labelled "Very Likely" and "Very Unlikely".
99
ai - the evaluation of belief i. A representative measure of ai would be "In terms of
buying Crest toothpaste, decay prevention is …" with a five or seven point scale with
"good" and "bad"; or "Excellent" and "Poor" at the endpoints.
In building a customer satisfaction survey, it is also helpful to consider reasons why
pre-purchase expectations or post-purchase satisfaction may or may not be fulfilled or
even measurable.
1. Expectations may not reflect unanticipated service attributes;
2. Expectations may be quite vague, creating wide latitudes of acceptability in
performance and expected satisfaction;
3. Expectation and product performance evaluations may be sensory and not cognitive,
as in taste, style or image;
4. The product use may attract so little attention as to produce no conscious affect or
cognition (evaluation), and result in meaningless satisfaction or dissatisfaction
measures;
5. There may have been unanticipated benefits or consequences of purchasing or using
the product (such as a use or feature not anticipated with purchase);
6. The original expectations may have been unrealistically high or low;
7. The product purchaser, influencer and user may have been different individuals, each
having different expectations.
2.11.7 When to Conduct Customer Satisfaction Surveys
The best timing for measuring customer satisfaction and building customer satisfaction
surveys depends on the kind of product or service provided, the kinds of customers
served, how many customers are served, the longevity and frequency of
customer/supplier interactions, and what you intend to do with the results.
As discussed in detail earlier there are three very different approaches that produce
meaningful and useful findings:
• Post Purchase Evaluation Surveys
100
• Periodic Satisfaction Surveys
• Continuous Satisfaction tracking Surveys
Satisfaction surveys are developed to provide an understanding of customers'
expectations and satisfaction. Satisfaction surveys typically require multiple questions
that address different dimensions of the satisfaction concept. Satisfaction measurement
includes measures of overall satisfaction, satisfaction with individual product and
service attributes, and satisfaction with the benefits of purchase. Satisfaction
measurement is like peeling away layers of an onion-each layer reveals yet another
deeper layer, closer to the core.
All three methods of conducting satisfaction surveys are helpful methods to obtain
customer feedback for assessing overall accomplishments, degree of success, and areas
for improvement.
2.11.8 Building a Customer Satisfaction Survey
Customer satisfaction surveys often include multiple measures of satisfaction,
including:
• Overall measures of customer satisfaction
• Affective measures of customer satisfaction
• Cognitive measures of customer satisfaction
• Behavioural measures of customer satisfaction
• Expectancy value measures of customer satisfaction
General Measures that are part of a customer satisfaction analysis usually involve
product fulfilment and will often include product use scenarios where and how is the
product used?
2.11.9 Common Ingredients of a Customer Satisfaction Survey
Product Use • Frequency of product use
101
• Primary use location
• Primary precipitating events or situations for product use or need
• Usage rates and trends
Product Familiarity
• Degree of actual product use familiarity
• Knowledge (read product information, read product label, etc.)
• Knowledge and Involvement with product and the purchase process
• Awareness of other brands
• Reasons for original product purchase (selection reasons)
• Primary benefits sought from the product
• Product Evaluation
• Attribute evaluation matrix: (quality, price, trust, importance, performance, value)
• Perceived benefit associations matrix
• Importance, performance
• Identification of primary benefits sought
• Comparison to other brands (better, worse)
• What is the best thing about the brand, what could be done better
Message and Package Evaluation
• Packaging size, design
• Advertising Promise, message fulfilment evaluation
Value Analysis
• Expectation of price
• Expectation of relative price (full price, on sale)
• Current price paid
102
Satisfaction Measurements
• Overall Satisfaction
• Reasons for Satisfaction Evaluation
• Satisfaction with attributes, features, benefits
• Satisfaction with use
• Expected and Ideal Satisfaction-Performance Measures
• Likelihood of recommending
• Likelihood of repurchasing
2.11.10 Kano model of Customer Satisfaction
According to the Standish group research on average 45% of software features are
never used and only 20% of features are used always or often. It means that on average
you could develop two times simpler product and sell it for the same price. Potentially
gains can be even bigger, for the enterprise scale systems two times simpler product
often means four times shorter schedules and ten times simpler integration and testing.
There is no other way to discover what features would be actually used, than to ask the
real or at least potential customers, preferably after letting them to try some features
live. One of the tools for aiding the feature categorization is the Kano model of
customer satisfaction.
The Kano model separates features into three broad categories:
Must-have mandatory features
It is necessary to develop these features just to enter the market. However, once the
basic requirement is satisfied, customer almost doesn't care about the further
improvement of the feature. For example, the modern web processor has to contain the
spell-checker feature to be sell. However, most customers won't even notice if the
spell-checker contains 50 or 200 thousand words
103
Linear or performance features
The better this kind of features is developed, the more customer is satisfied.
For example, the more storage space a file storage server provides, the more customers
would be satisfied
Excitement or "wow" features
Customer won't be disappointed too much if these features are missing. However, the
couple of exciter features can provide great customer satisfaction often adding a price
premium to a product.
The Kano model is a theory of product development and customer satisfaction
developed in the 80s by Professor Noriaki Kano which classifies customer preferences
into five categories:
Attractive One-Dimensional Must-Be Indifferent Reverse
Attractive Quality:
These attributes provide satisfaction when achieved fully, but do not cause
dissatisfaction when not fulfilled. These are attributes that are not normally expected,
for example, a thermometer on a package of milk showing the temperature of the milk.
Since these types of attributes of quality unexpectedly delight customers, they are often
unspoken.
One-dimensional Quality:
These attributes result in satisfaction when fulfilled and dissatisfaction when not
fulfilled. These are attributes that are spoken of and ones which companies compete
for. An example of this would be a milk package that is said to have ten percent more
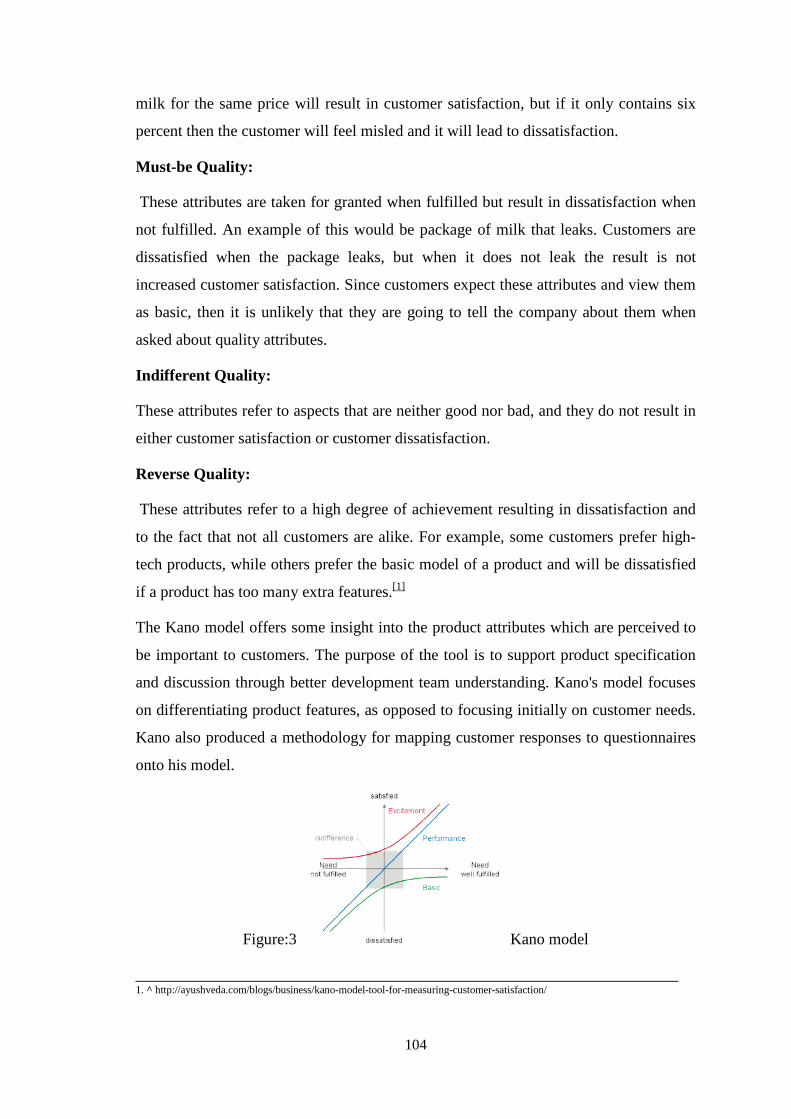
104
milk for the same price will result in customer satisfaction, but if it only contains six
percent then the customer will feel misled and it will lead to dissatisfaction.
Must-be Quality:
These attributes are taken for granted when fulfilled but result in dissatisfaction when
not fulfilled. An example of this would be package of milk that leaks. Customers are
dissatisfied when the package leaks, but when it does not leak the result is not
increased customer satisfaction. Since customers expect these attributes and view them
as basic, then it is unlikely that they are going to tell the company about them when
asked about quality attributes.
Indifferent Quality:
These attributes refer to aspects that are neither good nor bad, and they do not result in
either customer satisfaction or customer dissatisfaction.
Reverse Quality:
These attributes refer to a high degree of achievement resulting in dissatisfaction and
to the fact that not all customers are alike. For example, some customers prefer high-
tech products, while others prefer the basic model of a product and will be dissatisfied
if a product has too many extra features.[1]
The Kano model offers some insight into the product attributes which are perceived to
be important to customers. The purpose of the tool is to support product specification
and discussion through better development team understanding. Kano's model focuses
on differentiating product features, as opposed to focusing initially on customer needs.
Kano also produced a methodology for mapping customer responses to questionnaires
onto his model.
Figure:3 Kano model
____________________________________________________________________ 1. ^ http://ayushveda.com/blogs/business/kano-model-tool-for-measuring-customer-satisfaction/
105
Quality Function Deployment (QFD) makes use of the Kano model in terms of the
structuring of the Comprehensive QFD matrices. Mixing Kano types in QFD matrices
can lead to distortions in the customer weighting of product characteristics. For
instance, mixing Must-Be product characteristics-such as cost, reliability,
workmanship, safety, and technologies used in the product-in the initial House of
Quality will usually result in completely filled rows and columns with high correlation
values. Other Comprehensive QFD techniques using additional matrices are used to
avoid such issues. Kano's model provides the insights into the dynamics of customer
preferences to understand these methodology dynamics.
Threshold or Basic Attributes
One of the main points of assessment in the Kano model is the threshold attributes.
These are basically the features that the product must have in order to meet customer
demands. If this attribute is overlooked, the product is completely incomplete. If a new
product is not examined using the threshold aspects, it may not be possible to enter the
market. This is the first and most important characteristic of the Kano model.[11] The
product is being manufactured for some type of customer base, and therefore this must
be a crucial part of product innovation. Threshold attributes are simple components to a
product. However, if they are not available, the product will soon leave the market due
to dissatisfaction. The attribute is either there or not. An example of a threshold
attribute would be a steering wheel in a vehicle. The vehicle is no good if it is not able
to be steered.[12]
The threshold attributes are most often seen as a price of entry. Many products have
threshold attributes that are overlooked. Since this component of the product is a
necessary guideline, many customers do not judge how advanced a particular feature is.
Therefore, many times companies will want to improve the other attributes because
customers remain neutral to changes in the threshold section. [13]
___________________________________________________________________________
11. ^ Jacobs, Randy, Evaluating Satisfaction with Media Products and Services: An Attribute Based Approach, European Media
Management Review, Winter 1999.
12. ^ Ullman, David G., The Mechanical Design Process, McGraw-Hill, Inc., U.S.A., 1997 pp. 105-108 ISBN 0-07-065756-4
13. ^ Bonacorsi, Steven. "Kano Model and Critical To Quality Tree." Six Sigma and Lean Resources - Home. Web. 26 Apr. 2010.
106
Performance Attributes
A performance attribute is defined as a skill, knowledge, ability, or behavioural
characteristic that is associated with job performance. Performance attributes are
metrics on which a company bases its business aspirations. They have an explicit
purpose. Companies prioritize their investments, decisions, and efforts and explain
their strategies using performance attributes. These strategies can sometimes be
recognized through the company’s slogans. For example Lexus’s slogan is “The
Passionate Pursuit of Perfection” (reliability) and WalMart; “Always low prices.
Always” (cost). In retail the focus is generally on assuring availability of products at
best cost.
Performance attributes are those for which more is better, and a better performance
attribute will improve customer satisfaction. Conversely, a weak performance attribute
reduces customer satisfaction. When customers discuss their needs, these needs will
fall into the performance attributes category. Then these attributes will form the
weighted needs against the product concepts that are being evaluated. The price a
customer is willing to pay for a product is closely tied to performance attributes. So the
higher the performance attribute, the higher the customers will be willing to pay for the
product. Performance attributes also often require a trade-off analysis against cost. As
customers start to rate attributes as more and more important, the company has to ask
itself, “how much extra they would be willing to pay for this attribute?” And “will the
increase in the price for the product for this attribute deter customers from purchasing
it.” Prioritization matrices can be useful in determining which attributes would provide
the greatest returns on customer satisfaction.[14]
___________________________________________________________________________
14. ^ http://www.scortalk.com/talks/2008/01/15/performance-attributes/
107
Excitement Attributes
Not only does the Kano Model feature performance attributes, but additionally
incorporates an “excitement” attribute as well. Well what is an “excitement” attribute?
Excitement attributes are for the most part unforeseen by the client but may yield
paramount satisfaction. Having excitement attributes can only help you, in some
scenarios it is ok to not have them included. The beauty behind an excitement attribute
is to spur a potential customers’ imagination, these attributes are used to help the
customer discover needs that they’ve never thought about before.[15]
The key behind the Kano Model is for the engineer to discover this “unknown need”
and enlighten the customer, to sort of engage that “awe effect.” Having concurrent
excitement attributes within a product can provide a significant competitive advantage
over a rival. In a diverse product assortment, the excitement attributes act as the WOW
factors and trigger impulsive wants and needs in the mind of the customer. The more
the customer thinks about these amazing new ideas, the more they want it.[16]
Out of all the attributes introduced in the Kano Model, the excitement ones are the
most powerful and have the potential to lead to the highest gross profit margins.
Innovation is undisputedly the catalyst in delivering these attributes to customers; you
need to be able to distinguish what is an excitement today, because tomorrow it
becomes a known feature and the day after it is used throughout the whole world.[17]
_________________________________________________________________________________________________________
15. ^http://www.12manage.com/methods_kano_customer_satisfaction_model.html
16. ^ The Kano Model Illustrated Report
17. ^ Discovering the Kano Model
108
2.11.11 Kano Model Analysis
Threshold attributes are not typically captured in QFDs (Quality Function Deployment)
or other evaluation tools as products are not rated on the degree to which a threshold
attribute is met, the attribute is either satisfied or not.
Performance Attributes
Performance attributes are those for which more is generally better, and will improve
customer satisfaction. Conversely, an absent or weak performance attribute reduces
customer satisfaction. Of the needs customers verbalise, most will fall into the category
of performance attributes. These attributes will form the weighted needs against which
product concepts will be evaluated.
The price for which customer is willing to pay for a product is closely tied to
performance attributes. For example, customers would be willing to pay more for a car
that provides them with better fuel economy.
Excitement Attributes
Excitement attributes are unspoken and unexpected by customers but can result in high
levels of customer satisfaction, however their absence does not lead to dissatisfaction.
Excitement attributes often satisfy latent needs – real needs of which customers are
currently unaware.
In a competitive marketplace where manufacturers’ products provide similar
performance, providing excitement attributes that address “unknown needs” can
provide a competitive advantage. Although they have followed the typical evolution to
a performance then a threshold attribute, cup holders were initially excitement
attributes.
109
Other Attributes
Products often have attributes that cannot be classified according to the Kano Model.
These attributes are often of little or no consequence to the customer, and do not factor
into customer decisions. An example of this type of attribute is a plate listing part
numbers can be found under the hood on many vehicles for use by repairpersons.
Application of the Kano Model Analysis
A relatively simple approach to applying the Kano Model Analysis is to ask customers
two simple questions for each attribute:
1. Rate your satisfaction if the product has this attribute?; and
2. Rate your satisfaction if the product did not have this attribute?
Customers should be asked to answer with one of the following responses:
A) Satisfied;
B) Neutral (It’s normally that way);
C) Dissatisfied;
D) Don’t care.
Basic attributes generally receive the “Neutral” response to Question 1
and the “Dissatisfied” response to Question 2.
Exclusion of these attributes in the product has the potential to severely impact
the success of the product in the marketplace.
Eliminate or include performance or excitement attributes that their presence or
absence respectively lead to customer dissatisfaction. This often requires a trade-off
analysis against cost. As Customers frequently rate most attributes or functionality as
important, asking the question “How much extra would you be willing to pay for this
attribute or more of this attribute?” will aid in trade-off decisions, especially for
110
performance attributes. Prioritisation matrices can be useful in determining which
excitement attributes would provide the greatest returns on Customer satisfaction.
Consideration should be given to attributes receiving a “Don’t care” response as they
will not increase customer satisfaction nor motivate the customer to pay an increased
price for the product. However, do not immediately dismiss these attributes if they play
a critical role to the product functionality or are necessary for other reasons than to
satisfy the customer.
The information obtained from the Kano Model Analysis, specifically regarding
performance and excitement attributes, provides valuable input for the Quality
Function
____________________________________________________________________________ Ullman, David G., The Mechanical Design Process, McGraw-Hill, Inc., U.S.A., 1997
pp. 105-108 ISBN 0-07-065756-4
Jacobs, Randy, Evaluating Satisfaction with Media Products and Services: An Attribute
Based Approach, European Media Management Review, Winter 1999.
http://www.tukkk.fi/mediagroup/emmr/Previous%20Issues/Satisfaction.htm
111
2.12 Conclusion
After studying various Customer Satisfaction Models and other Satisfaction
Measurement Models, in the present study the researcher identifies the following
‘Four specific factors’ as the most important factors on which a focused
‘Customer Satisfaction model’ is developed.
1. Network Coverage
2. Call Charges
3. Value Added Services
4. Instinct & Impulse
In addition to this, the researcher also attempts to measure customer satisfaction on a
separate scale of “Perceived Customer Satisfaction Levels”
Hence the researcher has prepared a detailed Questionnaire which includes
Question No.5 specifically related to the important factors on which Customer
Satisfaction is measured and Question No.20 targeted to evoke responses related to
“Perceived Customer Satisfaction Levels”.
This Questionnaire is included in the Appendices.
Further to this the Research Methodology is described in the subsequent Chapter.