Embed Size (px)
Citation preview

Chapter 2
Operations and Supply Strategy

What is Operations and Supply Strategy?
• Operations and supply strategy is concerned with setting broad policies and plan for using the resources of a firm to best support its long-term competitive strategy.
2-2

• Differentiation
• Cost leadership
• Quick response
Strategies for Competitive Advantage

Competitive Strategies
• Cost or Price– Make the Product or Deliver the Service Cheap
• Quality– Make a Great Product or Deliver a Great Service
• Delivery Speed– Make the Product or Deliver the Service Quickly
• Delivery Reliability– Deliver It When Promised
• Coping with Changes in Demand– Change Its Volume
• Flexibility and New Product Introduction Speed– Change It
• Other Product-Specific Criteria– Support It
2-4

• Must understand:– Strengths and weaknesses of
competitors, entrants, substitutes– Environmental, technological, legal,
economic issues– Product life cycle– Available resources (overall and OM)– Integration of OM strategy with Company
strategy and other functional areas
Developing OM Strategy

Operations and Supply Strategy Framework
2-6

Dealing with Trade-offs
Cost
Quality
DeliveryFlexibility
For example, if we improve customer service problem solving by cross-training personnel to deal with a wider-range of problems, they may become less efficient at dealing with commonly occurring problems.
For example, if we improve customer service problem solving by cross-training personnel to deal with a wider-range of problems, they may become less efficient at dealing with commonly occurring problems.
For example, if we reduce costs by reducing product quality inspections, we might reduce product quality.
For example, if we reduce costs by reducing product quality inspections, we might reduce product quality.
2-7

• Changes in the organization• Stages in the product life cycle• Changes in the environment
When to Change Strategy

Order Qualifiers and Winners
Defined
•Order qualifiers are the basic criteria that permit the firms products to be considered as candidates for purchase by customers
•Order winners are the criteria that differentiates the products and services of one firm from another
2-9

Reasons to Globalize Operations
• Reduce costs (labor, taxes,
tariffs, etc.)• Improve the supply chain• Provide better goods and services• Attract new markets• Learn to improve operations• Attract and retain global talent
Tangible
Intangible

Global Impact of Culture and Ethics
• Cultures differ! Some accept/expect:– variations in punctuality– long lunch hours– expectation of thievery– bribery– little protection of intellectual property
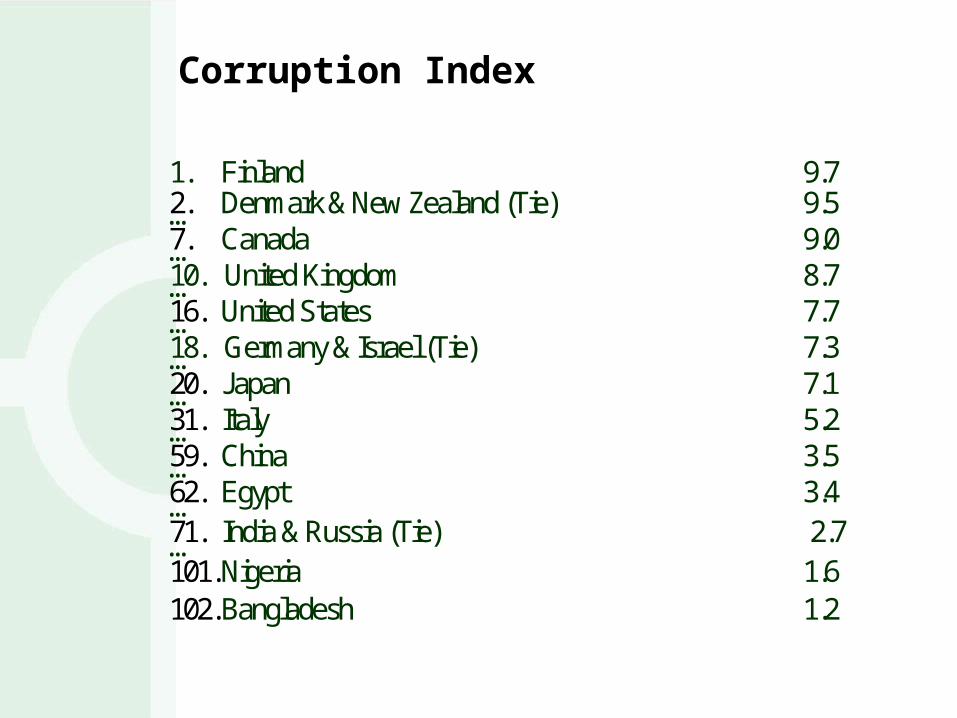
Corruption Index
1. Finland 9.72. Denmark & New Zealand (Tie) 9.5…7. Canada 9.0…10. United Kingdom 8.7…16. United States 7.7…18. Germany & Israel (Tie) 7.3…20. Japan 7.1…31. Italy 5.2…59. China 3.5…62. Egypt 3.4…71. India & Russia (Tie) 2.7…101. Nigeria 1.6102. Bangladesh 1.2

What is Productivity?Defined
Productivity is a common measure on how well resources are being used. In the broadest sense, it can be defined as the following ratio:
Outputs Inputs
2-13

Total Measure Productivity
Total Measure Productivity = Outputs
Inputs or
= Goods and services produced
All resources used
2-14
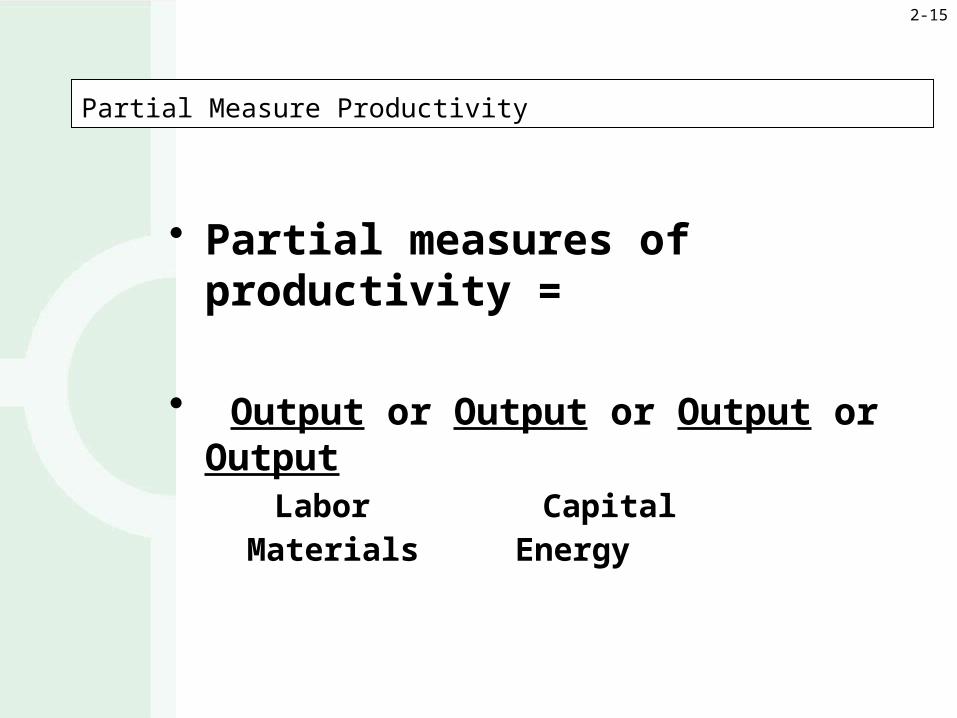
Partial Measure Productivity
• Partial measures of productivity =
• Output or Output or Output or Output Labor Capital Materials Energy
2-15
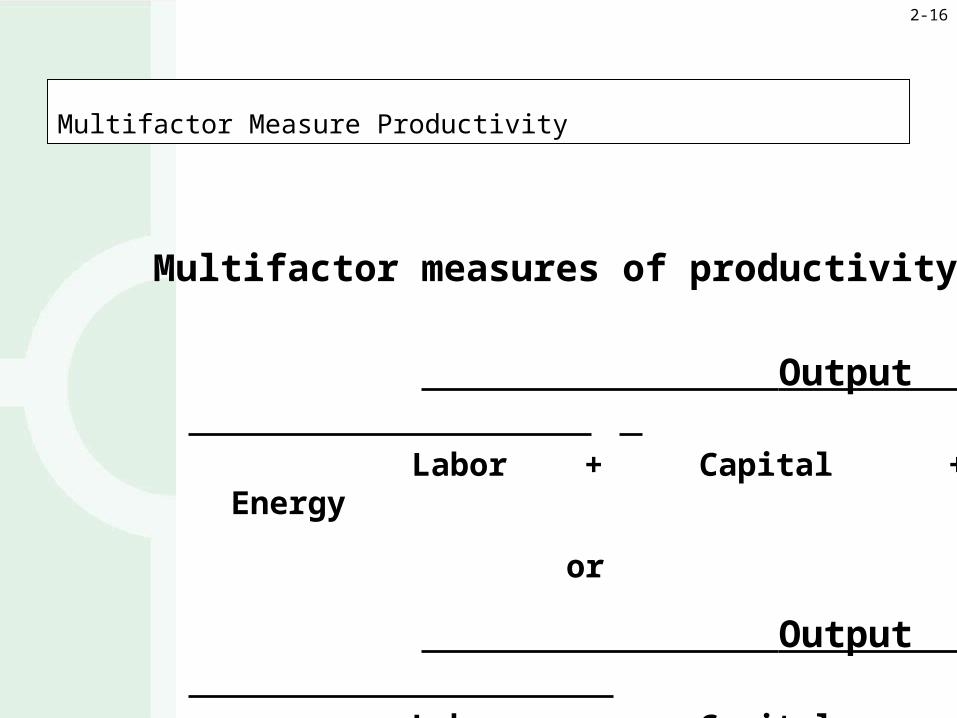
Multifactor Measure Productivity
Multifactor measures of productivity =
Output Labor + Capital + Energy
or
Output Labor + Capital + Materials
2-16
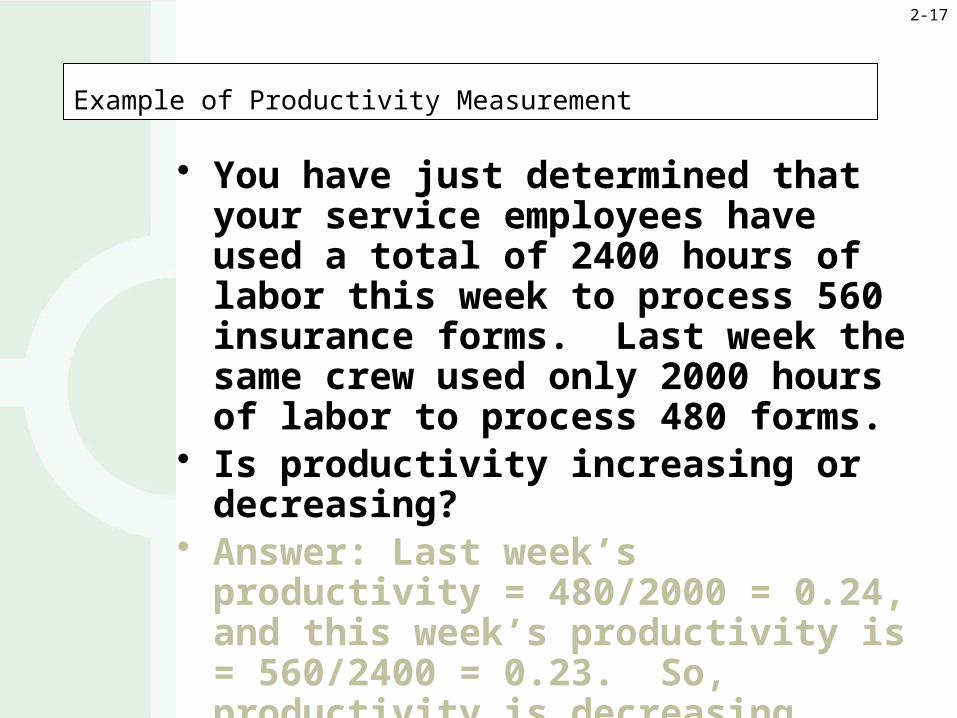
Example of Productivity Measurement
• You have just determined that your service employees have used a total of 2400 hours of labor this week to process 560 insurance forms. Last week the same crew used only 2000 hours of labor to process 480 forms.
• Is productivity increasing or decreasing?
• Answer: Last week’s productivity = 480/2000 = 0.24, and this week’s productivity is = 560/2400 = 0.23. So, productivity is decreasing slightly.
2-17

Productivity Example 1
As operations manager, you are concerned about being able to meet sales requirements in the coming months. You have been given the following production report. Find the average total productivity per month (units per hour).
Jan Feb Mar AprUnits produced 2300 1800 2800 3000Hours workedPer machine 325 200 400 320# of machines 3 5 4 4
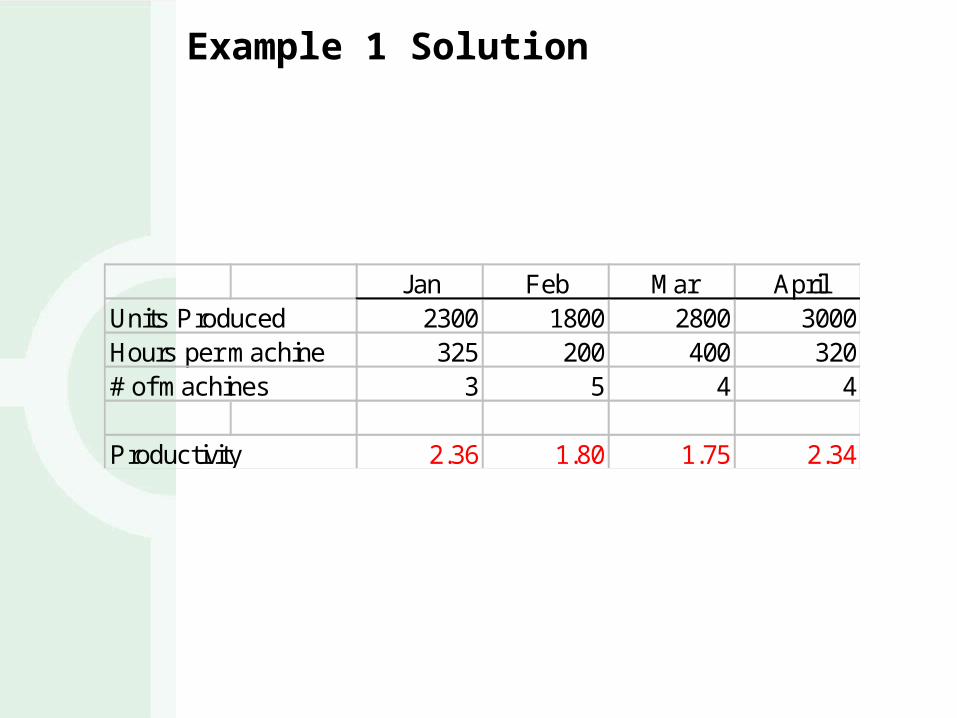
Example 1 Solution
Jan Feb Mar AprilUnits Produced 2300 1800 2800 3000Hours per machine 325 200 400 320# of machines 3 5 4 4
Productivity 2.36 1.80 1.75 2.34

Productivity Example 2
For the previous data set, based on growth in productivity between March and April, how many units can we expect to produce in May, if operating resources for May are the same as they were in April and we experience the same gain in productivity?

Example 2 Solution
Productivity Growth Rate (from Mar to April)PGR = P2-P1/P12.34-1.75/1.75= 33.93%
Therefore, for May 2.34 X 1.3393= 3.13

Productivity Example 3
Lori produces “Final Exam Care Packages” for resale by a sorority. She is currently working a total of 5 hours per day to produce 100 care packages.
a. What is Lori’s productivity?b. Lori thinks that by redesigning the package
she can increase her total output to 133 care packages per day. What would her new productivity be?
c. What will the increase in productivity be if Lori makes the change?
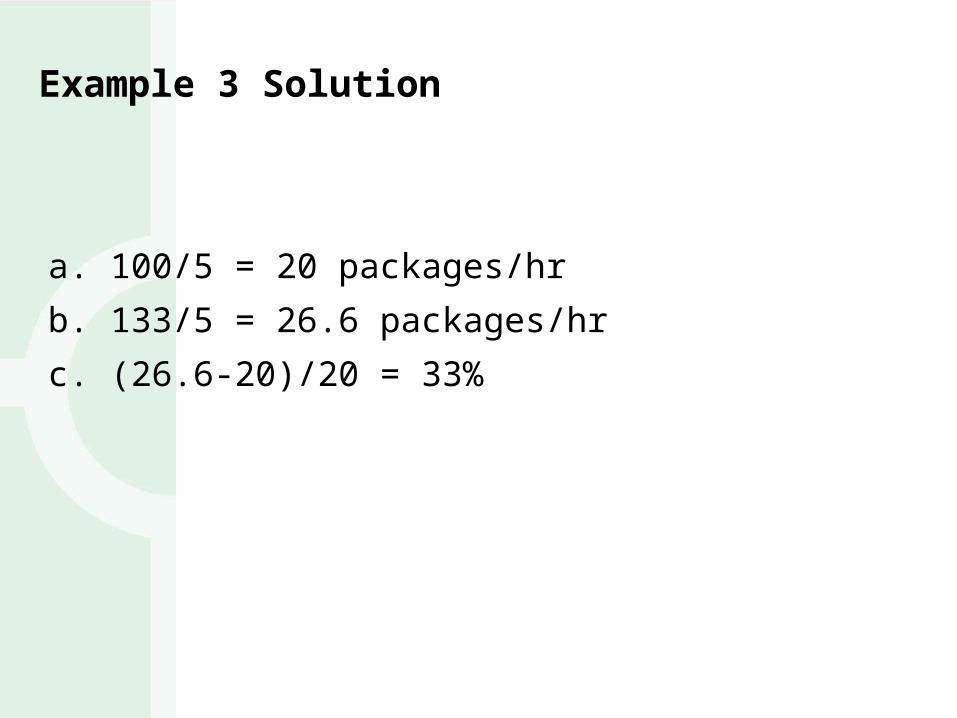
Example 3 Solution
a. 100/5 = 20 packages/hr
b. 133/5 = 26.6 packages/hr
c. (26.6-20)/20 = 33%

End of Chapter 2
2-24