Embed Size (px)
Citation preview
22
CHAPTER 2
Land boundary layer characteristics
The thermal and dynamic interaction between the atmosphere and the underlying
surface occurs through turbulent exchange of momentum, heat and moisture at their
interface. The variation of fluxes of momentum heat and moisture in the surface
boundary layer and their distribution in the rest of the planetary boundary layer play a
vital role in the energy transport mechanism ofthe ocean-atmosphere land system. Over
the Indian region the meteorological features exhibits wide variability during pre
monsoon, onset and post-monsoon periods. Also there is a region to region variation due
to the topography of the region. Therefore the boundary layer characteristics over the
region will also have wide variability spatiallr and during various seasons. Thus the
boundary layer over the region during various periods requires special study. Several
studies were done over the region giving special reference to the monsoon trough region
using the MONTBLEX-90 data. All those studies bring out the variation in the surface
layer parameters, structure of boundary layer etc., during the southwest monsoon period.
The variations that occur in the boundary layer characteristics during various seasons
were not examined well. It was also well known that the synoptic and mesoscale features
and the atmospheric boundary layer have close linkage. Mishra and Salvekar (1980)
produced unstable disturbances by explicit high-resolution integration of the boundary
layer equations within the framework of quasi-geostrophic baroclinic theory. Shukla
(1978) found CISK as an important mechanism for the instability during monsoon.
These studies show the importance of boundary layer on the formation of disturbances.
Only a very few studies are done so far to understand the variations in the characteristics
in the boundary layer during synoptic scale or mesoscale disturbances (Pradhan et al
1994; Pradhan et al 1996; Singh 1992; Sivaramakrishnan et al 1996 etc.). These studies
found that the surface flux increases steeply during development and intensification of
the system and it decreases as it decays or passes away. The boundary layer variations
that occur at different stations when a depression or cyclone is formed either over Bay of
Bengal or over Arabian Sea was not investigated. All the earlier boundary layer studies
associated with the cyclonic system were done as the system passes through the area of
23
study. According to Klinker (1997) in the tropics convection is an important process and
the sensible heat flux shows a high correlation to convective rainfall. Hence deep
convection may influence the surface fluxes. The interplay between thunderstorm and
the boundary layer over the Indian region is not studied weII by the earlier studies.
Therefore in this chapter the variations in the boundary layer fluxes and stability during
the pre-monsoon, onset and post-monsoon seasons at some selected stations over the
subcontinent are examined. Also the variations in association with the formation of
thunderstorms are also obtained. To understand the variations in boundary layer
characteristics at different stations over the subcontinent during the formation of
depressions or cyclones either over Bay of Bengal or over Arabian Sea the surface fluxes
and stability parameter are computed at various stations during the occurrence of a
monsoon depression.
Materials and Methods
The daily values of surface momentum, sensible heat and latent heat fluxes and
stability parameter during April, May, June and October, November, December are
obtained indirectly by the profile method for five years from 1984 to 1988 for three west
coast stations Bombay, Mangalore and Trivandrum. Computations are performed using
the daily surface observations of wind and temperature taken at oourc by the India
Meteorological Department. The thunderstorm data and the associated rainfall in
millimeters during the pre-monsoon and post-monsoon at Trivandrum are taken from the
Indian Daily Weather Report to study the variations in surface layer characteristics during
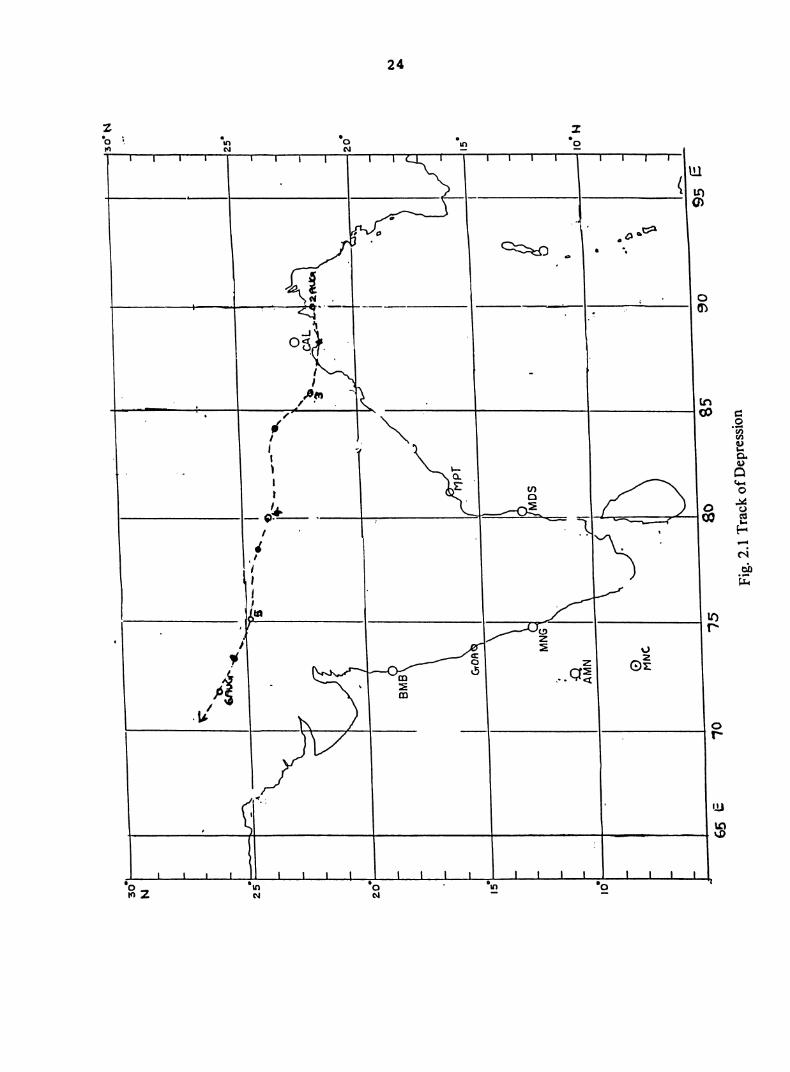
thunderstorms. The variations in surface layer features in association with the depression
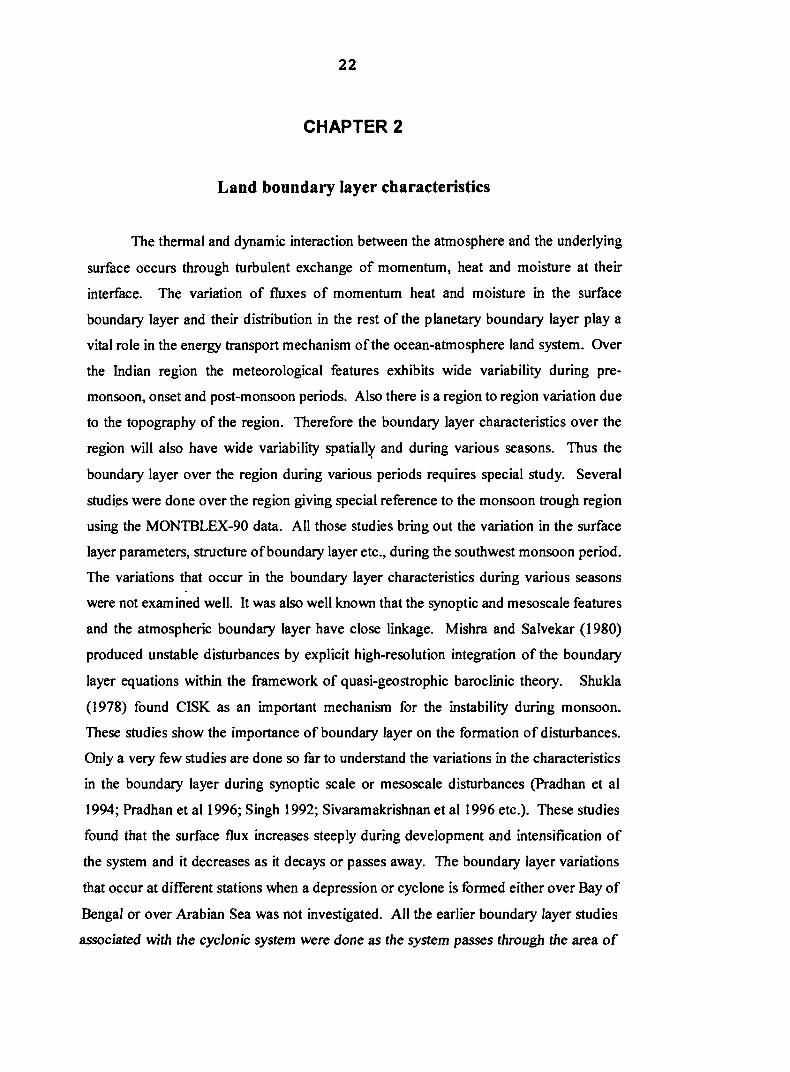
formed during "August 2- 6 over the Bay of Bengal at some selected stations are also
obtained. The stations selected are (fig. (2.1» Calcutta (CAL), Masulipatnam (MPn,
Madras (MDS), Amini (AMN), Minicoy (MNC), Mangalore (MGL), Goa (GOA) and
Bombay (BMB).
The surface fluxes of momentum can be obtained using the profile method which
is an indirect method based mainly on Monin- Obukhov similarity theory. The wind
profile, temperature profile and specific humidity profile in the surface layer can be
described as (Dyer and Hicks 1970; Businger et al 1971)
~0.1
1'0· ..
.
125
•
~,
I ~ ...
,I -,
I '-..
'Pi
---
-...
_ ...
~ .. -.
---
5 Y
... _
__
'.
" I
r' ..-
1=
V=
, .
'1--
zo.1
{ t!!,L
'
;1..,
120 •
/
1St
I -.-
~, !
. !F
. I
~
IO.t
aN
I \
>.Jj
.
\ .'
66 e
10
o MN
C.
75
Fig
. 2.1
Tra
ck o
f Dep
ress
ion
N ..
25
(2.1)
(2.2)
(2.3)
where ~u = U2 - Ut, UI and U2 are winds at levels 1 and 2 respectively, ~9 = 92 - 91 is the
difference in temperature at levels 1 and 2 respectively and ~q = q2 - ql is the difference
in specific humidity at levels 1 and 2 respectively. u. is the frictional velocity, 9. is the
temperature scale and q. is the humidity scale, \IIm and \IIh are the stability functions
associated with wind and temperature respectively. l; = :zJL is the stability parameter,
where Z = Z2 - ZI is the difference in height of the two levels I and 2. Z2 is taken at 10m
height which is the height at which surface winds are measured and ZI is the roughness
length Zo where u is zero. The roughness length is obtained following Delsol et al (1971)
using the expression
Zo = 0.15 + 0.2(236.8 + 18.42hilO·s (2.4)
The temperature at the earth's surface is obtained by solving the energy balance equation
and that at 10m is obtained by linearly interpolating the observed surface temperature to
that level.
The surface energy balance can be expressed as
where Sw,l.. is incoming short wave radiation, Lw,l.. is longwave radiation flux into the
ground, (l the surface albedo which is taken as 0.15, O'Ts is the outgoing longwave
radiation where 0' is the Stefan-Boltzman constant. Fs and FI are the fluxes of sensible
and latent heat respectively which are obtained using stability dependent bulk
aerodynamic formula and Go is the soil moisture flux. The surface temperature is
obtained by solving the equation using the software by Krishnamurty (1986). The frrst
guess for Ts is assumed to be the air temperature at the lowest observation level. The
data used for the computation of ground temperature is the upper air radiosonde data at
26
OOUTC obtained from the India Meteorological Department. The saturated specific
humidity at the surface is taken as the specific humidity at the surface. The computed
ground temperature is compared with the NCEP reanalysis ground temperature data and
both are found to be in good agreement.
L is the Monin Obukhov length given by
- 2 L = Tu. 1 g k e. (2.6)
R=0.74 is the ratio of eddy diffusivities in the neutral limit, k=OA, the Von Karman
constant.
The stability functions can be written as (Paulsen 1970, Barker and Baxter 1975)
In the unstable condition (l; <0)
\Vm(l; ) = In ((1 +x2 )/2) + 2ln ((1 +x)1 2) - 2arc tanx + 7tl2 (2.7)
and
\Vh(l;) = 2 In((1 +y)/2) (2.8)
where x=( 1-15l;)1/4 andy=( 1-9l;)112 (2.9)
In stable condition (l; > 0)
\Vm= -4.7l; (2.10)
and
\Vh = -4.7l; IR (2.11 )
The frictional velocity U., the temperature scale e. and humidity scale q. are computed
iteratively. First a large value was assumed for Land u. and e. are computed in neutral
27
limits. L is then recomputed using the computed u. and 9. according to equation (2.6).
Then u. and 9. are recomputed using equation (2.1) and (2.2) with the new L. Again L is
recomputed with the recomputed u. and 9. and this process is repeated until L does not
change in desired accuracy limits.
The surface momentum flux is computed as
t = pu. 2
Surface sensible heat flux is given by
And surface latent heat flux can be expressed as
(2.12 )
(2.13)
(2.14)
where p is the density of air which does not have much variation in the layer considered
and is taken as 1.25xl03 kgm-3, Cp is the coefficient of specific heat capacity at constant
pressure and Le is the latent heat of evaporation/condensation.
Results and discussion
Variation in surface Duxes during pre-monsoon, onset and post-monsoon periods
a) Momentum Dux
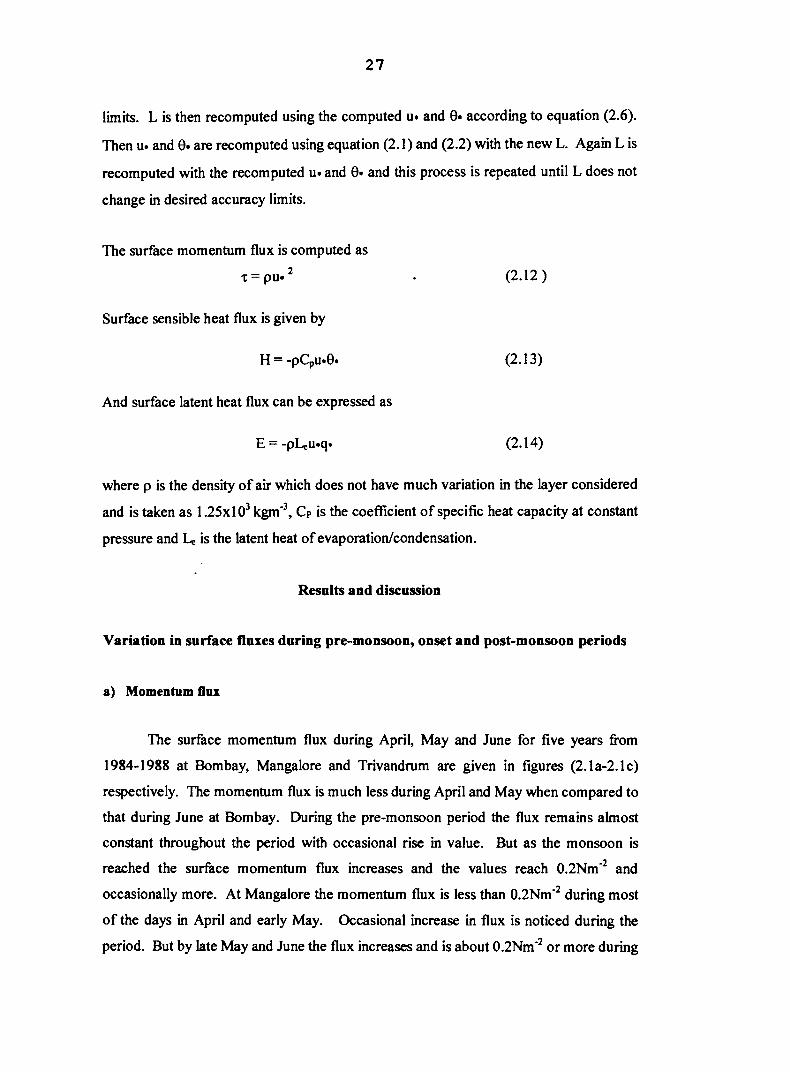
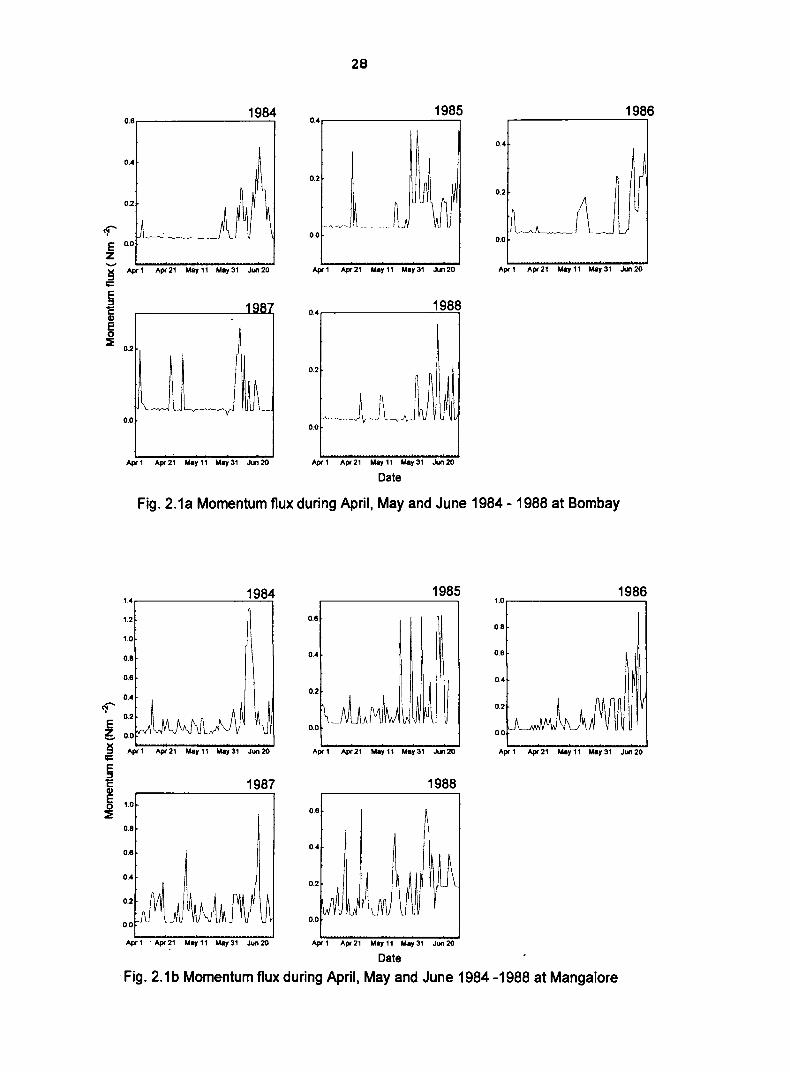
The surface momentum flux during April, May and June for five years from
1984-1988 at Bombay. Mangalore and Trivandrum are given in figures (2.1 a-2.1 c)
respectively. The momentum flux is much less during April and May when compared to
that during June at Bombay. During the pre-monsoon period the flux remains almost
constant throughout the period with occasional rise in value. But as the monsoon is
reached the surface momentum flux increases and the values reach O.2Nm-2 and
occasionally more. At Mangalore the momentum flux is less than O.2Nm-2 during most
of the days in April and early May. Occasional increase in flux is noticed during the
period. But by late May and June the flux increases and is about O.2Nm-2 or more during
1984 0.8,....-----------'-=--=-;
o.~
0.2
cf"" E 0.0
z ~ Aprl
t;::
~ Gl
5 ::il 0.2
0.0
Apr21 May 11 May 31 Jun 20
Apr 1 Apr 21 May 11 May 31 Jun 20
28
1985 O.~r----------,
",J 0.0
Apr 1 Apr 21 May 11 May 31 Jun20
1988 0.4.----------'..::....::...,
0.2
~.l-jLh) ~I 0.0
Aprl Apr21 May 11 May 31 Jun20
Date
1986
o.~
0.0
Aprl Apr 21 May 11 May 31 Jun 20
Fig. 2.1a Momentum flux during April, May and June 1984 -1988 at Bombay
E ~
1984 1.~.------------'-=-='-i
1.2
1.0
0.8
0.8
o.~
~ Apr 1 Apr 21 May 11 May 31 Jun 20
E ~ 1987 Gl
~ 1.0
0.8
0.8
o.~
Apr 1 . Apr 21 May 11 May 31 Jun 20
1985 1986 1.0.-------------,
0.8 0.8
O.~ 0.8
0.4
0.2
0.0
Aprl Apr21 May 11 May 31 Jun20 Aprl Apr21 May 11 May 31 Jun20
1988
0.8
O.~
Apr 1 Apr 21 May 11 May 31 Jun 20
Date
Fig. 2.1b Momentum flux during April, May and June 1984 -1988 at Mangalore
29
1984 1985 1986 1.8
2.2 1.0
2.0 1.4
1.8 1.2 0.8 1.8
1.4 1.0 0.8 1.2
0.4
V I~ ~ v.lt .-. 0.2
N
'E 0.0
z .{J.2 "pr 1 "pr 21 May 11 May 31 Jun 20 "pr 1 "pr 21 May 11 May 31 Jun20 "pr 1 "pr 21 May 11 M.y31 Jun20
~ ;;:::
E 1987 1988 :::J c 1.8 \I) 1.0 E 1.4 0 ~ 1.2 0.8
1.0 0.8
0.8
0.0
lip< 1 "pr 21 May 11 May 31 Jun 20 "pr 1 "pr 21 May" May 31 Jun 20
Date
Fig. 2.1 c Momentum flux during April, May and June 1984 - 1988 at Trivandrum
1984 1985 1986 o.3r---------..., 0.4.-------------,
0.8
0.2 0.4
0.2
0.1 0.2 ~ A ,-__ JIJ IftIcAJJ
E 0.0
Z 0&.~1~Od:.-.:2~1 ~Nov~1:'!'0-N::-0'I ... 30=-=-Dec-=2O:-.I. Od 1 Od 21 Nov 10 Nov 30 Dec 20 Od 21 No. 10 No.30 Dec 20
~ ;;:::
E :::J C 0.2.-------------,
1987 1988 \I)
E o 0.4
~
0.2
0.0
O&. 1 Od 21 Nov 10 Nov 30 Dec 20 Od 1 Od 21 No. 10 NO'I 30 Dec 20
Date
Fig. 2.2a Momentum flux during Oct.-Dec. 1984 - 1988 at Bombay
30
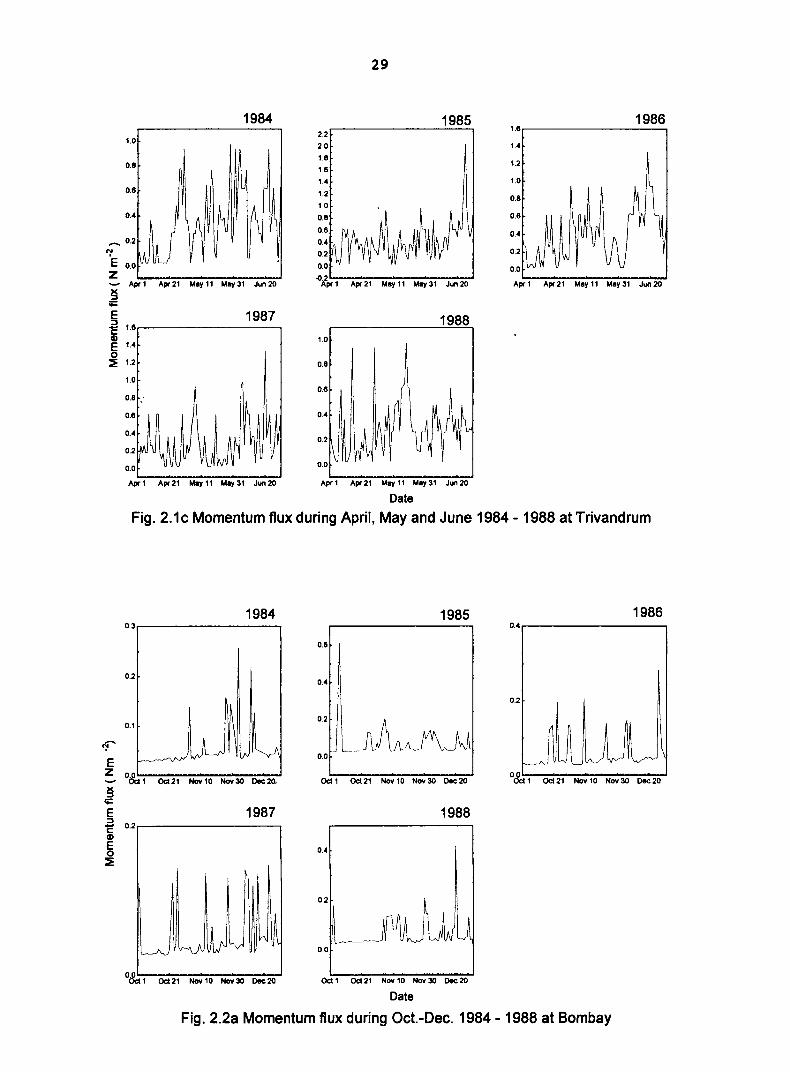
most of the days. At Trivandrum high flux is noticed in most ofthe days much before the
onset of monsoon and very high flux transport occurs after the monsoon is reached over
the station in June. Comparing the magnitudes of the surface momentum flux at the three
stations, high flux values are noticed at Trivandrum. Mangalore is having higher fluxes
when compared to that at Bombay. Therefore as the monsoon flow approaches the station
there is an increase in surface momentum flux. The increase is due to the increase in
surface winds in association with the monsoon onset. The observed wind speed at
Trivandrum is higher than the other two stations hence higher fluxes are noticed at the
station.
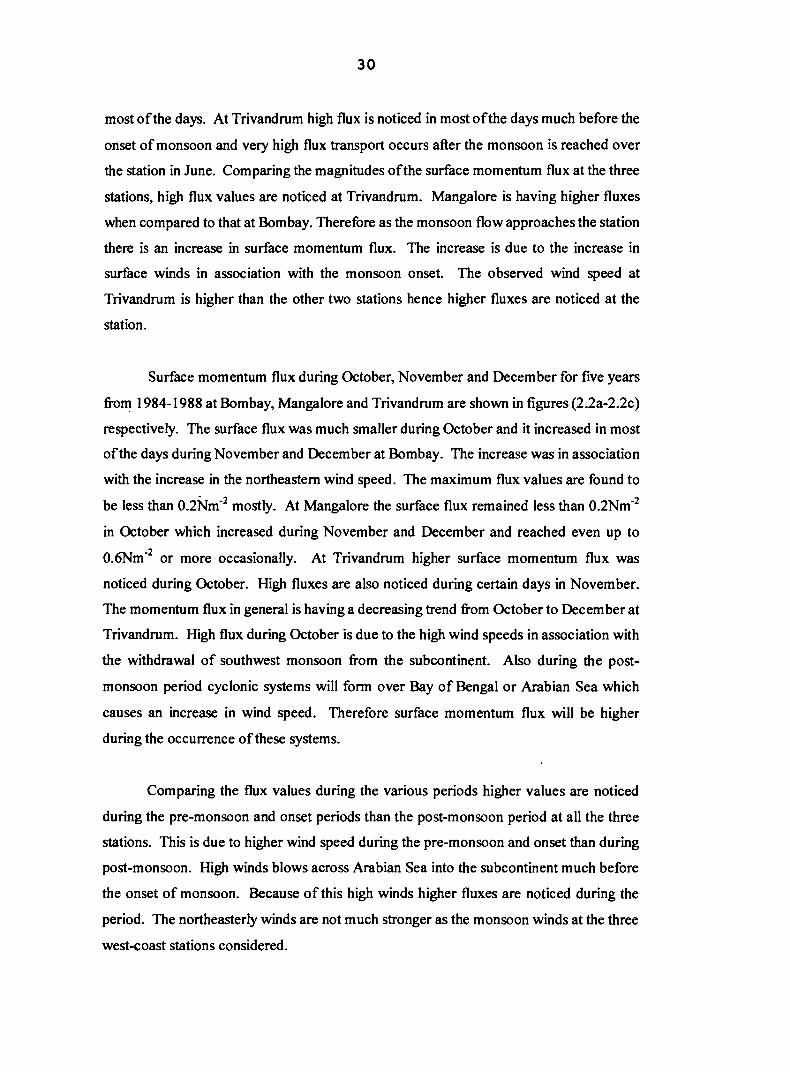
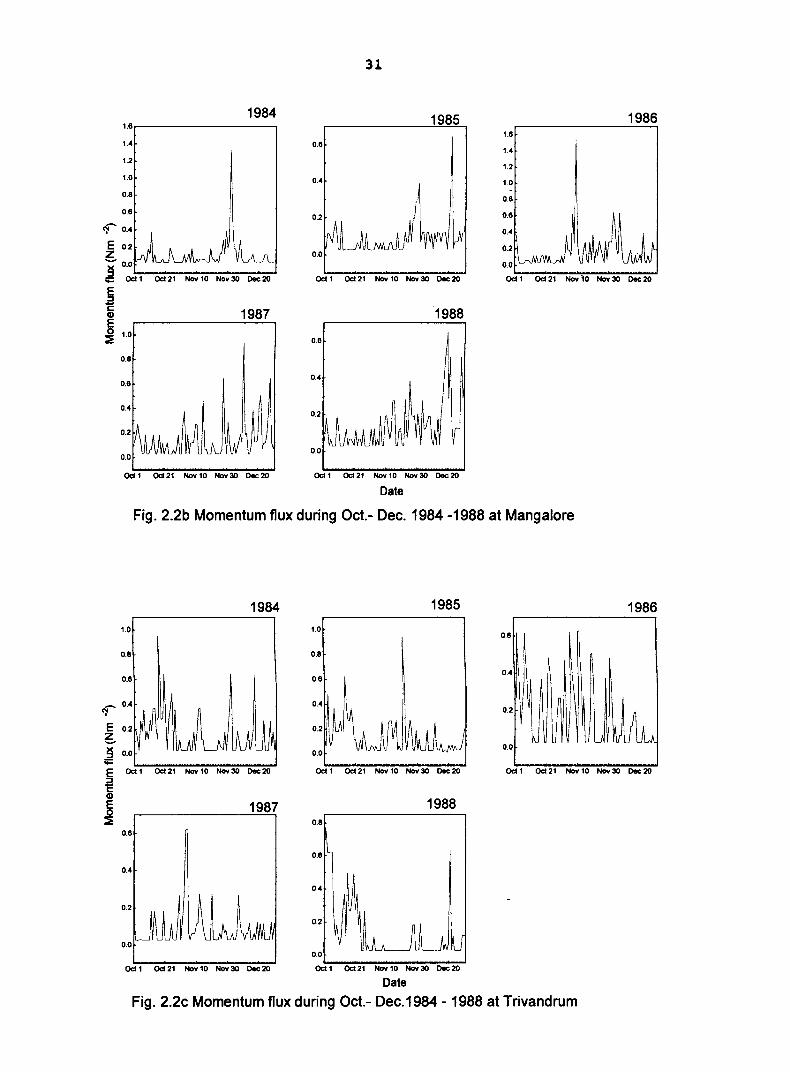
Surface momentum flux during October, November and December for five years
from 1984-1988 at Bombay, Mangalore and Trivandrum are shown in figures (2.2a-2.2c)
respectively. The surface flux was much smaller during October and it increased in most
of the days during November and December at Bombay. The increase was in association
with the increase in the northeastern wind speed. The maximum flux values are found to
be less than O.2Nm-2 mostly. At Mangalore the surface flux remained less than 0.2Nm-2
in October which increased during November and December and reached even up to
O.6Nm-2 or more occasionally. At Trivandrum higher surface momentum flux was
noticed during October. High fluxes are also noticed during certain days in November.
The momentum flux in general is having a decreasing trend from October to December at
Trivandrum. High flux during October is due to the high wind speeds in association with
the withdrawal of southwest monsoon from the subcontinent. Also during the post
monsoon period cyclonic systems will form over Bay of Bengal or Arabian Sea which
causes an increase in wind speed. Therefore surface momentum flux will be higher
during the occurrence ofthese systems.
Comparing the flux values during the various periods higher values are noticed
during the pre-monsoon and onset periods than the post-monsoon period at all the three
stations. This is due to higher wind speed during the pre-monsoon and onset than during
post-monsoon. High winds blows across Arabian Sea into the subcontinent much before
the onset of monsoon. Because of this high winds higher fluxes are noticed during the
period. The northeasterly winds are not much stronger as the monsoon winds at the three
west-coast stations considered.
31
1984 1985 1.6 1.6
1.4 0.6 1.4
1.2 1.2
1.0 0.4 1.0
0.8 0.8
0.6
1"' 0.4
E 0.2 Z ~!L 0.0 i 0.0
;0:: OcIl 0cI21 Novl0 Nov3O Dec20 OcIl 0cI21 Nov 10 Nov3O Dec20 OcIl 0cI21 Novl0
E ::J c 1987 1988 Cl)
E 0 1.0
::::!: 0.6
0.8
0.4 0.8
0.4
0.0
OcIl 0cI21 Nov 10 Nov 30 Dec 20 OcIl 0cI21 Nov 10 Nov 30 Dec 20
Date
Fig. 2.2b Momentum flux during Oct.- Dec. 1984 -1988 at Mangalore
1.0
0.8
0.8
1"' 0.4
E 0.2
e ~ I;:
1984 1985 1.0
0.8
O.S
0.4 O.S
0.4 0.2
0.2
0.0 0.0
1986
Nov3O Dec20
1986
E OcIl 0cI21 Nov 10 Nov 30 Dec 20 OcIl 0cI21 Nov 10 Nov 30 Dec 20 OcIl 0cI21 Novl0 Nov3O Dec20
~ Cl)
E o ::!:
1987 1988 0.8
O.S
O.S
0.4
0.4
0.2
0.0 0.0
OcIl 0cI21 Nov 10 Nov 30 Dec 20 0cI':-:1:--0cI~2~1 ~NOV:"'":"!10:-:":Nov~3O:-:::Dec~20:.-I
Date
Fig. 2.2c Momentum flux during Oct.- Dec.1984 - 1988 at Trivandrum
32
b) Sensible heat nux
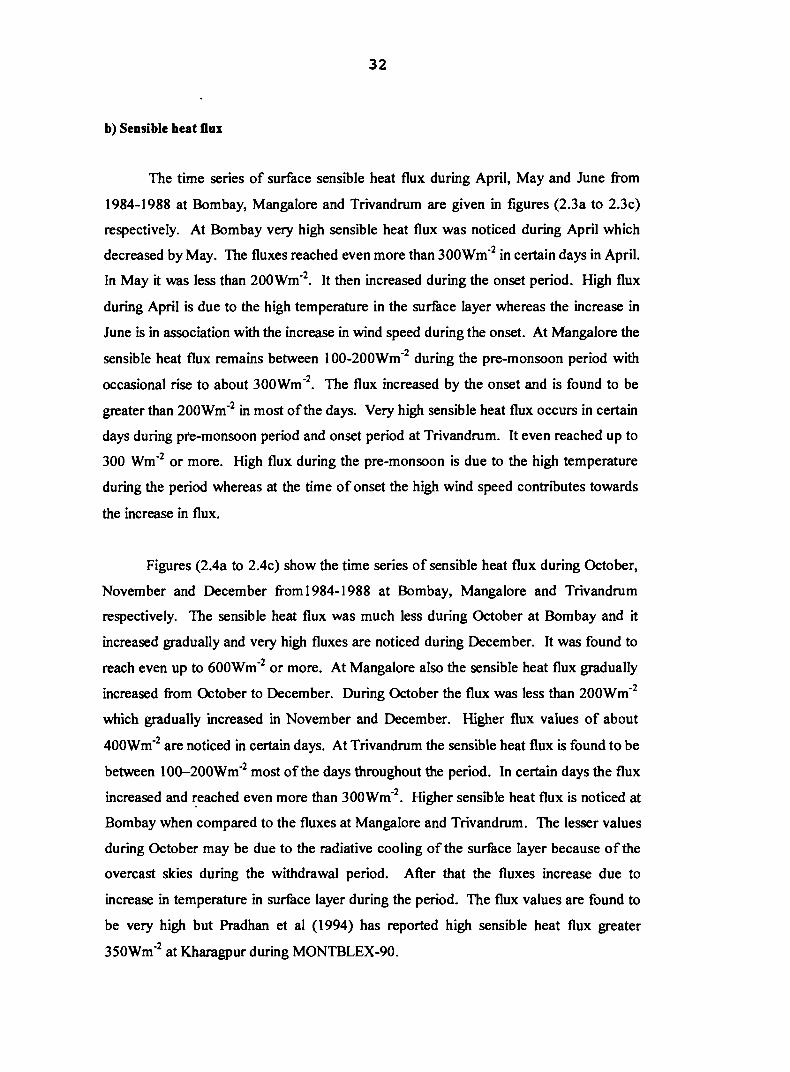
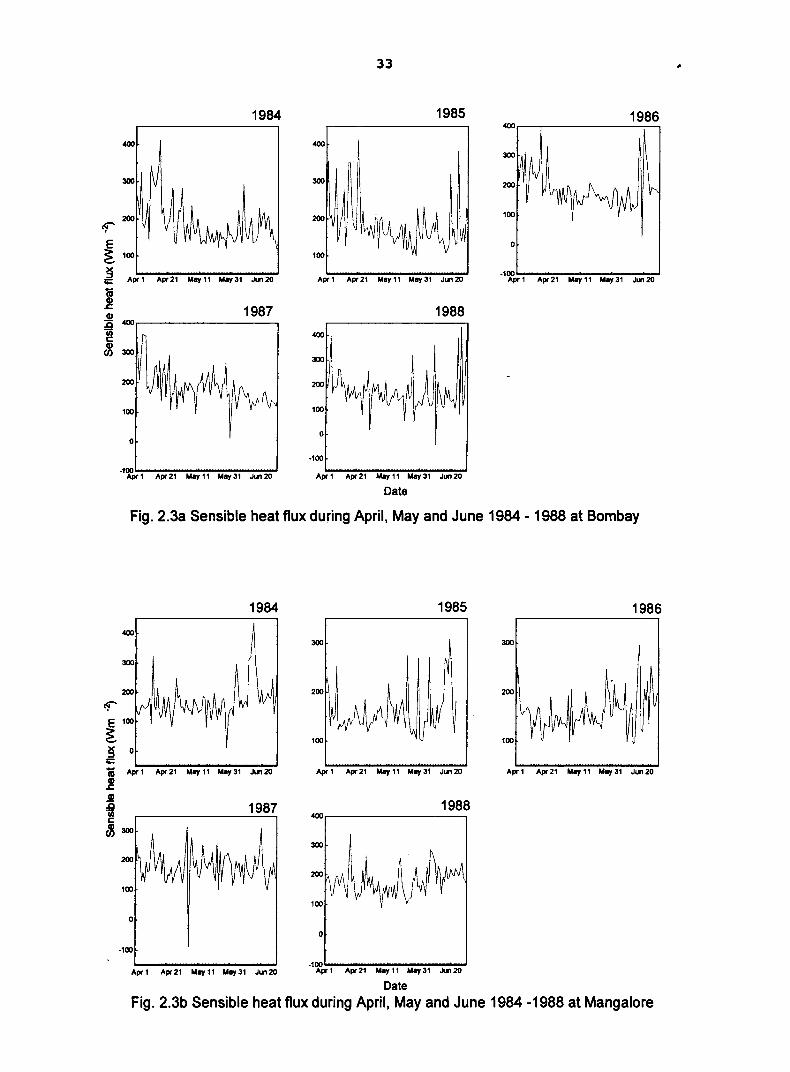
The time series of surface sensible heat flux during April, May and June from
1984-1988 at Bombay, Mangalore and Trivandrum are given in figures (2.3a to 2.3c)
respectively. At Bombay very high sensible heat flux was noticed during April which
decreased by May. The fluxes reached even more than 300Wm-2 in certain days in April.
In May it was less than 200Wm-2• It then increased during the onset period. High flux
during April is due to the high temperature in the surface layer whereas the increase in
June is in association with the increase in wind speed during the onset. At Mangalore the
sensible heat flux remains between 1 00-200Wm -2 during the pre-monsoon period with
occasional rise to about 300Wm-2• The flux increased by the onset and is found to be
greater than 200Wm-2 in most ofthe days. Very high sensible heat flux occurs in certain
days during pte-monsoon period and onset period at Trivandrum. It even reached up to
300 Wm-2 or more. High flux during the pre-monsoon is due to the high temperature
during the period whereas at the time of onset the high wind speed contributes towards
the increase in flux.
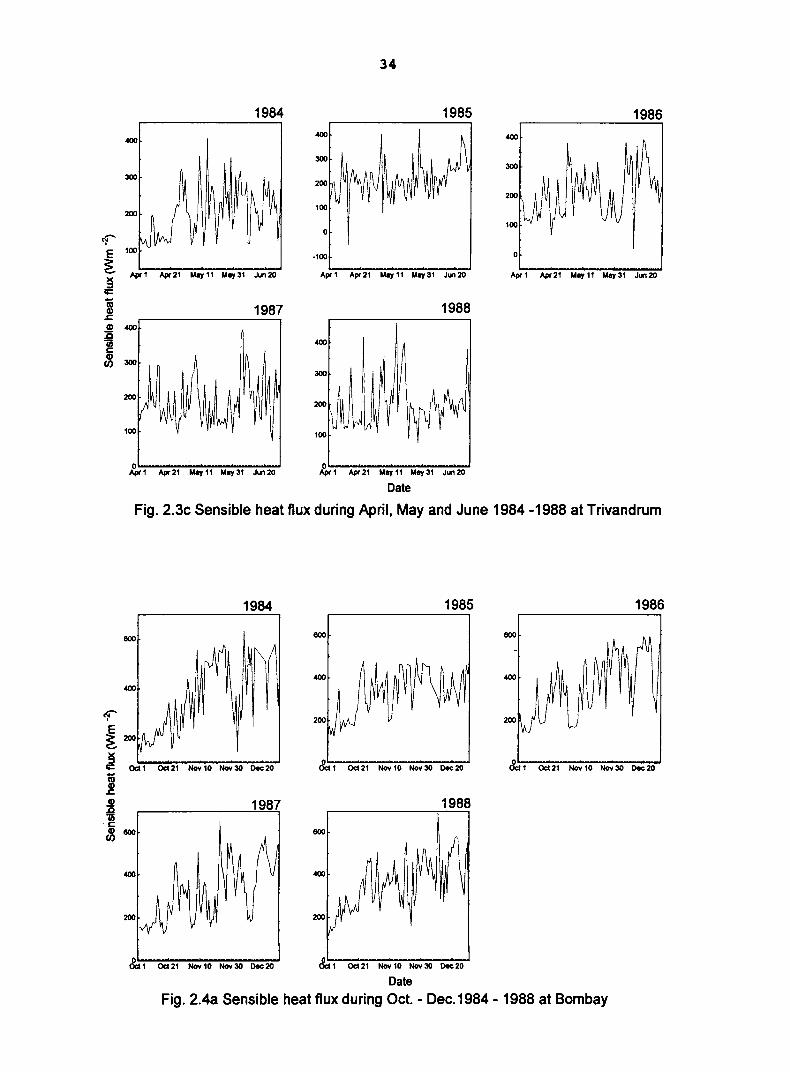
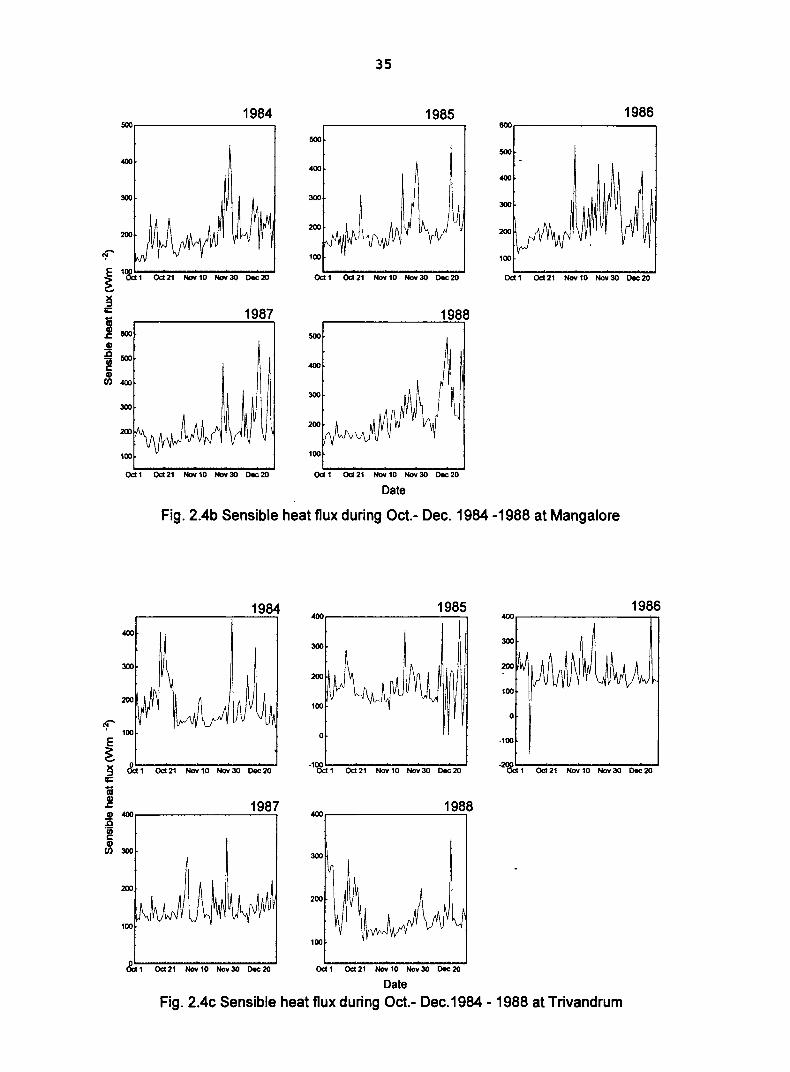
Figures (2.4a to 2.4c) show the time series of sensible heat flux during October,
November and December from 1984-1988 at Bombay, Mangalore and Trivandrum
respectively. The sensible heat flux was much less during October at Bombay and it
increased gradually and very high fluxes are noticed during December. It was found to
reach even up to 600Wm-2 or more. At Mangalore also the sensible heat flux gradually
increased from October to December. During October the flux was less than 200Wm-2
which gradually increased in November and December. Higher flux values of about
400Wm-2 are noticed in certain days. At Trivandrum the sensible heat flux is found to be
between 100--200Wm-2 most of the days throughout the period. In certain days the flux
increased and ~eached even more than 300Wm-2• Higher sensible heat flux is noticed at
Bombay when compared to the fluxes at Mangalore and Trivandrum. The lesser values
during October may be due to the radiative cooling of the surface layer because of the
overcast skies during the withdrawal period. After that the fluxes increase due to
increase in temperature in surface layer during the period. The flux values are found to
be very high but Pradhan et al (1994) has reported high sensible heat flux greater
350Wm-2 at Kharagpur during MONTBLEX-90.
1984
300
~ 100
~ Apr~1~A~pr"=21~May~1':""1 "':':M:-'ay"=3':""1 -:J-un~2O:-I
1 1987 ~ .oo~--------------~ ~ Cl) 00300
o
33
1985 1986 'OOr--r------------~~
300
o
Apr 1 Apr 21 May 11 May 31 Jun 20
1988
300
o
-100
Apr 1 Apr 21 May 11 May 31 Jun 20
Date
Fig. 2.3a Sensible heat flux during April, May and June 1984 - 1988 at Bombay
1984 1985 1986
300 300
200
yv~ 100
- Aprl Apr21 May 11 May 31 Ju120 Aprl Apr21 May 11 May 31 Jun20 III Apr 1 Apr 21 May 11 May 31 Jun 20
.! J! 1988 .ll 1987 .i/5 400 c ~300
300
o o
-100
Aprl Apr21 May 11 May 31 Jun20 -lOO~~~~"'"""!"."-:-:.-~~""=",
Apr 1 Apr21 May 11 May 31 Jun 20
Date
Fig. 2.3b Sensible heat flux during April, May and June 1984 -1988 at Mangalore
<f' E ~ ~ I;:
1ii ID ~
..!! Jl 'in c ID
Cl)
1ii ID s::. J! .c 'jjj 'c
ID Cl)
1984
100
Apr1 Apr21 May 11 May 31 Jun20
1987 400
41 Apr21 May 11 May 31 Jun20
34
1985
100
0
·100
Apr1 Apr21 May 11 May 31 Jun20
1988
400
300
41 Apr21 May 11 May 31 Jun20
Date
1986
o
Apr 1 Apr 21 May 11 May 31 J.., 20
Fig. 2.3c Sensible heat flux during April, May and June 1984 -1988 at Trivandrum
1984 1985 1986
eoo eoo
&11 0
Od1 Od 21 No.10 Nov30 Dec20 Od 21 Nov 10 Nov30 Dec20 Od1 Od 21 Nov10 Nov30 Dec20
1987 1988
eoo eoo
Od 21 Nov 10 Nov 30 Dec 20
Date
Fig. 2.4a Sensible heat flux during Oct. - Dec.1984 - 1988 at Bombay
35
1984 1985 1986 500.-------------, 800,---------.
500
500
400 400
300 300
100
Od 21 Now 10 Nov 30 Oec 20 Odl Od21 Now 10 Nov 30 Oec 20 Odl Od21 Nov 10 Noy 30 Oec 20
1987 1988 500
400
300
100
Odl Od 21 Nov 10 Nov 30 Oec 20 Odl Od 21 Nov 10 Nov 30 Oec 20
Date
Fig. 2.4b Sensible heat flux during Oct.- Dec. 1984 -1988 at Mangalore
1984
400
300
l' 100
E ~ ~ &. 1 Od 21 Nov 10 Now 30 Dec 20 ~
j 1987 ~ 400.---------~ .c .~
~300
100
&;j 1 Od 21 Nov 10 Nov 30 Oec 20
1985 1986 4OOr--------~ 4OOr---------;~
300 300
o
o ·100
.1~l.-l---'0d'"""""""21~N""'0Y-10"""NO-Y"'30"""Dec"""'20...I .~ 1 Od 21 Noy 10 Nov 30 Dec 20
Odl Od 21 Nov 10 Nov 30 Dec 20
Date
Fig. 2.4c Sensible heat flux during Oct.- Dec.1984 - 1988 at Trivandrum
36
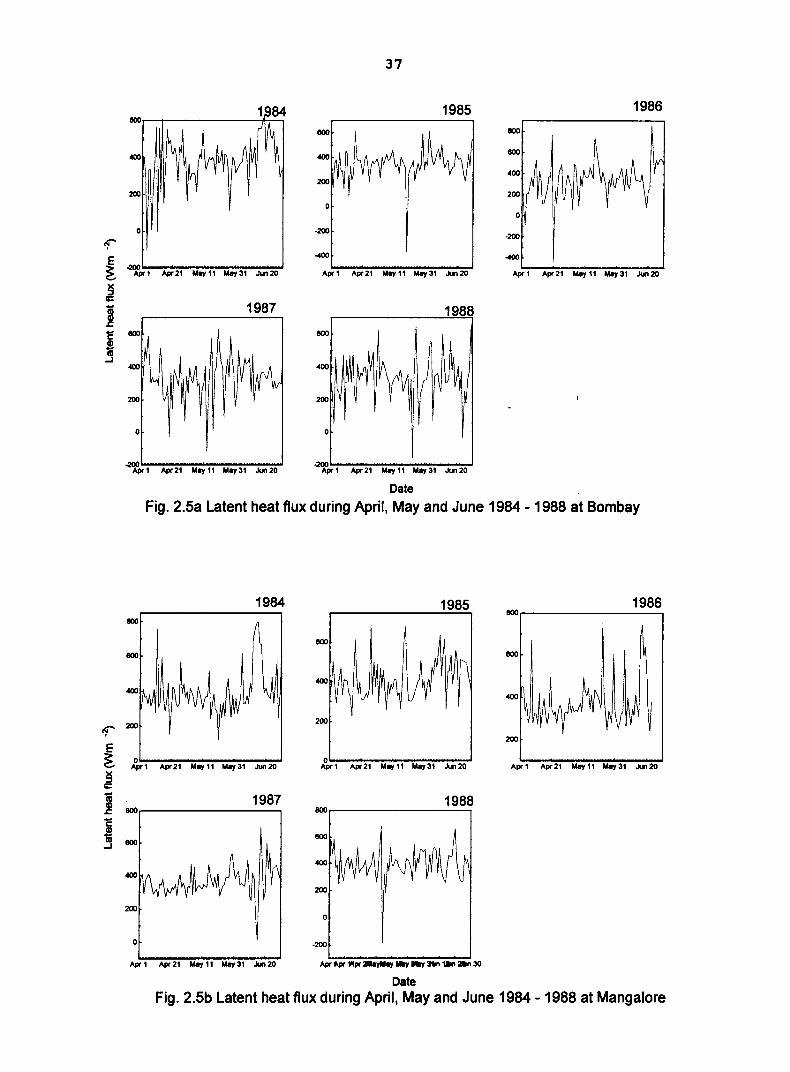
c) Latent heat Dux
The time series of latent heat fluxes at Bombay, Mangalore and Trivandrum
during Atlri\ to June, 1984-\988 is given in figures (2.Sa to 2.Sc) respectively. The latent
neat \\U'k \\unt\~ t\\e ~t\OO at ~mba'j v-i'C)S ~out\\\ \0 be be\v.leet\ 'l,)\)-,~\)\) ~ m'l v-i\\\\
occasional rise. In certain da)'s the flux values were less than 2S0Wm·'l and downward
flux was noticed occasionally. Higher fluxes are noticed during late May and June,
which is during the onset of southwest monsoon. At Mangalore the latent heat fluxes
during April and May remain more or less constant and the range is found to be around
300-400Wm -2. By monsoon onset high fluxes are noticed at the station and it may reach
up to 650Wm-2• At Trivandrum very high fluxes are noticed in certain days during the
pre-monsoon months. By the monsoon onset the fluxes are very high. The flux may
reach up to 75QWm-2• The higher fluxes are due to increase in wind speed during the
period in association with the onset. Higher fluxes are noticed at Trivandrum when
compared to Bombay and Mangalore. This is because of the high-speed winds at the
station. The surface latent heat flux is generally higher during the onset period.
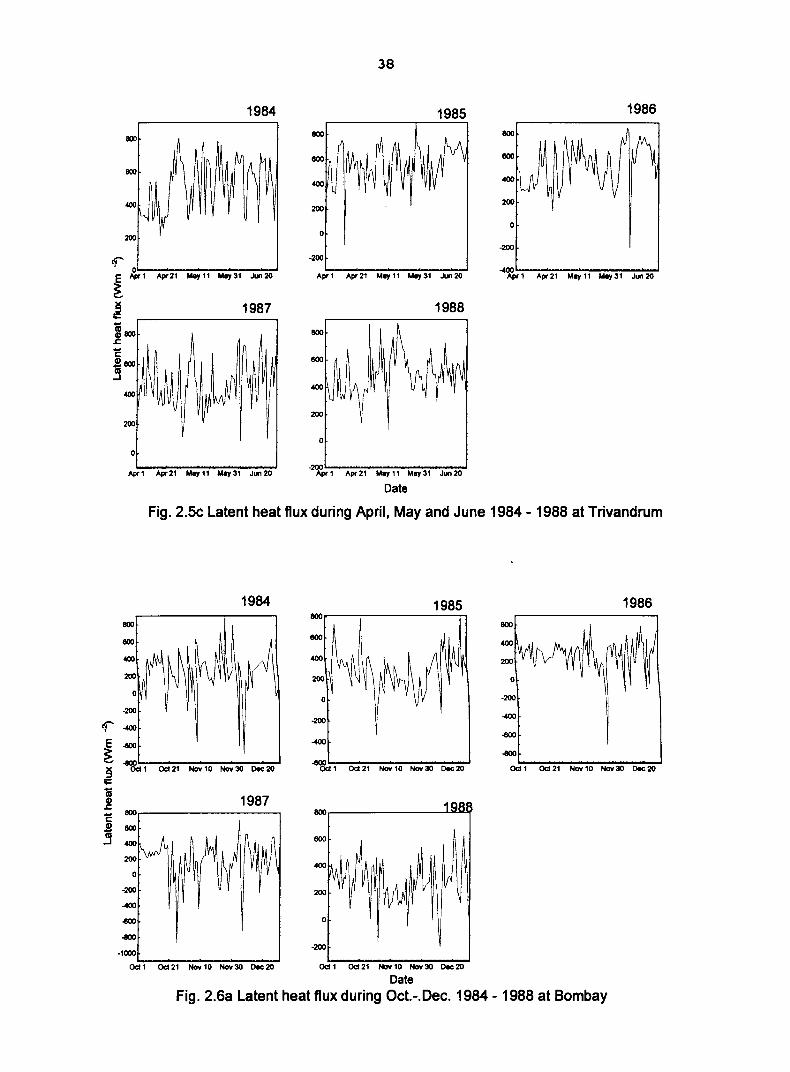
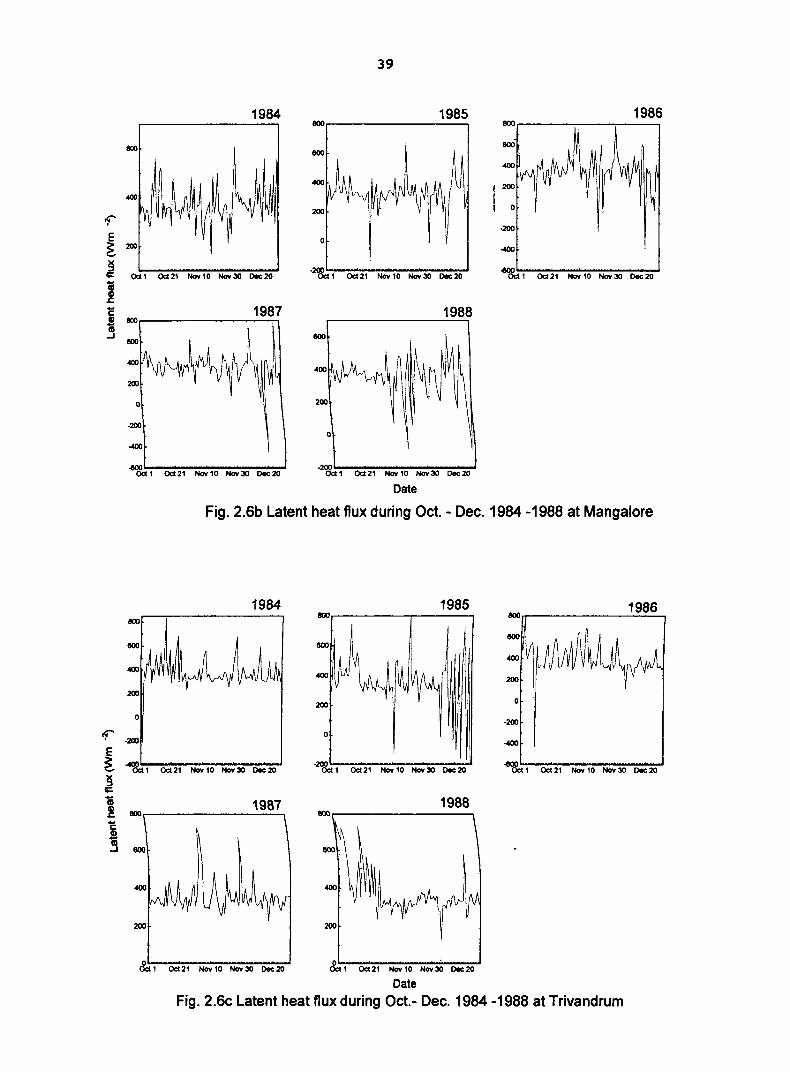
Figures (2.6a to 2.6c) shows the time series oflatent heat fluxes during October,
November and December, from 1984-1988 at Bombay, Mangalore and Trivandrum
respectively. At Bombay during the post-monsoon periods higher fluxes are noticed
during October. After that the fluxes decreased and downward fluxes were noticed in
certain days. Very high fluxes are noticed occasionally which may be due to the
occurrence of disturbances. At Mangalore during October the flux remained almost
constant, which was about 300-400Wm-2• After that lesser flux values are noticed and
downward flux transport occurs in certain days during November and December. At
Trivandrum higher fluxes were noticed during the month of October. After that during
November and December it remained almost constant and is found to be around
300Wm -2. In certain days very high fluxes are noticed which is due to the disturbances
during the period. Therefore in the post-m on soon periods the latent heat flux is found to
decrease from October to December. Higher fluxes during October are due to the higher
winds and rainfall activity in association with the withdrawal of southwest monsoon.
After October the rainfall activity is very less therefore there will be less moisture
37
1985 1986 IlOO
800
800
200
0
0
l' -200
-200
E -<lOO -<lOO
~ ~
Aprl Apr21 M8Yll M8Y31 Jun20 Aprl Apr21 M8Y 11 M8Y31 ...... 20 Aprl Apr21 M8Y 11 M8Y31 ...... 20
~ I;: - 1987 1988 1\1
~ 'E IlOO 800
S 1\1 .J
o o
~1 Apr21 M8Y11 M8Y31 Jun20 ~~--~----------~ Apr 1 Apr21 M8Y 11 M8Y 31 ...... 20
Date
Fig. 2.5a Latent heat flux during April, May and June 1984 - 1988 at Bombay
1984 1985 1986 800,----------------,
800
800
200 et;'
200 E ~ 0 0
Aprl Apr21 M8Y 11 M8Y31 Jun20 Aprl Apr21 M8Y 11 M8Y31 Jun20 Aprl Apr21 M8Y 11 M8Y31 Jun20
~ I;: - 1987 1988 ~ 800 800
'E ! 800 .J
200
200 0
0 -200
Aprl Apr21 M8Y 11 M8Y31 ...... 20 Apr apt lIIpr:llleyMay ..., lily ... 1111 an 30
Date Fig. 2.5b Latent heat flux during April, May and June 1984 - 1988 at Mangalore
1984
200
o
Aprl Apr21 May 11 May 31 Jun20
38
1985 BOO
200
o
-200
Apr 1 Apr 21 May 11 May 31 Jun 20
1988
o
-~L.:l~A:-pr'".:2~1 '"'!M~ay-l~1-:M~ay-:3:':"1--:-Jun"":2::--10
Date
1986
200
o
-200
Fig. 2.Sc Latent heat flux during April, May and June 1984 - 1988 at Trivandrum
800
-200
1""-400
1984
i~ ~ ~~1~0cI~2~1 '"'!N~OV~l~O '"'!Nov~3O~Dec~2O~ ;:
iii ~ 1987 1: BOO,-----------,
~ BOO
-400
~
~
-1000
1985 BOO~-~-------n
eoo
-200
BOO.-------~~~
eoo
o
-200
0cIL..l~0cI~21~Nov~10~Nov~3O~Dec~2O~ OcIl 0cI21 Nov 10 Nov 30 Dec 20
Date
1986
-200
~
0cII:-l~0cI~2~1 -:N~OV ... l:=O-Nov~3O~=-Dec ... 2O=-'
Fig. 2.6a Latent heat flux during Oct.-.Dec. 1984 - 1988 at Bombay
39
1984 1985 1986 8OOr---------------~
600
<f' -200
~200 o
~ t;:: Od 1 Od 21 Nov 10 Nov 30 Dec20 ~"'."1 ~Od~21~Nov-l0~Nov~3O"""""'Dec--2O-I -~~I~Od~2~1 ~N-0¥-1"'."0~Nov~3O~Dec~2~0
J 1987 1988
800
o
-200 o
~ 1 Od 21 Nov 10 Nov 30 Dec 20 ~ 1 Od 21 Nov 10 NO¥ 30 Dec 20
Date
Fig. 2.6b Latent heat flux during Oct. - Dec. 1984 -1988 at Mangalore
1984 1985 1986 800 800
800
800 800
400
200
200
200 0
0 -200
<f' 0 ·200 -400
E ~ ~1 Od 21 Nov 10 Nov3O Dec20 -~1 Od21 NO¥ 10 Nov3O Dec20 ~1 Od 21 Nov 10 Nov 30 Dec 20
~ t;::
I 1988 800 800
c; !l C\J ~
200
&'i 1 Od 21 NO¥ 10 Nov 30 Dec 20 &t'!-:I~Od~21~Nov~10~N"'0¥~3O~Dec~2O~
Date
Fig. 2.6c Latent heat flux during Oct.- Dec. 1984 -1988 at Trivandrum
40
available at the surface for evaporation hence lesser values and downward transport is
noticed. The sensible heat flux is found to increase at Bombay and Mangalore during the
post-monsoon period whereas the latent heat flux is decreased. But during the onset
period at all the three stations the sensible heat and latent heat fluxes increase. This
shows that the monsoon activity influences the surface boundary layer characteristics by
increasing the surface fluxes.
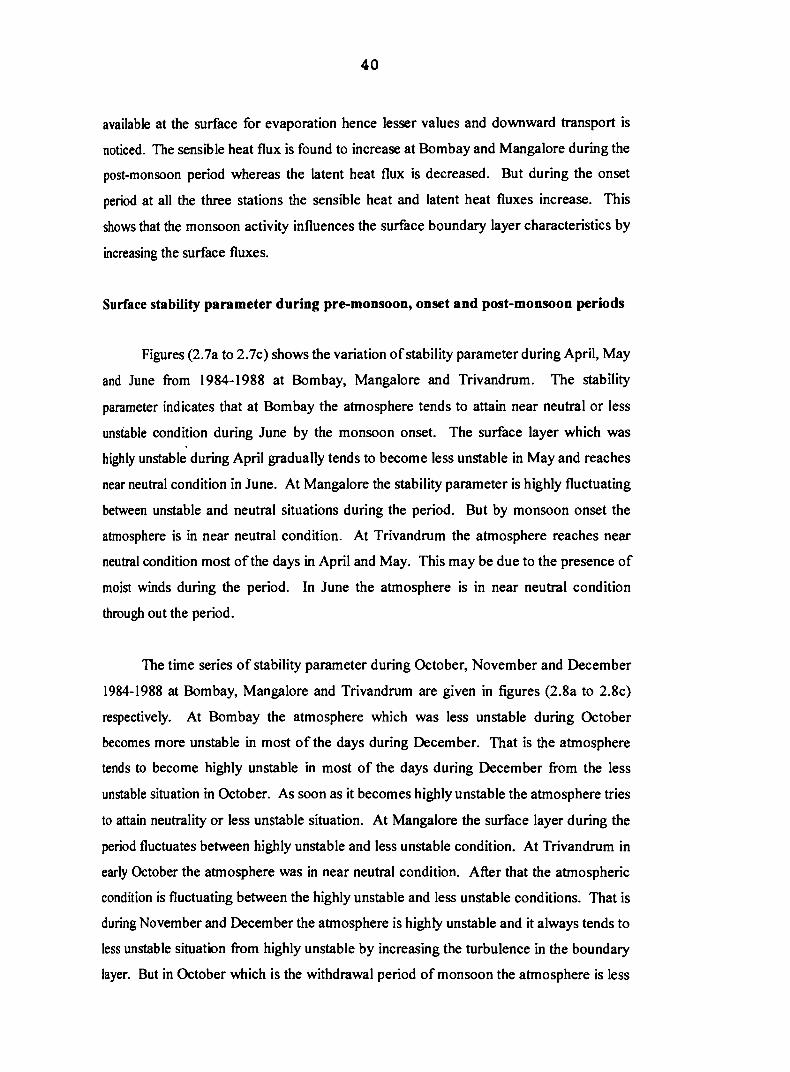
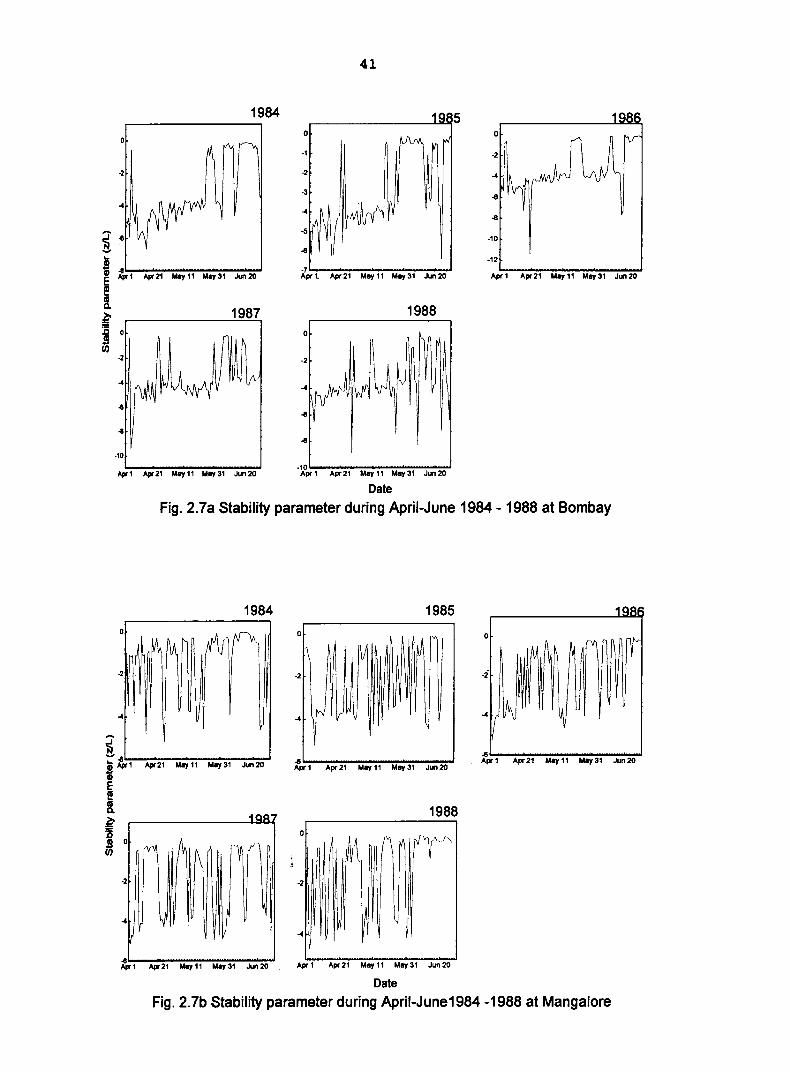
Surface stability parameter during pre-monsoon, onset and post-monsoon periods
Figures (2.7a to 2.7c) shows the variation of stability parameter during April, May
and June from 1984-1988 at Bombay, Mangalore and Trivandrum. The stability
parameter indicates that at Bombay the atmosphere tends to attain near neutral or less
unstable condition during June by the monsoon onset. The surface layer which was
highly unstable during April gradually tends to become less unstable in May and reaches
near neutral condition in June. At Mangalore the stability parameter is highly fluctuating
between unstable and neutral situations during the period. But by monsoon onset the
atmosphere is in near neutral condition. At Trivandrum the atmosphere reaches near
neutral condition most ofthe days in April and May. This may be due to the presence of
moist winds during the period. In June the atmosphere is in near neutral condition
through out the period.
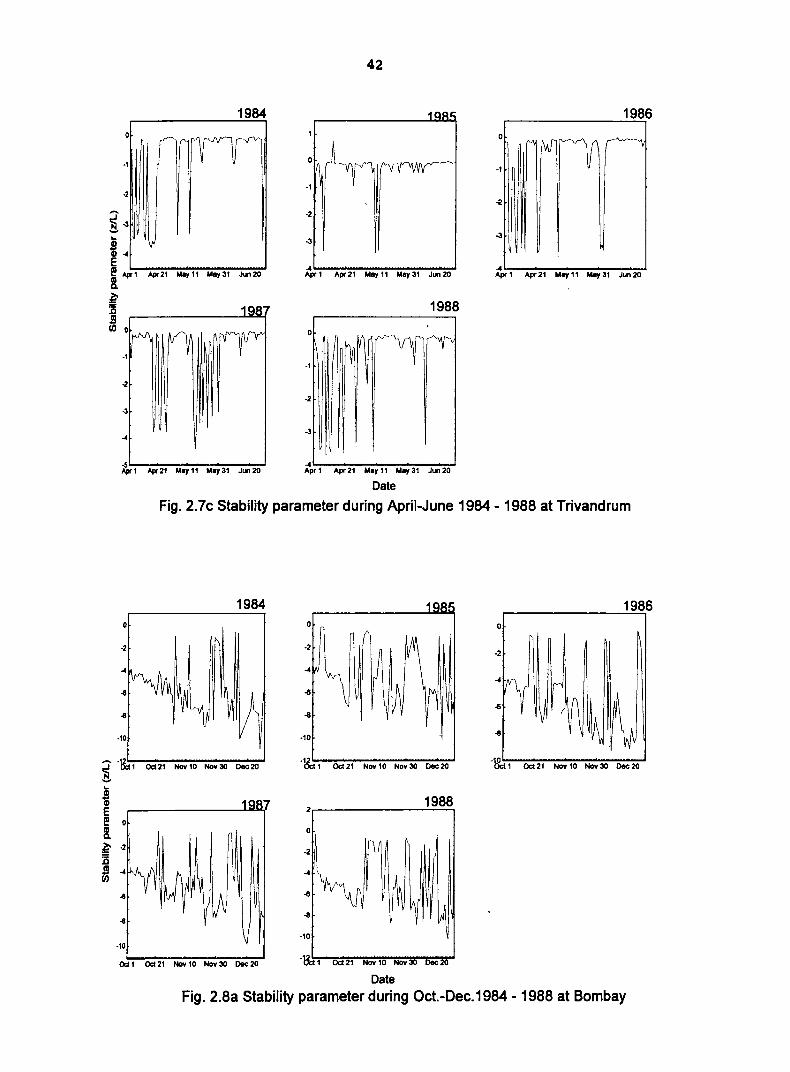
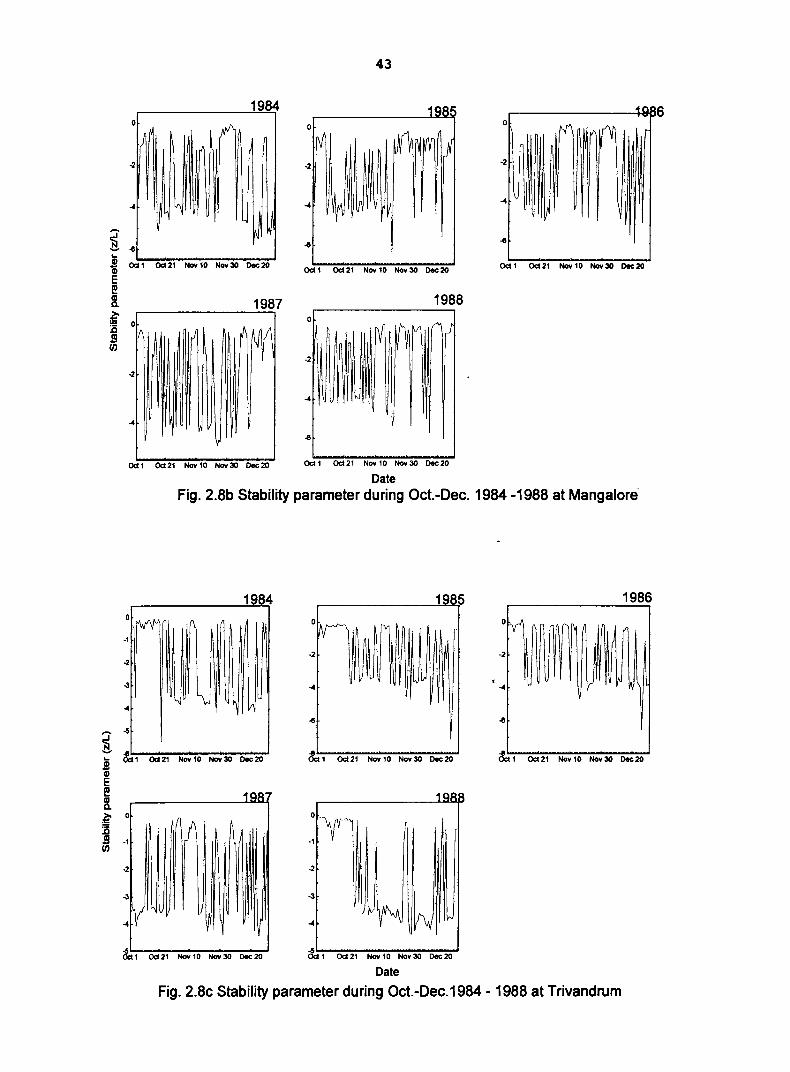
The time series of stability parameter during October, November and December
1984-1988 at Bombay, Mangalore and Trivandrum are given in figures (2.8a to 2.8c)
respectively. At Bombay the atmosphere which was less unstable during October
becomes more unstable in most of the days during December. That is the atmosphere
tends to become highly unstable in most of the days during December from the less
unstable situation in October. As soon as it becomes highly unstable the atmosphere tries
to attain neutrality or less unstable situation. At Mangalore the surface layer during the
period fluctuates between highly unstable and less unstable condition. At Trivandrum in
early October the atmosphere was in near neutral condition. After that the atmospheric
condition is fluctuating between the highly unstable and less unstable conditions. That is
during November and December the atmosphere is highly unstable and it always tends to
less unstable situation from highly unstable by increasing the turbulence in the boundary
layer. But in October which is the withdrawal period of monsoon the atmosphere is less
1984
-2
Apt 21 May 11 MIIJ 31 Jun 20
1987
·10
Aprl Apt 21 May 11 MIIJ 31 Jun 20
41
r-____________ ~5 o
·1
·2
-3
·7~-------......I "pr t "pr 21 MIIJ 11 MIIJ 31 Jun 20
1988 o
.10~-~~ __ ~~~,=", "pr 1 "pr 21 May 11 May 31 Jun 20
Date
·10
·12
~--------------~ "pr 1 "pr 21 May 11 MIIJ 31 Jun 20
Fig. 2.7a Stability parameter during April-June 1984 - 1988 at Bombay
1984 1985 1981
o o (V
-2 ·2 ·i
~~--~~~~~~~~ "pr 1 "pr 21 MlIJll MIIJ31 Jun20
~~~~~~~~--~~ "pr 1 "pr 21 MIIJ 11 MIIJ 31 Jun 20
1988 o
·2 ·2
4-1 Apt 21 May 11 MIIJ 31 Jun 20 "pr 1 "pr 21 MIIJ 11 MIIJ 31 Jun 20
Date
Fig. 2.7b Stability parameter during April-June1984 -1988 at Mangalore
1984
·1
·2
~~ ! \fJ GI ... E i Aprl "",21 MlIJll MllJ31 Jun20
~ :s ! (/) 0
·1
·2
41 "",21 MlIJll MIIJ31 J..,2O
42
1986 o
·1
1988
o
·1
·2
~
... ~----~~~~~~ Apr 1 Apr 21 May 11 MIIJ 31 Jun 20
Date
Fig. 2.7c Stability parameter during April-June 1984 - 1988 at Trivandrum
1984
·2
·10
;I .12'1 ~ Od Od 21 Nov 10 Nov 30 Dec 20
..... ... ~ E I! 0
~ ~ ·2
:s ! ... If)
·10
Odl Oct21 Nov 10 Nov 30 Dec20
1986 o o
·2 ·2
·10
.&;j 1 0cI21 Nov 10 Noy 30 Dec 20
1988 2,----------------,
o
·10
·3!i1 0cI21 Nov 10 Nov 30 Dec 20
Date
Fig. 2.8a Stability parameter during Oct.-Dec. 1984 - 1988 at Bombay
43
1984 198f 401:16
0 ;vi' 0 0
f'II "'(\f rv ~ W jI )
-2 -2 -2
~ ~ ~ ~~ ~ ~ .e .e
... .!! CD
Oct I 0cI21 Nov 10 Nov 30 Dec20 Oc\ I Oc\21 Nov 10 Nov3O Dec20 Oc\ I Oc\ 21 Nov 10 Nov 30 Dec 20
E I!! !l 1987 1988 ~ 0
0
N V)~ f"',J :0 t!f\ J!I I/)
-2
-2
~
Oct I 0cI21 Nov 10 Nov 30 Dec 20 Oc\ I Oc\ 21 No.l0 Nov 30 Dec 20
Date Fig. 2.8b Stability parameter during Oct.-Dec. 1984 -1988 at Mangalore'
1984 0rw"f -I
~
-6
~ ~~~~~=-' ... ~ I 0cI21 Nov 10 Nov 30 Dec 20
~ E I!! !l ~ 0
il J!I -I I/)
-2
~y
1Q8~
&;i I 0cI21 Nov 10 Nov 30 Dec 20
1985
-2 -2
-<4
Oc\ 21 Nov 10 No.3O Dec 20
1QBB 0_
--vyv~
-I
-2
-3
-<4
Date
Fig. 2.8c Stability parameter during Oct.-Oec.1984 - 1988 at Trivandrum
1986
44
unstable or in near neutral condition. Thus the activity of the monsoon has got profound
influence on the surface layer stability. Therefore all the activities in the surface layer,
particularly the exchange processes do get influenced by monsoon activity.
In general at the three stations considered the surface layer becomes less unstable
or near neutral by the onset ofmonsoon. This is because of the presence of moist winds
and radiative cooling of the surface layer due to overcast sky during onset period. The
less unstable situation during October is also because of the moist winds and radiative
cooling of the surface during the withdrawal period of monsoon. During the pre
monSoon and post-monsoon months when usually clear sky conditions prevail the
atmosphere becomes highly unstable. Whenever the atmosphere becomes highly unstable
it soon tries to attain less unstable situation. This is achieved by increasing the turbulence
and therefore the turbulent fluxes. When the atmosphere becomes highly unstable the
surface turbulence increases and the turbulent fluxes are increased so that the atmosphere
attains less unstable condition. High fluxes are noticed soon after the atmosphere is • highly unstable so that less unstable situation is attained.
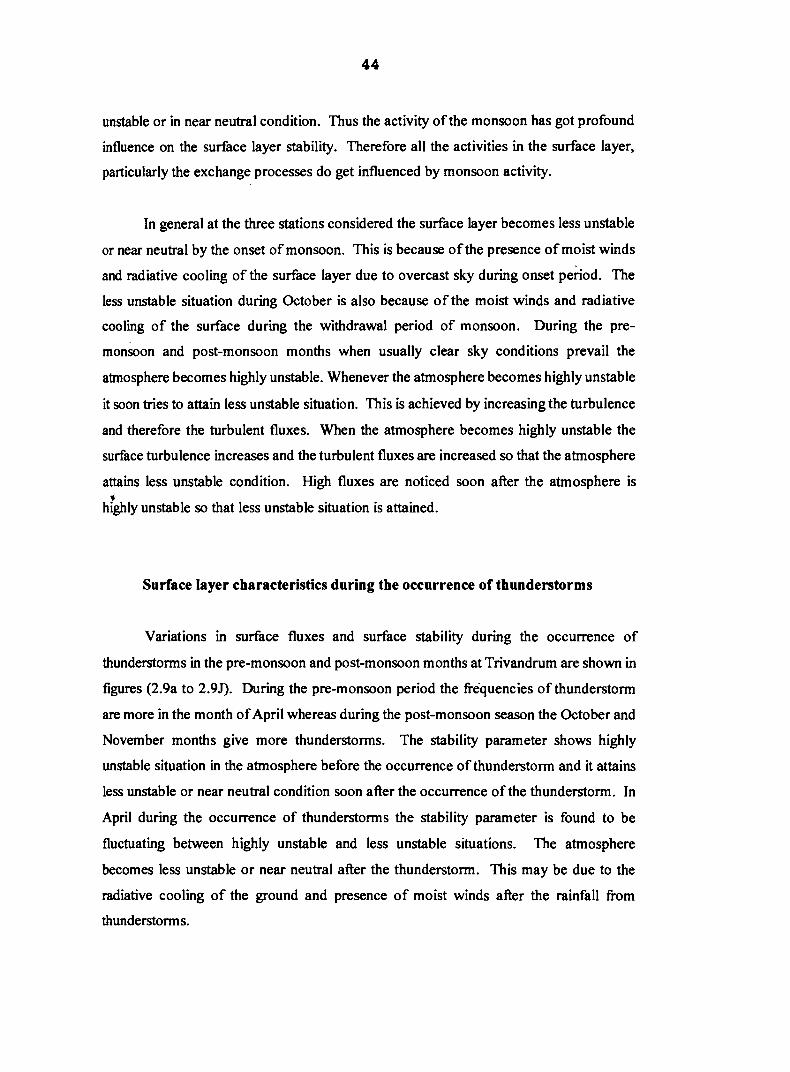
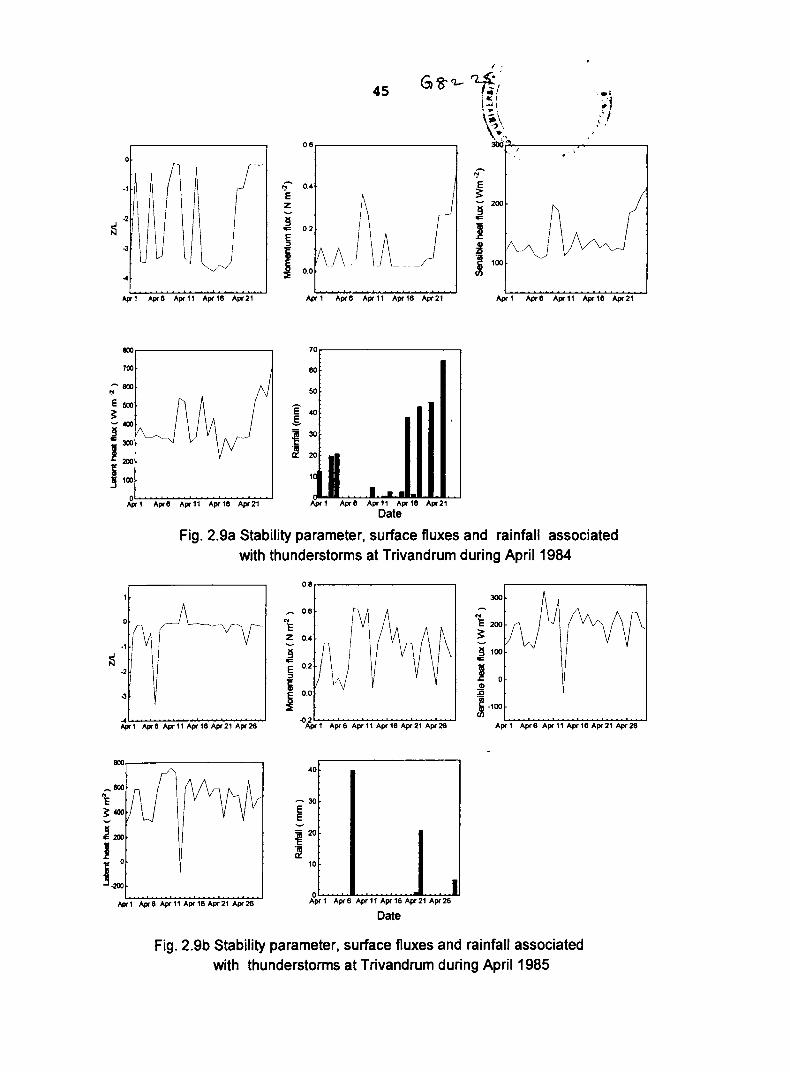
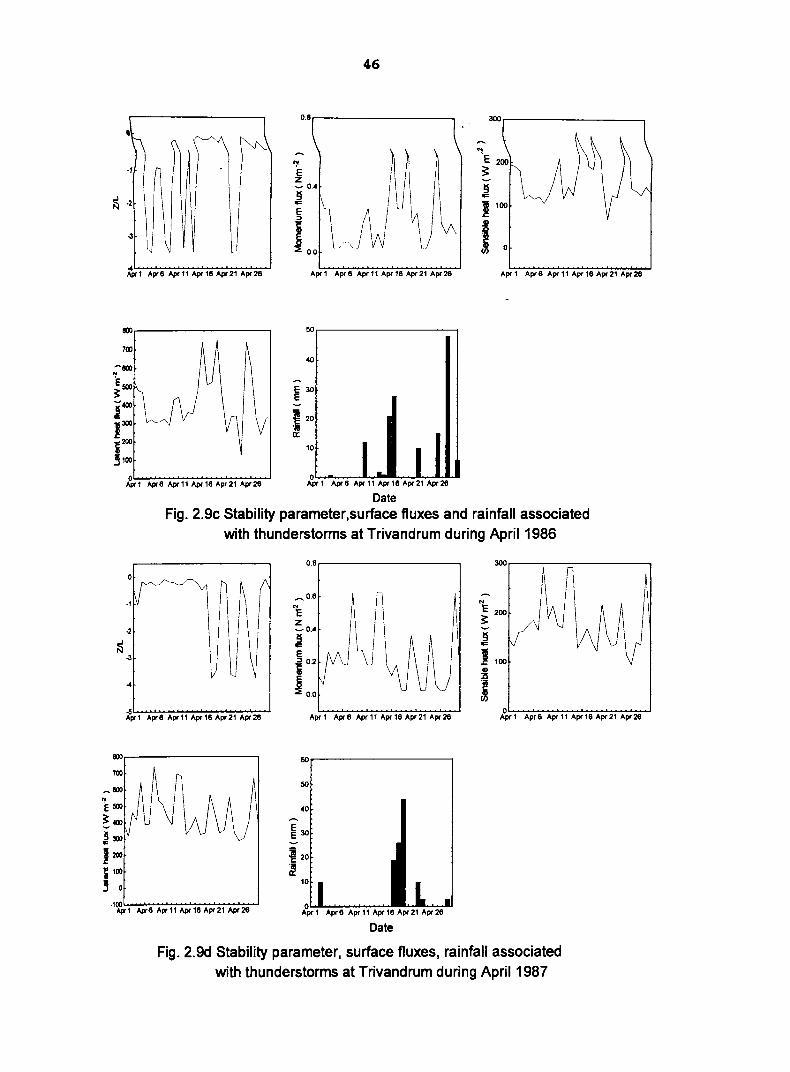
Surface layer characteristics during the occurrence of thunderstorms
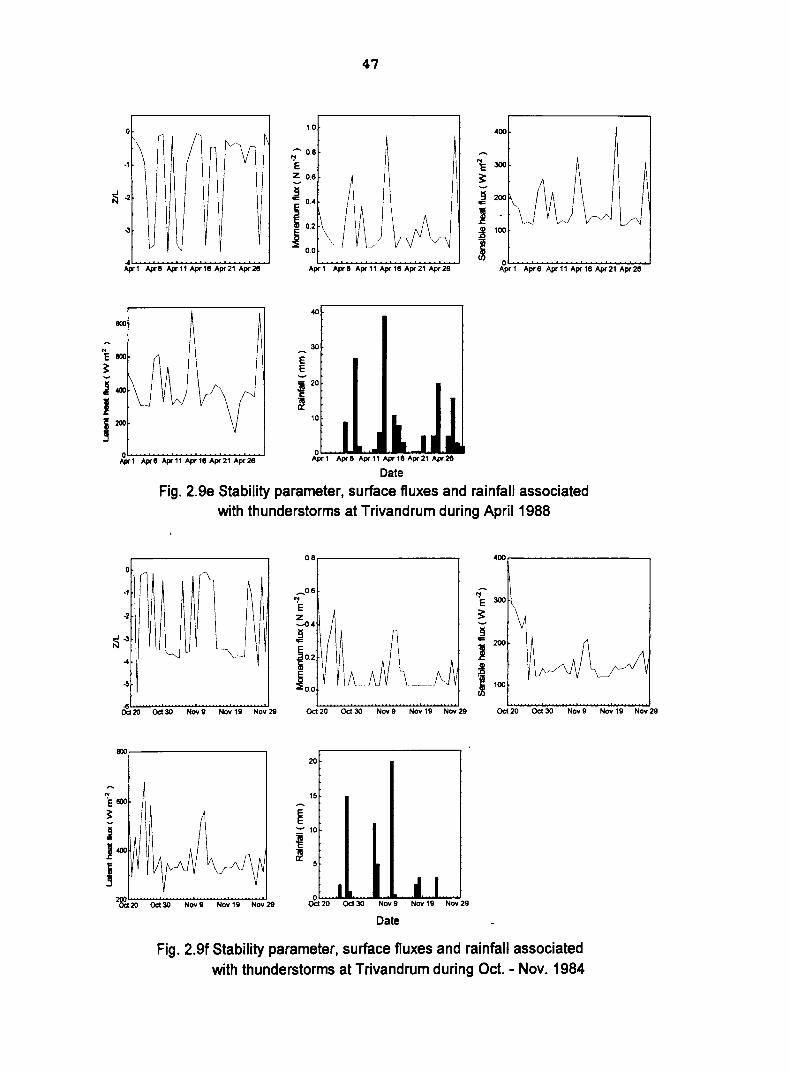
Variations in surface fluxes and surface stability during the occurrence of
thunderstorms in the pre-monsoon and post-monsoon months at Trivandrum are shown in
figures (2.9a to 2.91). During the pre-monsoon period the frequencies of thunderstorm
are more in the month of April whereas during the post-monsoon season the October and
November months give more thunderstorms. The stability parameter shows highly
unstable situation in the atmosphere before the occurrence of thunderstorm and it attains
less unstable or near neutral condition soon after the occurrence of the thunderstorm. In
April during the occurrence of thunderstorms the stability parameter is found to be
fluctuating between highly unstable and less unstable situations. The atmosphere
becomes less unstable or near neutral after the thunderstorm. This may be due to the
radiative cooling of the ground and presence of moist winds after the rainfall from
thunderstorms.
45
0.8.------------,
(l "!
·1 "! 0.4 E E ~ z ~ 200
·2 ~ "" ~ "" 0.2 J E
.J :;:J Gl 1\-V\J\~A_I li :is
<..J \/ \J ~ ~ 100
-4
Aprl Apr8
800
700
~600
~
E500 ~ ~ 400 !! ""300
1200 ~ ~ 100
0 Aprl Apr8
·2
0.0
Apr 11 Apr 18 Apr 21 Apr 1 Apr8 AprIl Apr18 Apr21 Aprl Apr 8 Apr 11 Apr 18 Apr 21
70
80
50
E 40 S ~ 30
.li\ a: 20
Iq
.1 •• AprIl Apr18 Apr21 Aprl Apr8 AprIl Apr18 Apr21
Date
Fig. 2.9a Stability parameter, surface fluxes and rainfall associated with thunderstorms at Trivandrum during April 1984
0.8.-------------.
~2~~~~~--~~~ Apr 1 Apr 6 Apr 11 Apr 18 Apr 21 Apr 28
40
~30
E E
~20
~ 10
o I
~ 0
~
ll00~~~~ ........... __ ~~~ Apr 1 Apr 8 Apr 11 Apr 18 Apr 21 Apr 28
"pr 1 Apr8 AprIl Apr18 Apr21 Apr28 Apr 1 Apr 6 Apr 11 Apr 18 Apr 21 Apr 28
Date
Fig. 2.9b Stability parameter, surface fluxes and rainfall associated with thunderstorms at Trivandrum during April 1985
46
0.8r------------------, 3OOr------------------,
.,
~ ·2
Apr 1 Apr 6 Apr 11 Apr 16 Apr 21 Apr 26
~r---------------~ ~.---------------~
700
~
40
E30 E
~ 20 'iII cr
R.,,1 Apr6 AprIl Apr16 Apr21 Apr26
Date Fig. 2.9c Stability parameter,surface fluxes and rainfall associated
with thunderstorms at Trivandrum during April 1986
O.B 3OOr---~~~------_.
.:~ /\ f\ ~0.6
N
~\ E 200 ~
..2
-3
-4 V \
E z ~O ••
~ ... E ~ 02
~ 00
Apr 1 Apr 6 Apr 11 Apr 16 Apr 21 Apr 26
OOr---------------~
40
~30
~ 20 'iII cr
10
Date
~ ... J 100
11 ~
Fig. 2.9d Stability parameter, surface fluxes, rainfall associated with thunderstorms at Trivandrum during April 1987
J\ (IV
~~~~~~~~~~ AjIr 1 Apr8 Apr 11 Apr 18 Apr 21 Apr 28
BOO
4L..,I~Apr~8""'Apr~II""'A~pr~18""'A~pr~21""'A~pr""!:28~
1.0
- 0.8 ~ E Z 0.8
47
Aprl Apr8 AprIl Apr18 Apr21 Apr26
E E ~
40
30
~ 20
·iII 0::
Date
400
o~~~~~~~~~ Apr 1 Apr 8 Apr 11 Apr 18 Apt 21 Apr 28
Fig. 2.ge Stability parameter, surface f1uxes and rainfall associated with thunderstorms at Trivandrum during April 1988
·1 /\ ·2
& 20 Od3O Nov 9 Nov 19 Noy 29
BOO'r----------------,
E E
0.8,..--------------,
Od 20 Od 30 Noy 9 Noy 19 Nov 29
20
15
~ 10
~ ~
hi. I dl:t 20 Od 30 Noy 9 Noy 19 Noy 29
Date
400~--------------~
~E 300
~
!§ -=200
J ~ ~ 100
Od 20 Od 30 Noy 9 Nov 19 Noy 29
Fig. 2.9f Stability parameter, surface f1uxes and rainfall associated with thunderstorms at Trivandrum during Oct. - Nov. 1984

0
~\MW~~· ·2
~ -4
-11
-11 Od 15 0cI25 No. 4 Nov 14 No. 24
~r-----------~--~
0cI15 0cI2S No. 4 No. 14 No. 24
48
1.0
rf' 0.8
E Z 0.6
~ i 04
i 0.2
0.0 \N\~fij
Oc:t 15
35
30
25
~20 ~15 ·11 0:: 10
0cI25
: 1.. Oc:t 15 Oc:t 25
No. 4 No.14 No. 24
1 Nov 4 No. 14 No. 24
Date
400
.;'300 E ~ ~ 200
~ "" I 100 GI j5
J 0
Oc:t15 Oc:t25
Fig. 2.9g Stability parameter,surface f1uxes and rainfall asspciated with thunderstorms at Trivandrum during Oct.- Nov. 1985
No. 4 No.14 No.24
4OOr---------------~
it. 1 0cI6 OcIll 0cI18 Oc:t 21 Oc:t 28 Oc:t 31
~ 1 0cI6 0<:111 0<:116 0<:121 Oc:t 28 Oc:t 31
0.6
~
~ E Z 0.4
~ 50.2 • i 00
Oc:t 1 Oc:t 6 Oc:t 11 0<:116 0<:121 0<:128 0<:131
~~-----------------
25
Date
300
-~I~~--~~~~~~ Oc:t 1 Oc:t 8 Oc:t 11 Oc:t 16 Oc:t 21 Oc:t 28 Oc:t 31
fig. 2.9h Stability parameter,surface f1uxes and rainfall associated with thunderstorms at Trivandrum during Oct.-Nov. 1986
49
400
nr 0.8 .. ·1 "I 'E 300
E Z 0.4 ~
·2 ~
~ -3
~ ... ... 200 E 0.2
M All J Uv i ID
-4 j 00 :l5
~ 100
&'i, Od21 Now 10 Nov3O Odl Od21 Now 10 Nov3O Odl Od 21 Novl0 Now 30
1400
1200 80
~E 1000 ~60
~
9 .. J ; ~
800
eoo
400
200
Odl
·1
-2
~'5
E E
~40
~ 20
Oc:t21 Now 10 Now 30
Date
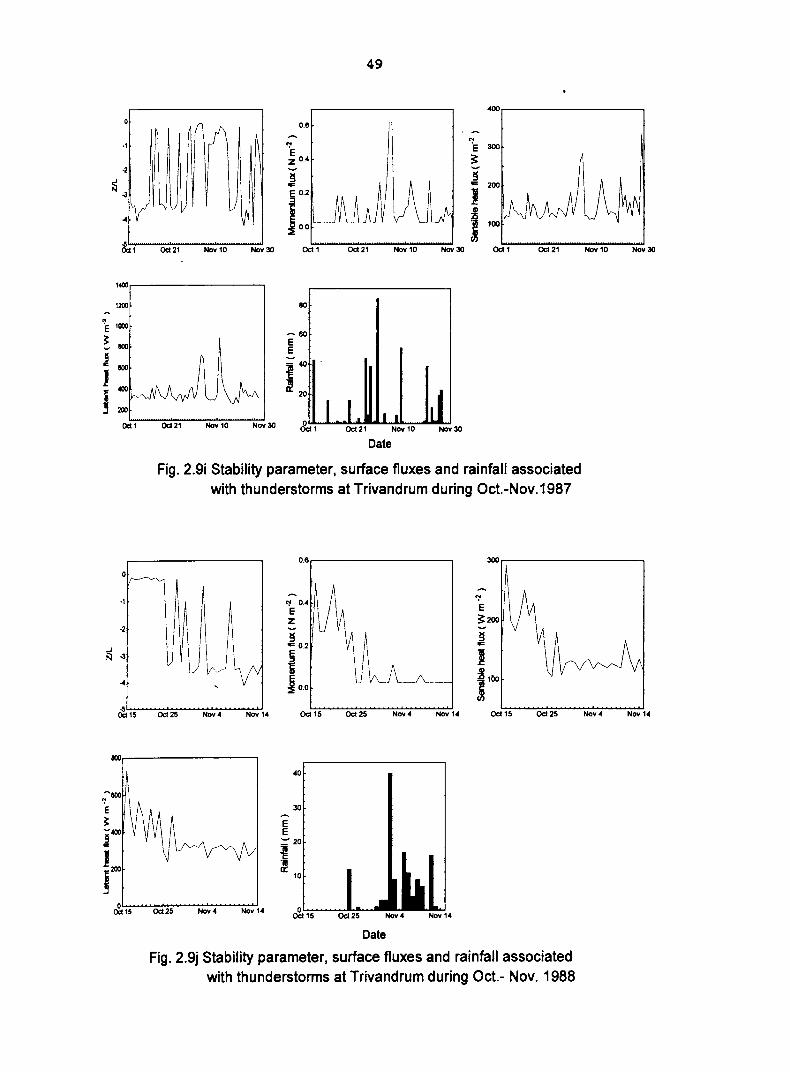
Fig. 2.9i Stability parameter, surface fluxes and rainfall associated with thunderstorms at Trivandrum during Oct.-Nov.1987
0.8.-----------,
Od 25 Nov4 Nov 14 Od15 Od 25 Nov4 Now 14
3OO.---------~
"I E ~200
~ ... J ID
)'00 Od~,~5~~0d~25~~Now~4~~N~OWI4
8OO1r--------------,
40
30
~'5 Oc:t25 Nov4 Now 14 ~'5 Od 25
Date
Fig. 2.9j Stability parameter, surface fluxes and rainfall associated with thunderstorms at Trivandrum during Oct.- Nov. 1988
50
In the post-monsoon period most of the thunderstorm activity is during October
and November. During these months also the atmospheric stability condition fluctuates
between highly unstable and less unstable after the thunderstorm activity. Before the
thunderstorm the atmosphere becomes highly unstable and becomes less unstable soon
after the thunderstorm activity. Therefore the stability parameter in the atmospheric
surface layer gives a clear indication of occurrence of thunderstorms much before its
activity occurs in the atmosphere. The thunderstorm activity very much influences the
surface layer stability, hence the energy exchange processes in the surface layer also gets
affected by it.
The surface layer momentum, sensible heat and latent heat flux shows an increase
in association with the occurrence ofthunderstorms. As soon as the atmosphere becomes
highly unstable prior to the occurrence of thunderstorm the surface turbulence increases
and the surface turbulent fluxes are increased so that the atmospheric flow becomes less
unstable. During the pre-monsoon period the momentum flux is found to reach O.6Nm-2
and occasionally more than that. The surface sensible heat flux reached a maximum of
300Wm-2 and in certain days higher values are noticed. The latent heat flux is found to
be slightly highe! in magnitude in certain days which was found to be about 800Wm-2•
During the post-monsoon period the surface momentum flux was found to be O.4Nm-2
and occasionally higher. The surface sensible heat flux was found to be less than
300Wm-2 and downward flux was noticed as the atmosphere becomes highly stable. The
latent heat was found to reach a maximum of600Wm-2 and sometimes higher. Therefore
the thunderstorm activity influences the surface layer exchange properties. The surface
fluxes were high during the occurrence of thunderstorms and because of the radiative
cooling of the surface due to intense rainfall activity the atmosphere becomes neutral or
stable. The convection in association with the thunderstorms increases the surface
turbulence and hence the surface fluxes.
Surface layer characteristics during the occurrence of monsoon depression
Surface layer stability parameter and surface fluxes over various stations are
computed during the life period of the depression (August2- August 6) formed over Bay
of Bengal in 1988. The track of the depression is shown in figure (2.1). The stations
selected are also given in the figure. The depression was formed over the head Bay on
51
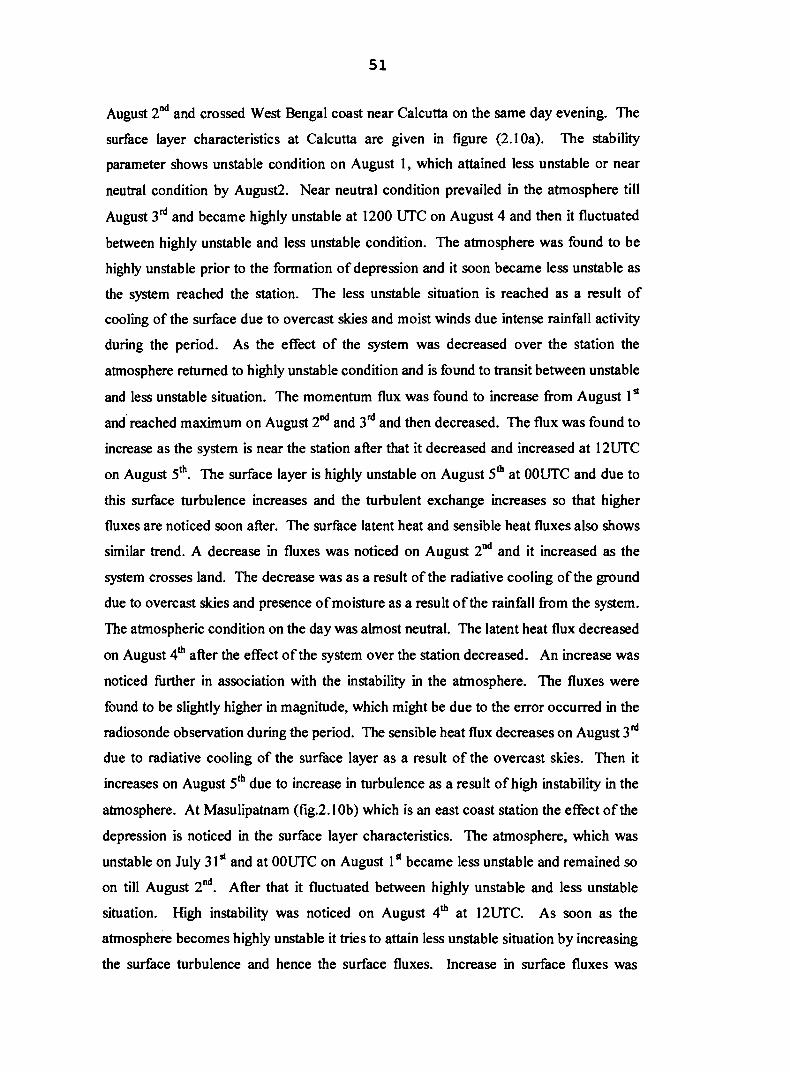
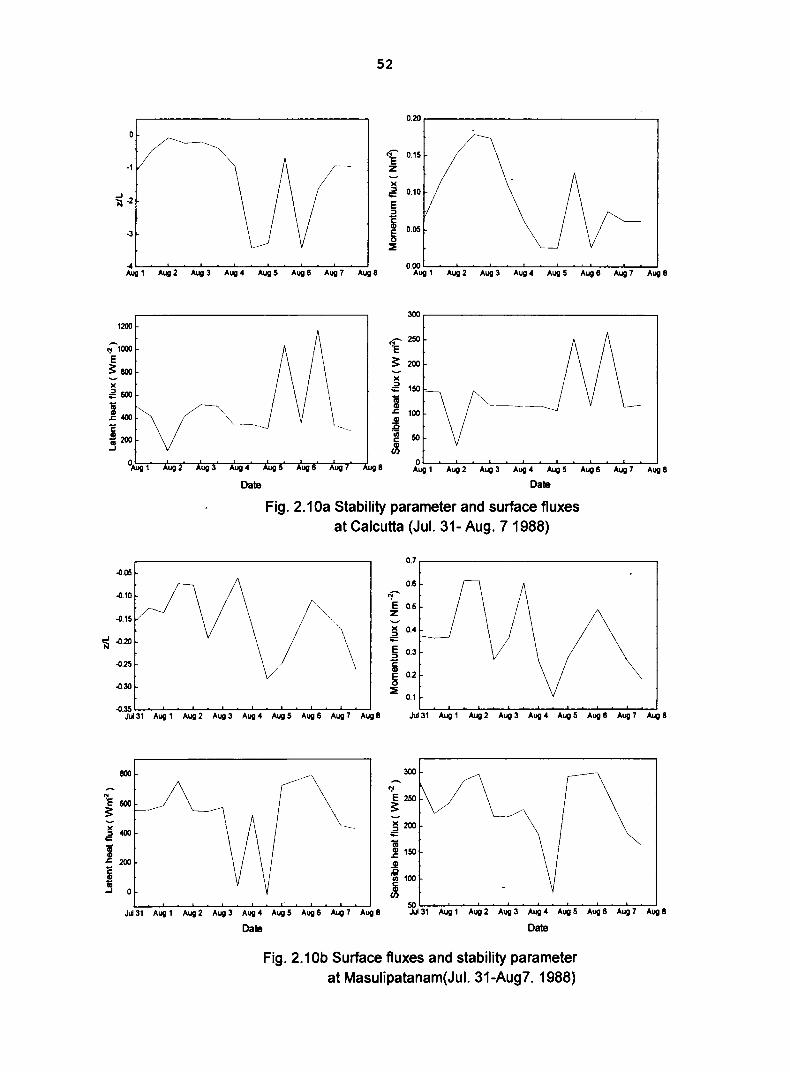
August 2nd and crossed West Bengal coast near Calcutta on the same day evening. The
surface layer characteristics at Calcutta are given in figure (2.IOa). The stability
parameter shows unstable condition on August I, which attained less unstable or near
neutral condition by August2. Near neutral condition prevailed in the atmosphere till
August 3rd and became highly unstable at 1200 UTC on August 4 and then it fluctuated
between highly unstable and less unstable condition. The atmosphere was found to be
highly unstable prior to the formation of depression and it soon became less unstable as
the system reached the station. The less unstable situation is reached as a result of
cooling of the surface due to overcast skies and moist winds due intense rainfall activity
during the period. As the effect of the system was decreased over the station the
atmosphere returned to highly unstable condition and is found to transit between unstable
and less unstable situation. The momentum flux was found to increase from August 1 si
and'reached maximum on August 2nd and 3n1 and then decreased. The flux was found to
increase as the system is near the station after that it decreased and increased at 12UTC
on August 5th• The surface layer is highly unstable on August 5th at OOUTC and due to
this surface turbulence increases and the turbulent exchange increases so that higher
fluxes are noticed soon after. The surface latent heat and sensible heat fluxes also shows
similar trend. A decrease in fluxes was noticed on August 2nd and it increased as the
system crosses land. The decrease was as a result ofthe radiative cooling of the ground
due to overcast skies and presence of moisture as a result ofthe rainfall from the system.
The atmospheric condition on the day was almost neutral. The latent heat flux decreased
on August 4th after the effect of the system over the station decreased. An increase was
noticed further in association with the instability in the atmosphere. The fluxes were
found to be slightly higher in magnitude, which might be due to the error occurred in the
radiosonde observation during the period. The sensible heat flux decreases on August 3n1
due to radiative cooling of the surface layer as a result of the overcast skies. Then it
increases on August 5th due to increase in turbulence as a result of high instability in the
atmosphere. At Masulipatnam (fig.2.lOb) which is an east coast station the effect ofthe
depression is noticed in the surface layer characteristics. The atmosphere, which was
unstable on July 31 si and at OOUTC on August 1 si became less unstable and remained so
on till August 2nd• After that it fluctuated between highly unstable and less unstable
situation. High instability was noticed on August 4th at 12UTC. As soon as the
atmosphere becomes highly unstable it tries to attain less unstable situation by increasing
the surface turbulence and hence the surface fluxes. Increase in surface fluxes was
52
·1
~ ·2
-3
-4 Aug 1
1200
;'1000 E ~800 )(
.e600
1400 'E i200 ..I
Aug2
/-
Aug 3 Aug4 Aug 5 Aug6 Aug 7 Aug8
°Aug 1 Aug 2 Aug 3 Aug 4 Aug 5 Aug 6 Aug Aug 6
Date
0.20
... /
'E z )( ~
;;:::
E 2 c III 0.05 S
::::E
0.00 Aug 1 Aug2 Aug3 Aug4 Aug 5 Aug6 Aug7 Aug 8
300,------------------------------. 'f 250
;:200
O~~~~~~~~~~~~~~~~ Aug 1 Aug 2 Aug 3 Aug 4 Aug 5 Aug 6 Aug 7 Aug 8
Date
Fig. 2.10a Stability parameter and surface fluxes at Calcutta (JuL 31- Aug. 7 1988)
-0.05
-0.10
" -0.15 "-
~ -0.20 \ -0.25
-0.30
-0.35 L.............,...,'-:-'~'_:_~'_:_~...."..'"_:_'_:_'"_:_L_:_'"_:_L_:_~ Jul31 Aug 1 Aug 2 Aug 3 Aug 4 Aug 5 Aug 6 Aug 7 Aug 8
800
\ ~
1:600 ~
~4OO ;;:::
i J:: 200
i " ..I 0
Jul31 Aug 1 Aug 2 Aug 3 Aug 4 Aug 5 Aug 6 Aug 7 Aug 8
Date
0.7,---------------------------------,
0.6
<f' E 0.5 Z
~ 0.4 ;;:::
§ 0.3 C III S 0.2
::::E 0.1
JuI 31 Aug 1 Aug 2 Aug 3 Aug 4 Aug 5 Aug 6 Aug 7 Aug 8
"! E 250 ;: ~ 200
;;:::
16 ~15O J! ~100 ~ ~~_1_2_3_4_5_8_7_8
Date
Fig. 2.10b Surface fluxes and stability parameter at Masulipatanam(JuL 31-Aug7. 1988)
53
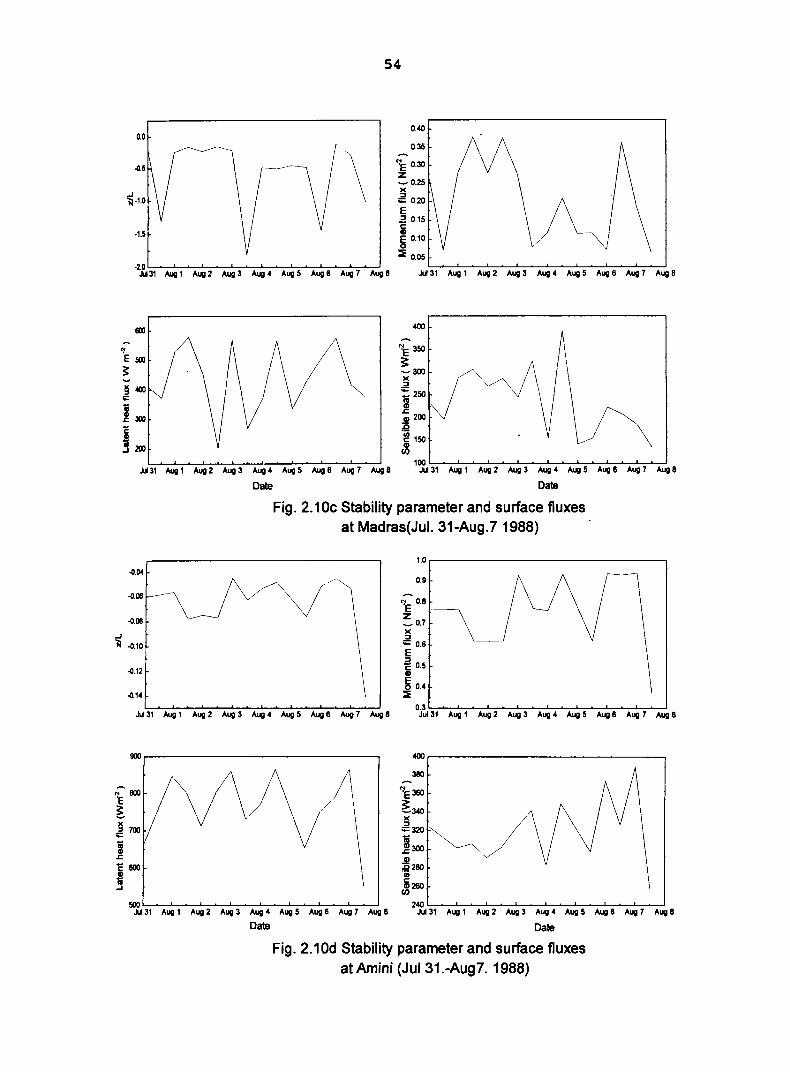
noticed soon after the atmosphere is highly unstable. The increase is due to strong winds
during the disturbance. At Madras also high instability is noticed on July 31 si before the
formation of the depression (fig.2.10c). The atmosphere becomes less unstable during
August 1-3 after which it again becomes highly unstable and transits between highly
unstable and less unstable condition. The less unstable situation during the occurrence of
depression is achieved as a result of the radiative cooling of the surface due to overcast
skies and moist winds. The surface momentum, sensible heat and latent heat fluxes are
higher during the system. Higher fluxes are noticed soon after the atmosphere becomes
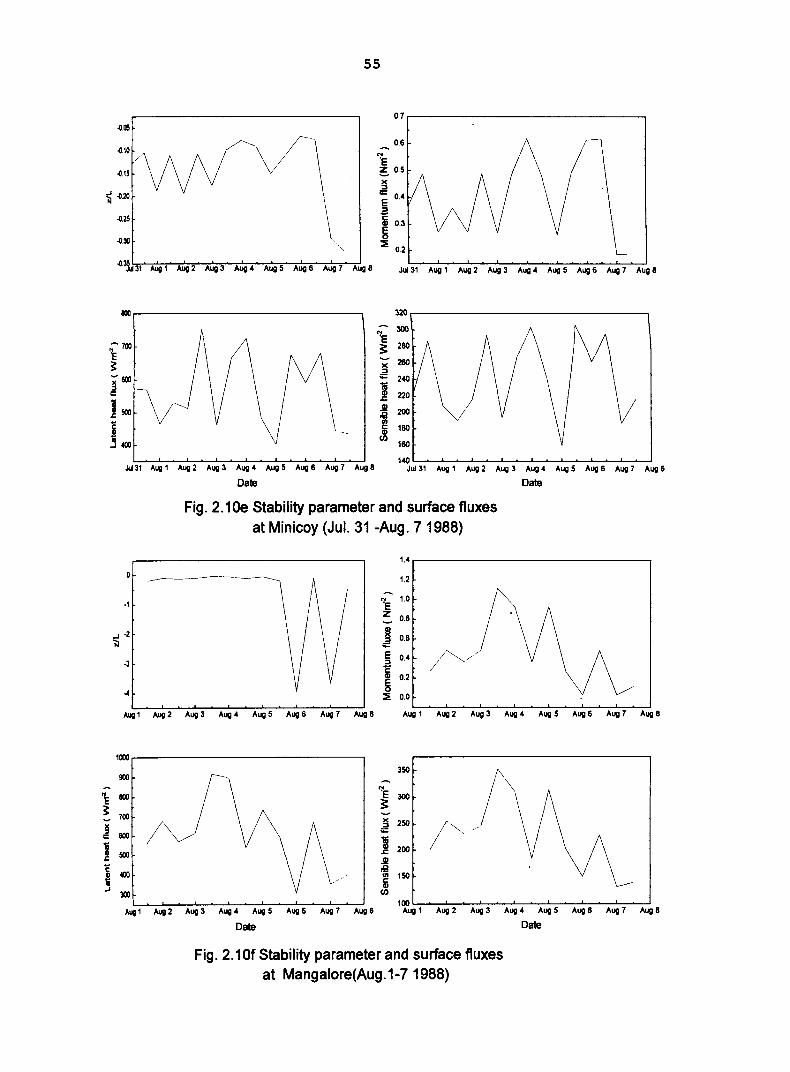
highly unstable. At Amini and Minicoy (figures 2.10d and 2.lOe) the atmospheric
condition fluctuates between highly unstable and less unstable situatioQ. during the
disturbance and becomes highly unstable after the decay of the disturbance. Higher
surface fluxes are noticed throughout the period at the two stations. At Mangalore
(fig.2.10f) the atmosphere is in near neutral condition during the life period of the
depression and becomes highly unstable after August 5th • Near neutral condition is due to
overcast skies and moist winds due to the disturbance. After the effect of the depression
decreases the atmosphere becomes highly unstable. The surface momentum, sensible and
latent heat fluxes are very high during August 2-5 after which it decreases. The high
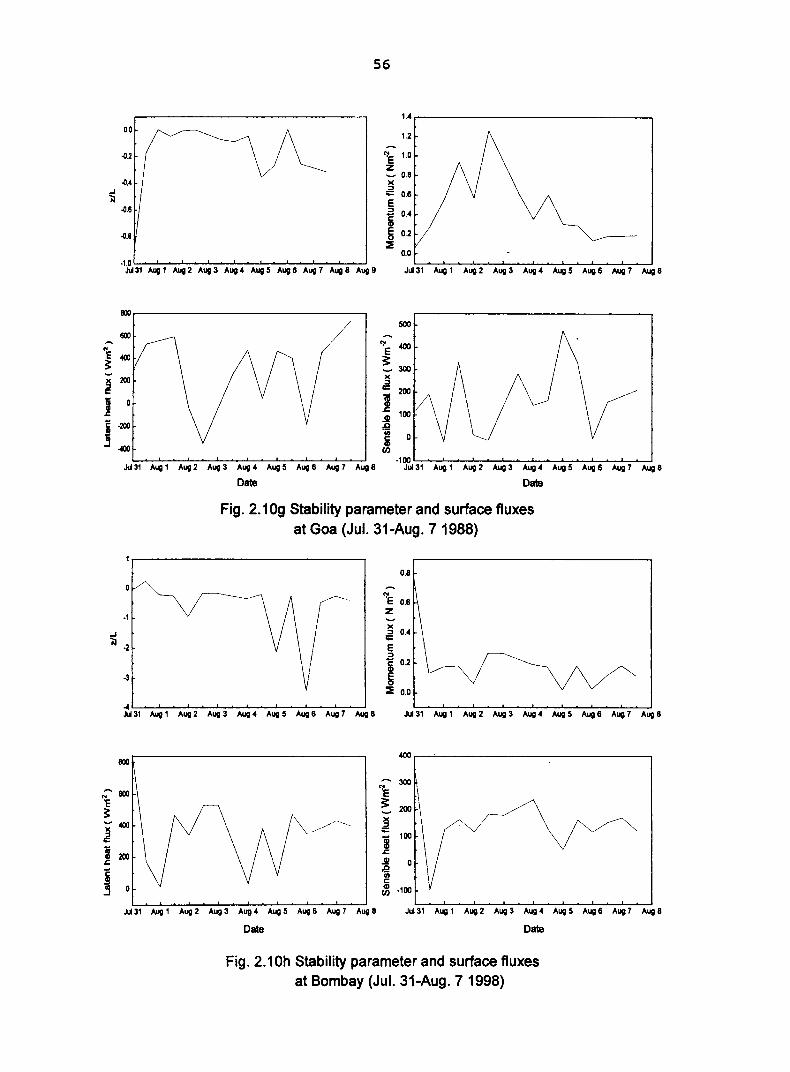
speed winds during the period are responsible for the increase in surface fluxes. At Goa
the atmosphere is highly unstable prior to the formation of the depression and becomes .. near neutral or stable during the disturbance and becomes unstable again on August 5th
(fig.2.10g). The surface fluxes are much higher during the period. Downward flux was
noticed in latent heat flux on August 2nd and 6th • Downward sensible heat flux occurs
over the station during the period as a result of the high stable condition reached in the
atmosphere. At Bombay (fig.2.1 Oh) the atmosphere was highly stable on July 31 si which
gradually became unstable on August 2nd• It was in near neutral condition during August
2 -5 due to the depression. After that the atmospheric condition fluctuates between
.highly unstable and less unstable condition. There was a decrease in surface flux during .
July 31 st and downward sensible heat flux was noticed on the day. This was due to the
highly stable condition of the atmosphere on July 31 si. After that the surface fluxes
increases and higher fluxes are noticed during August 1 - 4.
The atmosphere therefore becomes highly unstable much before the disturbance
and it attains near neutral situation or less unstable situation during the life period of the
disturbance due to radiative cooling of the ground because of highly overcast skies and
..J
0.0
\ .1.5
600
54
0.40
0.35
<:'e 0.30 Z _0.25 )( :::J
;;::: 0.20
e .a 0.15 c: ID 8 0.10
::::iE 0.05
JUIL31~A...Jug'-,1~A....lug""'2~A....Lug""'3~Aug"""""'4~Aug"""""'5 ~Aug-'--:-6 ~A""ug.L..7~A~ug 8
400
'1'e 350
~ -300 )( :::J
;;::: 250
i .s::. .si 200 :9 :!! 150 ID fI)
JW 31 Aug 1 Aug 2 Aug 3 Aug 4 Aug 5 Aug 6 Aug 7 Aug 8
Date
l00.~~~~~~-'-~-.L..---L~~~~~~ Jul31 Aug 1 Aug 2 Aug 3 Aug 4 Aug 5 Aug 6 Aug 7 Aug 8
Date
-4.04
-4.08
-4.08
Fig. 2.1 Qc Stability parameter and surface f1uxes at Madras(Jul. 31-Aug.7 1988)
1.0 ,.------------------------------------------------,
0.9
N -4.10
-4.12
-4.14
Jul31 Aug 1 Aug 2 Aug 3 Aug 4 Aug 5 Aug 6 Aug 7 Aug 8
900,-----------------------------------------------,
~~~.L..-~~~~~-'-~-.L..---L~~~~
Jul31 Aug 1 Aug 2 Aug 3 Aug 4 Aug 5 Aug 6 Aug 7 Aug 8
Date
0.3.'-:-:-----:-~....,.....L..::_........,.....L...:~-.L..---L~~~~~-,...J JuI 31 Aug 1 Aug 2 Aug 3 Aug 4 Aug 5 Aug 6 Aug 7 Aug 8
4OO,----------------------------------------------~
380
1;360 ~340 .2320 iD 1!3OO .J! :9280 UI
i260 fI)
24O~~.L.._~~~....I._~_.L..~_.L..~_L~~~___'
Jut 31 Aug 1 Aug 2 Aug 3 Aug 4 Aug 5 Aug 6 Aug 7 Aug 8
Date
Fig. 2.1Qd Stability parameter and surface f1uxes at Amini (JuJ 31.-Aug7. 1988)
55
0.7 r-------------------, .(I.os
0.6
')lE ~ 0.5
~
.Q1O /\ 1\ 1\ fV
.(115 VVV i .(1.20
0;:: E 0.4
-E ~ -~ c:
1 ~
e t ~
.a -0.25
.(1.30
~ 03
::::!; 0.2
Jul 31 Aug 1 Aug 2 Aug 3 Aug 4 Aug 5 Aug 6 Aug 7 Aug 8
800....------------------, 320....------------------. ~300
1: ~ 280
~ 0;::
1 ~200 ~ 180
160
1~L-~L-~L-~L-~L-~L-~~~~~
.kA31 Aug1 Aug2 Aug3 Aug4 Aug5 Aug6 Aug7 Aug8
Date
JuI 31 Aug 1 Aug 2 Aug 3 Aug 4 Aug 5 Aug 6 Aug 7 Aug 8
·1
~ ·2 'N
-3
-4
Augl
1000
SOIl
800
700
600
500
400
300
Augl
Fig. 2.10e Stability parameter and surface f1uxes at Minicoy (Jul. 31 -Aug. 7 1988)
1.4
-------- 1.2
')lE 1.0
~ 0.8
fl 0.6 ::::I 0;::
E 0.4 /~/ .a :ii 0.2
~ ::::!; 0.0
Aug2 Aug3 Aug4 AugS Aug6 Aug7 Aug8 Aug 1 Aug2 Aug3
350 J- 1: 300 ~ )( ::::I 250 /~ ,
;;::
i / 200 .J::
.si ,g
/" UI 150 I: GI
(J)
100 Aug2 Aug3 Aug4 Aug 5 Aug6 Aug 7 Aug8 Aug 1 Aug2 Aug3
Date
Fig. 2.10f Stability parameter and surface f1uxes at Mangalore(Aug.1-7 1988)
Date
Aug4 Aug 5 Aug6 Aug 7 Aug8
Aug4 AugS Aug6 Aug7 AugB
Date
.J
56
0.0
.(1.8
800,------------------------------,
Jul31 Aug 1 Aug 2 Aug 3 Aug 4 Aug 5 Aug 6 Aug 7 Aug 8
Date
1.4,--------------------------------,
1.2
<:'E 1.0
Z ~ 0.8 )( :::> -= 0.6 E ~ 0.4
6 0.2 ::E
0.0
JuI 31 Aug 1 Aug 2 Aug 3 Aug 4 Aug 5 Aug 6 Aug 7 Aug 8
1 .i! .0
500
·in 0
~ .100 '--~L_~L_~.I_..~_'__~..l._~..l._~_'_ .............
JuI 31 Aug 1 Aug 2 Aug 3 Aug 4 Aug 5 Aug 6 Aug 7 Aug 8
Date
Fig. 2.10g Stability parameter and surface f1uxes at Goa (Jul. 31-Aug. 7 1988)
0.8
·1 )(
"'N .2 ~ 0.4
E
800
Jul31 Aug 1 Aug 2 Aug 3 Aug 4 Aug 5 Aug 6 Aug 7 Aug 8
Date
.a i 0.2
6 ::E 0.0
1: 3: )(
~
11 .c JI .e fI) c GI en
JuI 31 Aug 1 Aug 2 Aug 3 Aug 4 Aug 5 Aug 6 Aug 7 Aug 8
400,-------------------------------,
300
JuI 31 Aug 1 Aug 2 Aug 3 Aug 4 Aug 5 Aug 6 Aug 7 Aug 8
Date
Fig. 2.10h Stability parameter and surface f1uxes at Bombay (Jul. 31-Aug. 7 1998)
57
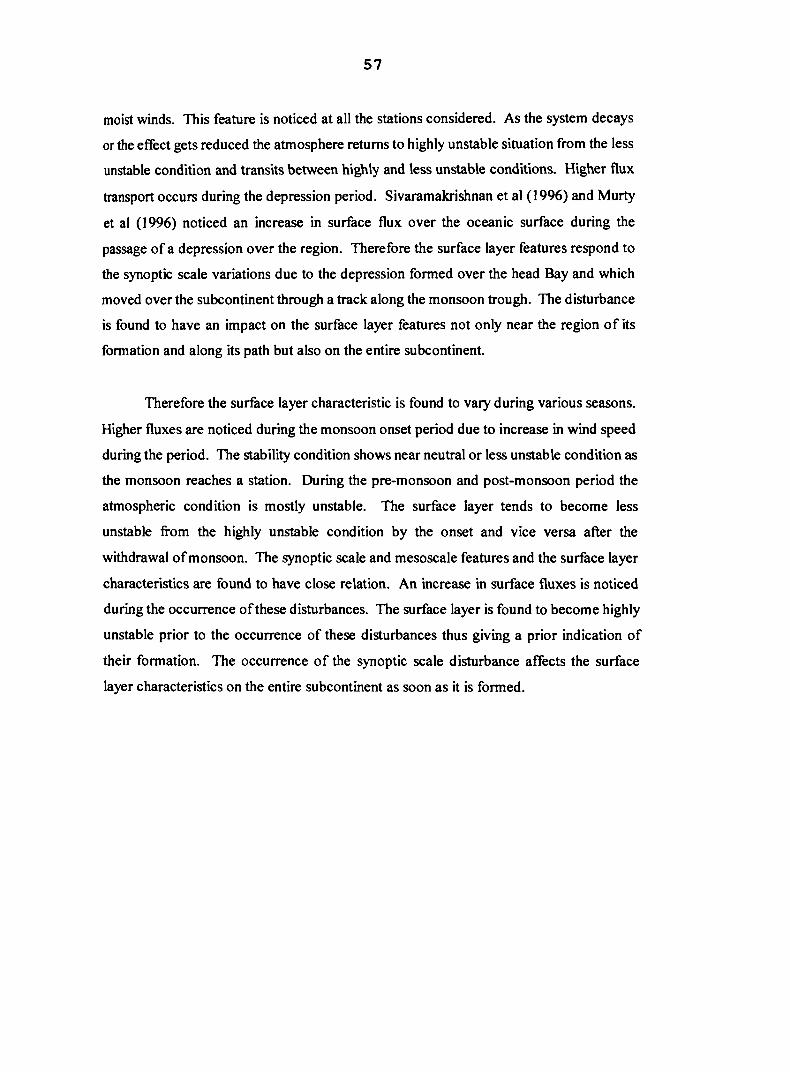
moist winds. This feature is noticed at all the stations considered. As the system decays
or the effect gets reduced the atmosphere returns to highly unstable situation from the less
unstable condition and transits between highly and less unstable conditions. Higher flux
transport occurs during the depression period. Sivaramakrishnan et al (1996) and Murty
et al (1996) noticed an increase in surface flux over the oceanic surface during the
passage of a depression over the region. Therefore the surface layer features respond to
the synoptic scale variations due to the depression formed over the head Bay and which
moved over the subcontinent through a track along the monsoon trough. The disturbance
is found to have an impact on the surface layer features not only near the region of its
formation and along its path but also on the entire subcontinent.
Therefore the surface layer characteristic is found to vary during various seasons.
Higher fluxes are noticed during the monsoon onset period due to increase in wind speed
during the period. The stability condition shows near neutral or less unstable condition as
the monsoon reaches a station. During the pre-monsoon and post-monsoon period the
atmospheric condition is mostly unstable. The surface layer tends to become less
unstable from the highly unstable condition by the onset and vice versa after the
withdrawalofmonsoon. The synoptic scale and mesoscale features and the surface layer
characteristics are found to have close relation. An increase in surface fluxes is noticed
during the occurrence ofthese disturbances. The surface layer is found to become highly
unstable prior to the occurrence of these disturbances thus giving a prior indication of
their formation. The occurrence of the synoptic scale disturbance affects the surface
layer characteristics on the entire subcontinent as soon as it is formed.