Embed Size (px)
Citation preview

Chapter 2
Experimental Methodology
Abstract
Thermal wave physics has emerged as an effective research and analytic tool
for the accurate evaluation of thermal, optical and transport properties of
matter in its different states. During the last three decades photothermal
techniques which are essentially based on the detection of thermal waves in
the sample after illumination with a pulsed or a chopped optical radiation
finds its applicability as a potential tool for the thermo-optic
characterization of materials both in industry and academic environments.
The experimental methodologies used for the works presented in this thesis
are thermal-lens technique and photoacoustic technique. These techniques
come under the broad field of photothermal techniques. This chapter is
concerned with the discussion of basic principles and characteristics of
photothermal techniques in general and in particular a detailed discussion
on thermal-lens and photoacoustic techniques.

42 Chapter 2
2.1 Introduction
The photothermal (PT) techniques are a group of experimental methods
based on a common principle of heating a sample with periodical or pulsed
radiation and on measuring directly or indirectly the induced change in
temperature. Today a broad range of methods can be subsumed under this
heading, with the common feature that they use light to produce a thermal
excitation. Optical energy is absorbed and eventually converted into thermal
energy by an enormous number of materials–solids, liquids and gases.
Although the initial absorption process in many materials are selective, it is
common for excited electronic states in atoms or molecules to loose their
excitation energy by a series of nonradiative transitions that results in general
heating of the material. Such processes are the origins of the PT effects and
techniques. PT spectroscopy techniques have sensitivities far exceeding
those of conventional absorption spectrophotometry. The reasons for high
sensitivity of PT spectroscopy are that it is an indirect technique for
measuring optical absorption. Light energy absorbed and not lost by
subsequent emission results in sample heating. This heating results in a
temperature change as well as changes in thermodynamic parameters of the
sample which are related to temperature. Measurements of temperature,
pressure, or density changes that occur due to optical absorption are
ultimately the basis for the photothermal spectroscopic methods. PT
spectroscopy is a more direct measure of optical absorption than optical
transmission based spectroscopies. Sample heating is a direct measure of
optical absorption, so PT spectroscopy signals are directly dependent on light
absorption. Scattering and reflection losses do not produce PT signals. The
indirect nature of measurement also results in PT spectroscopy being more
sensitive than optical absorption measured by transmission methods. There

Experimental Methodology 43
are two reasons for this. First, the PT effects can amplify the optical signal
measured. This amplification, referred to as enhancement factor is the ratio
of the signal obtained from the PT spectroscopy to that of the conventional
transmission spectroscopy. Enhancement factors depend on the thermal and
optical properties of the sample, the power or energy of the light source used
to excite the sample and on the optical geometry used to excite the sample.
Since the optical excitation power or energy and the geometry are variable,
the enhancement can be made very large, even with samples with relatively
poor thermal and optical properties. The second reason that PT spectroscopy
is more sensitive than transmission is that the precession of the instrument is
inherently better than that of the direct transmission methods. The
fundamental limitation of the conventional absorption spectroscopy such as
shot noise, may be partially circumvented.
PT spectroscopy is usually performed using laser light sources. The first
reason is the high spectral purity and power. For an excitation of a sample
with a given absorption coefficient, the temperature change will be
proportional to the optical power, in the case of both continuous and pulsed
excitation. The PT signal is generally proportional to the temperature change.
Thus greater the power or energy, the greater the resulting signal. Lasers can
provide high powers or pulse energies over very narrow optical bandwidths,
thereby enhancing photothermal signals. The second reason is the spatial
coherence. The temperature change is not only proportional to the optical
power or energy but is also inversely proportional to the volume over which
the light is absorbed since heat capacity changes with the amount of
substance. The spatial coherence properties of laser sources allow the light to
be focused to small diffraction limited volumes. The small volumes used in
photothermal spectroscopy enhance signal magnitudes, allow PT

44 Chapter 2
spectroscopy to be used in small volume sample analysis and allow for
microscopic analysis of heterogeneous materials.
2.1.1 Basic principle of photothermal techniques
The basic processes responsible for the PT signal generation are shown in
Fig. 2.1.
Fig. 2.1 Basic process involved in photothermal spectroscopy
Optical radiation from a laser is used to excite a sample. The sample absorbs
some of these radiations resulting in an increase in the internal energy. The
internal energy is dispersed in two different modes of hydrodynamic
relaxation, results in a temperature change in the sample or coupling fluid
placed next to the sample. This temperature change results in a change in the
density of the sample or coupling fluid. If the PT induced temperature change
is faster than the time required for the fluid to expand or in a few cases
contract, the rapid temperature change will results in a pressure change. The
Pressure
Change
Temperature Change
(Thermal Diffusion)
Absorption
Optical Excitation
Excited State Relaxation
Density Change
Photothermal
Signal Refractive Index Change Optical Probe
Pressure Change
(Acoustic Wave)

Experimental Methodology 45
pressure perturbation will disperse in an acoustic wave. In combination,
temperature and density changes affect other properties of the sample. PT
spectroscopy is based on the measurement of these properties. The key to the
success of sensitive PT apparatus lies in measurement of a thermal change,
not of the thermal state itself. Although apparatus could measure directly or
indirectly thermodynamic parameters such as temperature, pressure, density
and energy state, the limiting absorption that could measured would be
imposed by thermodynamic fluctuations. But sensitive PT methods
circumvent direct measurements by measuring refractive index changes due
to a non-equilibrium change in the energy of the sample.
The main excitation schemes can be grouped as pulsed, continuous and
modulated. Pulsed excitation source produce transient signals. These signals
are at a maximum immediately following sample excitation and decay as the
sample approaches equilibrium through thermal diffusion. The transient
signals last for few micro seconds in gas phase to several milliseconds in
condensed phases. The time duration is inversely proportional to the thermal
conductivity of the media since thermal diffusion or conduction removes
energy from the sample and, more important, distributes the energy
throughout the sample. Continuous excitation produces signals that are
initially small but increase in magnitude as the irradiation time progresses.
Initially, thermal diffusion removes heat slower than the heat produced by
optical excitation. As the sample absorbs radiation and converts the energy
to heat, the temperature gradient increases. When the radiative heating flux
equals the energy flux due to thermal conduction, a steady state spatially
dependent thermal change is attained. Thus the PT signal eventually reaches
a steady-state value. The time required to develop thermal-lens signal varies

46 Chapter 2
from milliseconds to seconds which in turn depends on the thermal
conductivity of the medium.
For analytical (e.g., concentration) measurements, both pulsed and
continuous excitation requires estimation of the signal magnitude. Signal
magnitudes are directly proportional to the sample absorbance in a first order
approximation. Signal magnitudes can be measured directly (e.g. using an
oscilloscope), or the signal transient can be recorded and subsequently
processed to enhance measurement precession. Excitation sources may also
be modulated. Chopped or oscillatory excitation produces oscillating signals.
The resulting signals can be processed using lock-in amplifiers. The
magnitude of the oscillating signal depends on sample absorbance, frequency
of excitation and thermal conductivity of the medium. With modulated
excitation, signal amplitude is directly proportional to sample absorbance but
decreases with increasing frequency. In addition to signal amplitude
information, phase sensitive lock-in analyzers also produces signal to
excitation phase shift information. The frequency dependent phase shift
information is essentially equivalent to that contained in the time dependent
signal transients obtained using pulsed excitation.
Two sensitive PT techniques ― dual-beam thermal-lens technique and laser
induced photoacoustic technique are employed for the works presented in
this thesis. The following section gives a brief description of basic principles
and theory of these techniques.
2.2 Thermal-lens technique
2.2.1 History of thermal-lens effect
The thermal-lens is a commonly employed experimental approach for the
accurate evaluation of various thermo-optic properties of samples. The

Experimental Methodology 47
thermal-lens effect was first reported in 1964 by Gordon et al. [1-2]. In an
attempt to study Raman spectra, they placed cuvetts containing various
liquids inside the cavity of a He-Ne laser. Power transients, mode changes
and relaxation-type oscillations with time constants on the order of seconds
were observed. These phenomena have been explained in terms of the
formation of a thermal-lens in the liquid. Solimini measured the absorptivity
of a number of organic liquids at 632.8 nm and later reported an extensive
study of the accuracy and sensitivity of the intracavity thermal-lens for
measuring sample absorptivity [3]. He was also the first to postulate that the
absorptivity in organic liquids might arise from transitions between vibration
energy sates in the molecule. Carmen and Kelley studied the time evolution
of the thermal-lens created in 4CCl solutions of iodine [3]. These authors
recorded the growth of the thermal-lens by the use of a moving camera and
measured the size of the beam image frame by frame.
The important advance in thermal-lens technique was introduced by Hu and
Whinnery [4]. The authors demonstrated that maximum divergence of the
laser beam could be obtained for a given sample by positioning the sample at a
distance of one confocal length from the minimum beam waist of the laser,
which results in sensitive absorbance measurements. Most importantly, Hu
and Whinnery demonstrated that a sensitive detection of thermal-lens
formation can be achieved for samples placed outside the laser cavity by use
of an auxiliary lens to form a beam waist at a distance of one confocal length
before the sample cell. The change in the laser beam size is monitored in the
far field.
The most refinement of the thermal-lens technique was given by Dovichi and
Harris [5]. They introduced procedures needed for reliable and reproducible
measurements of thermal-lens signal. The authors constructed a differential

48 Chapter 2
thermal-lens spectrophotometer for canceling the back absorbance of the
sample matrix or the solvent. When the sample, with negative thermal
coefficient of refractive index, is placed beyond the beam waist, a diverging
beam is created and when it is placed at an equal distance before the beam
waist, a converging beam is resulted. Therefore, when two cuvetts filled with
identical samples are placed symmetrically about a beam waist, a
cancellation of about 99% of thermal-lens signal is observed. Hence, signal
due to the matrix or solvent can be optically subtracted from that of the
sample automatically, if blank sample is placed √3 time’s confocal distance
before and after the beam waist. Using this procedure, an improved
sensitivity was reported.
The experiments described above used a single laser source to provide both
the sample excitation and the means for probing the heat produced by the
absorption process. But there are several advantages by using separate laser
sources for the pump and probe beams. The small intensity modulation that
can be repetitively imposed on a well behaved continuous laser beam by the
creation of a thermal-lens can be sensitively monitored by signal averaging
devices such as lock-in amplifiers and transient recorders. In addition,
detection optics and detectors can be optimized for a single, convenient
probe laser wavelength. The first report of dual-beam thermal-lens
measurements was reported by Grabiner et al. who used a He-Ne laser to
probe the time resolved formation of thermal-lens.
The first application of the dual-beam thermal-lens technique to
spectroscopic absorption measurements was reported by Long et al. They
used a repetitively chopped continuous wave dye laser to provide the pump
beam and a He-Ne laser for the probe. Rojas et al. fabricated a dual-beam
thermal-lens optical fiber spectrometer which is capable of measuring

Experimental Methodology 49
sensitive thermal-lens spectra at a location remote from the pump laser such
as remote environmental analysis [6]. Franko and Tran [7] constructed a CW
dual-wavelength pump-probe configuration thermal-lens spectrometer that
was capable of measuring thermal-lens signal at two different wavelengths.
The advantage of this dual-wavelength setup included the correction for
solvent background absorption and its improved selectivity. Swofford et al.
[8-9] described the dependence of the magnitude of thermal-lens on the
parameters of the experimental design in a dual-beam thermal-lens setup.
They observed good agreement between measured and calculated thermal-
lens signal. Franko and Tran fabricated various analytical thermal-lens
instruments such as differential thermal-lens, multiwavelength and spectral
tunable instruments, circular dichroism spectropolarimeters and miniaturized
instruments. Leach and Harris [10-11] demonstrated sensitivity of three
orders of magnitude in supercritical fluids [12-13], which opened new
possibilities for using thermal-lens spectroscopy in combination with
supercritical fluid extraction or chromatography.
Experimentally, recent advances in optics, electronics and quantum
electronics have been exploited to develop novel instruments which have
lower background noise, higher sensitivity and selectivity and wider
applications (by expanding its measurement capability from the conventional
visible region to the ultraviolet, near-infrared and infrared regions). The
unique characteristics of a laser, namely its low beam divergence, pure
polarization, high spectral and spatial resolution and its ability to be focused
on a diffraction-limited spot, have been fully exploited to develop novel
thermal-lens instruments which are particularly suited for small volume ( lµ )
and low concentration samples. As a consequence of these developments, the
thermal-lens technique has been established as a highly sensitive technique

50 Chapter 2
not only for chemical and stereochemical analyses but also for the detection
in chromatography and electrophoresis. Furthermore, different from
conventional techniques, in addition to the sample concentration and
excitation laser power, the thermal-lens signal is also dependent on the
position and thermo-physical properties of the sample.
2.2.2 Theory of thermal-lens effect
Assumptions
(1) The laser beam is in the TEM00 mode so that the beam cross-section is
Gaussian.
(2) The spot of the laser beam remains constant over the length of the
sample cell.
(3) The sample is homogeneous and satisfies Beer’s law.
(4) The thermal conduction is the main mechanism of heat transfer and the
temperature rise produced within the sample does not induce
convection.
(5) Refractive index change of the sample with temperature, is constant
over the temperature rise induced by the laser.
(6) The strength of the thermal-lens is not sufficient to induce a change in
the beam profile within the sample
The various processes responsible for the thermal-lens formation are given in
the following sections.
(i) Heat generation
In the thermal-lens technique the sample is illuminated using radiation from
a TEM00 or Gaussian intensity profile laser beam. Some of the radiation is

Experimental Methodology 51
absorbed by the sample. Excited states formed in this way may either lose
energy radiatively, e.g., fluorescence or phosphorescence or by nonradiative
routes, e.g., internal conversion or by interaction with other molecules in the
sample which results in the generation of heat. These are often competing
mechanisms. However, in nearly all situations where the quantum efficiency
of fluorescence is less than, for e.g. 0.95, some heat is evolved. Even if the
quantum efficiency for fluorescence was unity, some heat would be evolved
as a consequence of the Stokes’ shift. The flow of heat from the region
illuminated by the laser results in a thermal gradient proportional to the beam
intensity profile in the sample which may be a solution, solid or gas. Heating
is stronger at the center of the beam profile than in the wings and hence the
thermal gradient in turn establishes a refractive index gradient and a thermal-
lens is said to be created. For most liquids, the temperature coefficient of
refractive index, dTdn , is negative. Gaussian-shaped beam incident on the
liquid sample produces a concave lens and the beam diverges, or “blooms”.
Thus, the thermal-lens phenomenon is sometimes referred to as “thermal
blooming”. One can observe thermal-lensing quite readily. First, a sample is
placed beyond the focal point of a lens which focuses the laser. The resulting
thermal-lens causes the beam to become more divergent after passing
through the sample. Next, a pinhole is placed some distance away from the
sample and positioned so that the center part of the beam passes through it.
When the thermal-lens forms, the resulting divergence causes decrease of the
light passing through the pinhole. The creation of thermal-lens is
schematically shown in Fig. 2.2.

52 Chapter 2
Optical lens
Fig. 2.2 Creation of thermal-lens (Refractive index distribution caused by
the pump beam in the medium makes a probe beam to get diverged
like a concave lens)
(ii) Heat conduction
The classic work on heat conduction by Carslaw and Jaeger derives the
propagation function describing the temperature rise in an infinite
cylindrically symmetric medium at radius r and time t due to an
instantaneous cylindrical heat pulse of strength per unit length 'Q applied to
the medium at radius 'r and time 0 as [3]
+−=
tD
rrI
tD
)rr(exp
tD
Q)t,r,r(G
''''
2440
22
π (2.1)
where pC/kD ρ= , with D the thermal diffusivity )sec(12 −
cm , k the
thermal conductivity )Kcmseccal(111 −−− , ρ the sample density ),cmg(
3−
pC the heat capacity )Kgcal(11 −− and 0I a modified Bessel function. The
strength )( 3Kcm of a heat pulse is defined by Carslaw and Jaeger as the
Probe beam
Sample

Experimental Methodology 53
temperature to which the amount of heat liberated would raise unit volume of
the sample. Thus the quantity of heat instantaneously generated per unit
length of the cylinder is '
p QCρ )cmcal(1− . We can insert the rate of
continuous heat generation per unit length of the cylinder )cmseccal(Q.
11 −−
for the instantaneous heat pulse per unit length given by '
p QCρ . Thus Eq.
2.1 can be written as
+−=
'
'
'
'
'
p
.'
',,.
tD
rrI
tD
)rr(exp
tD
CQrdt)t,r,r(G
244
20
22
π
ρπ (2.2)
For a distributed heat source ''.
)( drrQ ),cmseccal(21 −− which specifies the
rate of heat generation per unit length of the sample, per unit thickness of
cylinder between radius 'r and ,''
drr + the temperature rise at r is calculated
by integrating over all 'r in the cylindrically symmetric medium. Thus for a
distributed and continues heat source, the temperature rise is given by
)t,r,r(Gdrdt)t,r(T ''.
''
∫∫∞
=0
(2.3)
In the limit of low absorptivity, the rate of heat generation between 'r and
'' drr + per unit length of the sample as a result of absorption of a Gaussian
laser beam is given by
''
'.
drr
expJ
P)r(Q
−=
2
2
2
22
ωωπ
α (2.4)
where 1184
−= calJ.J , )(1−α cm is the absorptivity of the sample, P is the
incident laser power and ω is the "e"2
1 beam radius of the laser in the

54 Chapter 2
sample cell, i.e., the radius which encompasses 8601 2 .e =− − of the total
beam power,
( )2''
2
2'
02
''
0
' 122
exp2
2)( −−=
−= ∫∫ ePdrr
rPdrrrI π
ωωππ
ωω
(2.5)
In Eq. 2.4, it has been implicitly assumed that the laser beam size ω is
constant along the cell length.
We can calculate the temperature rise in the medium and can evaluate its
second derivative at r = 0. The integral over 'r in Eq. 2.3 is evaluated to give
+
−
+=∫
∞
''
'''.
tD
rexp
tD
D
kJ
Pdr)t,r,r(G
8
2
8
22
2
2
0ωωπ
α (2.6)
We can evaluate second derivative with respect to r at r=0 before performing
the time integral in Eq. 2.3. Thus
( )22
00
2
2
8
8
)tD(kJ
DPdr)t,r,r(G
r'
r
.
'''.
+
−=
∂
∂
=
∞
∫ ωπ
α (2.7)
The integral over 't in Eq. 2.3 is evaluated to give
∫ +
−=
∂
∂
=
t
'
'
r)tD(
dtD
kJ
P
r
T
0
22
0
2
2
8
8
ωπ
α (2.8)
= ( )∫
+
−t
'
'
tD
dtD
kJ
P
0
22
2
281
8
ω
ω
ωπ
α (2.9)
=
t
'/tDkJ
P
0
2281
1
+
−
ωωπ
α (2.10)

Experimental Methodology 55
=
+ωπ
α−
t2/t1
1
kJ
P
c
2 (2.11)
The characteristic time D
tc4
2ω= , is the response time of the medium to the
heat input.
(iii) Thermal effect on index of refraction
When a laser radiation having a Gaussian profile is incident on the sample,
by absorbing some of the incident energy, the molecules get excited to higher
energy states. Nonradiative de-excitation of these excited molecules
generates a temperature rise which in turn produces density variation in the
medium which creates a refractive index variation given by [3]
∂
∂
∂
∂+
∂
∂=
T
n
T
n
dT
dn ρ
ρρ
(2.12)
is determined primarily by changes in the sample density (second term).
Most liquids expands when heated, resulting in a negative value of dT
dn. The
change in the index of refraction of the illuminated liquid is given by
TdT
dnn ∆=∆ (2.13)
(iv) Focal length of thermal-lens
The formation of an inhomogeneous spatial profile of the refractive index is
nothing but an optical lens. For most liquids the lens formed is a divergent
one and the effective focal length of the lens is calculated by Born and Wolf
[14]. We can write the index of refraction of the cylindrically symmetric

56 Chapter 2
distribution as a Maclaurin series in the radial displacement from the center
of the distribution [3]
( ) ( ) .....r
nr
r
nrnrn
rr
+
∂
∂
+
∂
∂+=
== 0
2
22
02
10 (2.14)
Such distribution has a vanishing first derivative at 0=r .
Fig. 2.3 Diagram for calculation of the focal length of the thermal-lens
Referring to Fig. 2.3, consider the path of ray AB incident parallel to central
axis HM but displaced by a distance rKB = . The ray follows the circular
path BC with radius of curvature R, given by Born and Wolf as
( )nlngrad.vR
1= (2.15)
where v is the unit principal normal at a typical point along BC.
Since we assume that the gradient is only in the radial direction and that the
sample cell is thin (so that point O is fixed), then Eq. 2.15 reduces to

Experimental Methodology 57
0r
2
2
r
n
n
r
r
n
n
1
R
1
=
∂
∂
=
∂
∂
= (2.16)
The ray would normally depart along CE, but refraction at the glass air
interface sends it along CD instead. By construction, DCFBJK =<< and
ECFBHK =<< .
Without refraction, the ray departing along CE would have a virtual image at
H, resulting in a focal length of fHK −=− . Instead the ray departs along
CD and has a virtual image at J, or a focal length 'fKJ −=− .
Snells law of refraction gives
1
2
1
2
)sin(
)sin(
φ
φ≈=
φ
φn (2.17)
since ,1=airn and both 1φ and 2φ are small.
We also have from geometric construction,
( ) 11tan φ≈=φf
r, (2.18)
( ) ,tan 2'2 φ≈=φf
r (2.19)
and hence
nf
f==
φ
φ'
1
2 (2.20)
From ∆ COG,
11)sin( φ≈=φR
l (2.21)

58 Chapter 2
and thus, f
r=φ1 =
R
l (2.22)
Finally,
0
2
2
=
∂
∂=
rr
nl
rR
nl (2.23)
Giving the focal length of the distribution in Eq. 2.14 as
=−= 'fF
1
0
2
2−
=
∂
∂−
rr
nl (2.24)
The radial distribution of the index of refraction in terms of the radial
temperature distribution is given by repeated use of chain rule. Since
0r
T
0r
2
2
=
∂
∂
=
, Eq. 2.24 becomes
=F
1
0
2
2−
=
∂
∂
−
rr
T
dT
dnl (2.25)
We can see in Eq. 2.25 how the strength of the thermal-lens depends on the
temperature distribution in the sample. Both dTdn / and
0
2
2
=
∂
∂
rr
Tare
negative and hence the thermal-lens is divergent )0F( < . Putting the value of
0
2
2
=
∂
∂
rr
Tfrom Eq. 2.11 in Eq. 2.25, the focal length F of the resulting
thermal-lens is obtained as
+=
t
t
)dT/dn(lP
kJ)t(F c
21
2
α
ωπ (2.26)

Experimental Methodology 59
Eq. 2.26 assumes that conduction is the dominant mechanism of heat
dissipation.
The thermal-lens develops over a period of tenths of milliseconds. During
that time, the laser beam may be observed as a spot on a plane located a few
meters past the sample. The spot “blooms” or increases in size. It is not
actually necessary to measure the size of the spot; a tiny photodiode detector
positioned carefully at the center of the spot produces a photocurrent which
is proportional to the laser intensity on axis and thus inversely proportional
to the beam area. As the area blooms, the photocurrent diminishes according
to the expression [15]
( ) ( ) ( )1
221
0 212
1211
−
−−
+++−= ttttItI cc θθ (2.27)
Here the parameter θ is proportional to the power degraded as heat thP ,
laser wavelength λ and the other thermo optic parameters of the material as
( ) ,kdTdnPth λ=θ where )/( dTdn is the temperature dependence of the
refractive index.
(v) Sensitivity of the thermal-lens measurement
The sensitivity of thermal-lens signal can be understood by comparing it
with conventional UV/Vis spectrophotometry. In UV/Vis spectrometry the
absorbance, A, of a solution is given by Beer’s Law
AeII −= 0 (2.28)
where 0I is the initial intensity and ,lcA α= where α is the molar
absorption coefficient, c is the concentration of the solution and l is the

60 Chapter 2
length of the medium. For a weakly absorbing solution the relative change in
the signal, I∆ , can be written as
AII 0=∆ (2.29)
Hence
AI
IS A =
∆
∆=
0
(2.30)
In thermal-lens technique the thermal gradient established after optical
absorption and thermal relaxation of the sample results in a change in
intensity at the beam center owing to the induced beam divergence. The
thermal-lens signal is expressed as the relative change in power
λ=
∆=
−=
dT
dn
k
AP
I
I
I
IIS
303.20 (2.31)
where 0I and I are the transmitted power before and after the formation of
the thermal-lens respectively, A is the absorbance, P is the excitation laser
power and λ is the laser wavelength. Eq. 2.31 can be written as [16]
AEI
I303.2=
∆ (2.32)
where k
dTdnPE
λ=
)/( (2.33)
Comparing Eqs. 2.30 and 2.32 for the same absorbance, it is clear that the
thermal-lens signal is increased by a factor E, called the enhancement factor.
The enhancement factor is a function of the thermodynamic and optical
properties of the medium and on the power used to excite the sample. Thus
the sensitivity of the photothermal method can be increased by using
Experimental Methodology 61
solvents with high refractive index gradient and low thermal conductivity for
a given power. The thermal-lens signal is inversely proportional to the square
of the excitation beam waist, while the sensitivity is independent of the beam
size. The selectivity of thermal-lens technique is hindered by the limited
wavelength range of available lasers and is most frequently confined to
single wavelength only.
(vi) Restrictions imposed on the thermal-lens model
There are several important restrictions implicit in the development of the
thin lens approximation, the most crucial being on the path length of the
sample cell. The model described earlier, assumed an index of refraction
distribution which remains constant along the beam path through the cell,
requiring that the laser beam remains reasonably well collimated over this
distance. The depth of focus, or Rayleigh length, of a laser beam is related to
focal spot size 0ω and the wavelength λ by λ
ωπ=
2
0b . The parameter
( )cmb , also called the confocal length, is the distance which the beam
expands from its minimum size to a radius 02 ω . The analysis of Gordon et
al. assumes a sample length which is a fraction of confocal length of the
incident beam. An additional restriction is that the cell edge should be short
compared with the focal length of the thermal-lens. The third restriction is
that the absorbed power must be limited to avoid full wave shifts in the phase
front of the laser beam which would otherwise lead to interference fringes in
the transmitted beam, a phenomenon known as spherical aberration. Such
strong aberration must be avoided under normal circumstances, either by use
of lower laser power, shorter path lengths, or more dilute samples. Finally it

62 Chapter 2
is implicitly assumed that heat travels out of the illuminated region of the
sample by conduction.
2.2.3 Measurement approach
According to the principle of operation, thermal-lens instruments can be
classified into two basic categories, namely single-beam and dual-beam
(pump/probe) configuration.
(i) Single-beam setup
Single-beam thermal-lens spectrometers are unique among the thermal-lens
instruments because the same laser beam is used to excite the sample and to
simultaneously probe the thermal-lens generated. Single-beam instruments
were widely used in the early stages of the thermal-lens technique. This setup
was applied to study the dependence of the thermal-lens effect on parameters
such as laser power, beam divergence, sample length, concentration,
convection and flow [17-19]. A schematic of a single-beam thermal-lens
spectrometer is shown in Fig. 2.4.
Fig. 2.4 Schematic of a single-beam thermal-lens spectrometer

Experimental Methodology 63
Application of the thermal-lens technique in chemical analysis has not been
realized until 1979 when Dovichi and Harris [5] used the technique to detect
Cu (11) as EDTA complexed at ppm levels. The use of single-beam
experiment, in general, is due to the relative simplicity of such an instrument
and ease of operation compared to dual-beam instruments, i.e., only one laser
is used to generate and to detect the thermal-lens. In a single-beam thermal-
lens instrument the laser beam is focused with a lens and modulated by a
chopper or a shutter. After passing through the sample, the beam center
intensity is usually measured in the far field with a photodiode placed behind
a pinhole. The photodiode output is amplified and fed into a digital storage
oscilloscope which facilitates the recording of transient changes in the beam
center intensity.
(ii) Dual-beam setup
In single-beam configuration we use a single laser source to provide both
sample excitation and the means of probing the heat produced by the absorption
process. In many cases the use of separate laser sources for the ‘pump’ and
‘probe’ beams can provide significant benefits in performance. In the case of
experiments where we have to change the excitation wavelength, the detector
should be carefully chosen and corrected taking into account its wavelength
response. This problem can be overcome by the dual-beam technique [20-25]. In
a dual-beam setup the generation and detection of the thermal-lens are achieved
separately by a modulated pump beam and an unmodulated probe beam,
respectively. Good spatial overlapping of both beams inside the sample is
necessary for optimal sensitivity. The alignment and combining of the two
beams is facilitated by a beam splitter or a dichroic mirror. A schematic of dual-
beam thermal-lens spectrometer is shown in Fig. 2.5.

64 Chapter 2
Fig. 2.5 Schematic of a dual-beam thermal-lens spectrometer
2.2.4 Instrumentation
The essential components of the apparatus used for dual-beam experimental
setup are: (i) pump (modulated continuous wave or pulsed) and probe lasers
(low power, intensity stabilised) (ii) chopper (iii) a sample cell (iv) a means of
detecting the thermal-lens signal and (v) signal processing unit.
(i) Pump and probe lasers
A diode pumped solid state (DPSS) laser (Coherent Inc., mW20 ) operating at
532 nm wavelength is used as the pump laser for the works presented in the
thesis. This creates thermal-lens in the medium and thermal-lens is probed by
the probe beam. A low power, intensity stabilized He–Ne laser (Melles
Griot, mW1 ) is used to probe the thermal-lens generated in the sample.
(ii) Chopper
For dual-beam CW thermal-lens measurements, the pump laser beam was
modulated using a mechanical chopper (SR 540, Stanford Research Systems).

Experimental Methodology 65
Mechanical chopper is the simplest form of a modulator consisting of a
rotating slotted disk placed in the path of light beam. It offers 100%
modulation depths for frequencies from a few Hz to 5-8 KHz.
(iii) Sample cell
The sample is most often taken in a standard square cuvette. Quartz cuvette of
path length 1cm is used for the present studies.
(iv) Detection of thermal-lens
The changes in laser beam intensity which result from the thermal-lens effect
are most frequently monitored by a monochromator-PMT assembly but a
photovoltaic detector such as silicon photodiode can also be used. A
monochromator is a spectrometer capable of measuring a single wavelength
which can be scanned through a wide wavelength range. Monochromator
consists of fixed entrance and exit slits, fixed focusing mirrors and a rotatable
diffraction grating. As the grating rotates different wavelength is focused onto
the exit slit. The spectral resolution depends on the widths of the slits, the
choice of grating and focal length. Grating monochromators may have planar
or concave gratings. Planar gratings are produced mechanically and may
contain imperfections in some of the grooves. Concave gratings are usually
produced by holographic methods and imperfections are usually rare. PMT
consist of a photocathode and a series of dynodes in an evacuated glass
enclosure. Photons that strikes the photoemissive cathode emits electrons due
to the photoelectric effect. Instead of collecting these few electrons at an anode
like in the phototubes, the electrons are accelerated towards a series of
additional electrodes called dynodes. These electrodes are each maintained at a
more positive potential. Additional electrons are generated at each dynode.
This cascading effect creates 105 to 10
7 electrons for each photon hitting the
66 Chapter 2
first cathode depending on the number of dynodes and the accelerating
voltage. This amplified signal is finally collected at the anode where it can be
measured. The monochromator-PMT assembly, Monora 201, Dongwoo
Optron Co. Ltd, is used for the thermal-lens studies.
(v) Thermal-lens signal analysis
The thermal-lens strength is most frequently measured as a relative change in
the beam center intensity. Only two values of the beam center intensity, initial
intensity I0 and intensity at some later time during the excitation )t(I are, in
principle, needed to calculate the thermal-lens strength. A digital storage
oscilloscope can be conveniently used to record the thermal-lens signal and
hence to find 0I and ).t(I The digital storage oscilloscope used for the present
study is APLAB (D36200CA, 200 MHZ). Digital oscilloscopes sample signals
using a fast analog-to-digital converter (ADC). At evenly spaced intervals, the
ADC measures the voltage level and stores the digitized value in high-speed
dedicated memory. The shorter the intervals, the faster the digitizing rate, and
the higher the signal frequency which can be recorded. The greater the
resolution of the ADC, the better the sensitivity to small voltage changes.
Captured waveforms can be expanded to reveal minute details.
A very efficient and rapid approach to eliminate signal noise is the use of lock-
in amplifier, which is suitable for the dual-beam thermal-lens configuration.
Lock-in amplifier is used to detect and measure very small AC signals. Lock-
in amplifiers use phase-sensitive detection to single out the component of the
signal at a specific reference frequency and phase. Noise signals at frequencies
other than the reference frequency are rejected and do not affect the
measurement. Stanford research systems (SR 830) Lock-in amplifier is used
for the works presented in this thesis.

Experimental Methodology 67
2.2.5 Applications of thermal-lens technique
The sensitive thermal-lens technique can be used for a wide variety of
applications. Some of the important applications are listed below.
(i) Determination of fluorescence quantum yield
Fluorescence quantum yield is one of the key photophysical quantities that are
amenable to direct experimental determination. The quantum yield of
fluorescence is a measure of the rate of nonradiative transitions that compete
with the emission of light. The knowledge of fluorescence quantum efficiency
of organic dyes and its concentration dependence are essential for selecting
efficient laser media. Conventional measurements require the use of accurate
luminescence standard samples and comparison of the given sample with a
standard for which the fluorescence yield is known. The reliability of such
relative determinations is then limited by both the accuracy of the standard yield
value and by the confidence that can be placed on the comparison technique.
Even after making various corrections for system geometry, re-absorption,
polarization, etc., the accuracy of the quantum yield values obtained from
photometric measurements is rather poor. In order to evaluate absolute quantum
efficiency, we have to consider both the radiative and nonradiative processes
taking place in the medium. As the contribution from nonradiative processes is
not directly measurable using the traditional optical detection methods, thermo-
optic techniques such as photoacoustic and thermal-lens methods have been
adopted recently for this purpose. Measurements based on photothermal effects
are capable of giving fluorescence yields of fluorescent solutions with high
accuracy and reproducibility.

68 Chapter 2
(ii) Determination of metal ions
The determination of chromium, especially Cr (III) and Cr (VI) in
environmental and biological systems, is currently of considerable interest
because the essentiality or the toxicity of chromium compounds, including
humans, depends on its oxidation state. Cr (III) is considered as essential in
mammals and Cr (VI) is toxic because of its oxidizing capability and adverse
impact on lung, liver and kidney. The applicability of thermal-lens
spectrometry for quantification and routine determination of hexavalent
chromium was investigated by Sikovec et al. using a collinear dual-beam
thermal-lens spectrometer [26]. The authors have validated the technique by
comparison between thermal-lens technique results on realistic samples with
results obtained by atomic absorption spectrometry (AAS) and by the
determination of Cr (VI) in standard reference materials (SRM). The results
have demonstrated that the thermal-lens technique is a reliable and accurate for
the determination of Cr (VI) with a detection limit of 0.1 µg l–1
, confirming its
high degree of sensitivity.
The determination of iron is very important for environmental and biological
studies because of the influence of its chemical forms on the bioavailability of
iron and physicochemical and toxicological properties of the other trace
elements. The low concentration of iron present in a natural medium
necessitates the use of a sensitive procedure for its determination. Natural iron
concentrations in real water samples have been determined by thermal-lensing
by Seibel and Faubel [27]. Thermal-lens spectrometry has been used for the
determination of iron in calf serum by Legeai and Georges [28]. There is a
continuing interest toward developing and evaluating highly sensitive analytical
techniques for determining the concentration of trace of heavy metals in
environmental and biological samples.

Experimental Methodology 69
(iii) Heat of reactions, energetics and kinetic studies
Suzuki et al. successfully employed thermal-lens technique to study heats of
reaction, energetics and reactivity of photocyclisation of diphenylamine which
highlights the potential for thermal-lens in fundamental studies of reaction
kinetics and energetics [29]. In this study a pulsed XeCl excimer laser as a
light source and an IR diode laser as a probe laser. Since the time resolved
method detects time dependent heat emitted through radiationless transitions,
metastable and excited state information can be obtained which is not
obtainable by other techniques such as flash photolysis. This twice–resolved
thermal-lens signal in the 1-10 sµ regions yielded a time profile from which
the rate constants for the decay of diphenylamine and the growth of ground
state dihydrocarbazole could be determined. The heat emitted was also
quantitatively determined by comparing the ratio of energy released as heat to
absorbed photon energy. The authors were able to determine the required
values of H∆ and the relative energetics of the triplet and singlet states of
dihydrocarbazole.
(iv) Thermal-lens effect in glass
Sampaio et al. applied thermal-lens spectrometry to study fluoride glasses as a
function of temperature [30]. The experiments, in the temperature range
between 20 and 300 0C, were performed to determine how the thermal-lens
technique can be compared with conventional differential thermal analyses
(DTA) method. Their results showed that the temperature dependence of the
thermal-lens signal amplitude provided a better definition in locating the glass
transition as compared to the DTA data. Lima et al. applied thermal-lens
technique to determine the thermal diffusivites, temperature coefficient of
optical path length changes, dT/ds and the fluorescence quantum efficiencies

70 Chapter 2
of several glasses such as fluorides, chalcogenides, chalcohalides, soda lime
and low silica calcium aluminosilicate [31].
2.3 Photoacoustic technique
2.3.1 Introduction to photoacoustic technique
Photoacoustic (PA) spectroscopy, also known as opto-acoustic spectroscopy,
is one of the families of photothermal techniques, which are based on the
conversion of light into thermal energy. Photoacoustic spectroscopy deals with
the generation of acoustic waves by any type of incident energetic beam
ranging from radio frequency to X-ray.
The PA effect was discovered by Alexander Graham Bell in 1880 while
experimenting on the transmission of sound via a beam of collimated sunlight
[32]. Bell discovered that modulated light can directly generate sound when
absorbed by solid or gaseous samples. In a series of experiments, he found out
most of the basics of PA spectroscopy and correctly interpreted his findings as
thermal expansion of matter due to the warming following the absorption of
light. He described the correlation between the absorbance of material exposed
to light and the generated acoustical signal and proposed that the effect can be
employed to investigate the optical properties of materials in the invisible part
of the optical spectrum. Bell [33] and, at the same time, Tyndall [34] and
Roentgen [35] performed several experiments with intense beams of sunlight
and arc lamps, modulated by rotating slotted disks and directed onto
transparent solid and gas samples, which generated intense acoustical signals.
Viengerov was able to measure CO2 concentrations down to ~ 0.2 vol % in N2,
using a Nernst glower as IR light source and an electrostatic microphone as
detector, thus presenting the first application of PA spectroscopy for
quantitative analysis [36]. Rosencwaig and Gersho laid the theoretical

Experimental Methodology 71
foundation of all further works on PA spectroscopy, formulating the famous
Rosencwaig–Gersho (R-G) theory [37].
2.3.2 Fundamental principle of photoacoustic technique
The underlying principle of PA is the thermal waves produced in a sample due
to the absorption of incident energetic beam. The different stages in PA signal
generation is shown in Fig. 2.6.
Fig. 2.6 Different stages in PA signal generation
The absorption of incident beam and the subsequent nonradiative de-excitation
―relaxation process give rise to a heat source in the sample, which may be
distributed throughout its volume or confined to its surface. This heat source
Modulated Laser
beam
Local Absorption
Local Temperature
Increase
Adiabatic Expansion
Pressure Wave
Generation
Acoustic Resonance
Amplification
Modulated
Photoacoustic Signal

72 Chapter 2
give rise to pressure fluctuations, which is coupled to air in contact with the
surface and thus acoustic waves are produced. Physically, nonradiative de-
excitation in the sample by the incident beam depends not only on light to heat
conversion efficiency, but also on how the heat diffuses through the sample. The
detected PA signal strongly depends on the interplay of these three factors and
this dependence is the main reason underlying the versatility of PA technique.
The fact that the PA signal strongly depends on how the heat diffuses through
the sample allows us to perform not only thermal characterization of the sample
(i. e., measurement of its thermal properties like thermal diffusivity and
conductivity) but also to conduct thermal imaging. This is due to the fact that the
thermal wave generated by the absorption of an incident energetic pulse may be
reflected and scattered as it encounters cracks, defects and so on, thereby
affecting the detected signal. One of the principal advantages of photoacoustic
spectroscopy is that it enables one to obtain spectra similar to optical absorption
spectra on any type of solid or semisolid material, whether it be crystalline,
powder, amorphous, smear, gel, etc. This capability is based on the fact that only
the absorbed light is converted to sound. Scattered light, which presents a
serious problem when dealing with many solid materials by conventional
spectroscopic techniques, produces no difficulties in photoacoustic
spectroscopy.
2.3.3 Theory of photoacoustic technique
According to R-G theory, which is based on the one dimensional heat flow
model, the sound waves detected by the microphone depends on the acoustic
pressure disturbance at the sample-gas interface. The generation of surface
pressure disturbance, in turn, depends on the periodic temperature fluctuations
at the sample gas interface. Rosencwaig and Gersho developed an exact

Experimental Methodology 73
expression for the temperature fluctuations by treating the acoustic disturbance
in the gas in an approximate heuristic manner.
The theoretical formulation of the R-G model [37] is based on the light
absorption and the thermal wave propagation in an experimental configuration
as shown in Fig. 2.7. Here, the sample, which is in the form a disc having a
thickness, l is in contact with backing material of low thermal conductivity
and of thickness bl . The front surface of the sample is in contact with a gas
column of length gl . The backing and the gas are considered to be non-
absorbing at the incident wavelength. Following are the parameters used in the
theoretical explanation of R-G model.
The thermal conductivity k , the density ρ , the specific heat capacity C , the
thermal diffusivity CkD ρ= , the thermal diffusion coefficient Da 2ω=
where ,fπω 2= with f modulation frequency of the incident light beam,
and the thermal diffusion length a/1=µ .
Fig. 2.7 Schematic representation of PA experimental configuration
The thermal diffusion equation in the three regions by taking into account of
the heat diffusion equation can be written as [37]
Incident light
gπµ2 gl
Boundary
layer of gas Gas Backing
material Sample
Xl− )ll( b+− 0

74 Chapter 2
( )tixee
k
I
tDx
ωβηβθθ+−
∂
∂=
∂
∂1
2
1 0
2
2
for 0≤≤− xl (2.34)
tD
1
x b
2
2
∂
θ∂=
∂
θ∂ for ( ) lxll b −≤≤+− (2.35)
tD
1
x g
2
2
∂
θ∂=
∂
θ∂ for glx ≤≤0 (2.36)
where θ is the temperature and η is the light to heat conversion efficiency
respectively. Here the subscripts b and g represent the backing medium and
gas respectively. The real part of the complex valued solution )t,x(θ of
these equations has physical significance and it represents the temperature
fluctuations in the gas cell as a function of position and time.
After imposing appropriate boundary conditions for the temperature and heat
flux continuity, and neglecting convective heat flow in the gas at steady-state
conditions, the explicit solution for the complex amplitude of the periodic
temperature at the solid-gas boundary can be obtained as
−−−++
−+−+−+−
−=
−
−−
ll
lll
e)b)(g(e)b)(g(
e)rb(e)b)(r(e)b)(r(
)(k
I
σσ
βσσ
σβ
βθ
1111
21111
2 22
00 (2.37)
where ka
akb bb= ,
ka
akg
gg= , ( ) air 21 β−= and ( ) ai+=σ 1
The periodic thermal waves, which are rapidly attenuating, damped
completely as it travels a distance equal to gµπ2 , where gµ is the thermal
diffusion length in gas. Thus the gas column within this distance expands
and contracts periodically so that it acts as an acoustic piston for the
remaining gas in the PA cell. Assuming that the rest of the gas responds

Experimental Methodology 75
adiabatically to the action of acoustic piston, the adiabatic gas law can be
used to derive an expression for the complex envelope of the sinusoidal for
the pressure variation Q as
gg alT
PQ
0
00
2
θγ= (2.38)
where ,γ 0P and 0T are the ratio of heat capacities of air, ambient pressure
and temperature respectively. Eq. 2.38 can be used to evaluate the magnitude
and phase of the acoustic pressure wave in the cell due to PA effect. This
expression takes a simple form in special cases.
1. Optically transparent solids ( )ll >β
Case1 (a): Thermally thin solids ( )βµµ l;l >>>
We can set lel ββ −≅− 1 , 1≅± l
eσ and 1>r in Eq. 2.38 and we obtain
( )Y
ka
liQ
b
b
g
−=
µβ
2
1 (2.39)
with
glT
IPY
0
00
22
γ=
Now the acoustic signal is proportional to lβ and varies as 1−f . Moreover,
the signal is now determined by thermal properties of the backing material
Case 1(b): Thermally thin solids ( )βµµ l;l <>
We can set lel β−≅β− 1 , ( )le
l σσ +≅± 1 and 1<r in Eq. 2.38 and we obtain
( )Y
ka
liQ
b
b
g
−≅
µβ
2
1 (2.40)

76 Chapter 2
The acoustic signal now behaves in the same fashion as in the previous case.
Case l(c): Thermally thick solids ( )βµµ l;l <<<
lel ββ −≅− 1 , 0≅− l
eσ and 1<<r , in Eq. 2.38 and we obtain
Yka
iQg
−≅
µβµ
2 (2.41)
Now, only the light absorbed within the first thermal diffusion length
contributes to the signal in spite of the fact that light is being absorbed
throughout the length of the sample. Also since ( )l<µ , the backing material
does not have any contribution to the signal. Interestingly, the signal now
varies as .5.1−
f
2. Optically opaque solids ( )ll <<β
Case 2(a): Thermally thin solids ( )βµµ l;l >>>>
We can set 0≅− le
β , 0≅σ± le and 1>>r , in Eq. 2.38 and we obtain
Yka
iQ
b
b
g
µ−≅
2
)1( (2.42)
Now the signal is independent of β , which is valid for a perfect black
absorber such as carbon black. The signal will be much stronger compared to
the case 1(a) and varies as 1−f , but still depends on the properties of backing
material.
Case 2 (b): Thermally thick solids ( )βµµ l;l ><
We can set 0≅β− le , 0≅σ− l
e and ;r 1> in Eq. 2.38 and we obtain

Experimental Methodology 77
( )Y
ka
iQ
g
µ−≅
2
1 (2.43)
Equation 2.43 is analogous to Eq. 2.42, but the thermal properties of backing
material are now replaced with those of the sample. Again the signal is
independent of β and varies as 1−f .
Case 2 (c): Thermally thick solids ( )βµµ l;l <<<
We can set 0≅− le
β , 0≅− le
σ and 1<r in, Eq. 2.38 and we obtain
Yka
iQg
−≅
µµβ
2 (2.44)
This is very interesting and important case. Even though the solid is optically
opaque, the photoacoustic signal is proportional to β as long as 1<µβ . As
in case 1 (c), the signal is independent of the thermal properties of the
backing material and varies as 51.f
− . The R-G theory also predicts the linear
dependence of PA signal to light intensity.
The one dimensional R-G theory of PA effect is quite successful in that, its
variation can be successfully applied to evaluate thermophysical parameters
such as thermal effusivity of solid and liquid samples, with high accuracy [38].
2.3.4 Instrumentation
The essential components of the apparatus used for photoacoustic
spectroscopy are: (1) a source of periodic radiation (i.e., modulated
continuous wave or pulsed) in the spectral region of interest; (2) a PA cell;
(3) a means of detecting the acoustic signal and (4) signal processing equipment.
78 Chapter 2
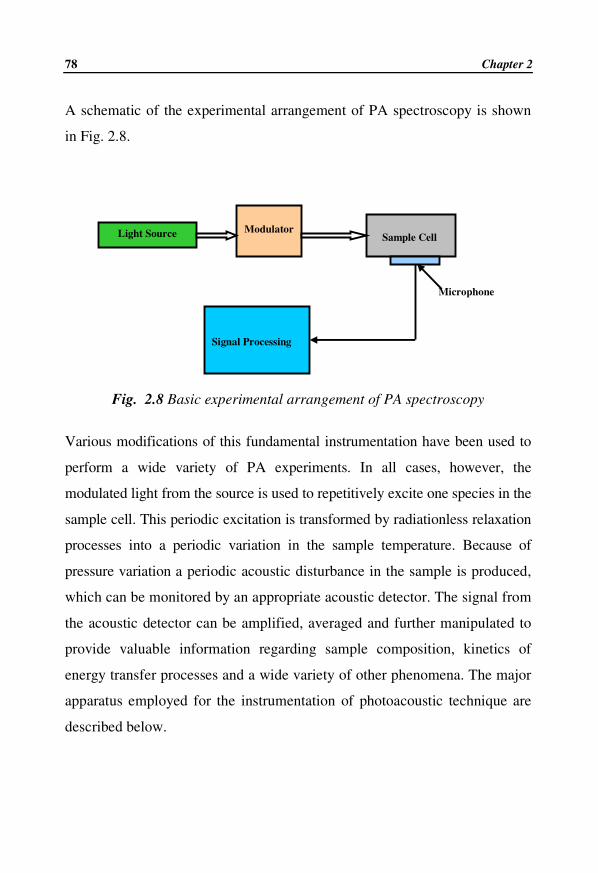
A schematic of the experimental arrangement of PA spectroscopy is shown
in Fig. 2.8.
Fig. 2.8 Basic experimental arrangement of PA spectroscopy
Various modifications of this fundamental instrumentation have been used to
perform a wide variety of PA experiments. In all cases, however, the
modulated light from the source is used to repetitively excite one species in the
sample cell. This periodic excitation is transformed by radiationless relaxation
processes into a periodic variation in the sample temperature. Because of
pressure variation a periodic acoustic disturbance in the sample is produced,
which can be monitored by an appropriate acoustic detector. The signal from
the acoustic detector can be amplified, averaged and further manipulated to
provide valuable information regarding sample composition, kinetics of
energy transfer processes and a wide variety of other phenomena. The major
apparatus employed for the instrumentation of photoacoustic technique are
described below.
Light Source
Modulator
Sample Cell
Signal Processing
Microphone

Experimental Methodology 79
(i) Light sources
The classical lamp/monochromator and the laser are two types of light
sources currently in use for PA spectroscopy. The lamp/monochromator
combination can provide continuous tunability from the infrared to
ultraviolet. A major limitation of this source is the modest bandwidth-
throughput product. The lamp/monochromator combination is generally used
with strongly absorbing samples or where low resolution suffices. But lasers,
with their nearly monochromatic high spectral brightness, have significant
advantages over lamp/monochromator combinations which account for their
wider acceptance as PA spectroscopy light sources. A laser output is highly
collimated, with cylindrical beam symmetry being ideal for exciting radial
resonances in a PA cell.
(ii) Modulation techniques
Several devices such as optical choppers, electronic shutters and acousto-
optic (AO) modulators are available for efficient and accurate modulation of
CW laser beams. Choppers are more appropriate, particularly when high
excitation powers are used (several hundred mW ). This is because heating
of the chopper blade is minimized due to its constant motion.
(iii) Cell design
Most common acoustic cell designs adopt the basic symmetry of the exciting
light source and are cylindrically shaped sample containers. The excitation
source is a smaller diameter light beam centered along the cylinder axis.
Local heating caused by light absorption and subsequent relaxation generates
a local pressure increase which propagates radially outward perpendicular to
the exciting beam.
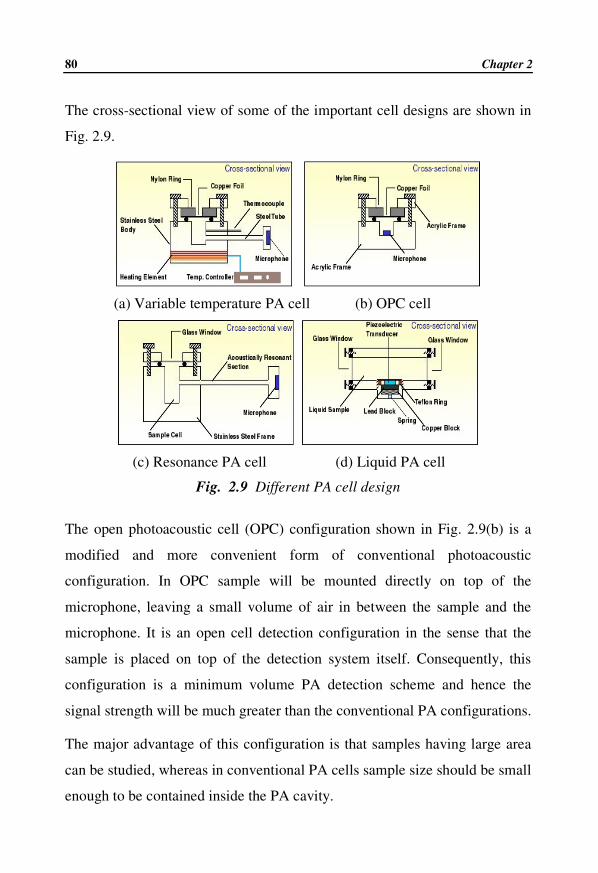
80 Chapter 2
The cross-sectional view of some of the important cell designs are shown in
Fig. 2.9.
(a) Variable temperature PA cell (b) OPC cell
(c) Resonance PA cell (d) Liquid PA cell
Fig. 2.9 Different PA cell design
The open photoacoustic cell (OPC) configuration shown in Fig. 2.9(b) is a
modified and more convenient form of conventional photoacoustic
configuration. In OPC sample will be mounted directly on top of the
microphone, leaving a small volume of air in between the sample and the
microphone. It is an open cell detection configuration in the sense that the
sample is placed on top of the detection system itself. Consequently, this
configuration is a minimum volume PA detection scheme and hence the
signal strength will be much greater than the conventional PA configurations.
The major advantage of this configuration is that samples having large area
can be studied, whereas in conventional PA cells sample size should be small
enough to be contained inside the PA cavity.

Experimental Methodology 81
(iv) Acoustic detectors
Several devices exist for detecting the acoustic disturbance generated by
sample absorption. They can be broadly classified into three groups: pressure
sensors, refractive index sensors and temperature sensors. Most PA
experiments utilize pressure sensors, the most common of which are
microphones.
A condenser microphone produces an electrical signal when a pressure wave
impinging on the diaphragm pushes the diaphragm closer to a fixed metal
plate, thereby increasing the capacitance between these two surfaces. The
capacitance change leads to a voltage signal Vs which increases with bias
voltage VB and diaphragm area Am. Condenser microphones generally have
flat frequency response to 15 kHz, have low distortion, are generally not
sensitive to mechanical vibrations and respond well to pressure, impulses,
which enable their use in pulsed applications. The dielectric material
between the condenser plates in this type of microphone is air. In contrast to
condenser microphones, electret microphones [37] are constructed using
solid materials of high dielectric constant which are electrically polarized.
One side of the electret foil is metallized and the insulating side is placed on
a fixed back plate. A sound wave impinging on the metallized side causes a
change in the polarization characteristics of the electret material which in
turn produces a small voltage between the metallized front electret surface
and the back plate of the microphone. Thus, an electret microphone requires
no bias voltage, which affords a simplification of the apparatus needed.
Another striking difference between air spaced condenser microphones and
electret microphones is physical size. Due to the large capacitance per unit
area possible from electret materials, they can be made into miniaturized
microphones.

82 Chapter 2
(iv) Photoacoustic signal processing
Signal processing in photoacoustic experiments entails three stages:
amplification, filtering and signal averaging. Amplifiers should be very low-
noise, broad-banded (~MHz) devices in order to prepare the signal for the
averager. Depending on the information desired, filtering might involve the
use of a high-Q filter to select the dominant frequency component in the
complex acoustic signal, the use of band pass filtering to discriminate
especially against 1−f noise, or the use of no filtering at all to accurately
reproduce the time evolution of the acoustic signal. The amplified and
filtered signal is then processed by lock-in amplifiers.
2.3.5 Applications of photoacoustic technique
(i) Depth profile analysis and microscopy
One of the important features of the PA technique is the potentiality of this
technique to detect subsurface variations in both optical and thermal
properties of the sample. The studies are called PA imaging and are
essentially classified in to two categories. PA imaging is mainly concerned
with the variations of the sample properties along its thickness, the technique
is called PA depth profiling. The depth profile analysis is performed by
measuring the PA signal amplitude and phase as a function of modulation
frequency. The PA signal is sensitive to the heat generated within one
thermal diffusion length ( ) 21 /f/D πµ = beneath the sample surface. Here
D , is the sample thermal diffusivity and f is the modulation frequency.
Thus, at high modulation frequency the PA signal comes deeper within the
sample. If however high lateral resolution is required, the PA imaging is
called PA microscopy. The potentialities of PA depth profile analysis were
originally demonstrated by Adans and kirkbright [39] for the simple case of

Experimental Methodology 83
two layer sample consisting of a top transparent layer of thickness l on an
optically thick substrate. The specific example used by these authors to
illustrate PA depth profile capability was that of a polymer coating on a
copper substrate. The PA depth profile technique can provide not only
information about the thickness of a surface layer, the thermal diffusivity of a
coating, or irregularities below the surface, but also about depth dependent
spectral features.
(ii) Thermal diffusivity measurements
The quantity which measures the rate of heat diffusion in the sample is the
thermal diffusivity ‘ D ’. Apart from its own intrinsic importance, its
determination gives the value of thermal conductivity k , if the density ρ and
the thermal capacity at constant pressure are known, since
ckD ρ= (2.45)
The importance of D as a physical parameter to be monitored is due to the
fact that, it is unique for each material. Furthermore, thermal diffusivity is
known to be extremely dependent upon the effect of compositional and
microstructural variables [40], processing conditions, as in the case of
polymers [41-43], Glasses [44] and ceramics [40]. Thermal diffusivity of
many materials can be accurately measured by PA technique. This was first
demonstrated by Adams and kirkbrigt [45]. The authors have used PA
method to obtain thermal diffusivity values of copper and glass by plotting
the phase angle φ of the PA signal as a function of the square root of the
chopping frequency ω .
84 Chapter 2
(iii) Biological applications
In many cases PA technique is an alternative method for studying biological
materials not suitable for conventional spectroscopic techniques such as
transmission or reflectance, due to scattering properties. The capability of PA
technique for obtaining biological spectra of samples of different types has
been illustrated by Rosencwaig [46]. Balasubramanian et al. used this
technique to monitor the malaria parasite in order to establish the nature of
this pigment, provide direct evidence of drug interaction in the parasite and
distinguish drug sensitive strains of resistant microorganism [47].
Various examples of the use of PA technique on intact green leaf have been
reported. For example, Lima et al. [48] presented evidence that PA technique
can be very useful complementary tool in assessing plant productivity at
some stage of its development. In addition to the usual spectroscopic
information such as band position and relative intensities, PA spectroscopy
can offer new information that arises uniquely from the combination of the
spectroscopic and calorimetric phenomena that comprise the PA Effect. This
information includes quantum yield, life times from various metastable
excited states and the kinetics of relaxation pathways of photobiological
systems [49].
The frequency dependence of the PA signal can give information on the
amounts of energy stored in the intermediates of biologial photoprocesses
[50-55]. Cahen et al. [50-51] studied photosynthesis of lettuce chloroplasts.
Carpentier et al. [52-54] reported the use of PA spectroscopy to study the
photosynthesis of algaue and leaves. The same group used the technique to
monitor the photosynthetic energy storage in hetrosystems. In the area of
dermatology, PA spectroscopy has been used particularly for studying the

Experimental Methodology 85
effects of active drugs in the skin. This was first demonstrated by Campbell
et al. [55] by carrying out drug detection and determination of drug diffusion
rate in the human skin. Using an open ended cell, Giese et al. [56] reported
measurements on human skin treated with sunscreens. Poulet and chambron
[57] described an open ended cell for in-vivo PA spectroscopy of the skin.
As demonstrated by the authors a satisfactory signal to noise ratio can be
obtained by using a differential microphone. In the area of food stuff quality
control many applications of PA technique on the monitoring of food stuffs
adulterants have also appeared in the literature [58].
(iv) Photoacoustic spectroscopy for aerosol characterization
Aerosols are fine particles in a size range between a few nanometers to
several micrometers suspended in gases. The first diode-laser based
instrument for atmospheric soot measurements was presented by Petzold
et al. in 1993 [59-60]. As opposed to most other analytical problems, the aim
of optical measurements on aerosols is the optical properties itself rather than
concentration of analyte. The optical properties are highly relevant for the
calculation of radiation balance in the context of global climate modeling.
Most PA systems developed for aerosol measurements are meant for the
characterization of their optical properties. Typical applications of PA-based
atmospheric aerosol measurements are demonstrated in many large-scale field
studies regarding aerosol distribution and their climate relevance [61-62].
(v) Industrial process analysis
PA spectroscopy can be employed for the analysis of food stuff. However, the
limited selectivity of optical absorption measurements restricts this field of
application to cases where the optical properties themselves are the target of the
analysis. Examples are the quantification of carotene in margarine [63] or the

86 Chapter 2
determination of colorant additives in different types of food [64-66]. Yang et al.
tested FTIR/PA for application in food analysis, e.g. for the quantification of
proteins, fats, water and carbohydrates in meat [67-69]. The same group
compared the capabilities of FTIR/PA with conventional attenuated total
reflection (ATR) and diffuse reflectance-FTIR and with NIR spectroscopy. PA-
induced ultrasound was also developed for the analysis of pulp in the process of
paper manufacture [70].
Conclusions
To conclude photothermal techniques are an ultrasensitive means to measure
optical absorbance. The field of photothermal science has partially fulfilled
some of its promises since its rediscovery, almost fifteen years ago, by
Rosencwaig. Yet its potential as a research and analytical tool seems to be
not fully explored and each year new routes for developments are being
opened up. Its ease of operation and versatility, together with the wealth of
information contained in the photothermal signal, warrants us that further
areas of applied research will adapt these techniques to their own uses. This
chapter described a survey about the state-of-the-art of two photothermal
techniques ― Thermal-lens technique and laser induced photoacoustic
technique. Both these techniques are nondestructive and noncontacting
measuring methods correlating the thermal and optical properties of
materials. They have gained a substantial progress during the last 10 years,
due to intensive research work. It is hoped that these systematic
measurement methods will a play a major role in the industrial applications
of the coming future.
Experimental Methodology 87
References
[1] J.P. Gordon, R.C.C. Leite, R.S. Moore, S.P.S. Porto, J.R. Whinnery,
Bull. Am. Phys. Soc. 9, 501 (1964)
[2] J.P. Gordon, R.C.C. Leite, R.S. Moore, S.P.S. Porto, J.R. Whinnery,
J. Appl. Phys. 36, 3 (1965)
[3] H.L. Fang and R.L. Swofford, The Thermal-lens in Absorption
Spectroscopy, Ultrasensitive Laser Spectroscopy, D. S. Klinger Ed.,
Academic Press, New York 1983
[4] C. Hu, J.R. Whinnery, Appl. Opt. 12, 72 (1973)
[5] N.J. Dovichi, J.M. Harris, Annal. Chem. 51, 728 (1979)
[6] D. Rojas, R.J. Silva, J.D. Spear, R.E. Russo, Anal. Chem. 63, 1927
(1991)
[7] C.D. Tran, Analyst. 12, 1417 (1987)
[8] R.L. Swofford, J.A. Morrell, J. Appl. Phys. 49, 3667 (1978)
[9] H.L. Fang, R.L. Swofford, J. Appl. Phys. 50, 6609 (1979)
[10] R.A. Leach, J.M. Harris, Anal. Chem. 56, 1481 (1984)
[11] R.A. Leach, J.M. Harris, Anal. Chem. 56, 2801 (1984)
[12] J.A. Hernandez, J.M.F. Romero, G.R. Ramos, M.D.L Castro, Anal
Chim. Acta. 390, 163 (1999)
[13] J. Amador-Hernandez, J.M. Fernandez-Romero, M.D.L. Castro,
Talanta 49, 813 (1999)
[14] M. Born, E. Wolf, Principles of Optics, Pergamon press, 1970
[15] J.H. Brannon, D. Magde, J. Phys. Chem. 82, 705 (1978)

88 Chapter 2
[16] M. Franko, C.D. Tran, Rev. Sci. Instrum. 62, 2430 (1991)
[17] K.E. Rieckhoff, Appl. Phys. Lett. 9, 87 (1966)
[18] J.R. Whinnery, D.T. Miller, F. Dabby, IEEE J. Quantum Electron.
QE-3, 282 (1967)
[19] S.A. Akhamov, D.P. Krindach, A.V. Migulin, A.P. Sukhorukov, R.
V. Khokhlov, IEEE J. Quantum Electron. QE-4, 568 (1968)
[20] A. Kurian, S.D George, C.V. Bindhu, V.P.N Nampoori, C.P.G.
Vallabhan, Spectrochim. Acta A 67, 678 (2007)
[21] A. Kurian, N.A. George, B. Paul, V.P.N. Nampoori, C.P.G.
Vallabhan, Laser Chem. 20, 99 (2002)
[22] A. Kurian, S.D. George, V.P.N. Nampoori, C.P.G. Vallabhan,
Spectrochim. Acta A 61, 2799 (2005)
[23] A. Kurian, K.P. Unnikrishnan, T. Lee S, V.P.N. Nampoori, C.P.G.
Vallabhan, Laser Chem. 20, 81 (2002)
[24] N.S. Basheer, B.R. Kumar, A. Kurian, S.D. George, J. Lumin. 137,
225 (2013)
[25] R.D. Snook, R.D. Lowe, Analyst 120, 2051(1995)
[26] M. Sikovec, M. Franko, F.G. Cruz, S. Katz, Anal. Chim. Acta 330,
245 (1996)
[27] B.S. Seidel, W.F. Faubel, J. Anal. Chem. 360, 795 (1998)
[28] S. Legeai, J. Georges, Anal. Letters 33, 3153 (2000)
[29] T. Suzuki, Y. Kaji, K. Shibaya, K. Obi, Bull. Chem. Soc. Jpn. 65,
1084 (1992)

Experimental Methodology 89
[30] J.A. Sampaio, S.M. Lima, T. Catunda, A.N. Medina, A.C. Bento, M.
L. Baesso, J. Non-Crystalline Solids 304, 315-321 (2002)
[31] S.M. Lima , J.A. Sampaio, T. Catunda, A.C. Bento, L.C.M. Miranda,
M.L. Baesso, J. Non-Crystalline Solids 273, 215(2000)
[32] A.G. Bell, Nature 22, 500 (1880)
[33] A.G. Bell, Nature 24, 42 (1881)
[34] J. Tyndall, Proc. R. Soc. Lond. 31, 307 (1881)
[35] W. Roentgen, Phil. Mag. 11, 308 (1881)
[36] M.L. Viengerov, Dokl. Akad. Nauk. 19, 687 (1938)
[37] A. Rosencwaig, A. Gersho, J. Appl. Phys. 47, 64 (1976)
[38] A. Sikroska, B.B.J. Linde, W. Zwirba, Chem. Phys. 320, 31 (2005)
[39] M.J. Adams, G.F. Kirkbright, Analyst 102, 678 (1977)
[40] G. Ziegler, D.P.H. Hasselman, J. Mater. Sci. 16, 495 (1981)
[41] N.F. Leite, N. Cella, H. Vargas, L.C.M. Miranda, J. Appl. Phys. 61,
3023 (1987)
[42] B. Merté, P. Korpiun, E, Liischer, R. Tilgner, J. Physique Coll. 44,
463 (1983)
[43] A. Torres-Filho, N. F. Leite, L.C.M. Miranda, N. Cella, H. Vargas, J.
Appl. Phys. 66, 97 (1989)
[44] A.C. Bento, H. Vargas, M.M.F. Aguiar, L.C.M. Miranda, Phys.
Chem. Glasses 28, 127 (1987)
[45] M.J. Adams, G. F. Kirkbright, Analyst 102, 281 (1977)
[46] A. Rosencwaig, Science 181, 657 (1973)

90 Chapter 2
[47] D. Balasubramanian, Ch. M. Rao, P. Panijpan, Science 223, 828 (1984)
[48] C.A.S. Lima, H. Vargas, C.L. Cesar, M.B.S. Lima, L.M. Prioli, W.J.
da Silva, Plant Science 38, 47 (1985)
[49] S. Malkin, D. Cahen, Photochem. Photobiol. 29, 803 (1979)
[50] D. Cahen, S. Malkin, E.I. Lerner, FEBS Lett. 91, 339 (1978)
[51] D. Cahen, H, Garty, S.R. Caplan, FEBS Lett. 91, 131 (1978)
[52] R. Carpentier, B. Larue, R.M. Leblanc, Arch. Biochem. Biophys.
222, 403 (1983)
[53] R. Carpentier, B. Larue, R.M. Leblanc, Arch. Biochem. Biophys.
228, 534 (1984)
[54] R. Carpentier, H.C.P. Matthijs, R.M. Leblanc, G. Hind, Can. J. Phys.
64, 1136 (1986)
[55] S.D. Campbell, S.S. Sinclair, M.A. Afromowitz, 1EEE Trans.
Biomed. Eng. BME 26, 220 (1979)
[56] K. Giese, A. Nicolaus, B. Sennhenn, K. Kölmel, Can. J. Phys. 64,
1139 (1986)
[57] P. Poulet, J. Chambron, J. Physique Coll. C6 44, 413 (1983)
[58] C.L. Cesar, C.A.S. Lima, H. Vargas, L.C.M. Miranda, J. Agric. Food
Chem. 32, 1355 (1984)
[59] A. Petzold, R. Niessner, Sensors Actuators B 14, 640 (1993)
[60] A. Petzold, R. Niessner, Appl. Phys. Lett. 66, 1285 (1995)
[61] P.J. Sheridan et al. Aerosol Sci. Technol. 39, 1 (2005)

Experimental Methodology 91
[62] D.A. Lack, E.R. Lovejoy, T. Baynard, A. Pettersson, A. R.
Ravishankara, Aerosol Sci. Technol. 40, 697 (2006)
[63] S. Luterotti, D. Bicanic, K. Jandragic Food Chem. 108, 316 (2008)
[64] O. Doka, D. Bicanic, Z. Ajtony, R. Koehorst, Food Additives
Contaminants 22, 503 (2005)
[65] T.M. Coelho, E.C. Vidotti, M.C.E. Rollemberg, M.L. Baesso, A.C.
Bento, J. Physique IV 125, 829 (2005)
[66] D. Bicanic, S. Luterotti, M. Becucci, V. Fogliano, P. Versloot, J.
Physique IV 125, 825 (2005)
[67] T. Yang, J. Irudayaraj, Food Sci. Technol. 34, 402 (2001)
[68] H. Yang, J. Irudayaraj, S. Sakhamuri, Appl. Spectrosc. 55, 571 (2001)
[69] H. Yang, J. Irudayaraj, J. Am. Oil Chemists Soc. 77, 291(2000)
[70] Z.M. Zhao, M. Tormanen, R. Myllyla, Meas. Sci. Technol. 21, 025105
(2010)


![CHAPTER II LITERATURE REVIEW - Shodhgangashodhganga.inflibnet.ac.in/bitstream/10603/93515/10/10_chapter2.pdf · Lin Zhang et.al [52] considered the personal authentication technique](https://img.pdfslide.us/doc/110x75/5f0354f07e708231d408b029/chapter-ii-literature-review-lin-zhang-etal-52-considered-the-personal-authentication.jpg)