Embed Size (px)
Citation preview
37
Chapter. 2
HYPOTHESIS, SCOPE, OBJECTIVES AND
METHODOLOGY
2.1: Hypothesis for the Present Study:
It is difficult to make categorical statements on the development
which is a multi faceted phenomenon; caused in the command areas, due
to irrigation, however voluminous may be the data. An evaluation
assessment on the basis of some primary and secondary information
available for a short, yet acceptable, period will indicate the positive
changes in the direction, and degree and quality of changes is discernible.
The hypothesis taken up in this study is whether irrigation improves the
standard of living of the rural masses and in turn helps the rural
development. This study has the main objective of studying the impact of
irrigation on rural development, through the development of agriculture
(Vasudeva Rao, D. 1982). The assumed chain reaction is that irrigation
leads to intensive cultivation which results in better crop pattern
reflecting in higher productivity causing more employment resulting in
more per capita income and more saving. The probable increase in
expenditure is expected to raise the intake of quality food. Expenditure on
non food items like education, health care would also go up. Thus the
study aims at quantifying and linking up interwoven characteristics of
development, with irrigation as the (center) starting point for around
development of the study (rural) area.
2.2: Scope and Objectives:
The main objective is to study in depth, how irrigation holds the
key for agricultural development and consequently rural development.
The approach is a two pronged one : (i) At micro level : the cultivator
38
households are considered, (ii) Tahsil as a unit is taken up for macro-
level study of the overall development.
2.3: Specific Objectives and Problem:
The present study can be termed as a path breaking one, in the
sense that, an attempt is made here to study, understand and assess at
micro level (cultivators households) the impact of irrigation under a
command area canal system, in Shrigonda tahsil, as against the macro
background of state level. After critical examination of different issues
involved, at micro and macro levels, the study has finally selected the
following eleven specific objectives to be studied at micro level.
To cross cheek and further corroborate the micro level findings, an
unique attempt and novel approach is made to compare the two
neighboring villages (with irrigation as the limiting factor) with respect to
twenty variables between two points of time. This proceeding helped to
arrive at definite conclusions as to whether irrigation has really effected
or it is a fluke chance at the micro mechanism of the analysis which
makes the conclusions tool proof and leaves no room for benefit of doubt.
At the farmer‟s (households) levels the following topics would be
studies in depth to know whether irrigation has brought any change in
the:
1. Work participation of own family female labour.
2. Attendance of the school going children (4-15 years) either to
school or for work.
3. Area under cash crops; sugarcane, oil seeds, cotton, lemon, graps.
4. Use of inputs viz, on time and in sufficient quantities, thus
minimizing the wastage.
5. Optimum (own / hired) labour usage (habit)
6. Intake of quality foods (milk, meat, ghee, etc.)
39
7. Proportion of (per capita consumption unit) expenditure on non-
food items in the total expenditure
8. Per capita income: overall and source wise.
9. Indebtedness and its impact on agricultural production.
10. Housing conditions and availability of amenities / facilities
11. Position of people with reference to poverty line.
At macro level, Shrigonda tahsil would be compared (over time
and extent of benefit derived) with the neighboring dry tahsil Karjat. The
secondary information will be collected on important variables that can
be quantified like changes in literacy, population, employment, land use,
crop pattern, agricultural implements, social infrastructure,
communication, connectivity etc. this will be supplemented by personal
observation too.
2.4: Relevance of the Study:
The overall development in the command area can be well brought
out at micro level, by studying one fairly big and representative village as
most of the characteristics the problems faced, the benefits enjoyed, soil
type, crop pattern, Ecological sociological and economic conditions are
unbiasedly represented by the sample villages. However generalization
cannot be extended too far. It is also remembered that ten years time is
not that big to manifest radical changes in the traditionally backward
areas like the study region. An attempt is made to know the directions of
change. The ideal way of studying and understanding the impact of
irrigation on the all round development of the village would have been by
comparing the pre- irrigation data for the same villages. But this is time
consuming and can‟t be done single handedly. Hence the next best
alternative is to compare two neighboring villages, which are similar in
40
all respects and ascepcts, except irrigation. The differences if any can be
safely attributed to irrigation (Alexander, K. C. 1980).
With an eye on change in the crop pattern, crop rotation judicious
use of water and other essential inputs, the maximum yields can be
achieved which in turn would give rise to a shift in emphasis from growth
of per capita income to eradication of poverty, reduction in income
inequalities, expansion of employment opportunities, rise in literacy
levels, better standard of living.
2.5: Limitations:
i. Study is not following up but cross sectional in nature, due to lack
of manpower, time and money. Wherever possible some figures
from the bench mark survey report are referred to.
ii. Memory basis of the respondent: as the data for a full agricultural
year is collected in one to two sittings, during 2000-01 to 2010-11
for the each agricultural year.
iii. Generally the tendency is to overestimate the expenditure and
underestimate the income and production.
iv. Only one year reference period (through rainfall is normal and not
a drought year) It is not safe to generalize from the results obtained
and conclusions arrived at, on the basis of only one year‟s inquiry,
though the year of inquiry coincided with adequate rainfall in
selected villages. To the extent the differences in output between
22 villages, which might have been noticeable, in an otherwise
drought year, is mitigated. There are dangers in generalization,
dangers of extrapolation and its is sometimes forgotten that any
number of traverses do not add up to triangulation- this warning is
well kept in mind by the researcher, in this study (Spate, O. H. K.
in Introductions to T. S. Episten‟s Book of 1973).
41
This is overcome to a great extent by cross checking the village
level data and agriculture department employees, (checklist) and personal
observation.
2.6: Study Region Canal Irrigation Sources:
1. Visapur Dam:
In Shrigonda Tahsil irrigation facility provided by British Visapur
Dam was dedicated to the Nation by the British on 1927. The earthern
dam is 84 ft. in height. The water storage capacity of this dam is 0.92
TMC for irrigation and other purpose. There is only one canal on the left
bank with a length of 25 Kms. It irrigates mainly villages from Shrigonda
Tahsil.
2. Ghod Dam:
This is earthen dam with 10900 ft. embankment and 97 ft. height.
The water from dam is let into canal with Ghod left and right banks. It
was completed in 1966 and irrigated the area of Shrigonda and Karjat
tahsil, some villages. It also facilitates the area of Shirur tahsil of Pune
district. Water storage capacity of this dam is 7.5 TMC.
3. Kukadi Project:
In 1903 to 1910 Mr. Ben, an Executive Engineer, has don a
research study of the river Ghod, Kukadi and Meena for using their water
for the droughted tahsils areas in the district of Ahmednagar like Parner,
Shrigonda, Karjat and Karmala of Solapur district. In addition to this, he
also studied the various optional plans previously studied water resources
for farming. Having studied the Kukadi canal project, he submitted the
project report to the Maharashtra Government; in 1965.
42
The Kukadi Project Report was studied the Irrigation Department
of the government and sanctioned the project on 30/04/1965 vide letter
No. PIM / 3465 / 12050- P
Under the Kukadi project in Pune district hearly about five dams
were constructed such as Yedgaon (1977), Manikdoh (1994) on Kukadi
River, Wadaj (1983) on Mina River, this river is tributary of Kukadi,
Dimbhe (1995) on Ghod River, Pimplgaon Joga (2000) on Arr River; this
river is tributary of Kukadi River also. Total five dams were constructed
under this project.
Through Kukadi left Bank Canal 50 % land irrigated in Shrigonda
tahsil. The Kukadi canal project plays vital role in the development of
agricultural field.
Some Particulars:
Visapur Dam (Left canal) - 25 Km length – Irrigates 3164.51 hectares in
Shrigonda Tahsil.
Ghod Dam (Left Canal) - 64 Km length – Irrigates 9238.92 hectares in
ShrigondaTahsil.
Kukadi Canal Project - 104 Km. length – Irrigates 30616 hectares in
Shrigonda Tahsil.
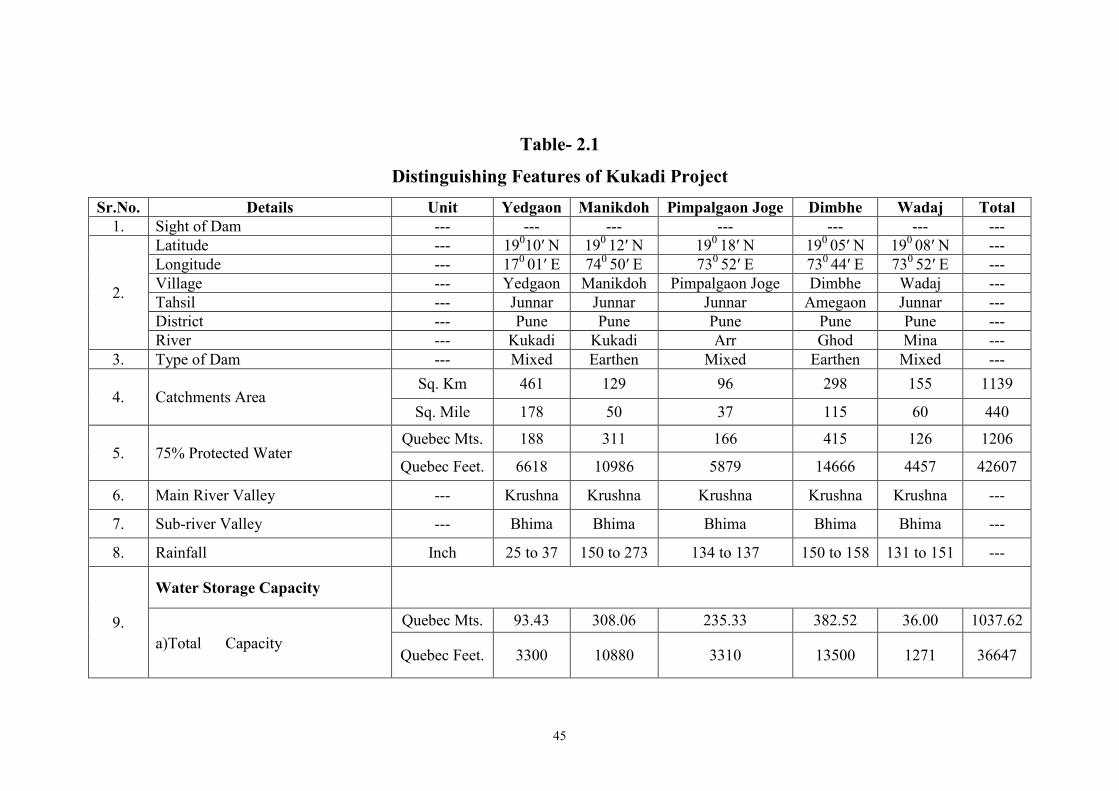
Above all three projects benefited irrigation facilities as follows
(Table 2.1)
43
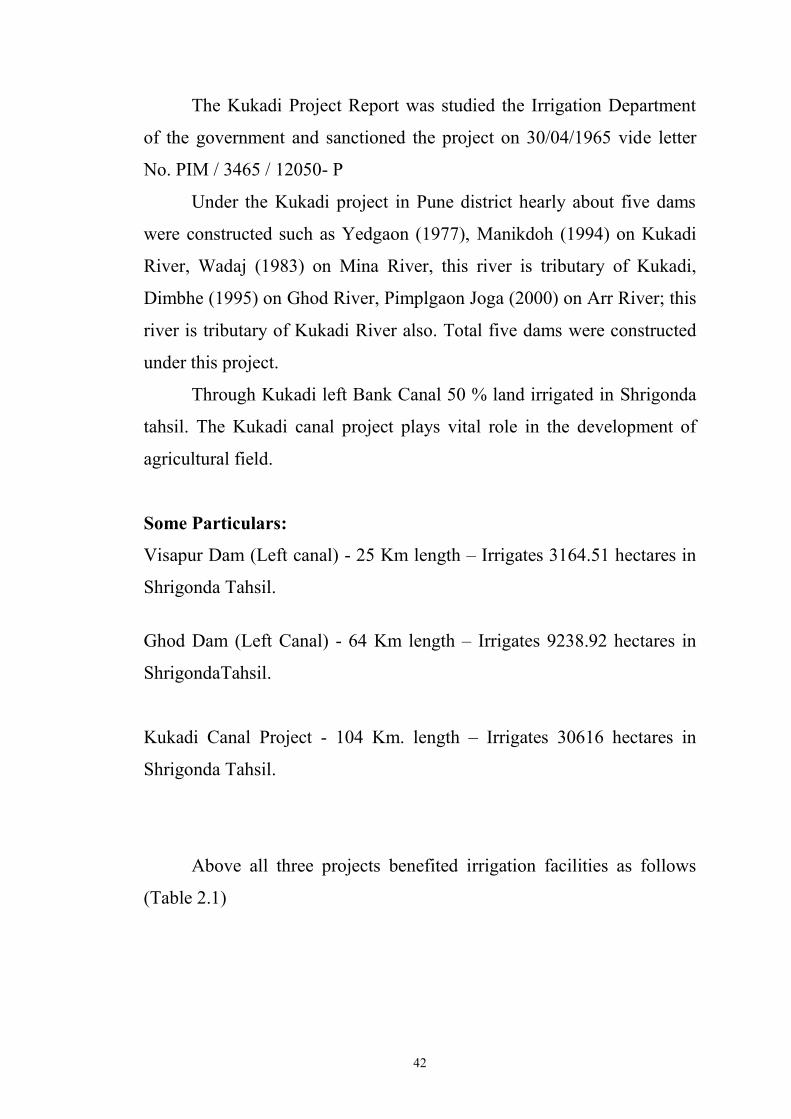
Map 2.1: Visapur Dam with Canal
Map 2.2: Ghod Dam with Left Bank Canal
44
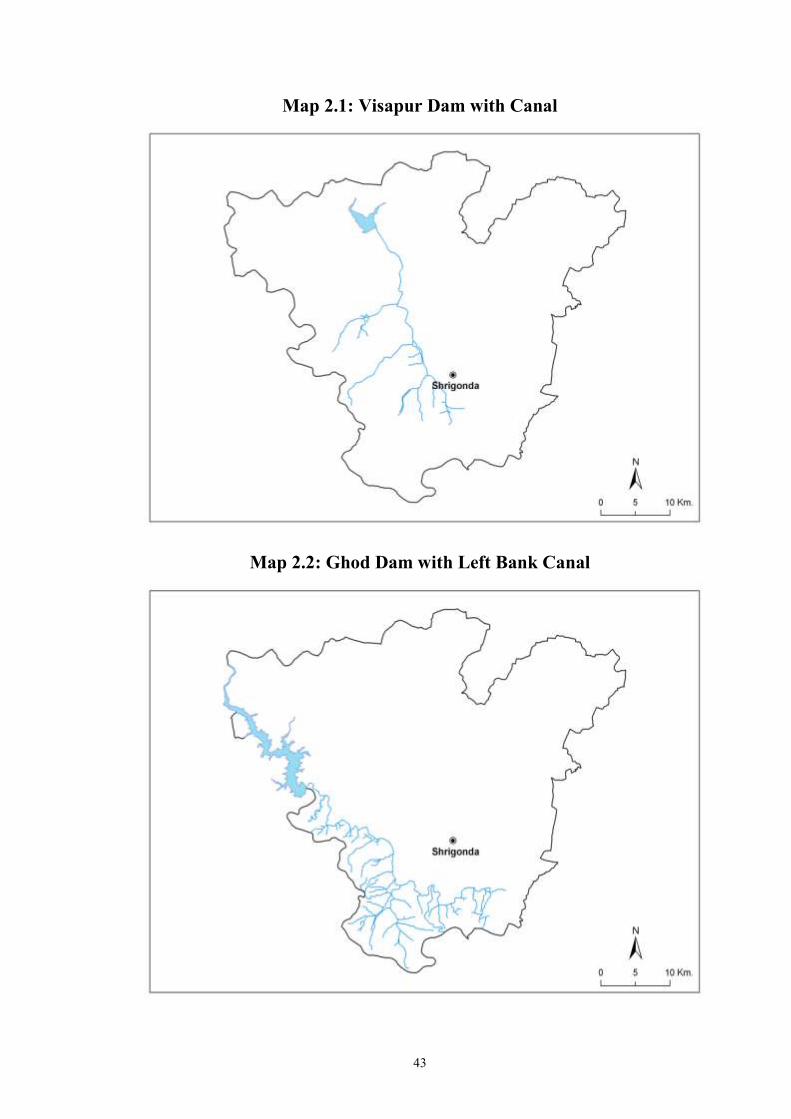
Map 2.3: Kukadi Irrigation Project with Left Bank Canal
Map 2.4: Canals, Dams and Bandharas of Study area
45
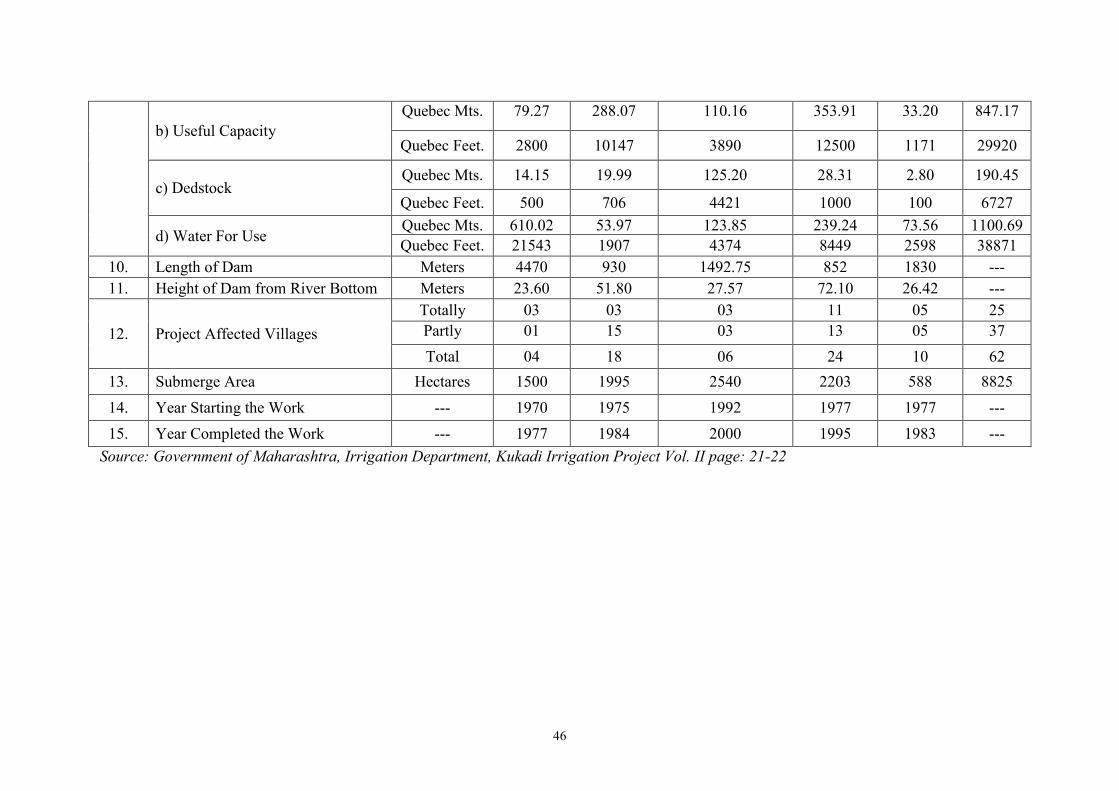
Table- 2.1
Distinguishing Features of Kukadi Project
Sr.No. Details Unit Yedgaon Manikdoh Pimpalgaon Joge Dimbhe Wadaj Total
1. Sight of Dam --- --- --- --- --- --- ---
2.
Latitude --- 19010′ N 19
0 12′ N 19
0 18′ N 19
0 05′ N 19
0 08′ N ---
Longitude --- 170
01′ E 740
50′ E 730
52′ E 730
44′ E 730
52′ E ---
Village --- Yedgaon Manikdoh Pimpalgaon Joge Dimbhe Wadaj ---
Tahsil --- Junnar Junnar Junnar Amegaon Junnar ---
District --- Pune Pune Pune Pune Pune ---
River --- Kukadi Kukadi Arr Ghod Mina ---
3. Type of Dam --- Mixed Earthen Mixed Earthen Mixed ---
4. Catchments Area Sq. Km 461 129 96 298 155 1139
Sq. Mile 178 50 37 115 60 440
5. 75% Protected Water Quebec Mts. 188 311 166 415 126 1206
Quebec Feet. 6618 10986 5879 14666 4457 42607
6. Main River Valley --- Krushna Krushna Krushna Krushna Krushna ---
7. Sub-river Valley --- Bhima Bhima Bhima Bhima Bhima ---
8. Rainfall Inch 25 to 37 150 to 273 134 to 137 150 to 158 131 to 151 ---
9.
Water Storage Capacity
a)Total Capacity
Quebec Mts. 93.43 308.06 235.33 382.52 36.00 1037.62
Quebec Feet. 3300 10880 3310 13500 1271 36647
46
b) Useful Capacity
Quebec Mts. 79.27 288.07 110.16 353.91 33.20 847.17
Quebec Feet. 2800 10147 3890 12500 1171 29920
c) Dedstock Quebec Mts. 14.15 19.99 125.20 28.31 2.80 190.45
Quebec Feet. 500 706 4421 1000 100 6727
d) Water For Use Quebec Mts. 610.02 53.97 123.85 239.24 73.56 1100.69
Quebec Feet. 21543 1907 4374 8449 2598 38871
10. Length of Dam Meters 4470 930 1492.75 852 1830 ---
11. Height of Dam from River Bottom Meters 23.60 51.80 27.57 72.10 26.42 ---
12. Project Affected Villages
Totally 03 03 03 11 05 25
Partly 01 15 03 13 05 37
Total 04 18 06 24 10 62
13. Submerge Area Hectares 1500 1995 2540 2203 588 8825
14. Year Starting the Work --- 1970 1975 1992 1977 1977 ---
15. Year Completed the Work --- 1977 1984 2000 1995 1983 ---
Source: Government of Maharashtra, Irrigation Department, Kukadi Irrigation Project Vol. II page: 21-22
47
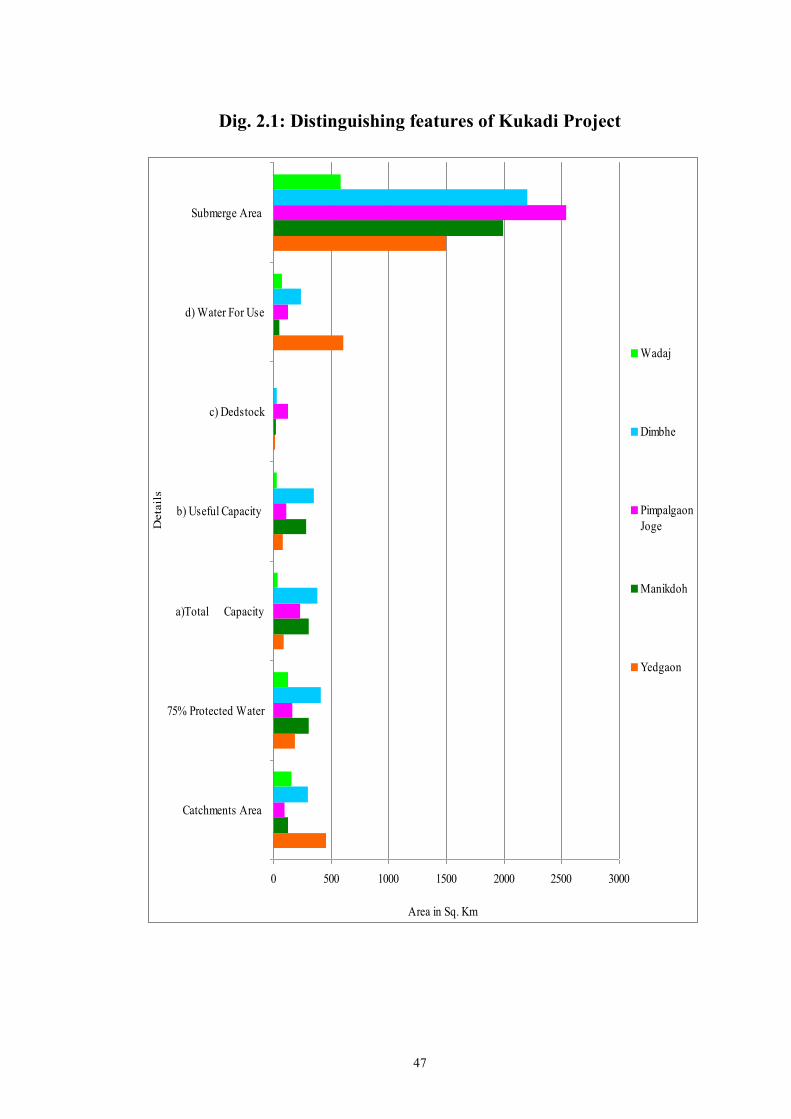
Dig. 2.1: Distinguishing features of Kukadi Project
0 500 1000 1500 2000 2500 3000
Catchments Area
75% Protected Water
a)Total Capacity
b) Useful Capacity
c) Dedstock
d) Water For Use
Submerge Area
Deta
ils
Area in Sq. Km
Wadaj
Dimbhe
Pimpalgaon
Joge
Manikdoh
Yedgaon
48
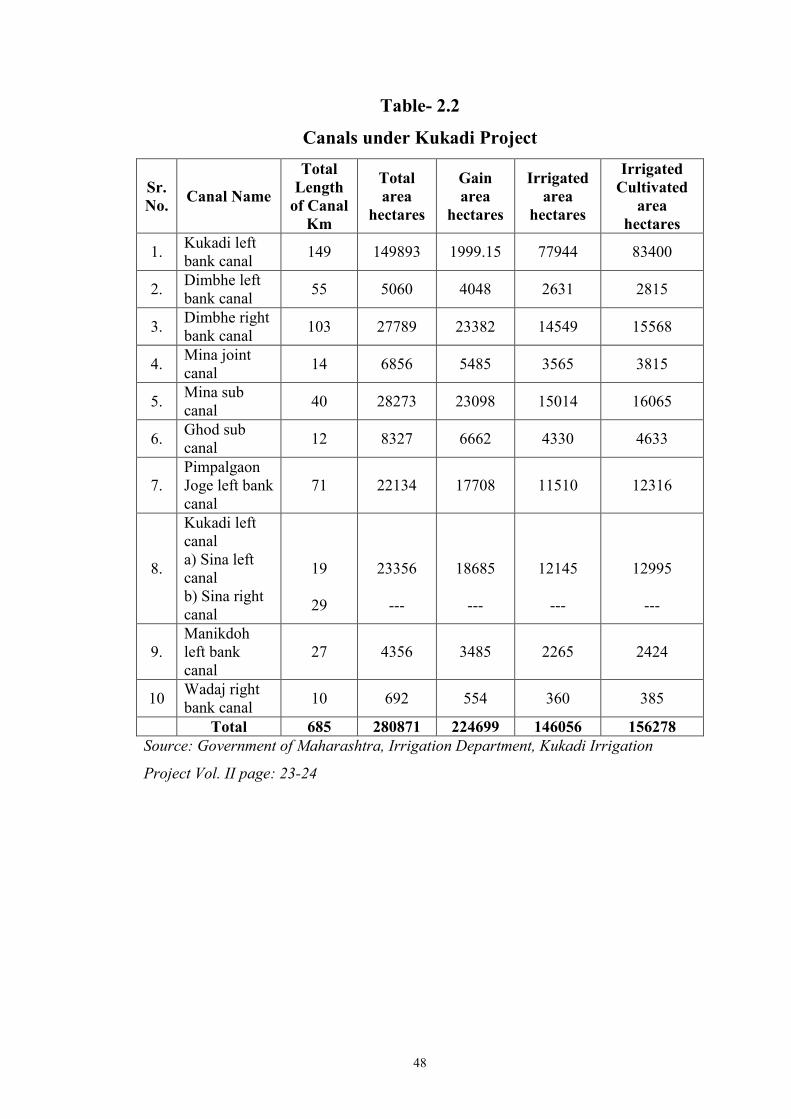
Table- 2.2
Canals under Kukadi Project
Sr.
No. Canal Name
Total
Length
of Canal
Km
Total
area
hectares
Gain
area
hectares
Irrigated
area
hectares
Irrigated
Cultivated
area
hectares
1. Kukadi left
bank canal 149 149893 1999.15 77944 83400
2. Dimbhe left
bank canal 55 5060 4048 2631 2815
3. Dimbhe right
bank canal 103 27789 23382 14549 15568
4. Mina joint
canal 14 6856 5485 3565 3815
5. Mina sub
canal 40 28273 23098 15014 16065
6. Ghod sub
canal 12 8327 6662 4330 4633
7.
Pimpalgaon
Joge left bank
canal
71 22134 17708 11510 12316
8.
Kukadi left
canal
a) Sina left
canal
b) Sina right
canal
19
29
23356
---
18685
---
12145
---
12995
---
9.
Manikdoh
left bank
canal
27 4356 3485 2265 2424
10 Wadaj right
bank canal 10 692 554 360 385
Total 685 280871 224699 146056 156278
Source: Government of Maharashtra, Irrigation Department, Kukadi Irrigation
Project Vol. II page: 23-24
49
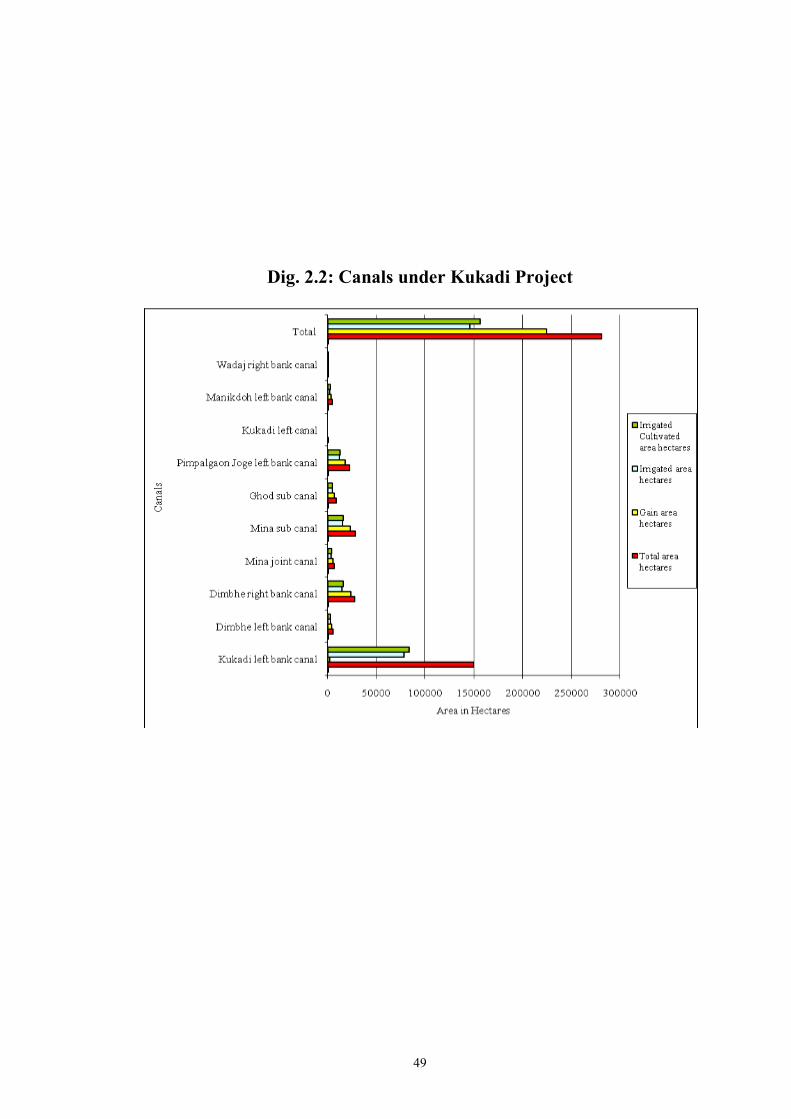
Dig. 2.2: Canals under Kukadi Project
50
(Table 2.1 and 2.2) shows the all area of Dams under Kukadi
project was in Pune district. But more benefited area in Ahmednagar
district. To take for granted water storage capacity of all five Dams are
75% and 42.09 Quebec feet water use for Kukadi project. Water
availability for Pushapatvati dam is 0.5 Quebec feet and for Ghod canal
0.2 Quebec feet form Kukadi project. In 1970-71 water demand of
benefited farmers under Kukadi project is increased than Government
relies more water by Visapur and Ghod Dams.
Today irrigation department has including under Kukadi project.
But in 1976 Government (irrigation Department) publish new report and
following beneficial changes including in the report.
1. Kukadi left bank canal expansion up to Sina river valley and an
attempt to more 12,145 hectares area under irrigation.
2. An attempt to more 11,510 hectares area under irrigation to
Pimpalgaon Joge left bank canal.
3. Increasing irrigated area (3,565 hectares) with the help of Wadaj
left bank canal.
4. With the help of newly constructed Manikdoh left canal 2,265
hectares area under irrigation.
Social and Economic Condition under Kukadi Canal Project Area:
Kukadi canal project mainly the advantage of to drought prone area
of Pune, Ahmednagar and Solapur district. In this districts total 5, 38,760
hectares area irrigated by this project. This project helps improvement in
employment and industries in this area particularly.
51
Competence of Irrigation by Kukadi Project:
Dams including under Kukadi project are 1) Manikdoh 2) Dimbhe
3) Yedgaon 4) Wadaj and 5) Pimpalgaon Joge. The planning of irrigation
formed by government are, fist collect the four Dams water in Yedgaon
Dam and then relies the water form Kukadi left bank canal for irrigation
purpose.
All five Dams under Kukadi project providing water for irrigation
of Kharif and Rabbi Seasons, but not for summer season. The total
capacity of irrigation by Kukadi project was 1, 56,278 hectares. Out of
that 1, 14,271 hectares area covered up to June 2004.
This project provided the irrigation facilities for Pune district
(Ambegaon, Junnar and Shirur tahsils), Ahmednagar district (Parner,
Shrigonda and Karjat tahsils) and Solapur distict (Karmala tahsil) mainly.
According to 75% water storage capacity of these five Dams are
42,600 Quebec feet. After completion the all work the water storage
capacity was increased up to 37,256 Quebec feet. The following planning
of water use estimating by irrigation department.
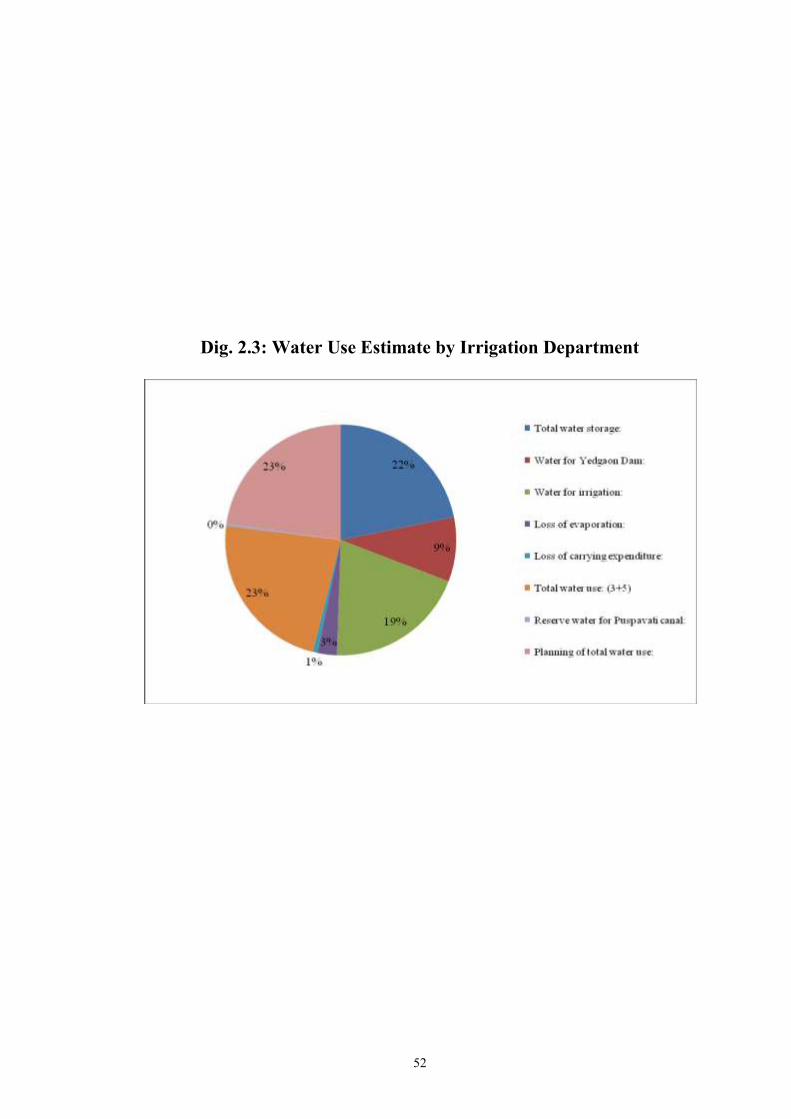
1. Total water storage: 37,256 Quebec feet
2. Water for Yedgaon Dam: 15,439 Quebec feet
3. Water for irrigation: 33,595 Quebec feet
4. Loss of evaporation: 4,631 Quebec feet
5. Loss of carrying expenditure: 1,145 Quebec feet
6. Total water use: (3+5) 39,371 Quebec feet
7. Reserve water for Puspavati canal: 500 Quebec feet
8. Planning of total water use: 38,871 Quebec feet
52
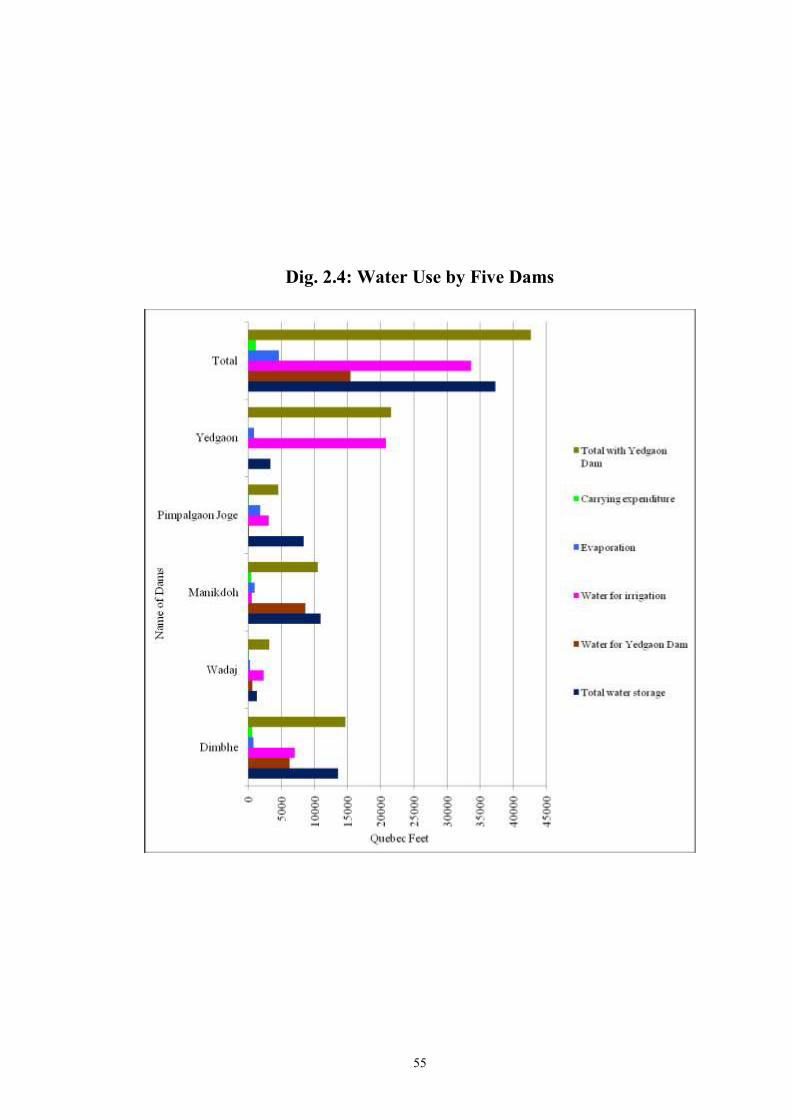
Dig. 2.3: Water Use Estimate by Irrigation Department
53
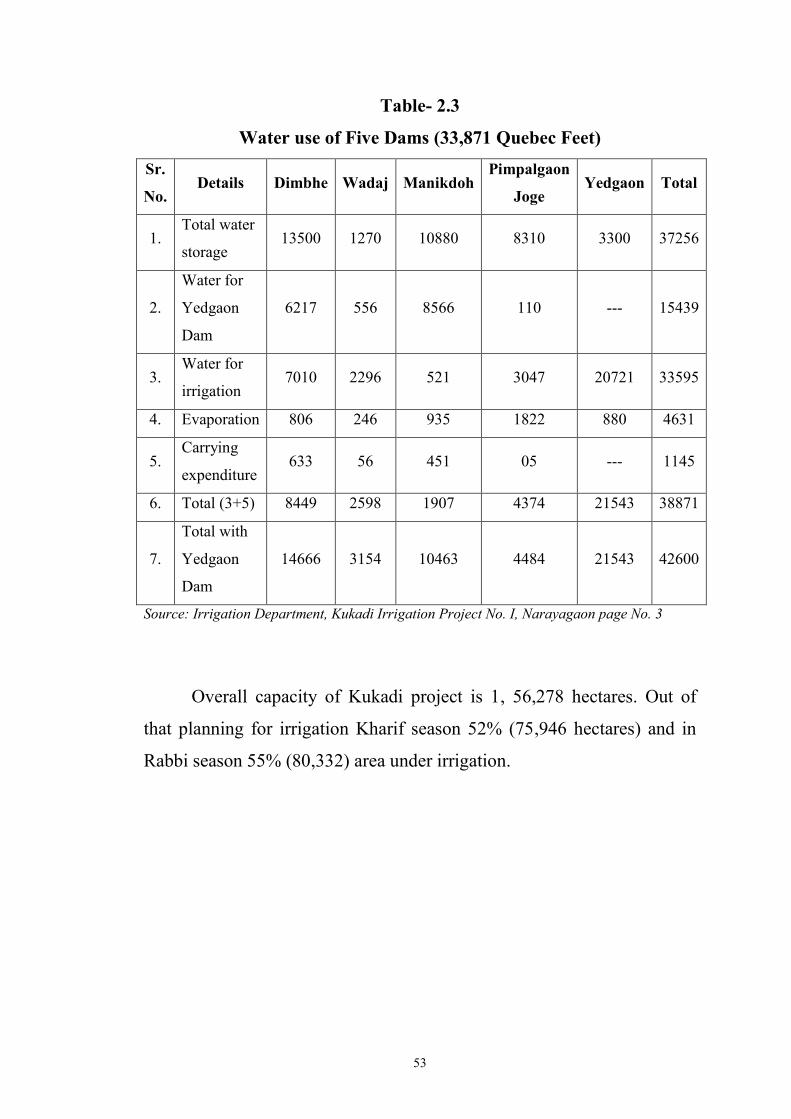
Table- 2.3
Water use of Five Dams (33,871 Quebec Feet)
Sr.
No. Details Dimbhe Wadaj Manikdoh
Pimpalgaon
Joge Yedgaon Total
1. Total water
storage 13500 1270 10880 8310 3300 37256
2.
Water for
Yedgaon
Dam
6217 556 8566 110 --- 15439
3. Water for
irrigation 7010 2296 521 3047 20721 33595
4. Evaporation 806 246 935 1822 880 4631
5. Carrying
expenditure 633 56 451 05 --- 1145
6. Total (3+5) 8449 2598 1907 4374 21543 38871
7.
Total with
Yedgaon
Dam
14666 3154 10463 4484 21543 42600
Source: Irrigation Department, Kukadi Irrigation Project No. I, Narayagaon page No. 3
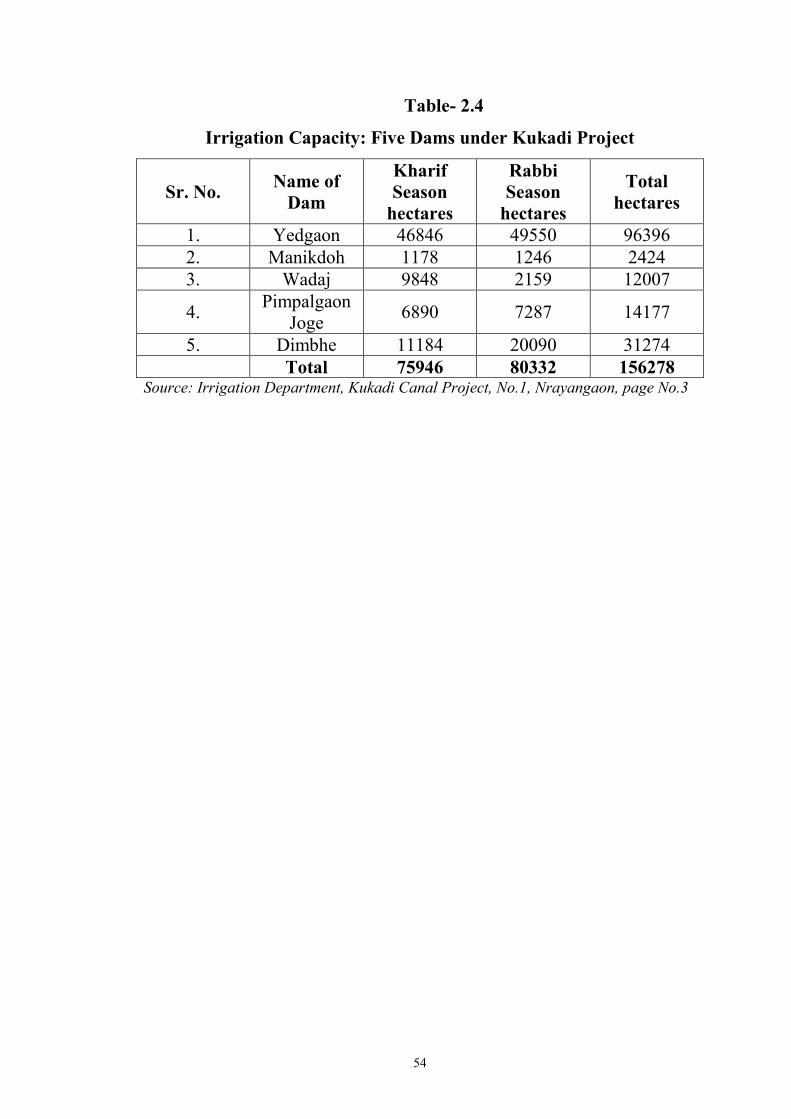
Overall capacity of Kukadi project is 1, 56,278 hectares. Out of
that planning for irrigation Kharif season 52% (75,946 hectares) and in
Rabbi season 55% (80,332) area under irrigation.
54
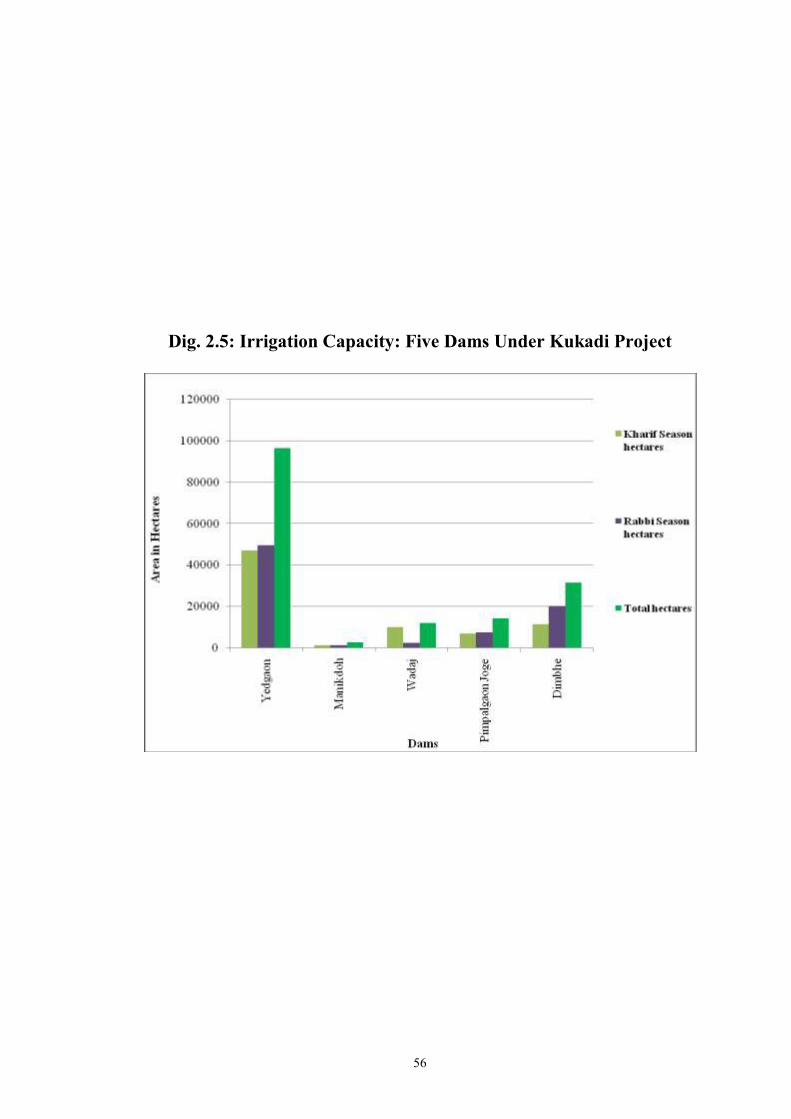
Table- 2.4
Irrigation Capacity: Five Dams under Kukadi Project
Sr. No. Name of
Dam
Kharif
Season
hectares
Rabbi
Season
hectares
Total
hectares
1. Yedgaon 46846 49550 96396
2. Manikdoh 1178 1246 2424
3. Wadaj 9848 2159 12007
4. Pimpalgaon
Joge 6890 7287 14177
5. Dimbhe 11184 20090 31274
Total 75946 80332 156278 Source: Irrigation Department, Kukadi Canal Project, No.1, Nrayangaon, page No.3
55
Dig. 2.4: Water Use by Five Dams
56
Dig. 2.5: Irrigation Capacity: Five Dams Under Kukadi Project
57
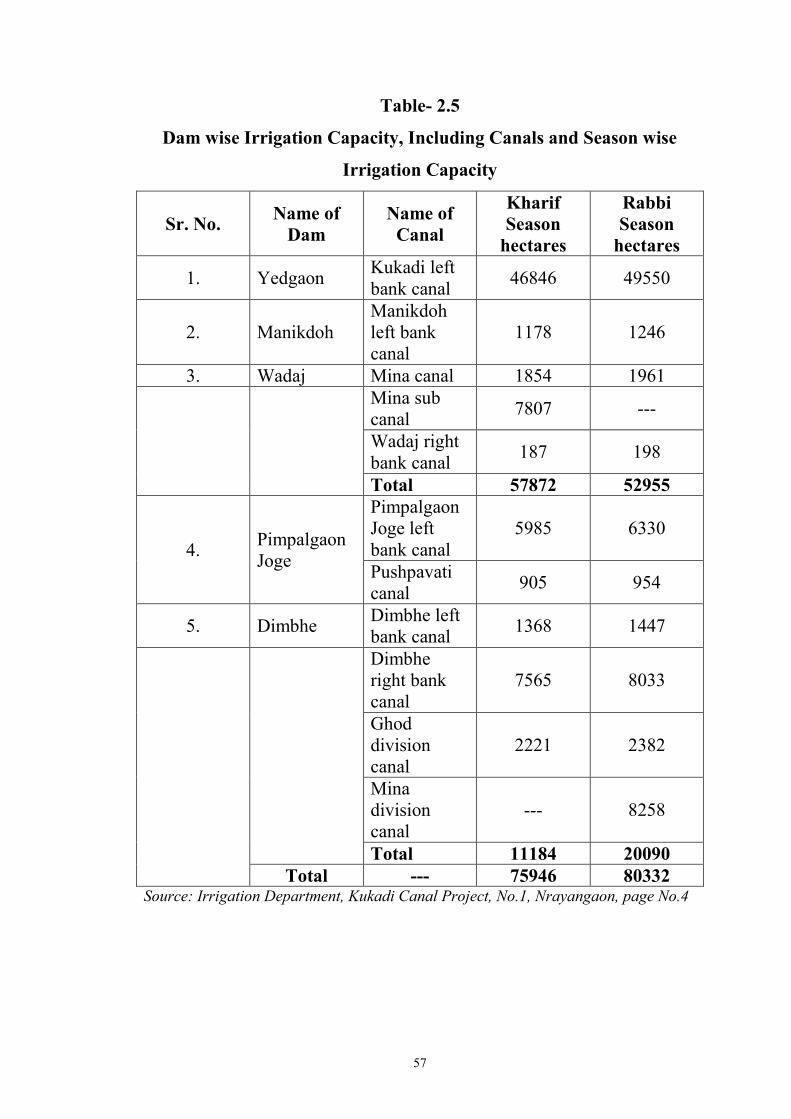
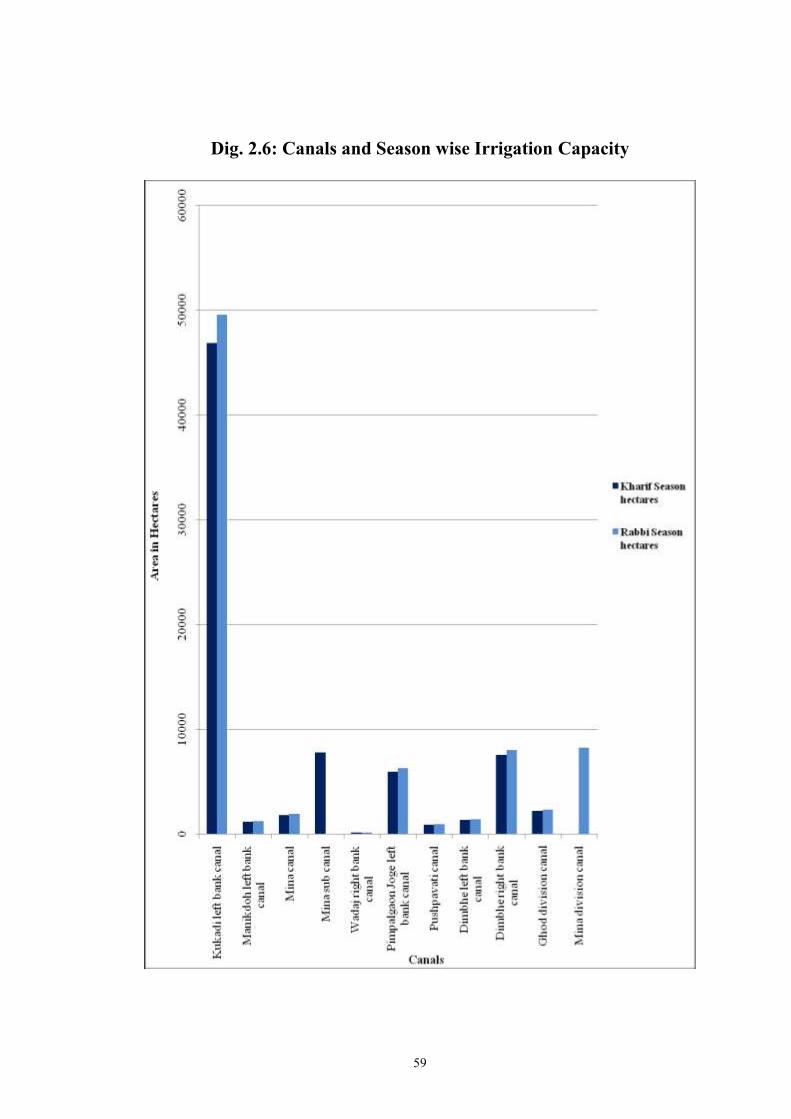
Table- 2.5
Dam wise Irrigation Capacity, Including Canals and Season wise
Irrigation Capacity
Sr. No. Name of
Dam
Name of
Canal
Kharif
Season
hectares
Rabbi
Season
hectares
1. Yedgaon Kukadi left
bank canal 46846 49550
2. Manikdoh
Manikdoh
left bank
canal
1178 1246
3. Wadaj Mina canal 1854 1961
Mina sub
canal 7807 ---
Wadaj right
bank canal 187 198
Total 57872 52955
4. Pimpalgaon
Joge
Pimpalgaon
Joge left
bank canal
5985 6330
Pushpavati
canal 905 954
5. Dimbhe Dimbhe left
bank canal 1368 1447
Dimbhe
right bank
canal
7565 8033
Ghod
division
canal
2221 2382
Mina
division
canal
--- 8258
Total 11184 20090
Total --- 75946 80332 Source: Irrigation Department, Kukadi Canal Project, No.1, Nrayangaon, page No.4
58
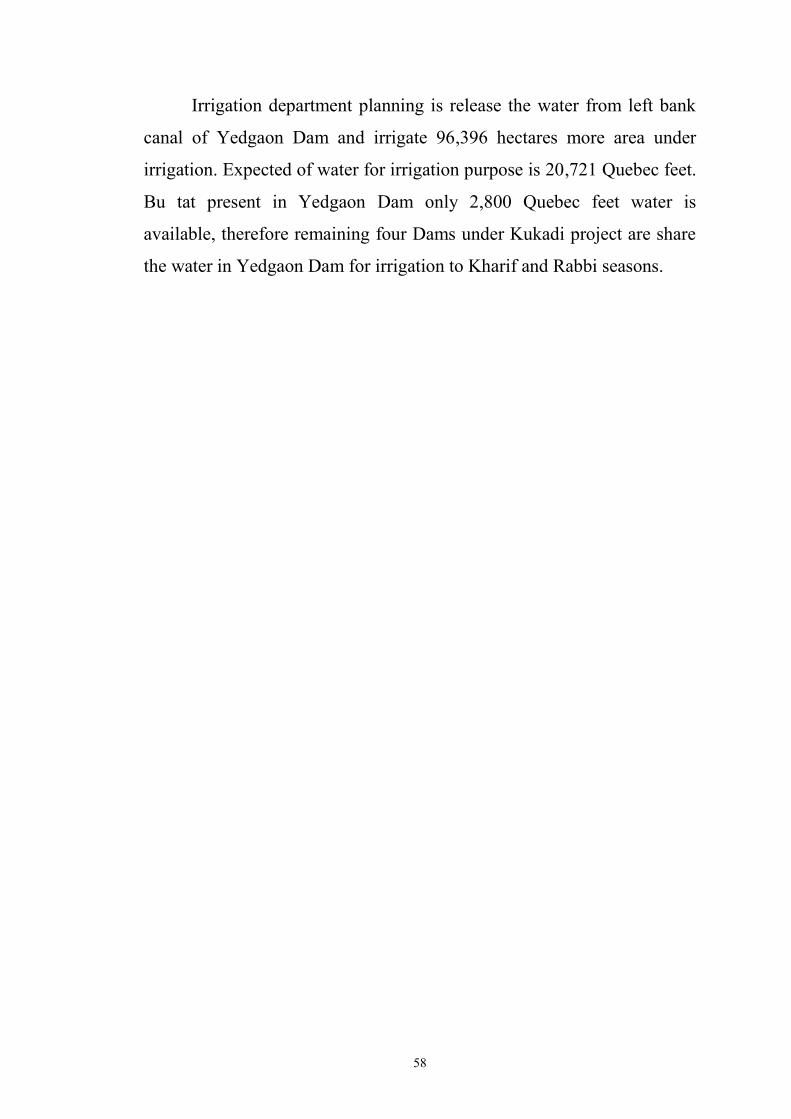
Irrigation department planning is release the water from left bank
canal of Yedgaon Dam and irrigate 96,396 hectares more area under
irrigation. Expected of water for irrigation purpose is 20,721 Quebec feet.
Bu tat present in Yedgaon Dam only 2,800 Quebec feet water is
available, therefore remaining four Dams under Kukadi project are share
the water in Yedgaon Dam for irrigation to Kharif and Rabbi seasons.
59
Dig. 2.6: Canals and Season wise Irrigation Capacity
60
Table- 2.6
Canals under Kukadi Project and Their Tahsil wise Irrigation
Capacity (Area in Hectares)
Sr.
No
Name of
Canal Pune Ahmednagar Solapur Tatal
Ambegaon Junnar Shirur Parner Shrigonda Karjat Karmala
1. Kukadi left
bank --- 1678 --- 9550 30616 29990 24562 96396
2. Dimbhe
left bank 2124 691 --- --- --- --- --- 2815
3. Dimbhe
right bank 8661 --- 6907 --- --- --- --- 15568
4. Mina canal --- 3815 --- --- --- --- --- 3815
5. Mina
division --- 9135 6930 --- --- --- --- 16065
6. Ghod
division 4633 --- --- --- --- --- --- 4633
7.
Pimpalgaon
Joge left
bank
--- 7125 --- 5190 --- --- --- 12315
8. Manikdoh
left bank --- 2424 --- --- --- --- --- 2424
9. Wadaj left
bank --- 385 --- --- --- --- --- 385
10. Pusphavati --- 1862 --- --- --- --- --- 1862
11.
Tahsil wise
total
irrigated
area
15418 27115 13837 14740 30616 29990 24562 156278
12.
District
wise total
irrigated
area
56370 75343 24562 156278
Source: Government of Maharashtra, Irrigation Department, Kukadi Irrigation Project Vol. II page.10-11
61
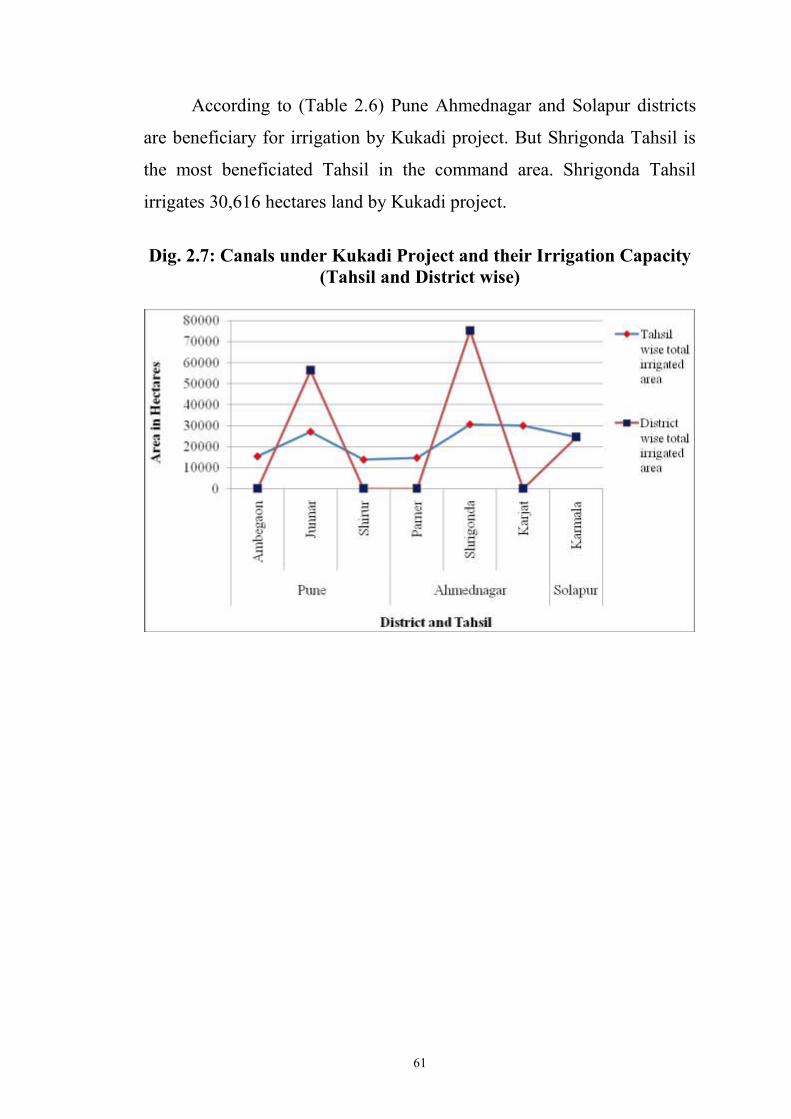
According to (Table 2.6) Pune Ahmednagar and Solapur districts
are beneficiary for irrigation by Kukadi project. But Shrigonda Tahsil is
the most beneficiated Tahsil in the command area. Shrigonda Tahsil
irrigates 30,616 hectares land by Kukadi project.
Dig. 2.7: Canals under Kukadi Project and their Irrigation Capacity
(Tahsil and District wise)
62
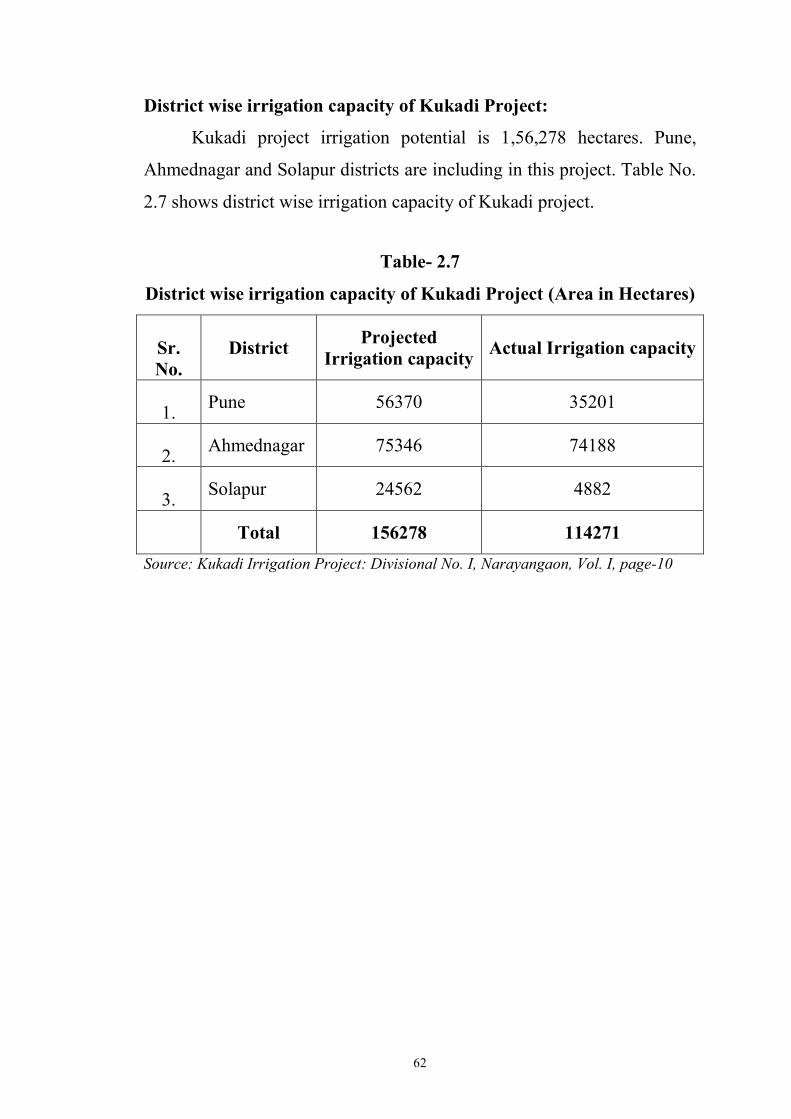
District wise irrigation capacity of Kukadi Project:
Kukadi project irrigation potential is 1,56,278 hectares. Pune,
Ahmednagar and Solapur districts are including in this project. Table No.
2.7 shows district wise irrigation capacity of Kukadi project.
Table- 2.7
District wise irrigation capacity of Kukadi Project (Area in Hectares)
Sr.
No.
District Projected
Irrigation capacity Actual Irrigation capacity
1. Pune 56370 35201
2. Ahmednagar 75346 74188
3. Solapur 24562 4882
Total 156278 114271
Source: Kukadi Irrigation Project: Divisional No. I, Narayangaon, Vol. I, page-10
63
Table- 2.8
Tahsil wise Irrigation Potential- under Divisional Irrigation office
Narayangaon
Sr.
No.
Name of
canal Pune Ahmednagar Tatal
Ambegaon Junnar Shirur Parner Shrigonda Karjat
1. Kukadi left
bank canal --- 1678 --- 9550 15003 --- 26231
2.
Dimbhe
left bank
canal
224 691 --- --- --- --- 2815
3.
Dimbhe
right bank
canal
8661 --- 6907 --- --- --- 15568
4. Mina canal --- 3815 --- --- --- --- 3815
5. Mina sub
canal --- 9135 6930 --- --- --- 16065
6. Ghod sub
canal 4633 --- --- --- --- --- 4633
7.
Pimpalgaon
Joge left
bank canal
--- 7125 --- 5190 --- --- 12315
8.
Manikdoh
left bank
canal
--- 2424 --- --- --- --- 2424
9. Wadaj right
bank canal --- 385 --- --- --- --- 385
10. Pusphavati
canal --- 1862 --- --- --- --- 1862
11.
Total
irrigation
area in
Tahsil
15418 27115 13837 14740 15003 --- 86113
12.
Total
irrigation
area in
District
56370 29743 86113
Source: Kukadi Irrigation Department, Division No. 1, Narayangaon Project, Vol. I,
page-11.
64
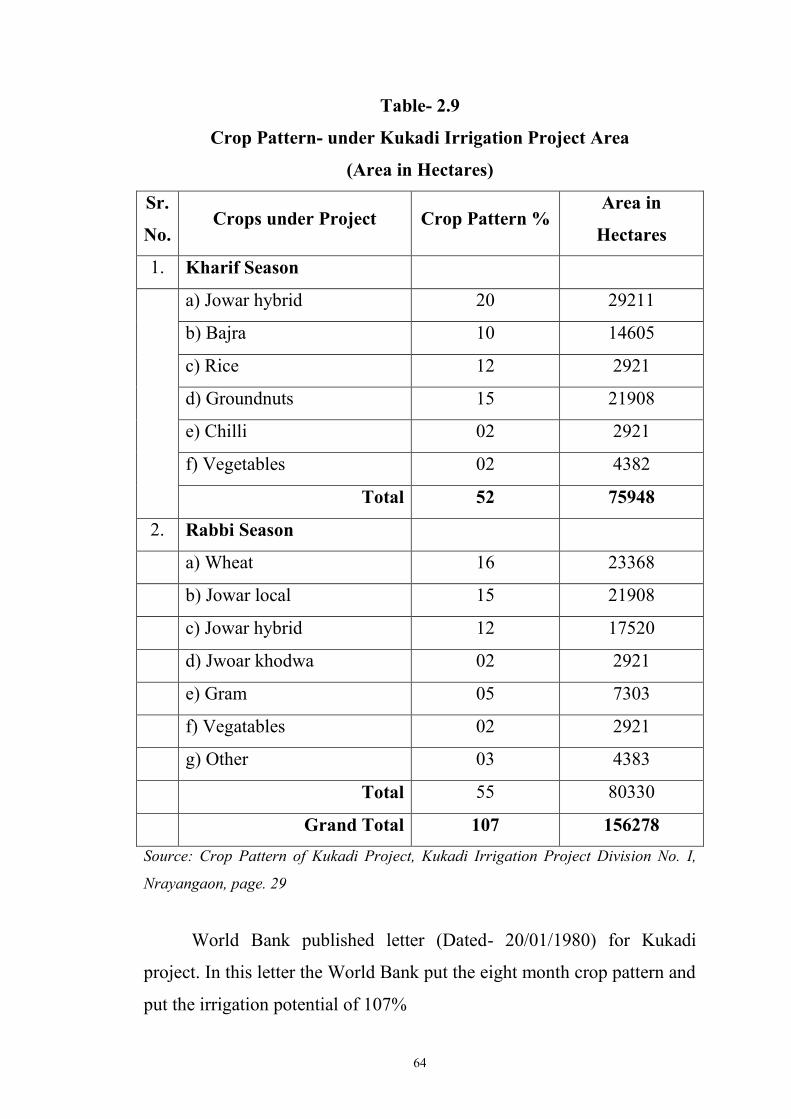
Table- 2.9
Crop Pattern- under Kukadi Irrigation Project Area
(Area in Hectares)
Sr.
No. Crops under Project Crop Pattern %
Area in
Hectares
1. Kharif Season
a) Jowar hybrid 20 29211
b) Bajra 10 14605
c) Rice 12 2921
d) Groundnuts 15 21908
e) Chilli 02 2921
f) Vegetables 02 4382
Total 52 75948
2. Rabbi Season
a) Wheat 16 23368
b) Jowar local 15 21908
c) Jowar hybrid 12 17520
d) Jwoar khodwa 02 2921
e) Gram 05 7303
f) Vegatables 02 2921
g) Other 03 4383
Total 55 80330
Grand Total 107 156278
Source: Crop Pattern of Kukadi Project, Kukadi Irrigation Project Division No. I,
Nrayangaon, page. 29
World Bank published letter (Dated- 20/01/1980) for Kukadi
project. In this letter the World Bank put the eight month crop pattern and
put the irrigation potential of 107%
65
Kukadi Irrigation Project in Shrigonda Tahsil:
In Shrigonda Tahsil Kukadi irrigation division No. 2 was working.
Under this division Ghod Project, Kukadi left bank canal Km. 114 to Km.
178 area was consider for irrigation. Visapur medium project, Small
irrigation projects in Pune district, five Kolhapur type dams, Kolhapur
type dam at Kapsewadi in Ahmednagar district and other eight small
irrigation dams was under this division.
Ghod dam was constructed brtween the village Chinchni, Tal:
Shirur, Dist: Pune and village Wadgaon, Tal: Shrigonda, Dist:
Ahmednagar. The total water storage capacity of Ghod dam is 216.31
Quebec meters. Out of that 154.80 Quebec meters water available for
irrigation. This project irrigates 14310 hectares area in Ahmednagar
district is and 6190 hectares area in Pune district.
Under the Ghod project on Ghod River there are five Kolhapur
type dams are constructed by irrigation department, and all that five
dams‟ store 441 Quebec feet water. By this water 3321 hectares area was
irrigated in Shrigonda Tahsil. Near Kolgaon Dolas there is another small
irrigation dam under this project and the water storage capacity of this
dam is 3775 Quebec feet. This dam irrigates 134 hectares area in
Shrigonda Tahsil.
From Ahmednagar and a Solapur districts Kukadi left bank canal
up to 114 Km. irrigates 52838 and 24562 hectares area consequently.
Today PWD handover up to 178 Km. canal for irrigation purpose and this
canal irrigates more area in Shrigonda and Karjat Tahsils. Canal provided
the water up to 178 Km. for drinking purpose and filling the small dams
for other purpose by the direction of District Collector Ahmednagar.
Newly constructed Visapur medium project was included in
Kukadi project. Water storage capacity of Visapur medium project was
26.10 Quebec meters (922 Quebec feet) and this project irrigates 5388
66
hectares area of Ahmednagar district. From Shrigonda Tahsil 5 and
Karjat Tahsil 3 small dams under Kukadi project and water storage
capacity of the eight dams are 16.45 Quebec feet (581 Quebec feet).
These eight dams irrigate 3288 hectares area in Shrigonda and Karjat
Tahsils in Ahmednagar district. At Kapsewadi in Shrigonda Tahsil there
are another one Kolhapur type dam is constructed and this dam are also
under this division. This dam provided more 267 hectares area facility of
irrigation. Water storage capacity of this dam is 1.38 Quebec meters (49
Quebec feet).
Rabbi Season and Summer Season of Year 2005-06:
Rabbi Season: For rabbi season 2005-06 three times water relies
from the canal and this decision taken by the Canal Committee. Ghod
project, Visapur medium project and all dams under Kukadi project was
fully storage by water up to 15/10/2005.
Area Irrigates in Rabbi Season- 2005-06:
1. Ghod Project: 11606 hectares
2. Kukadi Project: 24722 hectares
3. Visapur Medium Project: 3956 hectares
4. Small Irrigation Dams 1028 hectares
5. Kolhapur type Dams 1402 hectares
Total: 39714 hectares
Summer Season: In summer season the design taken from canal
adversary committee is two times release the water for irrigation. This
design depends upon availability of water in Ghod and Kukadi project.
Finally release the water successfully by the design.
67
Area irrigated in summer season:
1. Ghod Project 4797.45 hectares
2. Kukadi Project 5768.30 hectares
3. Visapur Medium Project 2850.00 hectares
4. Small Irrigation project 651.00 hectares
5. Kolhapur type Dams 1000.00 hectares
Total: 15060.00 hectares
Today‟s water storage capacity: Following table 2.10 shows the
availability of water in Kukadi project, Visapur medium project, Ghod
project and Small irrigation projects up to 08/09/2006.
68
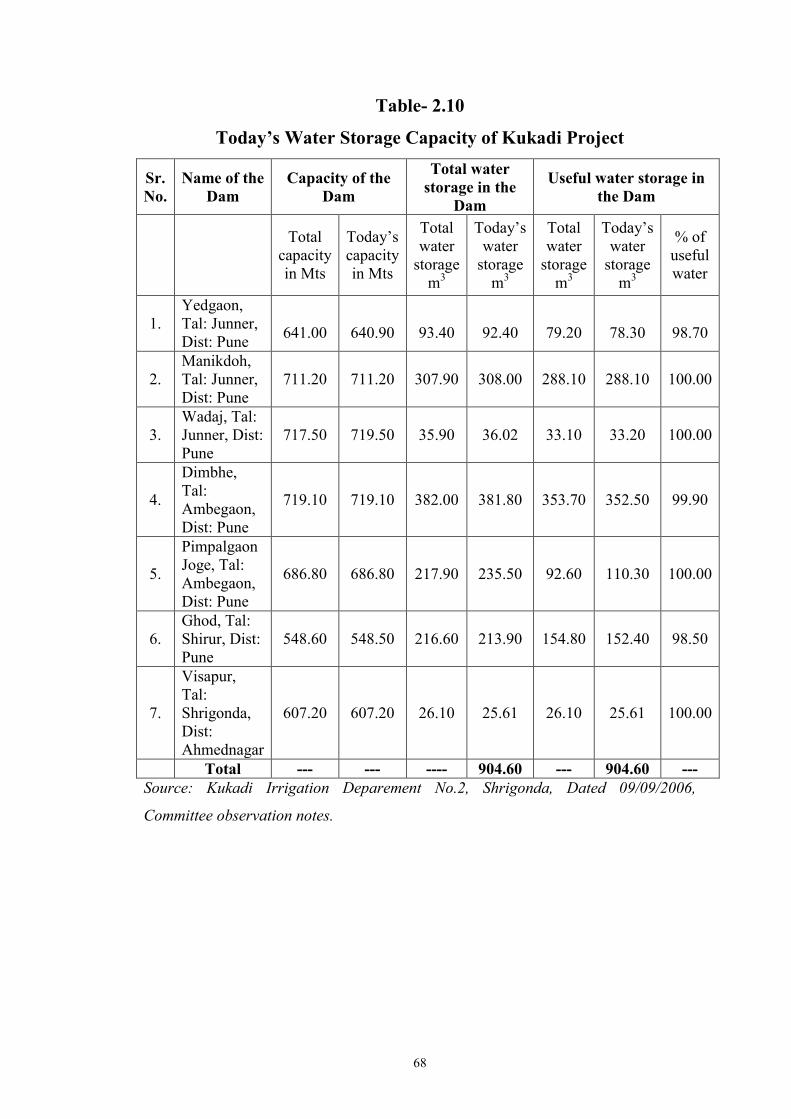
Table- 2.10
Today’s Water Storage Capacity of Kukadi Project
Sr.
No.
Name of the
Dam
Capacity of the
Dam
Total water
storage in the
Dam
Useful water storage in
the Dam
Total
capacity
in Mts
Today‟s
capacity
in Mts
Total
water
storage
m3
Today‟s
water
storage
m3
Total
water
storage
m3
Today‟s
water
storage
m3
% of
useful
water
1.
Yedgaon,
Tal: Junner,
Dist: Pune
641.00
640.90
93.40
92.40
79.20
78.30
98.70
2.
Manikdoh,
Tal: Junner,
Dist: Pune
711.20 711.20 307.90 308.00 288.10 288.10 100.00
3.
Wadaj, Tal:
Junner, Dist:
Pune
717.50 719.50 35.90 36.02 33.10 33.20 100.00
4.
Dimbhe,
Tal:
Ambegaon,
Dist: Pune
719.10 719.10 382.00 381.80 353.70 352.50 99.90
5.
Pimpalgaon
Joge, Tal:
Ambegaon,
Dist: Pune
686.80 686.80 217.90 235.50 92.60 110.30 100.00
6.
Ghod, Tal:
Shirur, Dist:
Pune
548.60 548.50 216.60 213.90 154.80 152.40 98.50
7.
Visapur,
Tal:
Shrigonda,
Dist:
Ahmednagar
607.20 607.20 26.10 25.61 26.10 25.61 100.00
Total --- --- ---- 904.60 --- 904.60 ---
Source: Kukadi Irrigation Deparement No.2, Shrigonda, Dated 09/09/2006,
Committee observation notes.
69
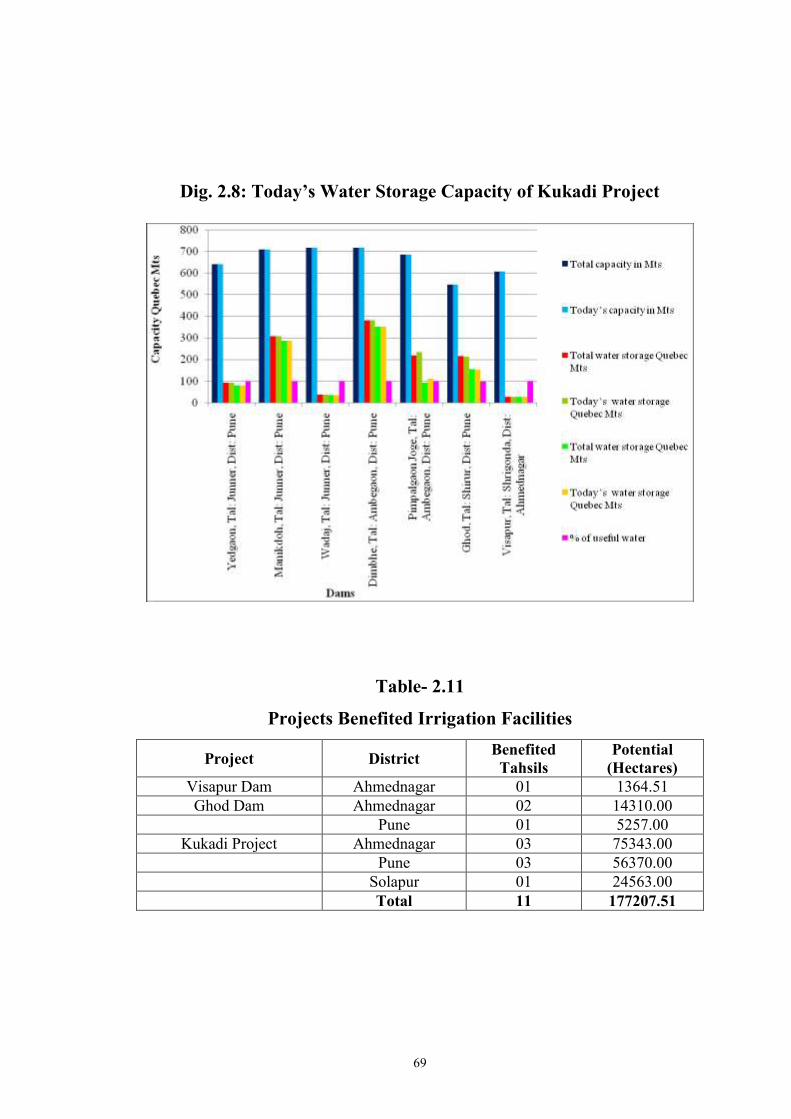
Dig. 2.8: Today’s Water Storage Capacity of Kukadi Project
Table- 2.11
Projects Benefited Irrigation Facilities
Project District Benefited
Tahsils
Potential
(Hectares)
Visapur Dam Ahmednagar 01 1364.51
Ghod Dam Ahmednagar 02 14310.00
Pune 01 5257.00
Kukadi Project Ahmednagar 03 75343.00
Pune 03 56370.00
Solapur 01 24563.00
Total 11 177207.51
70
2.7: Methodology:
Under Kukadi Canal project, command area in all, seven Tahsils
get the benefit of irrigation; three tahsil from Ahmednagar district, three
tahsils from Pune district and one tahsil from Solapur district. The water
is provided three times in an agricultural year (July to June) in a
protective fashion i.e., under Kharif, Rabi and 2 seasonal in the ratio of
40:40:20 respectively. Ghod Dam has got 20% area under 2 seasonal
crops which is not so under Visapur Dam command area selection of the
sample Tahsil.
In Ahmednagar district of the three tahsils, Shrigonda tahsil gets
maximum irrigation from Kukadi canal project. In terms of acreage and
as well as number of villages. 83 villages get the benefit to some extent or
the other. Shrigonda tahsil, both in absolute figures and percentage,
stands first in terms of area actually brought under irrigation and
percentage, stands first, in terms of area actually brought under irrigation
and as a ratio of the targeted area (in all the 3 seasons). For the year 2005-
06 (the latest available, at the beginning of this study) Shrigonda tahsil
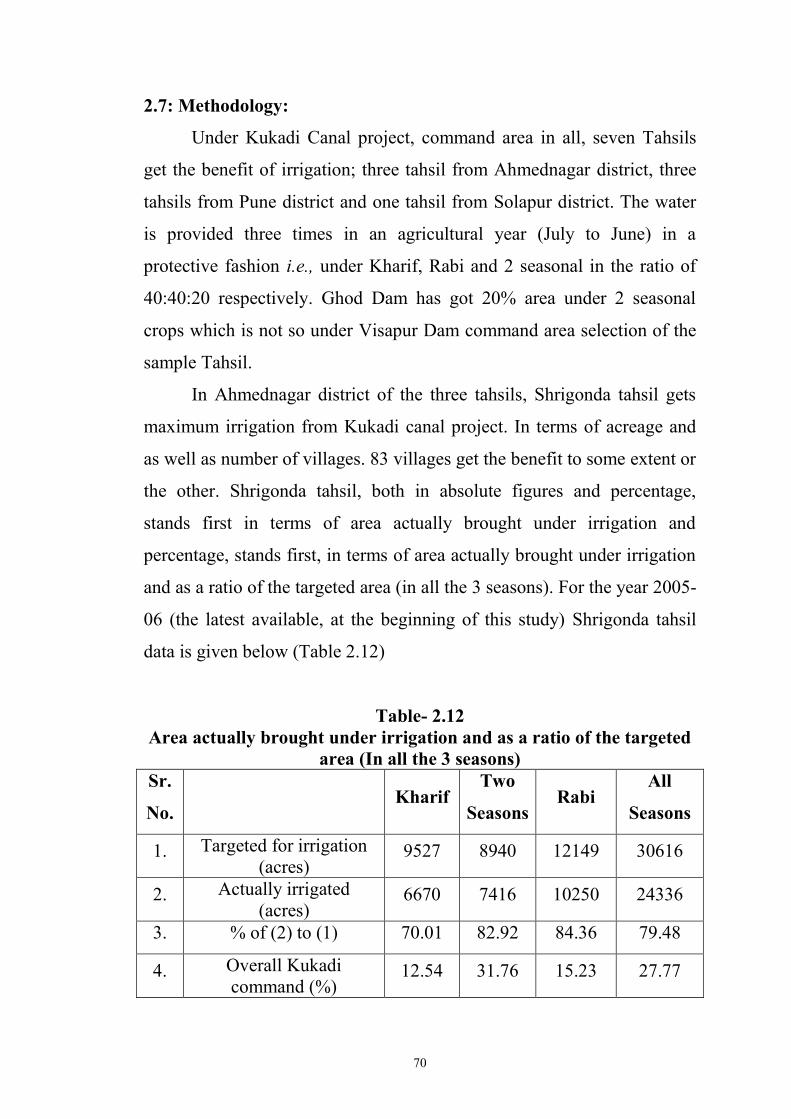
data is given below (Table 2.12)
Table- 2.12
Area actually brought under irrigation and as a ratio of the targeted
area (In all the 3 seasons)
Sr.
No. Kharif
Two
Seasons Rabi
All
Seasons
1. Targeted for irrigation
(acres) 9527 8940 12149 30616
2. Actually irrigated
(acres) 6670 7416 10250 24336
3. % of (2) to (1) 70.01 82.92 84.36 79.48
4. Overall Kukadi
command (%) 12.54 31.76 15.23 27.77
71
Thus season wise and overall, Shrigonda tahsils figures are higher
than the command area‟s figures. As a matter of fact, the area under this
command, till the project was constructed, has been cultivated during
Rabi season only (October onwards) as it is the only rainy season. It will
be redundant to use irrigation water, when rainwater is abundantly
available during Rabi season. If only rains fail, the farmer looks forward
for canal water. Kharif is a new concept in these newly irrigated areas.
The farmers are yet to get used, to the suage of canal water during Kharif.
Thus Shrigonda tahsil is selected for this study due to large area under
canal irrigation.
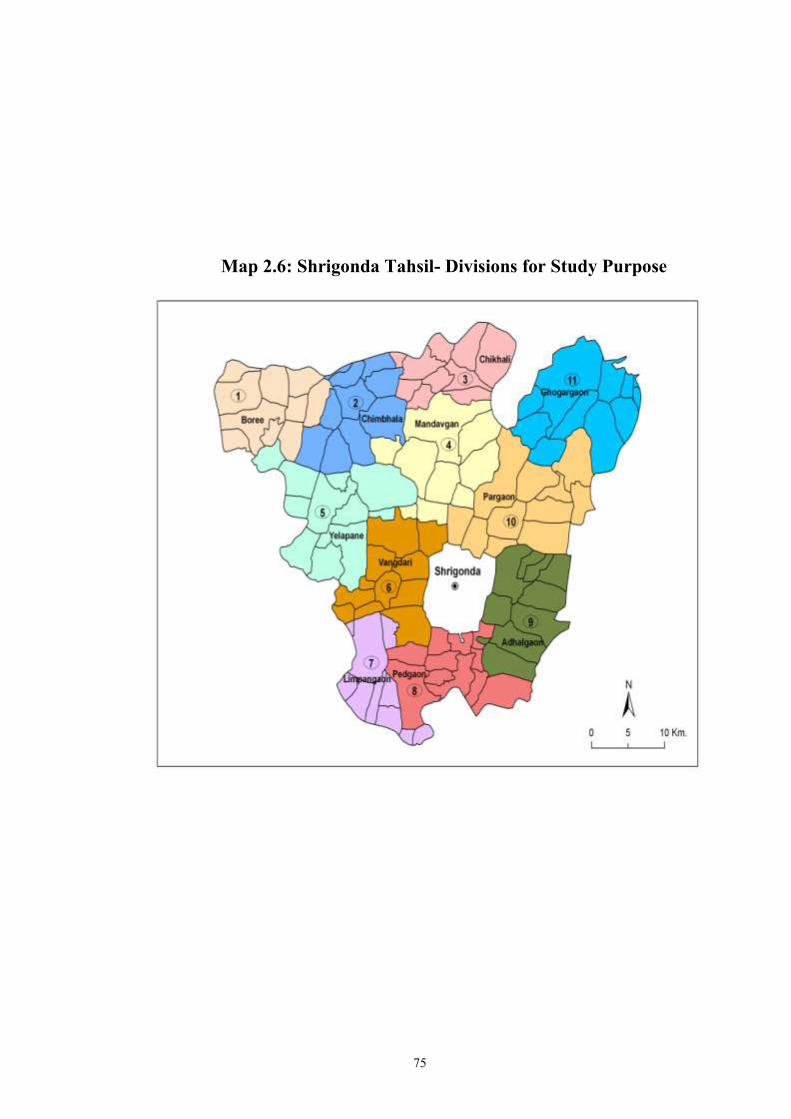
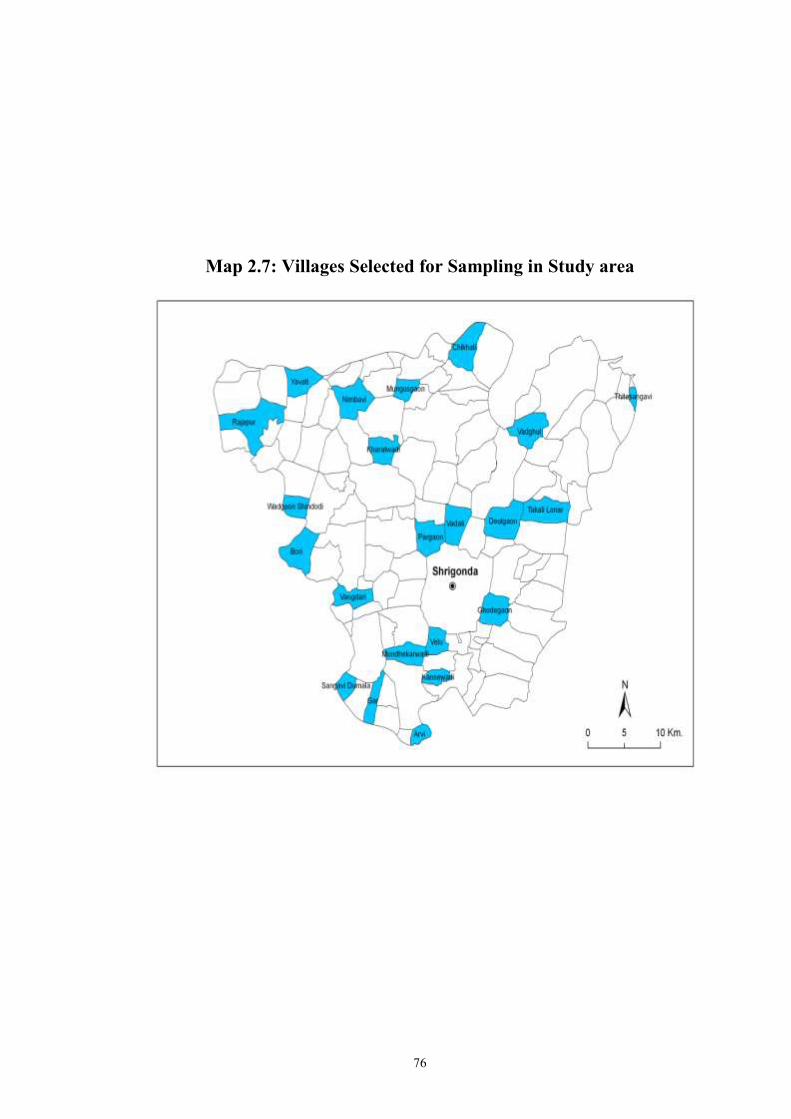
2.8: Sample Village Selection:
The next stage is to select villages for the intensive study of the
farm household to assess the impact of irrigation, from out of the 114
villages, of the Shrigonda tahsil. The study area is beyond imagination to
the side villages. The numbers of villages are more; therefore the Tahsil
will divide in to 11 divisions. In each division to villages are selected by
random sampling method. 20 farmers will be selected in each division
respectively. They will be divided in four categories such as Marginal,
small, medium and big farmers (According to land holding capacity).
Five sample of each category will be considered in terms of interview for
study.
72
Map 2.5: Villages of Shrigonda Tahsil
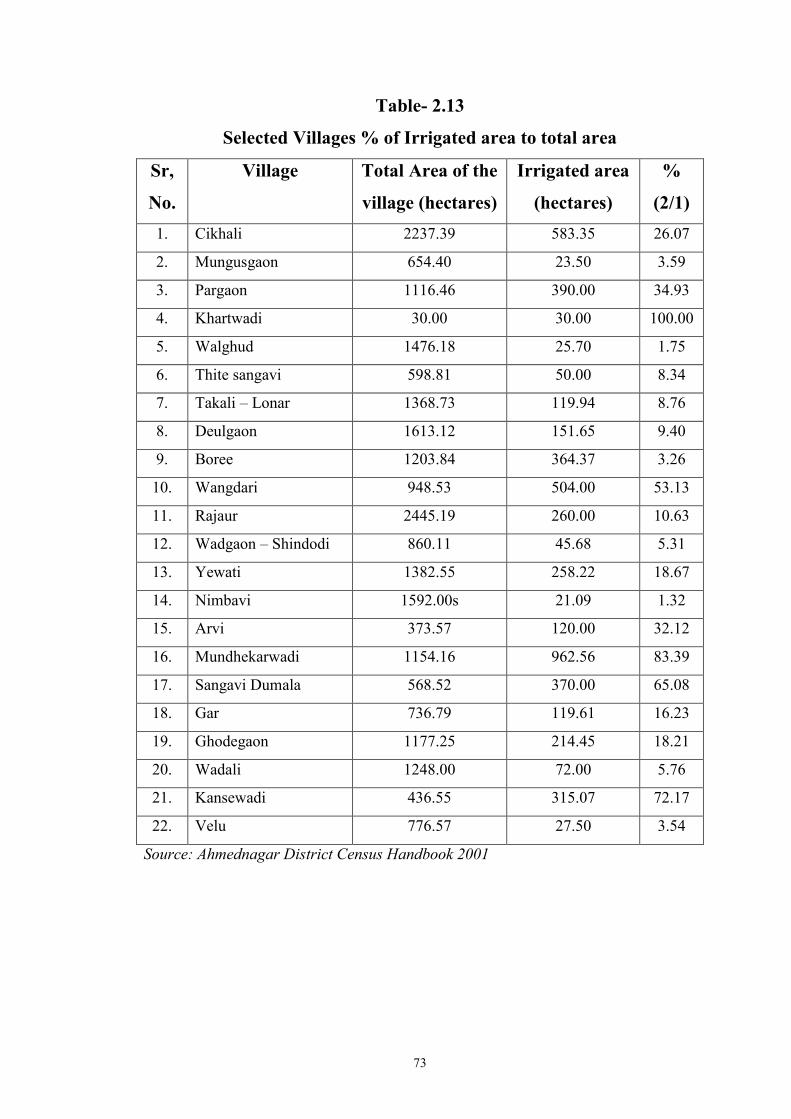
73
Table- 2.13
Selected Villages % of Irrigated area to total area
Sr,
No.
Village Total Area of the
village (hectares)
Irrigated area
(hectares)
%
(2/1)
1. Cikhali 2237.39 583.35 26.07
2. Mungusgaon 654.40 23.50 3.59
3. Pargaon 1116.46 390.00 34.93
4. Khartwadi 30.00 30.00 100.00
5. Walghud 1476.18 25.70 1.75
6. Thite sangavi 598.81 50.00 8.34
7. Takali – Lonar 1368.73 119.94 8.76
8. Deulgaon 1613.12 151.65 9.40
9. Boree 1203.84 364.37 3.26
10. Wangdari 948.53 504.00 53.13
11. Rajaur 2445.19 260.00 10.63
12. Wadgaon – Shindodi 860.11 45.68 5.31
13. Yewati 1382.55 258.22 18.67
14. Nimbavi 1592.00s 21.09 1.32
15. Arvi 373.57 120.00 32.12
16. Mundhekarwadi 1154.16 962.56 83.39
17. Sangavi Dumala 568.52 370.00 65.08
18. Gar 736.79 119.61 16.23
19. Ghodegaon 1177.25 214.45 18.21
20. Wadali 1248.00 72.00 5.76
21. Kansewadi 436.55 315.07 72.17
22. Velu 776.57 27.50 3.54
Source: Ahmednagar District Census Handbook 2001
74
Thus the inevitable choice has fallen on 22 villages (Table 2.13) for
detailed and in-depth study of the impact of irrigation on economic
development. For comparison purpose. The villages spread all over the
tahsil. But they are too small population wise, and also they get full
irrigation after 2000-01 by Kukadi Canal Project. Hence the availability
of dry farmers is ruled out (Administration report for 1979-80, Chairman
and Administrator, CADA, MP&G Projects, Ahmednagar).
75
Map 2.6: Shrigonda Tahsil- Divisions for Study Purpose
76
Map 2.7: Villages Selected for Sampling in Study area
77
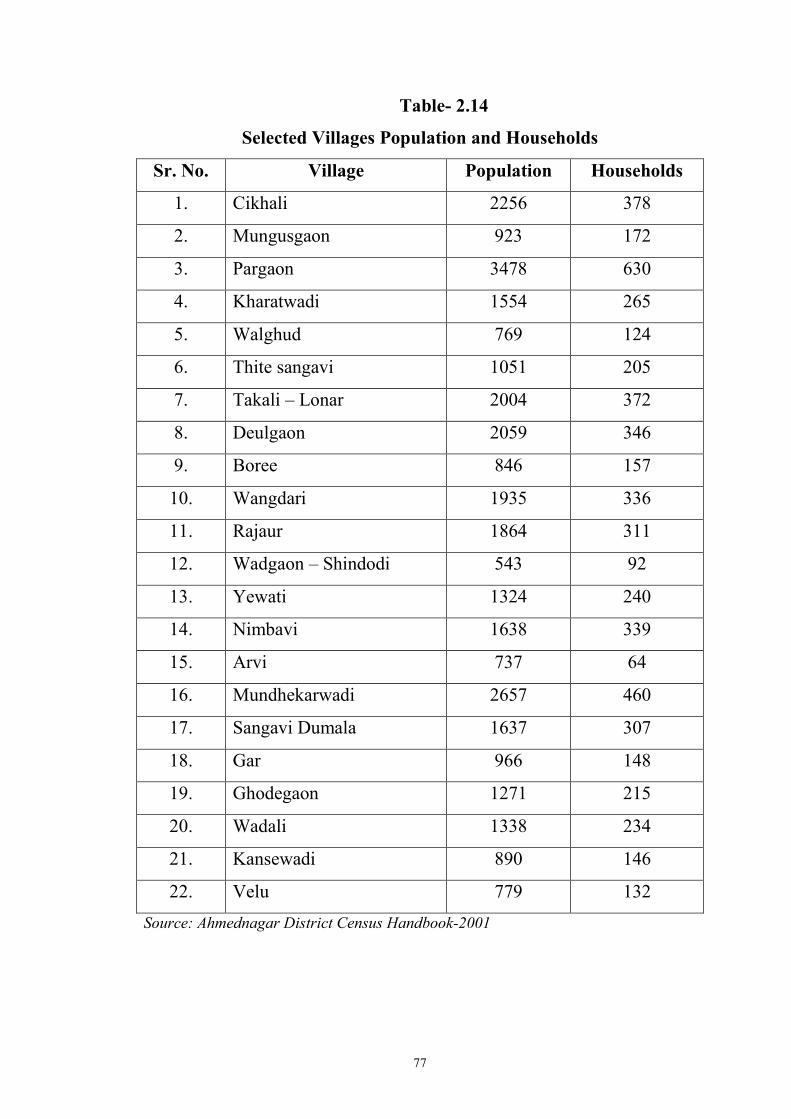
Table- 2.14
Selected Villages Population and Households
Sr. No. Village Population Households
1. Cikhali 2256 378
2. Mungusgaon 923 172
3. Pargaon 3478 630
4. Kharatwadi 1554 265
5. Walghud 769 124
6. Thite sangavi 1051 205
7. Takali – Lonar 2004 372
8. Deulgaon 2059 346
9. Boree 846 157
10. Wangdari 1935 336
11. Rajaur 1864 311
12. Wadgaon – Shindodi 543 92
13. Yewati 1324 240
14. Nimbavi 1638 339
15. Arvi 737 64
16. Mundhekarwadi 2657 460
17. Sangavi Dumala 1637 307
18. Gar 966 148
19. Ghodegaon 1271 215
20. Wadali 1338 234
21. Kansewadi 890 146
22. Velu 779 132
Source: Ahmednagar District Census Handbook-2001
78
On the Eastern side, Takali Lonar village is very big village, and
very low (8.76%) area under irrigation. On the south weastern side.
Mundhekarwadi village is another big village and areas irrigated by all
sources are 83.39%. This village has got a total geographical area are of
1154.16 hectares out of which 962.56 hectares are irrigated. Kharatwadi
is near to Visapur Dam. This Village has got 30.00 hectares geographical
area and all 30.00 hectares are irrigated mines 100% of irrigation in this
village. Mungusgaon is only 5 kilometers away from Visapur Dam and
this village has got a total geographical area of 654.40 hectares out of
which 23.50 (3.59%) hectares area irrigated by canal. Cikhal is the big
village on the north – eastern side of the tahsils. Populations of this
village are 2,346 and total area of the village is 2,237.39 hectares out of
this area only 583.35 hectares (26.07%) area is irrigated. The only
difference between these villages is irrigation from Kukadi canal project.
Moreover both Sellected villages have the same characteristics in terms
of climate, rainfall, temperature, soil structure, sociological factors, farm
practices etc. thus this study can be termed as an ex- post assessment of
the benefits of irrigation. Since it is not possible to obtain data prior to the
construction of the dam canal, comparing the agriculture input output in
two areas similar in all respects, except the availability of the irrigation in
one and the absence of it in another village, similar in all respects like
climate, rainfall, soil, sociological factors, farm practices and other
essential factors required to farm business, would indirectly to farm
business, would indirectly bring out the impact of irrigation, if any.
Naturally the results of this study would be based on the intensive
households to household‟s surveyor of cultivator‟s households. Every
sample farmer would be personally contacted and interrogated in detail,
with the help of a questionnaire specially designed for this purpose,
covering all the conceivable aspects of his social and farming life.
79
The samples are drawn on he lines of probability proportional
sampling method, taking the land holding size as the major control. In the
experimental irrigated (wet) villages 1105 sample house holds and in the
control (dry) villages 175 sample households are contacted for micro
level study (Table 2.16).
2.9: Methods of data collection:
Questionnaire method is adopted by contacting each head of the
sample household, besides the field observation and macro level
(secondary) data collection. The data is collected for the single
agricultural year; July 2008 June 2009. For cross checking the reliability
of the data, the village level worker, agricultural assistants, engineers
(PWD) and some elite leaders of the villages are interviewed
individually. Their views opinions are also recorded, on cretin relevant
and important issues, to serve as guidelines cross checks.
The strong point of the study is that the data has been collected by
the researcher himself and subsequently the tabulate on and analysis is
done by him. This approach, it is felt, enables the researcher to develop
insight in the field situation which helped a lot to enrich the subject
treatment in the analysis part
.
2.10: Size and Type of Samples:
The cultivators list has been prepared from the up-dated Khata
book of all villages, available with the Talathi (Village accountant)
revenue official at the village level. The list, thus recorded is exhaustive
and latest. Those farmers, who are having land in the sample villages but
staying outside the village, are however not considered for this study.
The Khata book thus recorded has been regrouped into four land
holding size (Villiam G. Cochran, 1972, Sampling techniques, pp. 282-
80
299), to capture the conditions of farmers, belonging to various levels
(small, medium, marginal, big, etc.)
Farmer categories:
1. < 1.5 hectares – Small farmers
2. 1.6 to 3 hectares – Medium farmers
3. 3.1 to 7 hectares – Marginal farmers
4. > 7 hectares – Big farmers.
The percentages are worked out LHS wise to the total. The samples
are drawn by adopting the “probability proportional sampling” method
(Narayan, B. K. and Vasudeva Rao, D. Farm, Economy 1978 of MP and
GP, CASU, ISEC). The average land holding size, per household, is
observed to be around 5 to 6 hectares in the sample villages- which is true
for the study region. Hence care is taken to include “samples of less than
1.5 hectares” as they might represent weaker sections and small farmers,
who need special attention for their share in he process of development.
In the total sample representation for each size class is maintained in the
same households are selected for intensive study. (Table 2.15) so far as
the control villages is concerned; the dry farmers from the villages are
selected by the same method. Though 18 villages gets the benefit of
irrigation from canal, yet 70 % of cultivated farmers (due to there
location, higher altitude, and the alignment of the canal) pursuer the
cultivation on dry / rain fed methods. From among the 05 villages listed
under each land holding size, the dry farmers are identified and selected
for the study of the „control‟ (rain fed) conditions of 18 villages. In all
1285 cultivators are selected from 22 villages. Irrigation is the principal
factor of agriculture development where rainfall is inadequate and is
unevenly spread in time and space (Arun S. Patel, 1981).
81
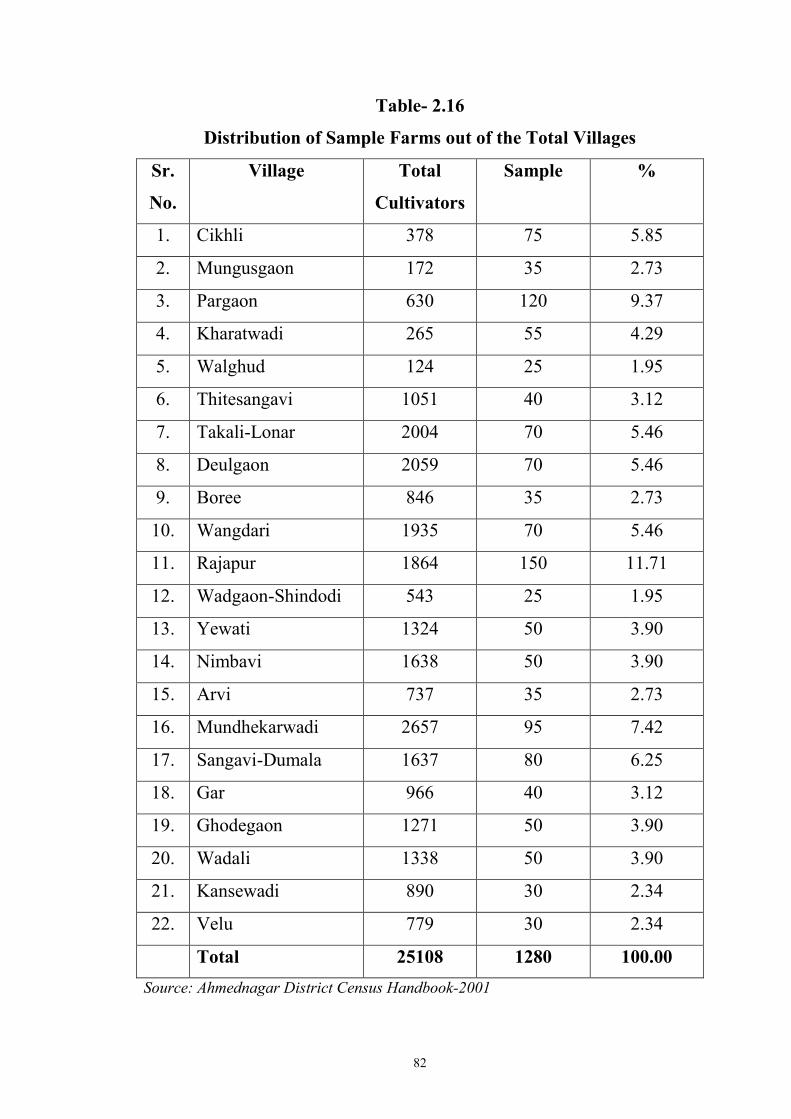
The selected households are distributed equally in each of the
selected villages, such that the varying geo-agricultural and social
configuration of the project may well be represented in the sample
(Table 2.16)
Table- 2.15
Sample Frame Work – Probability Proportional Method
Sr.
No.
LHS Total No. of
Cultivators
% Sample
Cultivators
%
1. < 1.5 hectares 1596 28.10 320 25.00
2. 1.6 to 3 hectares 1468 25.90 320 25.00
3. 3.1 to 7 hectares 1389 24.50 320 25.00
4. > 7 hectares 1220 21.50 320 25.00
Total 5670 100.00 1280 100.00
82
Table- 2.16
Distribution of Sample Farms out of the Total Villages
Sr.
No.
Village Total
Cultivators
Sample %
1. Cikhli 378 75 5.85
2. Mungusgaon 172 35 2.73
3. Pargaon 630 120 9.37
4. Kharatwadi 265 55 4.29
5. Walghud 124 25 1.95
6. Thitesangavi 1051 40 3.12
7. Takali-Lonar 2004 70 5.46
8. Deulgaon 2059 70 5.46
9. Boree 846 35 2.73
10. Wangdari 1935 70 5.46
11. Rajapur 1864 150 11.71
12. Wadgaon-Shindodi 543 25 1.95
13. Yewati 1324 50 3.90
14. Nimbavi 1638 50 3.90
15. Arvi 737 35 2.73
16. Mundhekarwadi 2657 95 7.42
17. Sangavi-Dumala 1637 80 6.25
18. Gar 966 40 3.12
19. Ghodegaon 1271 50 3.90
20. Wadali 1338 50 3.90
21. Kansewadi 890 30 2.34
22. Velu 779 30 2.34
Total 25108 1280 100.00
Source: Ahmednagar District Census Handbook-2001