Embed Size (px)
Citation preview


CHAPTER 1 INTRODUCTION
This project was initiated in 1995 by the Florida Planning and Development
Laboratory at Florida State University in collaboration with the Lee County, Florida, Division of Public Safety, with the objective of developing a practical, risk-based mechanism for financing local emergency management costs associated with hurricanes. This initiative is premised on the tax-benefit-equity principle that property owners should pay for municipal services in proportion to the benefits they receive. It also is premised on the assumption that property owners within a jurisdiction consume differing levels of local emergency management services based on the types of structures on their properties and where those properties are located relative to the hazards associated with hurricanes.
Tax benefit equity is an axiom of normative tax policy that can be traced to the contract theory of the state as it was defined by such writers as Locke and Hobbes and Adam Smith’s first canon of taxation (Musgrave and Musgrave, 1984: 228). Local governments traditionally have applied this concept to such public services as street lighting, fire protection, water and sewer service, and trash collection, where it is a fairly simple matter to distinguish property owners who consume the services from those who do not and to measure the amount of the service they consume.
More recently, a number of planning scholars have advocated extending the tax benefit equity concept to public services that are necessitated by the development of land that is exposed to natural hazards (Burby, 1991; Burby, 1998; Burby and French, 1985; Godschalk et al.,1989; Godschalk et al, 1999; Smith and Deyle, 1997). While it is acknowledged that all land is subject to some natural hazards (e.g., wind, hail, and lightning), risks from other hazards such as flooding, storm surge, waves, and wildfire, vary spatially at a scale that is relevant to local land use planning. Furthermore, vulnerability to most natural hazards also varies with the type of structural improvements that are made to land and the design and construction of those improvements.
The essence of this argument is that where property owners choose to develop land in hazardous areas, and thereby make it necessary for local governments to provide emergency management services as well as public infrastructure that is also exposed to natural hazards, they should pay the majority of the costs for planning, preparedness, mitigation, response, and recovery by local government. Such a policy requires a method of allocating appropriate shares of the costs based on relative risk that is practical and legally and politically defensible. There is little experience, however, with operationalizing the concept of risk-based tax benefit equity, and little research has been done to assess the options for recouping the costs of providing emergency management services both before and after disasters. We have undertaken such an effort focused on local disaster management services necessitated by development of land exposed to hurricanes.
In this project report, using data for Lee County, we demonstrate a method for defining and measuring the benefits property owners derive from emergency management services where they are attributable to hazards such as hurricanes that
1
vary spatially and where private decisions about structure type and design affect the necessity for such services. We show that local governments are likely to be able to use a risk-based special assessment for financing emergency management services, in the form of a special benefit assessment, under their existing revenue-generating powers. We find, however, that the total local government costs that would be covered by such an assessment are relatively small under current federal and state disaster assistance policies. As a result, establishing and administering such an assessment might not be viewed as cost-effective, and the potential for such an assessment to influence development decisions is likely to be small. On the other hand, the small effect of such an assessment on most property owners’ tax bills suggests that tax redistribution issues are not likely to pose serious political obstacles to implementation. Moreover, where communities do not presently have a contingency fund to pay for costs of disaster response and recovery, a risk-based assessment may offer a more politically acceptable method of financing such a fund. The system described here can be applied by other jurisdictions exposed to hurricanes, and it can be extended to other natural hazards for which risk varies spatially at a local scale or as a function of the type and design of structural improvements on land.
Why A Special Benefit Assessment? The public costs of developing hazardous lands are substantial. Godschalk et al.
(1999: 8) report that federal expenditures for individual assistance, public assistance, and local hazard mitigation for floods, coastal storms, hurricanes, earthquakes, and fires totaled more than $11 billion between 1988 and 1996. The total for hurricanes alone was $3.7 billion. We have estimated that local government losses from hurricanes in Florida exceeded $650 million between 1979 and 1995, prior to receipt of federal and state disaster assistance (Boswell et al., 1999).
Local governments typically pay their share of disaster event costs, as well as the ongoing costs of emergency planning, preparedness, and mitigation, from general revenue sources such as property taxes or sales taxes. However, when they finance these services in this manner, all members of the jurisdiction pay, including those who own property in less hazardous locations and those who have incurred the expenses of building structures that are less vulnerable to the forces of natural hazards. Similarly, because state and federal governments pay a large proportion of the costs of local government response and recovery, persons who live in other, potentially less hazardous jurisdictions further subsidize those who build vulnerable structures on hazardous land.
We count ourselves among those who argue that such subsidies are inequitable and inefficient and, therefore, bad land use policy and bad fiscal policy. Where local governments are unwilling or unable to control development in hazardous areas, the principle of tax benefit equity dictates allocating the public costs of providing emergency management services in proportion to the benefits received. The generally accepted test of the reasonableness of imposing a separate assessment or user fee for a specific public service is the extent to which consumption of the service is rivalrous -- that is,
2

consumption
3

by one individual reduces the benefits available to other consumers -- and the benefits consumed by each individual can be clearly defined and measured (Aronson, 1985; Musgrave and Musgrave, 1984). We address these questions in the following chapters.
Eliminating subsidies for risky development on hazardous land also may provide a stimulus for property owners to reduce their vulnerability by relocation or by retrofitting their structures through such measures as elevation, flood proofing, and structural strengthening. In addition, requiring property owners to pay their full share of emergency management costs may reduce the attractiveness of developing hazardous areas at all. The importance of these incentives depends on the magnitude of the tax differential that would result from substituting a risk-based assessment. Our analysis is designed to estimate these parameters as well.
Overview of the Report Two articles have been published in peer-reviewed articles based upon this
project. Boswell et al. (1999) describe the methods used to estimate annualized response and recovery costs a local government may experience from hurricanes. Deyle and Smith (2000) present an overall summary of the project and its findings. This report provides details about data and methods that are needed for applying this approach in another setting, either for the purpose of assessing property owners for local emergency management services associated with hurricanes, or for other natural hazards that might threaten a community.
Chapter 2 details the methods we have used to define the local emergency management costs can that can be attributed to development of land exposed to natural hazards. These are divided into three categories: (1) annual costs of planning, preparedness, and mitigation; (2) annualized costs of emergency protective measures, including evacuation, that may be incurred when a local government is threatened by a foreseeable hazard such as a flood or hurricane, and (3) annualized costs of response and recovery in the event that a disaster strikes the jurisdiction. We then apply those methods to hurricane hazards in Lee County to estimate annualized costs that can be used to quantify the local emergency management services benefits consumed by owners of developed property in the county. Appendices A through C provide additional details on the data and methods used to estimate these costs.
In Chapter 3 we describe a method, based on relative risk, for defining the appropriate share of local emergency management costs that should be paid by the owner of a structure on land exposed to natural hazards. The approach involves calculation of four risk indexes that are applied to the major benefit categories defined in Chapter 2. We then apply this approach to hurricane hazards in Lee County.
Chapter 4 demonstrates how the risk indices can be used to calculate annual assessments for individual properties and describes the impacts of such an assessment in
4

5
Lee County. We examine the tax differentials that would result from applying a risk-based assessment, versus continuing to fund emergency management services from general revenues.
In the final chapter, we discuss implementation issues including alternative methods of levying a risk-based assessment, the administrative and political feasibility of implementing such an assessment system, and the potential for such an assessment to alter the behavior of land owners and developers. Appendix D provides documentation for a Microsoft Access program that we developed for performing the property assessment calculations for Lee County that are described in Chapters 3 and 4.

5
CHAPTER 2 LOCAL EMERGENCY MANAGEMENT SERVICES FOR NATURAL HAZARDS
AND APPLICATION TO LEE COUNTY, FLORIDA
Introduction
If the tax benefit equity concept is accepted on principle, the first step toward assessing the utility of a risk-based property assessment is defining and quantifying the services provided. This requires identifying local emergency management services provided to the owners of developed property parcels that can be attributed to one or more hazards. These services can be divided into two major categories: (1) ongoing services and (2) event services. Ongoing services include planning, preparedness, and mitigation activities that occur independent of specific disasters. Event services include response to an anticipated or actual disaster and recovery from the impacts of disasters that do affect the jurisdiction.
Our approach estimates total average annual service costs for a local government so that these costs can be allocated across developed parcels within the jurisdiction on the basis of the relative risk posed by the structures that have been erected. In addition, the estimate of event costs can be used as the basis for developing a local contingency fund designed to cover the costs of response to and recovery from specified natural disasters. Ongoing Costs of Emergency Management Services
In agencies such as police, planning, building inspection, and public works, whose primary missions are not focused on emergency management, ongoing services primarily consist of planning and preparedness. Associated costs include participation in annual disaster response training exercises and the purchase and maintenance of specialized equipment used in fulfilling the agency’s assigned duties in disaster response and recovery. Typically the local emergency management department performs the majority of planning and preparedness activities and may have responsibility for administering programs for hazard mitigation.
In the following sections we present the results of our survey of county agencies within Lee County that play some role in providing emergency management services related to hurricanes. Estimates include annual operating costs and a separate estimate of annualized capital costs for equipment that is priced at greater than $500 and is used for disaster response or recovery following hurricanes. After a brief description of the general methods used to gather data and the agencies included in the analysis, we present summaries for each agency. This is followed by a tabulation of the total continuing costs that can be reasonably attributed to the hazards presented by hurricanes in Lee County.

6
Estimation Methods for Hurricanes in Lee County
We limited our estimates of ongoing service expenditures to those that are funded from the county’s general fund and their All Hazards Tax. The All Hazards Tax is an ad valorem tax applied to real property only within the unincorporated areas of the county that is used to fund mitigation initiatives and the local share of disaster response and recovery costs. The risk-based assessment we have developed differs from the All Hazards Tax in four respects:
(1) it would be assessed on the basis of relative risk rather than assessed property value;
(2) it would cover annual costs of emergency management that are currently funded from general revenues as well as mitigation costs and response and recovery costs currently financed by the All Hazards Tax;
(3) it only applies to costs associated with hurricanes; and (4) we calculated the assessment on the assumption that it would be applied
county-wide rather than solely within the unincorporated areas of the county as is the case for the All Hazards Tax.
We selected agencies for analysis in consultation with John Wilson, Director of the County Division of Public Safety and from a review of the county's Peacetime Emergency Plan Element (Lee County Department of Public Safety,1992: 18). As a general rule, we included agencies that were assigned at least one primary role in the plan. Table 2-1 lists agencies with primary assignments in the plan that are in this analysis. The roles of these agencies are detailed below. Table 2-2 describes those agencies that are excluded. This latter group consists of agencies whose operations are not principally funded from the county general fund and, therefore, could not be easily included under a single revenue-generating mechanism designed to pay for the emergency management costs associated with hurricanes. These include all municipal agencies as well as two county agencies that are operated as enterprise funds: the water and sewer operations of the Department of Lee County Utilities and the Solid Waste Division of the County Department of Public Works.
Discussions with Wilson (1995) and staff of the two enterprise-fund agencies (Horton, 1995; Johnson, 1995) indicated that emergency management activities of these agencies are funded solely from user fees. Any incident costs that exceed enterprise fund operating budgets also would be covered by user fees, although there might be some short-term transfer of monies from the county general fund to cover shortfalls occasioned by a disaster. To properly apply the risk-based assessment concept, federal public assistance costs for these agencies should be applied for separately by these agencies, so that the local share is paid directly by the enterprise funds and so that the federal financial assistance is returned to the funds. A risk-based assessment system developed for the county also could be applied to these enterprise fund operations, but would require an analysis of storm damage risks for specific service areas.
We based estimates of ongoing service expenditures primarily on 1994 staffing data and 1995 budget information provided to us through interviews with agency directors or their designees. In a few instances we used 1994 budgets because of uncertainties about 1995 budgets at the time we collected the data. We estimated

7
annualized capital expenditures by applying straight-line depreciation to the original purchase price of specific pieces of equipment that cost $500 or more adjusted to 1995 dollars using the Consumer Price Index.
We asked the agency staff to provide us with their best estimate of the staff time and expenditures that could be reasonably attributed to planning, preparedness, and mitigation for hurricanes. Most could not do so, however, because their staff activities and budgets are not neatly differentiated in so narrow a fashion. Therefore, most expenditure estimates represent those for total emergency management planning, preparedness, and mitigation. Where this is the case, we have applied estimates provided by Wilson to differentiate costs associated with natural hazards versus technologic hazards (67% versus 33%) and costs associated with hurricanes and flooding versus other natural disasters (90% versus 10%). Thus where cost estimates provided by the agency contacts were not clearly limited to those associated with hurricanes, we multiplied the estimates by a factor of 0.603 (0.67 x 0.90). All estimates were subsequently reviewed and approved for reasonableness by the individual agencies. Table 2-1 Local Agencies Included in Cost Analysis Budget Services Department of Community Development...
Division of Codes and Building Services Division of Environmental Sciences Division of Zoning and Development Services Division of Planning
Department of Parks and Recreation... Public Recreation Services
Department of Public Safety... Division of Communications Division of Emergency Management Division of Emergency Medical Services
Division of Transportation... Department of Public Works
HRS Lee County Public Health Unit Human Resources Human Services Information Hotline/Lee Cares Lee County Transit Public Information Office Purchasing Services Sheriff's Department Visitor and Convention Bureau (Recovery Information Hotline)

8
Table 2-2 Local Agencies with Primary Assignments Under Lee County Peacetime Emergency Plan Not Funded Through the County General Fund
Agency (page reference)
Primary Assignment (Annex)
Secondary Assignment (Annex)
Department of Lee County Utilities (enterprise fund) (p. 64)
Utility Services - Coordination (XVIII)
Training & Education (I) Public Health - Water (VIII) Emergency Reporting (X) Federal Public Assistance (XII) Debris Removal (XIII) Hazard Mitigation (XVII) Resource Management (XIX)
Division of Solid Waste
None
Debris Removal (XIII)
School Board of Lee County (p. 66)
Training & Education (I)
Relief Services - Facilities (IX) Emergency reporting (X) Federal Public Assistance (XI) Emergency Transportation (XIV) Electrical Power Shortage (XVI)
Local Fire Suppression Agencies (p. 67)
Training & Education (I) Warning (II) Communications (IV) Search & Rescue (VI) Fire Suppression (XV)
Federal Public Assistance (XI) Evacuation (V) Emergency Reporting (X) Debris Removal (XIII) Electrical Power Shortage (XVI)
Municipal Law Enforcement Agencies (p.VII-3)
Public Safety (VII)
None
Agency (page reference)
Primary Assignment (Annex)
Secondary Assignment (Annex)
Health/Medical Care-Related Agencies, Providers, Facilities (p. 67)
Training & Education (I)
Public Health (VII) Relief Services (IX) Electrical Power Shortage (XVI)
Utility Services (p. 67)
Training & Education (I) Electrical Power Shortage (XVI) Utility Services (XVIII)
None

9
These estimates can be updated by following a similar process. It is, however, a difficult and time-consuming effort. We would recommend that if such an update is undertaken, it be initiated under the direction of the county manager's office to assure timely cooperation from each of the affected agencies. Agency Expenditures
Following are details for each county agency included in the tabulation of continuing costs. For each agency or division we have listed the principal contact person from whom data were obtained, an estimate of the salaries, fringe benefits, and other indirect costs that can be attributed to planning, preparedness, and mitigation for hurricanes, and the estimated annualized capital costs of specialized equipment used for hurricane planning, preparedness, and mitigation. Budget Services Contact: Bruce Loucks, Director. Telephone interview 6/30/95. Description of activities: Administers the flood insurance program. After a disaster event, is responsible for filing disaster claims with the Federal Emergency Management Agency (FEMA). Most of the training in which staff participate is related to technological disasters and is related to staff of safety specialists and responsibilities for administering the worker's compensation program. Agency does participate in state-wide hurricane training exercise. Salaries, fringe benefits, and other indirect costs: 1) Continuing effort devoted to administration of flood insurance program - 5 worker-days/yr. 2) Training: State-wide hurricane training exercise - 4 persons x 8 hrs = 4 worker-days/yr. Total hurricane emergency management work effort = 9 worker-days/yr Total Staff = 25 FTE (full-time equivalent employee) x 260 worker-days/FTE/yr = 6,500
worker-days/yr Proportion = 9/6,500 = 0.00138 Budget FY 95 = $1,706,775 Hurricane multiplier = 1.0 Estimated annual expenditures for hurricanes: 1.0 x 0.00138 x $1,706,775 = $2,363 Specialized equipment: None.

10
Department of Parks and Recreation - Public Recreation Services Contact: John Yarbrough, Director. Telephone interview and memorandum 6/95. Description of activities: The Parks and Recreation Department participates in ongoing county emergency management planning and training as well as briefing and planning sessions that are convened when a storm threatens. Response and recovery activities include debris removal from park property and operation of the County Civic Center as a regional center for staging and storage for the north part of the county. Salaries, fringe benefits, and other indirect costs: Total emergency management work effort (excluding Civic Center) = 425 hrs = 53.13
worker-days/yr (should keep the order of information consistent with each agency)
Total Staff = 200 FTE = 52,000 worker-days/yr Proportion = 53.13/52,000 = 0.00102 Budget FY 94 = $11,000,000 Estimated planning costs for Civic Center staging operations = $8,000 Hurricane multiplier = 0.603 Estimated annual expenditures for hurricanes: 0.603 x [(0.00102 x $11,000,000) +
$8,000] = $11,590 Specialized equipment: None. Department of Community Development - Division of Codes and Building Services Contacts: Bobby Stewart, Director; Mary Conrod, D/P Expert System Specialist. Personal interview 6/13/95. Description of activities: This division is responsible for implementing the county's building regulations and for issuing permits for new development. Direct involvement and responsibility for emergency management planning, preparedness, and mitigation activities is minimal; after a disaster staff will be called upon to assess building damage through building inspections. The division has recently participated in the development of the county’s Post-Disaster

11
Ordinance which is viewed as a non-recurring activity. Ongoing planning, preparedness, and mitigation costs related to emergency management include training of new personnel on damage assessment procedures, occasional agency-wide in-house training on damage assessment, and infrequent meetings between the division director and personnel from the Office of Emergency Management. Salaries, fringe benefits, and other indirect costs: 1) Ten to 12 people participate in a one-half day damage assessment training session
if FEMA training officials brought in, but this does not occur on a regular basis. As a working assumption we anticipate this training once every 2 years. Therefore, annual average costs are approximately 3 worker-days/yr.
2) In-house training of 12 persons for approximately one hour per year, resulting in a
cost of 1.5 worker-days/yr. 3) Occasional meetings among staff, estimated at 1.5 worker-days/yr. Total emergency management work effort = 6 worker-days/yr Total Staff = 95 FTE = 24,700 worker-days/yr Proportion = 6/24,700 = 0.00024 Budget 95 FY = $4,866,000 Hurricane multiplier = 0.603 Estimated annual expenditures for hurricanes: 0.603 x 0.00024 x $4,866,000 = $704 Specialized equipment: None. Department of Community Development - Division of Planning Contact: Annette Snapp. Personal interview 6/15/95; written documentation 7/28/95; telephone conversation 8/12/95 and others. Description of activities: The County Division of Planning is responsible for the preparation, update, and revision of Lee Plan, the county's comprehensive plan. Among the mandated plan elements is the Coastal Management Element in which specific goals, objectives, and policies pertaining to emergency management are presented. The basis of the Coastal Management Element is a study of coastal issues and conditions conducted on contract by a consultant in 1987. The division anticipates that this study will be updated at some future, but as yet unspecified, date. Revisions to Lee Plan, and specifically to the emergency management policies of the Coastal Management Element are ongoing.

12
Also, state regulations require a comprehensive review of plan policies at five-year intervals. This process includes review and potential amendment to emergency management policies, and is being done in 1995. In addition, the division participates in the preparation of specialized plans (e.g., the Post-Disaster Strategic Plan) and conducts special studies for other agencies, both county and regional, that may relate to emergency management issues. For example, beginning in 1994 the division began a study for providing evacuation data requested by the Southwest Florida Regional Planning Council, with continuing update responsibilities for these data. Staff of the division suggest that these special studies are commonplace, although the subject and nature of the studies are continually changing. An adequate representation of the continuing costs of emergency management to the division should anticipate these special studies as well as the ongoing work in plan preparation and revision. Salaries, fringe benefits, and other indirect costs: We handled the continuing costs of dealing with emergency management issues differently for this division. Rather than estimating worker hours devoted to emergency management as a proportion of total staff hours, actual dollar figures are used. This is done because a considerable part of the costs to the division are expressed in terms of contract dollars and because the division has already established a dollar figure to reflect the costs of revising plan policies. The total annual costs are computed as follows: 1) Studies relating to the preparation of the Coastal Management Element of the
comprehensive plan. The original contract price for this study was $152,770. We estimate that the original study may need to be updated at 10-year intervals. Moreover, only a part of the study contributes to issues involving hurricane emergency management, as reflected in the proportion of natural hazard emergency management policies (0.33) that constitute this element of the plan. Accordingly, we have annualized the cost of this study over the 10-year time frame and taken only one-third of this annual cost as relating to emergency management. We assume that all of these costs can be attributed to hurricanes, thus, 1.0 x $152, 770 x 0.1 x 0.33 = $5,092.
2) Revision to the Comprehensive Plan. The Planning Division has established the
figure of $1,250 as the approximate administrative cost of dealing with plan amendments. These amendments are ongoing, with approximately 2 per year relating to emergency management. In addition, the state-mandated cycle for comprehensive review and revision of the plan is anticipated to result in revision to approximately 20 policies relating to emergency management. We have annualized this latter revision to 4 per year, plus the 2 per year that otherwise occur. We assume that all of these costs can be attributed to natural disasters, thus, 0.90 x 6 x $1,250 = $6,750.

13
3) Revision to the Post-Disaster Strategic Plan. In 1995 revisions to the Post-Disaster Ordinance adopted by the County Commission necessitated changes to the Post-Disaster Strategic Plan, entailing approximately 70 hours of time valued at $2,110. No specific guidelines for future revision are offered; the ordinance and plan may be revised on an as-needed basis, with perceptions of need highlighted by the frequency and severity of future hurricanes. As an approximation we have estimated revisions equivalent to the current ones once every 3 years. This ordinance is principally concerned with hurricane disasters, thus, 1.0 x $2,110 x 0.33 = $702.
4) Special studies. Special studies are conducted as required. The current, ongoing
effort for the Southwest Florida Regional Planning Council Hurricane Evacuation Study has extended over two calendar years and is estimated at involving 260 hours of staff time at a cost of $5,016. In addition, updates to these data will involve 4 hours of staff time on a continuous basis, valued at $3,808 annually. (All estimates of the value of staff time are computed at the salary rates of the appropriate staff, including indirect costs.) Taking this study as a guide, we have annualized the costs of the study and have included the ongoing costs of maintaining and updating the data. These efforts principally concern hurricane hazards, thus, 1.0 x [($5,016 x 0.5) + $3,808] = $6,316.
5) On-going meetings and training. The planning director attends an annual 2-3 day
training session sponsored by the Division of Public Safety. This is costed at a minimum of $552 and applies to all types of hazards, thus 0.603 x $552 = $333.
Estimated annual expenditures for hurricanes:
$5,092 + $6,750 + $702 + $6,316 + $333 = $19,193 Specialized equipment: None. Department of Community Development - Division of Zoning and Development Services Contact: Bryan Kelner, Director. Contact by memorandum; telephone interview 6/8/95. Description of activities: On a formal on-going basis the division is involved only in the review of applications for rebuilding after a disaster, as members of the Emergency Review Board. This role, however, involves them in a number of continuing emergency management activities. The division participated in the development of the County Post-Disaster Strategic Plan through membership in the Recovery Task Force, and in the drafting of the Post-Disaster Ordinance. These activities, however, are regarded as non-recurring. However, subsequent to the adoption of the ordinance the division will also participate in the development of administrative procedures and will be involved in periodic reviews of all

14
documents associated with the ordinance. The timing and frequency of this involvement is undetermined. Staff also participate in training, but the incidence and number of staff involved is highly variable. Salaries, fringe benefits, and other indirect costs: The numbers below represent reasonable estimates of average annual continuing expenditures associated with planning, preparedness, and mitigation for hurricanes. 1) General meetings with other county officials - 15 hrs/yr =1.875 worker-days/yr. 2) Staff training - 7 workers for 8 hrs = 7 worker-days/yr. Total hurricane emergency management work effort = 8.875 worker-days/yr Total Staff = 43 FTE = 11,180 worker-days/yr Proportion = 8.875/11,180 = 0.00079 Budget FY 95 = $3,088,525 Hurricane multiplier = 1.0 Estimated annual expenditures for hurricanes: 1.0 x 0.00079 x $3,088,525 = $2,440 Specialized equipment: None. Department of Community Development - Division of Environmental Sciences Contact: Rick Joyce, Director. Contact by memorandum. Description of activities: This division has virtually no current and ongoing involvement in emergency management issues other than occasional staff conversations related to post-hurricane environmental issues. Costs are trivial and are not included. Department of Public Works - Transportation Division Contact: William J. Nichols, Deputy Director. Telephone interview, 6/20/95. Description of activities: Participates in county-wide planning and preparedness as well as periodic, internal planning and preparedness activities. Response and recovery activities are primarily debris removal from roads and primary drainage systems including drainage pipes, channels, and weirs. Storm water detention systems are drawn down in anticipation of

15
major storms when they have sufficient advance warning. Response and recovery also involves restoration of traffic signal systems and signage. Salaries, fringe benefits, and other indirect costs: 1) In-house planning and preparedness activities: 12.5 worker-days/yr 2) Participation in annual training and conferences: 46.9 worker-days/yr Total natural hazard emergency management work effort= 59.4 worker-days/yr Total Staff = 199 FTE = 51,740 worker-days/yr Proportion = 59.4/51,740 = 0.00115 Budget FY 95 = $16,600,000 Hurricane multiplier = 0.90 Estimated annual expenditures for hurricanes: 0.90 x 0.00115 x $16,600,000 = $17,181 Specialized equipment: Purchase dates not reported; assumed to be 1994:
6 generators - 20-yr life, $121,143 cost, $6,057/yr batteries - 1-yr life, $500 cost, $500/yr Army MREs - 4-yr life, $10,000 cost, $2,500/yr other road maintenance supplies - 10-yr life, $149,000 cost, $15,000/yr Annualized 1995 costs for emergency management equipment used for coastal
storms (see detailed analysis in Table 2-3) = $14,847 Total agency costs attributable to hurricanes: $17,181 + $14,847 = $32,028 Division of Communications Contact: Ben Holycross, Director. Telephone interviews 7/11/95; 2/1/96; equipment data 3/28/96. Description of activities: The Lee County Division of Communications operates the centralized communication system of the county, servicing the communication needs of all other county agencies (Holycross, 1995). Each county agency pays a user fee for the services it receives. Charges are proportional to the number of radios each agency has in use. The facility is funded by bond sales. Debt service as well as operating expenses (including salaries of the three employees) are paid from the charges made to the other county agencies.

16
These user charges were not explicitly addressed in the annual expenditures reported by other agencies, hence they are properly accounted for here. The Division of Communications performs other functions related to emergency management services:
(1) maintenance and operation of the county 911 system; (2) maintenance and operation of the county data processing network which
includes the data files of the property appraiser, tax collector, etc.; (3) provision of other communications services for other county agencies including
telephone, cellular phones, and pagers, and issuance of cable TV franchises; (4) maintenance of the Disaster Communications Response Unit which includes 4
trailers: (a) disaster communications trailer, (b) crew support trailer, (c) operations/incident command post, and (d) a second disaster communications trailer;
(5) serves as dispatch agent for all emergency facilities including fire centers; and (6) provides communications engineering services, e.g. tying individual county
communications centers with the central dispatch center. Salaries, fringe benefits, and other indirect costs: Holycross was not able to estimate the approximate number of staff hours devoted to support planning, preparedness, and mitigation activities associated with hurricanes. He did estimate that approximately 5 percent of his total operating budget of $5 million could be ascribed to all emergency management activities. This would encompass staff time in day-to-day operations when emergency management is discussed in planning, design, and training activities. However, Holycross was unable to differentiate between those emergency management activities that might be ascribed to natural disasters as opposed to technologic disasters. We resorted to using the mid-point of John Wilson’s estimates of the split between technologic hazards and natural hazards for the administration, operations, and planning functions of the Emergency Management Section of the Division of Public - 67%. This estimate should then be further adjusted for the proportion of natural hazards that are represented by hurricanes. Wilson’s estimate of 90% (see next section) is used for this purpose. Thus the estimated annual operating expenses of the Division of Communications that are attributable to planning, preparedness, and mitigation for hurricanes are as follows: Budget FY 95 = $4,953,912 Proportion ascribed to natural hazards planning, preparedness, and mitigation work =
0.05 x 0.67 = 0.033 Estimated annual expenditures for hurricanes: 0.033 x 0.90 x $4,953,912 = $147,131 Specialized equipment: Holycross (1996) provided an inventory of equipment maintained by the Division of Communications that constitutes the Disaster Communications Response Unit. This

17
consists primarily of four trailers, a 350 kW generator, and numerous radios and related communications equipment. Where specific items could not be identified on the detailed inventory lists, purchase dates were deduced from tag numbers and purchase prices and useful lives were deduced from those of comparable equipment. Annualized 1995 cost for emergency management equipment used for coastal
storms (see detailed analysis in Table 2-3) = $18,815 Total agency costs attributable to hurricanes: $147,131 + $18,815 = $165,946 Division of Public Safety - Emergency Management The Lee County Division of Public Safety includes two sections that perform planning, preparedness, and mitigation functions concerned with hurricanes: (1) the Emergency Management Section and (2) the Emergency Medical Services Section. The expenditures of each are detailed here and in the following section. Contact: John Wilson, Director, Division of Public Safety; Jimmy Geren, Budget Officer. Personal and telephone interviews 2/95, 6/95; memorandum 5/95. Description of activities: Planning, preparedness, and mitigation activities of the Lee County Emergency Management Section of the Division of Public Safety include the following: (1) preparedness planning for natural and technological hazards, (2) public information and education programs, (3) training of their own and other county agency employees, (4) technical assistance to other county agencies in preparing emergency plans, (5) developing emergency response and recovery programs, and (6) implementing the county's hazard mitigation program (Lee County Department of Public Safety, 1992: 18). Salaries, fringe benefits, and other indirect costs: The budget for the Emergency Management Section is divided into four categories: (1) administration, (2) operations, (3) planning, and (4) all hazards. The “all hazards” category includes expenditures under the county’s existing All Hazards Tax. Activities within the section can be divided between those focused on planning, preparedness, and mitigation for natural hazards and those focused on technological hazards. John Wilson (1995) estimated that natural hazards efforts could be further differentiated as follows: 90% floods and hurricanes, 7% thunderstorms and tornados, 2% freezes, and 1% civil disorders. Wilson could not readily differentiate flooding hazards caused by

18
events other than hurricanes, but agreed that this is a relatively minor part of Lee County’s flood hazard. Expenditures listed here are only those that can be reasonably attributed to planning, preparedness, and mitigation for natural hazards. They are multiplied by 0.90 to account for the distinction between hurricane hazards and other natural hazards to which Lee County is exposed. Based on an analysis of staff time during the 1994 fiscal year and the budget allocations for FY 1995, the estimated continuing costs of the Emergency Management Section for planning, preparedness, and mitigation for natural hazards are as follows. 1) Administration:
Total natural hazards planning, preparedness, and mitigation work effort = 273 worker-days/yr
Total annual work: 3 FTE = 780 worker-days/yr Proportion = 273/780 = 0.35000 Budget FY 95 = $661,278 Hurricane multiplier = 0.90 Estimated annual expenditures for hurricanes: 0.90 x 0.35000 x $661,278 =
$208,303 2) Operations:
Total natural hazards planning, preparedness, and mitigation work effort = 421 worker-days/yr
Total annual work: 2 FTE = 520 worker-days/yr Proportion= 421/520 = 0.81000 Budget FY 95 = $107,718 Hurricane multiplier = 0.90 Estimated annual expenditures for hurricanes: 0.90 x 0.81000 x $107,718 = $78,526
3) Planning:
Total natural hazards planning, preparedness, and mitigation work effort = 504.5 worker-days/yr
Total annual work: 2 FTE = 520 worker-days/yr Proportion = 504.5/520 = 0.97000 Budget FY 95 = $114,587 Hurricane multiplier = 0.90 Estimated annual expenditures for hurricanes: 0.90 x 0.97000 x $114,587 =
$100,034

19
4) All Hazards:
Note: We had to make some adjustment here, because unspent funds are carried over from one year to the next. The amount in the budget for FY 1995 is $665,684, versus $777,013 in FY 94 and $273,389 in FY 93. The following estimate is based, therefore, on actual 1994 expenditures for salaries, benefits, travel, printing, office supplies, and equipment under $500, rather than the 1995 budget, i.e. a total of $150,064.
Total natural hazards planning, preparedness, and mitigation work effort = 58.25
worker-days/yr Total annual work: 2 FTE = 520 worker-days/yr Proportion = 58.25/52 = 0.11000 Budget FY 94 = $150,064 Hurricane multiplier = 0.90 Estimated annual expenditures for hurricanes: 0.90 x 0.11 x $150,064 = $14,856 Estimated total annual expenditures for hurricanes:
$208,303 + $78,526 + $100,034 + $14,856 = $401,719 Specialized equipment: Wilson (1995) provided an inventory of equipment maintained by the Division of Public Safety on which items are identified that are used predominantly for natural hazards emergency management by the Emergency Management Section, including planning, preparedness, and mitigation and response and recovery. This listing includes items that cost $500 or more. A detailed analysis is included in Table 2-3.
Annualized 1995 cost for emergency management equipment used for coastal storms = $29,281
Total agency costs attributable to hurricanes: $401,719 + $29,281 = $431,000 Division of Public Safety - Emergency Medical Services Contact: William Van Helden, Deputy Director. Written documentation 12/8/95. Description of activities: The primary role of the Emergency Medical Services (EMS) Division is in the development of protocols and procedures for the transportation and treatment/primary

20
care of county residents with special needs in the event of a disaster. Additional responsibilities involve public education. Salaries, fringe benefits, and other indirect costs: Van Helden provided direct estimates based on time spent by individual personnel. Adjustments were required because Van Helden’s figures included training concerned with hazardous materials. The total hours were reduced accordingly and a proportional reduction (0.78) was made in the cost estimate provided. The lower range of Van Helden’s total cost estimate ($6,500 - $7,000) was used to account for the larger proportion of the total costs represented by his time on the assumption that his hourly wage would be higher than that of his other staff. 1) Administration (Van Helden): 180 hrs/yr 2) Special needs planning (Wheaton): 40 hrs/yr 3) Public education (public information staff): 40 hrs/yr
Estimated annual expenditures for hurricanes: 0.78 x $6,500 = $5,070 Specialized equipment: Disaster response equipment purchased from military surplus. Examples include tents, small generators, and other small items such as coolers. Not differentiated by type of disaster. Estimated initial cost is less than $1,500. Estimated equipment life is 3 to 5 years. Replacement costs likely to vary depending on availability from surplus suppliers. Purchase date not reported; assumed to be 1994.
Annualized 1995 cost for emergency management equipment used for coastal storms (see Table 2-3 for detailed analysis) = $233
Total agency costs attributable to hurricanes: $5,070 + $233 = $5,303 Lee County Public Health Unit Contact: Judith Hartner, Director. Personal interview 6/14/95. Description of activities: The relevant activities of the County Public Health unit include planning and preparedness for providing medical personnel for public and special care shelters

21
during disasters; planning, preparedness, and mitigation for post-storm environmental health response, e.g. water quality testing, vector control, etc.; and planning for assuring survival of the agency's own personnel, equipment, and facilities during a hurricane. Unit Director Judith Hartner participates in monthly meetings of the Lee County Medical Society Disaster Committee during hurricane season. This includes the County Division of Public Safety, shelter agencies, nonprofits, hospitals, etc. New nurses attend disaster medicine training by the Red Cross as needed. The department participates in annual county exercises/drills and conducts its own internal drills. Salaries, fringe benefits, and other indirect costs: Total hurricane emergency management work effort = 60 worker-days/yr Total Staff = 259 FTE = 67,340 worker-days/yr Proportion = 60/67340 = 0.000891 Budget FY 95 = $10,314,735, of which $2,382,424 (23.1%) is derived from county
general revenue. Hurricane multiplier = 1.0 Estimated annual expenditures for hurricanes: 1.0 x 0.00089 x $2,382,424 = $2,123 Specialized equipment: Three items of equipment have been purchased for use in emergency situations. These are a portable generator, and mobile radios, totaling $4755. Useful life is estimated at 10 years for each piece of equipment, derived from comparison to county equipment inventory. Purchase date not reported; assumed to be 1994.
Annualized 1995 cost for emergency management equipment used for coastal storms (see detailed analysis in Table 2-3) = $295
Total agency costs attributable to hurricanes: $2,123 + $295 = $2,418 Human Resources Contact: George Bradley, Director. Telephone interview with Ann Banks, 7/19/95 Description of activities: The agency has responsibility for recruiting, screening, and placing volunteers to work in a variety of post-disaster roles. During an emergency the agency has responsibility for staffing emergency telephones for providing disaster information to the public. On an on-going basis, two staff participate in the single-day state hurricane training exercise, and two staff may participate in a half-day session devoted to planning this training. One

22
staff person is assigned responsibility for recruiting volunteers, and this is incorporated into the more general volunteer recruitment activities of the agency. Estimates are for no more than 2 person-days/yr. Salaries, fringe benefits, and other indirect costs: Total hurricane emergency management work effort = 5 worker-days/yr Total Staff = 13 FTE = 3,380 worker-days/yr Proportion = 5/3,380 = 0.00148 Budget FY 95 = $821,515 Hurricane multiplier = 1.0 Estimated annual expenditures for hurricanes: 1.0 x 0.00148 x $821,515 = $1,215 Specialized equipment: None. Human Services Contact: Karen Hawes, Director. Telephone interview 6/7/95. Description of activities: The Human Services Department participated in three meetings during preparation of Peacetime Emergency Plan. The agency’s main role in an emergency is to work with Red Cross and assist them with such tasks as opening shelters and recruiting volunteers. They have no ongoing role in planning, preparedness, and mitigation and no specialized equipment. Salaries, fringe benefits, and other indirect costs: None. Specialized equipment: None. Information Hotline (Lee Cares) Contact Anita Flaitz. Telephone interview. Description of activities: Lee Cares operates an information hotline. County residents may call the hotline to receive up-to-date information on hurricane and emergency management issues. The agency recruits volunteers to staff telephones and organizes training for volunteers. Salaries, fringe benefits, and other indirect costs: Insignificant.

23
Specialized Equipment: None. Lee County Transit Contact: Jim Fetzer, Director. Telephone interview 7/30/95. Description of activities: Lee County Transit provides busses for evacuation upon request, which are charged to the county at $60/hr. The agency does no internal plan development; it responds to disasters on a case-by-case basis. It does not participate in ongoing plan/ordinance development or review. Staff do participate in state-wide training annually. Salaries, fringe benefits, and other indirect costs: 1 worker-day/yr for state training session. This is an insignificant percentage of the agency’s budget. Specialized equipment: None. Public Information Office Contact: Booch DeMarchi, Officer. Telephone interview, 6/7/95. Description of activities: The Public Information Office is responsible for the dissemination of information regarding county business and issues. Routine activities with respect to emergency management include participation in two emergency management practice sessions per year, and two to three meetings per year on an as-needed basis. DeMarchi estimates total expenditure of his time at 3-4 days, with perhaps an additional day of staff time. Salaries, fringe benefits, and other indirect costs: Total hurricane emergency management work effort = 4.5 worker-days/yr Total Staff = 4 FTE = 1,040 worker-days/yr Proportion = 4.5/1,040 = 0.00433 Budget FY 95 = $218,710 Hurricane multiplier = 1.0 Estimated annual expenditures for hurricanes: 1.0 x 0.00433 x $218,710 = $946
24
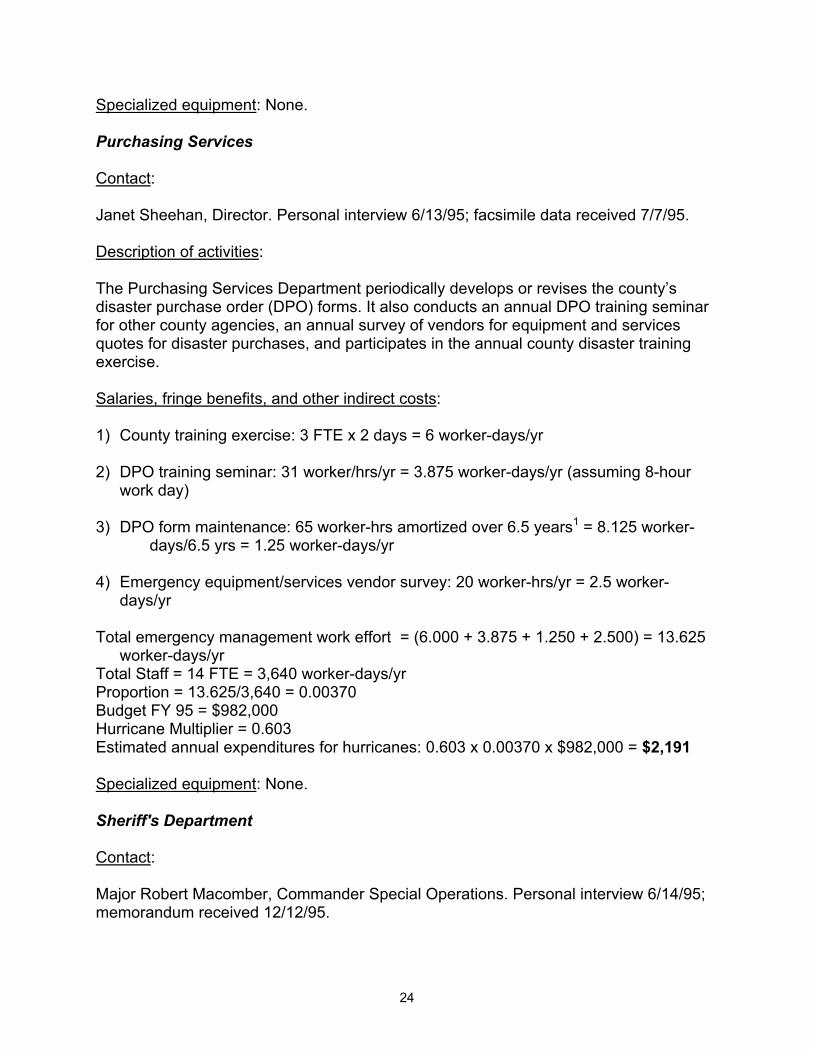
Specialized equipment: None. Purchasing Services Contact: Janet Sheehan, Director. Personal interview 6/13/95; facsimile data received 7/7/95. Description of activities: The Purchasing Services Department periodically develops or revises the county’s disaster purchase order (DPO) forms. It also conducts an annual DPO training seminar for other county agencies, an annual survey of vendors for equipment and services quotes for disaster purchases, and participates in the annual county disaster training exercise. Salaries, fringe benefits, and other indirect costs: 1) County training exercise: 3 FTE x 2 days = 6 worker-days/yr 2) DPO training seminar: 31 worker/hrs/yr = 3.875 worker-days/yr (assuming 8-hour
work day) 3) DPO form maintenance: 65 worker-hrs amortized over 6.5 years1 = 8.125 worker-
days/6.5 yrs = 1.25 worker-days/yr 4) Emergency equipment/services vendor survey: 20 worker-hrs/yr = 2.5 worker-
days/yr Total emergency management work effort = (6.000 + 3.875 + 1.250 + 2.500) = 13.625
worker-days/yr Total Staff = 14 FTE = 3,640 worker-days/yr Proportion = 13.625/3,640 = 0.00370 Budget FY 95 = $982,000 Hurricane Multiplier = 0.603 Estimated annual expenditures for hurricanes: 0.603 x 0.00370 x $982,000 = $2,191 Specialized equipment: None. Sheriff's Department Contact: Major Robert Macomber, Commander Special Operations. Personal interview 6/14/95; memorandum received 12/12/95.

25
Description of activities: The Sheriff’s Department plays a substantial role in planning and preparedness for natural disasters including preparation and maintenance of the department's emergency/disaster response plan (major update was underway in 1995 because of recent move to new facilities and reorganization of the department); development of vendor contracts (Macomber talked as if this were a new initiative); development of supply strategies (ditto); periodic participation in state training exercises; periodic internal mobilization drills; and other staff training. Salaries, fringe benefits, and other indirect costs: Macomber provided direct estimates of worker hours for specific activities to which he recommended we apply an hourly rate of $22.50/hour (includes fringe benefits). The estimates are as follows:
training - 15 worker-hrs/yr hurricane drills - 120 worker-hrs/yr planning with BOC - 25 worker-hrs/yr planning with other agencies - 20 worker-hrs/yr department planning - 50 worker-hrs/yr annual plan revisions - 15 worker-hrs/yr emergency power tests - 70 worker-hrs/yr
Total: 315 worker-hrs/yr @ $22.50/hr = $7,088
Specialized equipment: Macomber provided a list which includes generators, switches, batteries, radios, and telephones.
Annualized 1995 cost for emergency management equipment used for coastal storms (see detailed analysis in Table 2-3) = $24,876
Total agency costs attributable to hurricanes: $7,088 + $24,876 = $31,964 Visitor and Convention Bureau (Recovery Information Hotline) Contact: Elain McLaughlin, Director. Letter; telephone interview, 7/13/95.
26
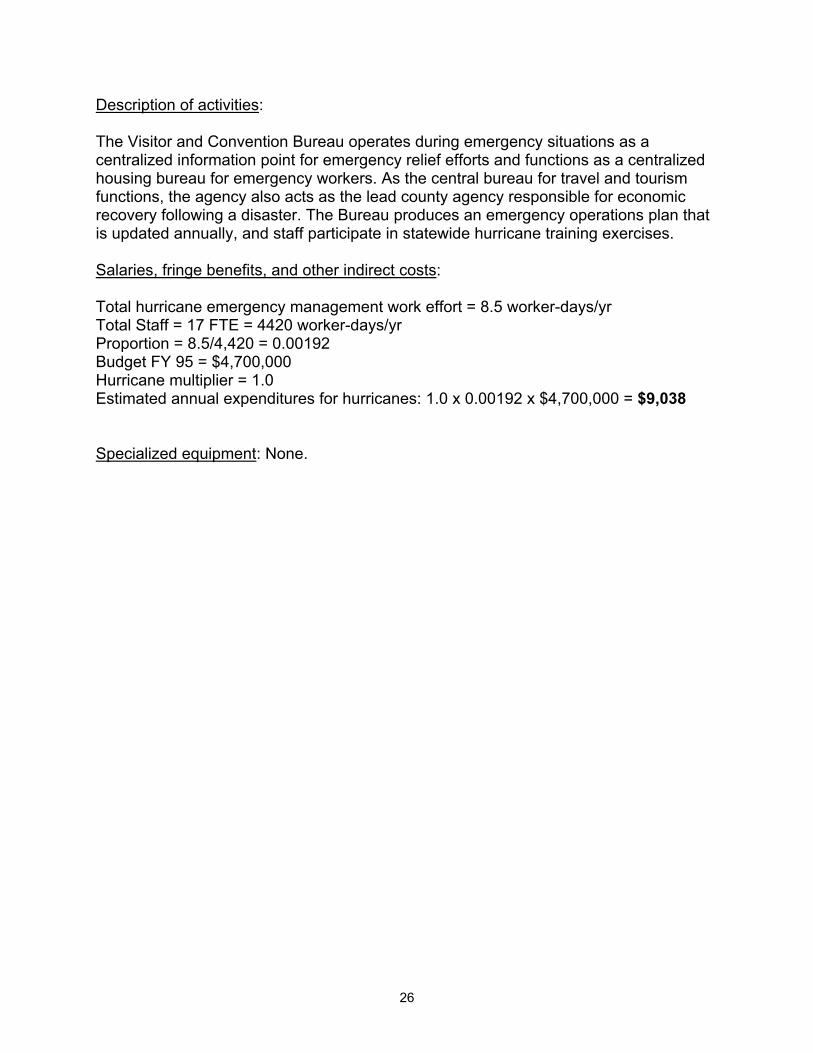
Description of activities: The Visitor and Convention Bureau operates during emergency situations as a centralized information point for emergency relief efforts and functions as a centralized housing bureau for emergency workers. As the central bureau for travel and tourism functions, the agency also acts as the lead county agency responsible for economic recovery following a disaster. The Bureau produces an emergency operations plan that is updated annually, and staff participate in statewide hurricane training exercises. Salaries, fringe benefits, and other indirect costs: Total hurricane emergency management work effort = 8.5 worker-days/yr Total Staff = 17 FTE = 4420 worker-days/yr Proportion = 8.5/4,420 = 0.00192 Budget FY 95 = $4,700,000 Hurricane multiplier = 1.0 Estimated annual expenditures for hurricanes: 1.0 x 0.00192 x $4,700,000 = $9,038 Specialized equipment: None.

27
Table 2-3 Annualized Capital Costs for Emergency Management for Hurricanes Lee County, Florida (1995)
CPI
Useful
Original
Purchase
Total
Annualized
Number
Year
Year
Life
Purchase
Price @
Price
Cost
Hurricane
Hurricane
Department Item
Purchased
Purchased
Purchased
(yrs)
Price @
(1995 $)
(1995 $)
(1995 $)
Weight
Share
Sheriff Generator-1
1
1985
107.6
35
$116,500
$165,006
$165,006
$4,714
0.603
$2,843
Generator-2
1
1982
96.5
38
$116,500
$183,985
$183,985
$4,842
0.603
$2,920
UPS-1
1
1985
107.6
21
$10,000
$14,164
$14,164
$674
0.603
$407
UPS-1
1
1981
90.9
25
$10,000
$16,766
$16,766
$671
0.603
$404
Batteries for UPS
1
1988
118.3
20
$200,000
$257,650
$257,650
$12,883
0.603
$7,768
Fuel Tank
1
1987
113.6
30
$15,000
$20,123
$20,123
$671
0.603
$404
Substa Generators
1
1993
144.5
12
$140,000
$147,654
$147,654
$12,304
0.603
$7,420
Radios
4
1995
152.4
10
$3,000
$3,000
$12,000
$1,200
0.603
$724
Telephones
20
1994
148.2
10
$500
$514
$10,283
$1,028
0.603
$620
Transfer Switch
1
1985
107.6
35
$56,000
$79,316
$79,316
$2,266
0.603
$1,367
SUBTOTAL:
$41,254
$24,876
Communications
Disastr comm unit trailer
1
1993
144.5
10
$89,100
$93,971
$93,971
$9,397
0.603
$5,666
a-truck
1
1994
148.2
4
$2,475
$2,545
$2,545
$636
0.603
$384
b-computer
1
1987
113.6
7
$3,130
$4,199
$4,199
$0
0.603
$0
w-copier
1
1988
118.3
10
$2,063
$2,658
$2,658
$266
0.603
$160
c-computer
1
1989
124
7
$1,305
$1,604
$1,604
$229
0.603
$138
d-radio
1
1990
130.7
10
$2,196
$2,561
$2,561
$256
0.603
$154
e-radio
1
1990
130.7
10
$2,196
$2,561
$2,561
$256
0.603
$154
f-radio
1
1990
130.7
10
$2,196
$2,561
$2,561
$256
0.603
$154
g-radio
1
1990
130.7
10
$2,196
$2,561
$2,561
$256
0.603
$154
h-radio
1
1990
130.7
10
$2,196
$2,561
$2,561
$256
0.603
$154

28
CPI
Useful
Original
Purchase
Total
Annualized
Number
Year
Year
Life
Purchase
Price @
Price
Cost
Hurricane
Hurricane
Department Item
Purchased
Purchased
Purchased
(yrs)
Price @
(1995 $)
(1995 $)
(1995 $)
Weight
Share
Communications k-radio control set
1
1990
130.7
10
$1,847
$2,154
$2,154
$215
0.603
$130
(cont'd) l&m-trailers
2
1993
144.5
4
$1,500
$1,582
$3,164
$791
0.603
$477
n-radio transceiver
1
1993
144.5
10
$11,663
$12,301
$12,301
$1,230
0.603
$742
o-radio
1
1994
148.2
10
$2,986
$3,071
$3,071
$307
0.603
$185
p-radio receiver/trans
1
1994
148.2
10
$3,523
$3,623
$3,623
$362
0.603
$218
~p-radio receiver/tr
1
1994
148.2
10
$3,500
$3,599
$3,599
$360
0.603
$217
q-amp power supply
1
1994
148.2
10
$773
$795
$795
$79
0.603
$48
~z-amp power supply
1
1994
148.2
10
$773
$795
$795
$79
0.603
$48
r-trailer
1
1994
148.2
10
$4,500
$4,628
$4,628
$463
0.603
$279
s-phone-satellite
1
1995
152.4
10
$10,826
$10,826
$10,826
$1,083
0.603
$653
t&u-fax/copiers
2
1995
152.4
10
$700
$700
$1,400
$140
0.603
$84
radio consoles
6
1995
152.4
7
$1,500
$1,500
$9,000
$1,286
0.603
$775
~y(1)-printer
1
1988
118.3
6
$1,699
$2,189
$2,189
$365
0.603
$220
~x-fax
1
1988
118.3
7
$1,850
$2,383
$2,383
$340
0.603
$205
~b(2)-computer
1
1987
113.6
7
$3,130
$4,199
$4,199
$0
0.603
$0
radios
5
1987
113.6
10
$2,000
$2,683
$13,415
$1,342
0.603
$809
radios
2
1990
130.7
10
$2,000
$2,332
$4,664
$466
0.603
$281
radios
3
1989
124
10
$2,000
$2,458
$7,374
$737
0.603
$445
Rolm switch
1
1995
152.4
7
$60,000
$60,000
$60,000
$8,571
0.603
$5,169
~y(2)-printer
1
1988
118.3
6
$1,700
$2,190
$2,190
$365
0.603
$220
~v-file server components
1
1994
148.2
10
$3,300
$3,394
$3,394
$339
0.603
$205
Television
1
1995
152.4
10
$250
$250
$250
$25
0.603
$15
DSS Tuner/Receiver
1
1995
152.4
10
$849
$849
$849
$85
0.603
$51
Generator sets
1
1995
152.4
20
$8,000
$8,000
$8,000
$400
0.603
$241

29
SUBTOTAL:
$33,197
$18,815
Transportation Generators
6
1994
148.2
20
$20,191
$20,763
$124,579
$6,229
0.603
$3,756
Batteries
1
1995
152.4
1
$500
$500
$500
$500
0.603
$302
Army MREs
1
1994
148.2
4
$10,000
$10,283
$10,283
$2,571
0.603
$1,550
Road maint supplies
1
1994
148.2
10
$149,000
$153,223
$153,223
$15,322
0.603
$9,239
SUBTOTAL:
$24,622
$14,847
CPI
Original
Purchase
Total
Annualized
Number
Year
Year
Useful
Purchase
Price @
Price
Cost
Hurricane
Hurricane
Department Item
Purchased
Purchased
Purchased
Life
Price @
1995 $
1995 $
1995 $
Weight
Share
Public Safety Level gauge (80%)
1
1991
136.2
10
$6,445
$7,212
$7,212
$721
0.720
$519
Building (40%)
1
1977
60.6
65
$226,800
$570,368
$570,368
$8,775
0.360
$3,159
Building (40%)
1
1977
60.6
20
$30,000
$75,446
$75,446
$3,772
0.360
$1,358
Building (40%)
1
1977
60.6
30
$36,700
$92,295
$92,295
$3,077
0.360
$1,108
Lines (40%)
1
1988
118.3
10
$2,771
$3,570
$3,570
$357
0.360
$129
Building (40%)
1
1977
60.6
20
$30,000
$75,446
$75,446
$3,772
0.360
$1,358
Mapping Sys (40%)
1
1991
136.2
5
$4,998
$5,592
$5,592
$1,118
0.360
$403
Fence (40%)
1
1977
60.6
20
$6,963
$17,511
$17,511
$876
0.360
$315
Auto (70%)
1
1991
136.2
4
$9,205
$10,300
$10,300
$2,575
0.630
$1,622
Printer (80%)
1
1989
124
7
$1,500
$1,844
$1,844
$263
0.720
$190
Printer (50%)
1
1992
140.3
7
$2,074
$2,253
$2,253
$322
0.450
$145
Printer (10%)
1
1993
144.5
7
$1,835
$1,935
$1,935
$276
0.090
$25
Van (70%)
1
1991
136.2
4
$12,484
$13,969
$13,969
$3,492
0.630
$2,200
ArcNet Hub (50%)
1
1994
148.2
7
$519
$534
$534
$76
0.450
$34
Camcorder (90%)
1
1990
130.7
10
$1,000
$1,166
$1,166
$117
0.810
$94
Camera (40%)
1
1990
130.7
7
$3,528
$4,114
$4,114
$588
0.360
$212
Projector (90%)
1
1991
136.2
10
$4,004
$4,480
$4,480
$448
0.810
$363
Receiver (100%)
1
1988
118.3
10
$5,797
$7,468
$7,468
$747
0.900
$672
Receiver (100%)
1
1987
113.6
10
$1,450
$1,945
$1,945
$195
0.900
$175
Station (90%)
1
1992
140.3
10
$8,495
$9,228
$9,228
$923
0.810
$747

30
CPI
Useful
Original
Purchase
Total
Annualized
Number
Year
Year
Life
Purchase
Price @
Price
Cost
Hurricane
Hurricane
Department Item
Purchased
Purchased
Purchased
(yrs)
Price @
(1995 $)
(1995 $)
(1995 $)
Weight
Share
Public Safety Trailer (10%)
1
1993
144.5
10
$3,251
$3,429
$3,429
$343
0.090
$31
(cont'd) Tower (90%)
1
1980
82.4
20
$21,500
$39,765
$39,765
$1,988
0.810
$1,610
Tank (40%)
1
1977
60.6
20
$6,650
$16,724
$16,724
$836
0.360
$301
Sta Weather (80%)
1
1991
136.2
5
$9,825
$10,994
$10,994
$2,199
0.720
$1,583
Sta Weather (80%)
1
1991
136.2
5
$9,770
$10,932
$10,932
$2,186
0.720
$1,574
Secrty Sys (40%)
1
1986
109.6
10
$4,253
$5,914
$5,914
$591
0.360
$213
Fax (30%)
1
1991
136.2
7
$1,888
$2,113
$2,113
$302
0.270
$81
Generator (40%)
1
1990
130.7
5
$35,000
$40,811
$40,811
$8,162
0.360
$2,938
Generator (70%)
2
1993
144.5
5
$950
$1,002
$2,004
$401
0.630
$252
Computer (90%)
1
1994
148.2
7
$2,215
$2,278
$2,278
$325
0.810
$264
Computer (50%)
1
1994
148.2
7
$2,215
$2,278
$2,278
$325
0.450
$146
Computer (70%)
2
1994
148.2
7
$1,870
$1,923
$3,846
$549
0.630
$346
Computer (10%)
1
1994
148.2
7
$1,870
$1,923
$1,923
$275
0.090
$25
Computer (40%)
1
1994
148.2
7
$1,870
$1,923
$1,923
$275
0.360
$99
Printer (90%)
1
1994
148.2
7
$658
$677
$677
$97
0.810
$78
Truck (90%)
1
1990
130.7
4
$15,361
$17,911
$17,911
$0
0.810
$0
Computer (50%)
1
1994
148.2
7
$2,679
$2,755
$2,755
$394
0.450
$177
Computer (80%)
1
1994
148.2
7
$2,424
$2,493
$2,493
$356
0.720
$256
**Printer (50%?)
1
1994
148.2
7
$542
$557
$557
$80
0.450
$36
**Trailer (50%?)
1
1994
148.2
10
$3,545
$3,645
$3,645
$365
0.450
$164
HandbookPC (80%)
2
1994
148.2
7
$934
$960
$1,921
$274
0.720
$198
Fldlight (20%)
1
1994
148.2
10
$1,935
$1,990
$1,990
$199
0.180
$36
Colorbook (90%)
1
1994
148.2
7
$1,582
$1,627
$1,627
$232
0.810
$188
Colorbook (90%)
1
1994
148.2
7
$1,915
$1,969
$1,969
$281
0.810
$228
Camera (30%)
1
1994
148.2
10
$3,550
$3,651
$3,651
$365
0.270
$99
Test Kit (10%)
1
1994
148.2
10
$650
$668
$668
$67
0.090
$6

31
Colorbook (80%) 1 1994 148.2 10 $1,534 $1,577 $1,577 $158 0.720 $114
Colorbook (80%)
1
1994
148.2
10
$1,856
$1,909
$1,909
$191
0.720
$137
Colorbook (80%)
1
1994
148.2
10
$1,587
$1,632
$1,632
$163
0.720
$118
Colorbook (80%)
1
1994
148.2
10
$1,920
$1,974
$1,974
$197
0.720
$142
Panel Book (90%)
2
1994
148.2
10
$4,547
$4,676
$9,352
$935
0.810
$757
Projector (70%)
1
1994
148.2
10
$648
$666
$666
$67
0.630
$42
Trailer (90%)
1
1994
148.2
10
$21,031
$21,627
$21,627
$2,163
0.810
$1,752
Trailer (40%)
1
1994
148.2
10
$5,546
$5,703
$5,703
$570
0.360
$205
Printer (80%)
1
1995
152.4
7
$742
$742
$742
$106
0.720
$76
Lens (30%)
1
1995
152.4
10
$1,238
$1,238
$1,238
$124
0.270
$33
SUBTOTAL:
$60,951
$29,281
Emergency Misc small equipt
1
1994
148.2
4
$1,500
$1,543
$1,543
$386
0.603
$233
Medical Services
Public Health Misc small equipt
1
1994
148.2
10
$4,755
$4,890
$4,890
$489
0.603
$295
TOTAL ALL AGENCIES:
$2,634,97
2
$160,898
$88,346

32
Total Annual Ongoing Costs
Table 2-4 presents a summary of annual operating costs and annualized capital costs in 1995 for each Lee County agency that plays a significant role in planning, preparedness, and mitigation for hurricanes. These sum to slightly more than $718,400 in total annual ongoing costs.
Event Service Costs
Event services are those associated with responding to an anticipated or actual disaster. These services can be differentiated based on whether or not a given disaster physically affects the jurisdiction. Where a disaster such as a flood, wildfire, or hurricane is anticipated but does not strike the area, the jurisdiction will incur costs for evacuation of at-risk populations and other measures to protect life and property - these are anticipated event costs. The annual expected value of such costs is a function of two parameters: (1) the joint probability of initiating evacuations and associated protective measures for the array of possible disaster events that might threaten a jurisdiction for a given type of natural hazard and (2) the costs of taking such actions. Where a disaster does strike the jurisdiction, the local government will incur response and recovery costs in addition to those associated with pre-disaster protective measures - these we call actual event costs. Here too, the annual expected value of such costs is a function of two parameters: (1) the joint probability of a jurisdiction experiencing disaster forces of different magnitudes and (2) the costs of post-disaster response and recovery actions that would result from those forces. Estimation Methods for Hurricanes in Lee County
Event costs can be represented as the annual expected value of the costs of responding to and recovering from both approaching and landfalling hurricanes where the expected value is computed as the typical response and recovery costs associated with storms of different intensities multiplied by the probability of storms of different intensities occurring. To estimate these potential costs for hurricanes that may threaten or actually strike Lee County, we undertook an analysis of the public costs associated with five hurricanes that resulted in presidential disaster declarations in Florida between 1979 and 1995 (see Table 2-5). Our estimates are derived from seven categories of local government expenditures approved for federal reimbursement under the Stafford Act 406 Public Assistance Program (see Table 2-6).2 These are conservative estimates of local government event costs because they exclude expenditures that are not eligible for federal reimbursement under the Public Assistance Program. Unfortunately no systematically recorded, reliable data exist for local government costs of response and recovery that are not eligible for federal assistance.

33
Table 2-4 Total Ongoing Costs for Emergency Management for Hurricanes Lee County, Florida (1995)
Annual
Operating
Annualized
Total Annual
Agency
Costs
Capital Costs
Costs Budget Services
$2,363
$0
$2,363
Public Recreation Services
$11,590
$0
$11,590 Community Development
Division of Codes & Building
Services
$704
$0
$704 Division of Planning
$19,193
$0
$19,193
Division of Zoning & Develop-
ment Services
$2,440
$0
$2,440 Division of Environmental
Sciences
$0
$0
$0 Dept. of Public Works
Transportation Division
$17,181
$14,847
$32,028 Division of Communications
$147,131
$18,815
$165,946
Division of Public Safety
Emergency Management
$401,719
$29,281
$431,000 Emergency Medical Services
$5,070
$233
$5,303
County Public Health Unit
$2,191
$295
$2,486 Human Resources
$1,215
$0
$1,215
Human Services
$0
$0
$0 Information Hotline (Lee Cares)
$0
$0
$0
Lee County Transit
$0
$0
$0 Public Information Office
$946
$0
$946
Purchasing Services
$2,191
$0
$2,191 Sheriff's Department
$7,088
$24,876
$31,964
Visitor and Convention Bureau
$9,038
$0
$9,038 County Total:
$630,060
$88,347
$718,407

34
Table 2-5 Summary of Hurricanes Affecting the State of Florida 1979-1995 Hurricane
Landfall Date
Hurricane Category
Affected Florida Region
Number of Affected Florida
Jurisdictions
Total Public Costs‡
Frederic
September 1979
4
Northwest†
10
$6.6
Elena
September 1985
2
Northwest & Central†
40
$7.8
Kate
November 1985
1
Northwest
19
$6.5
Andrew
August 1992
4
South
55
$554.9
Erin
August 1995
1
Central & Northwest
76
$21.5
Opal
October 1995
3
Northwest
50
$51.4
†These storms did not have a Florida landfall. ‡Costs in millions of 1996 dollars for Florida jurisdictions; costs for Andrew, Erin, and Opal not final at the time of these calculations.

35
Table 2-6 Reimbursement Categories Stafford Act Public Assistance Program Category
Description
Category A
Debris Removal - all disaster-induced debris on non-federal public roads and waterways, other public property, and private property when managed by local government forces; also can include cost of demolition of public structures made unsafe by the disaster
Category B
Protective Measures - emergency response measures designed to protect life, safety, property, and health including evacuation, police and fire service, sand bags, and barricades
Category C
Roads, Signs, Bridges - damage to non-federal roads, bridges, streets, culverts, and traffic control devices
Category D
Water Control Facilities - costs to repair or replace dikes, dams, drainage channels, irrigation works, and levees
Category E
Buildings and Equipment - costs to repair public buildings and equipment, damaged supplies and inventories, and public transit systems
Category F
Public Utilities - repair or replacement of damaged water supply systems, solid waste management facilities, sewerage systems, storm drainage systems, and telephone, light, electric, and gas supply utilities
Category G
Parks & Recreation, & Other - damage to parks and recreational facilities or any other public facilities that do not reasonably fit under other categories

36
We used two approaches to estimate event costs from the data base of previous hurricanes: one is based on average per capita costs by storm category3 and the other is based on an empirically-derived, multivariate model. We applied both approaches to generate a range of estimates of the annualized event costs for Lee County.
Under the first approach, we estimated the total average per capita amounts each jurisdiction in our data base received for public assistance for each of four of the five hurricane categories defined by the Saffir-Simpson scale (our data base does not include any category 5 storms)4 We then multiplied these average values by the 1996 population for the unincorporated area of Lee County - 241,604 persons - to produce an estimate of the total event costs that would be experienced by Lee County for each hurricane category (see Table 2-7).5
In the second approach we used multiple regression analysis to estimate a predictive model for total event costs based on an array of independent variables that measure meteorological, socio-economic, and physical conditions related to the landfall of hurricanes within a local government jurisdiction. From the analysis we selected a log-log (base 10) model based on population and wind speed that explains 74 percent of the variance in the expenditure data (see Appendix A for details about the derivation of the multivariate model). As with the first approach, we applied this model to Lee County by setting the population value equal to that of the unincorporated area of the county in 1996. The model can be used to estimate the costs associated with any specified wind speed. In Table 2-8 we report cost estimates for Lee County based on the average costs for the range of wind speeds encompassed by each hurricane category.
Separate estimation of annualized anticipated event and actual event costs requires partitioning the costs by public assistance category and accounting for the different annual probabilities of a local government responding to an approaching storm or being hit by actual storms of different intensities. Anticipated event costs can be represented by Category B expenditures that are incurred for protective measures taken when a storm is approaching. These include costs of evacuation and protective measures such as drawing down storm water holding ponds and sandbagging low areas. Actual event costs can be represented by any Category B expenditures for protective measures taken after a storm has hit an area, such as extra police patrols in evacuated areas, as well as the expenditures made under the other six categories described in Table 2-6. While these distinctions hold in theory, we were unable to follow them precisely in practice. Our review of damage survey reports submitted for the five storms in our data base revealed insufficient detail for differentiating the portion of Category B costs that can be attributed to pre-storm protective measures from those attributable to post-storm initiatives. We have, therefore, included all Category B costs as pre-storm anticipated event costs.6
We divided the event cost estimates derived by the two methods between anticipated event costs and actual event costs based on the average proportion of total public assistance costs attributable to Category B expenditures (27 percent) versus the other categories derived from our data base (73 percent) as shown in Table 2-9. In the following sections we explain further how these estimates were done and report our results.

37
Table 2-7 Total Event Costs by Storm Category Based on Per Capita Estimation Method Hurricane Category
Number of
Observations
Minimum
Per Capita
Maximum Per Capita
Mean Per
Capita
Standard Deviation
Lee County
Total
1
61
$0.30
$397.50
$44.40
$66.00 $10,703,241
2
14
$27.80
$296.30
$91.80
$76.50
$22,129,675
3
12
$14.60
$1,029.20
$220.80
$274.60
$53,226,931
4
3
$283.00
$1,138.60
$820.50
$382.10
$197,793,010
†Category 5 storms were not included because there were no observations. Table 2-8 Total Event Costs by Storm Category Based on Population-Wind Model
Hurricane Category
Wind Speed Range (mph)
Total Eligible
Costs
1
74-95
$4,937,163
2
96-110
$12,411,242
3
111-130
$27,794,677
4
131-155
$66,560,686
5
155-200 $207,097,626
NOTE: These values are based on average costs for the range of wind speeds encompassed by each hurricane category.

38
Table 2-9 Proportions of Public Expenditures by Public Assistance Categories
Category
Proportion
A
49%
B
27%
C
3%
D
1%
E
4%
F
5%
G
11%
Anticipated Event Costs
Officials in Lee County were unable to provide estimates of the costs of evacuation and other pre-storm protective measures since no hurricane-stimulated response actions had occurred there within the recent past. Therefore, as described above, we have used cost estimates derived from analysis of Category B expenditures approved for federal reimbursement from the five hurricanes which struck Florida jurisdictions between 1979 and 1995 using two approaches: (1) per capita cost estimation and (2) the population-wind model.
We estimated the probabilities of Lee County initiating pre-storm protective measures as storms of each Saffir-Simpson category approach the county by applying a hypothetical decision rule to historic data on hurricane tracks. We used data from the National Hurricane Center's HURDAT data base to identify all hurricanes passing within 250 miles of Lee County since 1886. For each of these storms, we determined the passage attribute (i.e. exiting, entering, or paralleling), hurricane category, and closest point of approach.7 We used these variables to define a decision rule for whether Lee County would choose to evacuate at-risk areas in the county. We then applied the decision rule to the historic hurricane data to estimate how many hurricanes would result in evacuation and initiation of other protective measures. We derived annual probabilities from these frequencies. Our approach is explained in greater detail in Appendix B.
To estimate annualized anticipated event costs we multiplied the total event
costs for each hurricane category reported in Tables 2-7 and 2-8 by the percentage of total event costs accounted for by Category B protective measures reported in Table 2-9: 27 percent. We then applied the probabilities we derived for initiating protective measures in anticipation of an approaching hurricane to generate an estimated range of

39
the total annual anticipated event costs that would be eligible for federal public assistance under the Stafford Act (see Table 2-10). The actual local costs will be a function of the federal and state cost-sharing formulas that apply to the federal Public Assistance Program. Under current federal and state policy, the local share is 12.5 percent.8 Thus as shown in the final column of Table 2-10, the annualized anticipated event costs for Lee County for the array of possible storms that might approach the county is between $263,000 and $545,000. Actual Event Costs
We estimated the probabilities of Lee County experiencing hurricane force winds by applying methods modified from those developed by the National Hurricane Center (see Appendix C). As we did for anticipated event costs, we estimated the costs of response and recovery from approved local government expenditures under the Stafford Act Public Assistance Program using two approaches. In this case, however, we applied the methods to expenditures under Category A and Categories C through G which represent 73 percent of all event costs (see Table 2-9). For cost estimates generated with the per capita estimation method, we multiplied the total event costs for each hurricane category reported in Table 2-7 by 73 percent and by the annual probability of a storm within that intensity range striking Lee County. For cost estimates generated with the population-wind model we estimated the total event costs for each one mile-per-hour wind speed increment multiplied by 73 percent and the probability of a storm of that wind speed striking Lee County. We then summed the weighted cost estimates across the wind speed ranges of each hurricane category to produce the annualized joint cost by hurricane category. We adjusted these values by the assumed local share of 12.5 percent to produce the estimates of the annual potential costs to Lee County. As shown in Table 2-11, we estimate these annualized actual event costs to range between $231,000 and $423,000. Total Annualized Emergency Management Service Costs
The total annual costs of emergency management services necessitated by the risks posed by development of land exposed to the forces of natural disasters include annual continuing costs plus annualized anticipated event and actual event costs. The total costs for hurricanes in Lee County are reported in Table 2-12; their sum ranges from approximately $1.2 million to $1.7 million. These annual costs serve as the basis for defining the amount of revenue to be raised each year by levying a risk-based annual assessment on owners of developed property within the county. The actual amount of revenue to be raised each year, however, depends on the county's choice about how to provide funds for event costs. Different options and their implications are discussed in detail in Chapter 5.
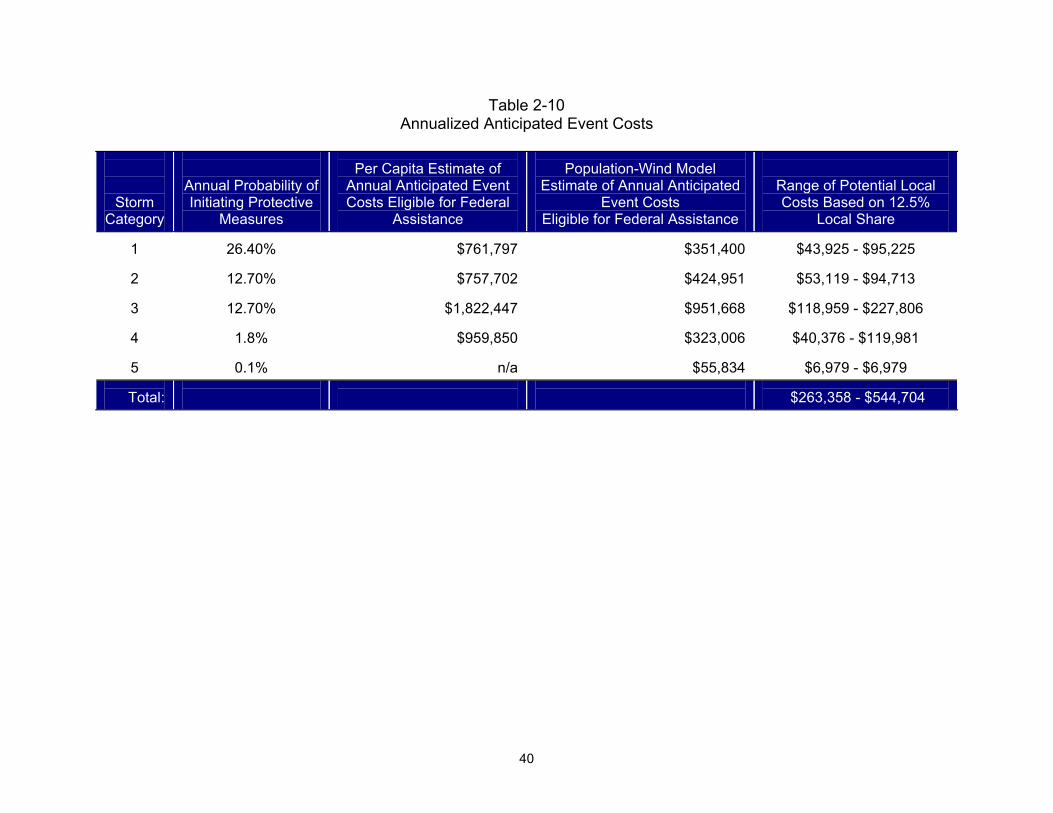
40
Table 2-10 Annualized Anticipated Event Costs
Storm Category
Annual Probability of Initiating Protective
Measures
Per Capita Estimate of
Annual Anticipated Event Costs Eligible for Federal
Assistance
Population-Wind Model
Estimate of Annual Anticipated Event Costs
Eligible for Federal Assistance
Range of Potential Local Costs Based on 12.5%
Local Share
1
26.40%
$761,797
$351,400
$43,925 - $95,225
2
12.70%
$757,702
$424,951
$53,119 - $94,713
3
12.70%
$1,822,447
$951,668
$118,959 - $227,806
4
1.8%
$959,850
$323,006
$40,376 - $119,981
5
0.1%
n/a
$55,834
$6,979 - $6,979
Total:
$263,358 - $544,704

41
Table 2-11 Annualized Actual Event Costs
Storm Category
Annual
Probability of Hurricane
Strike
Per Capita Estimate of Annual Actual Event
Costs Eligible for Federal Assistance
Population-Wind Model
Estimate of Annual Actual Event Costs Eligible for
Federal Assistance
Range of Potential Local Costs Based
on 12.5% Local Share
1
6.15%
$480,785
$221,775
$27,723 - $60,098
2
2.20%
$355,597
$199,434
$24,929 - $44,450
3
1.61%
$625,919
$326,850
$40,856 - $78,240
4
0.86%
$1,242,425
$418,097
$52,262 - $155,303
5
0.45%
n/a
$680,688
$85,086 - $85,086
Total:
$230,856 - $423,177

42
Table 2-12 Total Annualized Emergency Management Costs
Cost Categories
Range of Costs (1995 $) Total Annual Continuing Costs
$718,407 - $718,407
Total Annual Anticipated Event Costs
$263,358 - $544,704
Total Annual Actual Event Costs
$230,856 - $423,177
Total Annualized Hurricane Costs
$1,212,621 - 1,686,288
Endnotes 1. Sheehan estimated that the form will be revised every 6 to 7 years. 2. We obtained the public expenditure data by examining current and historical records held by
the Florida Department of Community Affairs, Division of Emergency Management. The records for recent disasters are held in a computer database while data for older disasters are archived as printed forms. The records consist of summaries of approved public assistance damage claims submitted to the Federal Emergency Management Act under Section 406 of the Stafford Act (Robert T. Stafford Disaster Relief and Emergency Assistance Act of 1988, Public Law 100-707). They contain a detailed description of the applicant (jurisdiction), expenditure amounts by expenditure category, damage location, damaged facility, and a narrative description of the damage. The geographic and temporal limitations of the data set were based on the ability to obtain consistent data for the analysis. Including states other than Florida proved problematic for gathering data on many variables within the time and resource constraints of this project. Including disasters prior to 1979 proved problematic due to the inaccessibility of historic records. The data for public expenditures were partitioned by disaster name and date, affected jurisdictions, and expenditure category. This yielded 250 observations that represent the final approved expenditures for a presidentially declared disaster for an individual jurisdiction, converted to constant 1996 dollars based on the Consumer Price Index. The jurisdictions include cities and unincorporated portions of counties; we excluded expenditure claimants that are not general government units, i.e. school boards, sheriff’s offices, special districts, etc.

43
3. We categorize storms using the standard Saffir-Simpson scale: Maximum Storm Sustained Storm Surge Category Winds (mph) (feet)
1 74-95 4-5 2 96-110 6-8 3 111-130 9-12 4 131-155 13-18 5 > 155 > 18 4. We conducted an outlier analysis to remove all observations more than three standard
deviations from the mean. Only one observation was eliminated based on this threshold: the Santa Rosa Island Authority (SRIA) observation for Hurricane Opal (more than three standard deviations above the mean).
5. Although pre-storm protective measures may be provided to residents in any part of the
county, the per capita analysis used to estimate such costs was based on the population of the unincorporated area of counties in the database. Thus we use the unincorporated county population to apply this estimation method to Lee County.
6. The exclusion of all Category B costs from actual event costs results in some over-estimation
of anticipated event costs and under-estimation of actual event costs. The resulting error amounts to that portion of the Category B costs that are, in fact, post-storm protective measures to which we should have applied the lower probabilities for storm strikes versus the higher probabilities for anticipated-event actions. The different probabilities are shown in tables 2-10 and 2-11.
7. There are other relevant variables used in evacuation decisions, but they are not documented
in the historic record. 8. The Stafford Act authorizes the federal government to reimburse local governments for 75
percent of their expenditures for debris removal, emergency protective measures, and repair of public buildings, facilities, and infrastructure. State governments have typically covered at least half of the non-federal share of these expenditures. Thus, local governments could anticipate having to cover only 12.5 percent of the costs of disaster response and recovery. More recently, beginning with Hurricane Hugo in 1989, the federal government has assumed either 90 or 100 percent of the response and recovery costs eligible for reimbursement under the Public Assistance Program. In Florida, the state covered 100 percent of the non-federal share in recent disasters, thereby relieving local communities of any fiscal responsibilities for these storm costs. However, the State Legislature retrenched on this issue in 1997 enacting a statute that reasserts the former state policy of paying only 50 percent of the non-federal share of eligible Public Assistance Program costs (S.B. 2400, 29th Florida Legislature). Federal policy makers are also considering various alternative formulae governing the Public

44
Assistance Program. For purposes of this analysis we have assumed that the federal statutory rate of 75 percent applies and that the state will pay half the non-federal share leaving a local share of 12.5 percent.

45
CHAPTER 3 RISK-BASED ASSESSMENT FOR EMERGENCY MANAGEMENT SERVICES
Introduction
As discussed in Chapter 1, the tax benefit equity principle that underlies this initiative requires that the costs of local emergency management services necessitated by development of land exposed to natural hazards be allocated among property owners in proportion to the demand they create for such services. Relative risk can be used as the basis for allocating these costs where service consumption can be linked to the vulnerability of structural improvements on private property and the vulnerability of public facilities and infrastructure that are provided to serve that property. We apply this concept by developing a series of risk indices for developed property parcels that can be applied to different components of the local emergency management services described in Chapter 2. In the next sections we describe our generic approach to defining the relative risk indices and then provide a detailed account of how we applied this approach to hurricanes using data available for Lee County, Florida. Risk Indices for Allocating
Local Emergency Management Service Costs
The emergency management service demands that result from development of an individual parcel of land are a function of its location, and the resulting exposure of that parcel to the forces of natural hazards; the characteristics of the structure on the parcel, and the resulting vulnerability of that structure to damage from natural hazards forces; and the exposure and vulnerability of public facilities necessary to serve that developed property. Here we discuss the formulation of relative risk indices, based on exposure and vulnerability, for the two main categories of emergency management services: (1) response and recovery event services associated with the threat and actual occurrence of a disaster event and (2) ongoing services for disaster planning, preparedness, and mitigation. Event Service Risk Indices
We have split event services into three categories for the purpose of allocating service costs among developed property parcels: (1) anticipated event services, for which we estimate an anticipatory protective measures risk index, (2) actual event services associated with debris removal, for which we estimate a damage risk index, and (3) actual event services associated with repair of damaged public facilities and infrastructure, for which we estimate a public facility risk index.
Anticipatory Protective Measures Risk Index. For some natural hazards such
as earthquakes, landslides, and tornadoes, there are few if any emergency protective measures that can be taken because there is little or no warning prior to the onset of the disaster event. For these disasters, anticipated event services would not be included in

46
assessment calculations. For disasters such as floods, hurricanes, and wildfires, local governments can initiate protective measures in anticipation of a threatened event. These will be based primarily on hazard exposure, although they also may be based on structure vulnerability. For example, for floods and hurricanes, local officials evacuate occupants of residential, commercial, and other structures when a storm threatens, based primarily on the flood zone within which they are located. However, mobile homes are often evacuated for all hurricane categories, regardless of location, because of their high vulnerability to wind damage.
We can, therefore, define an anticipatory protective measures risk index (APIi) for a developed property parcel as a function of the cumulative probability that anticipatory protective measures will be taken to protect the structure on that parcel and its occupants as a disaster event approaches (PAPi). As indicated in Chapter 2, we have simplified this estimation problem to one of predicting the likelihood of evacuating the residents or employees in a particular structure on a particular property parcel. We assume that the probability of initiating other emergency protective measures for a given occupied parcel are similar to those for evacuating it. This risk index is then applied to the annualized estimate of the costs of providing emergency protective measures which we have linked to the Category B reimbursement category under the federal Stafford Act Public Assistance Program (see Chapter 2).
The anticipatory protective measures risk index value for any given developed property parcel can be defined as the ratio of its anticipatory protective measure probability to the sum of the anticipatory protective measure probabilities for all developed parcels within the jurisdiction:
APIi = PAPi ⁄ ∑ (PAPi) Eq 3-1
Damage Risk Index. Debris removal (Category A) is often the largest category of public expenditures for recovery from natural disasters. Debris can be generated from damaged private structures, damaged public facilities and infrastructure, and damaged trees and other vegetation on both public and private property (United States Environmental Protection Agency, 1995). The relative contributions of these different sources will vary with the nature of the disaster as well as the specific characteristics of the built environment in the affected community. Several computer-based programs are available for estimating the total amount of debris that will be generated from different types of disasters,1 but these do not provide explicit information on the different sources of the debris.
We have simplified these complexities by estimating debris removal benefits solely on the basis of the annualized risk of damage to privately-owned structures on developed property parcels within the jurisdiction. As detailed below, there is evidence that the majority of public debris costs due to hurricanes are associated with damage to privately-owned structures. This assumption may be less appropriate for other types of disasters.
The damage risk for a developed property parcel is determined by its location and resulting exposure to the hazard, the type of structure and its design, and the structure’s size and contents. Size and contents of a private structure can be approximated by the structure’s assessed value. Damage probabilities and magnitudes

47
must be estimated for each of the destructive forces associated with a hazard. Thus for inland and river flooding, the principal damage will be from inundation. For wildfires the damage will be from fire. For earthquakes damage may result from structural collapse, landslides, and fires. For hurricanes there are three different forces: (1) still-water flooding from storm surge, (2) the force of breaking waves, and (3) wind.
To construct a damage risk index, one must apply damage algorithms that estimate the percent damage to the structure that will result from different magnitudes of the hazard forces. Damage functions are empirically derived algorithms, such as those from insurance claims, that relate percent structural damage to specific magnitudes of a natural hazard force for structures with different characteristics. For a discussion of public domain damage functions, see Deyle et al. (1998).
The annual expected damage (EDif) to structure i on a specific property parcel from a single natural hazard force f across all possible magnitudes m of that force can be defined as follows:
EDif = ∑PEfm x PDfmi x AVi Eq 3-2
where PEfm = annual probability of exposure to hazard force f of magnitude m PDfmi = percent damage to structure i from hazard force f at magnitude m AVi = assessed value of structure i
The total annual expected damage (TEDi) to structure i from all forces associated
with a specific type of natural hazard is the sum of annual expected damages for each of the forces associated with the hazard:
TEDi = ∑EDif Eq 3-3
The damage risk index (DRIi) for any given developed property parcel can be defined as the ratio of its total annualized expected structural damage divided by the sum of the total annualized expected damages for all structures within the jurisdiction:
DRIi = TEDi ⁄ ∑ (TEDi) Eq 3-4
Public Facility Risk Index. This risk index is intended to reflect the potential for damage to public facilities and infrastructure that serve a given developed property parcel. It is applied to the costs associated with categories C through G of the Stafford Act Public Assistance Program (see Table 2-6). These include expenses for repair and restoration of damaged roads, utilities, parks, public buildings, and other infrastructure. Some of these facilities, such as local roads and water and sewer lines, are located in hazardous areas to serve the properties in these areas, so damage to them should be charged to local property owners. In contrast, other public facilities, such as central wastewater treatment facilities, municipal buildings, and major transportation arterials, serve properties spread over larger areas. The costs of damage to these facilities should be shared more generally.
These distinctions, while intuitively attractive, are difficult to operationalize. Accordingly, we have allocated the costs of damage to public facilities to all developed

48
parcels in a jurisdiction independent of the exposure or vulnerability of individual property parcels or specific public facilities. We use the product of the square footage and assessed value of the taxable structure on a property as an indirect measure of public facility use (PFUi). The public facility risk index (PFIi) is, therefore, the proportional share of services a given developed property parcel is assumed to consume from all public facilities and infrastructure that may be at risk within the community:
PFIi = PFUi ⁄ ∑PFUi Eq 3-5 Ongoing Services Risk Index
Ongoing services encompass the jurisdiction's activities concerned with planning, preparedness, and mitigation. In many jurisdictions, these services are allocated to a large degree on the basis of the exposure and vulnerability of the built environment. Thus, local officials direct evacuation planning principally toward those areas and properties most likely to be evacuated in anticipation of a disaster event, and they target public education toward owners of the most vulnerable structures in the areas most exposed to natural hazard forces. In addition, local officials initiate mitigation to protect public facilities and infrastructure and private properties that are situated in the most exposed areas. Thus, the owner of a developed property parcel can be assessed for the costs of ongoing emergency management services based on the exposure and vulnerability of his or her structure.
Following this logic a composite risk index (CRIi) for each parcel i can be defined that is a function of the other three risk indices:
CRIi = (APIi + DRIi + PFIi) ⁄ 3.0 Eq 3-6 Risk Indices for Hurricanes and Their Application to Lee County, Florida
A risk-based assessment system will be feasible only where it is possible to define the relationships that characterize the risk attributes of individual developed property parcels and to collect the necessary data to measure the variables that define those risk attributes. We undertook this project in part to demonstrate the feasibility of such an approach. In this section we describe how we have applied the general approach described above to the particular hazards represented by hurricanes and how we measured the parameters with data available for Lee County, Florida. Because a number of parcels include more than one taxable structure, some of which have different vulnerability attributes, for example a commercial strip mall, we calculated the risk index, and the associated assessment, separately for each structure rather than for parcels as a whole.
For each of the risk indices we describe the variables used to calculate the index, the sources from which we obtained data for assigning values to each variable, and the

49
computations used to calculate the index. In Appendix D we describe a Microsoft ACCESS program that was designed to calculate the risk indices and apply them against the annual costs generated in Chapter 2 to determine the annual assessment each owner of developed property would pay. Here we identify variable names used in the ACCESS program as well as the input tables (T) that contain the data used in these calculations, the queries (Q) that perform the calculations, and the output tables (T) that contain the results. We follow a similar procedure in Chapter 4 in which we describe how we calculated the annual assessment levies for each taxable structure.
Anticipatory Protective Measures Risk Index
We based the anticipatory protective measures risk index for hurricanes on the annualized probability of an occupied structure being evacuated when the jurisdiction is threatened by an approaching hurricane. In Lee County, this can be defined as a function of whether or not the structure is a mobile home and where the property parcel is located. For non-mobile homes, evacuation orders are based on the evacuation zone within which the parcel is located. These are keyed to modified storm surge inundation zones for each hurricane category developed for the county by the Southwest Florida Regional Planning Council (1991) using the SLOSH (Sea, Lake, and Overland Surge) model developed by Jelesnianski et al. (1984). Mobile homes are evacuated for all hurricane categories regardless of location. Figure 3-1 delineates the SLOSH storm surge inundation zones for Lee County. Figure 3-2 shows hurricane evacuation zones. Input Variables
1. Type of improved structure: mobile home or non-mobile home [STRUCTURE TYPE: ParcelData2(T)]
2. Location by evacuation zone based on the Saffir-Simpson hurricane intensity scale [EVAC ZONE: ParcelData2(T)]
3. Probability of evacuation by zone [PE: EvacZone(T)] Data Sources
Data on structure type and evacuation zone were obtained from the Lee County Property Appraiser’s data base. Evacuation probabilities for each zone were estimated using the method described in Appendix B.

50
Computations
1. For structure i, other than a mobile home, the annual probability of anticipatory protective measures being initiated (PAPi) is the cumulative probability of evacuation (PEzi) for the hurricane category (1-5 on the Saffir-Simpson scale) that corresponds to the evacuation zone Zi in which the parcel is located, plus the sum of the cumulative evacuation probabilities (PEz) for all higher storm categories for the jurisdiction (z>Zi) [APMRI(Q)]:
PAPi = PEzi + ∑PEz for z>Zi Eq 3-7

51
2. For a mobile home, PAPi is the cumulative probability of evacuation for all storm categories for the jurisdiction (∑PEz)
3. Sum the anticipatory protective measure probabilities for all structures in the
jurisdiction [APMRI(Q)]: ∑(PAPi)
4. The anticipatory protective measures risk index (APIi) is the ratio of the probability for structure i divided by the sum of the probabilities for all structures in the county (see equation 3-1) [APMRI2(Q)]:
APIi = PAPi / ∑(PAPi) Eq 3-8
Damage Risk Index
As indicated above, we based the damage risk index on the annualized damage risk for a developed property parcel relying in part on a formula developed by the United States Army Corps of Engineers, based on data from Hurricanes Frederick, Hugo, and Andrew (B. Hanna, personal communication, October 19, 1998), that attributes 67 to 91% of all hurricane debris to damaged residential and commercial structures and 9 to 33% to

52
damaged non-private structures and vegetation. We estimated annualized potential damage from three storm forces (still-water flooding from storm surge, the force of breaking waves, and wind), and summed these for each structure. Still-Water Flood and Wave Damage
We estimated probable damage from surge flooding and waves for individual structures for four categories of hurricanes as defined by the Saffir-Simpson scale (Categories 1, 2, 3, and 4/5). Consistent with the damage functions developed by the National Flood Insurance Administration (NFIA), we assumed that structures subject to a three-foot or higher breaking wave experience combined damage from still-water, storm surge flooding and wave impact, while structures subject to waves less than three feet experience only damage from still-water flooding. We used damage functions from the NFIA (1995) and the United States Army Corps of Engineers (1990). Based primarily on flood insurance claims data, these assign structural damage percentages based on the height of water or a breaking wave above the first floor of a structure. Separate damage functions have been designed for broad classes of structures, e.g. one-story structures, two-story structures, etc. Input Variables
1. Type of structure: single-family residential, multi-family residential, mobile home, commercial, industrial, institutional [STRUCTURE TYPE: ParcelData2(T)]
2. Number of stories/split-level [NUMBER FLOORS: ParcelData2(T)] 3. Year structure built (<1984; >= 1984) [YEAR BUILT: ParcelData2(T)] 4. Site elevation for structure i, in feet NGVD (National Geodetic Vertical Datum)
above sea level (EVi) [EV: ParcelData2(T)] 5. Assessed value of structure i, excluding land (VALi) [ASSESSED:
ParcelData2(T)] 6. Base flood elevation for structure i, if located within a 100-year flood zone, in feet
NGVD (BFEi) [BFE: ParcelData2(T)] 7. Surge level by hurricane category for the nearest surge height benchmark (SHB),
in feet NGVD (SLh) [CAT 1 SURGE LEVEL: SurgeBench1(T); CAT 2 SURGE LEVEL: SurgeBench2(T); CAT 3 SURGE LEVEL: SurgeBench3(T); CAT 45 SURGE LEVEL: SurgeBench45(T)]
8. Annual probabilities of a storm strike by hurricane category [STRIKE ANNUAL PROB: StormCat(T)]
Data Sources
Data for variables 1-6 were obtained from the Lee County Property Appraiser’s data base. Surge level elevations (SL) represent the height of coastal water surfaces above sea level that result from hurricane pressures. Data on surge height benchmarks (SHB) were obtained from the SLOSH atlas prepared by the Southwest Florida Regional Planning Council (1991). The benchmarks were digitized and added to the Property Appraiser’s GIS data base. The GIS was then used to identify the nearest

53
surge height benchmark to each developed property parcel and assign the associated surge elevations for each hurricane category to the parcel. Annual hurricane strike probabilities were calculated as described in Appendix C. Computations
Separate damage computations are performed for each developed property parcel i for each hurricane category h as follows:
1. Determine the elevation of the first floor of the structure (SEVi) [EV: ParcelData2(T)]
We estimated first-floor elevations using two methods depending on the age and location of the structure. Structures located within 100-year flood zones and built since the county's flood plain ordinance was adopted in 1984 were presumed to have been built in conformance with the local code. All other structures were presumed to have first-floor elevations 18 inches above the site elevation in conformance with the local practice of building structures 18 inches above road grade.
- If built in 1984 or later and located in a flood hazard area (A-zone or V-zone):
SEVi = BFEi Eq 3-9a
- If built in 1984 or later and not located in a flood hazard area OR if built prior to
1984:
SEVi = 1.5 ft. + EVi Eq 3-9b
2. Calculate the water depth at the structure (WDih) in feet for hurricane category h by subtracting the site elevation (EVi) from the surge level (SLh) in feet NGVD for the given hurricane category [QSurgeWave1(Q); QSurgeWave2(Q); QSurgeWave3(Q); QSurgeWave45(Q)]:
WDih = SLh - EVi Eq 3-10
3. Calculate the height of the wave above surge level (WHih) in feet
[QSurgeWave1(Q); QSurgeWave2(Q); QSurgeWave3(Q); QSurgeWave45(Q)]:2
WHih = 0.656 x WDih Eq 3-11

54
4. Calculate the total wave and water level at the structure (WWLih) in feet NGVD by adding the wave height above surge level (WHih) to the surge level (SLh) [QSurgeWave1(Q); QSurgeWave2(Q); QSurgeWave3(Q); QSurgeWave45(Q)]:
WWLih = WHih + SLh Eq 3-12
5.Calculate the wave plus water depth above the first floor of the structure (WWDih) in feet by sub
WWDih = WWLih - SEVi Eq 3-13
6. Round the WWDih to the nearest whole number [QSurgeWave1(Q); QSurgeWave2(Q); QSurgeWave3(Q); QSurgeWave45(Q)]
7. Look up the percent damage in the appropriate damage table based on
maximum wave height [SubQSurgeWave1(Q); SubQSurgeWave2(Q); SubQSurgeWave3(Q); SubQSurgeWave45(Q)]
a. Determine which damage function to apply based on maximum wave height:3
- Calculate the maximum wave height (MWHih) based on water depth (WDih)
as follows:4
MWHih = WDih/1.28 Eq 3-14
- If MWHih ≥ 3.00, apply the wave damage function - If MWHih < 3.00, apply the still-water surge damage function
b. If WWDih < 0, assign a damage coefficient of 0 (no surge or wave damage)5
c. If WWDih ≥ 0, apply the value from the damage table for the appropriate
structure type to yield percent damage from wave and surge (PDWSih)
8. For each hurricane category h multiply the percent damage from wave and surge (PDWSih) by the assessed value of the structure (VALi) on the parcel to derive the dollar value of damage to the structure from waves and/or surge for that hurricane category (WSDih) [SubQSurgeWave1(Q); SubQSurgeWave2(Q); SubQSurgeWave3(Q); SubQSurgeWave45(Q)]
WSDih = PDWSih x VALi Eq 3-15
Wind Damage
We estimated probable wind damages to individual structures for maximum gusts associated with the mid-range maximum sustained surface wind (MSSW) speeds (10-minute, 10-meter) for the four hurricane categories from public-domain damage tables employed in the most-recently completed hurricane loss studies in Florida (United

55
States Army Corps of Engineers, 1990). These differentiate structures by broad construction types, e.g. residential, mobile home, commercial, industrial.
Input Variables
1. Type of structure: residential, mobile home, commercial, industrial [STRUCTURE TYPE: ParcelData2(T)]
2. Assessed value of the structure i (VALi) [ASSESSED: ParcelData2(T)] 3. Linear distance from the structure i to the nearest coastal point (Si) in nautical
miles (n. mi.) [COAST DISTANCE STAT: ParcelData2(T)] Data Sources
Data for variables 1 and 2 were obtained from the Lee County Property Appraiser’s data base. Linear distance from the open coast (Si) was calculated using the Property Appraiser’s GIS based on the reference line shown in Figure 3-3. The line represents the point at which frictional forces are assumed to have an impact on the maximum sustained surface winds of a hurricane as it moves onshore.

56
Computations
Separate damage computations are performed for each structure i for each hurricane category h as follows:
1. Look up the mid-range maximum sustained surface wind speed (10 meter, 10-minute) for the hurricane category (MSSWh) based on the Saffir-Simpson scale
2. Look up the linear distance in statute miles and convert to nautical miles (n. mi.)
from structure i to the nearest coastal point (Si) [QParcelData(Q)]
3. Calculate the maximum sustained surface wind speed at the site of structure i for hurricane category h (WSih) taking into account the frictional effects of the land surface [QWind1(Q), QWind2(Q), QWind3(Q), QWind45(Q)]:6
- Where Si = 0 (on barrier islands or right at the coast):
WSih = MSSWh Eq 3-16
- Where 0 < Si < 10 n. mi. calculate WSih by applying the following algorithm for
surface friction impacts:
WSih = (0.78 + ((1-(0.195 x S)i + (0.0095 x Si 2)) x (0.89-0.78))) x MSSWhEq 3-17
- Where Si ≥ 10 n. mi. calculate WSih by applying the following algorithm for surface friction impacts:
WSih = (0.78 + (0.89-0.78)) x MSSWh Eq 3-18
4. Convert the maximum sustained surface wind speed at the site (WSih) to the
maximum gust wind speed at the site (WGSih) [QWind1(Q), QWind2(Q), QWind3(Q), QWind45(Q)]:7
WGSih = 1.3 x 1.11 x WSih Eq 3-19
5. Round WGSih to the nearest 5 mph [InterQWind1(Q), InterQWind2(Q),
InterQWind3(Q), InterQWind45(Q)]
6. Look up the percent damage (PDih) in the wind damage table [WindDam(T)] for the appropriate structure type: mobile home, residential, commercial, industrial [SubQWind1(Q), SubQWind2(Q), SubQWind3(Q), SubQWind45(Q)]8

57
7. For each hurricane category h multiply the percent damage from wind (PDWNih) by the assessed value of the structure (VALi) to derive the dollar value of damage to the structure from wind for that hurricane category (WNDih) [SubQWind1(Q), SubQWind2(Q), SubQWind3(Q), SubQWind45(Q)]:
WNDih = PDWNih x VALi Eq 3-20
Combined Damage Risk and Damage Risk Index
The total damage to a structure is a function of the combined effects of wind, waves, and still-water flooding. We follow the practice used in hurricane loss studies by the U.S. Army Corps of Engineers and simply add the total damages from the three storm forces making certain, however, that the total does not exceed the assessed value of the structure. Input Variables
1. Dollar value of damage to structure i from waves and/or surge for each hurricane category h (WSDih) [WAVEWATER DAMAGE: SubQuerySW1Table; SubQuerySW2Table; SubQuerySW3Table; SubQuerySW45Table]
2. Dollar value of damage to structure i from wind for each hurricane category h (WNDih) [WIND DAMAGE: SubQWind1Table; SubQWind2Table; SubQWind3Table; SubQWind45Table]
3. Assessed value of structure i (VALi) [ASSESSED: ParcelData2(T)] 4. Cumulative probability of hurricane force winds affecting the county for each
hurricane category h (HPLh) [STRIKE ANNUAL PROB: StormCat(T)] Data Sources
Values for variables 1 and 2 are obtained from equations 3-15 and 3-20 respectively. Data for variable 3 were obtained from the Lee County Property Appraiser’s data base. Hurricane wind strike probabilities were calculated as described in Appendix C. Computations
1. For each hurricane category h sum the dollar damages to structure i from surge/wave (WSDih) and wind (WNDih) to yield the total dollar damage (ATDih) for the hurricane category, not to exceed the assessed value of the structure [QAnnualTotal1(Q); QAnnualTotal2(Q); QAnnualTotal3(Q); QAnnualTotal45(Q)]:
ATDih = WSDih + WNDih Eq 3-21a
If ATDih ≥ VALi then ATDih = VALi Eq 3-21b

58
2. Multiply the total dollar damage (ATDih) by the cumulative probability of hurricane force winds affecting the county for the hurricane category h (HPLh) to derive the annual expected damage to structure i for the hurricane category (EDih) [QAnnualTotal1(Q); QAnnualTotal2(Q); QAnnualTotal3(Q); QAnnualTotal45(Q)]:
EDih = HPLih x ATDih Eq 3-22
3. Sum the annual expected damages across hurricane categories h to derive the
total annual expected damage for the structure (TEDi) [DRI(Q)]:
TEDi = ∑EDih for h = 1 - 4/5 Eq 3-23
4. Sum the damage risk index values for all structures in the jurisdiction [DRI(Q)]: ∑(TEDi)
5. The damage risk index (DRIi) for structure i is the ratio of the total annualized
expected damage for its structure (TEDi) divided by the sum of the total annualized expected damages for all structures within the jurisdiction (see equation 3-4) [DRI2(Q)]:
DRIi = TEDi ⁄ ∑(TEDi) Eq 3-24
Public Facility Risk Index
The public facility risk index is calculated as described above (see discussion for equation 3-5). Input Variables
1. Size of structure i in square feet (SIZEi) [SQFT: ParcelData2(T)] 2. Assessed value of structure i (VALi) [ASSESSED: ParcelData2(T)]
Data Sources
Data for both variables were obtained from the Lee County Property Appraiser’s data base. Computations
1. Compute public facility use (PFUi) as the product of square footage (SIZEi) and assessed value (VALi) and divide by 1,000,000 to reduce the size of the numbers used to calculate the index [PFRI(Q)]:
PFUi = SIZEi x VALi /1,000,000 Eq 3-25
2. Sum public facility use values across all structures [PFRI(Q)]: ∑PFUi

59
3. Compute the public facility risk index (PFIi ) as the proportion of total public
facility use for each structure (see equation 3-5) [PFRI2(Q)]:
PFIi = PFUi / ∑PFUi Eq 3-26 Ongoing Services Risk Index
The ongoing services risk index is calculated as described above as a function of the other three risk indices (see discussion for equation 3-6). Input Variables
1. Anticipatory protective measures risk index for structure i (APIi) [QAPMRI2(T)] 2. Damage risk index for structure i (DRIi) [QDRI2(T)] 3. Public facility risk index for structure i (PFIi) [QPFRI2(T)]
Data Sources
Values for variables 1-3 are obtained from equations 3-8, 3-24, and 3-26 respectively. Computations
1. Compute a composite risk index for each structure i by summing the three risk index values for the structure and dividing by 3.0 (see equation 3-6) [CCI(Q)]:
CRIi = (APIi + DRIi + PFIi) / 3.0 Eq 3-27
Applying the Indices
The indices described here are applied in Chapter 4 to calculate annual assessments for properties in Lee County. As discussed in that chapter, the manner in which the indices are used depends on an important policy decision, that is, how rapidly to capitalize a contingency fund for paying for the local share of event costs.

60
Endnotes
1. See for example the HAZUS software developed for the Federal Emergency Management
Agency by the National Institutes of Building Sciences (Federal Emergency Management Agency, 1999), which estimates debris from building damage resulting from earthquakes, and the TAOS software developed by Watson Technologies for the State of Florida (Florida Department of Community Affairs (1999), which estimates debris from hurricanes.
2. We used a factor of 0.656 to estimate the height of the wave above still-water surge following
Balsillie (1983). The Army Corps of Engineers uses a factor equivalent to 0.55 in the Tri-State Property Loss Study (United States Army Corps of Engineers, 1990: B-8). They offer no justification for selection of that particular value.
3. This approach is consistent with that followed by the Army Corps of Engineers in the Tri-State Hurricane Property Loss Study. The Corps applies the wave damage function in all areas where still-water surge depth is at least 4 feet (they round all values to the nearest whole number) which equates to those areas with sufficient water depth to generate a maximum wave height of at least 3 feet (United States Army Corps of Engineers, 1988: 28; 1990: B-7; B-8).
4. This equation is derived from Balsillie (1983).
5. NFIA damage curves assign damage values for flood or wave depths of -0.5 (rounded to 0) because compensable damage does occur before water reaches the top of the finished flooring (National Flood Insurance Administration, n.d.).
6. The method followed here is based on that described by Schwerdt, Ho, and Watkins (1979) which accounts for the frictional effects of the land surface as a tropical cyclone moves on shore. They observed that onshore winds showed a sharp decrease within 1 nautical mile of the shore and that the fall in wind speed reached an equilibrium at about 10 nautical miles.
7. Wind damage tables are typically expressed as a function of peak gusts. We followed the methods used in most of the Florida regional hurricane loss studies (see for example Tampa Bay Regional Planning Council, 1983: 17) in multiplying the 10-minute, 10-meter MSSW values by 1.3 to convert them to 1-minute sustained surface winds and multiplying these values by 1.11 to estimate peak gust values adjusted for surface terrain. Applying this method, the range of possible values for maximum gusts based on mid-point MSSW values for the four hurricane categories extends from 109 mph (MSSW = 85 mph) to 213 mph (MSSW = 166 mph).
The methods used to derive peak gust wind speeds differ among the sources we consulted. The hurricane loss studies prepared by the different Florida Regional Planning Councils (RPCs) follow a similar method. The Tampa Bay RPC (1983: 17) reportedly converted 10-minute SLOSH sustained wind speeds to 1-minute sustained surface winds by multiplying by a factor of 1.3 on the recommendation of Brian Jarvinen of the National Hurricane Center.

61
One-minute velocities were then converted to peak gusts by multiplying by a factor to account for surface terrain. In the Tampa Bay study a value of 1.11 was used to account for the predominantly suburban nature of the coastal landscape. The South Florida RPC (1987: 16) used a multiplier of 1.22 because of the prevailing urban nature of the coastal landscape. The Apalachee RPC (1986) used an array of multipliers: 1.43 for open water, 1.22 for developed coastal areas, and 1.11 for woodlands and rolling terrain, apparently based on the original source of these factors cited in the Tampa Bay RPC study - Atkinson (1974). The US Army Corps of Engineers, in the Tri-State Hurricane Property Loss Study (United States Army Corps of Engineers 1988: 27-28), describes wind speeds generated from the SLOSH model as "peak gust windspeeds [sic] at 30-meters altitude." They claim to have reduced these by 30 to 50 percent "depending on the presence of dense vegetation or structures, to approximate a value for peak gusts at the surface." They label the damage curves as being based on 30-meter wind speeds. However, in Appendix B of the 1990 technical data report, the table upon which the curves are based is described as representing peak gusts at the surface. In that appendix (United States Army Corps of Engineers 1990: B-1), it is reported that the 30-meter sustained winds were converted to sustained surface winds (most likely 10-meter) by multiplying by 0.66. These values were then multiplied by 1.3 to obtain "peak gusts at the surface," which are evidently the values reported in the table on p. B-6. This process appears to convert 10-meter, 10-minute surface wind speeds to peak gusts without the additional adjustment for surface terrain used in the RPC studies. The Army Corps method as detailed in the 1990 appendix appears to be consistent with that recommended by Simpson and Riehl (1981: 213) based on their review of the technical literature. Simpson and Riehl recommend multiplying 10-minute, 10-meter sustained wind values by 1.3 to convert them to "instantaneous" peak gusts at "anemometer level" (10 meters).
Dzurik et al. (1990: 34) use multipliers similar to those used by the RPCs to convert 1-minute sustained winds to peak gusts. They, however, present the SLOSH grid data as 1-minute sustained wind estimates and do not, therefore, apply the 1.3 multiplier for converting 10-minute wind velocities to 1-minute values.
8. We relied on damage tables used by the US Army Corps of Engineers (1990) in the appendix of the Tri-State Hurricane Property Loss Study. With the exception of the damage table for mobile homes, these tables appear to be based on the damage tables originally developed by Friedman (1975) and relied upon for most of the other damage loss studies performed by the regional planning councils (RPCs) in Florida during the 1980s. The source of the wind damage table for mobile homes which is included in the Army Corps's Tri-State Study is not clearly documented, but appears to be more reasonable than the table used in previous RPC damage loss studies which is attributed to Foremost Insurance Company (1979). More recent wind damage curves reportedly have been developed by the insurance industry but are treated as proprietary and thus are not available for use by local governments (Loomis, 1998).
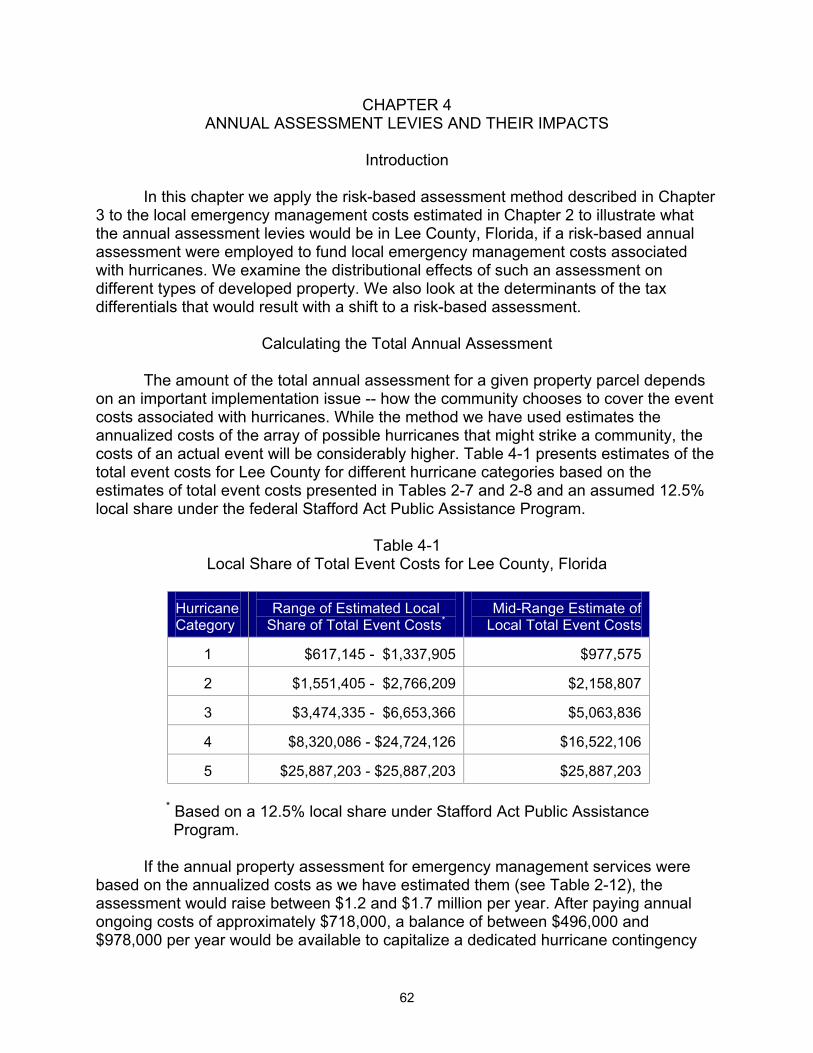
62
CHAPTER 4 ANNUAL ASSESSMENT LEVIES AND THEIR IMPACTS
Introduction
In this chapter we apply the risk-based assessment method described in Chapter 3 to the local emergency management costs estimated in Chapter 2 to illustrate what the annual assessment levies would be in Lee County, Florida, if a risk-based annual assessment were employed to fund local emergency management costs associated with hurricanes. We examine the distributional effects of such an assessment on different types of developed property. We also look at the determinants of the tax differentials that would result with a shift to a risk-based assessment. Calculating the Total Annual Assessment
The amount of the total annual assessment for a given property parcel depends on an important implementation issue -- how the community chooses to cover the event costs associated with hurricanes. While the method we have used estimates the annualized costs of the array of possible hurricanes that might strike a community, the costs of an actual event will be considerably higher. Table 4-1 presents estimates of the total event costs for Lee County for different hurricane categories based on the estimates of total event costs presented in Tables 2-7 and 2-8 and an assumed 12.5% local share under the federal Stafford Act Public Assistance Program.
Table 4-1 Local Share of Total Event Costs for Lee County, Florida
Hurricane Category
Range of Estimated Local
Share of Total Event Costs*
Mid-Range Estimate of
Local Total Event Costs
1
$617,145 - $1,337,905
$977,575
2
$1,551,405 - $2,766,209
$2,158,807
3
$3,474,335 - $6,653,366
$5,063,836
4
$8,320,086 - $24,724,126
$16,522,106
5
$25,887,203 - $25,887,203
$25,887,203
* Based on a 12.5% local share under Stafford Act Public Assistance Program.
If the annual property assessment for emergency management services were
based on the annualized costs as we have estimated them (see Table 2-12), the assessment would raise between $1.2 and $1.7 million per year. After paying annual ongoing costs of approximately $718,000, a balance of between $496,000 and $978,000 per year would be available to capitalize a dedicated hurricane contingency

63
fund. At this rate it would take about 3 years to accumulate sufficient reserves to cover the local response and recovery costs of a category 2 hurricane ($2.2 million) and about 7 years to cover the local event costs of a category 3 hurricane $5.0 million). A jurisdiction might wish to capitalize the contingency fund more quickly. It also might want to cap the fund at some maximum amount. Thus, the actual annual assessment will depend on how a local government chooses to manage potential event costs.
If a jurisdiction chose to capitalize a contingency fund for event costs based on the annualized costs as we have estimated them, the annual assessment for a given parcel (ATi) would be the sum of the proportional shares of the four cost categories weighted by the appropriate risk indices derived in Chapter 3:
ATi = (APIi x PMC) + (DRIi x DRC) + (PFIi x PFC) + (CRIi x OC) Eq 4-1
where APIi = anticipatory protective measure risk index for parcel i (Eq 3-8) PMC = annualized costs of anticipatory protective measures (Category B) DRIi = damage risk index for parcel i (Eq 3-24) DRC = annualized cost of debris removal (Category A) PFIi = public facility risk index for parcel i (Eq 3-26) PFC = annualized cost of damage to public facilities (Categories C-G) CRIi = composite risk index for parcel i (Eq 3-27) OC = annual ongoing costs
Application to Lee County
We applied these indices to 146,674 taxable structures located on 138,949 property parcels, based on data obtained from the Lee County Property Appraiser’s office in 1998, to determine what the range of annual assessments would be under a risk-based special benefit tax. Because a number of parcels included more than one taxable structure, some of which had different vulnerability attributes, for example a commercial strip mall, we calculated the fee on a structure-by-structure basis rather than for parcels as a whole. Where multiple structures were present on a property parcel, the assessed value of the underlying land was divided evenly among the individual structures.
Table 4-2 compares the property assessments that would result in Lee County from financing emergency management services associated with hurricanes under a risk-based tax with what property owners would pay solely on the basis of assessed value. Under our low-range estimate of annualized local costs ($1.2 million), the individual risk-based assessments would range from $0.01 to $6,465 per year with a median assessment of $5.53. Under our high-range estimate of annual county costs ($1.7 million), the individual risk-based assessments would range from $0.01 to $8,160 per year with a median assessment of $8.14.
The actual change in tax obligation a property owner would experience is the difference between what they pay for these services through their existing ad valorem assessment and what they would pay under the risk-based approach. The ranges under a risk-based tax are substantially larger which indicates that there likely would be some noticeable changes in annual assessments, at least at the margins. For our high

64
estimate of total costs, nearly every improved
Table 4-2 Comparison of Annual Property Assessments
for Emergency Management Costs for Lee County, Florida.
Total Cost Assessment Basis
Low Estimate ($1,212,621)
High Estimate ($1,686,288)
Assessed Value of Structures and Land
$0.18 - $1,920
$0.25 - $2,683
Relative Risk
$0.01 - $6,465
$0.01 - $8,160
property would experience a tax differential (99.94%). Two-thirds of all improved properties (66%) would experience a tax increase.
The magnitude of the tax differential would range from a decrease of $1,000 per year to an increase of $5,477. The median tax change across all developed parcels, however, is much more moderate, a tax increase of $2.00 per year. The median tax increase for the most at-risk parcels, i.e., the upper quintile, would be $11.25 per year, while the median tax decrease for the lowest-risk parcels, i.e. the bottom quintile, would be -$4.30 per year.
These results demonstrate that tax-benefit equity is not achieved under the current practice of paying for local emergency management services from general revenues. They also show, however, that except for properties at the extremes of the relative risk distribution, the inequities are modest.
The change in tax obligation varies with structure type and location. Mobile homes have relatively high vulnerability and low assessed values regardless of location and, therefore, typically would experience a tax increase. Mean tax differentials for different political subdivisions within the county range from an increase of $9.04 to $11.45. Single-family residential structures generally have higher assessed values and are less vulnerable to wind damage. Their mean tax differentials range from a tax decrease of $2.18 to a tax increase of $8.26. Commercial and industrial structures typically would experience tax decreases on the order of $8.00 to $16.00 per year.

65
Tax Differential Determinants
An examination of the relative importance of factors that contribute to the tax differentials that would be experienced by different properties under a risk-based assessment offers some insight into the underlying sources of tax-benefit inequity under the current practice of financing local emergency management services with general revenues. To accomplish such an evaluation we used multiple regression to analyze the different variables used to calculate each property’s ad valorem and risk-based tax assessments. The dependent variable in the analysis is the value of the tax differential for each taxable structure. Table 4-3 describes the independent variables tested in the analysis. Table 4-3 Principal Determinants of Risk-Based Assessment Tax Differentials
Variable
Description
Units Commercial
Indicates if improvement is a commercial structure (0/1)
None
Distance from Coast
Distance of the parcel centroid from the digitized “open coast” line
Nautical miles
Elevation
Estimated first-floor elevation above sea level
Feet
Evacuation Probability
Annualized probability of evacuating an improved property parcel
None
Improvement Value
Assessed value of the structure
Dollars
Land Value
Assessed value of land on which structure sits
Dollars
Location
Indicates if parcel is in an incorporated area of the county (0/1)
None
Mobile Home
Indicates if improvement is a mobile home (0/1)
None
Multi-Family
Indicates if improvement is a multi-family structure (0/1)
None
Single-Family
Indicates if improvement is a single-family structure (0/1)
None
Square Footage
Interior floor space of the improvement
Square feet

66
Results of an ordinary least squares regression analysis of these variables are presented in Table 4-4. The model is statistically valid (F = 61382, probability > F = 0.0001) and explains 82% of the observed variation in tax differential (adjusted R2 = 0.82). All of the variables are significant at the 95% confidence level except Distance from Coast which is not significant at generally accepted confidence levels of 90% or greater. Examination of the standardized regression coefficients reveals that the assessed value of the land and the improvement (structure) on the property are two of the three most important factors that influence the difference between what a property owner currently pays and what they would pay under a risk-based assessment. The negative values of these coefficients indicate that property owners with higher assessed property values would experience lower tax differentials under a risk-based assessment system, i.e. they are generally paying more under the current ad valorem assessment system. Table 4-4 Relative Importance of Variables in Determining Risk-Based Assessment Tax Differentials
Variable
Standardized Regression Coefficients*
Land Value
-0.664
Evacuation Probability
0.381
Improvement Value
-0.369
Multi-Family
0.301
Square Footage
0.297
Mobile Home
0.270
Single-Family
0.142
Commercial
0.097
Elevation
-0.095
Location
0.012
Distance from Coast
0.001
* All coefficients significant at 95% confidence level
except Distance from Coast (43%).

67
The most significant variable used in calculating the risk indices used in the risk-based tax assessment method is the annualized probability that a parcel will be evacuated. The positive sign of the coefficient indicates that property owners whose structures are more likely to be evacuated are likely to experience greater tax increases under a risk-based assessment system.
Three other factors have very similar standardized coefficients: multi-family structures, mobile homes, and the square footage of the structure. It is not clear why multi-family structures are likely to experience greater tax increases. It may have to do with where such structures are concentrated geographically within the county, i.e. in areas subject to more frequent storm surges, or it may be because larger quantities of debris may be associated with larger structures. Mobile homes are much more vulnerable to wind and water damage than other structures. This may explain the relatively high standardized coefficient for this variable. The positive correlation between square footage and the tax differential is likely related to the public facilities risk index which is the only component of the risk-based tax assessment algorithm that employs this variable.
The lower values for the regression coefficients for single-family structures and commercial structures indicate that owners of these types of structures are more nearly paying an appropriate amount under the current ad valorem assessment method when all else is equal, i.e. for a given evacuation probability, assessed value, elevation, etc. The negative coefficient for elevation is to be expected, i.e. structures at lower elevations experience greater tax increases, but the small magnitude of the coefficient indicates that this factor alone is relatively unimportant. This may reflect the mitigating effect of the local building codes which require structures within 100-year flood zones to elevate the first floor of the structure to the elevation of the 100-year flood.
The location of a property within or outside of the incorporated areas of the county has only a minor effect on the tax differential. Distance of the structure from the open coast is not statistically significant. The sign for the distance variable is counter-intuitive, indicating that structures located farther from the coast have slightly higher tax increases than structures located closer to the coast, all else being equal.
Figure 4-1 may offer some insight into this unexpected statistical relationship. It shows a dramatic shift from a tax decrease to a tax increase between parcels located on the “open coast” (distance = 0.0) and those located 1/4 of a mile inland from the open coast line (see again Figure 3-3). This pattern is further supported if the regression model is analyzed separately for parcels within different distance zones. Table 4-5 compares the regression coefficients for the distance from coast variable for all parcels, as reported in Table 4-4, and for the regression model analyzed separately for property parcels located less than 1/4 mile from the coast and parcels located between 1/4 and 8 3/8 miles from the coast.
When the model is analyzed for subsets of parcels based on distance, the distance from coast variable is statistically significant and the sign of the coefficient shifts. In areas less than 1/4 mile from the coast, the tax differential increases with distance from the coast, indicating that parcels further inland in this area are paying less than they should under a risk-based assessment. For improved properties between 1/4 mile and 8 3/8 miles from the open coast, the tax differential decreases with distance suggesting that parcels further

68
inland are already paying closer to their proportional share under the existing ad valorem tax system.
Figure 4-1: Mean High Estimate of Tax Differential Versus Distance from the Open Coast

69
Table 4-5 Relative Effect of Distance from Open Coast on Risk-Based Assessment Tax Differentials
Model
Standardized Regression Coefficient for Distance
from Coast (probability >T)
Sample Size
Adjusted R2
All Properties
0.001
(0.5681)
146,66
8
0.82
Properties Less Than 1/4 Mile from the Coast
0.015
(0.0001)
6,848
0.95
Properties Between 1/4 and 8 3/8 Miles from the Coast
-0.027
(0.0001)
94,178
0.83
This pattern may reflect the effects of higher property values coupled with
elevation requirements for structures located on the barrier islands and on the shorelines of the sounds (for which distance = 0.0) versus some combination of lower property values and less stringent elevation requirements for structures located landward of the mainland shorelines.
Figures 4-2 and 4-3 isolate the relative relationships between the composite risk of a property parcel and distance from the coast and assessed property value and distance from the coast. Figure 4-2 shows that the composite risk index (see Equation 3-27) for property values peaks at a distance of 1/4 mile inland from the open coast reference line. This likely reflects in part differences in first-floor elevations tied to the local building code and the State of Florida’s rules governing structures located within an area defined by the Coastal Construction Control Line (CCCL): average first floor elevations for structures located at the coast (distance from the open coast = 0.0) is 7.23 feet, while the average first-floor elevations of structures located between 1/8 and 1/4 mile from the open coast is 5.14 feet. Figure 4-3 shows, however, that property values also decline dramatically as one moves from the “open coast” to property parcels located only 1/8 of a mile from the coast.
Thus the regression results which indicate that tax differentials tend to increase with distance from the coast within the first quarter mile probably reflect both declines in property values and increases in relative risk in areas immediate shoreward of the first few tiers of property along the open coasts of the mainland shoreline. This suggests that there may be merit to examining the relationship between storm surge flood risk and the more limited definition of flood risk zones within which elevation requirements are typically imposed in Florida.1
In the final chapter we turn to two important implementation questions: (1) what options do local governments have for putting a risk-based assessment in place and (2) how politically feasible is such an approach likely to be.
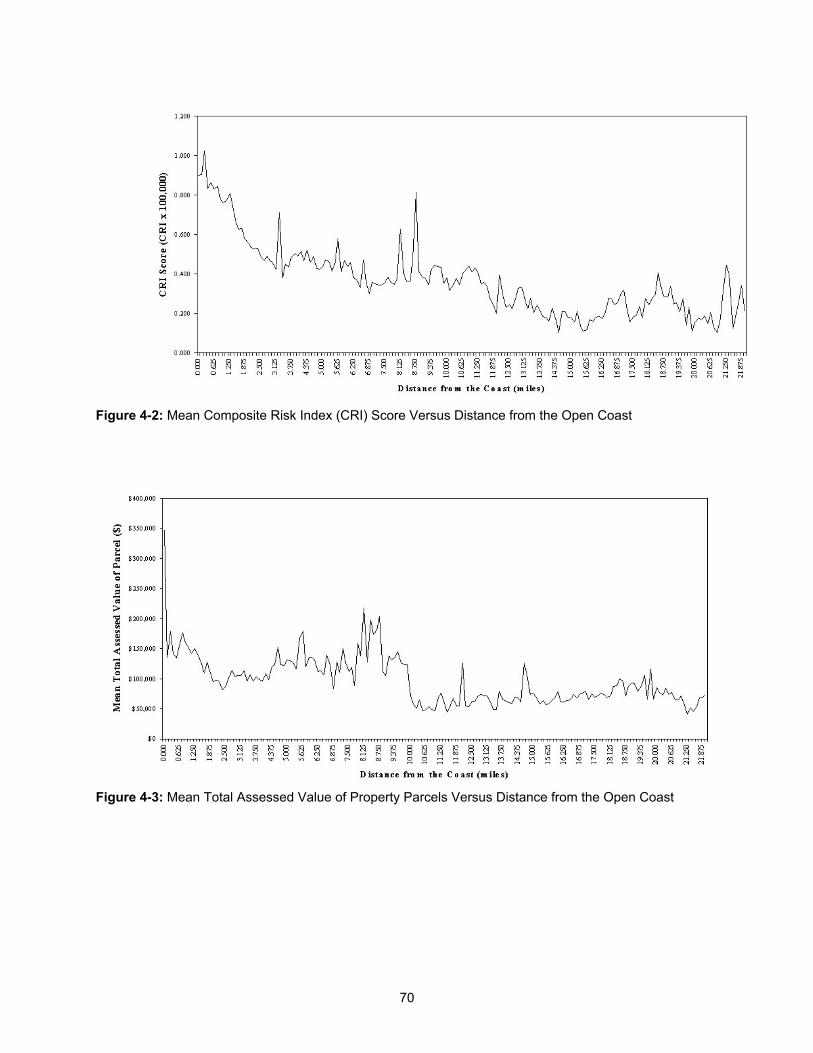
70
Figure 4-2: Mean Composite Risk Index (CRI) Score Versus Distance from the Open Coast
Figure 4-3: Mean Total Assessed Value of Property Parcels Versus Distance from the Open Coast

71
Endnotes 1. Local elevation requirements are tied to the 100-year flood zones defined under the National
Flood Insurance Program (NFIP). The areal extent of the NFIP A-zones (areas susceptible to still-water flooding from a 100-year storm) is generally smaller than that of the Category 2 storm surge zone in Lee County (see Figure 3-1). The NFIP V-zones (areas susceptible to damage from a 3-foot or greater breaking wave associated with a 100-year storm) typically only extend into immediate on-shore property parcels. This zone is generally narrower than the Category1 storm surge zone in Lee County. The state CCCL defines the area of open sandy beach coastline likely to be affected by erosion from a 100-year storm. Within this area structures must be elevated to heights that in some cases are greater than those required in NFIP V-zones. The CCCL area is typically about the same width or wider than the V-zone, but again this is narrower than the Category 1 storm surge zone in Lee County.