Embed Size (px)
Citation preview
Set of 71 slides based on the chapter authored by M.J. Myers of the IAEA publication (ISBN 92-0-107304-6): Nuclear Medicine Physics: A Handbook for Teachers and Students
Objective: To familiarize with functional measurements in diagnostic nuclear medicine
Chapter 16: Functional Measurements in Nuclear Medicine
Slide set prepared in 2015 by M. Ferrari (IEO European Institute of Oncology, Milano, Italy)
IAEA
CHAPTER 16 TABLE OF CONTENTS
16.1. INTRODUCTION
16.2. NON-IMAGING MEASUREMENTS 16.2.1. Renal function measurements 16.2.2. Carbon-14 breath tests 16.3. IMAGING MEASUREMENTS 16.3.1 Thyroid 16.3.2 Renal function 16.3.3 Lung function 16.3.4 Gastric function 16.3.5 Cardiac function
Nuclear Medicine Physics: A Handbook for Teachers and Students – Chapter 16 – Slide 2/71
IAEA
16.1 INTRODUCTION
The nuclear medicine modality focuses on
physiological organ function for diagnoses.
The three aspects involved in the process are: I. choice of radioactive tracer II. method of detection of the emissions from the tracer III. analysis of results of the detection.
Different methods of detection can be used: • Imaging with a gamma camera or PET scanner in a number of modes:
static, dynamic, whole body and tomographic • Counting over areas of the body which can also be static or dynamic • Laboratory analysis of blood samples
Nuclear Medicine Physics: A Handbook for Teachers and Students – Chapter 16 – Slide 3/71
IAEA
16.2 NON IMAGING MEASUREMENTS
Non-imaging measurements refer to the analysis of data from
radionuclide procedures that are not derived from interpreting
normal and pathological patterns of uptake of tracer in images
from γ-cameras and PET scanners.
Example: investigation of glomerular filtration in the kidney
using a tracer such as 51Cr-EDTA which can be measured
from timed blood samples without using images for
information about morphological changes.
Nuclear Medicine Physics: A Handbook for Teachers and Students – Chapter 16 – Slide 4/71
IAEA
16.2 NON IMAGING MEASUREMENTS 16.2.1 Renal function measurements
Renal haemodynamic functions can be divided into measurements of :
• renal blood flow: supply of blood to the cortical and extramedullary
nephrons which are the functional unit of the kidney
• glomerular filtration: transfer of fluids across the glomerulus
Several radioactive tracers may be used depending on the function to be studied, the most common being:
99mTc labelled diethylenetriaminepentaacetic acid (DTPA) 99mTc labelled dimercaptosuccinic acid (DMSA) 99mTc labelled mercaptoacetyltriglycine (MAG3)
Nuclear Medicine Physics: A Handbook for Teachers and Students – Chapter 16 – Slide 5/71
IAEA
16.2.1 Renal function measurements 16.2.1.1 Glomerular filtration rate plasma clearance
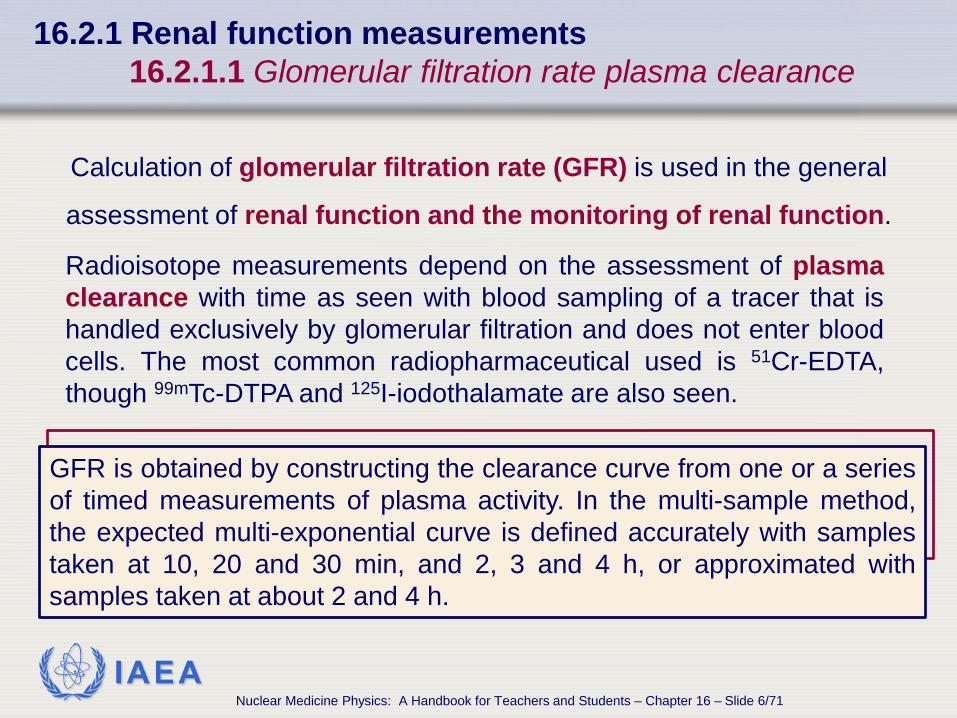
Calculation of glomerular filtration rate (GFR) is used in the general
assessment of renal function and the monitoring of renal function.
Radioisotope measurements depend on the assessment of plasma clearance with time as seen with blood sampling of a tracer that is handled exclusively by glomerular filtration and does not enter blood cells. The most common radiopharmaceutical used is 51Cr-EDTA, though 99mTc-DTPA and 125I-iodothalamate are also seen.
GFR is obtained by constructing the clearance curve from one or a series of timed measurements of plasma activity. In the multi-sample method, the expected multi-exponential curve is defined accurately with samples taken at 10, 20 and 30 min, and 2, 3 and 4 h, or approximated with samples taken at about 2 and 4 h.
Nuclear Medicine Physics: A Handbook for Teachers and Students – Chapter 16 – Slide 6/71
IAEA
16.2.1 Renal function measurements 16.2.1.1 Glomerular filtration rate plasma clearance
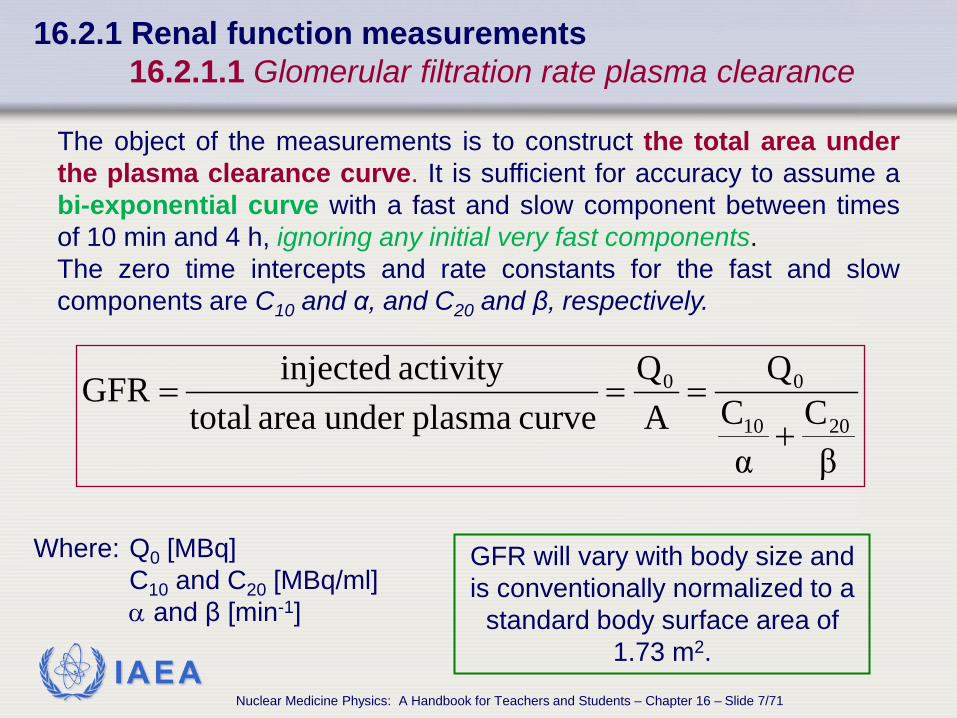
The object of the measurements is to construct the total area under the plasma clearance curve. It is sufficient for accuracy to assume a bi-exponential curve with a fast and slow component between times of 10 min and 4 h, ignoring any initial very fast components. The zero time intercepts and rate constants for the fast and slow components are C10 and α, and C20 and β, respectively.
βC
αC
QAQ
curve plasmaunder area totalactivity injected GFR
2010
00
+===
Where: Q0 [MBq] C10 and C20 [MBq/ml] α and β [min-1]
GFR will vary with body size and is conventionally normalized to a
standard body surface area of 1.73 m2.
Nuclear Medicine Physics: A Handbook for Teachers and Students – Chapter 16 – Slide 7/71
IAEA
16.2.1 Renal function measurements 16.2.1.1 Glomerular filtration rate plasma clearance
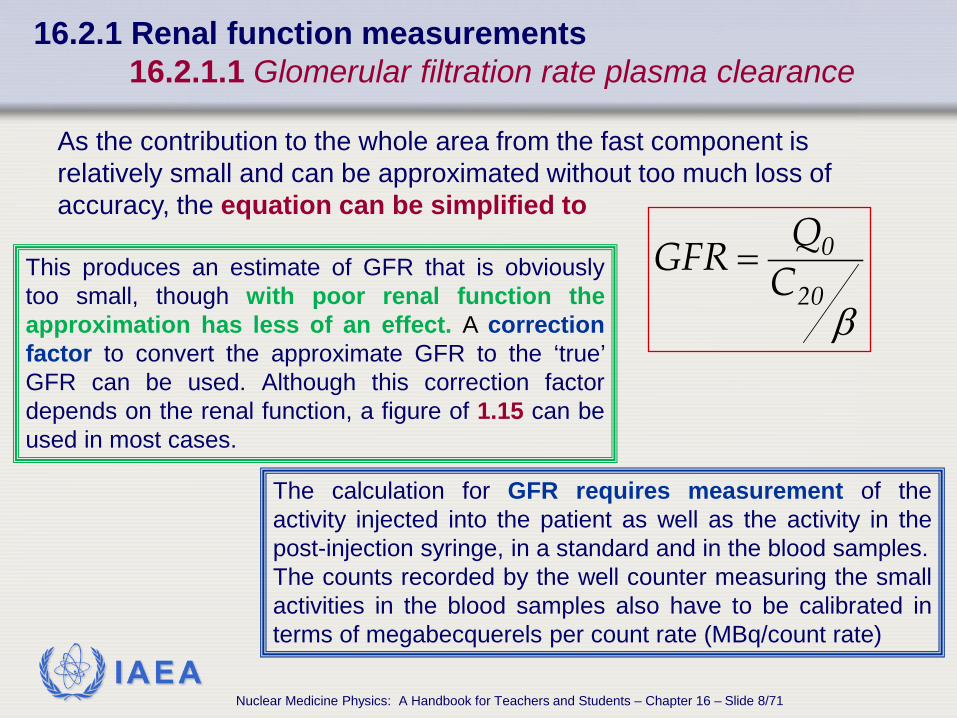
As the contribution to the whole area from the fast component is relatively small and can be approximated without too much loss of accuracy, the equation can be simplified to
β20
0C
QGFR =This produces an estimate of GFR that is obviously too small, though with poor renal function the approximation has less of an effect. A correction factor to convert the approximate GFR to the ‘true’ GFR can be used. Although this correction factor depends on the renal function, a figure of 1.15 can be used in most cases.
The calculation for GFR requires measurement of the activity injected into the patient as well as the activity in the post-injection syringe, in a standard and in the blood samples. The counts recorded by the well counter measuring the small activities in the blood samples also have to be calibrated in terms of megabecquerels per count rate (MBq/count rate)
Nuclear Medicine Physics: A Handbook for Teachers and Students – Chapter 16 – Slide 8/71
IAEA
16.2.1 Renal function measurements 16.2.1.2 Effective renal plasma flow measurements
βα2010
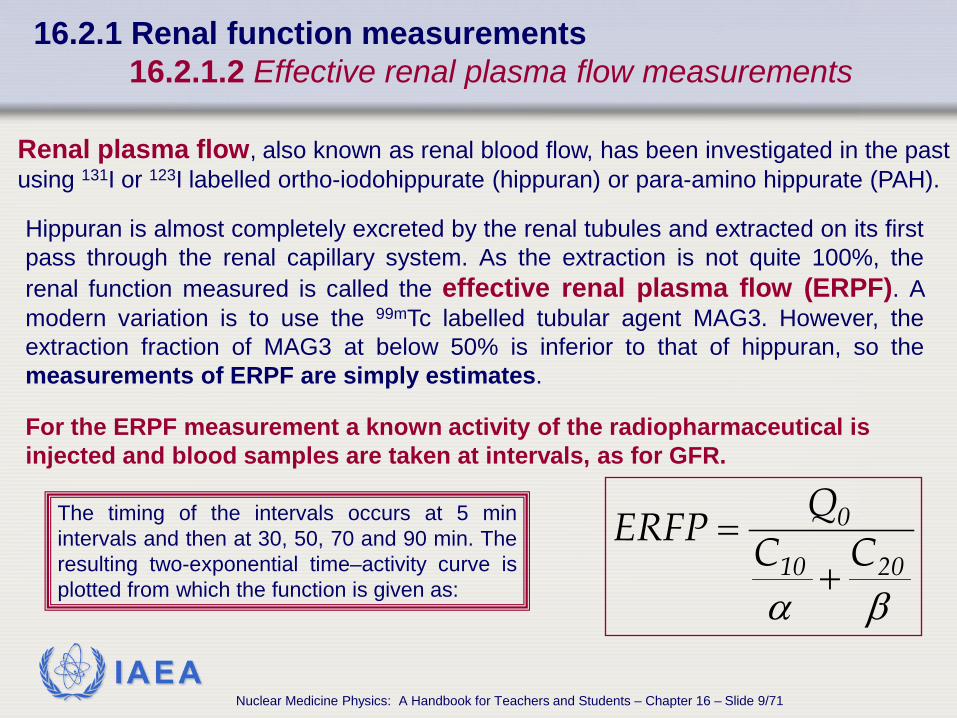
0CC
QERFP+
=The timing of the intervals occurs at 5 min intervals and then at 30, 50, 70 and 90 min. The resulting two-exponential time–activity curve is plotted from which the function is given as:
Renal plasma flow, also known as renal blood flow, has been investigated in the past using 131I or 123I labelled ortho-iodohippurate (hippuran) or para-amino hippurate (PAH).
Hippuran is almost completely excreted by the renal tubules and extracted on its first pass through the renal capillary system. As the extraction is not quite 100%, the renal function measured is called the effective renal plasma flow (ERPF). A modern variation is to use the 99mTc labelled tubular agent MAG3. However, the extraction fraction of MAG3 at below 50% is inferior to that of hippuran, so the measurements of ERPF are simply estimates.
For the ERPF measurement a known activity of the radiopharmaceutical is injected and blood samples are taken at intervals, as for GFR.
Nuclear Medicine Physics: A Handbook for Teachers and Students – Chapter 16 – Slide 9/71
IAEA
16.2 NON IMAGING MEASUREMENTS 16.2.2 Carbon-14 breath tests
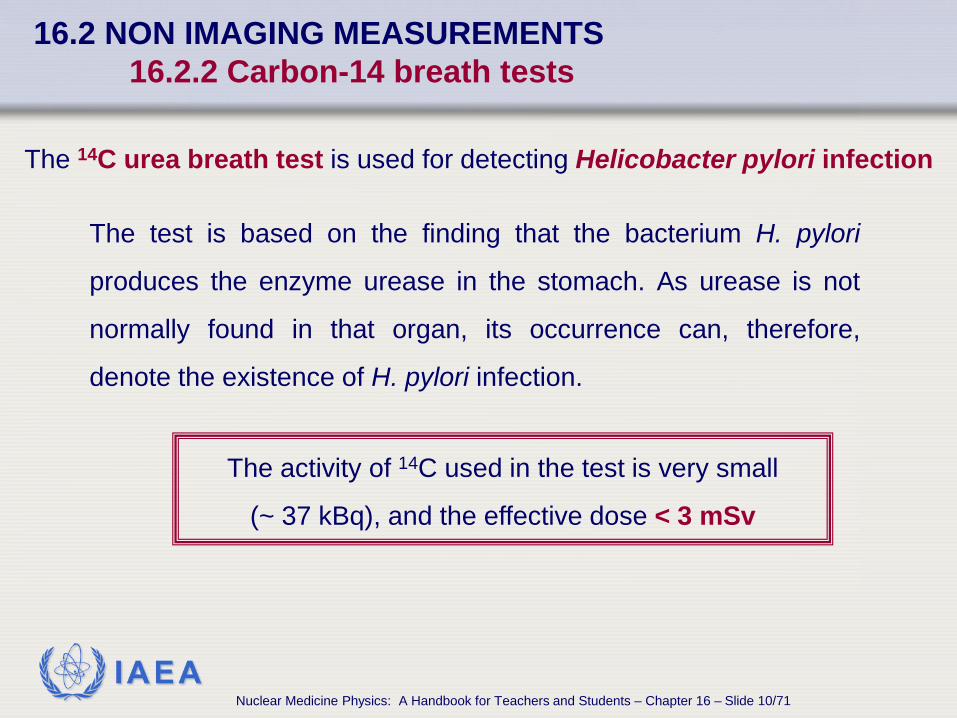
The 14C urea breath test is used for detecting Helicobacter pylori infection
The test is based on the finding that the bacterium H. pylori
produces the enzyme urease in the stomach. As urease is not
normally found in that organ, its occurrence can, therefore,
denote the existence of H. pylori infection.
The activity of 14C used in the test is very small
(~ 37 kBq), and the effective dose < 3 mSv
Nuclear Medicine Physics: A Handbook for Teachers and Students – Chapter 16 – Slide 10/71
IAEA
16.2 NON IMAGING MEASUREMENTS 16.2.2 Carbon-14 breath tests
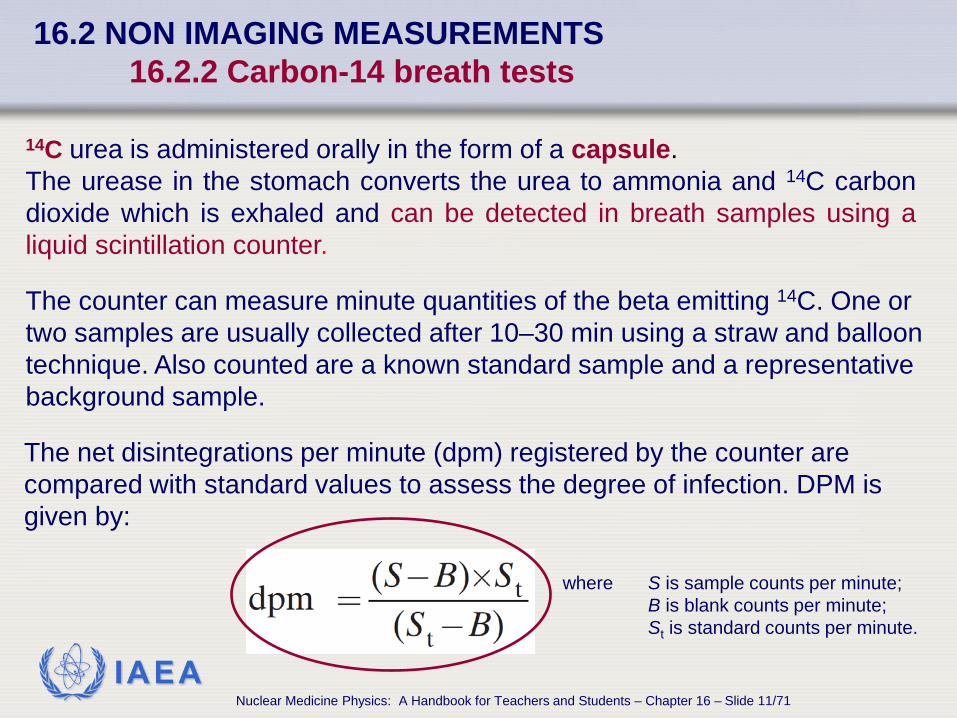
14C urea is administered orally in the form of a capsule. The urease in the stomach converts the urea to ammonia and 14C carbon dioxide which is exhaled and can be detected in breath samples using a liquid scintillation counter.
The net disintegrations per minute (dpm) registered by the counter are compared with standard values to assess the degree of infection. DPM is given by:
The counter can measure minute quantities of the beta emitting 14C. One or two samples are usually collected after 10–30 min using a straw and balloon technique. Also counted are a known standard sample and a representative background sample.
where S is sample counts per minute; B is blank counts per minute; St is standard counts per minute.
Nuclear Medicine Physics: A Handbook for Teachers and Students – Chapter 16 – Slide 11/71
IAEA
16.3 IMAGING MEASUREMENTS
Imaging measurements include
• static image acquisition and analysis for quantitative assessment
of uptake, example: thyroid uptake measurement
• time–activity curves derived from dynamic 2-D imaging and
quantitative parameters assessed from images, example: renal
function
• time–activity curves derived from dynamic 3-D imaging with
quantitative parameters assessed from physiologically triggered
images, example: cardiac ejection fraction measurement.
Nuclear Medicine Physics: A Handbook for Teachers and Students – Chapter 16 – Slide 12/71
IAEA
16.3 IMAGING MEASUREMENTS 16.3.1 Thyroid
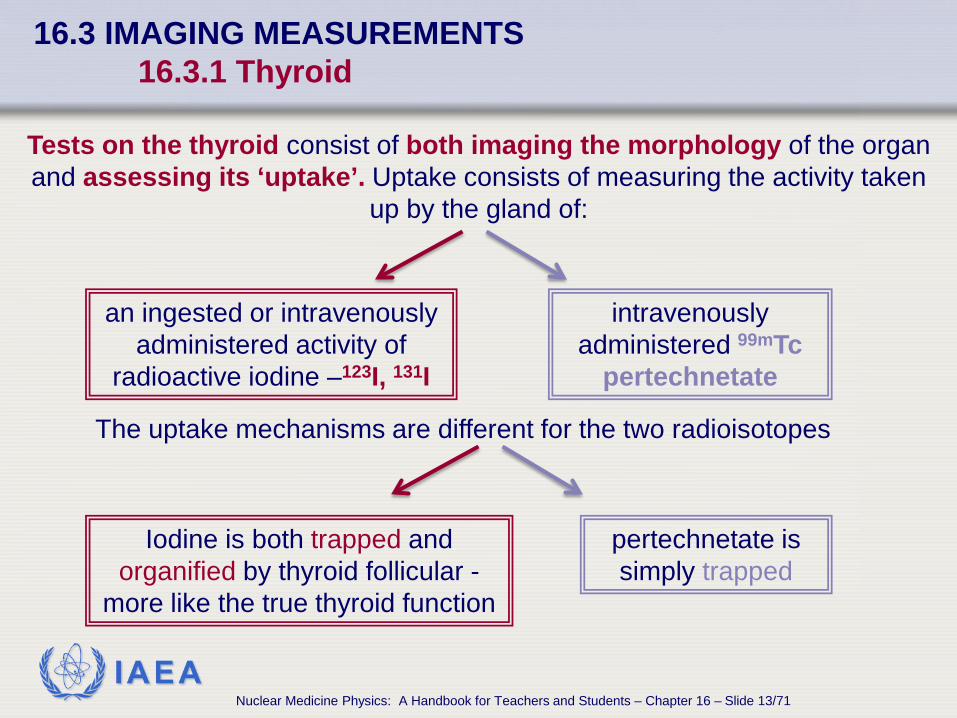
Tests on the thyroid consist of both imaging the morphology of the organ and assessing its ‘uptake’. Uptake consists of measuring the activity taken
up by the gland of:
an ingested or intravenously administered activity of
radioactive iodine –123I, 131I
intravenously administered 99mTc
pertechnetate
The uptake mechanisms are different for the two radioisotopes
Iodine is both trapped and organified by thyroid follicular -
more like the true thyroid function
pertechnetate is simply trapped
Nuclear Medicine Physics: A Handbook for Teachers and Students – Chapter 16 – Slide 13/71
IAEA
16.3 IMAGING MEASUREMENTS 16.3.1 Thyroid
The tests allow assessment of:
• functionality of thyroid lesions and nodules, and investigations of thyroiditis and ectopic tissue. They can confirm a diagnosis of an excess of circulating thyroid hormones, (Graves’ disease and toxic nodular goitre), and lead to a more quantitative approach to treatment of hyperthyroidism with 131I
• uptake of tumours secondary to thyroid cancer that have disseminated through the body following surgery may also be assessed. In this case, whole body images are made using 131I and a scanning gamma camera. The tumours can be located and, in some cases, a quantitative measurement of uptake made, thus allowing the effectiveness of treatment to be monitored
Nuclear Medicine Physics: A Handbook for Teachers and Students – Chapter 16 – Slide 14/71
IAEA
16.3 IMAGING MEASUREMENTS 16.3.1 Thyroid
The choice of radiopharmaceutical used can be dictated by the availability and cost of the preferred isotope 123I and 99mTc. Each is suitable for use with
a γ-camera.
123I • half-life: 13 h • gamma emission: 160 keV • cyclotron produced is not readily
available and is expensive
99mTc • half-life: 6 h • gamma emission: 140 keV • readily available from the standard
hospital molybdenum generator
The timing of the uptake of the two isotopes is also different
123I 18–24 h after injection 2–6 h after ingestion
99mTc 20 min after injection
Nuclear Medicine Physics: A Handbook for Teachers and Students – Chapter 16 – Slide 15/71
IAEA
16.3 IMAGING MEASUREMENTS 16.3.1 Thyroid
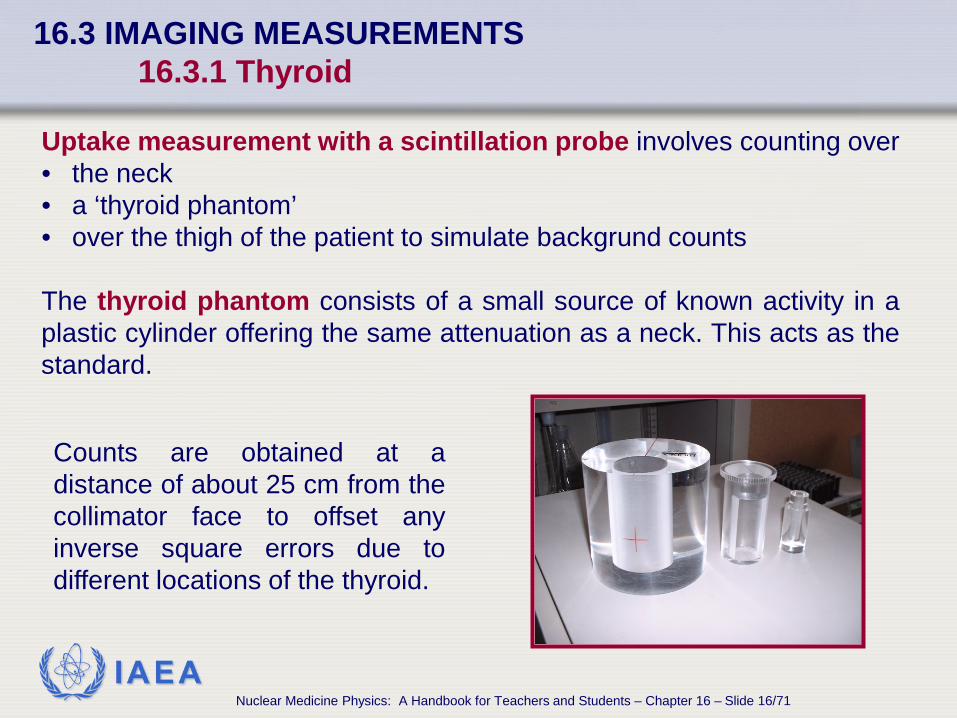
Uptake measurement with a scintillation probe involves counting over • the neck • a ‘thyroid phantom’ • over the thigh of the patient to simulate backgrund counts The thyroid phantom consists of a small source of known activity in a plastic cylinder offering the same attenuation as a neck. This acts as the standard.
Counts are obtained at a distance of about 25 cm from the collimator face to offset any inverse square errors due to different locations of the thyroid.
Nuclear Medicine Physics: A Handbook for Teachers and Students – Chapter 16 – Slide 16/71
IAEA
16.3 IMAGING MEASUREMENTS 16.3.1 Thyroid
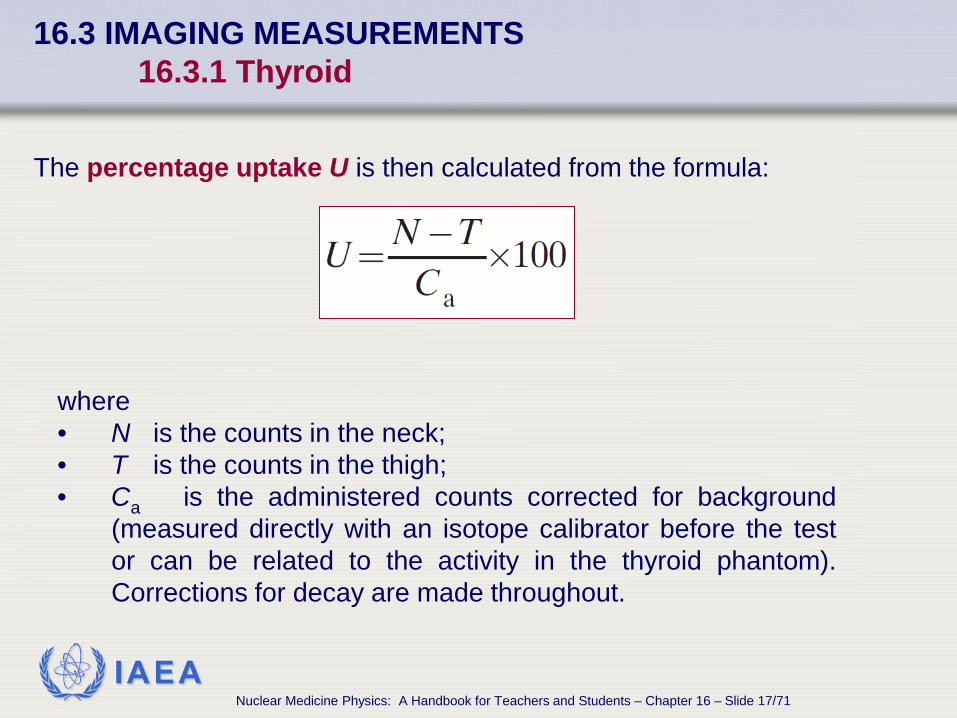
The percentage uptake U is then calculated from the formula:
where • N is the counts in the neck; • T is the counts in the thigh; • Ca is the administered counts corrected for background
(measured directly with an isotope calibrator before the test or can be related to the activity in the thyroid phantom). Corrections for decay are made throughout.
Nuclear Medicine Physics: A Handbook for Teachers and Students – Chapter 16 – Slide 17/71
IAEA
16.3 IMAGING MEASUREMENTS 16.3.1 Thyroid
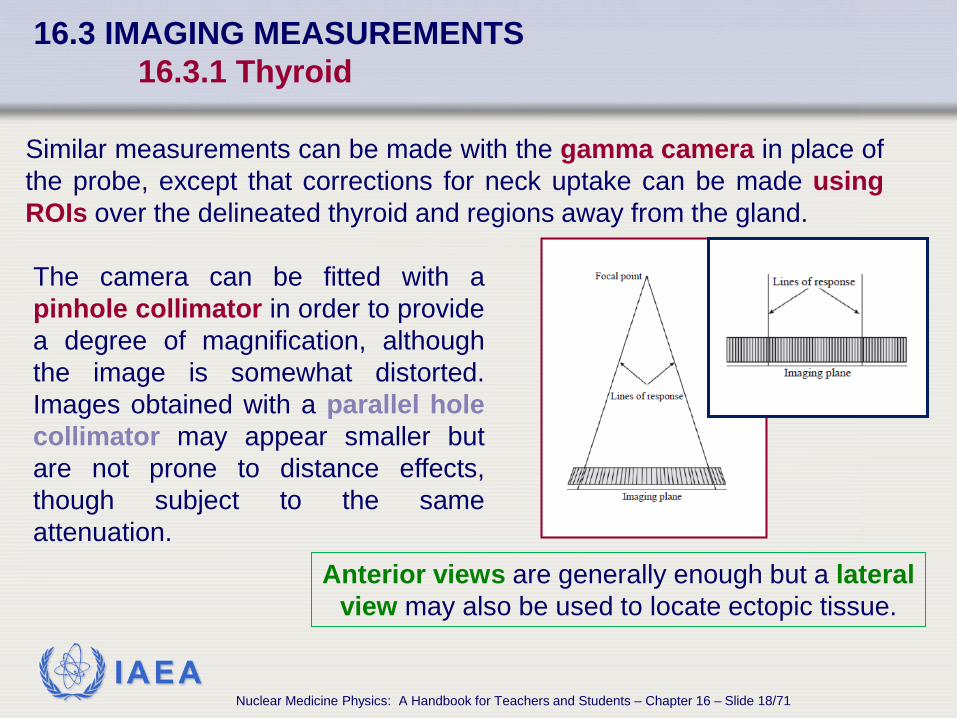
Similar measurements can be made with the gamma camera in place of the probe, except that corrections for neck uptake can be made using ROIs over the delineated thyroid and regions away from the gland.
The camera can be fitted with a pinhole collimator in order to provide a degree of magnification, although the image is somewhat distorted. Images obtained with a parallel hole collimator may appear smaller but are not prone to distance effects, though subject to the same attenuation.
Anterior views are generally enough but a lateral view may also be used to locate ectopic tissue.
Nuclear Medicine Physics: A Handbook for Teachers and Students – Chapter 16 – Slide 18/71
IAEA
16.3 IMAGING MEASUREMENTS 16.3.1 Thyroid
Quantification of the uptake is achieved in two ways: • by calibrating the camera with a known activity in a suitable phantom,
the activity injected into the patient can be measured • by measuring the injection directly in the syringe before administration. Each will yield the sensitivity of the camera in terms of counts/MBq and allow the activities seen in the thyroid glands and background to be calculated. The process is often an automatic one performed by the camera computer software that delineates the outlines of the thyroid lobe(s) and establishes a suitable background region used to correct for the presence of activity in tissue overlying and underlying the thyroid underlying tissue correction. It is important that a local normal range is established and that the calibration of the camera in terms of counts per megabecquerel is subject to a quality assurance programme.
Nuclear Medicine Physics: A Handbook for Teachers and Students – Chapter 16 – Slide 19/71
IAEA
16.3 IMAGING MEASUREMENTS 16.3.2 Renal function 16.3.2.1 General discussion
The study of renal function has been a mainstay of nuclear medicine for many decades and is an established efficient technique for, among other functions, assessing renal perfusion, quantifying divided or individual kidney function, and studying output efficiency and obstruction. Two aspects of renal function are exploited:
• glomerular filtration, i.e. the transfer of fluids across the glomerulus, investigated by measuring the clearance of 99mTc-DTPA (pentetate);
• tubular secretion, investigated by measuring the clearance of 99mTc-MAG3 (tiatide)
Nuclear Medicine Physics: A Handbook for Teachers and Students – Chapter 16 – Slide 20/71
IAEA
16.3 IMAGING MEASUREMENTS 16.3.2 Renal function 16.3.2.2 Renal function measurements
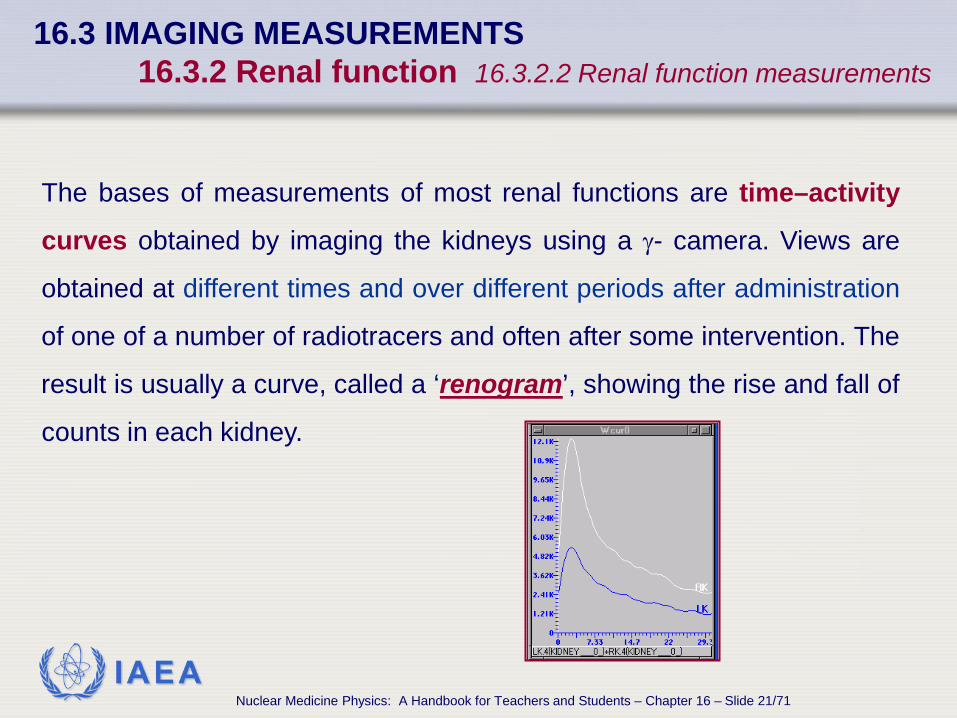
The bases of measurements of most renal functions are time–activity
curves obtained by imaging the kidneys using a γ- camera. Views are
obtained at different times and over different periods after administration
of one of a number of radiotracers and often after some intervention. The
result is usually a curve, called a ‘renogram’, showing the rise and fall of
counts in each kidney.
Nuclear Medicine Physics: A Handbook for Teachers and Students – Chapter 16 – Slide 21/71
IAEA
16.3 IMAGING MEASUREMENTS 16.3.2 Renal function 16.3.2.2 Renal function measurements
The analysis programmes, supported by
commercial software providers, allow the
calculation of a number of renal function
parameters, including relative perfusion,
relative function, mean and minimum transit
times, and outflow efficiency.
Nuclear Medicine Physics: A Handbook for Teachers and Students – Chapter 16 – Slide 22/71
IAEA
16.3 IMAGING MEASUREMENTS 16.3.2 Renal function 16.3.2.2 Renal function measurements
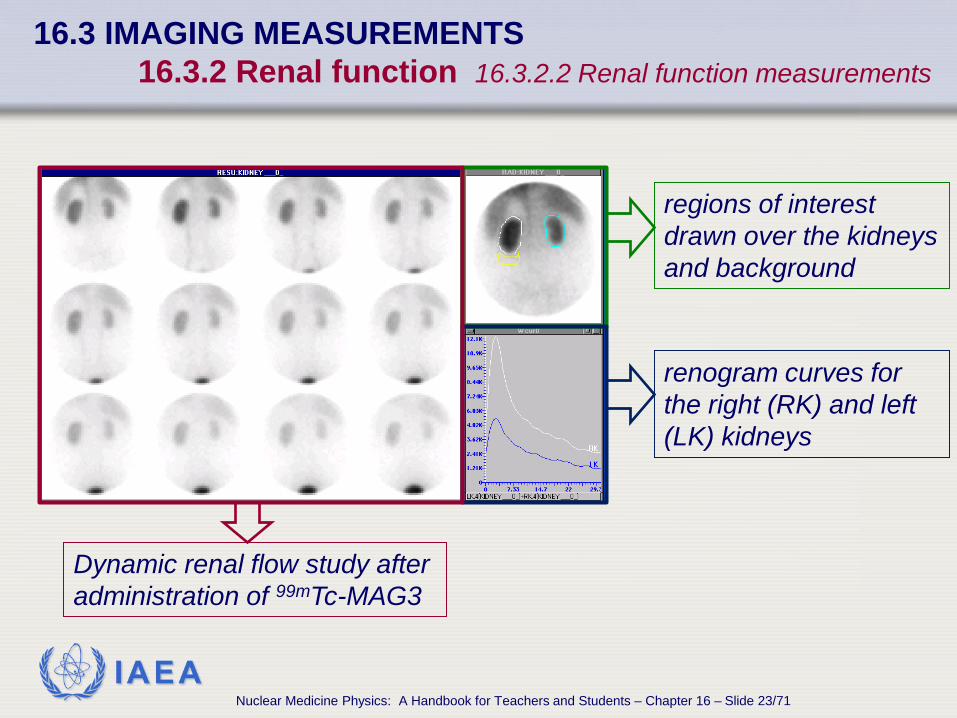
renogram curves for the right (RK) and left (LK) kidneys
Dynamic renal flow study after administration of 99mTc-MAG3
regions of interest drawn over the kidneys and background
Nuclear Medicine Physics: A Handbook for Teachers and Students – Chapter 16 – Slide 23/71
IAEA
16.3 IMAGING MEASUREMENTS 16.3.2 Renal function 16.3.2.2 Renal function measurements
What is happening to the tracer as it traverses the kidneys, and how it
appears in the images and renogram?
After adjustment for the contributions of activity in the renal vasculature, the
corrected curve displaying a relatively fast rise and subsequent slower fall
in activity can be described by two distinct phases:
• the first spans the time of injection to the end of the minimum transit time
when the kidney contains the sum of all of the tracer extracted from the
blood and has, therefore, been termed the sum phase
• the second starts at the end of the first and reflects the net activity left
after loss from the kidney and has been called the difference phase
Nuclear Medicine Physics: A Handbook for Teachers and Students – Chapter 16 – Slide 24/71
IAEA
16.3 IMAGING MEASUREMENTS 16.3.2 Renal function 16.3.2.2 Renal function measurements
• What is helpful is often a quantitative comparison of the
two kidneys with derivation of a relative function. This
may be calculated from Patlak plots or from the uptake
slope or the integral of the renogram curves.
• The programme can calculate the relative perfusion and
function from the retention functions.
• In the case of assessment of kidney transplants, other
aspects can be used to calculate relevant parameters.
Nuclear Medicine Physics: A Handbook for Teachers and Students – Chapter 16 – Slide 25/71
IAEA
16.3 IMAGING MEASUREMENTS 16.3.3 Lung function
The functions of the lung that are investigated using nuclear medicine techniques are:
• regional ventilation • pulmonary blood flow or perfusion (ventilation perfusion ratio) • intrapulmonary vascular shunting • pulmonary granulocyte kinetics • lung tissue permeability.
Lung air flow or ventilation imaging is carried out either with a gas such as:
• 81mKr (a 13 s half-life radioisotope generated from 81Rb that has a 4.6 h half-life)
• an aerosol containing particles of sizes between 0.1 and 2 mm, typically 99mTc-DTPA or carbon particles (Technegas)
Nuclear Medicine Physics: A Handbook for Teachers and Students – Chapter 16 – Slide 26/71
IAEA
16.3 IMAGING MEASUREMENTS 16.3.3 Lung function
• Lung blood flow or perfusion imaging is carried out with macroaggregates or microspheres of denatured human serum albumin (MAA).
• These particles of average size 20–40 mm are larger than the lung capillaries and are trapped in the capillary bed, distributing according to the blood flow to a region.
• Their main use is to image pulmonary vascular disease (pulmonary embolism)
• The two techniques are often employed together, either simultaneously (e.g. 81Kr and 99mTc MAA) or sequentially (99mTc aerosol and 99mTc MAA).
• The presence or absence of ventilation and/or perfusion is of clinical significance.
Nuclear Medicine Physics: A Handbook for Teachers and Students – Chapter 16 – Slide 27/71
IAEA
16.3 IMAGING MEASUREMENTS 16.3.4 Gastric function
Nuclear medicine allows a full, non-invasive and
quantitative assessment of the way the oesophagus
moves both solid and liquid meals to the stomach,
how the stomach handles these meals and how they
transit through the gastrointestinal tract.
Nuclear Medicine Physics: A Handbook for Teachers and Students – Chapter 16 – Slide 28/71
IAEA
As the choice of both solid and liquid test meals determines the standard
values used as criteria for evaluating the function, a ‘standard meal’ has
been agreed. Solid meals are based on preparations including eggs (into
which 99mTc sulphur colloid has been mixed), toast and water.
16.3 IMAGING MEASUREMENTS 16.3.4 Gastric function 16.3.4.1 Stomach emptying of solid and liquid meals
Anterior and posterior dynamic images are obtained at suitable intervals of
time following ingestion of the meal and are repeated for the same
positioning at hourly intervals for up to 4 h.
Nuclear Medicine Physics: A Handbook for Teachers and Students – Chapter 16 – Slide 29/71
IAEA
• The reason for the two view approach is to obtain a geometric mean of
the activity in the field of view that accounts for the movement of activity
between the anterior and posterior surfaces of the body. Relying on a
simple anterior view leads to artefacts due to differential attenuation of the 99mTc gamma rays.
• The data is analysed by drawing ROIs around the organs of interest
(stomach and parts of the gastrointestinal tract) and creating a decay
corrected time–activity curve. An assessment of the gastric emptying
function is made from standard values. An alternative way of expressing
the result is through the half-emptying time.
16.3 IMAGING MEASUREMENTS 16.3.4 Gastric function 16.3.4.1 Stomach emptying of solid and liquid meals
Nuclear Medicine Physics: A Handbook for Teachers and Students – Chapter 16 – Slide 30/71
IAEA
Colonic transport analysis can be performed using 111In
labelled non-absorbable material, such as DTPA or polystyrene
micropellets administered orally. Indium-111 is chosen because
of its longer half-life (2.7 d) and the possibility of imaging over a
longer time since images are taken at, for example, 6, 24, 48 and
72 h.
16.3 IMAGING MEASUREMENTS 16.3.4 Gastric function 16.3.4.2 Analysis of colonic transit
Nuclear Medicine Physics: A Handbook for Teachers and Students – Chapter 16 – Slide 31/71
IAEA
• The geometric mean parametric image of anterior and posterior
views may be used in the quantification.
• A geometric centre of the activity (also called centre of mass)
may be tracked over time by defining particular segments in the
colon, perhaps 5–11 in number (e.g the ascending, transverse,
descending, rectosigmoid and excreted stool), multiplying the
individual segment counts by weighting factors from 1 to 5
respectively, and summing the resulting numbers.
16.3 IMAGING MEASUREMENTS 16.3.4 Gastric function 16.3.4.2 Analysis of colonic transit
Nuclear Medicine Physics: A Handbook for Teachers and Students – Chapter 16 – Slide 32/71
IAEA
In addition to time–activity curves for the individual
segments, the rate of movement of the geometric centre
as a function of time can be assessed by plotting this as
a time position profile. A colonic half-clearance time may
be calculated and compared with historical normal
control values of colonic transport.
16.3 IMAGING MEASUREMENTS 16.3.4 Gastric function 16.3.4.2 Analysis of colonic transit
Nuclear Medicine Physics: A Handbook for Teachers and Students – Chapter 16 – Slide 33/71
IAEA
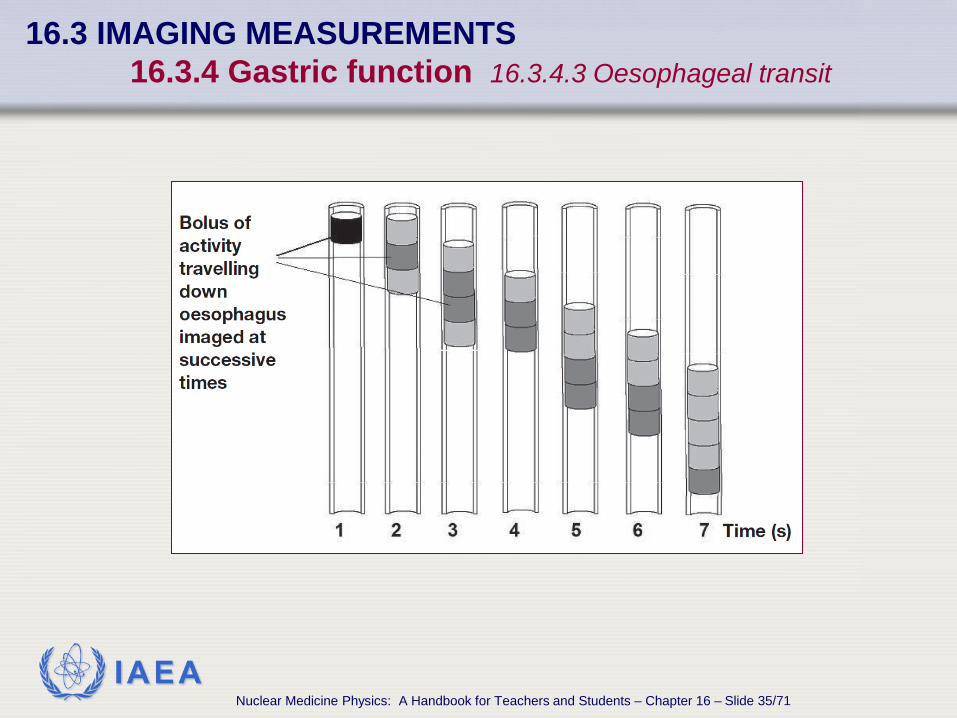
The oesophageal transit is studied by imaging the transit of a bolus of
radiolabelled non-metabolized material such as 99mTc sulphur colloid.
Either the whole oesophagus may be included in an ROI and a time–
activity curve generated for the whole organ, or a special display may be
generated, whereby the counts in successive regions of the oesophagus
are displayed on a 2-D space–time map called a condensed image.
The counts in the regions are displayed in the y direction as colour or grey
scale intensities corresponding to the count rate against time along the x
axis. The result is a pictorial idea of the movement of the bolus down
the oesophagus.
16.3 IMAGING MEASUREMENTS 16.3.4 Gastric function 16.3.4.3 Oesophageal transit
Nuclear Medicine Physics: A Handbook for Teachers and Students – Chapter 16 – Slide 34/71
IAEA
16.3 IMAGING MEASUREMENTS 16.3.4 Gastric function 16.3.4.3 Oesophageal transit
Nuclear Medicine Physics: A Handbook for Teachers and Students – Chapter 16 – Slide 35/71
IAEA
16.3 IMAGING MEASUREMENTS 16.3.4 Gastric function 16.3.4.3 Oesophageal transit
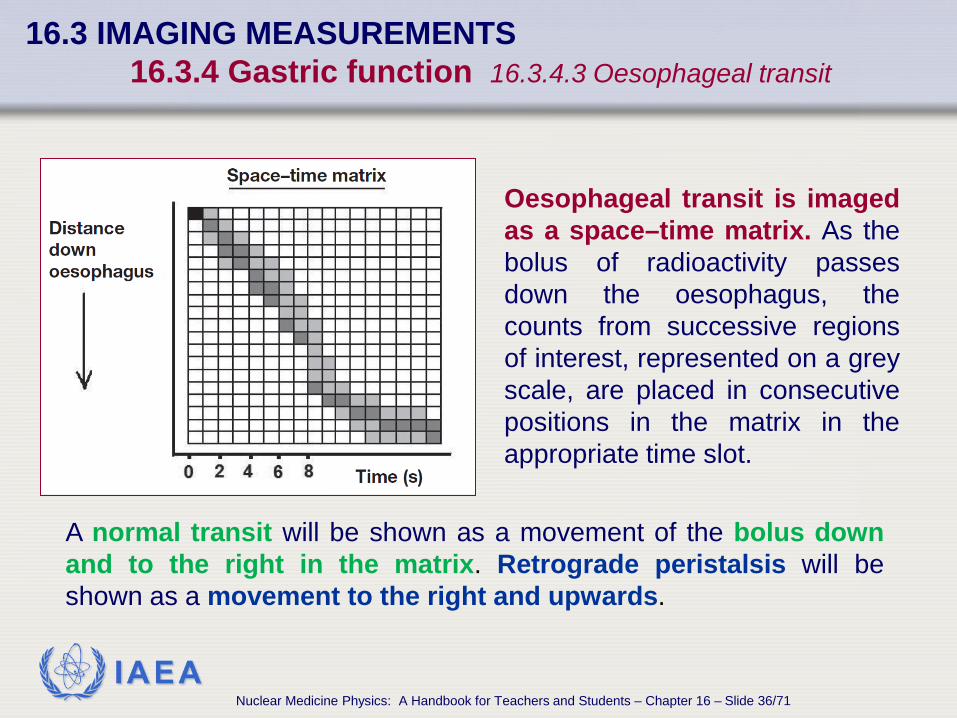
A normal transit will be shown as a movement of the bolus down and to the right in the matrix. Retrograde peristalsis will be shown as a movement to the right and upwards.
Oesophageal transit is imaged as a space–time matrix. As the bolus of radioactivity passes down the oesophagus, the counts from successive regions of interest, represented on a grey scale, are placed in consecutive positions in the matrix in the appropriate time slot.
Nuclear Medicine Physics: A Handbook for Teachers and Students – Chapter 16 – Slide 36/71
IAEA
16.3 IMAGING MEASUREMENTS 16.3.4 Gastric function 16.3.4.4 Gall bladder ejection function
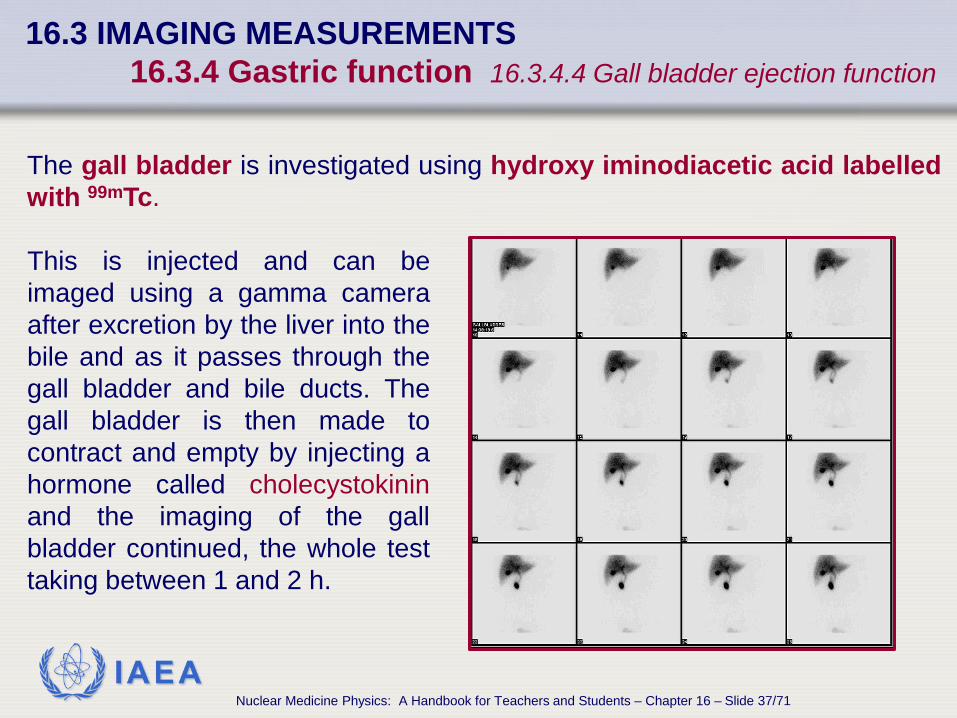
This is injected and can be imaged using a gamma camera after excretion by the liver into the bile and as it passes through the gall bladder and bile ducts. The gall bladder is then made to contract and empty by injecting a hormone called cholecystokinin and the imaging of the gall bladder continued, the whole test taking between 1 and 2 h.
The gall bladder is investigated using hydroxy iminodiacetic acid labelled with 99mTc.
Nuclear Medicine Physics: A Handbook for Teachers and Students – Chapter 16 – Slide 37/71
IAEA
16.3 IMAGING MEASUREMENTS 16.3.4 Gastric function 16.3.4.4 Gall bladder ejection function
The amount of the radiolabel that leaves the gall bladder is assessed
by the difference in counts in the ROI over the emptied gall bladder
divided by the counts from the ROI over the full gall bladder.
Expressed as a percentage, this gives the ejection fraction. An
ejection fraction above 50% is considered as normal and an ejection
fraction below about 35% as abnormal, suggesting, for example,
chronic acalculous cholecystitis.
Nuclear Medicine Physics: A Handbook for Teachers and Students – Chapter 16 – Slide 38/71
IAEA
16.3 IMAGING MEASUREMENTS 16.3.5 Cardiac function
• The two main classes of cardiac function are blood flow in the myocardium and in the blood pool and ventricles.
• Images are acquired in both planar and tomographic modes, and the data may be acquired dynamically over sequential time periods or as a gated study triggered by the electrocardiogram (ECG), or as part of a first-pass study.
• The information is presented on a global or regional basis as conventional or parametric images, or as curves from which quantitative parameters may be derived.
• A range of pharmaceutical agents labelled with single and positron emitting isotopes are used.
Nuclear Medicine Physics: A Handbook for Teachers and Students – Chapter 16 – Slide 39/71
IAEA
16.3 IMAGING MEASUREMENTS 16.3.5 Cardiac function
• myocardial perfusion
• myocardial metabolism of
glucose and fatty acids
• myocardial receptors
• left ventricular ejection fraction
• first-pass shunt analysis
• wall motion and thickness
• stroke volumes
Cardiac functions that may be investigated:
• cardiac output and its
fractionation
• circulation times
• systolic emptying rate
• diastolic filling rate
• time to peak filling or emptying
rate
• regional oxygen utilization
Nuclear Medicine Physics: A Handbook for Teachers and Students – Chapter 16 – Slide 40/71
IAEA
16.3 IMAGING MEASUREMENTS 16.3.5 Cardiac function
Commercial suite of programmes will
usually only offer a limited selection of
functional analysis. Typically, these
include blood pool gated planar or SPECT
analysis for ventricular volumes and
ejection fractions, and cardiac perfusion
analysis of gated SPECT images acquired
under stress/rest conditions.
Nuclear Medicine Physics: A Handbook for Teachers and Students – Chapter 16 – Slide 41/71
IAEA
16.3 IMAGING MEASUREMENTS 16.3.5 Cardiac function
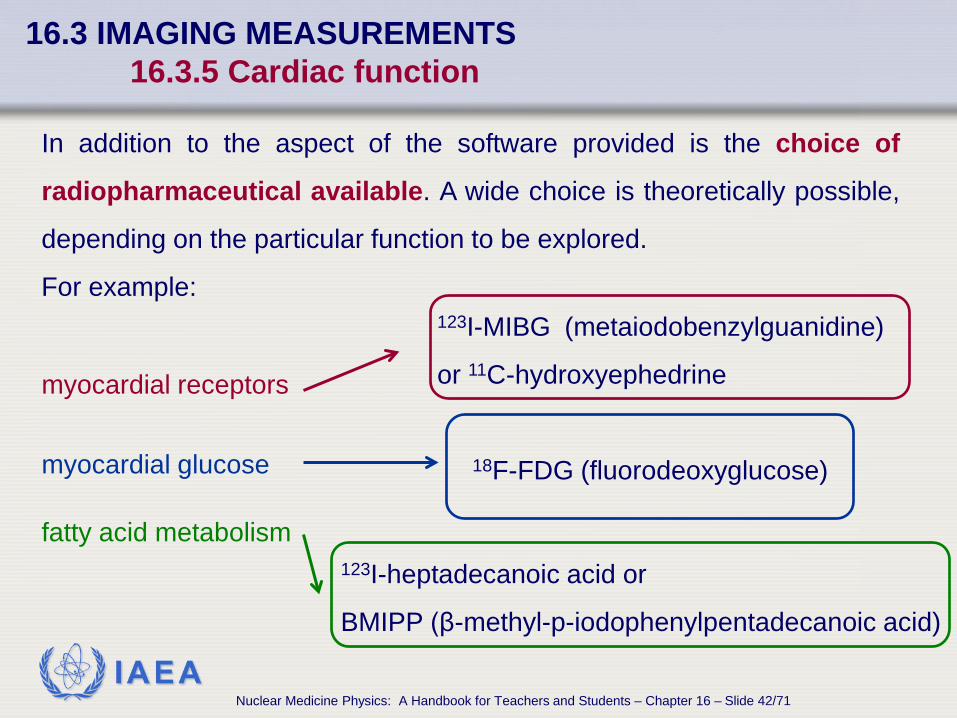
In addition to the aspect of the software provided is the choice of
radiopharmaceutical available. A wide choice is theoretically possible,
depending on the particular function to be explored.
For example:
123I-heptadecanoic acid or
BMIPP (β-methyl-p-iodophenylpentadecanoic acid)
myocardial receptors
myocardial glucose
fatty acid metabolism
123I-MIBG (metaiodobenzylguanidine)
or 11C-hydroxyephedrine
18F-FDG (fluorodeoxyglucose)
Nuclear Medicine Physics: A Handbook for Teachers and Students – Chapter 16 – Slide 42/71
IAEA
16.3 IMAGING MEASUREMENTS 16.3.5 Cardiac function
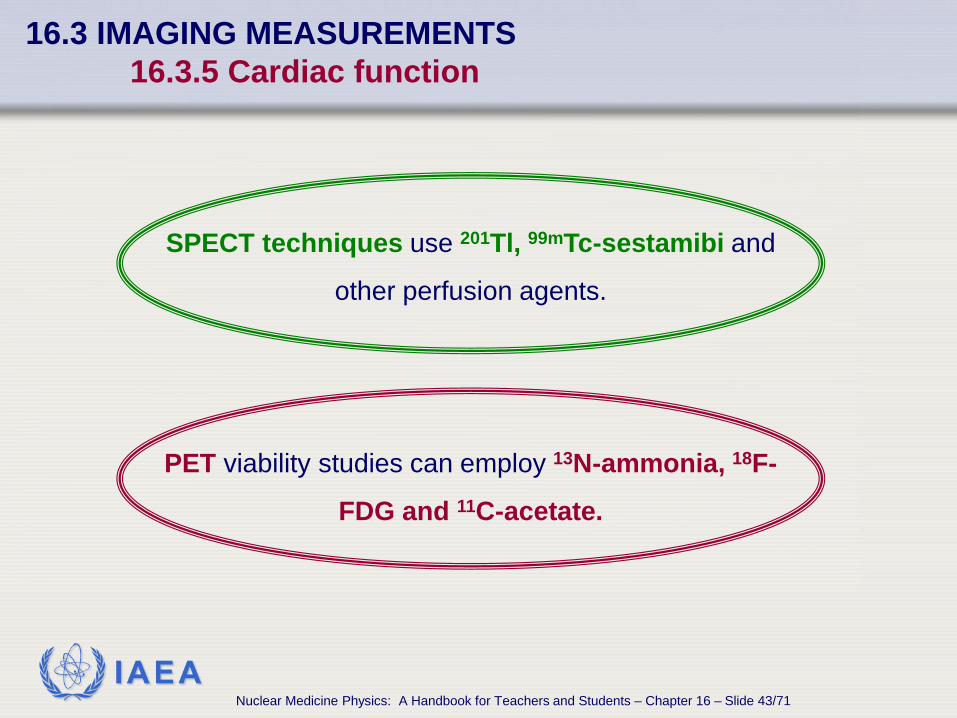
SPECT techniques use 201Tl, 99mTc-sestamibi and
other perfusion agents.
PET viability studies can employ 13N-ammonia, 18F-
FDG and 11C-acetate.
Nuclear Medicine Physics: A Handbook for Teachers and Students – Chapter 16 – Slide 43/71
IAEA
16.3 IMAGING MEASUREMENTS 16.3.5 Cardiac function 16.3.5.2 First-pass angiography
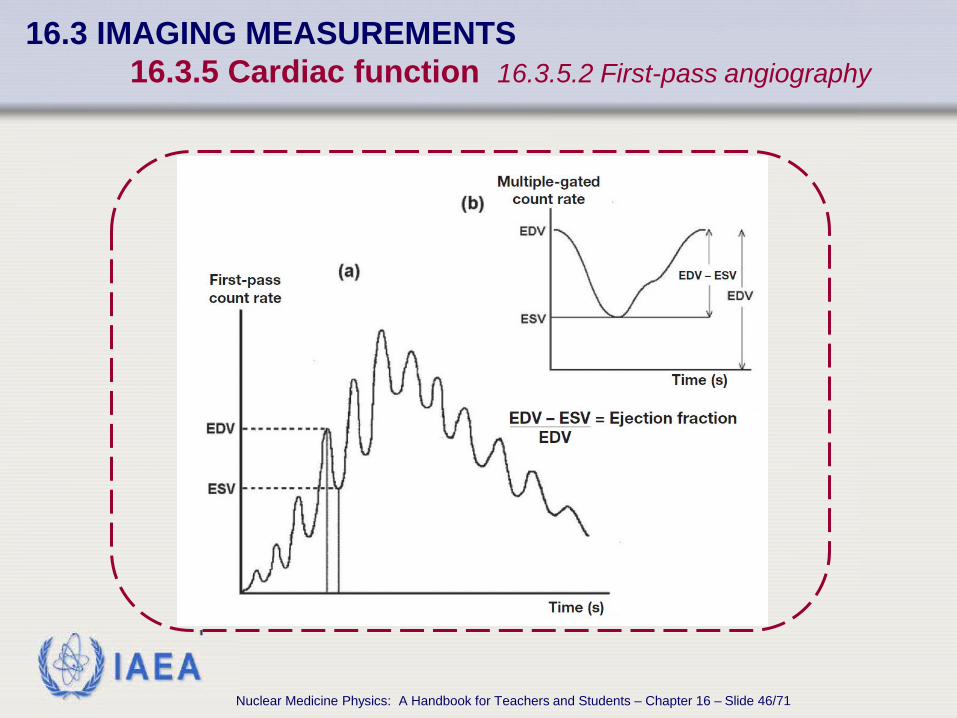
First-pass studies typically involve the acquisition of about 2000
frames of data at a duration of ~ 50 ms following the bolus
injection of autologous red blood cells labelled in vivo or in
vitro with 99mTc as they pass through the right ventricle for the first
time. A time–activity curve derived from an ROI over the
ventricle shows a curve that rises to a peak and then falls off, the
curve also showing a saw tooth pattern corresponding to the
filling and emptying of the left ventricle during the cardiac
cycle.
Nuclear Medicine Physics: A Handbook for Teachers and Students – Chapter 16 – Slide 44/71
IAEA
16.3 IMAGING MEASUREMENTS 16.3.5 Cardiac function 16.3.5.2 First-pass angiography
• By suitable positioning of the gamma camera in the right anterior
oblique view, this saw tooth can be used as an estimate of ejection
fraction in the right ventricle, a parameter that is only amenable to
analysis in the first pass before uptake in adjoining structures.
• The ejection fraction is derived from the ratio of the peak of any
saw tooth (the end diastolic volume (EDV)) minus the value of the
next trough (the end systolic volume (ESV)) to the EDV. The
ejection fraction for the left ventricle would be assessed from the
curve obtained by viewing in the left anterior oblique position.
Nuclear Medicine Physics: A Handbook for Teachers and Students – Chapter 16 – Slide 45/71
IAEA
16.3 IMAGING MEASUREMENTS 16.3.5 Cardiac function 16.3.5.2 First-pass angiography
Nuclear Medicine Physics: A Handbook for Teachers and Students – Chapter 16 – Slide 46/71
IAEA
• Although this parameter is more reliably obtained from a
MUGA study, the first-pass procedure is much quicker and
may be suitable for patients who cannot tolerate the much longer
MUGA study.
• First-pass kinetics also provide a measure of left to right cardiac
shunts and the pulmonary systemic flow ratio, as well as systolic
emptying and diastolic filling rates and ventricular volumes.
16.3 IMAGING MEASUREMENTS 16.3.5 Cardiac function 16.3.5.2 First-pass angiography
Nuclear Medicine Physics: A Handbook for Teachers and Students – Chapter 16 – Slide 47/71
IAEA
16.3 IMAGING MEASUREMENTS 16.3.5 Cardiac function 16.3.5.3 The multiple-gated acquisition scan MUGA
• The MUGA scan traces heart muscle activity from the distribution of the administered radiopharmaceutical, allowing the calculation of the left ventricular ejection fraction and demonstrating myocardial wall motion.
• It may be obtained while the patient is at rest and after physically or pharmacologically induced stress.
• Autologous red blood cells labelled in vivo or in vitro with 99mTc are injected as a bolus.
• The γ-camera views the patient in the left anterior oblique position so as to best separate the projections of the two ventricles.
Nuclear Medicine Physics: A Handbook for Teachers and Students – Chapter 16 – Slide 48/71
IAEA
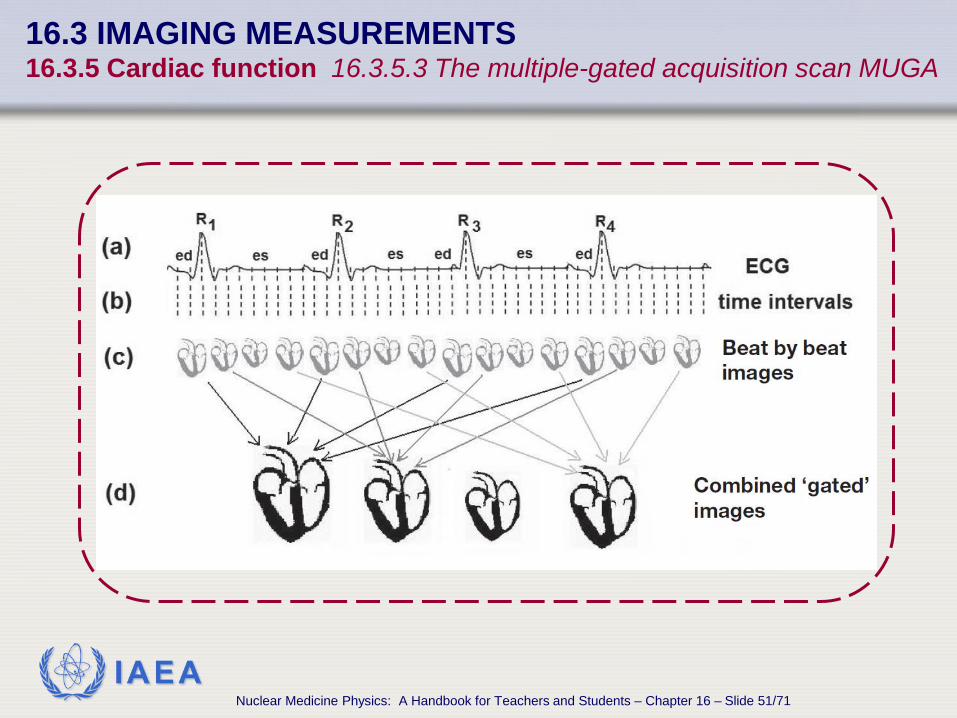
Dynamic images of the left ventricle in a beating heart are acquired
at the same time as the ECG and the results stored. A trigger (gating
signal) corresponding to the R wave marks the start of each heart cycle
and the start of each sequence of images. The time period between
successive R waves (R–R interval) is divided into time intervals and the
beat by beat left ventricular images corresponding to each time interval
are each integrated into a single combined ‘gated’ image that provides a
stop motion image of the heart at intervals in its cycle.
16.3 IMAGING MEASUREMENTS 16.3.5 Cardiac function 16.3.5.3 The multiple-gated acquisition scan MUGA
Nuclear Medicine Physics: A Handbook for Teachers and Students – Chapter 16 – Slide 49/71
IAEA
• As any one frame would not have enough data to provide sufficient counts and would, therefore, be statistically unreliable, many frames at the same interval are superimposed on each other.
• The signal for the start of each sequence is derived from an ECG monitor connected to the patient that provides a short electronic pulse as it detects the peak of an R wave. Usually, about 32 equally time-spaced frames (multiple gates) are used and these are defined between each R–R interval. Beats within 10% of the mean length are accepted.
• The result is a series of images of the heart at end diastole and at end systole, and at stages in between.
16.3 IMAGING MEASUREMENTS 16.3.5 Cardiac function 16.3.5.3 The multiple-gated acquisition scan MUGA
Nuclear Medicine Physics: A Handbook for Teachers and Students – Chapter 16 – Slide 50/71
IAEA
16.3 IMAGING MEASUREMENTS 16.3.5 Cardiac function 16.3.5.3 The multiple-gated acquisition scan MUGA
Nuclear Medicine Physics: A Handbook for Teachers and Students – Chapter 16 – Slide 51/71
IAEA
• The image at end diastole when the heart has filled with blood
contains the maximum number of counts, and the end systolic
image the least number.
• A direct relationship is made between the number of counts in a
region of the ventricle and its volume.
• For each frame, the computer, starting with an initial rough outline
provided by the operator, defines the boundary of the left ventricle.
16.3 IMAGING MEASUREMENTS 16.3.5 Cardiac function 16.3.5.3 The multiple-gated acquisition scan MUGA
Nuclear Medicine Physics: A Handbook for Teachers and Students – Chapter 16 – Slide 52/71
IAEA
Depending on the computer programme used, a
different method of edge detection may be employed:
• isocount contour
• maximum slope normal to the edge.
As there is interference with the ventricular image from
activity seen in pulmonary blood, the computer will also
define a suitable background ROI close to the wall and
correct the ventricular image at each stage.
16.3 IMAGING MEASUREMENTS 16.3.5 Cardiac function 16.3.5.3 The multiple-gated acquisition scan MUGA
Nuclear Medicine Physics: A Handbook for Teachers and Students – Chapter 16 – Slide 53/71
IAEA
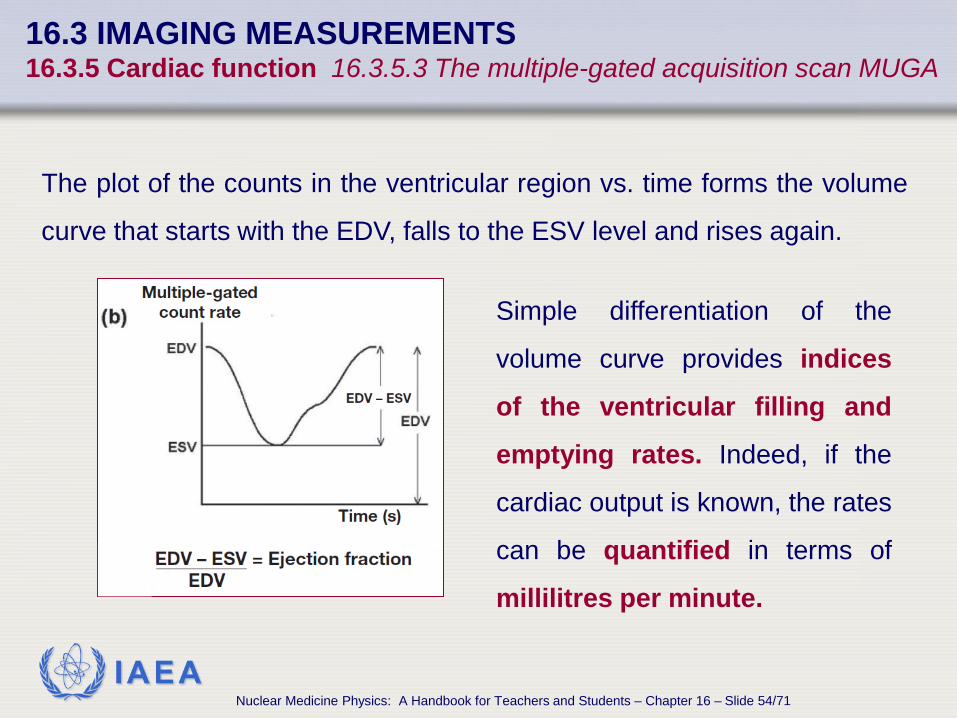
The plot of the counts in the ventricular region vs. time forms the volume
curve that starts with the EDV, falls to the ESV level and rises again.
Simple differentiation of the
volume curve provides indices
of the ventricular filling and
emptying rates. Indeed, if the
cardiac output is known, the rates
can be quantified in terms of
millilitres per minute.
16.3 IMAGING MEASUREMENTS 16.3.5 Cardiac function 16.3.5.3 The multiple-gated acquisition scan MUGA
Nuclear Medicine Physics: A Handbook for Teachers and Students – Chapter 16 – Slide 54/71
IAEA
16.3 IMAGING MEASUREMENTS 16.3.5 Cardiac function 16.3.5.4 Myocardial perfusion imaging
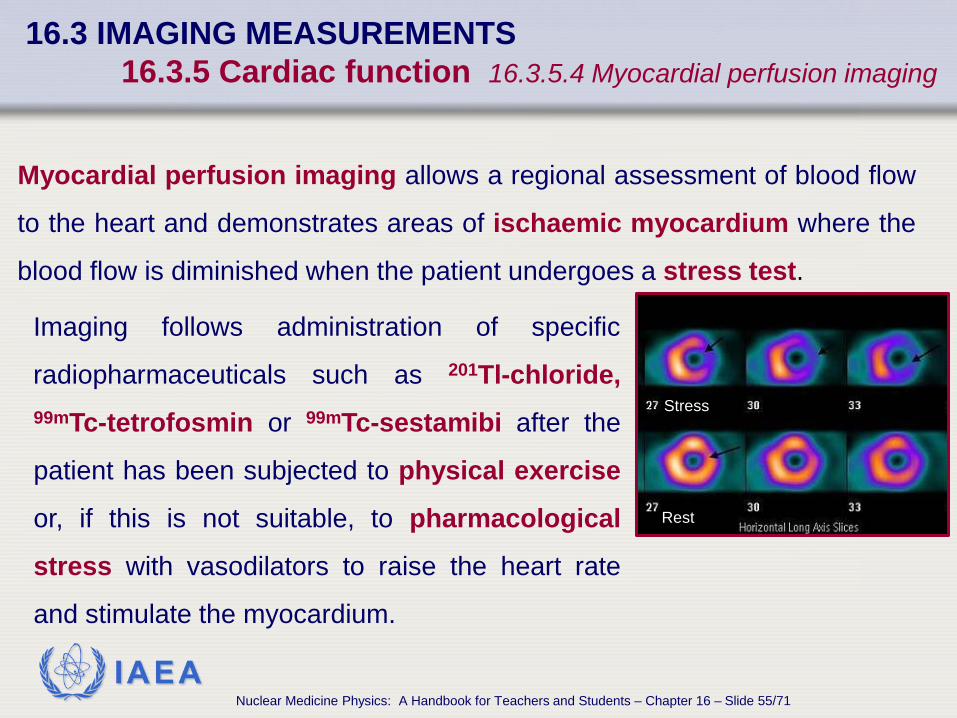
Myocardial perfusion imaging allows a regional assessment of blood flow
to the heart and demonstrates areas of ischaemic myocardium where the
blood flow is diminished when the patient undergoes a stress test.
Imaging follows administration of specific
radiopharmaceuticals such as 201Tl-chloride, 99mTc-tetrofosmin or 99mTc-sestamibi after the
patient has been subjected to physical exercise
or, if this is not suitable, to pharmacological
stress with vasodilators to raise the heart rate
and stimulate the myocardium.
Rest
Stress
Nuclear Medicine Physics: A Handbook for Teachers and Students – Chapter 16 – Slide 55/71
IAEA
It is also possible to use β+ emitting radiopharmaceuticals
such as
• 13N-ammonia (10 min half-life, produced by cyclotron)
• 82Rb (75 s half-life, produced by generator).
16.3 IMAGING MEASUREMENTS 16.3.5 Cardiac function 16.3.5.4 Myocardial perfusion imaging
Nuclear Medicine Physics: A Handbook for Teachers and Students – Chapter 16 – Slide 56/71
IAEA
• Once a stable ECG pattern is observed, the patient is imaged using a γ-
camera operating in SPECT mode
• ECG gating is applied throughout and produces sets of 16 images at
each acquisition angle
• The stress images and their analysis may be compared with similar ones
obtained with the patient at rest.
• Different protocols (times of examination, radiopharmaceutical) have
been devised to carry out the stress/rest examinations in one/two days,
given the potential long washout periods involved.
16.3 IMAGING MEASUREMENTS 16.3.5 Cardiac function 16.3.5.4 Myocardial perfusion imaging
Nuclear Medicine Physics: A Handbook for Teachers and Students – Chapter 16 – Slide 57/71
IAEA
Imaging can be performed ‘early’ (at ~ 15 min) following injection of 201Tl or 99mTc-sestamibi at rest or after the stress test and/or ‘delayed’ (after 1–4 h
or after 24 h) after injection at rest or under stress of the longer lived 201Tl.
These protocols give rise to different types of image.
In general, the imaging properties of 99mTc give superior images, though 201Tl is superior from a physiological viewpoint as it is a better
potassium analogue.
16.3 IMAGING MEASUREMENTS 16.3.5 Cardiac function 16.3.5.4 Myocardial perfusion imaging
Nuclear Medicine Physics: A Handbook for Teachers and Students – Chapter 16 – Slide 58/71
IAEA
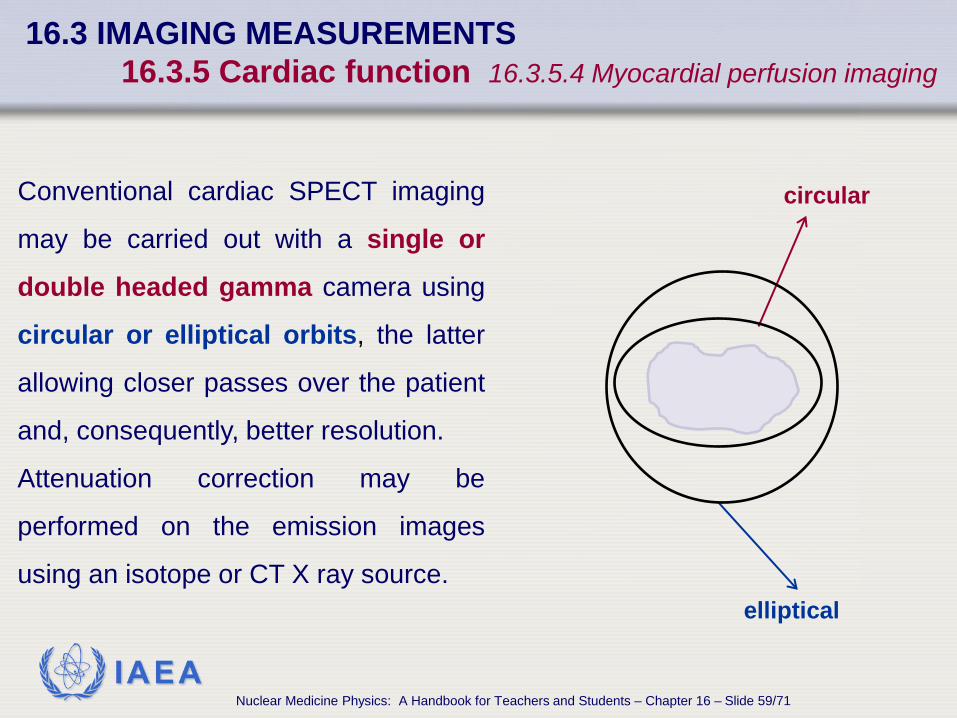
Conventional cardiac SPECT imaging
may be carried out with a single or
double headed gamma camera using
circular or elliptical orbits, the latter
allowing closer passes over the patient
and, consequently, better resolution.
Attenuation correction may be
performed on the emission images
using an isotope or CT X ray source.
circular
elliptical
16.3 IMAGING MEASUREMENTS 16.3.5 Cardiac function 16.3.5.4 Myocardial perfusion imaging
Nuclear Medicine Physics: A Handbook for Teachers and Students – Chapter 16 – Slide 59/71
IAEA
16.3 IMAGING MEASUREMENTS 16.3.5 Cardiac function 16.3.5.5 Technical aspects of SPECT and PET
There are different sources of degradation of the image quality in SPECT.
Attenuation: Thallium is not an ideal γ camera imaging radionuclide; it emits low energy characteristic X rays between 69 and 80 keV that are easily attenuated and, therefore, lost in the body. The attenuation varies for the different projections around the body and gives rise to artefacts in the perfusion images if not corrected. The 140 keV γ energy of 99mTc, while still liable to attenuation, allows better collection of data from the heart and less variation in the attenuation. SPECT/CT would be a better option for attenuation correction than the isotope attenuation correction devices that have been used in the past.
Nuclear Medicine Physics: A Handbook for Teachers and Students – Chapter 16 – Slide 60/71
IAEA
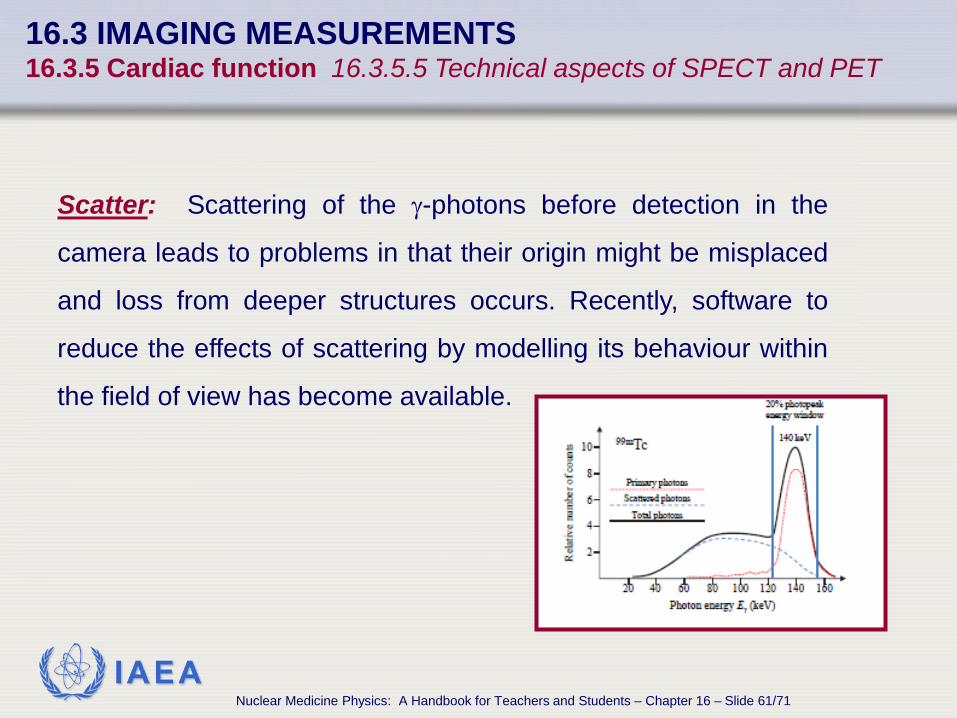
Scatter: Scattering of the γ-photons before detection in the
camera leads to problems in that their origin might be misplaced
and loss from deeper structures occurs. Recently, software to
reduce the effects of scattering by modelling its behaviour within
the field of view has become available.
16.3 IMAGING MEASUREMENTS 16.3.5 Cardiac function 16.3.5.5 Technical aspects of SPECT and PET
Nuclear Medicine Physics: A Handbook for Teachers and Students – Chapter 16 – Slide 61/71
IAEA
Resolution: Another source of degradation of the image quality is
the loss of resolution with distance from the collimator face.
Although ‘high’ resolution collimators are usually chosen for 99mTc
imaging, the basic resolution of the camera at the level of the heart
is rather poor. Again, software techniques to model this behaviour
and correct for it have become available.
16.3 IMAGING MEASUREMENTS 16.3.5 Cardiac function 16.3.5.5 Technical aspects of SPECT and PET
Nuclear Medicine Physics: A Handbook for Teachers and Students – Chapter 16 – Slide 62/71
IAEA
Statistic: γ-camera images, are always subject to lack of counts and are,
therefore, prone to statistical errors. Using a double headed rather than a
single headed system is, therefore, an advantage. There is still discussion
on the best angle between the heads and this may vary between less than
90° and 180°. Scanning the patient with the collimator as close to the
source of activity as possible also ensures the best resolution, so a non-
circular orbit is usually chosen. Owing to the lack of accessible counts with 201Tl, a general purpose collimator is used, which is more efficient but less
accurate than the high resolution collimator used with 99mTc.
16.3 IMAGING MEASUREMENTS 16.3.5 Cardiac function 16.3.5.5 Technical aspects of SPECT and PET
Nuclear Medicine Physics: A Handbook for Teachers and Students – Chapter 16 – Slide 63/71
IAEA
PET: PET imaging is more sensitive and more accurate
(better resolution) than SPECT and uptake of the
radiopharmaceuticals can be quantified absolutely.
In theory, the use of 13N labelled ammonia and 18F-FDG
can differentiate more about the state of the myocardium,
its blood flow and metabolism, than the SPECT tracers.
16.3 IMAGING MEASUREMENTS 16.3.5 Cardiac function 16.3.5.5 Technical aspects of SPECT and PET
Nuclear Medicine Physics: A Handbook for Teachers and Students – Chapter 16 – Slide 64/71
IAEA
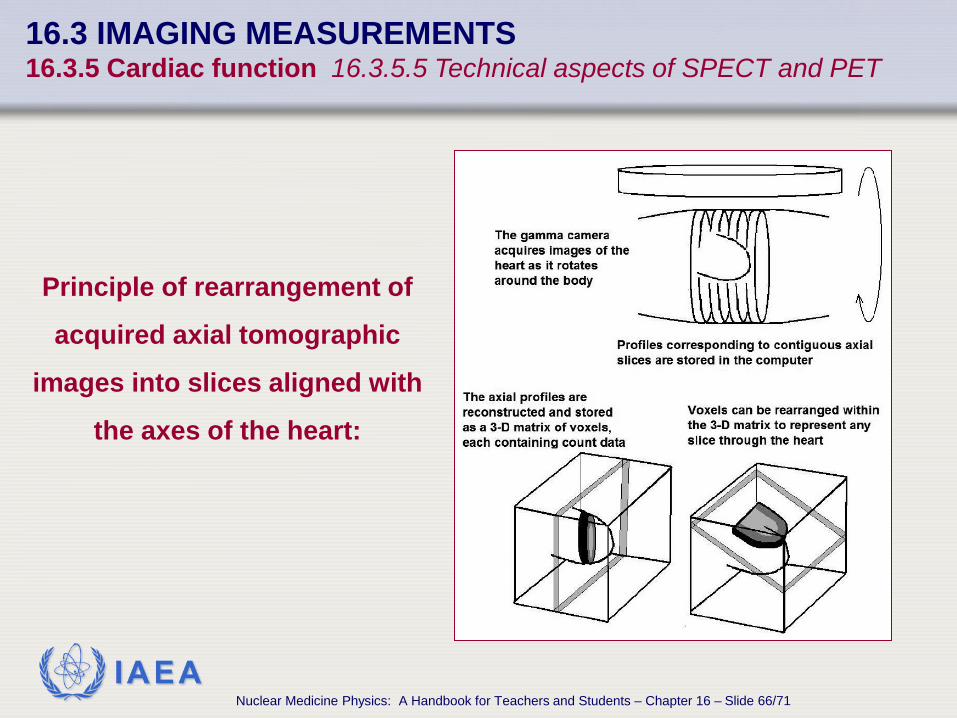
Reorientation: As the heart lies at an angle to this body axis, a
process of reorientation is performed. From the original matrix, the
data that lay parallel to the axes of the heart itself can be selected to
form vertical long axis (parallel to the long axis of the left ventricle
and perpendicular to the septum), horizontal long axis (parallel to
the long axis of the left ventricle and to the septum) and short axis
(perpendicular to the long axis of the left ventricle) slices through
the myocardium of the particular patient
16.3 IMAGING MEASUREMENTS 16.3.5 Cardiac function 16.3.5.5 Technical aspects of SPECT and PET
Nuclear Medicine Physics: A Handbook for Teachers and Students – Chapter 16 – Slide 65/71
IAEA
Principle of rearrangement of
acquired axial tomographic
images into slices aligned with
the axes of the heart:
16.3 IMAGING MEASUREMENTS 16.3.5 Cardiac function 16.3.5.5 Technical aspects of SPECT and PET
Nuclear Medicine Physics: A Handbook for Teachers and Students – Chapter 16 – Slide 66/71
IAEA
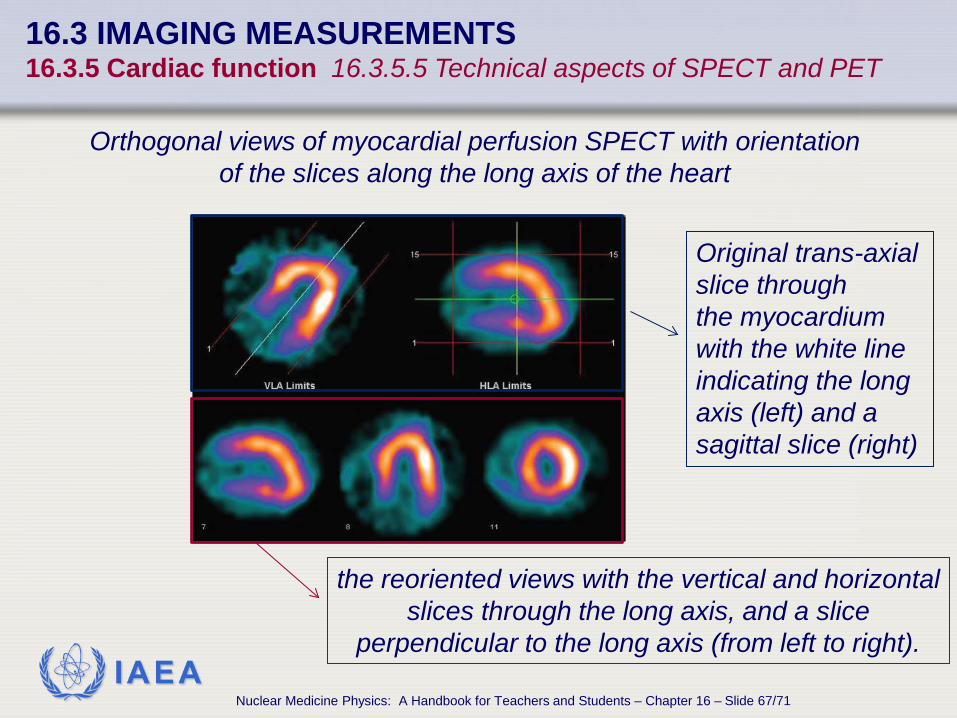
Original trans-axial slice through the myocardium with the white line indicating the long axis (left) and a sagittal slice (right)
Orthogonal views of myocardial perfusion SPECT with orientation of the slices along the long axis of the heart
the reoriented views with the vertical and horizontal slices through the long axis, and a slice
perpendicular to the long axis (from left to right).
16.3 IMAGING MEASUREMENTS 16.3.5 Cardiac function 16.3.5.5 Technical aspects of SPECT and PET
Nuclear Medicine Physics: A Handbook for Teachers and Students – Chapter 16 – Slide 67/71
IAEA
Cardiac processing software, working on features extracted from the
shape of the myocardium, allows easy automatic alignment which may
also be operator guided. The reoriented sections form three sets of
images that are displayed in a standard format to show, for example, the
apex and heart surfaces at each stage of gating of the heart cycle.
Presentation of the slice data is often as a so-called polar diagram or
bull’s-eye display, this allows the 3-D information about the
myocardium, which would be difficult to interpret easily, to be depicted as
a simple, 2-D, colour coded, semi-quantitative image.
16.3 IMAGING MEASUREMENTS 16.3.5 Cardiac function 16.3.5.5 Technical aspects of SPECT and PET
Nuclear Medicine Physics: A Handbook for Teachers and Students – Chapter 16 – Slide 68/71
IAEA
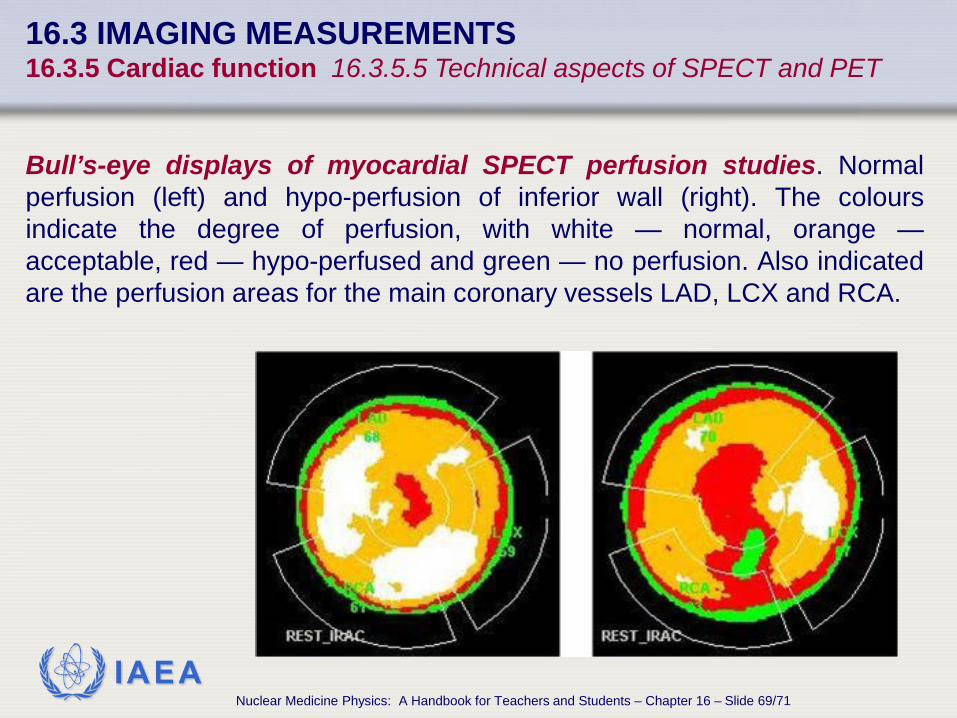
Bull’s-eye displays of myocardial SPECT perfusion studies. Normal perfusion (left) and hypo-perfusion of inferior wall (right). The colours indicate the degree of perfusion, with white — normal, orange — acceptable, red — hypo-perfused and green — no perfusion. Also indicated are the perfusion areas for the main coronary vessels LAD, LCX and RCA.
16.3 IMAGING MEASUREMENTS 16.3.5 Cardiac function 16.3.5.5 Technical aspects of SPECT and PET
Nuclear Medicine Physics: A Handbook for Teachers and Students – Chapter 16 – Slide 69/71
IAEA
The process is often described as imagining the myocardial surface as the peel of half an orange which is flattened out to form the polar diagram. This is divided into accepted segments and values, and colours associated with each segment.
There is a variation of the exact form and mathematical basis of the polar diagram in the commercial products available. This results in different looking maps that, although individually validated, are not directly comparable.
It would, therefore, be prudent for one software package to be standardized at any one reporting centre. The results from a particular study can be compared with a reference image derived from a so-called normal database to allow a better estimation of the extent of the defects.
16.3 IMAGING MEASUREMENTS 16.3.5 Cardiac function 16.3.5.5 Technical aspects of SPECT and PET
Nuclear Medicine Physics: A Handbook for Teachers and Students – Chapter 16 – Slide 70/71
IAEA
CHAPTER 16 BIBLIOGRAPHY
• PETERS, A.M., MYERS, M.J., Physiological Measurements with Radionuclides in Clinical Practice, Oxford University Press, Oxford (1998).
• ZIESSMAN, H.A., O’MALLEY, J.P., THRALL, J.H., Nuclear Medicine — The Requisites, 3rd edn, Mosby-Elsevier (2006).
FURTHER READING
Recommended methods for investigating many of these functions may be found on the web sites of the American Society of Nuclear Medicine (www.snm.org), the British Nuclear Medicine Society (www.bnms.org.uk) and the International Committee for Standardization in Haematology (http://www.islh.org/web/published-standards.php).
Nuclear Medicine Physics: A Handbook for Teachers and Students – Chapter 16 – Slide 71/71