Embed Size (px)
Citation preview
139SF-36 Health Status Questionnaire: Demographic
Chapter 10: SF-36 Health Status Questionnaire:Demographic and Socioeconomic Variables
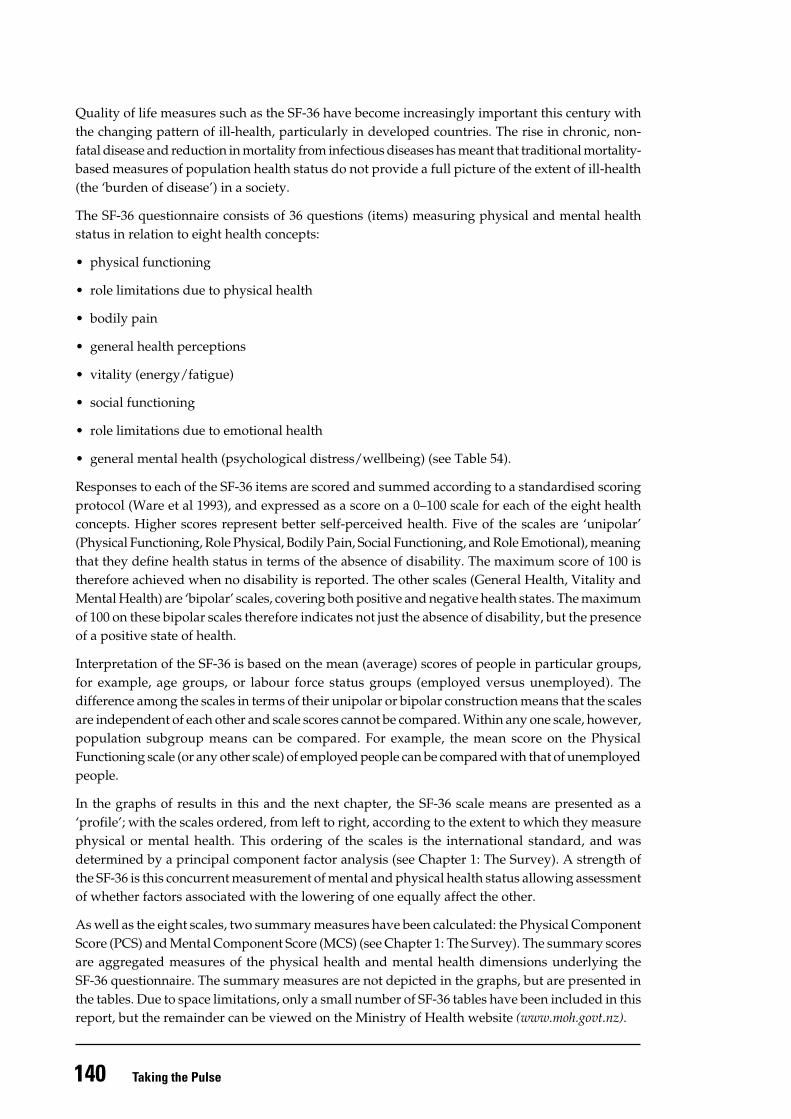
Key points
IntroductionThe SF-36 is a standardised questionnaire derived from a larger set of questions used in the USMedical Outcomes Study in the mid-1980s (Ware and Sherbourne 1992). The SF-36 has becomeone of the most widely used of the health-related quality of life measures. These are generic,multi-dimensional measures of self-reported health status. Self-reported health measures, basedon individuals’ own perception of their health status and functioning, are an alternative measureto the more traditional objective measures of health, such as mortality rates and hospitalisationrecords. Self-reported health measures introduce an element of subjectivity into health statusmeasurement. This is useful in providing a more ‘consumer-centred’ view of health, and placesthe measurement emphasis on quality of life or wellbeing.
• The SF-36 is a widely used questionnaire for measuring self-reported physical andmental health status.
• The New Zealand population showed higher levels of self-reported health (higher SF-36 mean scores) in comparison with overseas general population norms.
• Males scored slightly, but significantly, higher than women on most scales, particularlythose most related to mental health.
• Age had a profound effect on self-reported health, with scores on all scales except theMental Health scale decreasing with increasing age.
• European/Päkehä rated their health somewhat, but not substantially, higher than eitherMäori or Pacific people; the latter two groups did not significantly differ from eachother.
• Those with school, or school and post-school qualifications, generally had better self-reported health status than those with no school qualifications. Educational statusimpacted on mental health status in females, but not males.
• SF-36 scores tended to increase with family income, though not for all scales, or for allpopulations groups. The most pronounced gradient of increasing scores with incomesoccurred in non-Mäori males, and the least pronounced in Mäori females.
• Those who were employed typically showed better self-reported physical and mentalhealth than those unemployed, or not in the labour force. This pattern did not hold forMäori males.
• Non-Mäori, particularly non-Mäori females, showed higher SF-36 scores in associationwith lower levels of deprivation (as indexed by NZDep96 scores). Mäori showed noclear relationship between the SF-36 and the deprivation index.
140 Taking the Pulse
Quality of life measures such as the SF-36 have become increasingly important this century withthe changing pattern of ill-health, particularly in developed countries. The rise in chronic, non-fatal disease and reduction in mortality from infectious diseases has meant that traditional mortality-based measures of population health status do not provide a full picture of the extent of ill-health(the ‘burden of disease’) in a society.
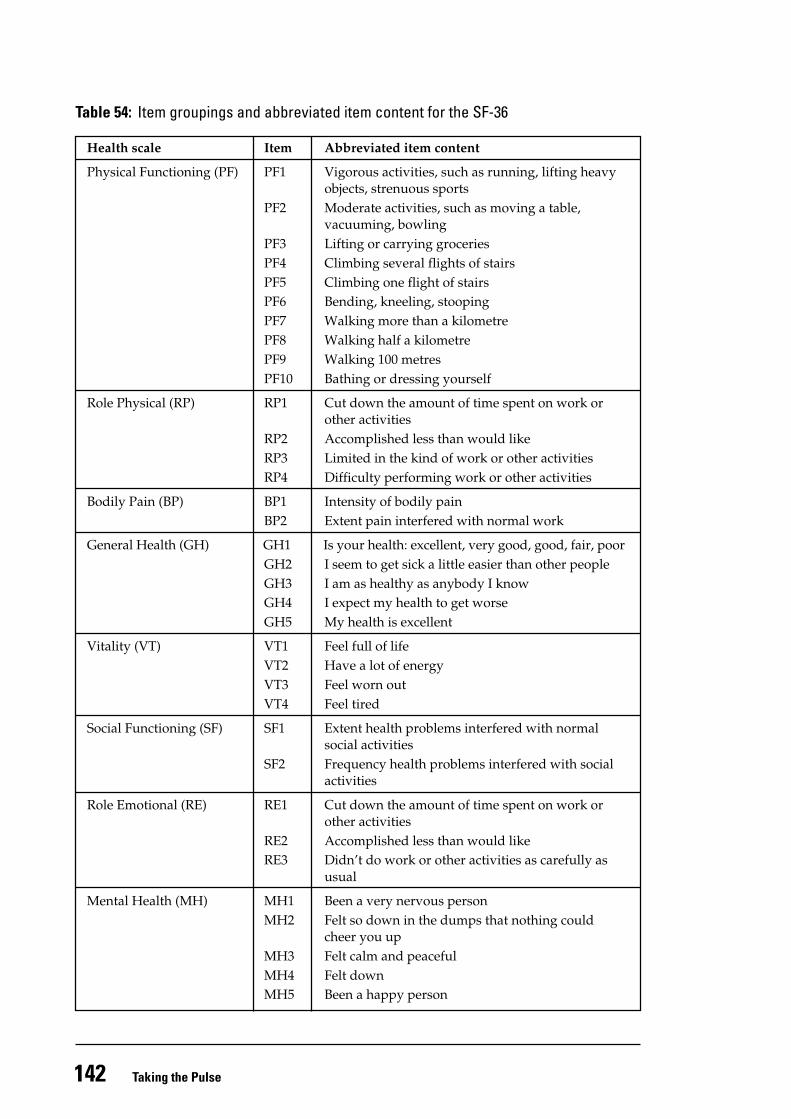
The SF-36 questionnaire consists of 36 questions (items) measuring physical and mental healthstatus in relation to eight health concepts:
• physical functioning
• role limitations due to physical health
• bodily pain
• general health perceptions
• vitality (energy/fatigue)
• social functioning
• role limitations due to emotional health
• general mental health (psychological distress/wellbeing) (see Table 54).
Responses to each of the SF-36 items are scored and summed according to a standardised scoringprotocol (Ware et al 1993), and expressed as a score on a 0–100 scale for each of the eight healthconcepts. Higher scores represent better self-perceived health. Five of the scales are ‘unipolar’(Physical Functioning, Role Physical, Bodily Pain, Social Functioning, and Role Emotional), meaningthat they define health status in terms of the absence of disability. The maximum score of 100 istherefore achieved when no disability is reported. The other scales (General Health, Vitality andMental Health) are ‘bipolar’ scales, covering both positive and negative health states. The maximumof 100 on these bipolar scales therefore indicates not just the absence of disability, but the presenceof a positive state of health.
Interpretation of the SF-36 is based on the mean (average) scores of people in particular groups,for example, age groups, or labour force status groups (employed versus unemployed). Thedifference among the scales in terms of their unipolar or bipolar construction means that the scalesare independent of each other and scale scores cannot be compared. Within any one scale, however,population subgroup means can be compared. For example, the mean score on the PhysicalFunctioning scale (or any other scale) of employed people can be compared with that of unemployedpeople.
In the graphs of results in this and the next chapter, the SF-36 scale means are presented as a‘profile’; with the scales ordered, from left to right, according to the extent to which they measurephysical or mental health. This ordering of the scales is the international standard, and wasdetermined by a principal component factor analysis (see Chapter 1: The Survey). A strength ofthe SF-36 is this concurrent measurement of mental and physical health status allowing assessmentof whether factors associated with the lowering of one equally affect the other.
As well as the eight scales, two summary measures have been calculated: the Physical ComponentScore (PCS) and Mental Component Score (MCS) (see Chapter 1: The Survey). The summary scoresare aggregated measures of the physical health and mental health dimensions underlying theSF-36 questionnaire. The summary measures are not depicted in the graphs, but are presented inthe tables. Due to space limitations, only a small number of SF-36 tables have been included in thisreport, but the remainder can be viewed on the Ministry of Health website (www.moh.govt.nz).
141SF-36 Health Status Questionnaire: Demographic
This is the first time the SF-36 has been used on a national sample in New Zealand. The populationmean scores (norms) presented below provide baseline scores for population health monitoring,so that with repetition of the SF-36 in future national surveys the self-reported health status ofpopulation subgroups can be compared over time. The norms also provide benchmarks (standardsfor comparison) for smaller New Zealand studies using the SF-36, such as clinical or regionalstudies. The analyses presented in this report can therefore form the basis for formulating andevaluating public health policy and programmes, assist in identifying priority populations andguide the targeting of resources. This use of the SF-36 on a national scale also provides theopportunity for international comparisons via a standardised instrument.
A comprehensive psychometric analysis of the acceptability (in terms of the level of missing data),reliability and construct validity of the SF-36 in the New Zealand population was undertaken aspart of the SF-36 analysis. The results indicated that in the New Zealand population as a whole,the SF-36 performed as well or better than in other countries (Scott et al, in press). However, theconstruct validity of the SF-36 (the extent to which the questionnaire measures the health constructsit aims to measure) may be questionable amongst Pacific people, and older Mäori (Scott et al1999). A summary of some of the results from the psychometric analysis, together with the frequencydistributions of the eight scales, can be found in Appendix 3: Psychometric Properties of the SF-36.
The version of the SF-36 used in this survey was the Australian and New Zealand adaptation,which differs only in minor respects from the original. The survey participants completed theSF-36 themselves, at the end of the face-to-face interview that collected the information coveredelsewhere in this report. The SF-36 was administered only to adults (aged 15 years and over).
The SF-36 results that follow are presented separately for males and females, and Mäori and non-Mäori (see Chapter 1: The Survey). SF-36 results for Pacific people are provided in the analysis ofSF-36 by ethnic group (European/Päkehä; Mäori and Pacific people). The further stratification ofall other SF-36 analyses (for example, SF-36 by family income) by ethnic groups other than Mäoriand non-Mäori was not possible due to the smaller size of the Pacific and Other ethnic groupsamples.
For these SF-36 chapters, a summary box has been included at the beginning of each subsection.Because the SF-36 results are presented for both males and females within Mäori and non-Mäorigroups, and eight SF-36 scales within each of these subgroups, there is a considerable volume ofdata being presented, and the summary boxes are intended to assist in highlighting the key featuresof the results.
142 Taking the Pulse
Table 54: Item groupings and abbreviated item content for the SF-36
Health scale Item Abbreviated item content
Physical Functioning (PF) PF1 Vigorous activities, such as running, lifting heavyobjects, strenuous sports
PF2 Moderate activities, such as moving a table,vacuuming, bowling
PF3 Lifting or carrying groceriesPF4 Climbing several flights of stairsPF5 Climbing one flight of stairsPF6 Bending, kneeling, stoopingPF7 Walking more than a kilometrePF8 Walking half a kilometrePF9 Walking 100 metresPF10 Bathing or dressing yourself
Role Physical (RP) RP1 Cut down the amount of time spent on work orother activities
RP2 Accomplished less than would likeRP3 Limited in the kind of work or other activitiesRP4 Difficulty performing work or other activities
Bodily Pain (BP) BP1 Intensity of bodily painBP2 Extent pain interfered with normal work
General Health (GH) GH1 Is your health: excellent, very good, good, fair, poorGH2 I seem to get sick a little easier than other peopleGH3 I am as healthy as anybody I knowGH4 I expect my health to get worseGH5 My health is excellent
Vitality (VT) VT1 Feel full of lifeVT2 Have a lot of energyVT3 Feel worn outVT4 Feel tired
Social Functioning (SF) SF1 Extent health problems interfered with normalsocial activities
SF2 Frequency health problems interfered with socialactivities
Role Emotional (RE) RE1 Cut down the amount of time spent on work orother activities
RE2 Accomplished less than would likeRE3 Didn’t do work or other activities as carefully as
usual
Mental Health (MH) MH1 Been a very nervous personMH2 Felt so down in the dumps that nothing could
cheer you upMH3 Felt calm and peacefulMH4 Felt downMH5 Been a happy person
143SF-36 Health Status Questionnaire: Demographic
Results
SF-36 profiles by demographic variables
SF-36 profiles by total population
The New Zealand population had higher SF-36 mean scores on all scales in comparisonwith overseas general population norms (for example, Australian or American).
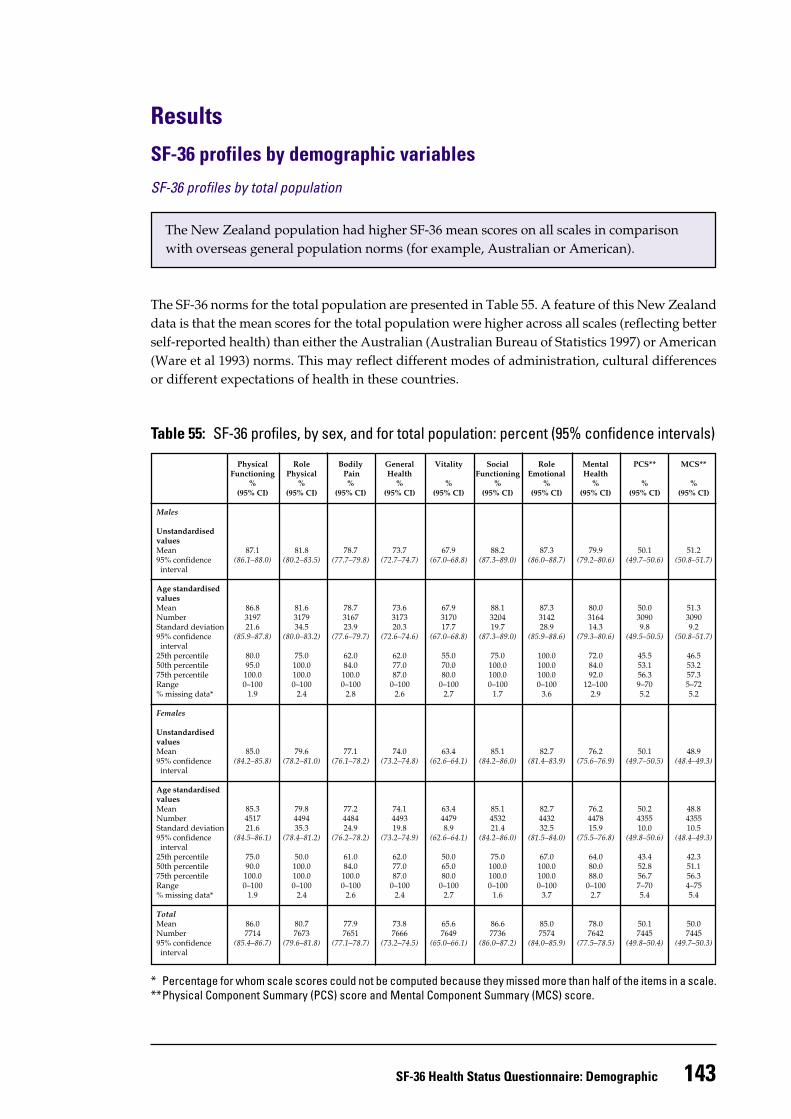
The SF-36 norms for the total population are presented in Table 55. A feature of this New Zealanddata is that the mean scores for the total population were higher across all scales (reflecting betterself-reported health) than either the Australian (Australian Bureau of Statistics 1997) or American(Ware et al 1993) norms. This may reflect different modes of administration, cultural differencesor different expectations of health in these countries.
Table 55: SF-36 profiles, by sex, and for total population: percent (95% confidence intervals)
Physical Role Bodily General Vitality Social Role Mental PCS** MCS**Functioning Physical Pain Health Functioning Emotional Health
% % % % % % % % % %(95% CI) (95% CI) (95% CI) (95% CI) (95% CI) (95% CI) (95% CI) (95% CI) (95% CI) (95% CI)
Males
UnstandardisedvaluesMean 87.1 81.8 78.7 73.7 67.9 88.2 87.3 79.9 50.1 51.295% confidence (86.1–88.0) (80.2–83.5) (77.7–79.8) (72.7–74.7) (67.0–68.8) (87.3–89.0) (86.0–88.7) (79.2–80.6) (49.7–50.6) (50.8–51.7) interval
Age standardisedvaluesMean 86.8 81.6 78.7 73.6 67.9 88.1 87.3 80.0 50.0 51.3Number 3197 3179 3167 3173 3170 3204 3142 3164 3090 3090Standard deviation 21.6 34.5 23.9 20.3 17.7 19.7 28.9 14.3 9.8 9.295% confidence (85.9–87.8) (80.0–83.2) (77.6–79.7) (72.6–74.6) (67.0–68.8) (87.3–89.0) (85.9–88.6) (79.3–80.6) (49.5–50.5) (50.8–51.7) interval25th percentile 80.0 75.0 62.0 62.0 55.0 75.0 100.0 72.0 45.5 46.550th percentile 95.0 100.0 84.0 77.0 70.0 100.0 100.0 84.0 53.1 53.275th percentile 100.0 100.0 100.0 87.0 80.0 100.0 100.0 92.0 56.3 57.3Range 0–100 0–100 0–100 0–100 0–100 0–100 0–100 12–100 9–70 5–72% missing data* 1.9 2.4 2.8 2.6 2.7 1.7 3.6 2.9 5.2 5.2
Females
UnstandardisedvaluesMean 85.0 79.6 77.1 74.0 63.4 85.1 82.7 76.2 50.1 48.995% confidence (84.2–85.8) (78.2–81.0) (76.1–78.2) (73.2–74.8) (62.6–64.1) (84.2–86.0) (81.4–83.9) (75.6–76.9) (49.7–50.5) (48.4–49.3) interval
Age standardisedvaluesMean 85.3 79.8 77.2 74.1 63.4 85.1 82.7 76.2 50.2 48.8Number 4517 4494 4484 4493 4479 4532 4432 4478 4355 4355Standard deviation 21.6 35.3 24.9 19.8 8.9 21.4 32.5 15.9 10.0 10.595% confidence (84.5–86.1) (78.4–81.2) (76.2–78.2) (73.2–74.9) (62.6–64.1) (84.2–86.0) (81.5–84.0) (75.5–76.8) (49.8–50.6) (48.4–49.3) interval25th percentile 75.0 50.0 61.0 62.0 50.0 75.0 67.0 64.0 43.4 42.350th percentile 90.0 100.0 84.0 77.0 65.0 100.0 100.0 80.0 52.8 51.175th percentile 100.0 100.0 100.0 87.0 80.0 100.0 100.0 88.0 56.7 56.3Range 0–100 0–100 0–100 0–100 0–100 0–100 0–100 0–100 7–70 4–75% missing data* 1.9 2.4 2.6 2.4 2.7 1.6 3.7 2.7 5.4 5.4
TotalMean 86.0 80.7 77.9 73.8 65.6 86.6 85.0 78.0 50.1 50.0Number 7714 7673 7651 7666 7649 7736 7574 7642 7445 744595% confidence (85.4–86.7) (79.6–81.8) (77.1–78.7) (73.2–74.5) (65.0–66.1) (86.0–87.2) (84.0–85.9) (77.5–78.5) (49.8–50.4) (49.7–50.3) interval
* Percentage for whom scale scores could not be computed because they missed more than half of the items in a scale.**Physical Component Summary (PCS) score and Mental Component Summary (MCS) score.
144 Taking the Pulse
SF-36 profiles by sex
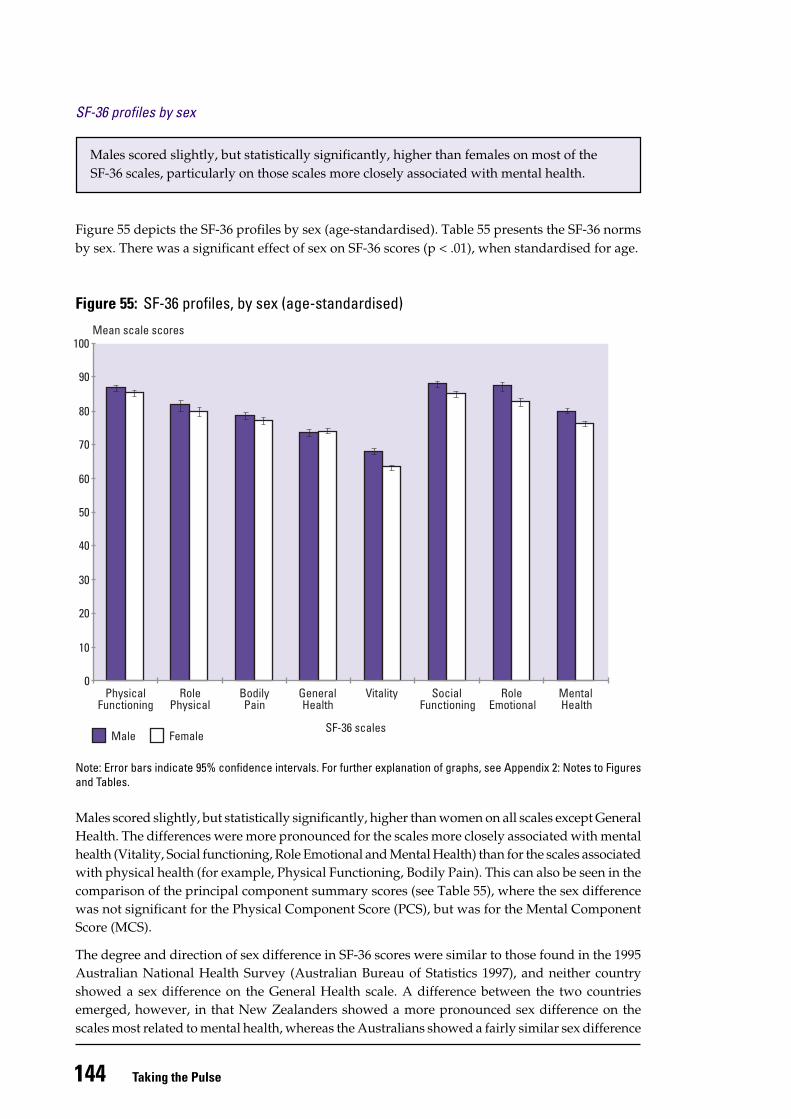
Males scored slightly, but statistically significantly, higher than females on most of theSF-36 scales, particularly on those scales more closely associated with mental health.
Figure 55 depicts the SF-36 profiles by sex (age-standardised). Table 55 presents the SF-36 normsby sex. There was a significant effect of sex on SF-36 scores (p < .01), when standardised for age.
Figure 55: SF-36 profiles, by sex (age-standardised)
Note: Error bars indicate 95% confidence intervals. For further explanation of graphs, see Appendix 2: Notes to Figuresand Tables.
Males scored slightly, but statistically significantly, higher than women on all scales except GeneralHealth. The differences were more pronounced for the scales more closely associated with mentalhealth (Vitality, Social functioning, Role Emotional and Mental Health) than for the scales associatedwith physical health (for example, Physical Functioning, Bodily Pain). This can also be seen in thecomparison of the principal component summary scores (see Table 55), where the sex differencewas not significant for the Physical Component Score (PCS), but was for the Mental ComponentScore (MCS).
The degree and direction of sex difference in SF-36 scores were similar to those found in the 1995Australian National Health Survey (Australian Bureau of Statistics 1997), and neither countryshowed a sex difference on the General Health scale. A difference between the two countriesemerged, however, in that New Zealanders showed a more pronounced sex difference on thescales most related to mental health, whereas the Australians showed a fairly similar sex difference
Mean scale scores
Male Female
PhysicalFunctioning
RolePhysical
BodilyPain
GeneralHealth
Vitality SocialFunctioning
RoleEmotional
MentalHealth
SF-36 scales
0
10
20
30
40
50
60
70
80
90
100
145SF-36 Health Status Questionnaire: Demographic
across the scales related to both mental and physical health. The New Zealand data were similarto the American data (Ware et al 1993) to the extent that in both countries men rated their healthbetter than women, but the Americans showed a more pronounced sex difference on the scalesmost closely related to physical health, rather than mental health.
SF-36 profiles by age and sex
Note: Error bars indicate 95% confidence intervals. For further explanation of graphs, see Appendix 2: Notes to Figuresand Tables.
Mean scale scores
15–24 years 45–64 years 75+ years
PhysicalFunctioning
RolePhysical
BodilyPain
GeneralHealth
Vitality SocialFunctioning
RoleEmotional
MentalHealth
SF-36 scales
0
10
20
30
40
50
60
70
80
90
100
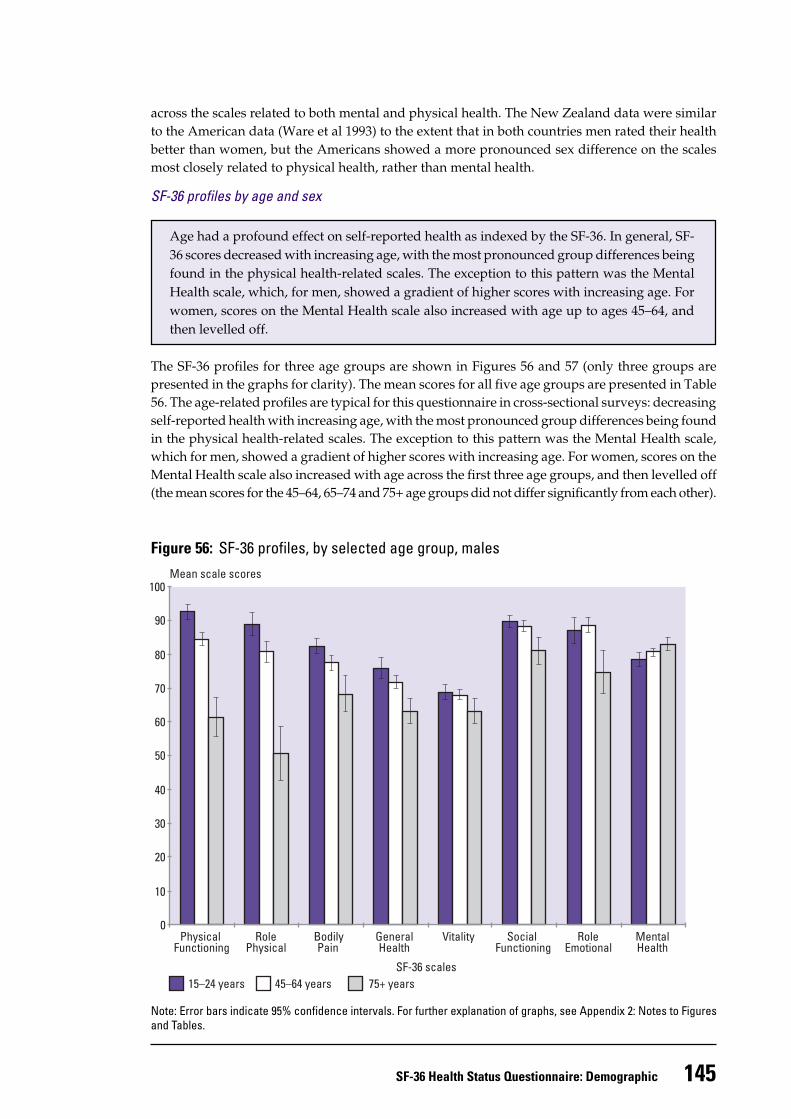
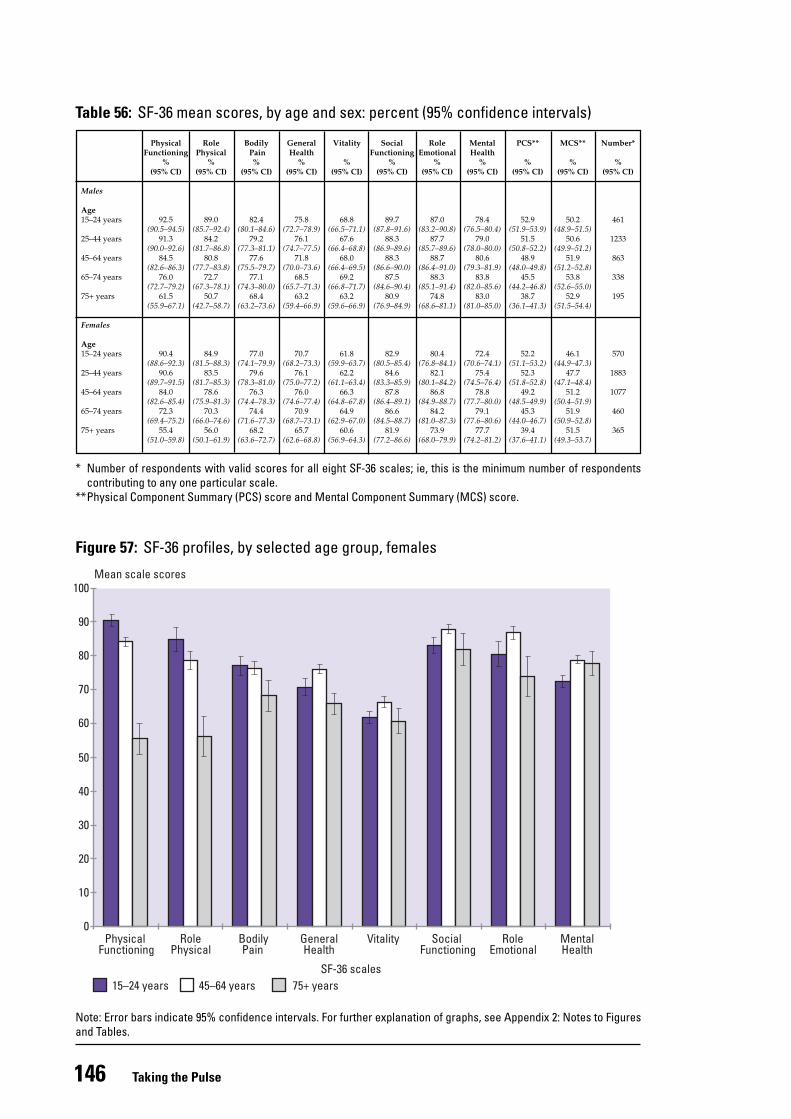
Age had a profound effect on self-reported health as indexed by the SF-36. In general, SF-36 scores decreased with increasing age, with the most pronounced group differences beingfound in the physical health-related scales. The exception to this pattern was the MentalHealth scale, which, for men, showed a gradient of higher scores with increasing age. Forwomen, scores on the Mental Health scale also increased with age up to ages 45–64, andthen levelled off.
The SF-36 profiles for three age groups are shown in Figures 56 and 57 (only three groups arepresented in the graphs for clarity). The mean scores for all five age groups are presented in Table56. The age-related profiles are typical for this questionnaire in cross-sectional surveys: decreasingself-reported health with increasing age, with the most pronounced group differences being foundin the physical health-related scales. The exception to this pattern was the Mental Health scale,which for men, showed a gradient of higher scores with increasing age. For women, scores on theMental Health scale also increased with age across the first three age groups, and then levelled off(the mean scores for the 45–64, 65–74 and 75+ age groups did not differ significantly from each other).
Figure 56: SF-36 profiles, by selected age group, males
146 Taking the Pulse
Figure 57: SF-36 profiles, by selected age group, females
Note: Error bars indicate 95% confidence intervals. For further explanation of graphs, see Appendix 2: Notes to Figuresand Tables.
Mean scale scores
15–24 years 45–64 years 75+ years
PhysicalFunctioning
RolePhysical
BodilyPain
GeneralHealth
Vitality SocialFunctioning
RoleEmotional
MentalHealth
SF-36 scales
0
10
20
30
40
50
60
70
80
90
100
Table 56: SF-36 mean scores, by age and sex: percent (95% confidence intervals)
Physical Role Bodily General Vitality Social Role Mental PCS** MCS** Number*Functioning Physical Pain Health Functioning Emotional Health
% % % % % % % % % % %(95% CI) (95% CI) (95% CI) (95% CI) (95% CI) (95% CI) (95% CI) (95% CI) (95% CI) (95% CI) (95% CI)
Males
Age15–24 years 92.5 89.0 82.4 75.8 68.8 89.7 87.0 78.4 52.9 50.2 461
(90.5–94.5) (85.7–92.4) (80.1–84.6) (72.7–78.9) (66.5–71.1) (87.8–91.6) (83.2–90.8) (76.5–80.4) (51.9–53.9) (48.9–51.5)25–44 years 91.3 84.2 79.2 76.1 67.6 88.3 87.7 79.0 51.5 50.6 1233
(90.0–92.6) (81.7–86.8) (77.3–81.1) (74.7–77.5) (66.4–68.8) (86.9–89.6) (85.7–89.6) (78.0–80.0) (50.8–52.2) (49.9–51.2)45–64 years 84.5 80.8 77.6 71.8 68.0 88.3 88.7 80.6 48.9 51.9 863
(82.6–86.3) (77.7–83.8) (75.5–79.7) (70.0–73.6) (66.4–69.5) (86.6–90.0) (86.4–91.0) (79.3–81.9) (48.0–49.8) (51.2–52.8)65–74 years 76.0 72.7 77.1 68.5 69.2 87.5 88.3 83.8 45.5 53.8 338
(72.7–79.2) (67.3–78.1) (74.3–80.0) (65.7–71.3) (66.8–71.7) (84.6–90.4) (85.1–91.4) (82.0–85.6) (44.2–46.8) (52.6–55.0)75+ years 61.5 50.7 68.4 63.2 63.2 80.9 74.8 83.0 38.7 52.9 195
(55.9–67.1) (42.7–58.7) (63.2–73.6) (59.4–66.9) (59.6–66.9) (76.9–84.9) (68.6–81.1) (81.0–85.0) (36.1–41.3) (51.5–54.4)
Females
Age15–24 years 90.4 84.9 77.0 70.7 61.8 82.9 80.4 72.4 52.2 46.1 570
(88.6–92.3) (81.5–88.3) (74.1–79.9) (68.2–73.3) (59.9–63.7) (80.5–85.4) (76.8–84.1) (70.6–74.1) (51.1–53.2) (44.9–47.3)25–44 years 90.6 83.5 79.6 76.1 62.2 84.6 82.1 75.4 52.3 47.7 1883
(89.7–91.5) (81.7–85.3) (78.3–81.0) (75.0–77.2) (61.1–63.4) (83.3–85.9) (80.1–84.2) (74.5–76.4) (51.8–52.8) (47.1–48.4)45–64 years 84.0 78.6 76.3 76.0 66.3 87.8 86.8 78.8 49.2 51.2 1077
(82.6–85.4) (75.9–81.3) (74.4–78.3) (74.6–77.4) (64.8–67.8) (86.4–89.1) (84.9–88.7) (77.7–80.0) (48.5–49.9) (50.4–51.9)65–74 years 72.3 70.3 74.4 70.9 64.9 86.6 84.2 79.1 45.3 51.9 460
(69.4–75.2) (66.0–74.6) (71.6–77.3) (68.7–73.1) (62.9–67.0) (84.5–88.7) (81.0–87.3) (77.6–80.6) (44.0–46.7) (50.9–52.8)75+ years 55.4 56.0 68.2 65.7 60.6 81.9 73.9 77.7 39.4 51.5 365
(51.0–59.8) (50.1–61.9) (63.6–72.7) (62.6–68.8) (56.9–64.3) (77.2–86.6) (68.0–79.9) (74.2–81.2) (37.6–41.1) (49.3–53.7)
* Number of respondents with valid scores for all eight SF-36 scales; ie, this is the minimum number of respondentscontributing to any one particular scale.
**Physical Component Summary (PCS) score and Mental Component Summary (MCS) score.
147SF-36 Health Status Questionnaire: Demographic
* Approximately 13% of people over 75 years live in non-private dwellings (Health Funding Authority and Ministry of Health 1998).** Readers are referred to the Ministry of Health’s website (www.moh.govt.nz) for tables showing the ethnicity x sex SF-36 means.
This disparity in the effect of age on self-reported physical versus mental health status is highlightedby observation of the summary scores (see Table 56), where for both sexes the young showedlower self-reported mental health than physical health (although the difference is more pronouncedin females), while the reverse is seen in the older age groups.
It is not possible to say from a cross-sectional survey whether these results are due to age, periodor cohort effects. Longitudinal data on the SF-36 are limited, but a British study (Hemingway et al1997) confirms the age-related decline in physical health found here. It also found decreasingscores on the Mental Health scale with increasing age up until age 55, then either a small increasein Mental Health scores (men) or stabilisation (women). This suggests that the results found inthis cross-sectional survey, showing an apparent stability or improvement in mental health withage in both sexes, is at least in part a function of a cohort effect: for example, rising expectationsamong each succeeding generation leading to apparently lower norms in younger age groups.
However, the Hemingway et al study only followed up participants for three years, so furtherlongitudinal research is needed to clarify the contribution of age and cohort effects to the patternsshown here in the cross-sectional data. Also of note is that institutionalised elderly people wereexcluded from this survey, and therefore the norms reported here may over-estimate the mentaland physical health of older people.*
SF-36 profiles by ethnicity
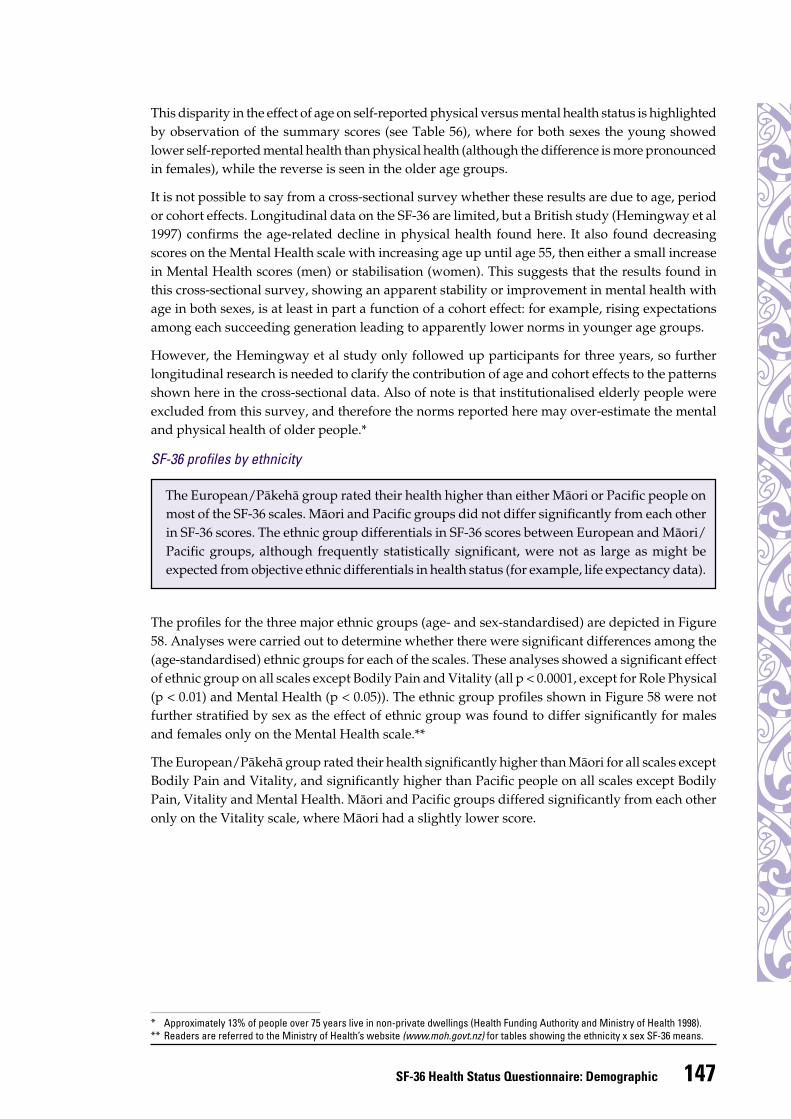
The profiles for the three major ethnic groups (age- and sex-standardised) are depicted in Figure58. Analyses were carried out to determine whether there were significant differences among the(age-standardised) ethnic groups for each of the scales. These analyses showed a significant effectof ethnic group on all scales except Bodily Pain and Vitality (all p < 0.0001, except for Role Physical(p < 0.01) and Mental Health (p < 0.05)). The ethnic group profiles shown in Figure 58 were notfurther stratified by sex as the effect of ethnic group was found to differ significantly for malesand females only on the Mental Health scale.**
The European/Päkehä group rated their health significantly higher than Mäori for all scales exceptBodily Pain and Vitality, and significantly higher than Pacific people on all scales except BodilyPain, Vitality and Mental Health. Mäori and Pacific groups differed significantly from each otheronly on the Vitality scale, where Mäori had a slightly lower score.
The European/Päkehä group rated their health higher than either Mäori or Pacific people onmost of the SF-36 scales. Mäori and Pacific groups did not differ significantly from each otherin SF-36 scores. The ethnic group differentials in SF-36 scores between European and Mäori/Pacific groups, although frequently statistically significant, were not as large as might beexpected from objective ethnic differentials in health status (for example, life expectancy data).
148 Taking the Pulse
Figure 58: SF-36 profiles, by ethnicity (age- and sex-standardised)
Note: Error bars indicate 95% confidence intervals. For further explanation of graphs, see Appendix 2: Notes to Figuresand Tables.
These differences in self-reported health status by ethnicity, although statistically significant insome cases, are quite small. Objective measures of health status produce somewhat largerdifferences. For example, the life expectancy of Mäori women at birth in 1996 was nine years lessthan that of European/Päkehä women (Ministry of Health, 1998a). Moreover, considerable ethnicgroup disparities in health status have been found elsewhere in this survey in, for example, theprevalence of diabetes and asthma. Additionally, they are documented in other publications whichmonitor population health status, for example, Progress on Health Outcome Targets (Ministry ofHealth 1998b).
This discrepancy between the size of subjective and objective ethnic differentials in health wasalso noted amongst indigenous Australians in comparison with the general population (AustralianInstitute of Health and Welfare 1996), although recent data (Australian Institute of Health andWelfare 1998) suggests that these data may have been confounded by differences in the age structureof the indigenous and non-indigenous population. Such a confound cannot explain the NewZealand results however, as the ethnic groups being compared were age-standardised. There area number of possible explanations for the smaller than expected ethnic differential in self-reportedhealth status, including different cultural perceptions of health, and different expectations of whatconstitutes ‘normal’ levels of health.
Other researchers have found that the difference in self-reported health status between ethnicgroups is greater than can be explained by differences in objective health status (Shetterly et al1996; Angel and Guarnaccia 1989). The general conclusion of Shetterly et al seems appropriate in
Mean scale scores
PhysicalFunctioning
RolePhysical
BodilyPain
GeneralHealth
Vitality SocialFunctioning
RoleEmotional
MentalHealth
SF-36 scalesPacificMaoriEuropean/Pakeha
0
10
20
30
40
50
60
70
80
90
100
149SF-36 Health Status Questionnaire: Demographic
either case: that cultural influences on definitions of health mean that ethnic differences in self-reported health (whatever the magnitude) may reflect a number of factors besides objective healthstatus.
For further discussion of the SF-36 and its use in New Zealand ethnic groups, see Scott et al 1999.
SF-36 profiles by socioeconomic variables
SF-36 profiles by education
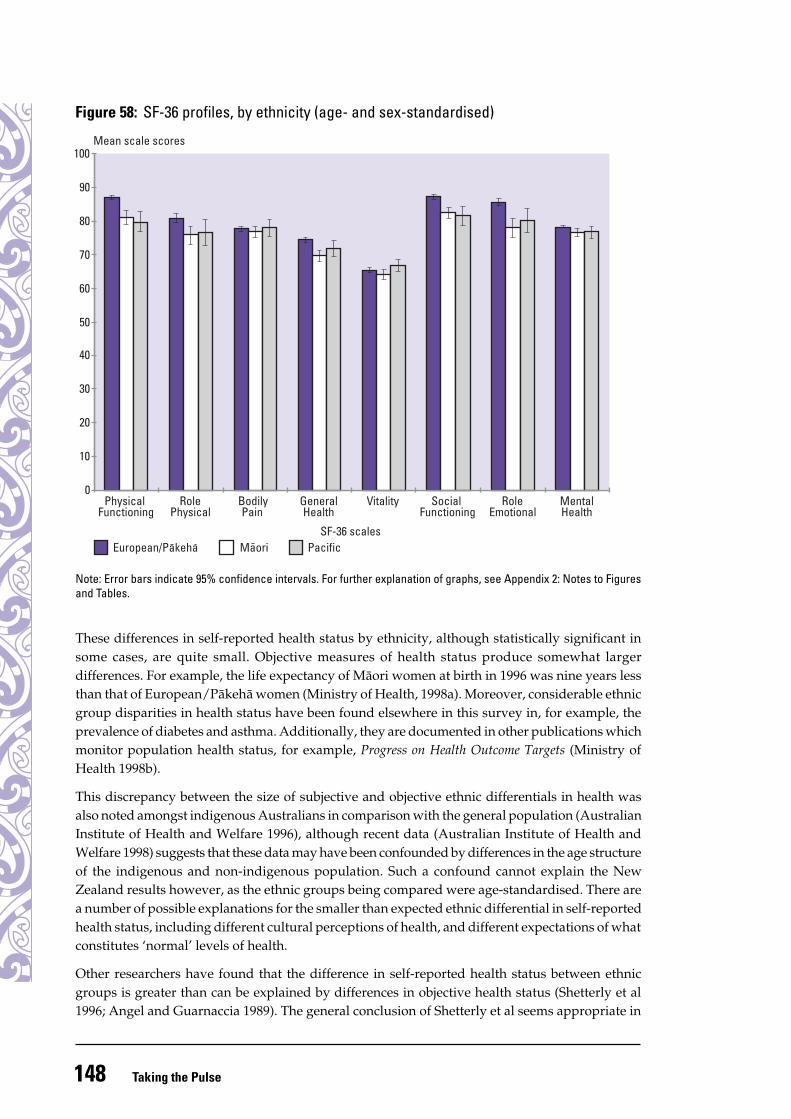
In all population groups there was some tendency for those who had the most educationalqualifications (school and post-school) to have higher self-reported health status relativeto those with no qualifications, on at least some of the scales. How systematic a pattern thiswas varied across sex and ethnic group. All groups showed this pattern for the PhysicalFunctioning scale (probably the most sensitive of the scales due to the larger number ofitems). Females in both ethnic groups showed a significant effect of educational status onmental health, whereas men did not (in either ethnic group).
The relationship between education and SF-36 scores was found to differ significantly for ethnic group(Mäori and non-Mäori) and sex on all scales (p < 0.0001 for each scale, except Role Physical: p = 0.01).
Figure 59: SF-36 profiles, by education, non-Maori males (age-standardised)
Mean scale scores
PhysicalFunctioning
RolePhysical
BodilyPain
GeneralHealth
Vitality SocialFunctioning
RoleEmotional
MentalHealth
SF-36 scales
No qualifications School or post-school only School and post-school
0
10
20
30
40
50
60
70
80
90
100
Note: Error bars indicate 95% confidence intervals. For further explanation of graphs, see Appendix 2: Notes to Figuresand Tables.
150 Taking the Pulse
Mean scale scores
PhysicalFunctioning
RolePhysical
BodilyPain
GeneralHealth
Vitality SocialFunctioning
RoleEmotional
MentalHealth
SF-36 scales
No qualifications School or post-school only School and post-school
0
10
20
30
40
50
60
70
80
90
100
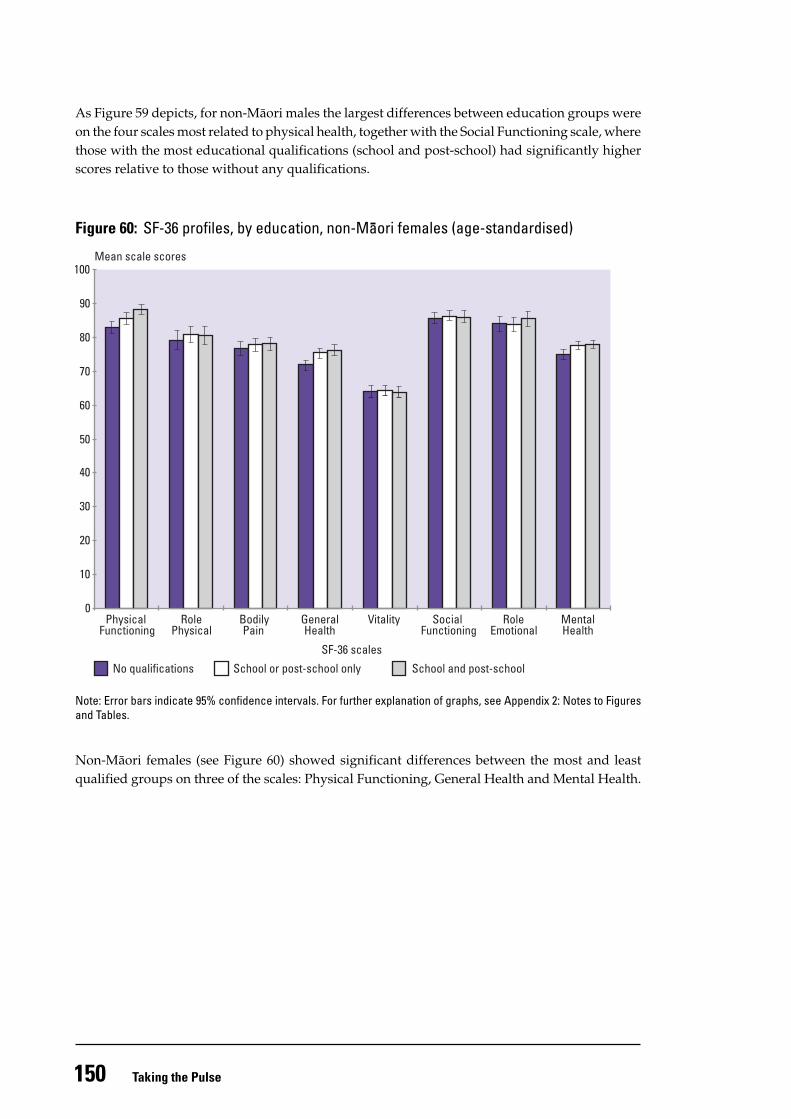
As Figure 59 depicts, for non-Mäori males the largest differences between education groups wereon the four scales most related to physical health, together with the Social Functioning scale, wherethose with the most educational qualifications (school and post-school) had significantly higherscores relative to those without any qualifications.
Figure 60: SF-36 profiles, by education, non-Maori females (age-standardised)
Note: Error bars indicate 95% confidence intervals. For further explanation of graphs, see Appendix 2: Notes to Figuresand Tables.
Non-Mäori females (see Figure 60) showed significant differences between the most and leastqualified groups on three of the scales: Physical Functioning, General Health and Mental Health.
151SF-36 Health Status Questionnaire: Demographic
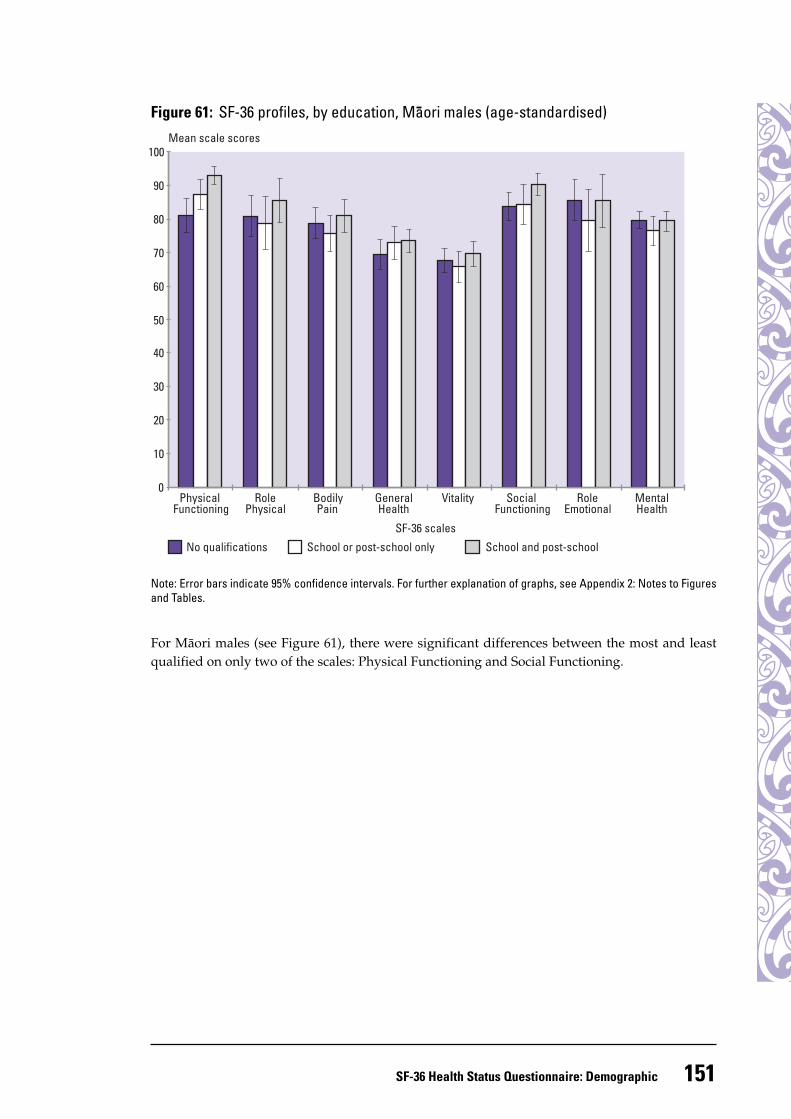
Figure 61: SF-36 profiles, by education, Maori males (age-standardised)
Note: Error bars indicate 95% confidence intervals. For further explanation of graphs, see Appendix 2: Notes to Figuresand Tables.
For Mäori males (see Figure 61), there were significant differences between the most and leastqualified on only two of the scales: Physical Functioning and Social Functioning.
Mean scale scores
PhysicalFunctioning
RolePhysical
BodilyPain
GeneralHealth
Vitality SocialFunctioning
RoleEmotional
MentalHealth
SF-36 scales
No qualifications School or post-school only School and post-school
0
10
20
30
40
50
60
70
80
90
100
152 Taking the Pulse
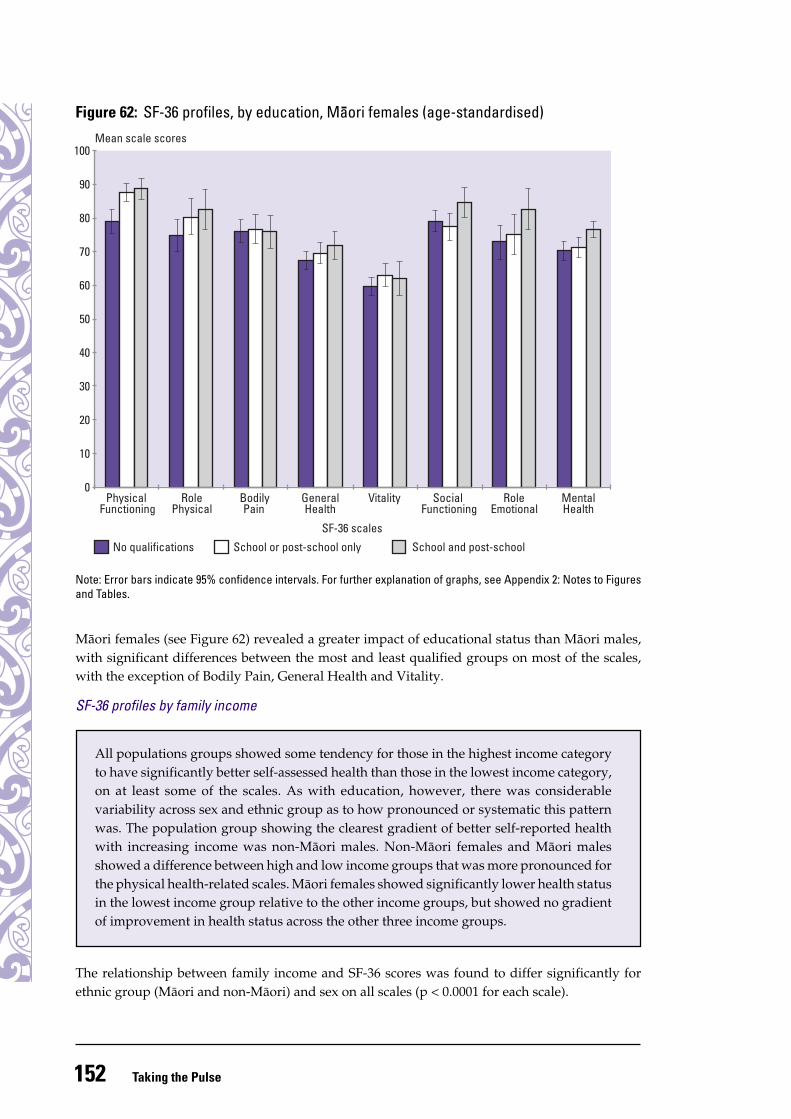
Figure 62: SF-36 profiles, by education, Maori females (age-standardised)Mean scale scores
PhysicalFunctioning
RolePhysical
BodilyPain
GeneralHealth
Vitality SocialFunctioning
RoleEmotional
MentalHealth
SF-36 scales
No qualifications School or post-school only School and post-school
0
10
20
30
40
50
60
70
80
90
100
Note: Error bars indicate 95% confidence intervals. For further explanation of graphs, see Appendix 2: Notes to Figuresand Tables.
Mäori females (see Figure 62) revealed a greater impact of educational status than Mäori males,with significant differences between the most and least qualified groups on most of the scales,with the exception of Bodily Pain, General Health and Vitality.
SF-36 profiles by family income
The relationship between family income and SF-36 scores was found to differ significantly forethnic group (Mäori and non-Mäori) and sex on all scales (p < 0.0001 for each scale).
All populations groups showed some tendency for those in the highest income categoryto have significantly better self-assessed health than those in the lowest income category,on at least some of the scales. As with education, however, there was considerablevariability across sex and ethnic group as to how pronounced or systematic this patternwas. The population group showing the clearest gradient of better self-reported healthwith increasing income was non-Mäori males. Non-Mäori females and Mäori malesshowed a difference between high and low income groups that was more pronounced forthe physical health-related scales. Mäori females showed significantly lower health statusin the lowest income group relative to the other income groups, but showed no gradientof improvement in health status across the other three income groups.
153SF-36 Health Status Questionnaire: Demographic
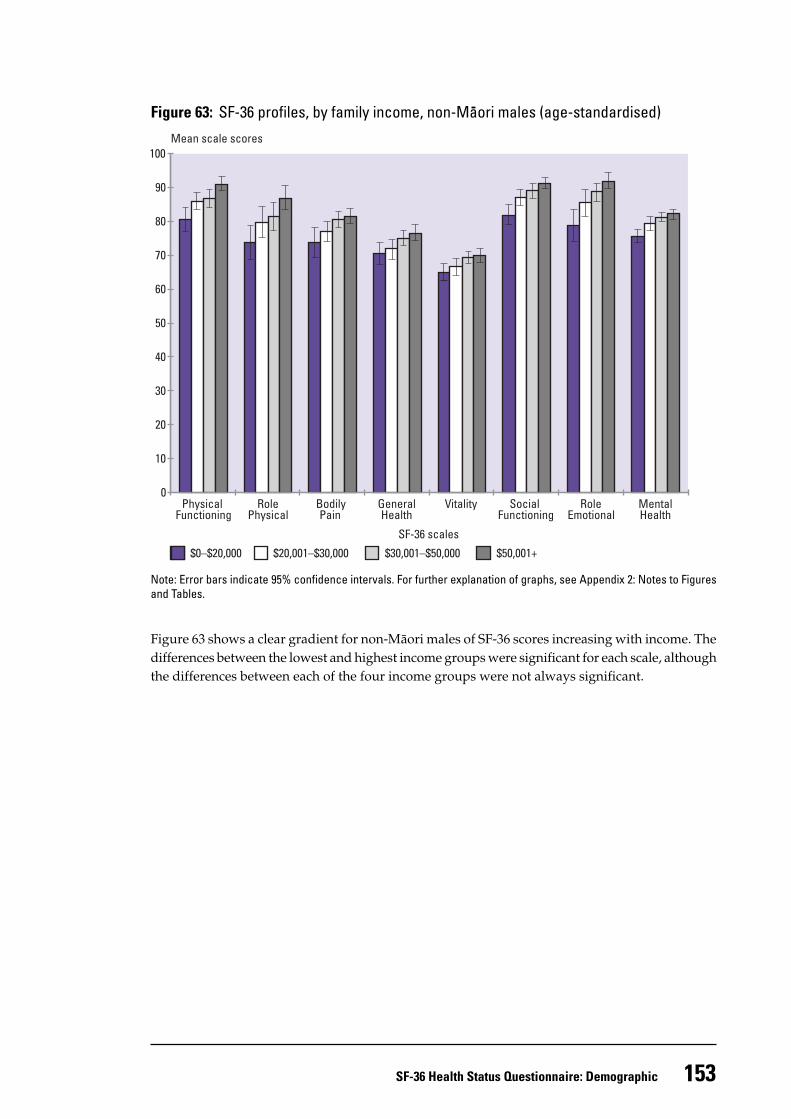
Figure 63: SF-36 profiles, by family income, non-Maori males (age-standardised)
Note: Error bars indicate 95% confidence intervals. For further explanation of graphs, see Appendix 2: Notes to Figuresand Tables.
Figure 63 shows a clear gradient for non-Mäori males of SF-36 scores increasing with income. Thedifferences between the lowest and highest income groups were significant for each scale, althoughthe differences between each of the four income groups were not always significant.
Mean scale scores
PhysicalFunctioning
RolePhysical
BodilyPain
GeneralHealth
Vitality SocialFunctioning
RoleEmotional
MentalHealth
SF-36 scales
$0–$20,000 $20,001–$30,000 $30,001–$50,000 $50,001+
0
10
20
30
40
50
60
70
80
90
100
154 Taking the Pulse
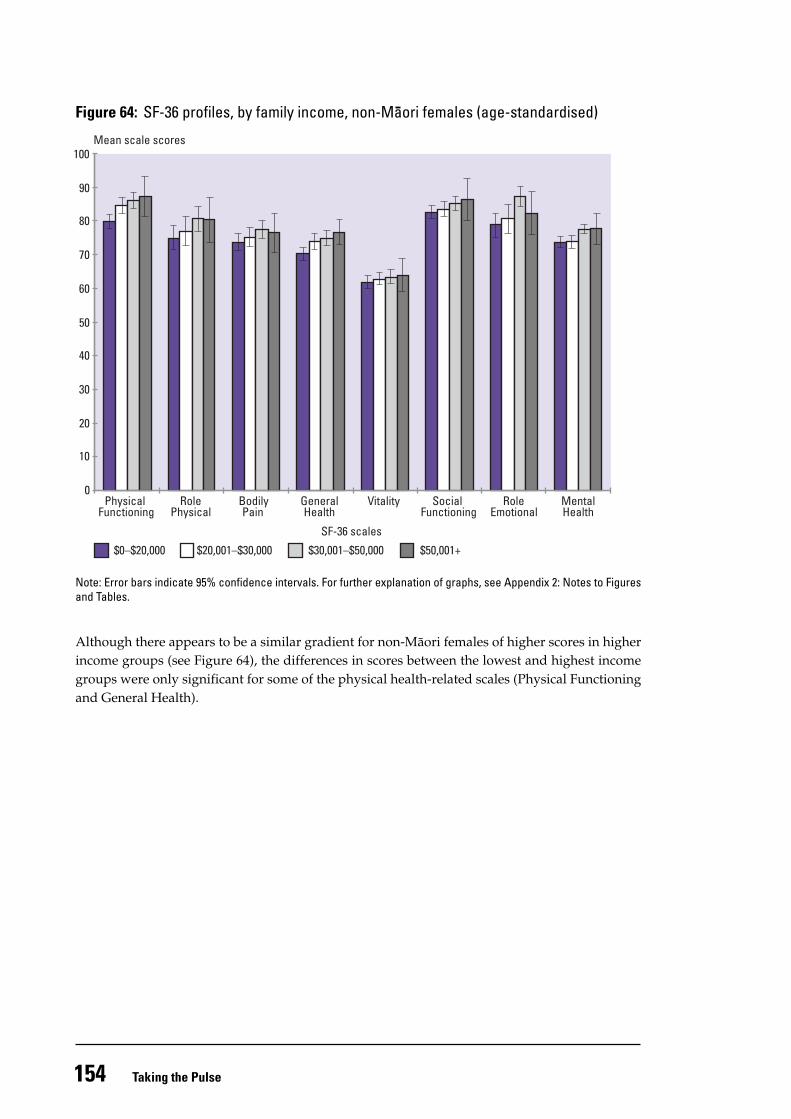
Figure 64: SF-36 profiles, by family income, non-Maori females (age-standardised)
Note: Error bars indicate 95% confidence intervals. For further explanation of graphs, see Appendix 2: Notes to Figuresand Tables.
Although there appears to be a similar gradient for non-Mäori females of higher scores in higherincome groups (see Figure 64), the differences in scores between the lowest and highest incomegroups were only significant for some of the physical health-related scales (Physical Functioningand General Health).
Mean scale scores
PhysicalFunctioning
RolePhysical
BodilyPain
GeneralHealth
Vitality SocialFunctioning
RoleEmotional
MentalHealth
SF-36 scales
$0–$20,000 $20,001–$30,000 $30,001–$50,000 $50,001+
0
10
20
30
40
50
60
70
80
90
100
155SF-36 Health Status Questionnaire: Demographic
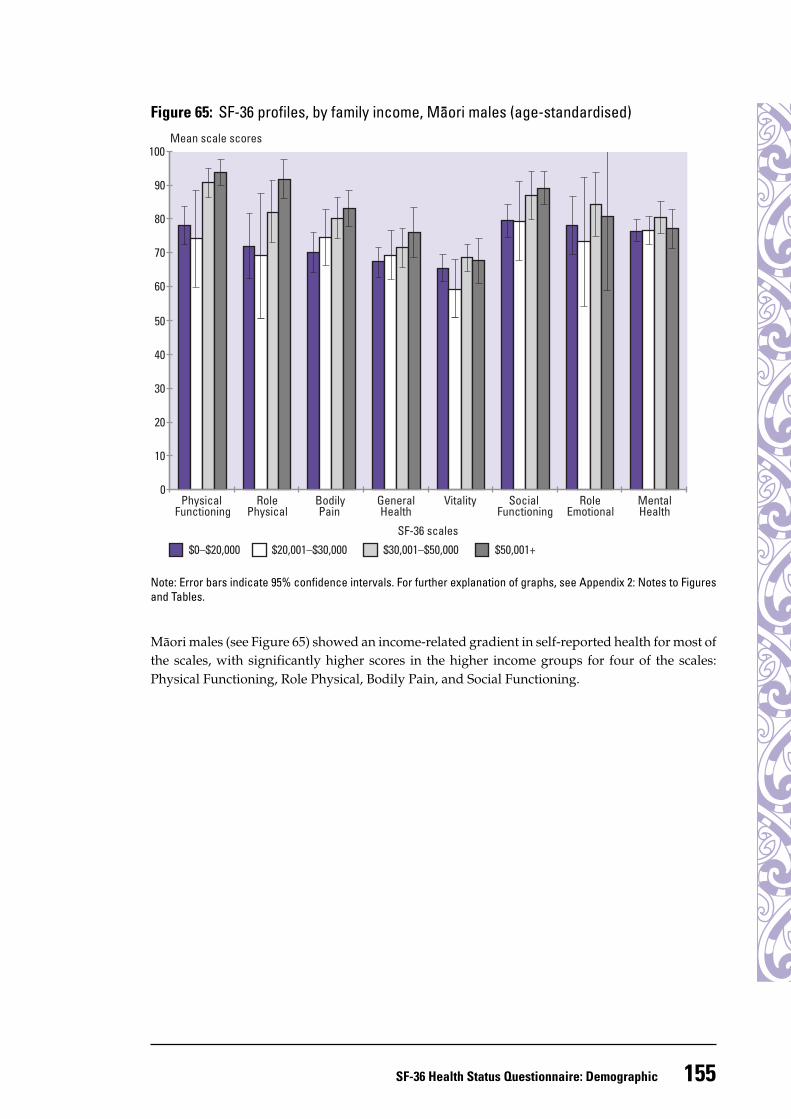
Figure 65: SF-36 profiles, by family income, Maori males (age-standardised)
Note: Error bars indicate 95% confidence intervals. For further explanation of graphs, see Appendix 2: Notes to Figuresand Tables.
Mäori males (see Figure 65) showed an income-related gradient in self-reported health for most ofthe scales, with significantly higher scores in the higher income groups for four of the scales:Physical Functioning, Role Physical, Bodily Pain, and Social Functioning.
Mean scale scores
PhysicalFunctioning
RolePhysical
BodilyPain
GeneralHealth
Vitality SocialFunctioning
RoleEmotional
MentalHealth
SF-36 scales
$0–$20,000 $20,001–$30,000 $30,001–$50,000 $50,001+
0
10
20
30
40
50
60
70
80
90
100
156 Taking the Pulse
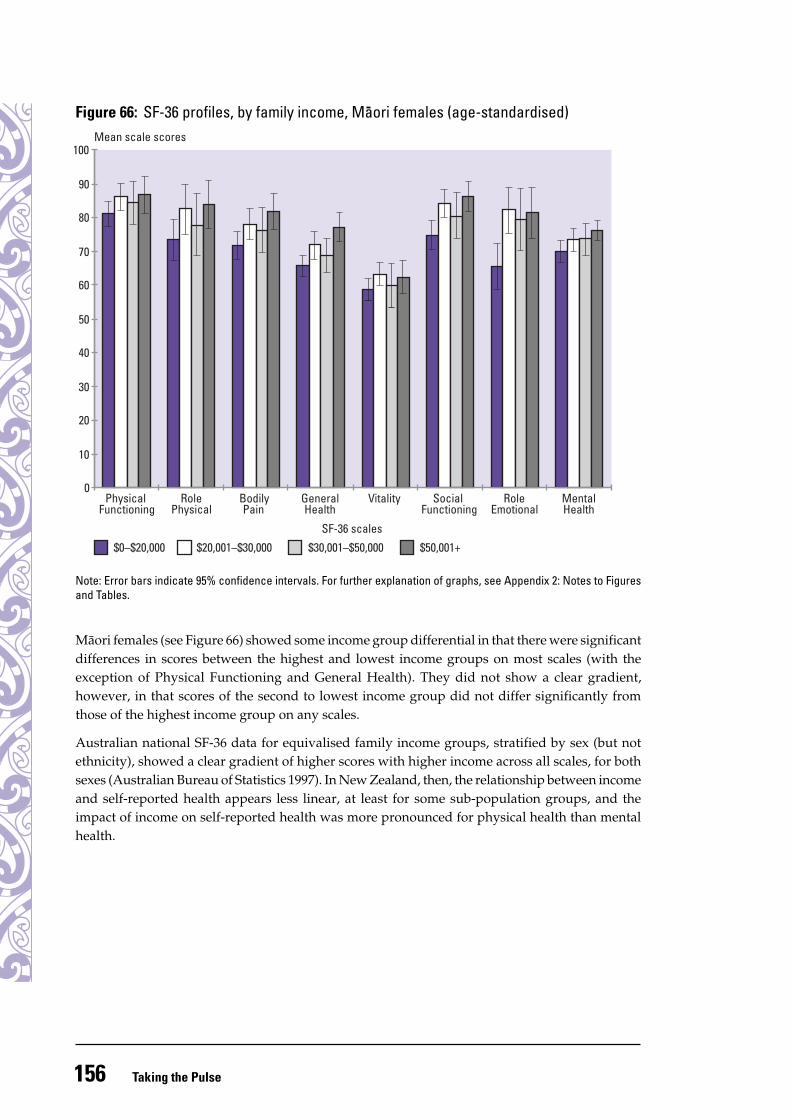
Figure 66: SF-36 profiles, by family income, Maori females (age-standardised)
Note: Error bars indicate 95% confidence intervals. For further explanation of graphs, see Appendix 2: Notes to Figuresand Tables.
Mäori females (see Figure 66) showed some income group differential in that there were significantdifferences in scores between the highest and lowest income groups on most scales (with theexception of Physical Functioning and General Health). They did not show a clear gradient,however, in that scores of the second to lowest income group did not differ significantly fromthose of the highest income group on any scales.
Australian national SF-36 data for equivalised family income groups, stratified by sex (but notethnicity), showed a clear gradient of higher scores with higher income across all scales, for bothsexes (Australian Bureau of Statistics 1997). In New Zealand, then, the relationship between incomeand self-reported health appears less linear, at least for some sub-population groups, and theimpact of income on self-reported health was more pronounced for physical health than mentalhealth.
Mean scale scores
PhysicalFunctioning
RolePhysical
BodilyPain
GeneralHealth
Vitality SocialFunctioning
RoleEmotional
MentalHealth
SF-36 scales
$0–$20,000 $20,001–$30,000 $30,001–$50,000 $50,001+
0
10
20
30
40
50
60
70
80
90
100
157SF-36 Health Status Questionnaire: Demographic
SF-36 profiles by labour force status
The relationship between labour force status and SF-36 scores was found to differ significantly forethnic group (Mäori and non-Mäori) and sex on all scales (p < 0.0001 for each scale).
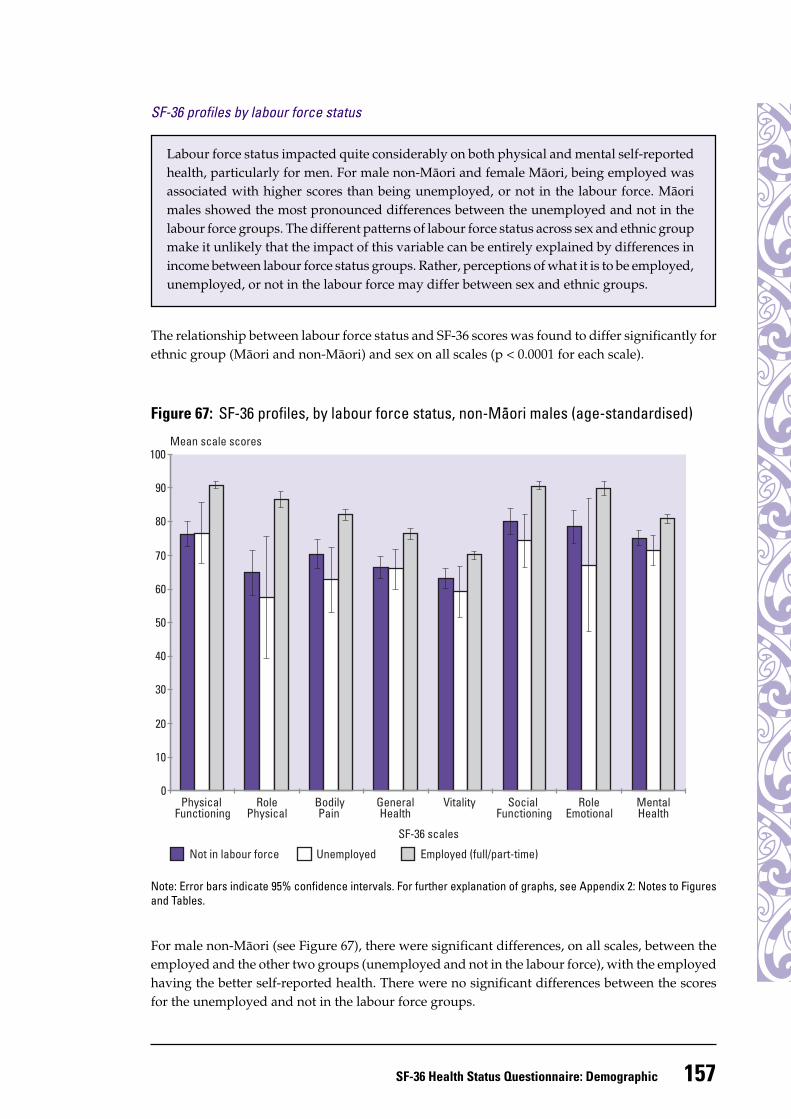
Figure 67: SF-36 profiles, by labour force status, non-Maori males (age-standardised)
Mean scale scores
PhysicalFunctioning
RolePhysical
BodilyPain
GeneralHealth
Vitality SocialFunctioning
RoleEmotional
MentalHealth
SF-36 scales
Not in labour force Unemployed Employed (full/part-time)
0
10
20
30
40
50
60
70
80
90
100
Labour force status impacted quite considerably on both physical and mental self-reportedhealth, particularly for men. For male non-Mäori and female Mäori, being employed wasassociated with higher scores than being unemployed, or not in the labour force. Mäorimales showed the most pronounced differences between the unemployed and not in thelabour force groups. The different patterns of labour force status across sex and ethnic groupmake it unlikely that the impact of this variable can be entirely explained by differences inincome between labour force status groups. Rather, perceptions of what it is to be employed,unemployed, or not in the labour force may differ between sex and ethnic groups.
Note: Error bars indicate 95% confidence intervals. For further explanation of graphs, see Appendix 2: Notes to Figuresand Tables.
For male non-Mäori (see Figure 67), there were significant differences, on all scales, between theemployed and the other two groups (unemployed and not in the labour force), with the employedhaving the better self-reported health. There were no significant differences between the scoresfor the unemployed and not in the labour force groups.
158 Taking the Pulse
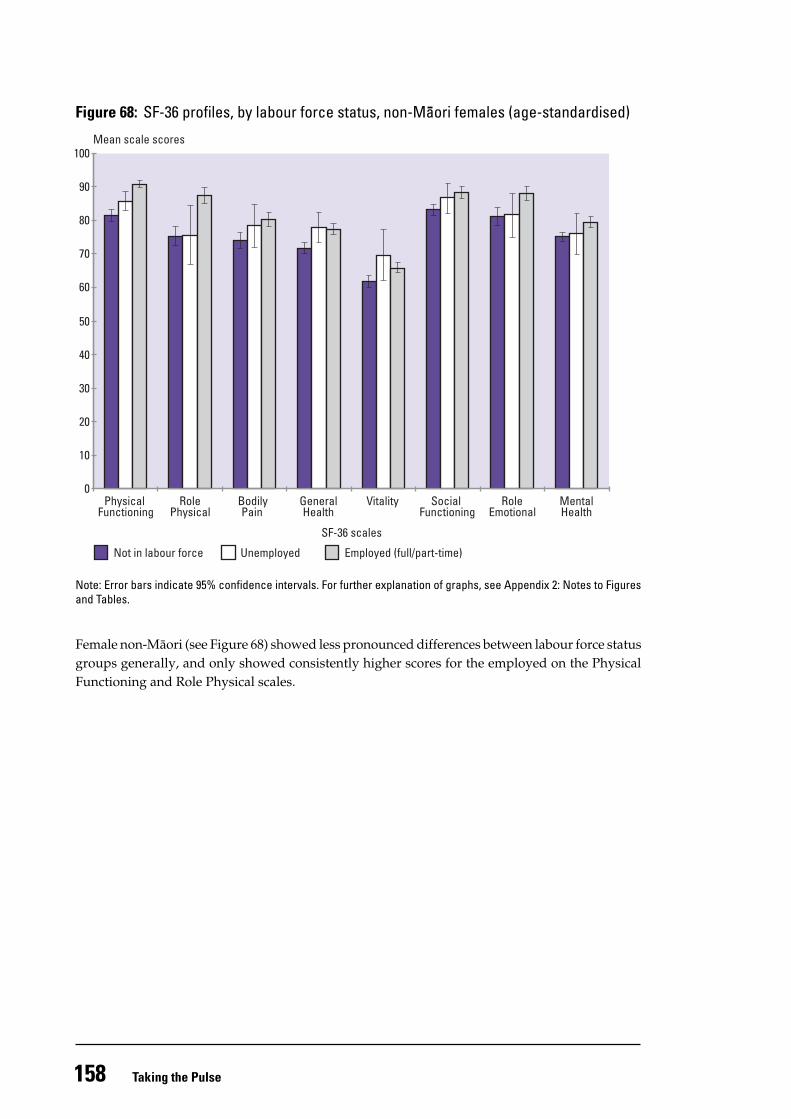
Figure 68: SF-36 profiles, by labour force status, non-Maori females (age-standardised)
Note: Error bars indicate 95% confidence intervals. For further explanation of graphs, see Appendix 2: Notes to Figuresand Tables.
Female non-Mäori (see Figure 68) showed less pronounced differences between labour force statusgroups generally, and only showed consistently higher scores for the employed on the PhysicalFunctioning and Role Physical scales.
Mean scale scores
PhysicalFunctioning
RolePhysical
BodilyPain
GeneralHealth
Vitality SocialFunctioning
RoleEmotional
MentalHealth
SF-36 scales
Not in labour force Unemployed Employed (full/part-time)
0
10
20
30
40
50
60
70
80
90
100
159SF-36 Health Status Questionnaire: Demographic
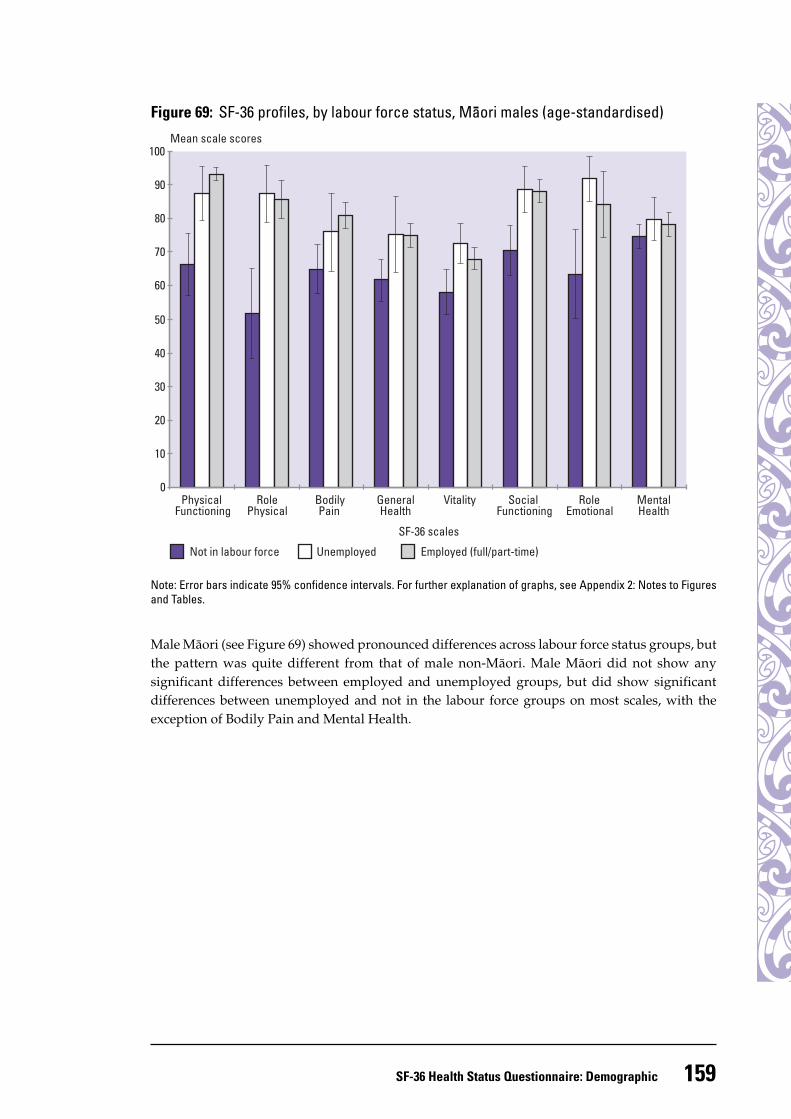
Figure 69: SF-36 profiles, by labour force status, Maori males (age-standardised)
Note: Error bars indicate 95% confidence intervals. For further explanation of graphs, see Appendix 2: Notes to Figuresand Tables.
Male Mäori (see Figure 69) showed pronounced differences across labour force status groups, butthe pattern was quite different from that of male non-Mäori. Male Mäori did not show anysignificant differences between employed and unemployed groups, but did show significantdifferences between unemployed and not in the labour force groups on most scales, with theexception of Bodily Pain and Mental Health.
Mean scale scores
PhysicalFunctioning
RolePhysical
BodilyPain
GeneralHealth
Vitality SocialFunctioning
RoleEmotional
MentalHealth
SF-36 scales
Not in labour force Unemployed Employed (full/part-time)
0
10
20
30
40
50
60
70
80
90
100
160 Taking the Pulse
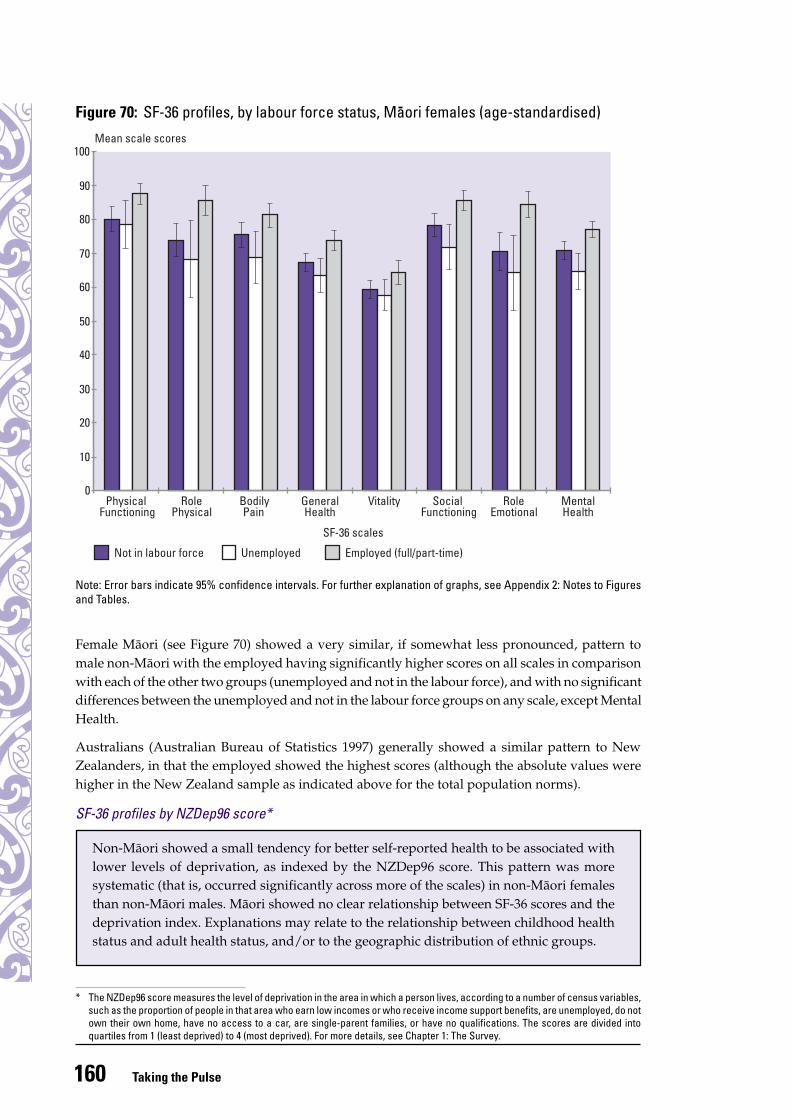
Figure 70: SF-36 profiles, by labour force status, Maori females (age-standardised)
Note: Error bars indicate 95% confidence intervals. For further explanation of graphs, see Appendix 2: Notes to Figuresand Tables.
Female Mäori (see Figure 70) showed a very similar, if somewhat less pronounced, pattern tomale non-Mäori with the employed having significantly higher scores on all scales in comparisonwith each of the other two groups (unemployed and not in the labour force), and with no significantdifferences between the unemployed and not in the labour force groups on any scale, except MentalHealth.
Australians (Australian Bureau of Statistics 1997) generally showed a similar pattern to NewZealanders, in that the employed showed the highest scores (although the absolute values werehigher in the New Zealand sample as indicated above for the total population norms).
SF-36 profiles by NZDep96 score*
Mean scale scores
PhysicalFunctioning
RolePhysical
BodilyPain
GeneralHealth
Vitality SocialFunctioning
RoleEmotional
MentalHealth
SF-36 scales
Not in labour force Unemployed Employed (full/part-time)
0
10
20
30
40
50
60
70
80
90
100
Non-Mäori showed a small tendency for better self-reported health to be associated withlower levels of deprivation, as indexed by the NZDep96 score. This pattern was moresystematic (that is, occurred significantly across more of the scales) in non-Mäori femalesthan non-Mäori males. Mäori showed no clear relationship between SF-36 scores and thedeprivation index. Explanations may relate to the relationship between childhood healthstatus and adult health status, and/or to the geographic distribution of ethnic groups.
* The NZDep96 score measures the level of deprivation in the area in which a person lives, according to a number of census variables,such as the proportion of people in that area who earn low incomes or who receive income support benefits, are unemployed, do notown their own home, have no access to a car, are single-parent families, or have no qualifications. The scores are divided intoquartiles from 1 (least deprived) to 4 (most deprived). For more details, see Chapter 1: The Survey.
161SF-36 Health Status Questionnaire: Demographic
Mean scale scores
PhysicalFunctioning
RolePhysical
BodilyPain
GeneralHealth
Vitality SocialFunctioning
RoleEmotional
MentalHealth
SF-36 scales
4 (most deprived) 3 2 1 (least deprived)
0
10
20
30
40
50
60
70
80
90
100
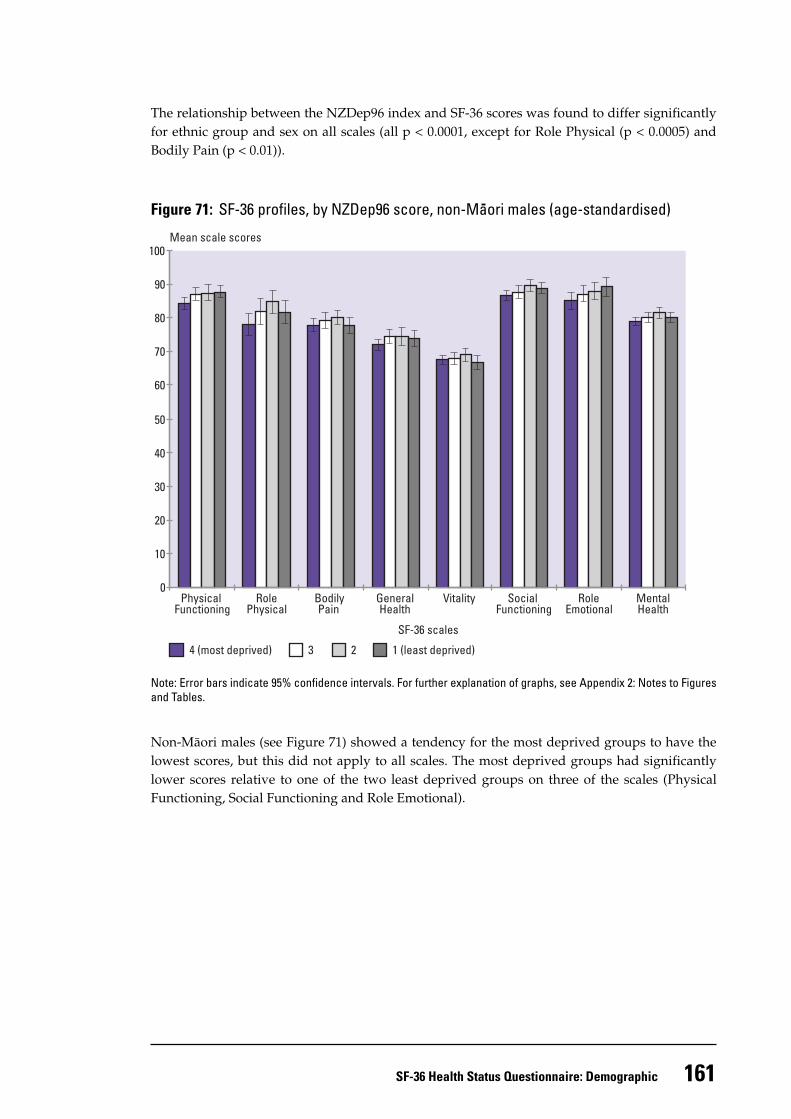
The relationship between the NZDep96 index and SF-36 scores was found to differ significantlyfor ethnic group and sex on all scales (all p < 0.0001, except for Role Physical (p < 0.0005) andBodily Pain (p < 0.01)).
Figure 71: SF-36 profiles, by NZDep96 score, non-Maori males (age-standardised)
Note: Error bars indicate 95% confidence intervals. For further explanation of graphs, see Appendix 2: Notes to Figuresand Tables.
Non-Mäori males (see Figure 71) showed a tendency for the most deprived groups to have thelowest scores, but this did not apply to all scales. The most deprived groups had significantlylower scores relative to one of the two least deprived groups on three of the scales (PhysicalFunctioning, Social Functioning and Role Emotional).
162 Taking the Pulse
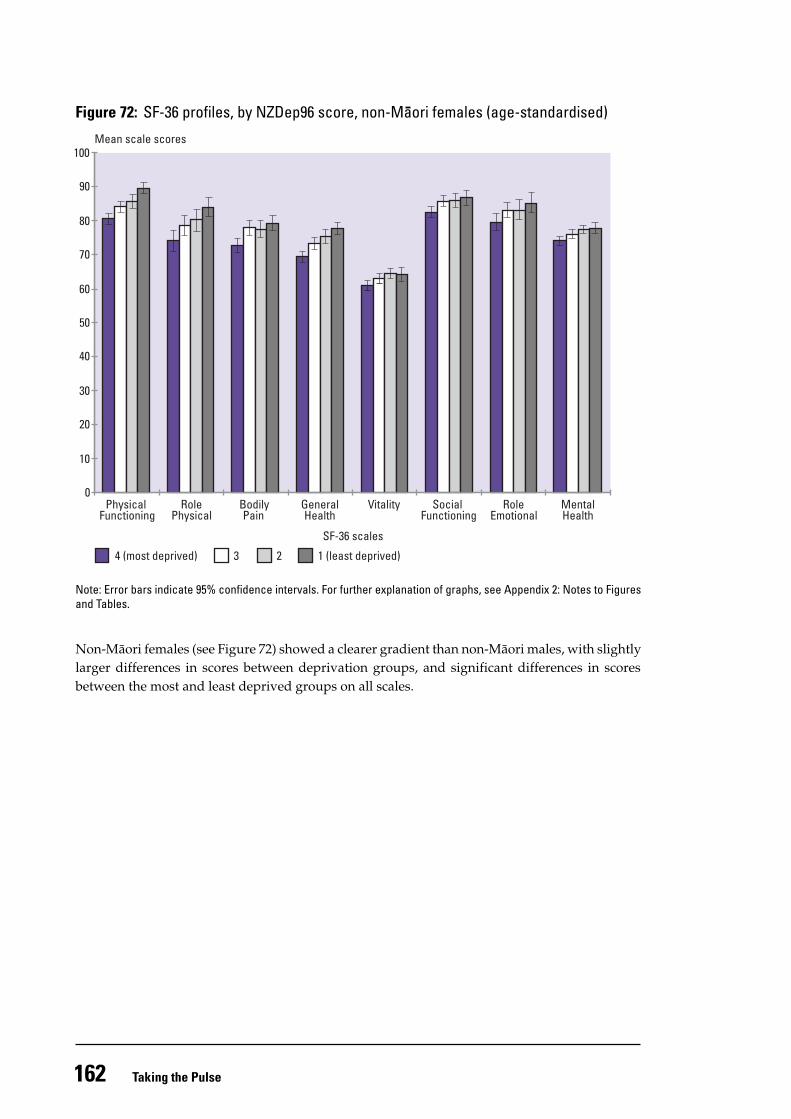
Figure 72: SF-36 profiles, by NZDep96 score, non-Maori females (age-standardised)
Note: Error bars indicate 95% confidence intervals. For further explanation of graphs, see Appendix 2: Notes to Figuresand Tables.
Non-Mäori females (see Figure 72) showed a clearer gradient than non-Mäori males, with slightlylarger differences in scores between deprivation groups, and significant differences in scoresbetween the most and least deprived groups on all scales.
Mean scale scores
PhysicalFunctioning
RolePhysical
BodilyPain
GeneralHealth
Vitality SocialFunctioning
RoleEmotional
MentalHealth
SF-36 scales
4 (most deprived) 3 2 1 (least deprived)
0
10
20
30
40
50
60
70
80
90
100
163SF-36 Health Status Questionnaire: Demographic
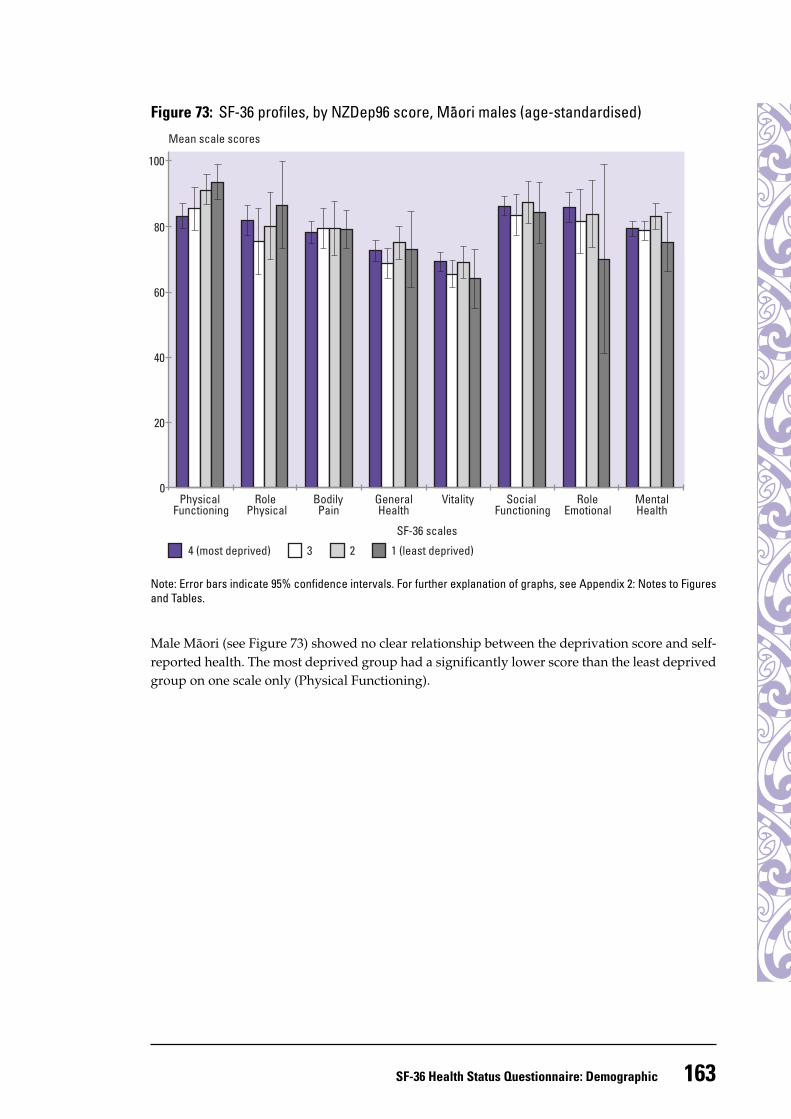
Figure 73: SF-36 profiles, by NZDep96 score, Maori males (age-standardised)
Note: Error bars indicate 95% confidence intervals. For further explanation of graphs, see Appendix 2: Notes to Figuresand Tables.
Male Mäori (see Figure 73) showed no clear relationship between the deprivation score and self-reported health. The most deprived group had a significantly lower score than the least deprivedgroup on one scale only (Physical Functioning).
Mean scale scores
PhysicalFunctioning
RolePhysical
BodilyPain
GeneralHealth
Vitality SocialFunctioning
RoleEmotional
MentalHealth
SF-36 scales
4 (most deprived) 3 2 1 (least deprived)
0
20
40
60
80
100
164 Taking the Pulse
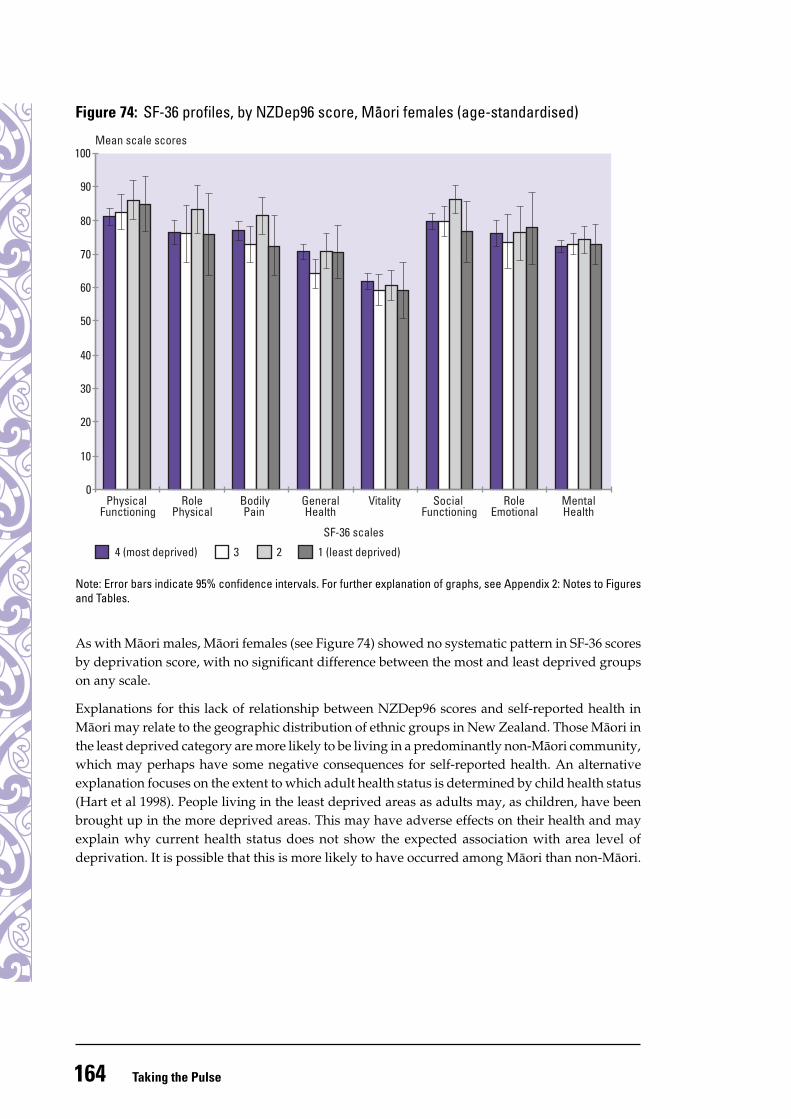
Figure 74: SF-36 profiles, by NZDep96 score, Maori females (age-standardised)
Note: Error bars indicate 95% confidence intervals. For further explanation of graphs, see Appendix 2: Notes to Figuresand Tables.
As with Mäori males, Mäori females (see Figure 74) showed no systematic pattern in SF-36 scoresby deprivation score, with no significant difference between the most and least deprived groupson any scale.
Explanations for this lack of relationship between NZDep96 scores and self-reported health inMäori may relate to the geographic distribution of ethnic groups in New Zealand. Those Mäori inthe least deprived category are more likely to be living in a predominantly non-Mäori community,which may perhaps have some negative consequences for self-reported health. An alternativeexplanation focuses on the extent to which adult health status is determined by child health status(Hart et al 1998). People living in the least deprived areas as adults may, as children, have beenbrought up in the more deprived areas. This may have adverse effects on their health and mayexplain why current health status does not show the expected association with area level ofdeprivation. It is possible that this is more likely to have occurred among Mäori than non-Mäori.
Mean scale scores
PhysicalFunctioning
RolePhysical
BodilyPain
GeneralHealth
Vitality SocialFunctioning
RoleEmotional
MentalHealth
SF-36 scales
4 (most deprived) 3 2 1 (least deprived)
0
10
20
30
40
50
60
70
80
90
100
165SF-36 Health Status Questionnaire: Demographic
SF-36 and socioeconomic indicators: conclusion
ReferencesAngel R, Gronfein W. 1988. The use of subjective information in statistical models. American
Sociological Review 53: 464–73.Angel R, Guarnaccia PJ. 1989. Mind, body and culture: somatization among Hispanics. Soc Sci
Med 28:1229–38.Australian Bureau of Statistics. 1997. 1995 National Health Survey. SF-36 Population Norms. Australia.
Canberra: Australian Bureau of Statistics.Australian Institute of Health and Welfare. 1996. Australia’s Health 1996: The 5th biennial report of
the Australian Institute of Health and Welfare. Canberra: Australian Government Printing Service.Australian Institute of Health and Welfare. 1998. Australia’s Health 1998: The 6th biennial report of
the Australian Institute of Health and Welfare. Canberra: Australian Government Printing Service.Hart CL, Smith GD, Blane D. 1998. Social mobility and 21 year mortality in a cohort of Scottish
men. Soc Sci Med 47:1121–30.Health Funding Authority and Ministry of Health. 1998. Disability in New Zealand: Overview of the
1996/97 surveys. Wellington: Health Funding Authority and Ministry of Health.Hemingway H, Stafford M, Stansfeld S, et al. 1997. Is the SF-36 a valid measure of change in
population health? Results from the Whitehall II study. BMJ 315: 1273–9.Ministry of Health. 1998a. Health Expectancy in New Zealand. Unpublished report.Ministry of Health. 1998b. Progress on Health Outcome Targets: Te Haere Whakamua Ki Ngä Whäinga
Hua Mö Te Hauora. Wellington: Ministry of Health.National Advisory Committee on Health and Disability. 1998. The Social, Cultural and Economic
Determinants of Health in New Zealand: Action to improve health. Wellington: National AdvisoryCommittee on Health and Disability.
There is considerable literature documenting a close association between differentmeasures of socioeconomic status (SES) and health outcomes (National AdvisoryCommittee on Health and Disability 1998). This association was demonstrated in someof the findings presented above; however, the relationship between the SF-36 and SESindicators was not always clear-cut. That is, the frequently documented linear associationbetween improving health status and increasing SES did not occur systematically inboth ethnic groups, or in both sexes, for all variables. This variability may be explainedby one or a combination of the following considerations:
• Differences in health status between Mäori and non-Mäori cannot be totally explainedby SES: cultural factors also play a role (Pearce et al 1983; Pearce et al 1993).
• SES variables such as labour force status and income may have different meanings fordifferent cultures, and for males and females (Angel and Gronfein 1988).
• Most of the SES variables included in this analysis measure current SES and fluctuateconsiderably across time. They are confounded, therefore, by the extent to which adulthealth status is determined by childhood health status and environment. A numberof studies have concluded that the main influence of SES on health outcomes is acumulative one, acting across the life span (Hart et al 1998).
166 Taking the Pulse
Pearce NE, Davis PB, Smith AH, et al. 1983. Mortality and social class in New Zealand. I: overallmale mortality. NZ Med J 96: 281–5.
Pearce NE, Pomare E, Marshall S, et al. 1993. Mortality and social class in Mäori and non-MäoriNew Zealand men: changes between 1975–7 and 1985–7. NZ Med J 106:193–6.
Scott KM, Tobias MI, Sarfati D, et al. SF-36 health survey reliability, validity, and norms for NewZealand. Aust NZ J public Health. (In press.)
Scott KM, Sarfati D, Tobias MI, et al. 1999. A challenge to the cross-cultural validity of the SF-36health survey: a comparative factor analysis in Mäori, Pacific and New Zealand European ethnicgroups. Manuscript submitted for publication.
Shetterly SM, Baxter J, Mason LD, et al. 1996. Self-rated health among Hispanic vs non-Hispanicwhite adults: the San Luis Valley Health and Aging study. Am J Public Health. 86: 1798–801.
Ware JE, Sherbourne CD. 1992. The MOS 36-item short-form health survey. I: conceptual frameworkand item selection. Med Care 30: 473–83.
Ware JE, Snow KK, Kosinski M, et al. 1993. SF-36 Health Survey Manual and Interpretation Guide.Boston, MA: The Health Institute.