Embed Size (px)
Citation preview
7/29/2019 Chapter 10 Classroom Ppt
http://slidepdf.com/reader/full/chapter-10-classroom-ppt 1/41
10-1 Quality Control
William J. Stevenson
Operations Management
8th edition
7/29/2019 Chapter 10 Classroom Ppt
http://slidepdf.com/reader/full/chapter-10-classroom-ppt 2/41
10-2 Quality Control
CHAPTER
10
Quality Control
McGraw-Hill/Irwin
Operations Management, Eighth Edition, by William J. StevensonCopyright © 2005 by The McGraw-Hill Companies, Inc. All rights reserved.
7/29/2019 Chapter 10 Classroom Ppt
http://slidepdf.com/reader/full/chapter-10-classroom-ppt 3/41
10-3 Quality Control
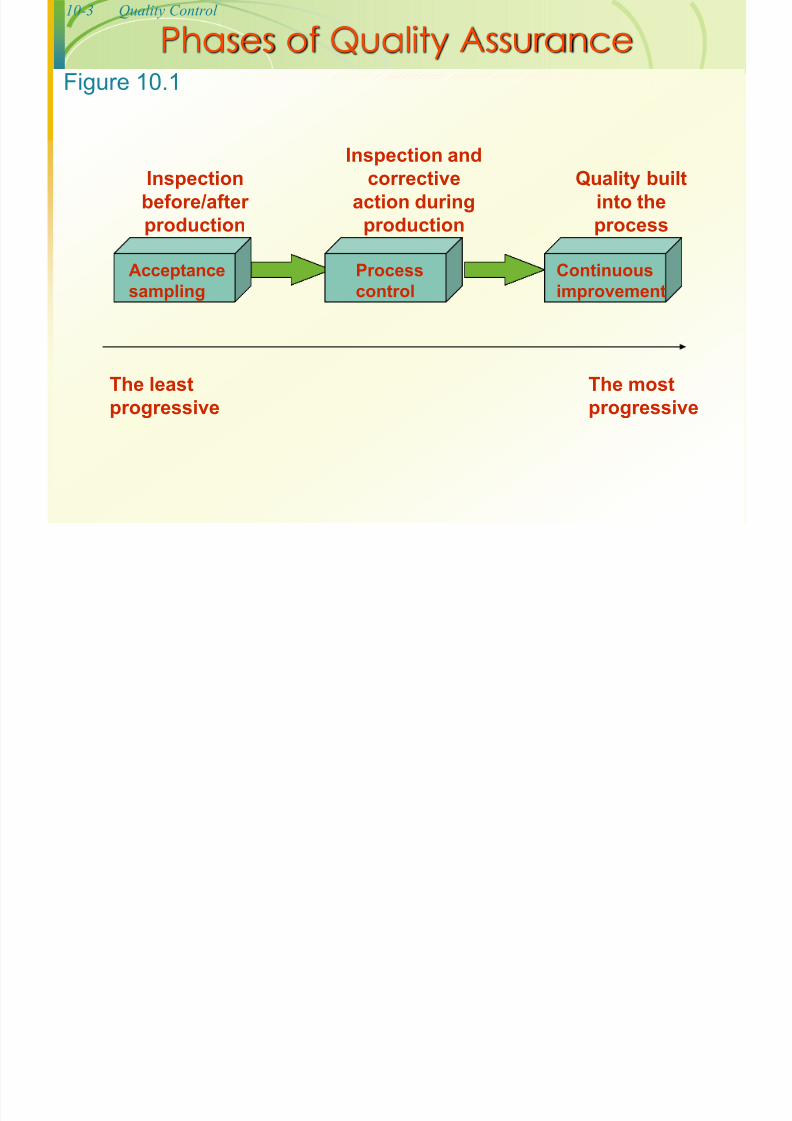
Phases of Quality Assurance
Acceptance
sampling
Process
control
Continuous
improvement
Inspection
before/after
production
Inspection and
corrective
action during
production
Quality built
into the
process
The least
progressive
The most
progressive
Figure 10.1
7/29/2019 Chapter 10 Classroom Ppt
http://slidepdf.com/reader/full/chapter-10-classroom-ppt 4/41
10-4 Quality Control
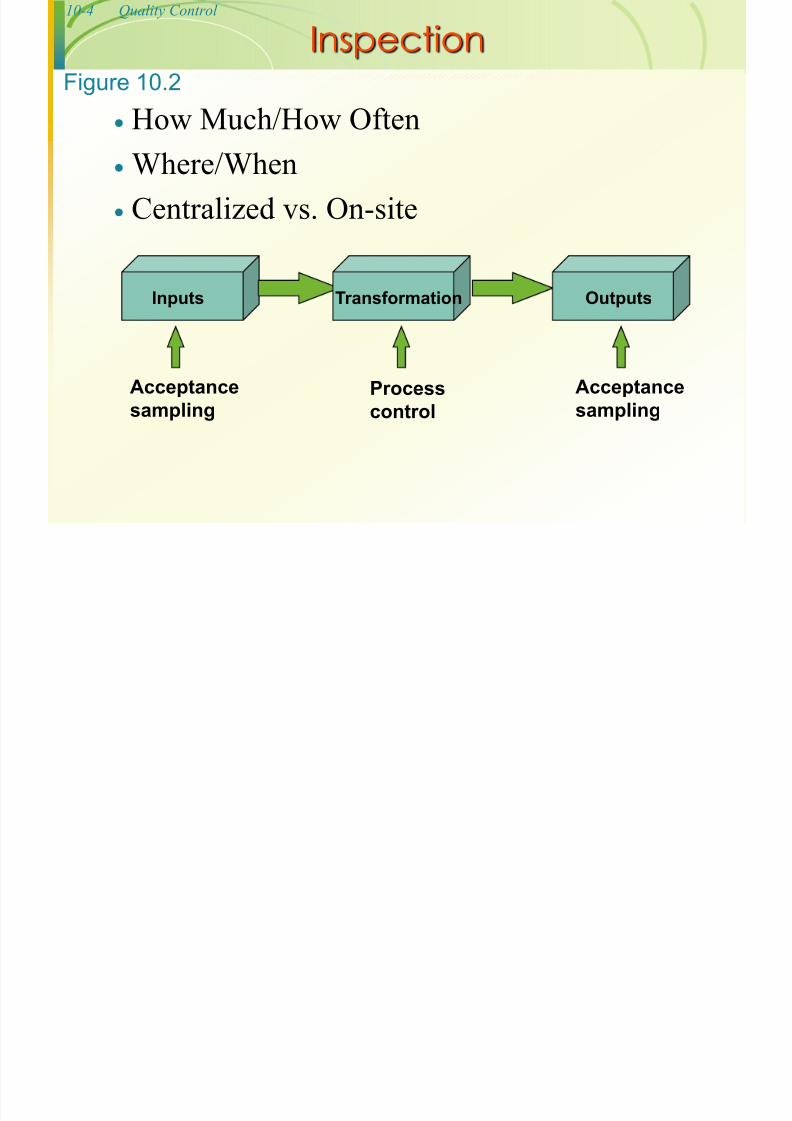
Inspection How Much/How Often Where/When
Centralized vs. On-site
Inputs Transformation Outputs
Acceptance
samplingProcess
control
Acceptance
sampling
Figure 10.2
7/29/2019 Chapter 10 Classroom Ppt
http://slidepdf.com/reader/full/chapter-10-classroom-ppt 5/41
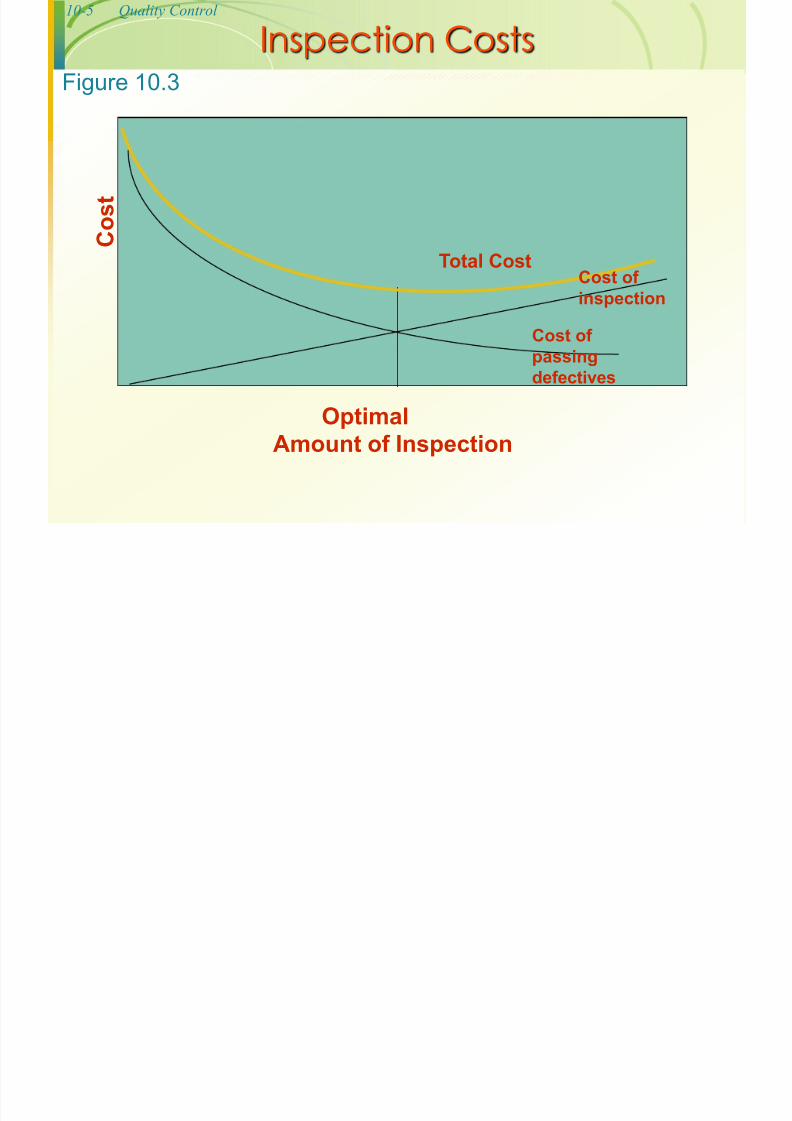
10-5 Quality Control
C
o s t
Optimal
Amount of Inspection
Inspection Costs
Cost of
inspection
Cost of
passing
defectives
Total Cost
Figure 10.3
7/29/2019 Chapter 10 Classroom Ppt
http://slidepdf.com/reader/full/chapter-10-classroom-ppt 6/41
10-6 Quality Control
Where to Inspect in the Process Raw materials and purchased parts
Finished products
Before a costly operation Before an irreversible process
Before a covering process
7/29/2019 Chapter 10 Classroom Ppt
http://slidepdf.com/reader/full/chapter-10-classroom-ppt 7/41
10-7 Quality Control
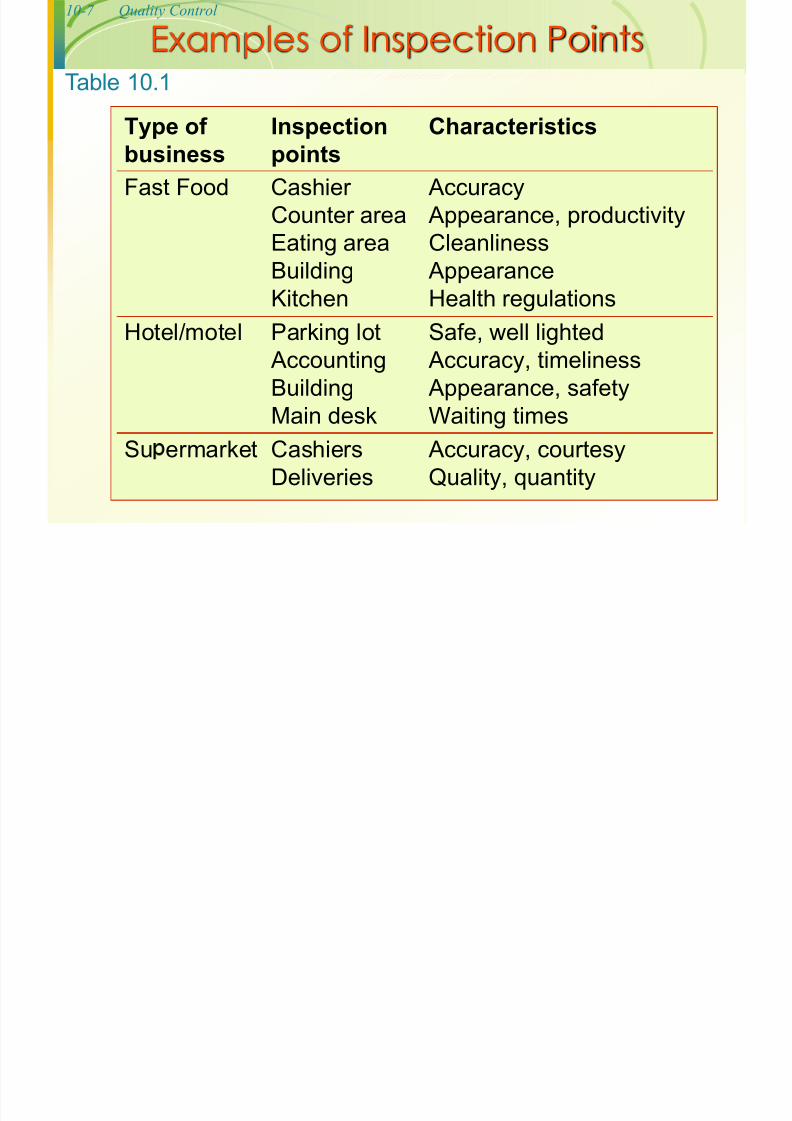
Examples of Inspection Points Type of business
Inspectionpoints
Characteristics
Fast Food Cashier
Counter area
Eating areaBuilding
Kitchen
Accuracy
Appearance, productivity
Cleanliness Appearance
Health regulations
Hotel/motel Parking lot
AccountingBuilding
Main desk
Safe, well lighted
Accuracy, timeliness Appearance, safety
Waiting times
Su ermarket Cashiers
Deliveries
Accuracy, courtesy
Quality, quantity
Table 10.1
7/29/2019 Chapter 10 Classroom Ppt
http://slidepdf.com/reader/full/chapter-10-classroom-ppt 8/41
10-8 Quality Control
Statistical Process Control :Statistical evaluation of the output of a processduring production
Quality of Conformance:A product or service conforms tospecifications
7/29/2019 Chapter 10 Classroom Ppt
http://slidepdf.com/reader/full/chapter-10-classroom-ppt 9/41
10-9 Quality Control
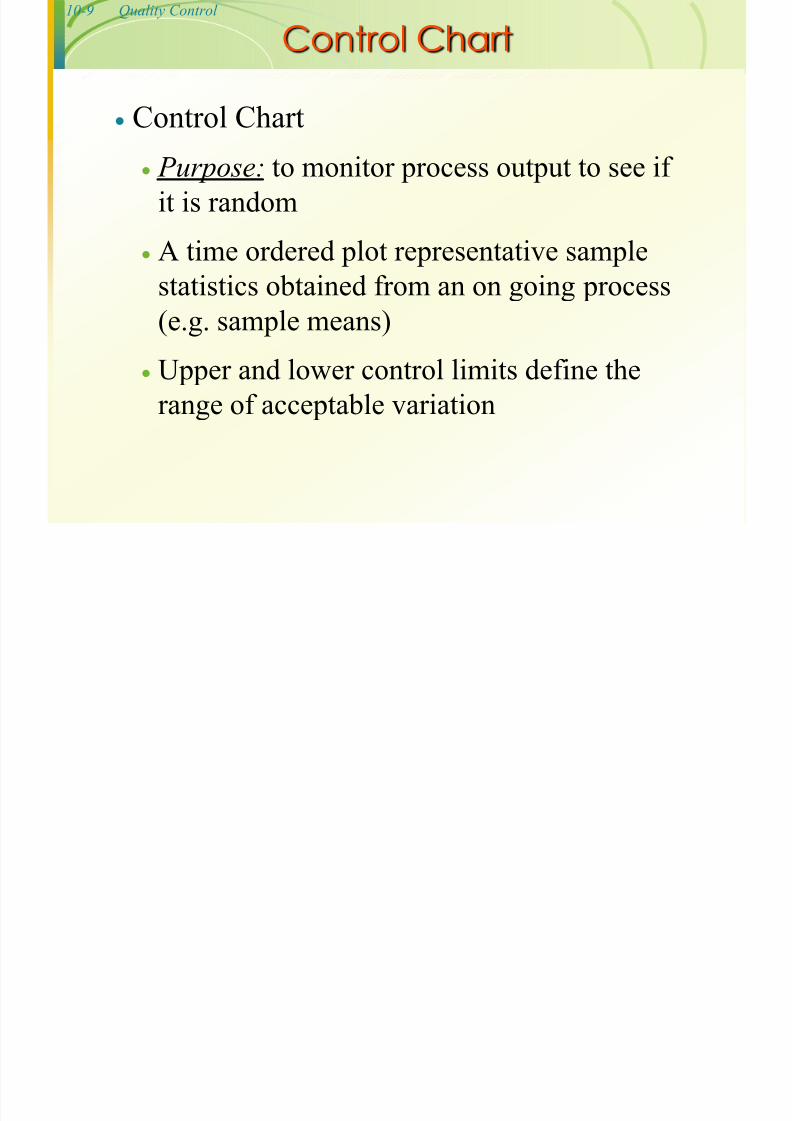
Control Chart
Control Chart Purpose: to monitor process output to see if
it is random
A time ordered plot representative samplestatistics obtained from an on going process
(e.g. sample means)
Upper and lower control limits define therange of acceptable variation
7/29/2019 Chapter 10 Classroom Ppt
http://slidepdf.com/reader/full/chapter-10-classroom-ppt 10/41
10-10 Quality Control
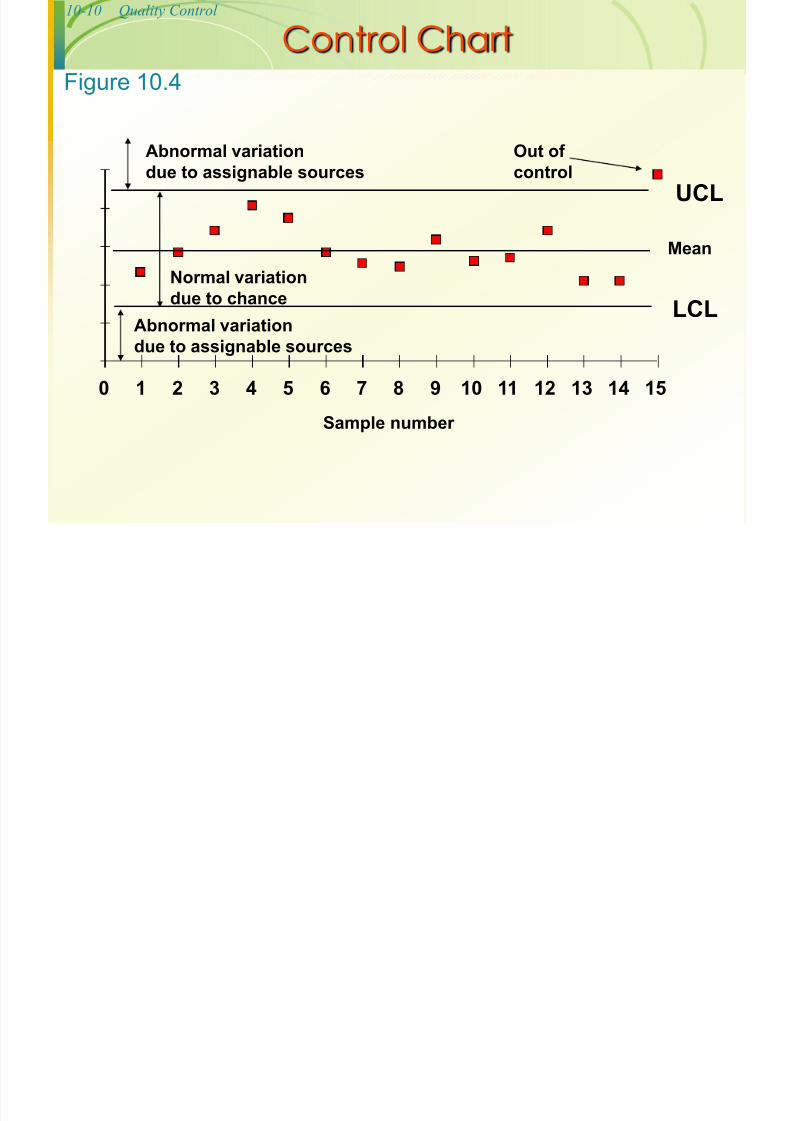
Control Chart
0 1 2 3 4 5 6 7 8 9 10 11 12 13 14 15
UCL
LCL
Sample number
Mean
Out of
control
Normal variation
due to chance
Abnormal variation
due to assignable sources
Abnormal variation
due to assignable sources
Figure 10.4
10 11 Q l C l
7/29/2019 Chapter 10 Classroom Ppt
http://slidepdf.com/reader/full/chapter-10-classroom-ppt 11/41
10-11 Quality Control
Statistical Process Control
The essence of statistical process control isto assure that the output of a process is
random so that future output will be random.
10 12 Q li C l
7/29/2019 Chapter 10 Classroom Ppt
http://slidepdf.com/reader/full/chapter-10-classroom-ppt 12/41
10-12 Quality Control
Statistical Process Control The Control Process
Define
Measure
Compare Evaluate
Correct
Monitor results
10 13 Q li C l
7/29/2019 Chapter 10 Classroom Ppt
http://slidepdf.com/reader/full/chapter-10-classroom-ppt 13/41
10-13 Quality Control
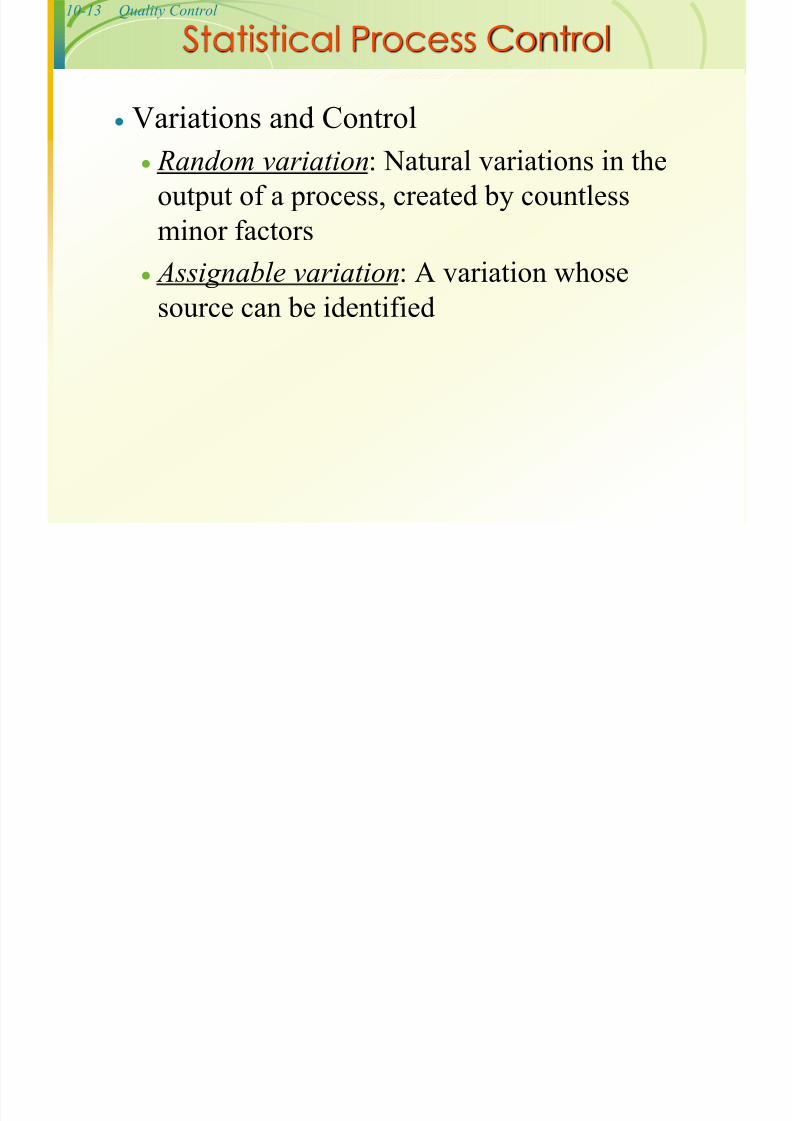
Statistical Process Control Variations and Control
Random variation: Natural variations in the
output of a process, created by countless
minor factors
Assignable variation: A variation whose
source can be identified
10 14 Q lit C t l
7/29/2019 Chapter 10 Classroom Ppt
http://slidepdf.com/reader/full/chapter-10-classroom-ppt 14/41
10-14 Quality Control
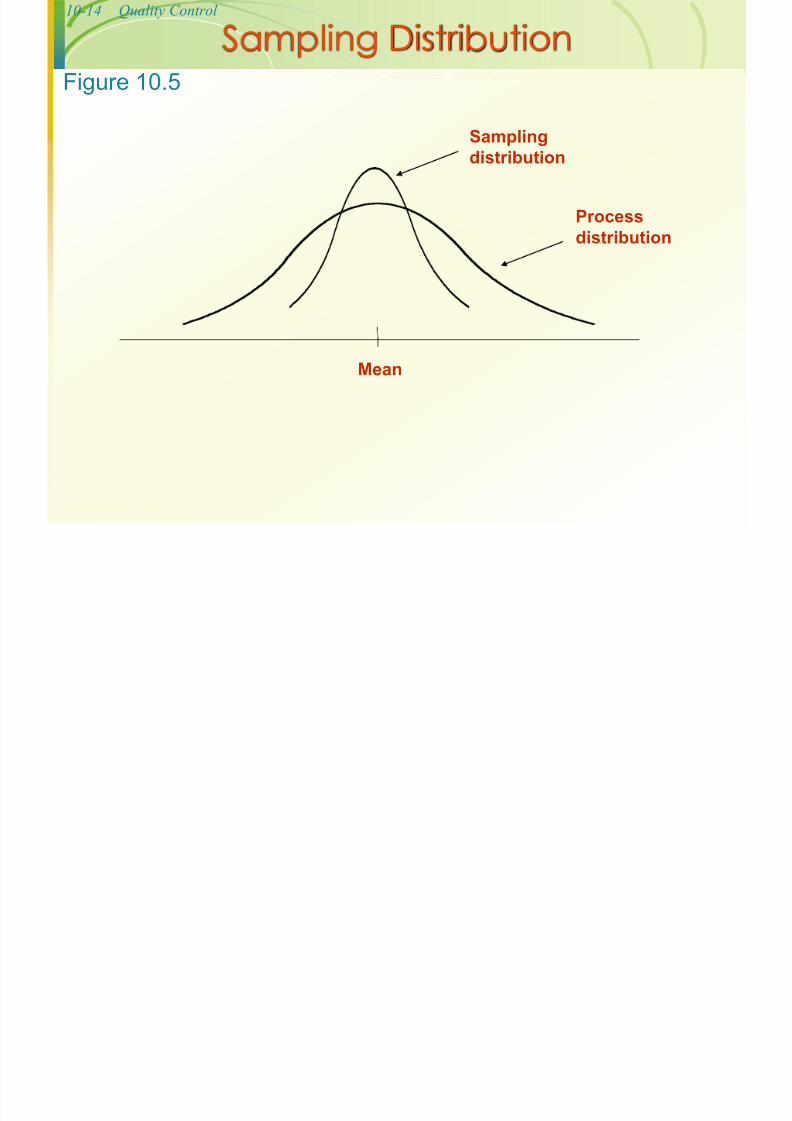
Sampling Distribution Sampling
distribution
Process
distribution
Mean
Figure 10.5
10 15 Q lit C t l
7/29/2019 Chapter 10 Classroom Ppt
http://slidepdf.com/reader/full/chapter-10-classroom-ppt 15/41
10-15 Quality Control
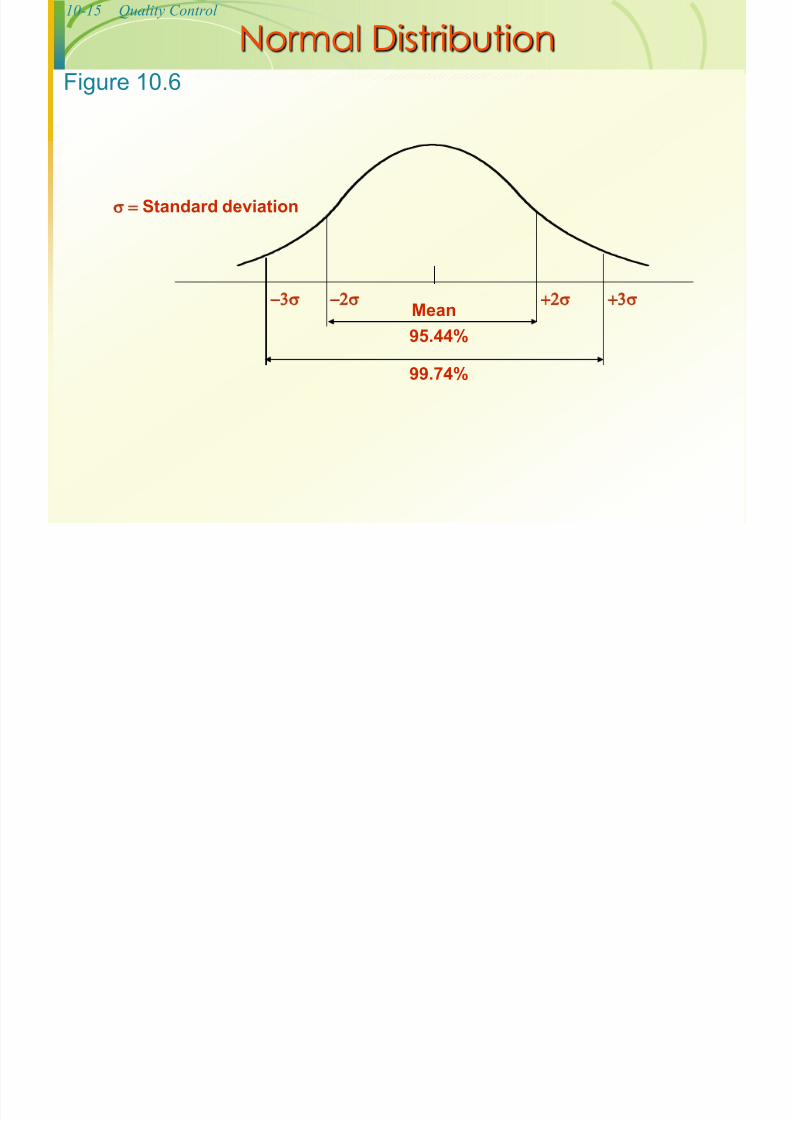
Normal Distribution
Mean
95.44%
99.74%
Standard deviation
Figure 10.6
10 16 Q lit C t l
7/29/2019 Chapter 10 Classroom Ppt
http://slidepdf.com/reader/full/chapter-10-classroom-ppt 16/41
10-16 Quality Control
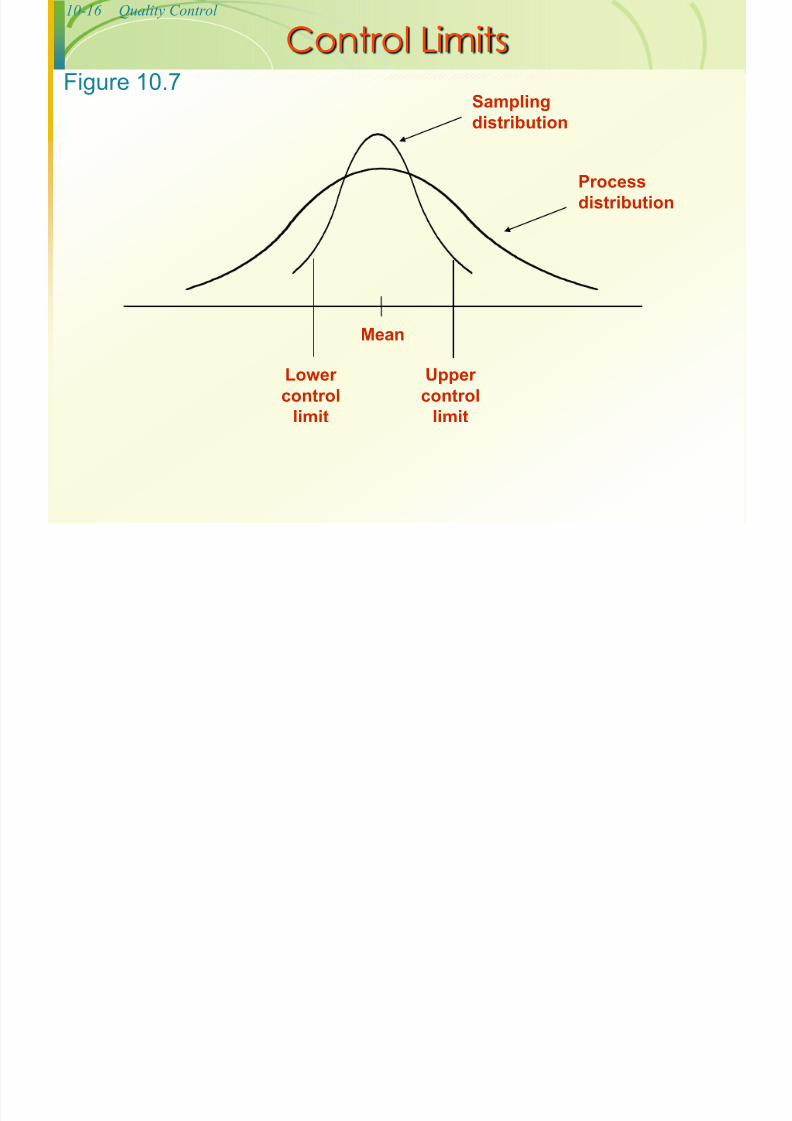
Control Limits Sampling
distribution
Process
distribution
Mean
Lower control
limit
Upper control
limit
Figure 10.7
10 17 Quality Control
7/29/2019 Chapter 10 Classroom Ppt
http://slidepdf.com/reader/full/chapter-10-classroom-ppt 17/41
10-17 Quality Control
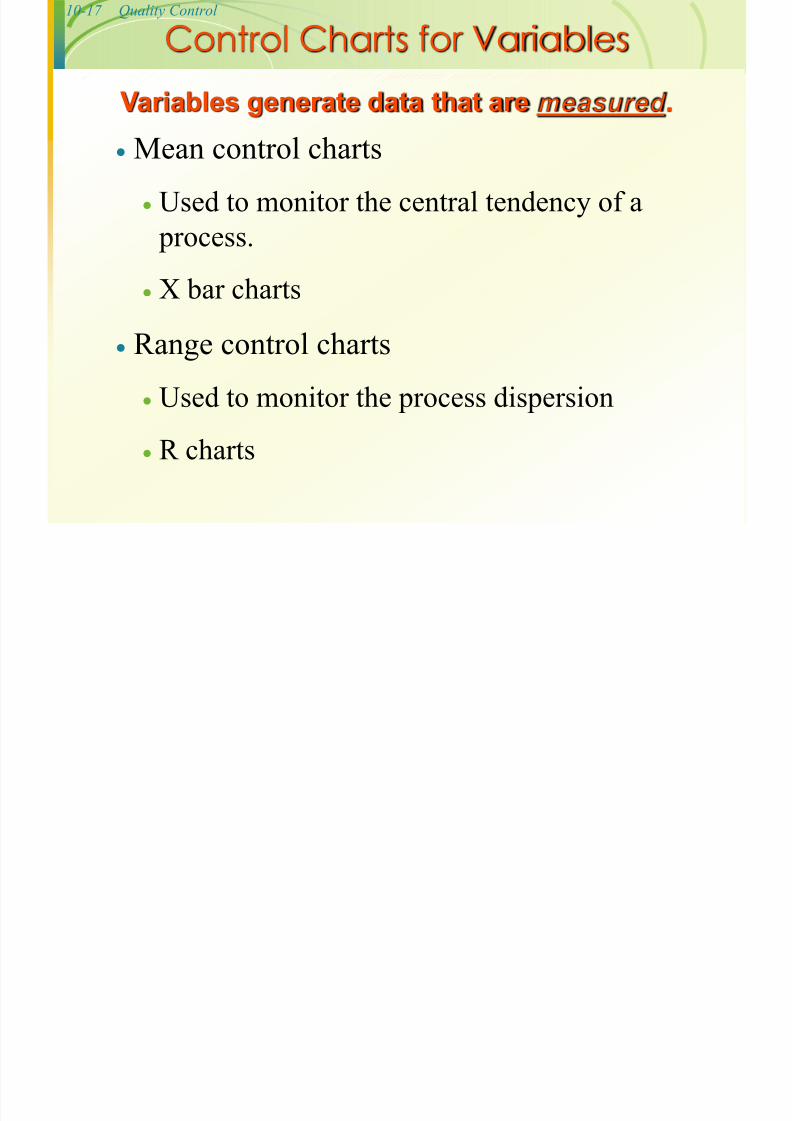
Control Charts for Variables
Mean control charts
Used to monitor the central tendency of a
process. X bar charts
Range control charts
Used to monitor the process dispersion
R charts
Variables generate data that are measured .
10 18 Quality Control
7/29/2019 Chapter 10 Classroom Ppt
http://slidepdf.com/reader/full/chapter-10-classroom-ppt 18/41
10-18 Quality Control
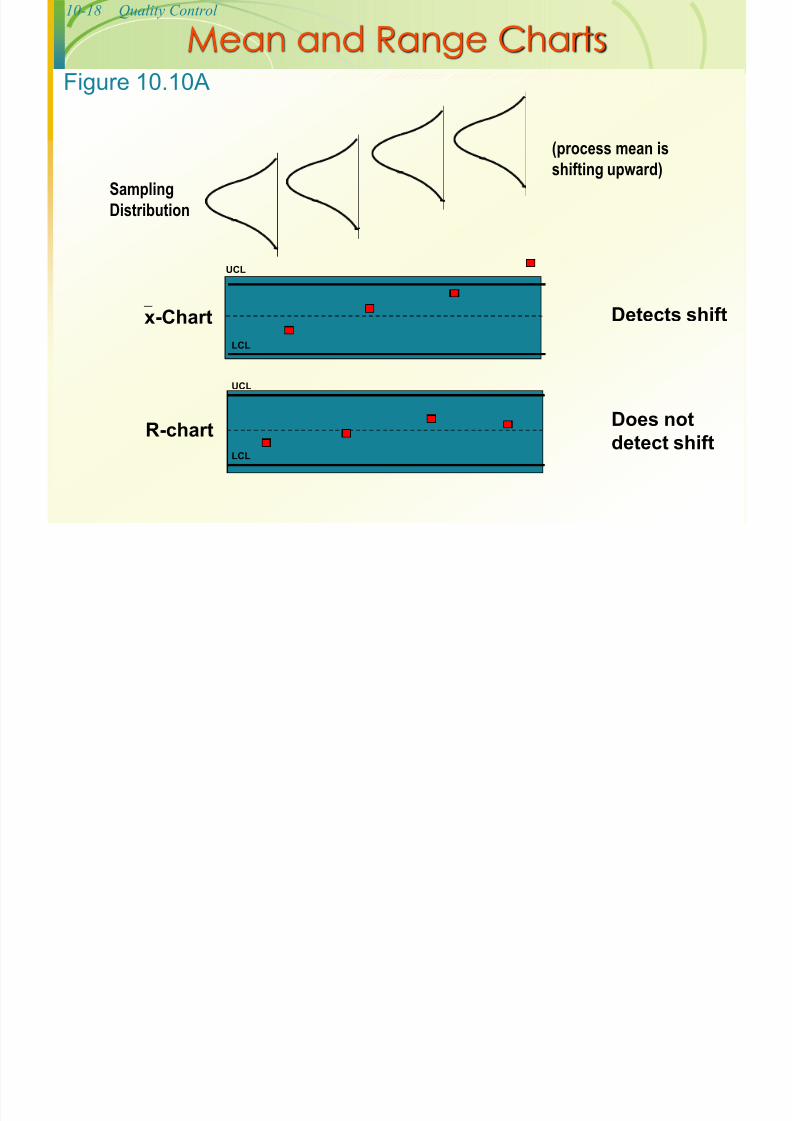
Mean and Range Charts
UCL
LCL
UCL
LCL
R-chart
x-Chart Detects shift
Does not
detect shift
Figure 10.10A
(process mean is
shifting upward)Sampling
Distribution
10 19 Quality Control
7/29/2019 Chapter 10 Classroom Ppt
http://slidepdf.com/reader/full/chapter-10-classroom-ppt 19/41
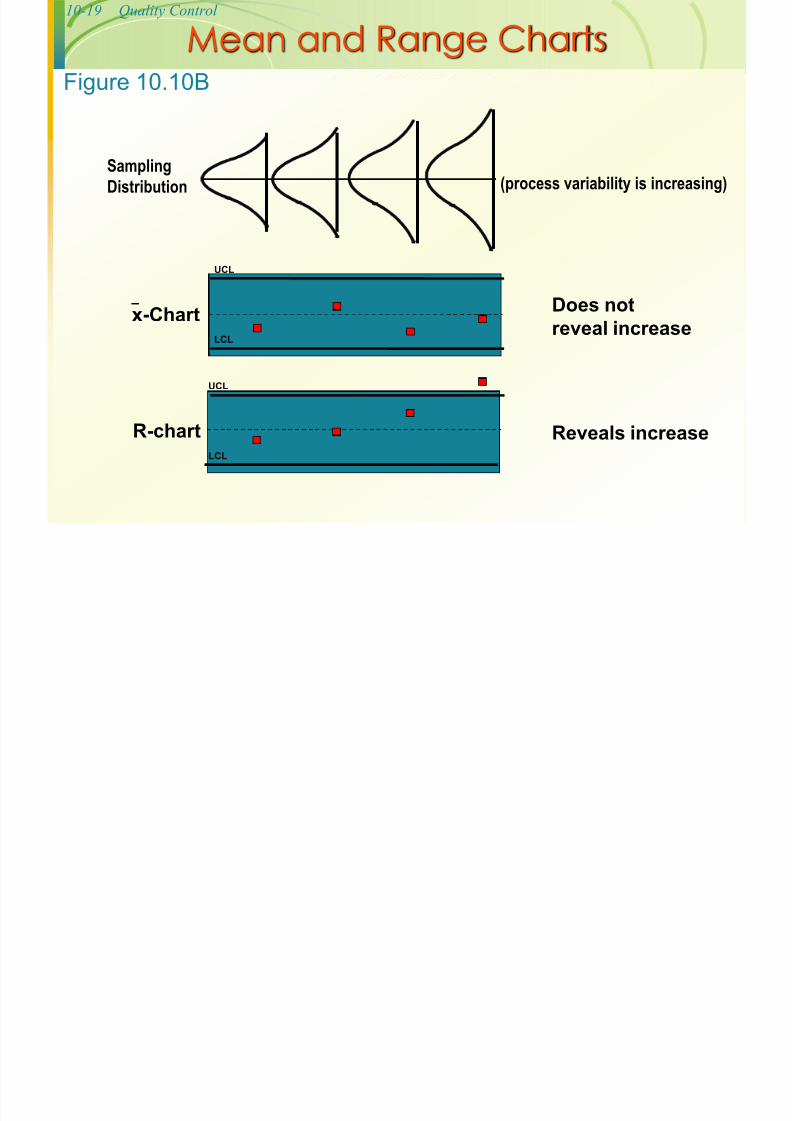
10-19 Quality Control
x-Chart
UCL
Does not
reveal increase
Mean and Range Charts
UCL
LCL
LCL
R-chart Reveals increase
Figure 10.10B
(process variability is increasing)Sampling
Distribution
10 20 Quality Control
7/29/2019 Chapter 10 Classroom Ppt
http://slidepdf.com/reader/full/chapter-10-classroom-ppt 20/41
10-20 Quality Control
Control Chart for Attributes p-Chart - Control chart used to monitor the proportion of defectives in a process
c-Chart - Control chart used to monitor the
number of defects per unit
Attributes generate data that are counted .
10-21 Quality Control
7/29/2019 Chapter 10 Classroom Ppt
http://slidepdf.com/reader/full/chapter-10-classroom-ppt 21/41
10-21 Quality Control
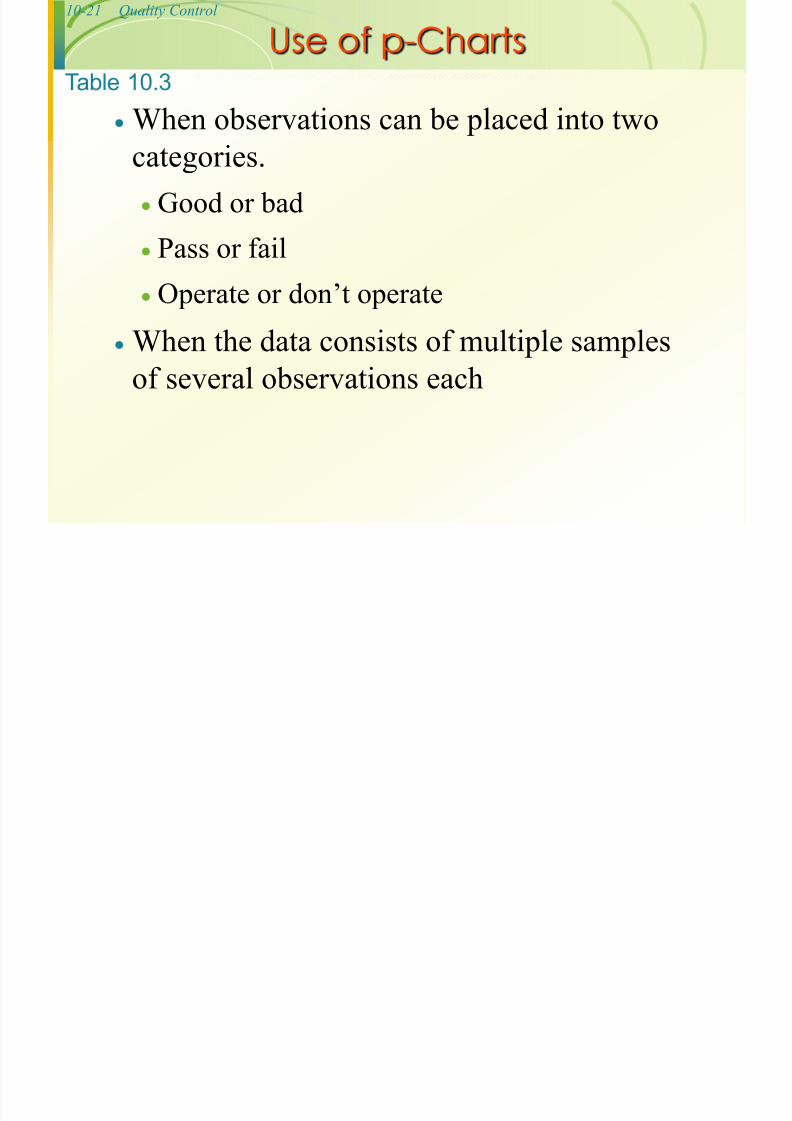
Use of p-Charts When observations can be placed into two
categories.
Good or bad
Pass or fail
Operate or don’t operate
When the data consists of multiple samples
of several observations each
Table 10.3
10-22 Quality Control
7/29/2019 Chapter 10 Classroom Ppt
http://slidepdf.com/reader/full/chapter-10-classroom-ppt 22/41
10-22 Quality Control
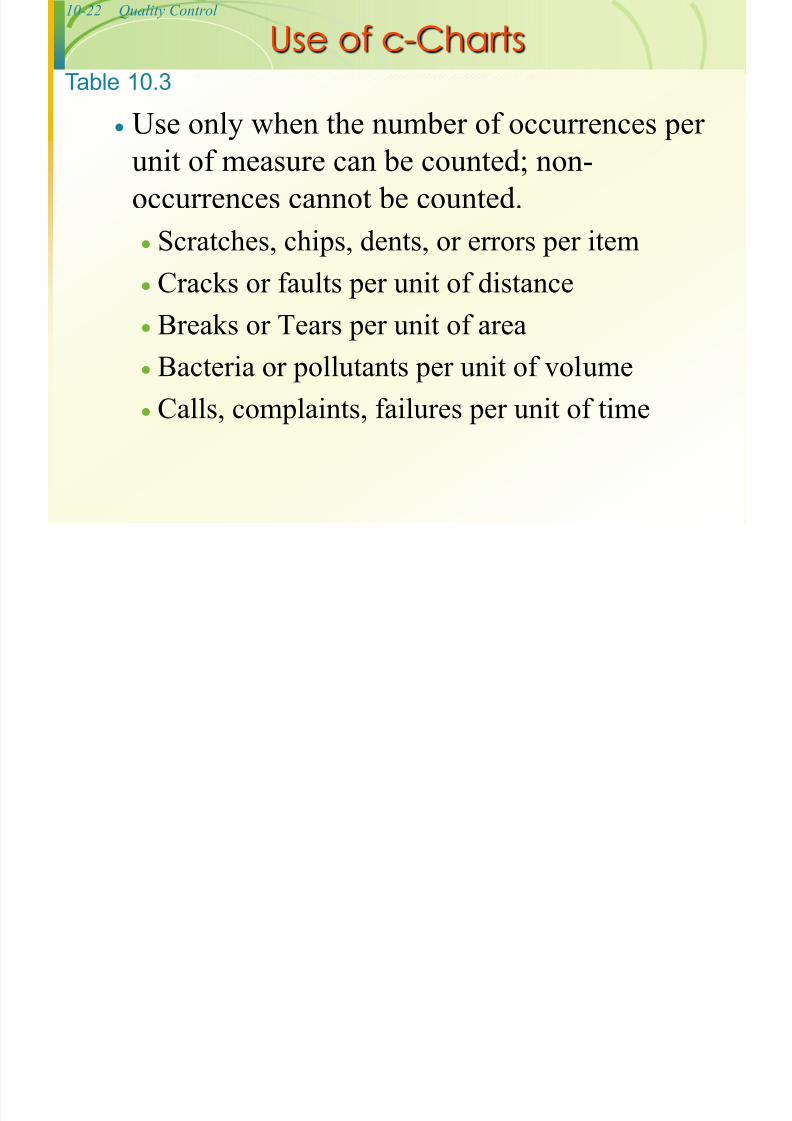
Use of c-Charts Use only when the number of occurrences per
unit of measure can be counted; non-
occurrences cannot be counted.
Scratches, chips, dents, or errors per item Cracks or faults per unit of distance
Breaks or Tears per unit of area
Bacteria or pollutants per unit of volume Calls, complaints, failures per unit of time
Table 10.3
10-23 Quality Control
7/29/2019 Chapter 10 Classroom Ppt
http://slidepdf.com/reader/full/chapter-10-classroom-ppt 23/41
10 23 Quality Control
Use of Control Charts
At what point in the process to use controlcharts
What size samples to take
What type of control chart to use
Variables
Attributes
10-24 Quality Control
7/29/2019 Chapter 10 Classroom Ppt
http://slidepdf.com/reader/full/chapter-10-classroom-ppt 24/41
10 24 Quality Control
Tolerances or specifications Range of acceptable values established by
engineering design or customer requirements
Process variability
Natural variability in a process
Process capability Process variability relative to specification
Process Capability
10-25 Quality Control
7/29/2019 Chapter 10 Classroom Ppt
http://slidepdf.com/reader/full/chapter-10-classroom-ppt 25/41
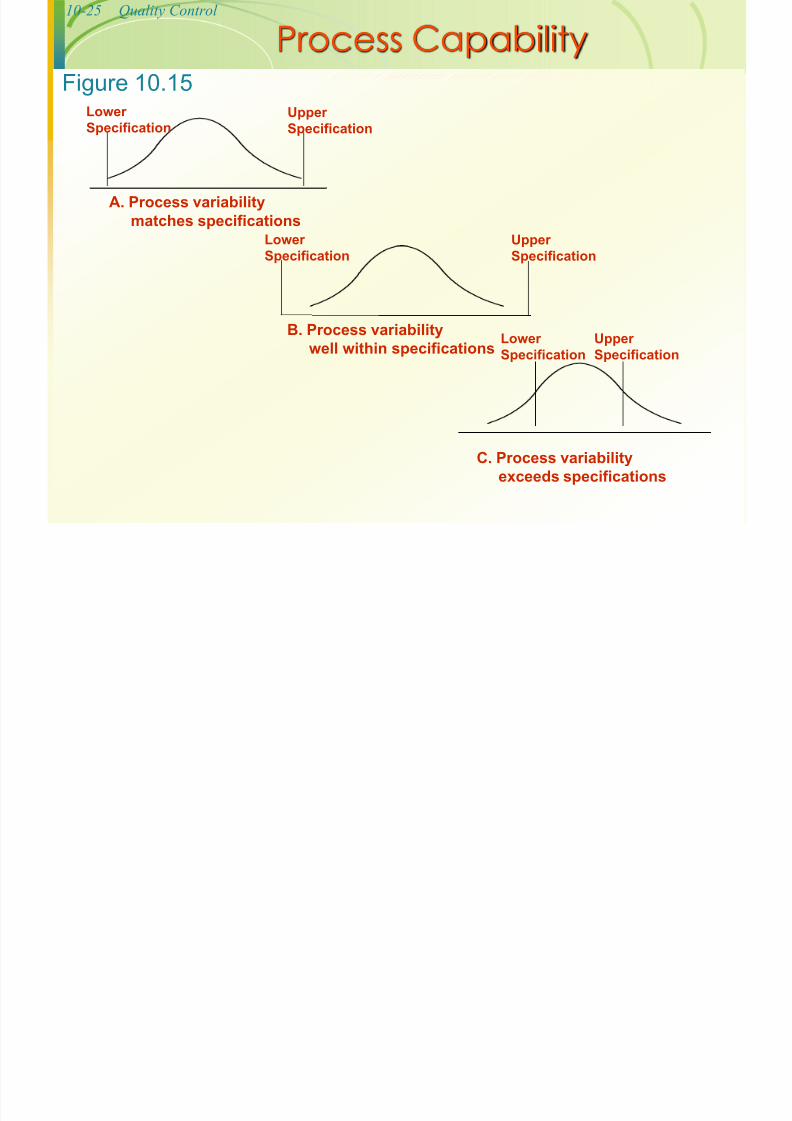
10 25 Quality Control
Process Capability
Lower
Specification
Upper
Specification
A. Process variability
matches specificationsLower
Specification
Upper
Specification
B. Process variability
well within specificationsLower
Specification
Upper
Specification
C. Process variability
exceeds specifications
Figure 10.15
10-26 Quality Control
7/29/2019 Chapter 10 Classroom Ppt
http://slidepdf.com/reader/full/chapter-10-classroom-ppt 26/41
10 26 Quality Control
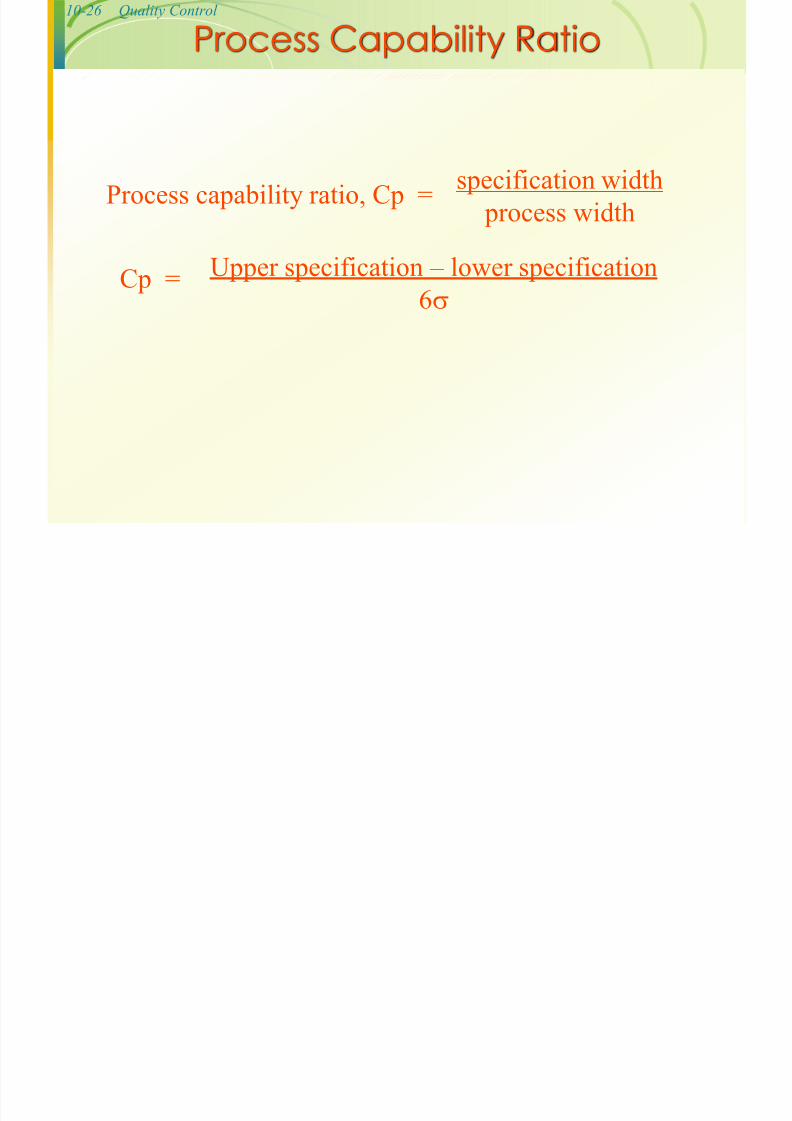
Process Capability Ratio
Process capability ratio, Cp =specification width
process width
Upper specification – lower specification
6 Cp =
10-27 Quality Control
7/29/2019 Chapter 10 Classroom Ppt
http://slidepdf.com/reader/full/chapter-10-classroom-ppt 27/41
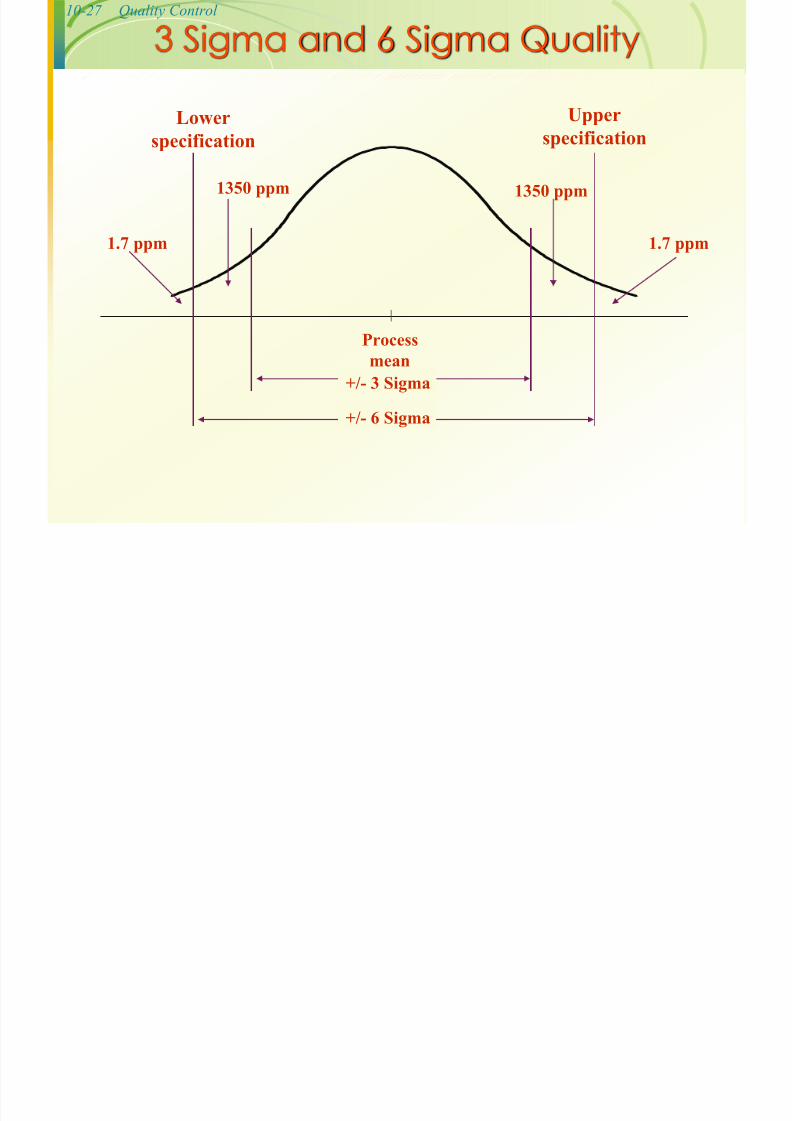
Q y
Process
mean
Lowerspecification
Upper
specification
1350 ppm 1350 ppm
1.7 ppm 1.7 ppm
+/- 3 Sigma
+/- 6 Sigma
3 Sigma and 6 Sigma Quality
10-28 Quality Control
7/29/2019 Chapter 10 Classroom Ppt
http://slidepdf.com/reader/full/chapter-10-classroom-ppt 28/41
Q y
Improving Process Capability
Simplify Standardize
Mistake-proof
Upgrade equipment
Automate
10-29 Quality Control
7/29/2019 Chapter 10 Classroom Ppt
http://slidepdf.com/reader/full/chapter-10-classroom-ppt 29/41
Q y
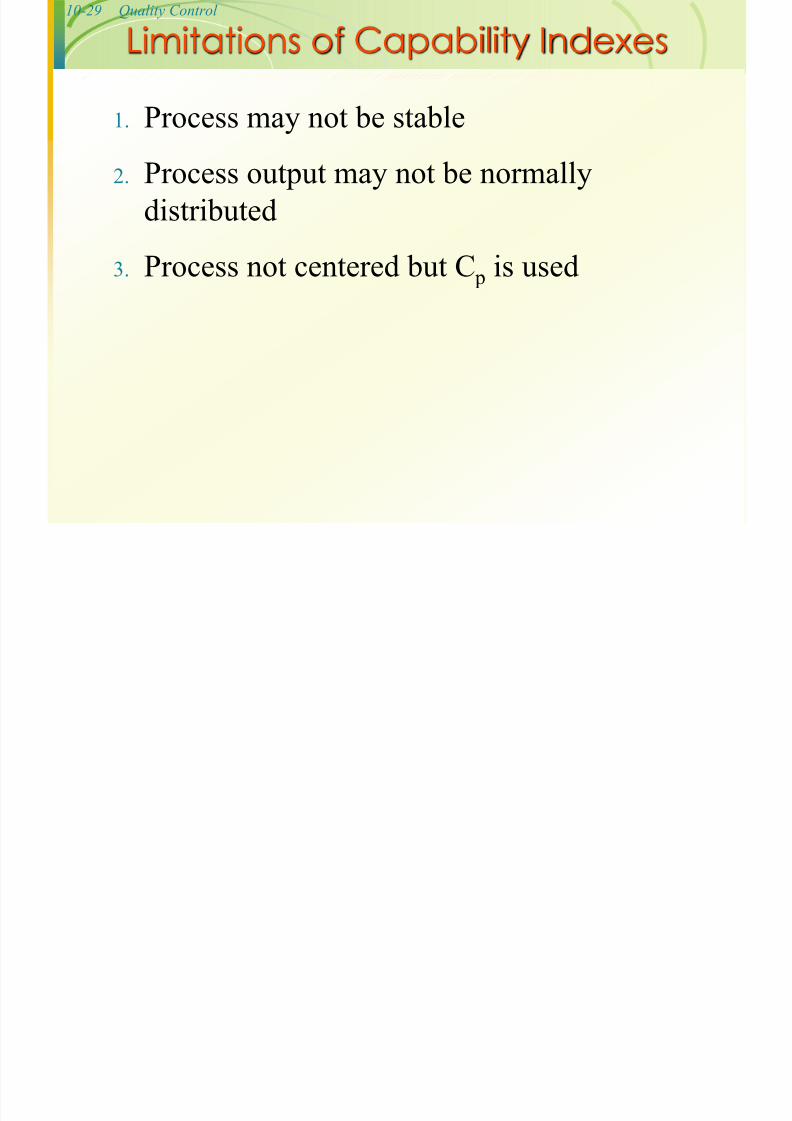
Limitations of Capability Indexes
1. Process may not be stable2. Process output may not be normally
distributed
3. Process not centered but C p is used
10-30 Quality Control
7/29/2019 Chapter 10 Classroom Ppt
http://slidepdf.com/reader/full/chapter-10-classroom-ppt 30/41
Q y
Additional PowerPoint slides
contributed by Geoff Willis,
University of Central Oklahoma.
CHAPTER
10
10-31 Quality Control
7/29/2019 Chapter 10 Classroom Ppt
http://slidepdf.com/reader/full/chapter-10-classroom-ppt 31/41
Q y
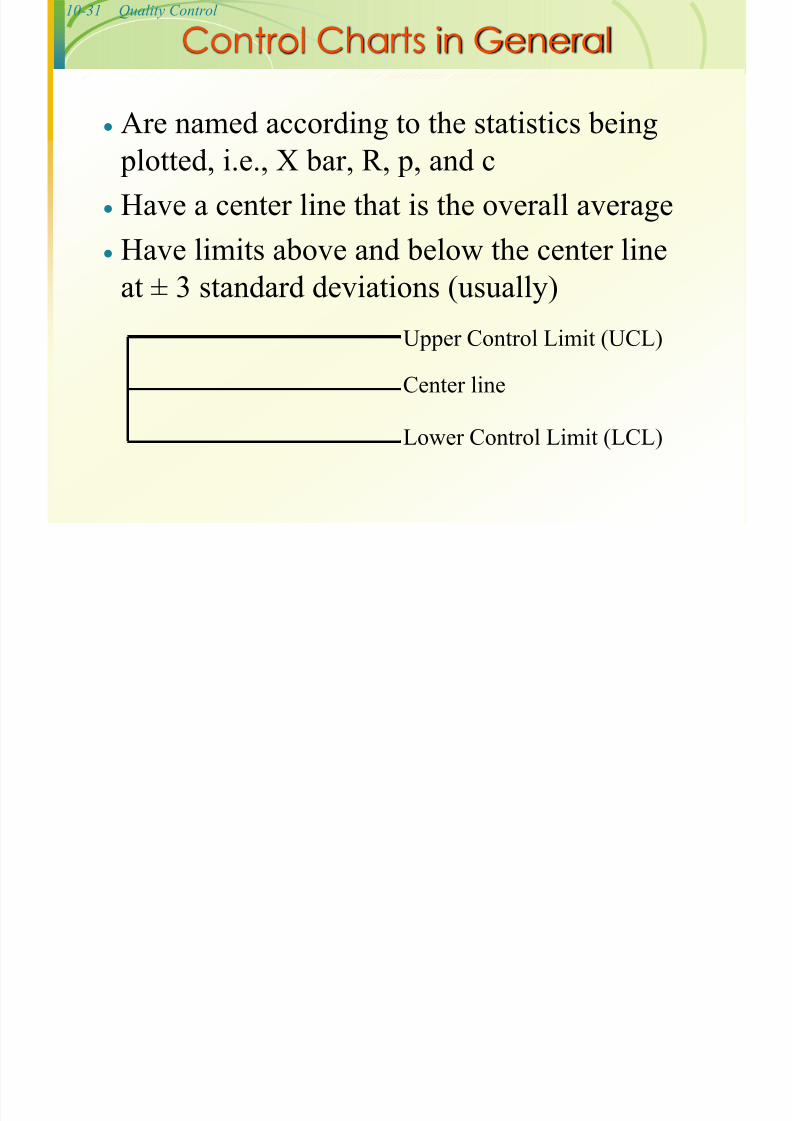
Control Charts in General
Are named according to the statistics being plotted, i.e., X bar, R, p, and c
Have a center line that is the overall average
Have limits above and below the center lineat ± 3 standard deviations (usually)
Center line
Lower Control Limit (LCL)
Upper Control Limit (UCL)
10-32 Quality Control
7/29/2019 Chapter 10 Classroom Ppt
http://slidepdf.com/reader/full/chapter-10-classroom-ppt 32/41
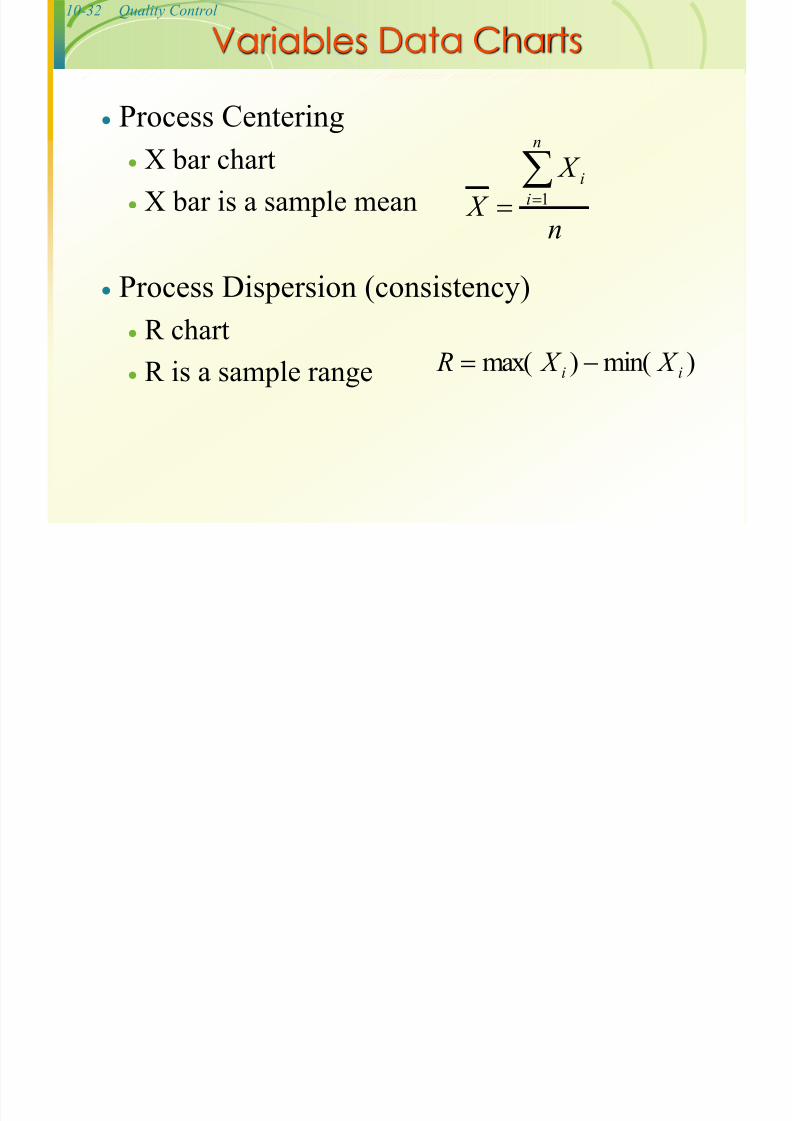
Variables Data Charts
Process Centering X bar chart
X bar is a sample mean
Process Dispersion (consistency)
R chart
R is a sample range
n
X
X
n
i
i 1
)min()max( ii X X R
10-33 Quality Control
7/29/2019 Chapter 10 Classroom Ppt
http://slidepdf.com/reader/full/chapter-10-classroom-ppt 33/41
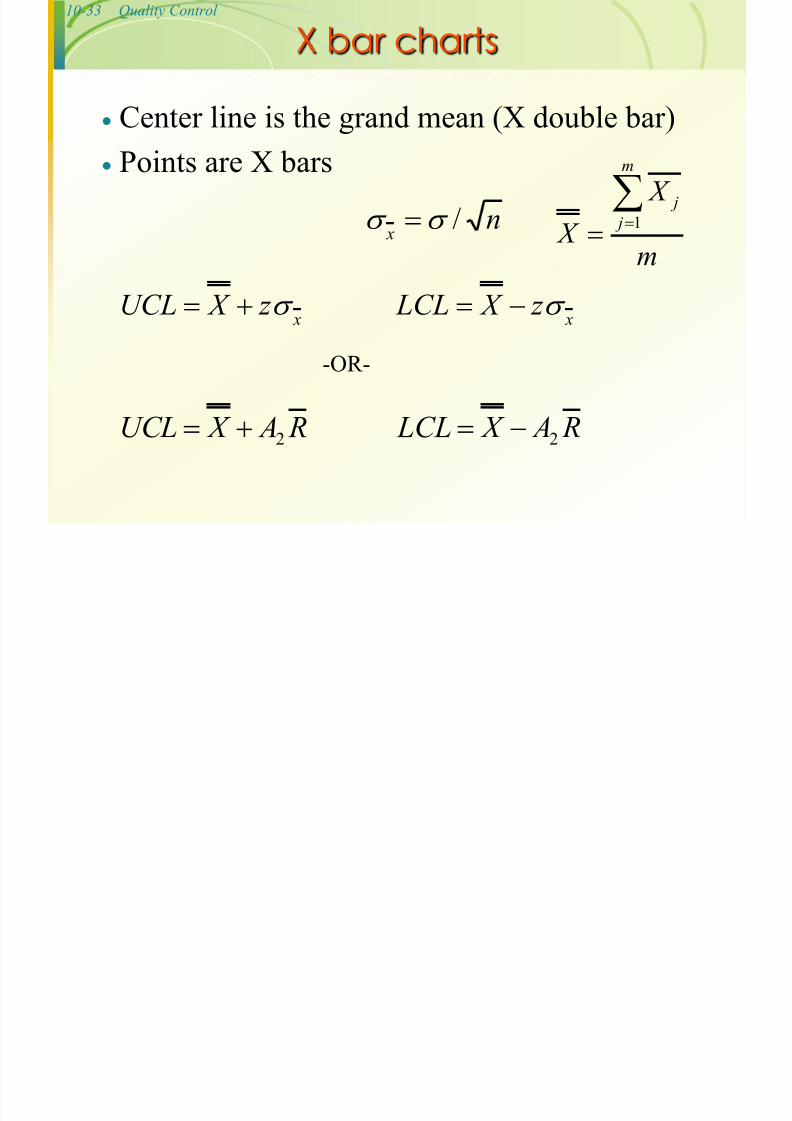
X bar charts
Center line is the grand mean (X double bar) Points are X bars
x z X UCL
n x
/
x z X LCL
m
X
X
m
j
j
1
R A X UCL 2 R A X LCL 2
-OR-
10-34 Quality Control
7/29/2019 Chapter 10 Classroom Ppt
http://slidepdf.com/reader/full/chapter-10-classroom-ppt 34/41
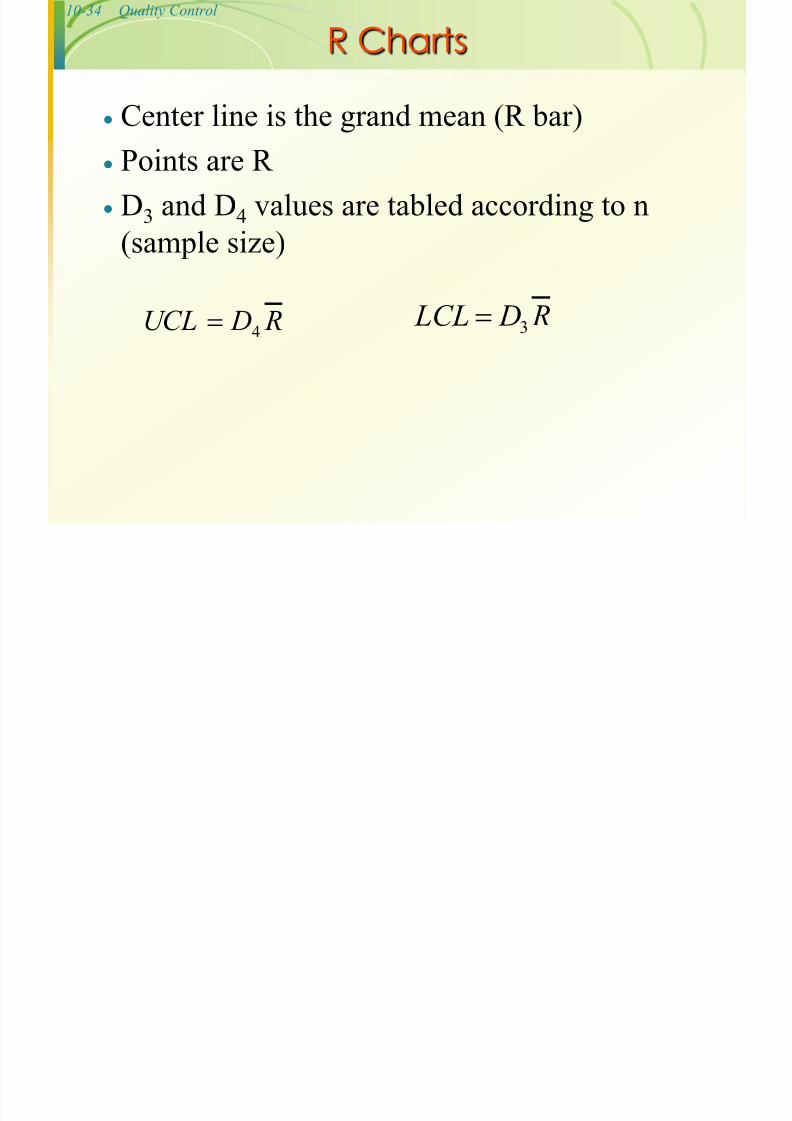
R Charts
Center line is the grand mean (R bar) Points are R
D3 and D4 values are tabled according to n
(sample size)
R DUCL 4 R D LCL 3
10-35 Quality Control
7/29/2019 Chapter 10 Classroom Ppt
http://slidepdf.com/reader/full/chapter-10-classroom-ppt 35/41
Use of X bar & R charts
Charts are always used in tandem Data are collected (20-25 samples)
Sample statistics are computed
All data are plotted on the 2 charts Charts are examined for randomness
If random, then limits are used “forever”
10-36 Quality Control
7/29/2019 Chapter 10 Classroom Ppt
http://slidepdf.com/reader/full/chapter-10-classroom-ppt 36/41
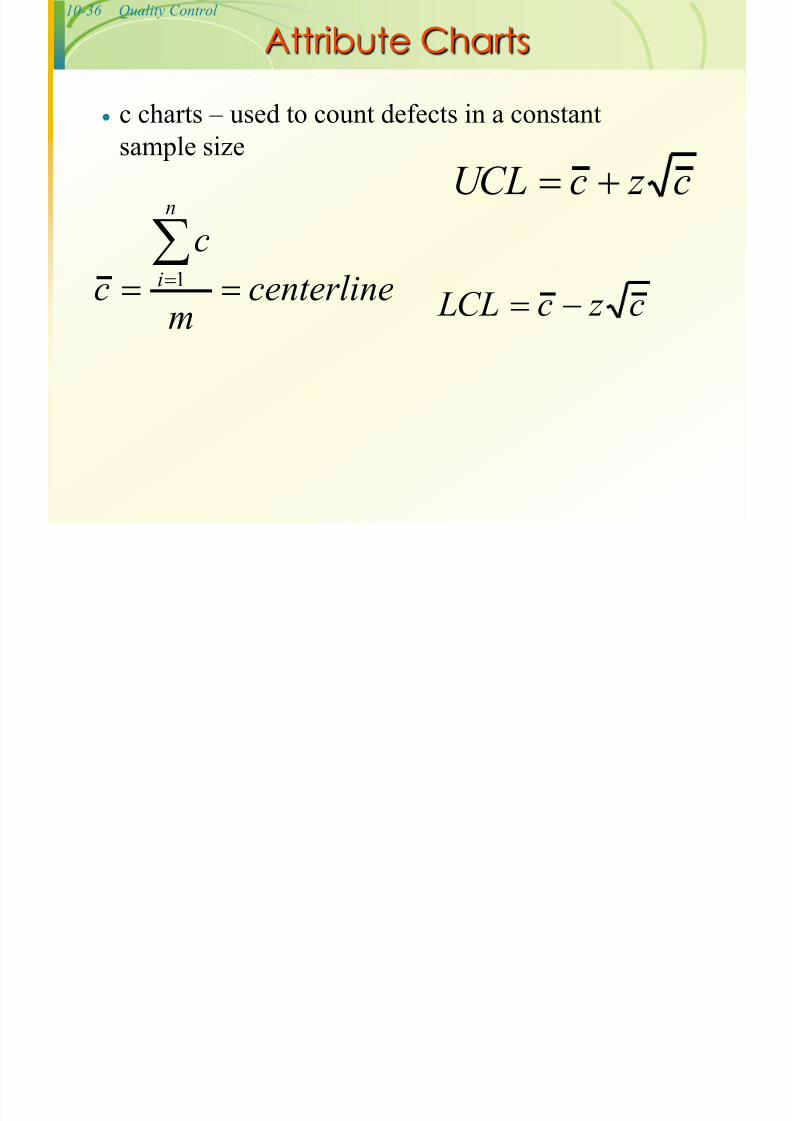
Attribute Charts
c charts – used to count defects in a constantsample size
centerlinem
cc
n
i 1
c z cUCL
c z c LCL
10-37 Quality Control
7/29/2019 Chapter 10 Classroom Ppt
http://slidepdf.com/reader/full/chapter-10-classroom-ppt 37/41
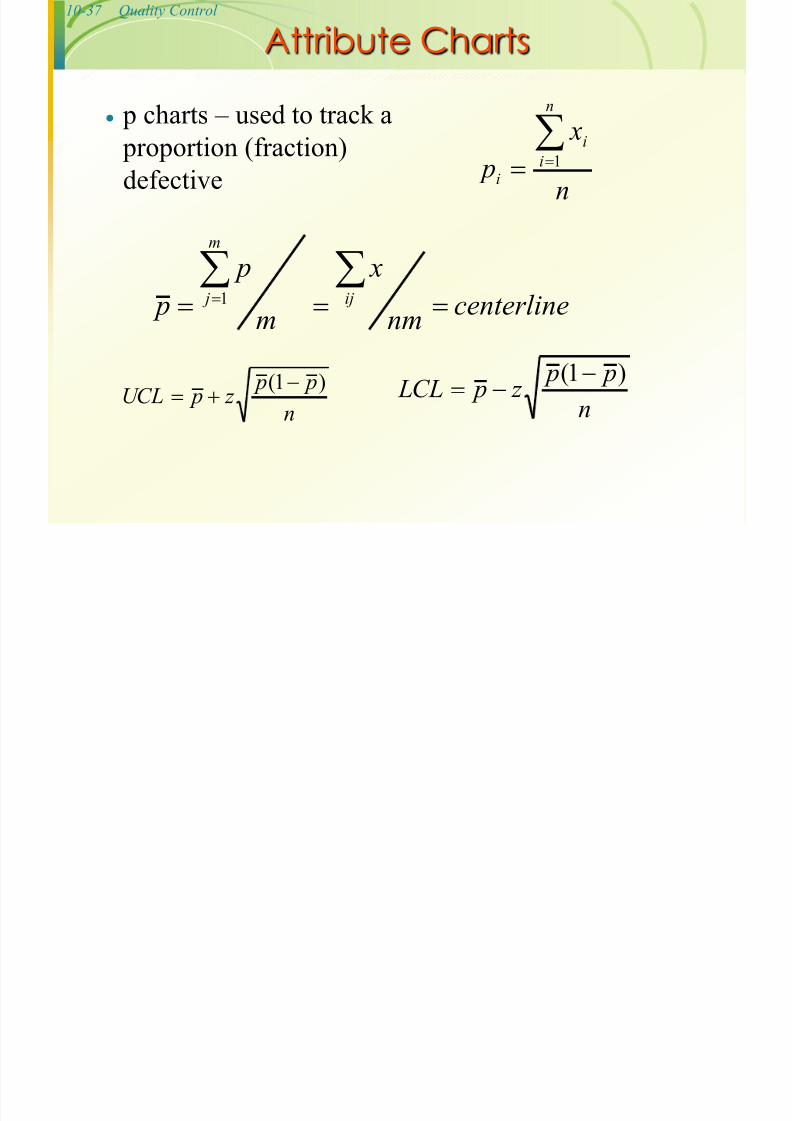
Attribute Charts
p charts – used to track a proportion (fraction)
defective
centerlinenm
x
m
p
p ij
m
j
1
n
p p z pUCL
)1(
n p p z p LCL )1(
n
x p
n
i
i
i
1
10-38 Quality Control
7/29/2019 Chapter 10 Classroom Ppt
http://slidepdf.com/reader/full/chapter-10-classroom-ppt 38/41
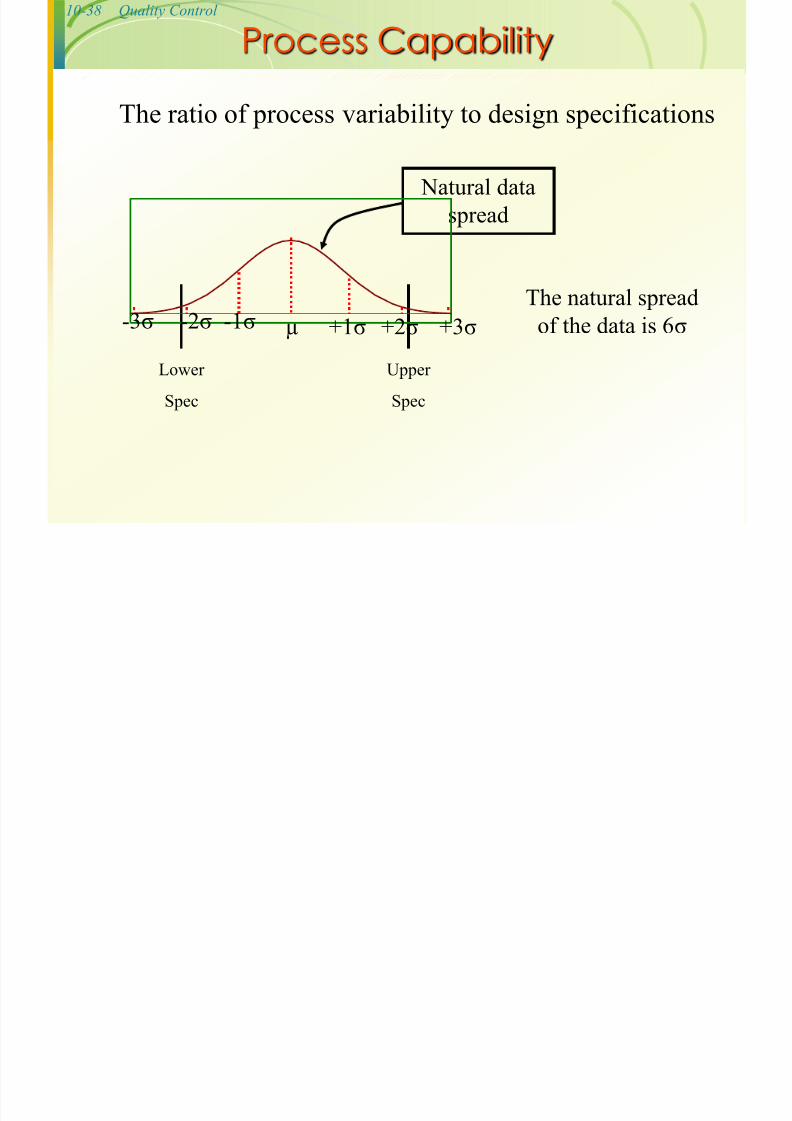
Process Capability
The ratio of process variability to design specifications
Upper
Spec
Lower
Spec
Natural data
spreadext Text Text Text Text Text
Title
The natural spread
of the data is 6σ -1σ +2σ -2σ +1σ +3σ -3σ µ
10-39 Quality Control
7/29/2019 Chapter 10 Classroom Ppt
http://slidepdf.com/reader/full/chapter-10-classroom-ppt 39/41
Training
MQ4
Job rotation/quality fatigue at Honda
10-40 Quality Control
7/29/2019 Chapter 10 Classroom Ppt
http://slidepdf.com/reader/full/chapter-10-classroom-ppt 40/41
Quality Measurement
STA10
Monitoring
10-41 Quality Control
7/29/2019 Chapter 10 Classroom Ppt
http://slidepdf.com/reader/full/chapter-10-classroom-ppt 41/41
Services/Measurement
STAO3