Embed Size (px)
Citation preview
Note: This RDP 2017-2022 Midterm Update Chapter is still preliminary and subject to further review and RDC approval. This draft is NOT official and no part of this document may be cited or quoted. This is being circulated for public consultation purposes.
1
Chapter 10 1
Accelerating Human Capital Development 2 3 This Chapter discusses assessment of implementing the Regional plan in the areas 4
of health and nutrition, education and labour. It also presents the gaps and 5 challenges need to be addressed and the opportunities that can be harnessed 6 towards developing human capital and contribute to reducing inequality. 7 8 Assessment and Challenges 9
10 In the past three years, CALABARZON has been consistent in providing quality 11 education, health and nutrition, and employment opportunities and services to its 12 populace. The Regional Development Council has also been actively engaging its 13
partners and stakeholders in providing these development initiatives. With the 14 implementation of several laws and policies such as Universal Access to Tertiary 15 Education, First 1000 Days, Universal Health Care Act, and Zero Unmet Needs for 16 Family Planning, enabling mechanisms were well placed to ensure the provision of 17
quality social services. However, more interventions are still needed to be 18 implemented to achieve the Region’s goals in terms of increasing human 19 development potential. 20
21 Improving nutrition situation. Nutrition data from 2013 and 2015 indicated an 22
increasing prevalence of stunting, wasting, and overweight among children under 5. 23
However, the Region fared better than other Regions. Insufficient child nutrition 24 particularly during the first 1000 days of life, as well as lack of family planning, 25
inadequate mother and infant care to address feeding peculiarities, and high 26
prevalence of teenage pregnancy are factors contributing to malnutrition in the 27
Region. While CALABARZON was able to decrease over-nutrition, much has yet to 28 be done to reduce proliferation of empty calorie food, having more physical activity of 29
children and adults and getting out of the sedentary lifestyle. 30 31 The proportion of households with per capita intake below 100 percent dietary 32 energy requirement also decreased from 29.3 percent in 2015 to 26.3 percent in 33
2019. This is the result of convergence of efforts of both government and private 34 sector in the Region. 35 36 The limited capacity of some LGUs in the implementation of health and nutrition 37 programs, absence of Local Nutrition Committee and Population Committee, and 38
limited budget for nutrition programs are among challenges faced by the Region’s 39 health and nutrition. 40 41 Improving mortality rates despite not achieving the target for health man power to 42
population ratio. Maternal, infant, neonatal, and under-five mortality rates decreased 43
and exceeded the target for 2019. Maternal mortality rate was significantly reduced 44 from 68 per 100,000 live births in 2016 to only 30 in the first semester of 2019. The 45
decrease was mainly attributed to the improved service delivery networks with the 46 inclusion of private sectors and the increased number of health facilities accredited 47 by PhilHealth to provide maternity care packages. Further, infant mortality rate 48 continued to decline from 10 percent in 2016 to 8.3 percent during the first semester 49 of 2019. The same was observed for under-five mortality rate, decreasing from 14 50
Note: This RDP 2017-2022 Midterm Update Chapter is still preliminary and subject to further review and RDC approval. This draft is NOT official and no part of this document may be cited or quoted. This is being circulated for public consultation purposes.
2
percent in 2016 to 13.3 percent in 2019. Meanwhile, there was no recorded neonatal 51
death during the first half of 2019. The accomplishment was brought by the 52 continuous strong advocacy on child health programs. 53 54
The proportion of births attended by skilled health personnel and delivered in health 55 facilities also continued to increase and further contributed to the reduced mortality 56 rates. This was the result of upgraded infrastructures of health facilities and birthing 57 homes and deployment of more skilled professionals in the communities, providing 58 for easy implementation and monitoring of health programs in the local government 59
units. 60 61 Despite the declining mortality rates, health manpower to population ratio of doctors, 62 nurses, and midwives is still below the target standard ratio. The ratio for doctors to 63
population ratio in 2018 was 1:21,846, an improvement from the 1:56,052 ratio in 64 2016, but still not within the standard 1:20,000 ratio. Likewise, nurse to population 65 ratio worsen from 1:20,206 in 2016 to 1:21,846 in 2018 and midwife to population 66 ratio further increased from 1:8042 in 2016 to 1:9,541 in 2018. Declining number of 67
manpower was the major reason for unmet targets on health manpower to 68 population ratio due to professionals opting to work abroad and low enrollees for 69 health courses such as midwifery. 70
71 Moreover, the percentage of one year old fully immunized children declined from 61 72 percent in 2016 to 31 percent in 2019. The recent Dengvaxia scare was a major 73
factor in the failure to immunize children. 74 75 Increasing prevalence rate for modern contraceptive and decreasing proportion of 76
women with unmet need for family planning. The proportion of women aged 15 to 49 77
years old with unmet need for family planning decreased from 17.8 percent in 2013 78 to 12 percent in the first semester of 2019. Likewise, use of modern family planning 79
methods significantly increased from 25 percent in 2016 to 47.5 percent in 2018. The 80 strengthened implementation of Executive Order 12 s. 2017 and the implementation 81 of Responsible Parenthood and Reproductive Health (Law, brought the improvement 82 in the adoption of modern contraceptives. 83
84 The proportion of adolescents, 15-19 years old, who have already begun 85 childbearing also decreased from 8.1 percent in 2013 to 7.6 percent in 2019. The 86 classes on Responsible Parenthood and Family Planning and outreach missions on 87 providing modern contraceptives and information dissemination on Adolescent 88
Health and Youth Development Program may have contributed to this positive 89 outcome. 90
91 No new incidence of malaria and decreasing number of tuberculosis incidence while 92
number of diagnosed new HIV cases continued to rise. The Region continued to be 93
malaria-free due to the sustained efforts on elimination and control of malaria, 94 particularly in Laguna, Rizal, and Quezon. The number of tuberculosis cases 95
continued to decline, however, it increased in 2018 to 345 due to multi-drug 96 resistance. 97 98 New HIV infections increased from 1,290 cases in 2016 to 1,871 cases in 2018 99 particularly on men having sex with men. There is a need to expand programs on 100
Note: This RDP 2017-2022 Midterm Update Chapter is still preliminary and subject to further review and RDC approval. This draft is NOT official and no part of this document may be cited or quoted. This is being circulated for public consultation purposes.
3
reproductive health by also considering education on safe sex among the 101
male population. 102 103 Population covered by health insurance program maintained. The Region already 104
met its target of 100 percent coverage of health insurance program in 2016 but 105 decreasedto 85 percent in 2017. However, health insurance coverage returned to 106 100 percent in 2018. 107 108 Basic, Higher and Technical Education 109
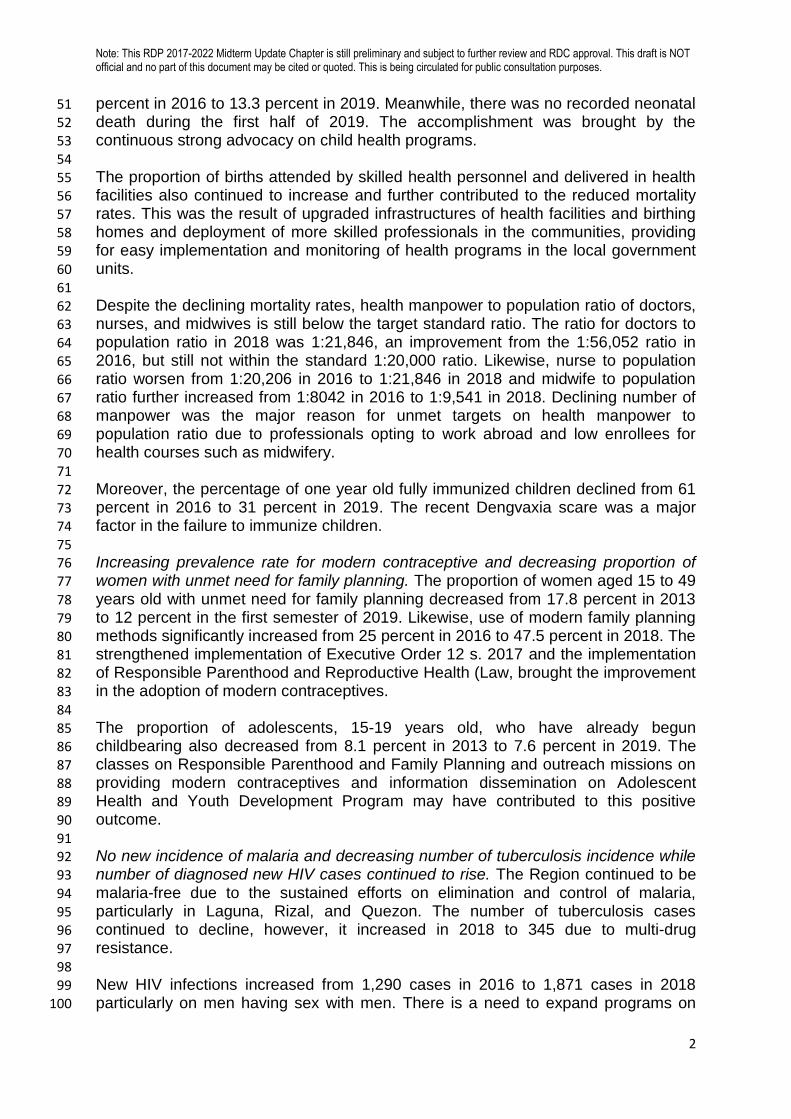
110 Basic Education 111 112 Net enrolment and completion rate improved. Net enrolment rate in all levels 113
improved from SY 2016-2017 to SY 2018-2019, except in kindergarten which 114 declined in SY 2018-2019. Increased net enrolment rate may be attributed to setting 115 of early registration schedules, school-based feeding program and the voucher 116 program for senior high school. It can also be attributed to the increase in the 117
number of elementary and secondary schools in the Region. Annual regional targets 118 were attained in the same period. In terms of gender disparity, there was minimal 119 difference in the male and female enrolees for all levels. More male enrolees were 120
observed in kinder, elementary and junior high school while more female enrolees in 121 senior high school. 122 123
Similarly, completion rate in elementary and junior high school improved from SY 124 2016-2017 to SY 2017-2018 and annual Regional targets were achieved. The 125
reorganization of the Regional Committee on Education for All to a Regional 126
Committee on Quality Education for All which monitored the implementation of the K 127
to 12 program may have contributed to the attainment of the regional targets. 128 129 Table 10.__. Net Enrolment and Completion Rate, CALABARZON, 2016-2019 130
Indicator Baseline
(2016) Target Accomplishment
2017 2018 2019 2017 2018 2019
Net enrolment rate increased (%)
Kinder 82.77 85.64 88.51 91.38 85.50 80.45 Not yet available
Elementary 81.00 84.17 87.43 90.51 96.31 97.36 Not yet available
Junior HS 60.89 66.58 72.27 77.96 82.51 86.38 Not yet available
Senior HS - - - TBD 53.90 58.33 Not yet available
Completion rate increased (%)
Elementary 95.53 95.41 95.73 96.05 98.40 Not yet available
Not yet available
Junior HS 86.53 88.27 90.01 91.75 90.72 Not yet available
Not yet available
Senior HS - - - TBD 98.40 Not yet
available Not yet available
Source: DepEd Region IV-A 131 132
Note: This RDP 2017-2022 Midterm Update Chapter is still preliminary and subject to further review and RDC approval. This draft is NOT official and no part of this document may be cited or quoted. This is being circulated for public consultation purposes.
4
Higher cohort survival rate observed. The Region’s cohort survival rates in 133
elementary level and junior high school were among the highest in the country for SY 134 2017-2018 at 99 and 91.4 percent, respectively. Cohort survival rates of female 135 students in both elementary and secondary levels were higher at 100 and 94.64 136
percent, respectively, compared to male students at 98.32 and 88.57 percent. The 137 Pantawid Pamilyang Pilipino Progrram contributed to this outcome as the condition is 138
for children to be in school. 139 140 Alternative Learning System (ALS) Intensified. ALS enrolment in 2017 to 2018 141
increased by about 29.89 percent. Higher male enrolees were also recorded in 2017 142 and 2019 at 56 and 57 percent, respectively. Increased promotion of the alternative 143 learning system particularly at the rural areas had spurred interest in ALS. 144 145 Addressing the demand on K to 12 education inputs remain a challenge. To ensure 146
smooth implementation and attainment of the objectives of the K to 12 program, 147 mechanisms were developed to meet the increased demand in basic education 148 requirements. The convergence program of DepEd and DPWH aims to provide 149
enough school buildings and classrooms for basic education learners including junior 150 and senior high schools. Even though classroom to pupil ratio had improved from 151 2017 to 2018, classroom to pupil ratio for junior and senior high school was 1:62 152
which was still behind the standard ratio of 1:40 despite implementation of class 153 shifts. In addition, ICT facilities for education should also be enhanced to provide 154 numerous options in the delivery of the classes and be at par with the other 155
countries. (see Chapter 19) 156 157 Higher Education and Technical and Vocational Education and Training 158
159
Faculty-Student Ratio improved. Regional faculty-student ratio in SY 2018-2019 was 160
1:21 with a ratio of 1:28 for SUCs and 1:19 for private HEIs. This was an 161
improvement from a ratio of 1:33 and 1:20 in SY 2016-2017, respectively. Notably, 162 private HEIs have better faculty to student ratio compared to SUCs. Significant 163 proportion of tertiary students went to state universities and colleges (SUCs) due to 164 free tertiary education. The Region ranked 2nd in the country with the most number of 165
tertiary education institutions with its 338 colleges and universities. 166 167
Increasing faculty staff competence continued. About half of the faculty in the tertiary 168
education have a post graduate degree. In line with the national goal of improving 169 the competence of our country’s professors and instructors, faculty members of 170
colleges and universities in the Region continue to seek further studies. For SY 171 2018-2019, 48 percent of professors and instructors in SUCs have a post graduate 172
degree while 52 percent in private HEIs have a post graduate degree. 173 174 Certification rate of TVET graduates continue to increase. The certification rate of 175
TVET graduates increased from 88.40 percent in 2016 to 92 percent in 2018. Hence, 176 annual regional and provincial targets in 2017 and 2018 were achieved. Further, 177
similar performance was observed in all provinces. The increase in certification rate 178 may be attributed to the improvement in the quality and provision of TVET programs. 179 180 Challenges encountered in UniFAST implementation. The passage of the Universal 181
Access to Quality Tertiary Education Act increased accessibility of tertiary learners 182
Note: This RDP 2017-2022 Midterm Update Chapter is still preliminary and subject to further review and RDC approval. This draft is NOT official and no part of this document may be cited or quoted. This is being circulated for public consultation purposes.
5
into state universities and colleges, and public technical-vocational institutions. 183
Increased access was made more possible with the continuous implementation of 184 UniFAST. However, challenges were encountered in the implementation of the 185 Tertiary Education Subsidy (TES). There were reports on discrepancies of the 186
beneficiaries of Listahanan vis-à-vis TES with some students included in the 187 Listahan of DSWD were not included in the list of beneficiaries of TES while those 188 not included in the former were able to access TES. 189 190 Labor Policies 191 192
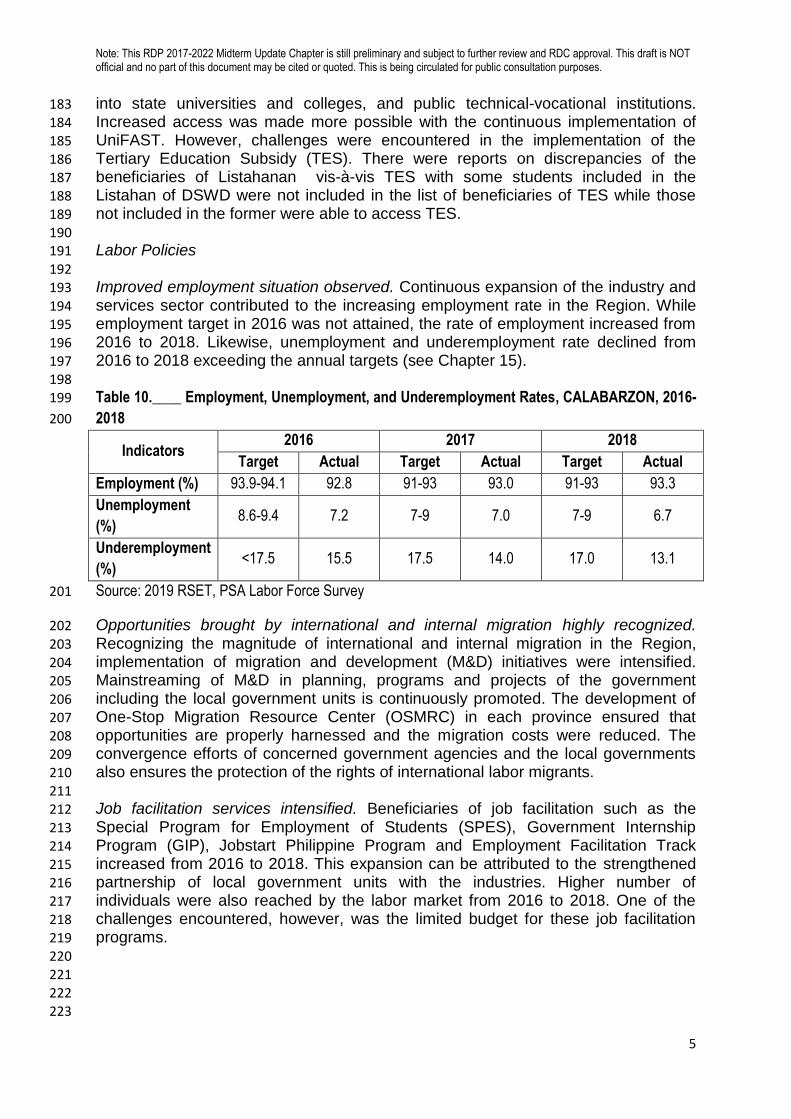
Improved employment situation observed. Continuous expansion of the industry and 193
services sector contributed to the increasing employment rate in the Region. While 194 employment target in 2016 was not attained, the rate of employment increased from 195
2016 to 2018. Likewise, unemployment and underemployment rate declined from 196 2016 to 2018 exceeding the annual targets (see Chapter 15). 197 198 Table 10.____ Employment, Unemployment, and Underemployment Rates, CALABARZON, 2016-199
2018 200
Indicators 2016 2017 2018
Target Actual Target Actual Target Actual
Employment (%) 93.9-94.1 92.8 91-93 93.0 91-93 93.3
Unemployment
(%) 8.6-9.4 7.2 7-9 7.0 7-9 6.7
Underemployment
(%) <17.5 15.5 17.5 14.0 17.0 13.1
Source: 2019 RSET, PSA Labor Force Survey 201
Opportunities brought by international and internal migration highly recognized. 202
Recognizing the magnitude of international and internal migration in the Region, 203
implementation of migration and development (M&D) initiatives were intensified. 204 Mainstreaming of M&D in planning, programs and projects of the government 205 including the local government units is continuously promoted. The development of 206
One-Stop Migration Resource Center (OSMRC) in each province ensured that 207 opportunities are properly harnessed and the migration costs were reduced. The 208
convergence efforts of concerned government agencies and the local governments 209 also ensures the protection of the rights of international labor migrants. 210 211 Job facilitation services intensified. Beneficiaries of job facilitation such as the 212
Special Program for Employment of Students (SPES), Government Internship 213 Program (GIP), Jobstart Philippine Program and Employment Facilitation Track 214 increased from 2016 to 2018. This expansion can be attributed to the strengthened 215
partnership of local government units with the industries. Higher number of 216 individuals were also reached by the labor market from 2016 to 2018. One of the 217 challenges encountered, however, was the limited budget for these job facilitation 218 programs. 219 220
221 222
223
Note: This RDP 2017-2022 Midterm Update Chapter is still preliminary and subject to further review and RDC approval. This draft is NOT official and no part of this document may be cited or quoted. This is being circulated for public consultation purposes.
6
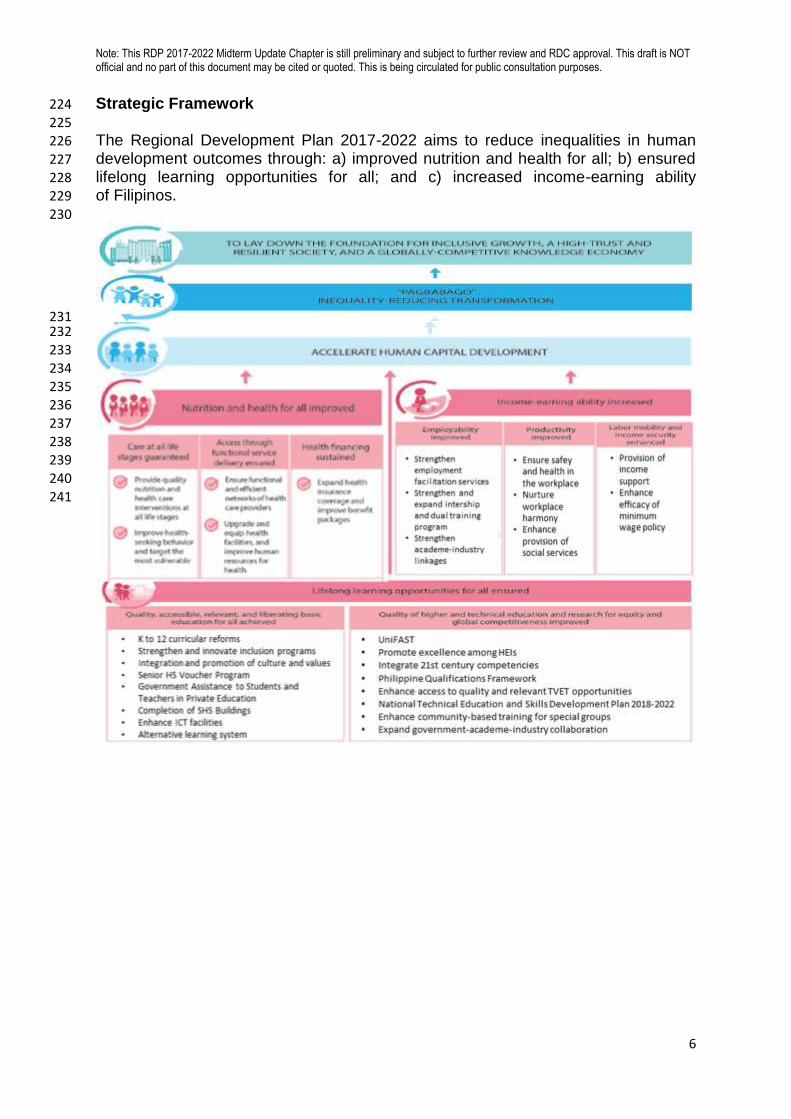
Strategic Framework 224
225 The Regional Development Plan 2017-2022 aims to reduce inequalities in human 226 development outcomes through: a) improved nutrition and health for all; b) ensured 227
lifelong learning opportunities for all; and c) increased income-earning ability 228 of Filipinos. 229 230
231 232
233
234 235 236 237
238 239
240
241

Note: This RDP 2017-2022 Midterm Update Chapter is still preliminary and subject to further review and RDC approval. This draft is NOT official and no part of this document may be cited or quoted. This is being circulated for public consultation purposes.
7
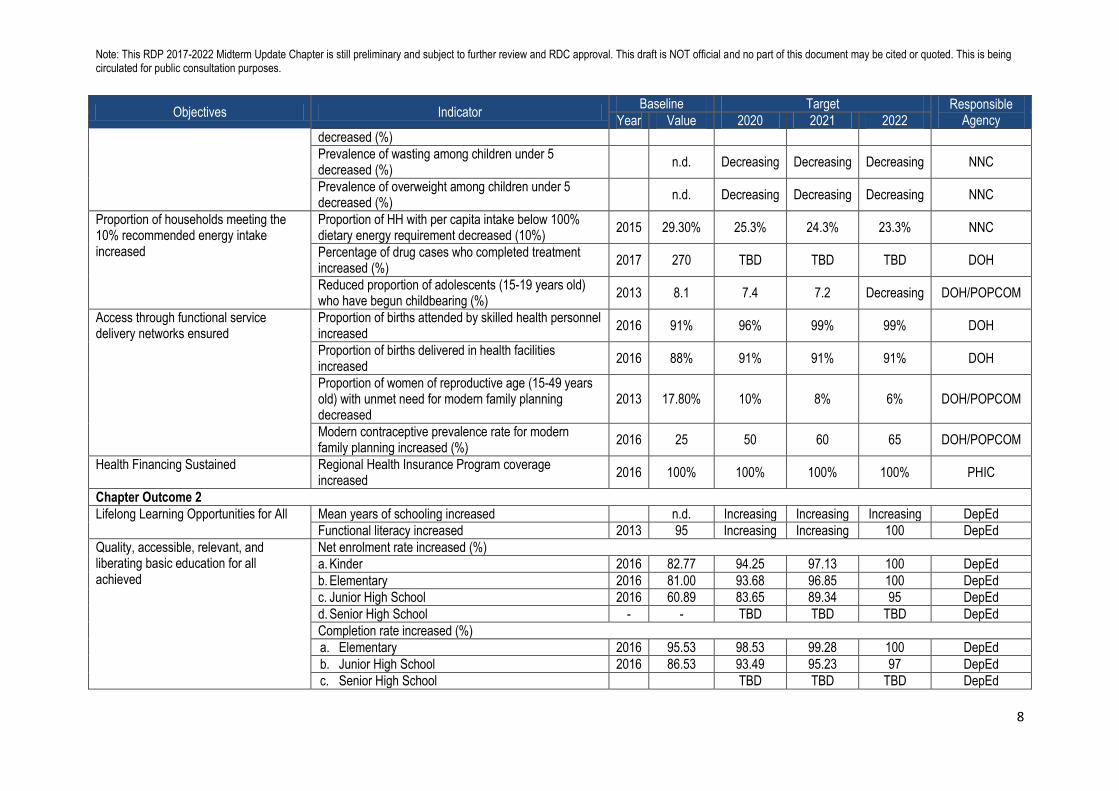
Targets 242
243 The following table show the indicators and corresponding targets towards improving human development outcomes. 244
245 Table 10. Indicators and targets on accelerating human development 246
Objectives Indicator Baseline Target Responsible
Agency Year Value 2020 2021 2022
Chapter Outcome 1
Nutrition and health for all improved Life expectancy at birth DOH
Male 2010 69.48 Increasing Increasing 75
Female 2013 75.62 Increasing Increasing 82
Total fertility rate decreased 2013 2.7 2.5 2.5 2.5 DOH, POPCOM
Care at all life stages increased Maternal mortality ratio (per 100,000 live births) decreased
2016 68 70 70 70 DOH
Infant mortality rate (per 1,000 live births) decreased 2016 10 15 15 15 DOH
Neonatal mortality rate (per 1,000 live births) decreased 2016 7 10 10 10 DOH
Under five mortality rate (per 1,000 live births) decreased
2016 14 22 22 22 DOH
Percentage of 1 year old children fully immunized increased
2016 61% 95% 95% 95% DOH
Premature mortality attributed to cardiovascular disease, cancer, diabetes and chronic respiratory diseased decreased
n.d. DOH
Malaria prevalence (per 100,000 population) decreased 2016 0 0 0 0 DOH
Tuberculosis incidence per 100,000 population decreased
2016 322 322 322 322 DOH
Number of new HIV infections (newly diagnosed cases/year) decreased
2016 1,290 Decreasing Decreasing Decreasing DOH
Health manpower to population ratio within the standard (nurses)
2016 1:20,2016 1:20,000 1:20,000 1:20,000 DOH
Health manpower to population ratio within the standard (midwife)
2016 1:8,042 1:500 1:5000 1:5000 DOH
Prevalence of underweight and severely underweight preschool children (0-71 months) decreased (%)
2016 19 15 14 13 NNC
Prevalence of stunting among children under 5 2015 27.7 23.7 22.7 21.7 NNC
Note: This RDP 2017-2022 Midterm Update Chapter is still preliminary and subject to further review and RDC approval. This draft is NOT official and no part of this document may be cited or quoted. This is being circulated for public consultation purposes.
8
Objectives Indicator Baseline Target Responsible
Agency Year Value 2020 2021 2022
decreased (%)
Prevalence of wasting among children under 5 decreased (%)
n.d. Decreasing Decreasing Decreasing NNC
Prevalence of overweight among children under 5 decreased (%)
n.d. Decreasing Decreasing Decreasing NNC
Proportion of households meeting the 10% recommended energy intake increased
Proportion of HH with per capita intake below 100% dietary energy requirement decreased (10%)
2015 29.30% 25.3% 24.3% 23.3% NNC
Percentage of drug cases who completed treatment increased (%)
2017 270 TBD TBD TBD DOH
Reduced proportion of adolescents (15-19 years old) who have begun childbearing (%)
2013 8.1 7.4 7.2 Decreasing DOH/POPCOM
Access through functional service delivery networks ensured
Proportion of births attended by skilled health personnel increased
2016 91% 96% 99% 99% DOH
Proportion of births delivered in health facilities increased
2016 88% 91% 91% 91% DOH
Proportion of women of reproductive age (15-49 years old) with unmet need for modern family planning decreased
2013 17.80% 10% 8% 6% DOH/POPCOM
Modern contraceptive prevalence rate for modern family planning increased (%)
2016 25 50 60 65 DOH/POPCOM
Health Financing Sustained Regional Health Insurance Program coverage increased
2016 100% 100% 100% 100% PHIC
Chapter Outcome 2
Lifelong Learning Opportunities for All Mean years of schooling increased n.d. Increasing Increasing Increasing DepEd
Functional literacy increased 2013 95 Increasing Increasing 100 DepEd
Quality, accessible, relevant, and liberating basic education for all achieved
Net enrolment rate increased (%)
a. Kinder 2016 82.77 94.25 97.13 100 DepEd
b. Elementary 2016 81.00 93.68 96.85 100 DepEd
c. Junior High School 2016 60.89 83.65 89.34 95 DepEd
d. Senior High School - - TBD TBD TBD DepEd
Completion rate increased (%)
a. Elementary 2016 95.53 98.53 99.28 100 DepEd
b. Junior High School 2016 86.53 93.49 95.23 97 DepEd
c. Senior High School TBD TBD TBD DepEd

Note: This RDP 2017-2022 Midterm Update Chapter is still preliminary and subject to further review and RDC approval. This draft is NOT official and no part of this document may be cited or quoted. This is being circulated for public consultation purposes.
9
Objectives Indicator Baseline Target Responsible
Agency Year Value 2020 2021 2022
Proportion of junior high school students performing at moving towards mastery, closely approximating mastery and mastered increased (%)
a. Elementary n.d. Increasing Increasing Increasing DepEd
b. Junior High School n.d. Increasing Increasing Increasing DepEd c. Senior High School n.d. TBD TBD TBD DepEd Proportion of junior high school students at low mastery reduced
a. Junior High School n.d. Decreasing Decreasing Decreasing DepEd
b. Senior High School n.d. TBD TBD TBD DepEd
Elementary drop-out rate decreased (%) 2015 2.27 0.65 0.33 0 DepEd
Junior high school drop-out rate decreased (%) 2015 4.31 2.77 2.39 2 DepEd
Quality of higher education and technical education and research for equity and global competitiveness improved
Certification rate of TVET graduates increased 2016 88.40% 86% 87% 87% TESDA
Percentage of students in the Region awarded scholarships, grants, and other financial assistance increased (%)
2016 54% Increasing Increasing Increasing SUCs, HEIs,
CHED
Percentage of tertiary graduates in the Region with degree in science, engineering, manufacturing and construction increased (%)
2016 33% Increasing Increasing Increasing SUCs, HEIs,
CHED
Number of patents, licenses, and royalties issued to HEIs in the Region (cumulative) increased
2016 29 Increasing Increasing Increasing SUCs, HEIs
Number of researchers and scientists in the Region increased
2016 140 Increasing Increasing Increasing SUCs, HEIs,
CHED
Number of curricula and programs in the Region developed/revised based on multi-disciplinal platforms that foster 21st century competencies increased (cumulative)
2016 91 Increasing Increasing Increasing SUCs, HEIs,
CHED
Number of HEIs in the Region engaged in local and global partnerships and collaborations increased
2016 272 Increasing Increasing Increasing SUCs, HEIs
Number of innovation hubs established within HEIs in the Region increased
2016 2 Increasing Increasing Increasing SUCs, HEIs
Government expenditure for higher education research, development, and innovation as a percentage of GRDP increased (%)
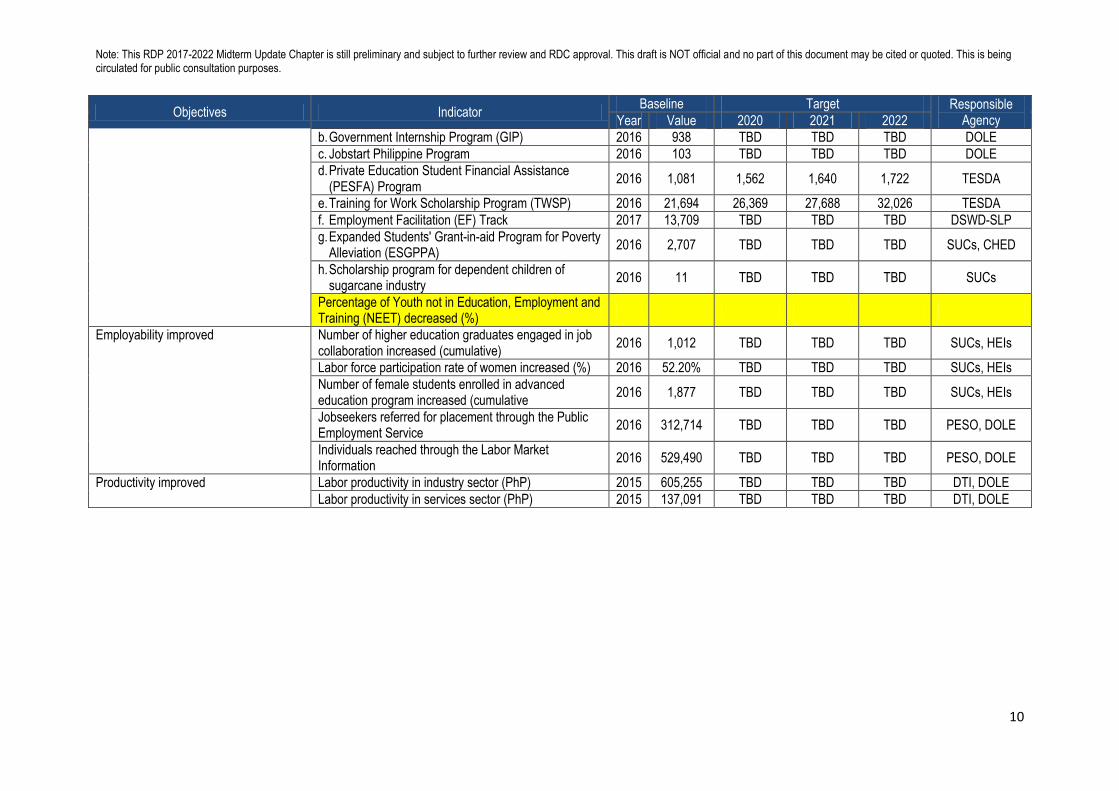
Income earning ability increased Beneficiaries of job facilitation and scholarships
a. Special Program for Employment of Students (SPES) 2016 13,221 TBD TBD TBD DOLE
Note: This RDP 2017-2022 Midterm Update Chapter is still preliminary and subject to further review and RDC approval. This draft is NOT official and no part of this document may be cited or quoted. This is being circulated for public consultation purposes.
10
Objectives Indicator Baseline Target Responsible
Agency Year Value 2020 2021 2022
b. Government Internship Program (GIP) 2016 938 TBD TBD TBD DOLE
c. Jobstart Philippine Program 2016 103 TBD TBD TBD DOLE
d. Private Education Student Financial Assistance (PESFA) Program
2016 1,081 1,562 1,640 1,722 TESDA
e. Training for Work Scholarship Program (TWSP) 2016 21,694 26,369 27,688 32,026 TESDA
f. Employment Facilitation (EF) Track 2017 13,709 TBD TBD TBD DSWD-SLP
g. Expanded Students' Grant-in-aid Program for Poverty Alleviation (ESGPPA)
2016 2,707 TBD TBD TBD SUCs, CHED
h. Scholarship program for dependent children of sugarcane industry
2016 11 TBD TBD TBD SUCs
Percentage of Youth not in Education, Employment and Training (NEET) decreased (%)
Employability improved Number of higher education graduates engaged in job collaboration increased (cumulative)
2016 1,012 TBD TBD TBD SUCs, HEIs
Labor force participation rate of women increased (%) 2016 52.20% TBD TBD TBD SUCs, HEIs
Number of female students enrolled in advanced education program increased (cumulative
2016 1,877 TBD TBD TBD SUCs, HEIs
Jobseekers referred for placement through the Public Employment Service
2016 312,714 TBD TBD TBD PESO, DOLE
Individuals reached through the Labor Market Information
2016 529,490 TBD TBD TBD PESO, DOLE
Productivity improved Labor productivity in industry sector (PhP) 2015 605,255 TBD TBD TBD DTI, DOLE
Labor productivity in services sector (PhP) 2015 137,091 TBD TBD TBD DTI, DOLE
Note: This RDP 2017-2022 Midterm Update Chapter is still preliminary and subject to further review and RDC approval. This draft is NOT official and no part of this document may be cited or quoted. This is being circulated for public consultation purposes.
11
Strategies 247
248 To accelerate human capital development, the following strategies will be 249 undertaken: a) improve the health and nutrition of everyone; b) ensure lifelong 250
learning opportunities for all; and c) increase income earning ability. These 251 strategies are aligned with the Philippine Development Plan 2017-2022 and the 252 AmBisyon Natin 2040 towards Matatag, Maginhawa at Panatag na Buhay. 253 254 Sector Outcome A: Nutrition and health for all improved 255
256 This sector outcome will be achieved through: a) guaranteed care for all life stages; 257 b) ensured access to functional service delivery networks and c) sustained health 258 financing. These will be supported by investments in nutrition and health towards 259
maximizing the demographic dividend in 2040. 260 261 Sub-sector Outcome 1: Care for all life stages guaranteed 262 263 Quality nutrition and health care at all life stages provided. The Region will focus its 264
efforts on the improvement of nutrition and health of its citizenry through timely and 265 quality nutrition and health care interventions for all life stages. Specifically, this will 266
be achieved through: a) improvement in prenatal care, safe delivery and new born 267 and infant care through provision of facilities for new born screening; b) full 268 implementation of expanded breast feeding act or Republic Act 10028; c) 269
implementation of the first 1000 days of life program; d) implementation of the RPRH 270 Act; e) improve the interventions in addressing HIV/AIDs and sustain efforts on 271
addressing TB, malaria and other emerging communicable diseases; f) strengthen 272
interventions in addressing non-communicable diseases such as cancer, diabetes 273
and heart diseases; g) address malnutrition in all its forms; and h) inclusion of health 274 programs and projects in gender and development plans to address inequalities in 275
nutrition and health. 276 277 Improve health-seeking behavior targeting the most vulnerable. Most of the nutrition 278
and health concerns in the Region resulted from the limitations in the health-seeking 279
behavior of the population. The Region will intensify its information education 280 campaign (IEC) on the nutrition and health services available in the rural health 281 units, local hospitals and private hospitals. 282 283 Proper education on HIV and sexually transmitted diseases will also be intensified to 284
decrease infections, ensure proper guidance on the disease of affected persons, and 285 to aid in removing any social stigma that are often associated with the disease. 286
287 Sub-sector Outcome 2: Access through functional Service Delivery Networks 288 ensured 289 290 Ensure functional and efficient networks of health care providers. Forging of 291
partnerships and convergence of initiatives with private sector and the academe in 292 the delivery of health and nutrition services will help address health and nutrition 293 concerns. The health sector needs to tap proactive private sectors, volunteers, and 294 state universities and colleges in the Region in advocating for and delivery of 295 nutrition and health services. 296
Note: This RDP 2017-2022 Midterm Update Chapter is still preliminary and subject to further review and RDC approval. This draft is NOT official and no part of this document may be cited or quoted. This is being circulated for public consultation purposes.
12
297
With the full implementation of the UHC, more health workers are expected to be 298 deployed under the Deployment of Human Resources for Health (HRH) Program of 299 the DOH. This will augment health man power and reach more communities are 300
reached and provided the appropriate medical assistance. 301 302 Upgrade and equip health facilities and improve human resources for health. With 303
the increasing population (natural and in-migration) resulting to high density status of 304 the Region, there is a need to upgrade most health facilities including rural health 305
units, local, provincial and Regional hospitals and private health providers. The 306 upgrading of health facilities will also consider gender sensitive and mother-baby 307 friendly facilities. 308 309
Access to nutrition and health services will be expanded through increasing health 310 manpower-to-population ratio, development of half-way health facilities especially for 311 far flung areas and provision of support infrastructures like road networks and 312 efficient transport systems. Redundant road networks and resilient facilities will be 313
beneficial during calamities and disasters. Nutrition and health caravans will also be 314 provided to rural areas and island municipalities to bring the services closer to the 315 people. Information systems must also be in place. 316
317 Sub-sector Outcome 3: Health Financing Sustained 318 319 Expand health insurance coverage and social protection. The Region will expand its 320
initiatives in terms of health insurance coverage to maintain its 100 percent health 321
insurance coverage. Available packages covered by the no balance billing (NBB) 322
may be updated and upgraded to include more types of communicable diseases. 323
Proper monitoring on the implementation of the NBB packages will also be employed 324 to ensure that all target beneficiaries are reached and provided with the necessary 325
assistance. PhilHealth may also tie up with other agencies to form more types of 326 customized care packages targeting the most vulnerable groups. 327 328 Sector Outcome B: Lifelong learning opportunities for all ensured 329
330 Subsector outcome B.1. Quality, accessible, relevant and liberating basic education 331 for all 332 333 Enhance K to 12 curriculums. Assessment of the K to 12 program implementation to 334
determine attainment of key targets and challenges encountered will be done. The 335 assessment will serve as guide in enhancing the current modules of the K to 12 336
program to be responsive to the current situations and needs of the basic 337 education sector. 338 339 Review of the work immersion guidelines will also be pursued to improve the 340 learning experience of students while meeting the needs of the industries particularly 341
in the advent of the fourth industrial revolution. Aside from the faculty and students, 342 work immersion of senior high school coordinators will also be proposed. Artificial 343 intelligence, internet of things, robotics and 3D printing are among the technologies 344 seen to be dominant in the succeeding years. Skills of graduates should be in line 345

Note: This RDP 2017-2022 Midterm Update Chapter is still preliminary and subject to further review and RDC approval. This draft is NOT official and no part of this document may be cited or quoted. This is being circulated for public consultation purposes.
13
with the requirement of the industries as they are expected to continuously innovate 346
to ensure competitiveness and efficiency. 347 348 Intensify career guidance and coaching. Career guidance and coaching is important 349
to ensure that students will choose a track that is appropriate to their skills and 350 interest. This will ensure that their potentials will be properly developed and will be 351 harnessed given the changing needs of the labor market. 352 353 Enhance teacher competencies. Increasing competencies of elementary and 354
secondary education teachers is essential to the attainment of quality education. 355 Teachers with a wide-array of knowledge and skills tend to be more effective 356 educators even in complex situations. Promoting further studies will be beneficial to 357 be at par with the ASEAN and global standards. With the passage of the Philippine 358
Qualification Framework, competitiveness of the education sector including the basic 359 education is vital. 360 361 Improve learning facilities. Improvement of the facilities for education both hard and 362
soft infrastructures is necessary to contribute to the attainment of quality, accessible, 363 relevant and liberating basic education for all. 364 365 Strengthen implementation of government programs for basic education to ensure 366
equal access for all. With the implementation of the K to 12 programs, 367
implementation of government program such as the Balik Aral Program, Senior High 368
School Voucher Program and Education Service Contracting Scheme was enhanced 369 to ensure equal access for all. These programs provide learners with numerous 370
option to take their basic education. 371
372
Subsector outcome B.2. Quality of higher and technical education and research for 373 equity and global competitiveness improved 374
375 Intensify promotion and strengthen implementation of government programs to 376 access tertiary education. Through the passage of RA 10931, quality tertiary 377
education was made more accessible. However, proper information in availing these 378
programs should be available to all particularly those residing in the rural areas. In 379 addition, monitoring mechanisms should be strengthened to address the 380 implementation gaps. 381 382 Promote culture of research and innovation. Research and innovation are vital in 383
development of capacities and increasing competitiveness. HEIs in the Region 384 promote the culture of research and innovation to further engage in the knowledge-385
based economy. 386 387 Enhance soft-skills of graduates. Development of the 21st century skills such as 388
critical thinking, problem-solving, creativity and imagination, self-direction, initiative, 389 and collaboration and teamwork has to be pursued. Apart from technical skills 390
acquired through formal education and training, these soft-skills are also sought by 391 employers. Learning methods to acquire these skills will be promoted across the 392 different levels of education. 393 394

Note: This RDP 2017-2022 Midterm Update Chapter is still preliminary and subject to further review and RDC approval. This draft is NOT official and no part of this document may be cited or quoted. This is being circulated for public consultation purposes.
14
Further strengthen the academe-industry collaboration. Industry skills requirement is 395
expected to evolve with the anticipated fourth industrial evolution. To minimize the 396 job-skills mismatch, collaboration between the academe and the industry need to be 397 further strengthened. Involvement of the government sector will also be promoted to 398
identify and develop more strategies that will address the job skills mismatch. 399 Industry demanded TVET programs that are area-specific, flexible, holistic, and 400 product and service oriented will also be prioritized. 401 402
Subsector Outcome C: Income earning ability-increased 403
404 Subsector outcome C.1: Employability improved 405 406 Strengthen employment facilitation services. New entrants to labor market including 407
OFs will be assisted through employment facilitation services of DOLE and the 408 Public Employment Service Office (PESO) of LGUs. These jobseekers will be 409 assisted through coaching, career and pre-employment orientations, and job fairs. 410 Expanding the reach and provision of regular and up-to-date labor market 411
information will also be ensured. 412 413 To strengthen the Career Guidance Advocacy Program of DOLE, the Region will 414
promote the implementation of the Youth Employability Framework. Implementation 415 of the framework will strengthen the development of technical and lifeskills of 416 students while promoting the importance of values and attitude. 417
418 Promotion of Jobstart Philippine Program will be intensified to reach more young 419
jobseekers and provide employment opportunity to all including the out-of-school 420
youth. The program contributes to easing the school to work transition of youth 421
through enhancing the knowledge and skills acquired in formal education and 422 training. With the full participation of the private sector, the program is expected to 423
continuously contribute in reducing youth that are not in employment, education or 424 training. 425 426 Subsector outcome C.2: Productivity improved 427
428 Provide humane work environment. Safety, security and workplace harmony provide 429
enabling environment for employees to be productive. 430 431 Ensure adequate social services. Provision of quality social services such as the 432
health programs of the government will contribute in enhancing the labor 433 productivity. Accessible and quality social services for all should be ensured. 434 435 Tap the knowledge and skills gained of OFWs. The Balik Scientist provides an 436
opportunity to tap the knowledge and skills gained by OFs while working abroad. 437 Harnessing these knowledge and skills will be beneficial to improve the labor force’s 438 competitiveness and enhance their capabilities. 439
440 Subsector outcome C.3: Labor mobility and income security enhance 441 442
Note: This RDP 2017-2022 Midterm Update Chapter is still preliminary and subject to further review and RDC approval. This draft is NOT official and no part of this document may be cited or quoted. This is being circulated for public consultation purposes.
15
Enhance labor mobility. Labor mobility will be enhanced through increasing 443
competitiveness by being at par with the ASEAN and global standards as defined in 444 the Philippines Qualification Framework. 445 Intensify investments promotion. Promotion of local and foreign investments in the 446
Region will be pursued. Increased investments will contribute to increasing 447 employment opportunities to the Region’s labor force. 448 449 450
Major Programs and Projects 451
452 The Region’s priority programs, projects, and activities to achieve the sectoral and 453 societal outcomes in accelerating human capital development will be implemented 454 through volunteerism, convergence, and multi-stakeholder partnership approach. 455
The priority interventions of the Region are the following: 456 457 Sector Outcome A: Nutrition and health for all improved 458 459
Infant and new born care program 460
Maternal health Program 461
Mental Health Program 462
Existing and emerging communicable diseases program 463
1st 1000 Days of Life Program 464
Counseling, referral and rehabilitation for substance abuse patients 465
Food sustainability projects 466
Community involvement and sports development 467
Full implementation of the RPRH Law 468
Full implementation of No Balance Billing 469
Full implementation of Universal Health Care Act 470
Adolescent Health and Youth Development Program 471
Adoption of the Regional Plan for Action on Nutrition 472
Implementation of AIDS Policy Act of 2018 473 474
Sector Outcome B: Lifelong learning opportunities for all ensured 475 476
Balik Aral Program 477
Government Assistance to Students and Teachers in Private Education 478
Alternative learning system 479
Unified Student Financial Assistance System for Tertiary Education 480
Community-based training for special groups 481
Implementation of the National Technical Education and Skills Development 482 Plan (NTESDP) 2018-2022 483
Philippine Qualifications Framework 484
DepEd-DPWH Convergence Program 485
Government programs on increasing access to ICT 486
Full implementation of First Time Jobseekers Assistance Act 487 488
Legislative Agenda 489 490
Note: This RDP 2017-2022 Midterm Update Chapter is still preliminary and subject to further review and RDC approval. This draft is NOT official and no part of this document may be cited or quoted. This is being circulated for public consultation purposes.
16
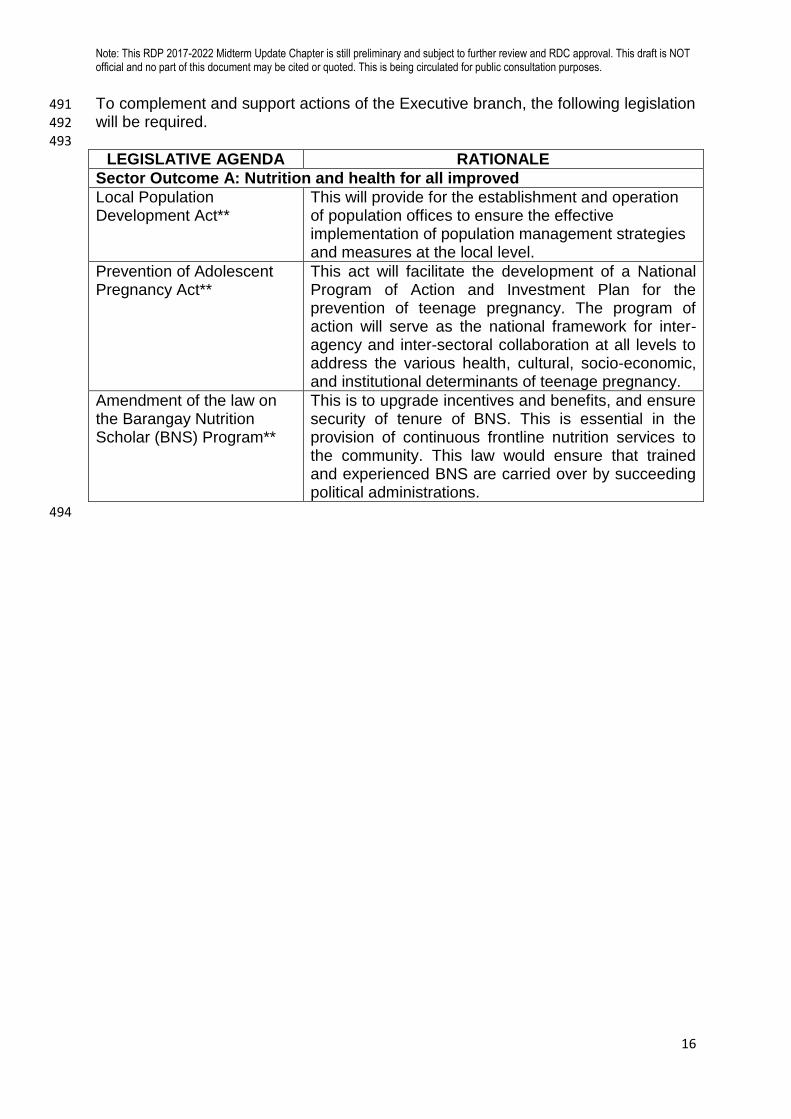
To complement and support actions of the Executive branch, the following legislation 491
will be required. 492 493
LEGISLATIVE AGENDA RATIONALE
Sector Outcome A: Nutrition and health for all improved
Local Population Development Act**
This will provide for the establishment and operation of population offices to ensure the effective implementation of population management strategies and measures at the local level.
Prevention of Adolescent Pregnancy Act**
This act will facilitate the development of a National Program of Action and Investment Plan for the prevention of teenage pregnancy. The program of action will serve as the national framework for inter-agency and inter-sectoral collaboration at all levels to address the various health, cultural, socio-economic, and institutional determinants of teenage pregnancy.
Amendment of the law on the Barangay Nutrition Scholar (BNS) Program**
This is to upgrade incentives and benefits, and ensure security of tenure of BNS. This is essential in the provision of continuous frontline nutrition services to the community. This law would ensure that trained and experienced BNS are carried over by succeeding political administrations.
494


![Outline Human capital theory by C. Echevarriahomepage.usask.ca/~ece220/econ221/4-HC [Compatibility Mode].pdf · Human capital theory by C. Echevarria ... Human capital Human capital](https://img.pdfslide.us/doc/110x75/5ae0d5467f8b9a6e5c8df29c/outline-human-capital-theory-by-c-ece220econ2214-hc-compatibility-modepdfhuman.jpg)