Embed Size (px)
Citation preview
China Economic Review 16 (2005) 50–70
China’s human capital investment
James J. HECKMAN*,1
Department of Economics, The University of Chicago, 1126 East 59th St., Chicago IL 60637, United States
Abstract
This paper discusses human capital investment in China. China’s current policies favor physical
capital investment over schooling and urban human capital investment over rural human capital
investment. Current migration policies discriminate against children of migrants. A more balanced
investment strategy across rural and urban regions and types of capital is appropriate. Private funding
for education through tuition and fees should be encouraged and can supplement government
funding and make schools more financially self-sufficient. However, if this policy is enacted, capital
markets for financing education need to be developed to avoid discouraging students from poor
families from attending school.
D 2004 Elsevier Inc. All rights reserved.
Keywords: Human capital; Economic growth; Migration
1. Introduction
In 1995, China, at all levels of government, spent about 2.5% of its GDP on investment
in schooling.2 At the same time, roughly 30% of its GDP was devoted to physical
investment. In the United States, those figures were 5.4% and 17%, respectively. In South
Korea, they were 3.7% and 30%. See Table 1 for a comparison of China with other
countries in its governmental expenditure of GDP on education. China was below average
1043-951X/$ - see fron
doi:10.1016/j.chieco.200
* Tel.: +1 773 702
E-mail address: jjh@1 Heckman is Henry
a Senior Fellow of the A2 See UNESCO, Sta
t matter D 2004 Elsevier Inc. All rights reserved.
4.06.012
0634; fax: 1 773 702 8490.
uchicago.edu.
Schultz Distinguished Service Professor of Economics at the University of Chicago and
merican Bar Foundation.
tistical Yearbook (New York: UNESCO, 1999).
Table 1
Public expenditures on education as a percentage of GNP in 1995
World 5.2
China 2.5
Philippines 3
Thailand 4.1
India 3.3
Malaysia 4.7
Singapore 3
Pakistan 2.8
Turkey 2.2
South Korea 3.7
Egypt 4.8
Mexico 4.9
Brazil 5.1
Argentina 3.8a
United States 5.4a
Japan 3.6a
Canada 6.9a
Germany 4.8
Russian Federation 3.5
Poland 5.2
Hungary 5.3
Source: UNESCO (1999).a Data were only available for 1994.
J.J. Heckman / China Economic Review 16 (2005) 50–70 51
even among its peers in its expenditure on investment in people. Recent trends in
governmental human capital investment are favorable, but the investment proportion is
still low by world standards, rising to 3.3% in 2002 (see Table 2). More than 45% of GDP
was invested in physical capital in 2002. Even the dramatic growth in private spending on
Table 2
Government appropriation for education as a percentage of GDP in 100 million Yuan
Year Government appropriations
for education
GDP Educational expenditure
as percentage of GDP
1991 618 21,618 2.9%
1992 729 26,638 2.7%
1993 868 34,634 2.5%
1994 1175 46,759 2.5%
1995 1412 58,478 2.4%
1996 1672 67,885 2.5%
1997 1863 74,463 2.5%
1998 2033 78,345 2.6%
1999 2287 82,068 2.8%
2000 2563 89,468 2.9%
2001 3057 97,315 3.1%
2002 3491 104,791 3.3%
Source: China Statistical Yearbook 2003.
J.J. Heckman / China Economic Review 16 (2005) 50–7052
education in the past 10 years, while encouraging (see Tables 3 and 4), is not enough to
fully redress the imbalance.
China’s ratio of annual investment in physical capital to human capital is much higher
than that in most countries. This imbalance might be warranted if the economic rate of
return to physical capital were much greater than the economic rate of return to human
capital. Below, I summarize evidence that indicates that the true rate of return to education
and skill formation is very high and that the imbalance in human capital investment
relative to physical capital investment is symptomatic of a serious distortion in current
policy that retards economic development in China. Conventional methods for computing
rates of return to human capital that are useful in less regulated labor markets, and are
frequently applied to the study of the Chinese labor market, give a misleading estimate of
the true social rate of return to human capital. Other methods must be used to estimate the
true social return.
A basic result of economics is that resources should flow to their most productive use.
A policy that equalizes returns across all investment types and across all regions increases
economic growth. Current Chinese policy tends to ignore this fundamental rule not only
by promoting physical capital investment over human capital investment, but also by
restricting the flow of resources across regions and investing in education at different rates
in different regions and by investing in physical capital in an imbalanced fashion. These
policies reduce the economic growth of China and promote inequality, both in the short
run and in the long run.
In this paper, I first present the potential benefits that flow from investment in human
capital. Then, I discuss the empirical evidence on the rate of return to education in China
and evidence on regional and geographic imbalances in expenditure on human capital
investment. I then consider alternative policy reforms that would foster skill acquisition
and enable China to harvest the benefits of investment in both physical and human capital.
I make seven points. (1) The benefits of human capital investment are substantial. (2)
The current level of investment in human capital in China is low compared to what is
Table 3
Government and total funds devoted to education in 100 million Yuan
Year Total Government appropriations
for education
%
1991 731.5 617.8 84.5
1992 867.0 728.8 84.1
1993 1059.9 867.8 81.9
1994 1488.8 1174.7 78.9
1995 1878.0 1411.5 75.2
1996 2262.3 1671.7 73.9
1997 2531.7 1862.5 73.6
1998 2949.1 2032.5 68.9
1999 3349.0 2287.2 68.3
2000 3849.1 2562.6 66.6
2001 4637.7 3057.0 65.9
2002 5480.0 3491.4 63.7
Source: China Statistical Yearbook 2003, and China Educational Finance Statistical Yearbook 2003.
Table 4
Total expenditures on education as a percentage of GDP in 100 million Yuan
Year Total education fundsa GDP %
1991 732 21,618 3.4
1992 867 26,638 3.3
1993 1060 34,634 3.1
1994 1489 46,759 3.2
1995 1878 58,478 3.2
1996 2262 67,885 3.3
1997 2532 74,463 3.4
1998 2949 78,345 3.8
1999 3349 82,068 4.1
2000 3849 89,468 4.3
2001 4638 97,315 4.8
2002 5480 104,791 5.2
Source: China Statistical Yearbook 2003, and China Educational Finance Statistical Yearbook 2003.a Total education funds, including government appropriation for education, organization and citizens running
schools, and other funds.
J.J. Heckman / China Economic Review 16 (2005) 50–70 53
required to complement the very high investment in physical capital and the large influx
of unskilled labor into urban areas. (3) At current levels, investment in human capital is
inequitably and inefficiently distributed across geographical regions and rural and urban
areas within the regions. (4) The imbalance in investment in human capital compared to
physical capital reduces the return to physical capital and thwarts physical investment
initiatives designed to foster growth in interior China and regions targeted for
rejuvenation. (5) A more balanced portfolio of investment will promote economic
growth and reduce inequality in the long run. (6) Open labor markets, functioning
markets for loans to human capital, and fewer restrictions on the mobility of workers
will foster human capital growth at little cost to governments. (7) The current growth in
private sector financing of education is encouraging (see Table 3). It has substantially
boosted the share of total GDP devoted to education (see Table 4). Reliance on the
private sector has great potential for increasing formation of human capital without
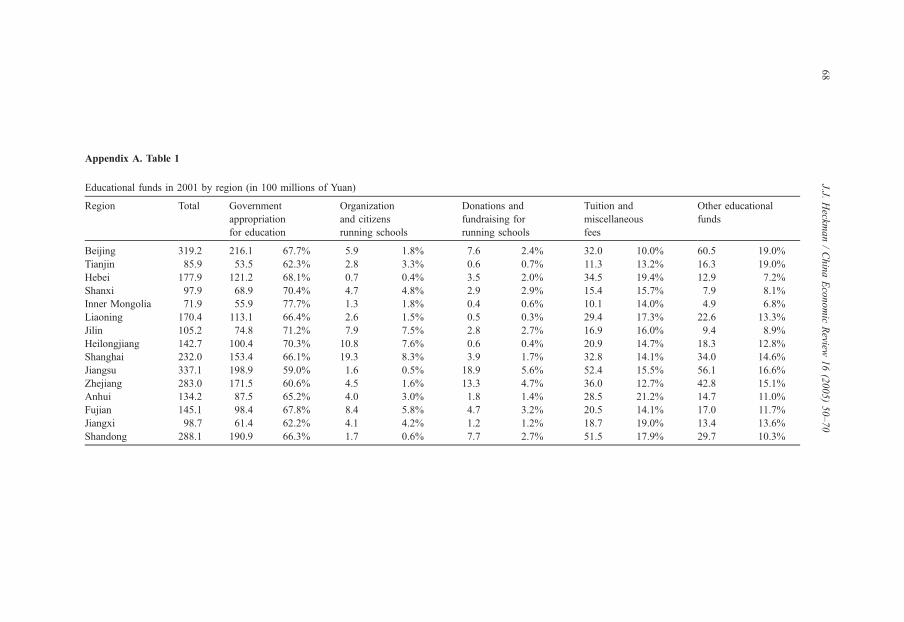
raising taxes. The percent of funds coming from private sources varies greatly across
regions [see Appendix A (Table 1)]. Some of the poorest regions use fees to pay for
schooling. Unless access to capital markets to finance education is improved, reliance on
tuition fees to finance education will deny access to education to children from poor
families.
2. The benefits of human capital investment
When economists first began to measure the sources of economic growth, what
previously had been considered an unexplained residual was shown to be attributable to
human capital. From studies of the development of the American economy, and the
sources of growth of many countries around the world, it has become recognized that
human capital—the skill of the population—plays a major role in explaining differences in
productivity and inequality among nations (Becker, 1964; Schultz, 1981). Human capital
J.J. Heckman / China Economic Review 16 (2005) 50–7054
is another, very valuable, kind of capital. It is costly to acquire, like physical capital, and
pays off over time, like physical capital.
The term human capital suggests to some a depersonalization or commercialization of
the individual and is often associated in popular discussions with a dehumanizing society
that equates men with machines. In fact, it is just the other way around. The human capital
concept recognizes that human beings are as important, if not more important, than
physical capital in creating wealth. Investment in people is an appropriate concept for the
People’s Republic of China. To understand how human capital affects the economy and
why China should promote it, consider how human capital improves productivity.
First, human capital is productive because of its effect on raising the skills of those
invested in. Thus, for example, if you train an individual to be a better accountant, the
accounting performance of that individual will rise. If you train a worker to fix an engine,
the worker will be more productive in fixing engines. These are the obvious direct effects
of making people more skilled.
Human capital also improves adaptability and allocative efficiency. More skilled
workers allocate resources more effectively across tasks and are more able to adapt to
change and to respond to new opportunities (Nelson & Phelps, 1966; Schultz, 1975).
These benefits of human capital investment are especially relevant today. China is
changing. Its labor markets and capital markets are changing along with the rest of the
world’s economy. Numerous empirical studies demonstrate that more educated and skilled
people adapt better to change. They are able to benefit from opportunities that become
available and create new opportunities of their own. They enhance productivity in the
workplace. Greater skill also facilitates worker mobility across occupations, industries, and
regions in response to new opportunities. It helps people reallocate resources, both human
and physical, toward more productive opportunities, and even to realize that those
opportunities exist. A more educated workforce is a more flexible workforce. More
educated people are better able to absorb new ideas, adopt foreign technologies, improve
local technologies, and understand and apply knowledge from outside China to local
situations.
As China enters world markets, it has access to newer forms of technology and
organizational arrangements. The need for a more skilled workforce will increase. By
developed world standards, China’s percentage of college-educated workers is low (see
Table 5). The proportion of college educated workers in many developed societies is in
excess of 30%. There is substantial regional variability in educational attainment levels, so
that the educational infrastructure for modern growth is deficient. I suspect that if a full
accounting were made of on-the-job training—postschool investment that is a vital
component of human capital formation in modern economies—this would only strengthen
the conclusion that human capital is in short supply in modern China.
The new technology being brought into China by its investment in physical capital
requires more skilled workers to operate it. Unskilled workers migrating into industrial
areas require skilled workers to train and complement them. Capital and skill are
complementary. So are unskilled workers and skilled workers. Each factor raises the
productivity of the other. An investment strategy that emphasizes physical capital over
human capital fails to capture the benefits that arise from a more balanced investment
strategy. It takes skilled workers to make the most efficient use of modern technologies.
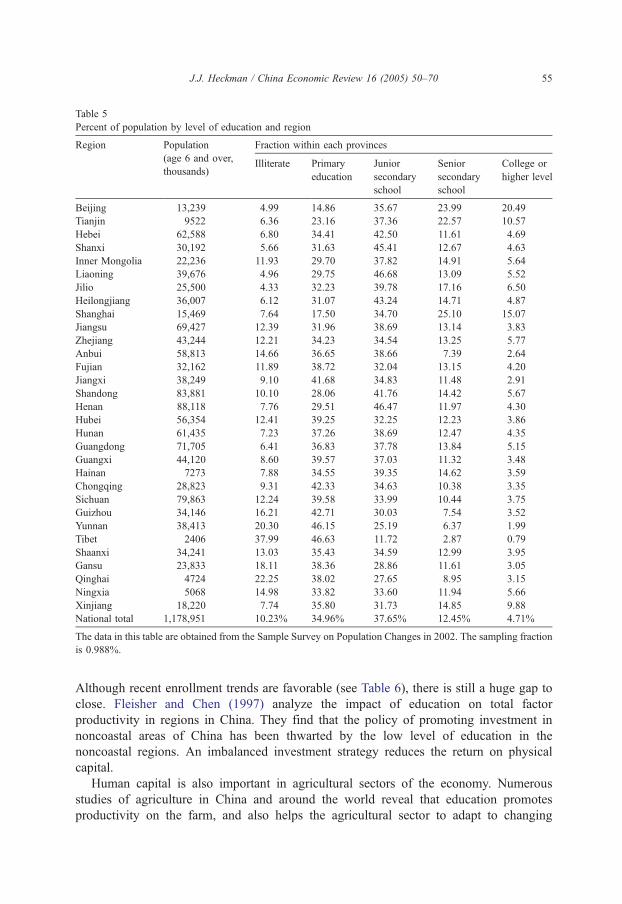
Table 5
Percent of population by level of education and region
Region Population
(age 6 and over,
thousands)
Fraction within each provinces
Illiterate Primary
education
Junior
secondary
school
Senior
secondary
school
College or
higher level
Beijing 13,239 4.99 14.86 35.67 23.99 20.49
Tianjin 9522 6.36 23.16 37.36 22.57 10.57
Hebei 62,588 6.80 34.41 42.50 11.61 4.69
Shanxi 30,192 5.66 31.63 45.41 12.67 4.63
Inner Mongolia 22,236 11.93 29.70 37.82 14.91 5.64
Liaoning 39,676 4.96 29.75 46.68 13.09 5.52
Jilio 25,500 4.33 32.23 39.78 17.16 6.50
Heilongjiang 36,007 6.12 31.07 43.24 14.71 4.87
Shanghai 15,469 7.64 17.50 34.70 25.10 15.07
Jiangsu 69,427 12.39 31.96 38.69 13.14 3.83
Zhejiang 43,244 12.21 34.23 34.54 13.25 5.77
Anbui 58,813 14.66 36.65 38.66 7.39 2.64
Fujian 32,162 11.89 38.72 32.04 13.15 4.20
Jiangxi 38,249 9.10 41.68 34.83 11.48 2.91
Shandong 83,881 10.10 28.06 41.76 14.42 5.67
Henan 88,118 7.76 29.51 46.47 11.97 4.30
Hubei 56,354 12.41 39.25 32.25 12.23 3.86
Hunan 61,435 7.23 37.26 38.69 12.47 4.35
Guangdong 71,705 6.41 36.83 37.78 13.84 5.15
Guangxi 44,120 8.60 39.57 37.03 11.32 3.48
Hainan 7273 7.88 34.55 39.35 14.62 3.59
Chongqing 28,823 9.31 42.33 34.63 10.38 3.35
Sichuan 79,863 12.24 39.58 33.99 10.44 3.75
Guizhou 34,146 16.21 42.71 30.03 7.54 3.52
Yunnan 38,413 20.30 46.15 25.19 6.37 1.99
Tibet 2406 37.99 46.63 11.72 2.87 0.79
Shaanxi 34,241 13.03 35.43 34.59 12.99 3.95
Gansu 23,833 18.11 38.36 28.86 11.61 3.05
Qinghai 4724 22.25 38.02 27.65 8.95 3.15
Ningxia 5068 14.98 33.82 33.60 11.94 5.66
Xinjiang 18,220 7.74 35.80 31.73 14.85 9.88
National total 1,178,951 10.23% 34.96% 37.65% 12.45% 4.71%
The data in this table are obtained from the Sample Survey on Population Changes in 2002. The sampling fraction
is 0.988%.
J.J. Heckman / China Economic Review 16 (2005) 50–70 55
Although recent enrollment trends are favorable (see Table 6), there is still a huge gap to
close. Fleisher and Chen (1997) analyze the impact of education on total factor
productivity in regions in China. They find that the policy of promoting investment in
noncoastal areas of China has been thwarted by the low level of education in the
noncoastal regions. An imbalanced investment strategy reduces the return on physical
capital.
Human capital is also important in agricultural sectors of the economy. Numerous
studies of agriculture in China and around the world reveal that education promotes
productivity on the farm, and also helps the agricultural sector to adapt to changing
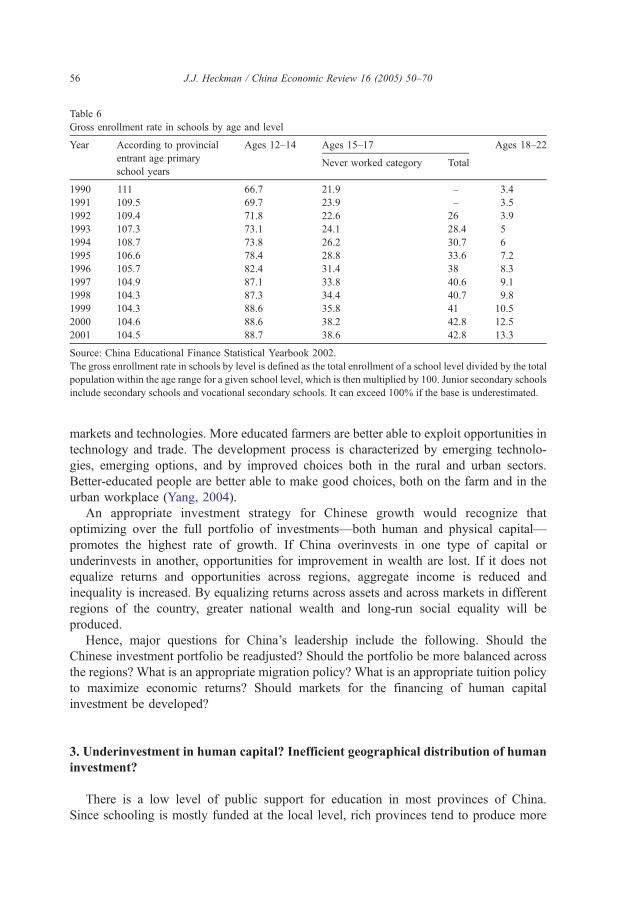
Table 6
Gross enrollment rate in schools by age and level
Year According to provincial
entrant age primary
school years
Ages 12–14 Ages 15–17 Ages 18–22
Never worked category Total
1990 111 66.7 21.9 – 3.4
1991 109.5 69.7 23.9 – 3.5
1992 109.4 71.8 22.6 26 3.9
1993 107.3 73.1 24.1 28.4 5
1994 108.7 73.8 26.2 30.7 6
1995 106.6 78.4 28.8 33.6 7.2
1996 105.7 82.4 31.4 38 8.3
1997 104.9 87.1 33.8 40.6 9.1
1998 104.3 87.3 34.4 40.7 9.8
1999 104.3 88.6 35.8 41 10.5
2000 104.6 88.6 38.2 42.8 12.5
2001 104.5 88.7 38.6 42.8 13.3
Source: China Educational Finance Statistical Yearbook 2002.
The gross enrollment rate in schools by level is defined as the total enrollment of a school level divided by the total
population within the age range for a given school level, which is then multiplied by 100. Junior secondary schools
include secondary schools and vocational secondary schools. It can exceed 100% if the base is underestimated.
J.J. Heckman / China Economic Review 16 (2005) 50–7056
markets and technologies. More educated farmers are better able to exploit opportunities in
technology and trade. The development process is characterized by emerging technolo-
gies, emerging options, and by improved choices both in the rural and urban sectors.
Better-educated people are better able to make good choices, both on the farm and in the
urban workplace (Yang, 2004).
An appropriate investment strategy for Chinese growth would recognize that
optimizing over the full portfolio of investments—both human and physical capital—
promotes the highest rate of growth. If China overinvests in one type of capital or
underinvests in another, opportunities for improvement in wealth are lost. If it does not
equalize returns and opportunities across regions, aggregate income is reduced and
inequality is increased. By equalizing returns across assets and across markets in different
regions of the country, greater national wealth and long-run social equality will be
produced.
Hence, major questions for China’s leadership include the following. Should the
Chinese investment portfolio be readjusted? Should the portfolio be more balanced across
the regions? What is an appropriate migration policy? What is an appropriate tuition policy
to maximize economic returns? Should markets for the financing of human capital
investment be developed?
3. Underinvestment in human capital? Inefficient geographical distribution of human
investment?
There is a low level of public support for education in most provinces of China.
Since schooling is mostly funded at the local level, rich provinces tend to produce more
J.J. Heckman / China Economic Review 16 (2005) 50–70 57
human capital per capita than do poor provinces. Resource constraints differentially
affect access to schooling of individuals in different parts of China, especially in rural
areas and in the West. The place of a person’s birth is one of the most important
determinants of that person’s adult skill level (Knight & Song, 1999). This creates
serious regional disparities, is a major source of inefficiency in current policy (Li,
undated), and is a powerful source of inequality in Chinese society across people
contemporaneously and across generations. This source of inequality is reinforced by the
vestiges of hukou policy that charges children of interregional immigrants additional fees
for schooling that can amount to as much as 10% of total family income just for the
right to attend school (Xie, 1999).
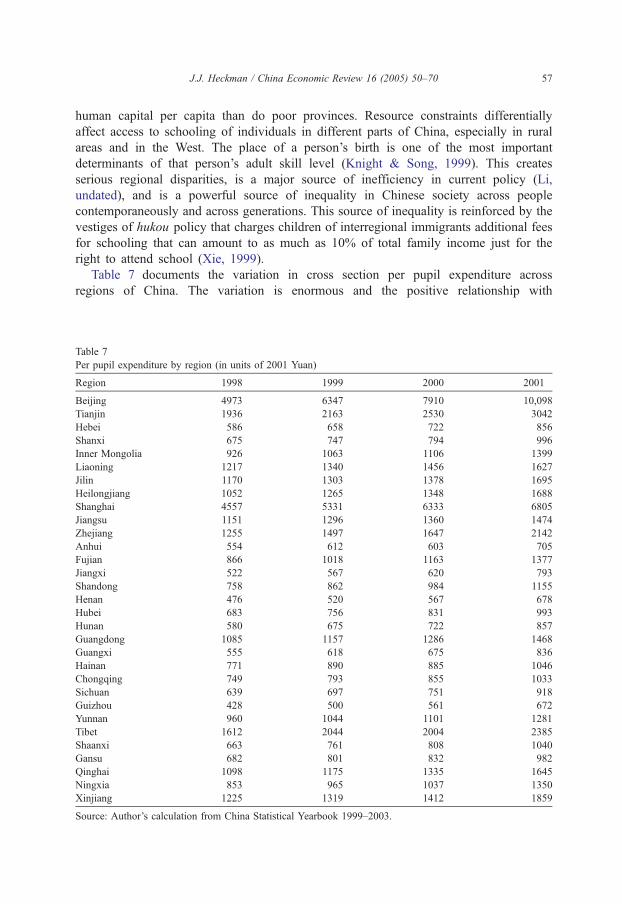
Table 7 documents the variation in cross section per pupil expenditure across
regions of China. The variation is enormous and the positive relationship with
Table 7
Per pupil expenditure by region (in units of 2001 Yuan)
Region 1998 1999 2000 2001
Beijing 4973 6347 7910 10,098
Tianjin 1936 2163 2530 3042
Hebei 586 658 722 856
Shanxi 675 747 794 996
Inner Mongolia 926 1063 1106 1399
Liaoning 1217 1340 1456 1627
Jilin 1170 1303 1378 1695
Heilongjiang 1052 1265 1348 1688
Shanghai 4557 5331 6333 6805
Jiangsu 1151 1296 1360 1474
Zhejiang 1255 1497 1647 2142
Anhui 554 612 603 705
Fujian 866 1018 1163 1377
Jiangxi 522 567 620 793
Shandong 758 862 984 1155
Henan 476 520 567 678
Hubei 683 756 831 993
Hunan 580 675 722 857
Guangdong 1085 1157 1286 1468
Guangxi 555 618 675 836
Hainan 771 890 885 1046
Chongqing 749 793 855 1033
Sichuan 639 697 751 918
Guizhou 428 500 561 672
Yunnan 960 1044 1101 1281
Tibet 1612 2044 2004 2385
Shaanxi 663 761 808 1040
Gansu 682 801 832 982
Qinghai 1098 1175 1335 1645
Ningxia 853 965 1037 1350
Xinjiang 1225 1319 1412 1859
Source: Author’s calculation from China Statistical Yearbook 1999–2003.
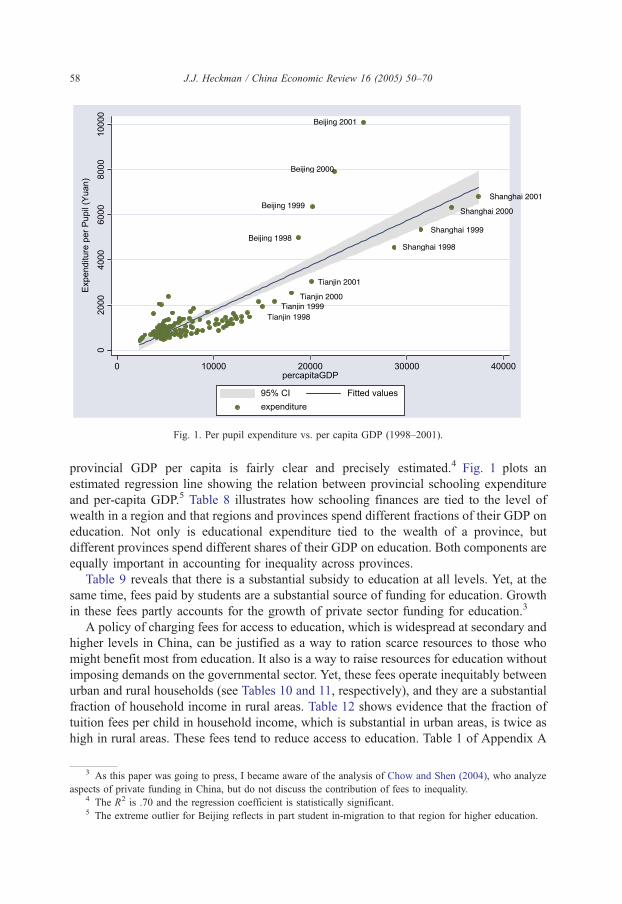
Fig. 1. Per pupil expenditure vs. per capita GDP (1998–2001).
J.J. Heckman / China Economic Review 16 (2005) 50–7058
provincial GDP per capita is fairly clear and precisely estimated.4 Fig. 1 plots an
estimated regression line showing the relation between provincial schooling expenditure
and per-capita GDP.5 Table 8 illustrates how schooling finances are tied to the level of
wealth in a region and that regions and provinces spend different fractions of their GDP on
education. Not only is educational expenditure tied to the wealth of a province, but
different provinces spend different shares of their GDP on education. Both components are
equally important in accounting for inequality across provinces.
Table 9 reveals that there is a substantial subsidy to education at all levels. Yet, at the
same time, fees paid by students are a substantial source of funding for education. Growth
in these fees partly accounts for the growth of private sector funding for education.3
A policy of charging fees for access to education, which is widespread at secondary and
higher levels in China, can be justified as a way to ration scarce resources to those who
might benefit most from education. It also is a way to raise resources for education without
imposing demands on the governmental sector. Yet, these fees operate inequitably between
urban and rural households (see Tables 10 and 11, respectively), and they are a substantial
fraction of household income in rural areas. Table 12 shows evidence that the fraction of
tuition fees per child in household income, which is substantial in urban areas, is twice as
high in rural areas. These fees tend to reduce access to education. Table 1 of Appendix A
4 The R2 is .70 and the regression coefficient is statistically significant.5 The extreme outlier for Beijing reflects in part student in-migration to that region for higher education.
3 As this paper was going to press, I became aware of the analysis of Chow and Shen (2004), who analyze
aspects of private funding in China, but do not discuss the contribution of fees to inequality.
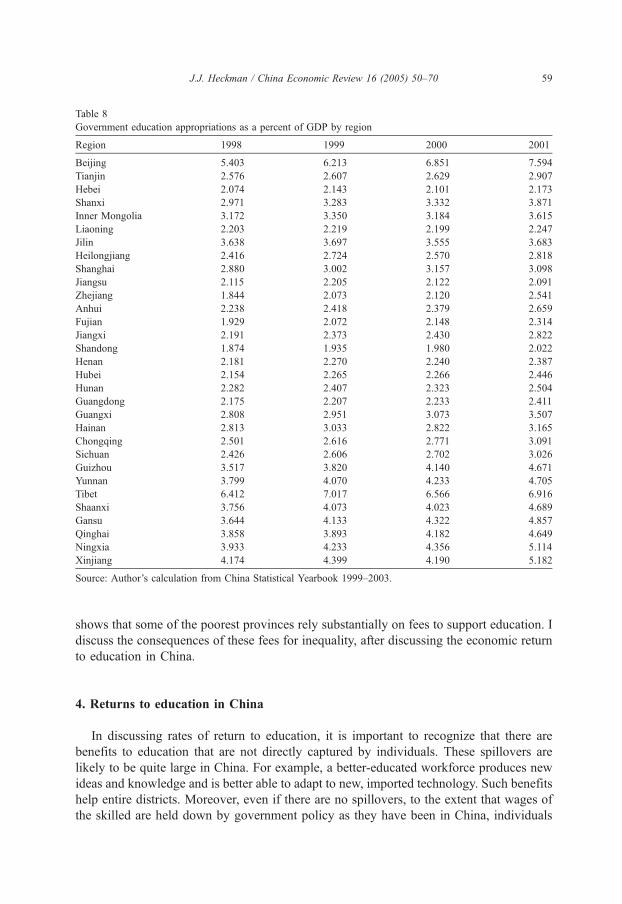
Table 8
Government education appropriations as a percent of GDP by region
Region 1998 1999 2000 2001
Beijing 5.403 6.213 6.851 7.594
Tianjin 2.576 2.607 2.629 2.907
Hebei 2.074 2.143 2.101 2.173
Shanxi 2.971 3.283 3.332 3.871
Inner Mongolia 3.172 3.350 3.184 3.615
Liaoning 2.203 2.219 2.199 2.247
Jilin 3.638 3.697 3.555 3.683
Heilongjiang 2.416 2.724 2.570 2.818
Shanghai 2.880 3.002 3.157 3.098
Jiangsu 2.115 2.205 2.122 2.091
Zhejiang 1.844 2.073 2.120 2.541
Anhui 2.238 2.418 2.379 2.659
Fujian 1.929 2.072 2.148 2.314
Jiangxi 2.191 2.373 2.430 2.822
Shandong 1.874 1.935 1.980 2.022
Henan 2.181 2.270 2.240 2.387
Hubei 2.154 2.265 2.266 2.446
Hunan 2.282 2.407 2.323 2.504
Guangdong 2.175 2.207 2.233 2.411
Guangxi 2.808 2.951 3.073 3.507
Hainan 2.813 3.033 2.822 3.165
Chongqing 2.501 2.616 2.771 3.091
Sichuan 2.426 2.606 2.702 3.026
Guizhou 3.517 3.820 4.140 4.671
Yunnan 3.799 4.070 4.233 4.705
Tibet 6.412 7.017 6.566 6.916
Shaanxi 3.756 4.073 4.023 4.689
Gansu 3.644 4.133 4.322 4.857
Qinghai 3.858 3.893 4.182 4.649
Ningxia 3.933 4.233 4.356 5.114
Xinjiang 4.174 4.399 4.190 5.182
Source: Author’s calculation from China Statistical Yearbook 1999–2003.
J.J. Heckman / China Economic Review 16 (2005) 50–70 59
shows that some of the poorest provinces rely substantially on fees to support education. I
discuss the consequences of these fees for inequality, after discussing the economic return
to education in China.
4. Returns to education in China
In discussing rates of return to education, it is important to recognize that there are
benefits to education that are not directly captured by individuals. These spillovers are
likely to be quite large in China. For example, a better-educated workforce produces new
ideas and knowledge and is better able to adapt to new, imported technology. Such benefits
help entire districts. Moreover, even if there are no spillovers, to the extent that wages of
the skilled are held down by government policy as they have been in China, individuals
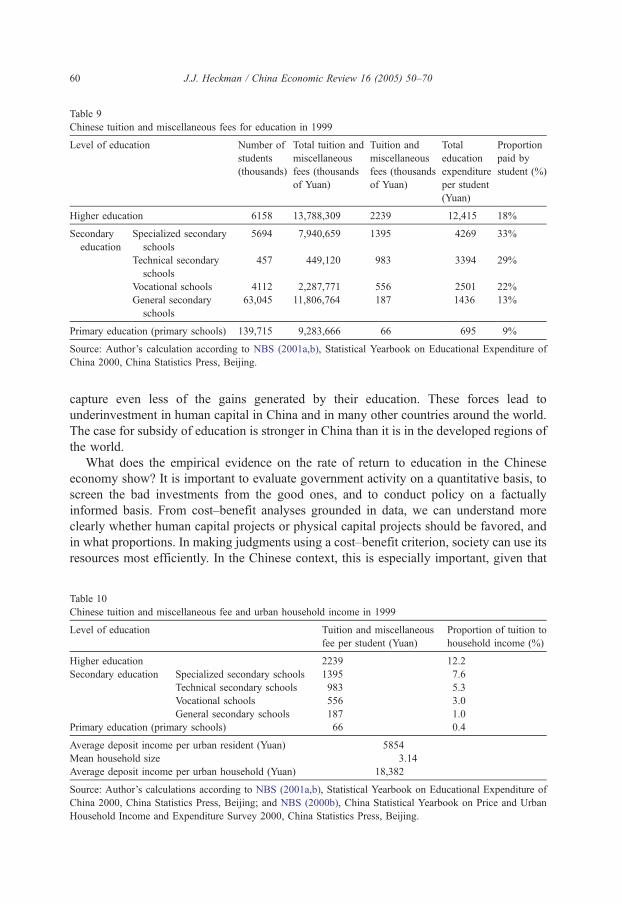
Table 9
Chinese tuition and miscellaneous fees for education in 1999
Level of education Number of
students
(thousands)
Total tuition and
miscellaneous
fees (thousands
of Yuan)
Tuition and
miscellaneous
fees (thousands
of Yuan)
Total
education
expenditure
per student
(Yuan)
Proportion
paid by
student (%)
Higher education 6158 13,788,309 2239 12,415 18%
Secondary
education
Specialized secondary
schools
5694 7,940,659 1395 4269 33%
Technical secondary
schools
457 449,120 983 3394 29%
Vocational schools 4112 2,287,771 556 2501 22%
General secondary
schools
63,045 11,806,764 187 1436 13%
Primary education (primary schools) 139,715 9,283,666 66 695 9%
Source: Author’s calculation according to NBS (2001a,b), Statistical Yearbook on Educational Expenditure of
China 2000, China Statistics Press, Beijing.
J.J. Heckman / China Economic Review 16 (2005) 50–7060
capture even less of the gains generated by their education. These forces lead to
underinvestment in human capital in China and in many other countries around the world.
The case for subsidy of education is stronger in China than it is in the developed regions of
the world.
What does the empirical evidence on the rate of return to education in the Chinese
economy show? It is important to evaluate government activity on a quantitative basis, to
screen the bad investments from the good ones, and to conduct policy on a factually
informed basis. From cost–benefit analyses grounded in data, we can understand more
clearly whether human capital projects or physical capital projects should be favored, and
in what proportions. In making judgments using a cost–benefit criterion, society can use its
resources most efficiently. In the Chinese context, this is especially important, given that
Table 10
Chinese tuition and miscellaneous fee and urban household income in 1999
Level of education Tuition and miscellaneous
fee per student (Yuan)
Proportion of tuition to
household income (%)
Higher education 2239 12.2
Secondary education Specialized secondary schools 1395 7.6
Technical secondary schools 983 5.3
Vocational schools 556 3.0
General secondary schools 187 1.0
Primary education (primary schools) 66 0.4
Average deposit income per urban resident (Yuan) 5854
Mean household size 3.14
Average deposit income per urban household (Yuan) 18,382
Source: Author’s calculations according to NBS (2001a,b), Statistical Yearbook on Educational Expenditure of
China 2000, China Statistics Press, Beijing; and NBS (2000b), China Statistical Yearbook on Price and Urban
Household Income and Expenditure Survey 2000, China Statistics Press, Beijing.
Table 11
Chinese tuition and miscellaneous fee and rural household income in 1999
Level of education Tuition and miscellaneous
fee per student (Yuan)
Proportion of tuition to
household income (%)
Higher education 2239 23.8
Secondary education Specialized secondary schools 1395 14.8
Technical secondary schools 983 10.5
Vocational schools 556 5.9
General secondary schools 187 2.0
Primary education (primary schools) 66 0.7
Average pure income per rural resident (Yuan) 2210
Mean household size 4.25
Average pure income per rural household (Yuan) 9393
Source: Author’s calculation according to NBS (2001a,b), Statistical Yearbook on Educational Expenditure of
China 2000, China Statistics Press, Beijing; and NBS (2000a), China Rural Household Survey Yearbook 2000,
China Statistics Press, Beijing.
J.J. Heckman / China Economic Review 16 (2005) 50–70 61
the country as a whole is poor. So it is especially important to make wise investment
decisions in the country.
Estimating the rate of return to education in China in the way economists do in Western
economies—relating market wages to levels of schooling—one finds that the rate of return
to education in China in the early 1990s was about 4% (Chow, 2002). This is a low rate of
return. Heckman and Li (2004) note that the rate of return has risen to 7% in recent years.
It is far below the rate of return to physical capital in industry that is estimated by some to
be as high as 20% (Chow, 1993). Taken at face value, these estimated returns suggest that
there might be too much investment in human capital in China. To give you a benchmark
Table 12
Chinese tuition fee for higher education and rural and urban household income for the five provinces with the
lowest resident income in 1999 (in Yuan)
Five provinces with lowest
resident income
Average
resident
income
Mean
household
size
Average
household
income
Tuition fees
for higher
education
Proportion of tuition
to household
income (%)
Urban areas Henan 4532 3.21 14,548 2239 15.4
Jilin 4480 3.09 13,843 2239 16.2
Gansu 4475 3.1 13,873 2239 16.1
Ningxia 4473 3.13 14,000 2239 16.0
Shaanxi 4343 3.17 13,767 2239 16.3
Rural areas Shaanxi 1456 4.41 6421 2239 34.9
Yunnan 1438 4.59 6600 2239 33.9
Guizhou 1363 4.5 6134 2239 36.5
Gansu 1357 4.86 6595 2239 33.9
Tibet 1309 6.84 8954 2239 25.0
Source: Author’s calculation according to NBS (2001a,b), Statistical Yearbook on Educational Expenditure of
China 2000, China Statistics Press, Beijing; NBS (2000b), China Statistical Yearbook on Price and Urban
Household Income and Expenditure Survey 2000, China Statistics Press, Beijing; and NBS (2000a), China Rural
Household Survey Yearbook 2000, China Statistics Press, Beijing.
J.J. Heckman / China Economic Review 16 (2005) 50–7062
figure, in the United States and many other countries, there are estimates that the rate of
return to human capital is as high as 15% to 20%. This evidence suggests that the
relatively high ratio of physical capital investment to human capital investment in China
might be appropriate.
If one understands how labor markets function in China, one realizes how misleading
such a conclusion would be, even for a historical analysis of educational policy. Labor
markets are the markets that price human capital services and reward people for their
skills. Wage policy in China historically guaranteed a low rate of return to skilled labor.
There are still many restrictions on wage setting in the labor market. So the only thing one
can conclude from standard rate of return to education analysis applied to historical
Chinese data is that personal incentives to invest in skills are low, although this is changing
(Cai, Wang, & Du, 2002).
The low private rate of return to education does not reflect the true rate of return in the
late 1980s or early 1990s. Labor markets were so distorted in China that wages did not
reflect the true marginal contribution of educated labor to the economy. To show this, I
draw on an analysis of data whose collection was supported by the Ford Foundation
working in cooperation with the Chinese Academy of Social Sciences and analyzed by
Fleisher and Wang (2004). Their analysis suggests that the social return to human capital is
much higher than the private return. Instead of looking directly at market data and seeing
what individuals are paid, they look at the productivity of education in the workplace in
producing output. This is a production-based return to education rather than a
compensation-based measure of the type that is widely used.
Their econometric studies suggest that the return to education was as high as 30% or
40% (Fleisher and Wang, 2004). The wages paid to skilled workers are only 10% of their
marginal productivity in 1992. Unskilled workers’ wages are much closer to their marginal
products. This evidence demonstrates the extreme consequences of wage setting policies
that fail to pay for productivity. Since workers get only a small fraction of their payment
for skill, they have weak incentives to acquire skills.
The rate of return to education in production estimated by Fleisher and Wang is
higher than any estimate reported in the United States or Western Europe. And
arguably, they underestimate the true rate of return to human capital because there are
many further benefits of education not captured by their output measure. Thus, the
available microeconomic data from China suggest that there is in fact substantial
underinvestment in human capital. Labor markets in China gave the wrong incentives
to workers in the late 1980s and early 1990s and likely do so today. If we compare
estimates of the true productivity in education with wages paid, Chinese labor markets
did not pay skill what it is worth and likely do not do so today. Fleisher and Chen
(1997) show that returns to education exceed the returns to investment in public
infrastructure in all provinces of China except Beijing, Tianjin, and Shanghai—regions
with high levels of education investment. They further estimate that the lower levels of
education in noncoastal China reduce the productivity of all forms of capital in those
regions by half. An imbalanced policy that seeks to improve productivity in noncoastal
China by encouraging investment in physical capital alone is much less effective than a
policy that invests in a more balanced fashion in both human capital and physical
capital.
J.J. Heckman / China Economic Review 16 (2005) 50–70 63
5. Policies to foster human capital and promote economic growth
The low level of compensation accorded to education relative to its large direct effect
on measured output is evidence of distortions in overall policy. Current policy reduces
the incentives of individuals to acquire the appropriate amount of human capital.
Chinese labor market policy and educational policy cause the national portfolio of
investments to be distorted away from human capital toward physical capital investment,
to be distorted away from human capital investment in the interior and toward the coast,
and to be distorted against human capital investments in rural people. High rates of
social return to investment can be realized by taking funds, even those borrowed from
abroad, and those created in the enterprises in China, to invest in human capital and
distribute the investment more equitably. Such a strategy would foster the creation of
national wealth.
One way to encourage education and job training is to subsidize it. That approach
entails a substantial increase in government expenditure and may not be feasible. Further
increases in direct governmental support for education may be difficult, given the large
demands on governments for many projects and benefits.
Another way to foster human capital that entails less direct cost to governments is to
free up labor markets for human capital. A free labor market that allows the same kind of
incentives to operate as those that increasingly govern capital markets and product markets
in China would go a long way toward promoting skill formation. This would have a
powerful effect on promoting human capital. If persons receive a 30–40% return on human
capital investments, they would willingly pay the costs of schooling. A 4% or even a 7%
rate of return is not that profitable.
Freeing up the labor market for skills would allow the forces of private incentives to
operate. Giving individuals the fruits of their skills would motivate people to acquire skills
without necessarily costing the government anything. It would allow private incentives to
operate to create the investment pools for human capital and to open private schools to
obtain schooling. This process has begun in China (see Tables 3 and 4), but it should be
accelerated. By unleashing the forces of individual incentives to create human capital,
China will create wealth and create pools of finance for physical capital from the savings
of its educated workers. It will expand its tax base and enhance its revenue from taxation.
However, to promote efficiency and equality of opportunity for education, it will be
necessary to develop markets to finance education, as I discuss below.
Another policy that would promote growth is equalization of regional and urban–rural
rates of return to human and physical capital by permitting free capital and labor
mobility. For decades, Chinese policy has favored certain regions over others (see
Fleisher & Yang, 2003). Eliminating regional disparity in wages and opening up markets
to allow freedom of migration and pursuit of opportunities throughout China would
enhance economic development of the country as a whole; so would a centralized
educational finance policy that served to allocate governmental funds from the center
more evenly across the regions and between rural and urban areas. Western China and
rural areas currently have low incomes and hence poor support for education but a very
high return to it. National income will be increased by allocating more resources for
education and training to poorer regions.
J.J. Heckman / China Economic Review 16 (2005) 50–7064
Many Chinese object to freeing up incentives in labor markets. The hukou policy
protects urban residents against the competition of migrants and protects the wages of
the unskilled in urban areas more than those of the skilled who require no protection.
Opening the labor market would likely increase inequality in wages between skilled and
unskilled workers, at least in the short run as the wages of skilled workers would be bid
up as they become relatively scarce. However, this policy would produce the right
incentives for people to acquire skills. Given the right rewards and access to capital
markets to finance education, people will be willing to pay tuition for schooling, which
leads to higher salaries in unregulated markets. As education is increased, and returns
across regions are equalized, inequality across people and over generations will be
reduced.
For this system to operate effectively, credit markets for schooling should be developed
to allow students to borrow against their future earnings. In the absence of such markets, it
is only the young people from wealthy families that can pay tuition charges that currently
are as high as 30–40% of mean income in rural areas (see Tables 10 and 11). Inequality
would increase across the generations since only the rich could send their children to
school.
There are many inequality-generating mechanisms in place. Current practices restrict
mobility of labor across regions. Migrants face many costs that native residents do not. Of
course, there has been a dramatic improvement in freedom of mobility compared to the
policies of the 1960s and 1970s. However, the 10% increase in the cost of schooling as a
fraction of household income for the children of migrants currently reduces social mobility
and perpetuates intergenerational poverty. Access to education for the children of
immigrant workers promotes the migration of their parents, promotes social mobility and
equality, and raises productivity.
A lesson that has been learned from recent studies in the United States, Europe, and
other countries around the world is the value of competition among schools and incentives
in education in improving the performance of educational institutions (Heckman, 2000). If
China encourages even more private organizations, such as private business schools,
technological institutes, and the like to operate, it can create an efficient educational
infrastructure to promote the formation of human capital. This trend, well underway,
should be accelerated. Restrictions on entry of foreign and domestic institutions into the
market for education should be eliminated.
China should rely on personal incentives to encourage schools to perform well as
students shop among them. Schools would gain resources directly from the students they
educate, and the resources available to educate Chinese people would increase.
Another important policy goal is to promote further ties between industry and
universities. Many universities have begun such partnerships, but there is room for
much more growth in these productive arrangements. Such partnerships allow the
universities to respond to practical problems and therefore help local industry meet
some of the challenges that accompany the introduction and improvement of
technology. This will provide a source of finance by private industry for the
educational enterprise.
In the United States, there are very successful firm–school relationships with schools at
all quality levels, not just those between distinguished universities and high-tech firms.
J.J. Heckman / China Economic Review 16 (2005) 50–70 65
Many lesser schools have formed valuable partnerships working closely with companies
that need workforce training. By creating incentives and allowing individuals and
organizations to trade and to bargain in human capital and in physical capital markets, the
effectiveness of the educational infrastructure would be improved at no cost to
governments.
Creating incentives and developing capital markets to finance education would promote
investment in human capital. It is not necessary to use funds from the center or to presume
that education and skill formation should be governmentally supplied. Freeing up the labor
market and the market for education would harness the forces that promote acquisition of
skills by fostering the training of individual workers by firms, or encouraging individuals
to train themselves in the workplace to be better farmers, better factory workers, and better
managers.
By whatever mechanism, educational expenditures should be increased and, at any
level, equalized across regions to maximize the return on human capital investment. One
of the best-established empirical findings from around the world is that human capital
enhances the productivity of high-technology physical capital. The two complement each
other strongly. The current unbalanced investment strategy of China emphasizes physical
capital over human capital. As previously noted, this strategy undermines policies to
promote physical capital investment in rural areas and in noncoastal provinces. Returns to
capital are low when the level of education of the workforce is low. There are too few
skilled workers to effectively operate the new technology rapidly being introduced into
China and to train and manage the influx of unskilled workers into the modern sector.
Furthermore, the skills being produced by the educational system are not always the ones
needed by industry. I next discuss the issue of income inequality, a topic of great concern
in modern China.
6. Inequality
In the short run, open labor markets and large-scale investment in new technologies
lead to greater inequality in wages. The young and most able benefit. The process of
opening labor markets and investing in new methods of production is well underway
in China and has contributed to greater wage inequality, which is a source of much
public concern. More educated and more able persons benefit more from the new
economy.
This problem is a transient one. In the long run, there will be less inequality as the
population becomes more skilled and as opportunities for education and skill investment
are spread more widely throughout Chinese society. Inequality across the generations will
be reduced.
A policy fostering interregional migration would serve to offset the rise in inequality
produced by more open wage setting and, even in the short run, would serve to reduce
a basic source of wage inequality. A major source of income inequality in China is the
difference between rural and urban incomes. These differences are due to policies of
the Chinese government that increase inequality (Cai, Wang, & Du, 2002; Fleisher &
Yang, 2004; Johnson, 2000, 2002; Yang, 1999). Restrictions on labor migration from
J.J. Heckman / China Economic Review 16 (2005) 50–7066
rural to urban areas have produced disparity between urban and rural workers that in
relative terms is among the highest in the world (see Yang & Cai, 2003; Lin, Wang &
Zhao, 2003).
Labor reallocation is a major source of Chinese growth and is a force, even in the short
run, toward reducing inequality (Lin et al., 2003). Adding to the effects of restrictions on
labor mobility is the disparity in the funding of education between rural and urban areas.
On average, the rural labor force has four years less schooling than the urban labor force.
Open labor markets, open capital markets, and geographical equity in spending on
education will reduce inequality, both in the long run and the short run, as wages equalize
across regions and migrants move to regions that invest more in the education of the
children. However, one cannot look to migration alone to reduce inequality in wages
across regions. The important recent work of Lin et al. (2003) demonstrates that migration
would have to quadruple to reduce inequality. Migration must be supplemented by human
capital investment.
Inequality is not to be feared. Many Chinese fear inequality as a potential source of
social instability. However, greater inequality plays an important role in stimulating people
to acquire skills. Making people more skilled is not socially harmful. Enhancing skills
raises the productivity of the nation and makes more resources available to society at large.
Greater access to schooling raises productivity and reduces a major source of inequality in
society.
Human capital is the asset that ultimately determines the wealth of China. Fostering
access to education will reduce inequality in the long run. Promoting human capital creates
opportunities for everyone and is a major force for promoting social equality. The potential
of the Chinese nation will be realized if its workers become educated and able to use
modern skills to cope with the technology of the 21st century.
Current educational policy promotes inequality. Place of birth currently determines a
person’s chances to become skilled and the amount of capital with which they can work.
Current tuition policies for secondary-school students discriminate against the children of
the poor and the children of migrants. High tuition fees not matched by access to markets
to borrow for education discriminate against children from poor regions and poor
backgrounds. In comparing alternative policies, it is important to consider the inequality
produced by educational policy across regions. Inequality in Chinese labor markets does
not arise solely from competitive wage setting, although the recent rise in inequality is due
to it. The fundamental sources of inequality in Chinese society arise from opportunities for
migration and education. There is a role for letting market forces work to stimulate the
production of skills and at the same time to reduce overall inequality, even in the short run,
in China.
7. Concluding remarks
The true rate of return to education in China may be as high as 30% or 40%. Our
knowledge of the true return to education is currently very limited, as is our
knowledge of the true rate of return to physical capital. More studies based on rigorous
data are warranted. A more factually informed knowledge base will improve
J.J. Heckman / China Economic Review 16 (2005) 50–70 67
government decision making. If governments evaluate projects, whether they are
human capital projects, or investment projects for dams, roads, bridges, or factories,
they will make better investment decisions. Project evaluations play an important role
in keeping good investments and promoting good projects and eliminating the bad
ones. The value of factually informed cost–benefit econometrics is very high. Cost–
benefit studies produce value for local governments, for provincial governments and
for the central government. Research that creates and collects much richer data sets on
the returns to all kinds of human and physical capital to guide policy formation will
improve policymaking.
Despite the weak data base on China, some policy recommendations seem justified.
China’s economic performance will be enhanced by producing an educated workforce.
Economic performance will be enhanced by equalizing returns across all types of
investments—physical and human—and by reducing regional inequalities in access to
education and dependence of educational decisions on the income of parents. Human
capital has a high rate of return. Its formation would be promoted by freeing up labor
markets, eliminating regional disparities in wages and access to education, and by
opening human capital markets to finance the formation of human capital.
These policies reduce economic inequality in the long run. Policies that promote
migration will reduce a major source of inequality, even in the short run. Human capital
would also be promoted by expanding the government budget on education and by
equalizing expenditure across regions and improving mobility. However obtained, a more
educated workforce based on equality of opportunity for all will produce greater payoffs to
people and capital and will produce greater national wealth.
Acknowledgements
This paper was presented in December 2003 at the Great Hall of the People in
Beijing at the Renmin University Conference celebrating the 20th anniversary of their
Industrial Relations Institute, at the Chinese Economics Society, Atlanta, July 2004, and
at Asian Education Forum, Beijing, and Harbin Institute of Technology, August 2004. It
is a substantial revision of Heckman (2003). I thank Hanna Lee for helpful research
assistance. I thank Gregory Chow, Belton Fleisher, D. Gale Johnson, Xuesong Li, Xin
Meng, Thomas Rawski, and Dennis Yang for their helpful comments and useful
supplementary data.
Region Total Government
appropriation
for education
Organization
and citizens
running schools
Donations and
fundraising for
running schools
Tuition and
miscellaneous
fees
Other educational
funds
Beijing 319.2 216.1 67.7% 5.9 1.8% 7.6 2.4% 32.0 10.0% 60.5 19.0%
Tianjin 85.9 53.5 62.3% 2.8 3.3% 0.6 0.7% 11.3 13.2% 16.3 19.0%
Hebei 177.9 121.2 68.1% 0.7 0.4% 3.5 2.0% 34.5 19.4% 12.9 7.2%
Shanxi 97.9 68.9 70.4% 4.7 4.8% 2.9 2.9% 15.4 15.7% 7.9 8.1%
Inner Mongolia 71.9 55.9 77.7% 1.3 1.8% 0.4 0.6% 10.1 14.0% 4.9 6.8%
Liaoning 170.4 113.1 66.4% 2.6 1.5% 0.5 0.3% 29.4 17.3% 22.6 13.3%
Jilin 105.2 74.8 71.2% 7.9 7.5% 2.8 2.7% 16.9 16.0% 9.4 8.9%
Heilongjiang 142.7 100.4 70.3% 10.8 7.6% 0.6 0.4% 20.9 14.7% 18.3 12.8%
Shanghai 232.0 153.4 66.1% 19.3 8.3% 3.9 1.7% 32.8 14.1% 34.0 14.6%
Jiangsu 337.1 198.9 59.0% 1.6 0.5% 18.9 5.6% 52.4 15.5% 56.1 16.6%
Zhejiang 283.0 171.5 60.6% 4.5 1.6% 13.3 4.7% 36.0 12.7% 42.8 15.1%
Anhui 134.2 87.5 65.2% 4.0 3.0% 1.8 1.4% 28.5 21.2% 14.7 11.0%
Fujian 145.1 98.4 67.8% 8.4 5.8% 4.7 3.2% 20.5 14.1% 17.0 11.7%
Jiangxi 98.7 61.4 62.2% 4.1 4.2% 1.2 1.2% 18.7 19.0% 13.4 13.6%
Shandong 288.1 190.9 66.3% 1.7 0.6% 7.7 2.7% 51.5 17.9% 29.7 10.3%
Appendix A. Table 1
Educational funds in 2001 by region (in 100 millions of Yuan)
J.J.Heckm
an/ChinaEconomic
Review
16(2005)50–70
68
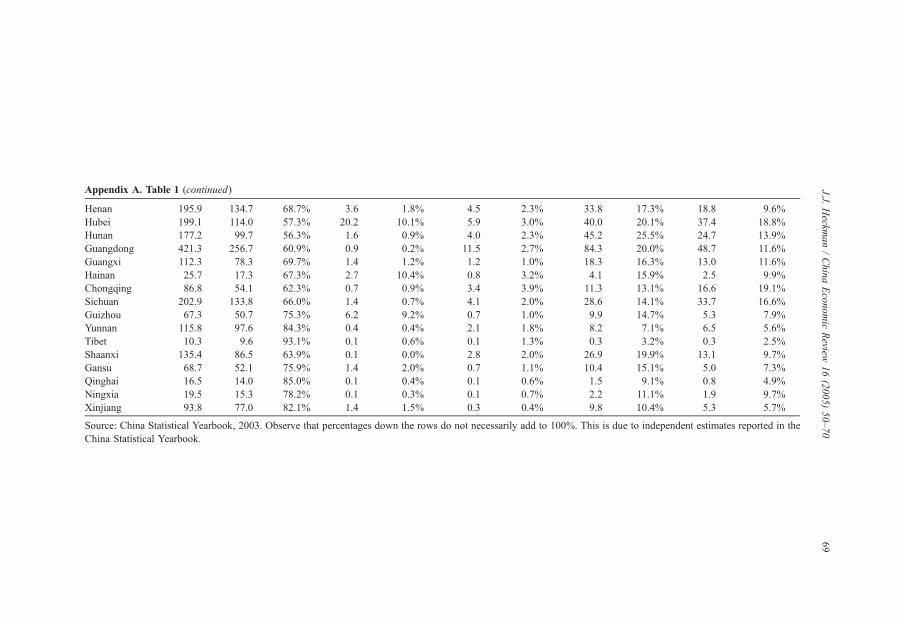
Henan 195.9 134.7 68.7% 3.6 1.8% 4.5 2.3% 33.8 17.3% 18.8 9.6%
Hubei 199.1 114.0 57.3% 20.2 10.1% 5.9 3.0% 40.0 20.1% 37.4 18.8%
Hunan 177.2 99.7 56.3% 1.6 0.9% 4.0 2.3% 45.2 25.5% 24.7 13.9%
Guangdong 421.3 256.7 60.9% 0.9 0.2% 11.5 2.7% 84.3 20.0% 48.7 11.6%
Guangxi 112.3 78.3 69.7% 1.4 1.2% 1.2 1.0% 18.3 16.3% 13.0 11.6%
Hainan 25.7 17.3 67.3% 2.7 10.4% 0.8 3.2% 4.1 15.9% 2.5 9.9%
Chongqing 86.8 54.1 62.3% 0.7 0.9% 3.4 3.9% 11.3 13.1% 16.6 19.1%
Sichuan 202.9 133.8 66.0% 1.4 0.7% 4.1 2.0% 28.6 14.1% 33.7 16.6%
Guizhou 67.3 50.7 75.3% 6.2 9.2% 0.7 1.0% 9.9 14.7% 5.3 7.9%
Yunnan 115.8 97.6 84.3% 0.4 0.4% 2.1 1.8% 8.2 7.1% 6.5 5.6%
Tibet 10.3 9.6 93.1% 0.1 0.6% 0.1 1.3% 0.3 3.2% 0.3 2.5%
Shaanxi 135.4 86.5 63.9% 0.1 0.0% 2.8 2.0% 26.9 19.9% 13.1 9.7%
Gansu 68.7 52.1 75.9% 1.4 2.0% 0.7 1.1% 10.4 15.1% 5.0 7.3%
Qinghai 16.5 14.0 85.0% 0.1 0.4% 0.1 0.6% 1.5 9.1% 0.8 4.9%
Ningxia 19.5 15.3 78.2% 0.1 0.3% 0.1 0.7% 2.2 11.1% 1.9 9.7%
Xinjiang 93.8 77.0 82.1% 1.4 1.5% 0.3 0.4% 9.8 10.4% 5.3 5.7%
Source: China Statistical Yearbook, 2003. Observe that percentages down the rows do not necessarily add to 100%. This is due to independent estimates reported in the
China Statistical Yearbook.
Appendix A. Table 1 (continued) J.J.Heckm
an/ChinaEconomic
Review
16(2005)50–70
69
J.J. Heckman / China Economic Review 16 (2005) 50–7070
References
Becker, Gary (1964). Human capital. New York7 Columbia University Press.
Cai, F., Wang, D., & Du, Y. (2002). Regional disparity and economic growth in China: The impact of labor
market distortions. China Economic Review, 13(2–3), 197–212.
Chow, G. (1993, August). Capital formation and economic growth in China. Quarterly Journal of Economics,
809–842.
Chow, G. C. (2002). China’s economic transformation. Malden, MA: Blackwell Publishers.
Chow, G. C., & Shen, Y. (2004). The Role of Private Funding in China’s Education System, unpublished
manuscript, Princeton University, Department of Economics.
Fleisher, B., & Chen, Jian (1997). The coast–noncoast income gap, productivity and regional economic policy in
China. Journal of Comparative Economics, 25, 220–236.
Fleisher, B. M., & Wang, X. (2004). Skill differentials, return to schooling and market segmentation in a transition
economy: The case of mainland China. Journal of Development Economics, 73(1), 315–328.
Fleisher, B. M., & Yang, D. T. (2004). China’s Labor Market. In N. Hope (Ed.), Market Reforms in China.
Stanford, CA: Stanford University Press.
Heckman, J. (2000). Policies to foster human capital (with discussion). Research in Economics, 54(1), 3–82.
Heckman, J. (2003). China’s investment in human capital. Economic Development and Cultural Change,
795–804.
Heckman, J., & Li, X. (2004). Selection Bias, Comparative Advantage and Heterogeneous Returns to Education:
Evidence from China in 2000. Pacific Economic Review, 9(3), 155–171.
Johnson, D. (2000, November 30). Reducing the urban–rural income disparity in China. Office of Agricultural
Economics Research, University of Chicago.
Johnson, D. (2002). Comment on U.S. structural transformations and regional convergence: A reinterpretation.
Journal of Political Economy, 110(6), 1414–1418.
Knight, J., & Song, L. (1999). The rural–urban divide: Economics disparities and interactions in China. New
York7 Oxford University Press.
Li, Wensheng (undated). Financing of Higher Education in China, Peking University. This can be obtained from
her Web site at http://iee.hedu.pku.edu.cn/jjlw/jjlw0020/jjlw0020.asp
Lin, J., Wang, G., & Zhao, Y. (2003). Regional Inequality and Labor Transfers in China, presented at D.G.
Johnson Memorial, University of Chicago, October 2003.
National Bureau of Statistics (2000a). China Rural Household Survey Yearbook 2000. Beijing7 China Statistics
Press.
National Bureau of Statistics (2000b). China’s Urban Household Income and Expenditure Survey. Beijing7
National Bureau of Statistics, Urban Socio-Economic Survey Organization.
National Bureau of Statistics (2001a). China Labor Statistical Yearbook. Beijing7 China Statistics Press.
National Bureau of Statistics (2001b). Statistical Yearbook on Educational Expenditure of China in 2000.
Beijing7 China Statistics Press.
Nelson, R., & Phelps, E. (1966). Investment in humans, technological diffusion, and economic growth. American
Economic Review, 56(1/2), 69–75.
Schultz, T. W. (1975, September). The value of the ability to deal with disequilibria. Journal of Economic
Literature, 13, 827–846.
Schultz, T. W. (1981). Investing in people. Berkeley7 University of California Press.
UNESCO. (1999). Statistical Yearbook. United Nations, New York.
Yang, D. (1999). Urban-based policies and rising income inequality in China. American Economic Review,
89(22), 306–310.
Yang, D. T. (2004). Education and allocative efficiency: Household income growth during rural reforms in China.
Journal of Development Economics, 74(1), 137–162.
Yang, D. T., & Cai, F. (2003). The political economy of China’s ruralurban divide, in How Far Across the River?
In N. Hope, D. T. Yang, & M. Yang (Eds.), Chinese policy reform at the millennium (pp. 389–416). Stanford7
Stanford University Press.
Xie, J. Y. (1999). Educational Problems of Rural–Urban Migrant Chinese, unpublished paper, April 1999.


![Outline Human capital theory by C. Echevarriahomepage.usask.ca/~ece220/econ221/4-HC [Compatibility Mode].pdf · Human capital theory by C. Echevarria ... Human capital Human capital](https://img.pdfslide.us/doc/110x75/5ae0d5467f8b9a6e5c8df29c/outline-human-capital-theory-by-c-ece220econ2214-hc-compatibility-modepdfhuman.jpg)