Embed Size (px)
Citation preview

Analyzer Operating Manual
2400-0131
Chapter - 1 Introduction
1.1 Introduction The Spectral Dynamics Analyzer allows the user to collect real time data, display real time waveform signals or play back previously recorded data and analyze all formats of data aquired.
This can be done at a sample rate of over 51 kps being input to as many as 16 channels that may be simultaneously sampled. Five different types of data signal output are available or the user may define a specific shaped broadband output. Also, five on-line controls allow the user to initiate actions to enhance or inhibit data flow including automatic input channel voltage range settings.
Channel setup parameters are defined for either a measurement or an inactive channel type with a sensitivity between one one-thousandth and one million units. Three triggering modes are possible on any input channel with external triggering available if required.
The status of any aspect of the test is easily accessed through on-line status monitors including a message log that records all test operations and operator commands.
Automatic acquisition of Modal data can easily be initiated and accumulated in three different storage formats including UFF. Swept sine analysis is accomplished through user-defined sweep range(s), resolution and reference profiles.
Analysis of the data is accomplished with five different FFT windows over nine frequency ranges between 50-20 k and six settings of frequency resolution between 100-32k. Up to a thousand different samples may be averaged with four different methods. The availability of an on-line analysis capability allows the user to view real-time displays of six different functions and to simultaneously overlay time histories of previously stored data.
Data storage is simple with 9.1 or 18 Gbyte removable SCSI disk drives. Retrieval of data is available from all functions including Modal playback or text files from the Message Log.

Analyzer Operating Manual
2400-0131
Chapter 2 - Getting Started
2.1 Introduction The Spectral Dynamics Computer Aided Test Suite (CATS) Vibration Controller program is called Puma. It can be started by either a desktop shortcut icon or through the Start button. The path is <Start> ➯ PROGRAMS ➯ SPECTRAL TEST SUITE ➯ PUMA.
2.1.1 Log In If the Security option (see paragraph 4.2.6) is in place the User Log In Dialog Box (Figure 2-1) appears. If there is no Security option the splash screen shown in Figure 2-2 will display. To access the features of the PUMA Vibration Controller program you must have a valid users name and password. See the system administrator for proper users name and passwords. Enter a User Name and Password and click <LOG IN>. The Puma Version Splash Screen (Splash Screen) shown in Figure 2-2 will appear. The Splash Screen will disappear in several seconds (or can be dismissed by clicking on it) leaving the New Dialog Box (Figure 2-3) from which the desired application can be launched. Click on ANALYZER, and then click OK.
Figure 2-1. User Log In Dialog Box
The Puma-Local part of the background behind the New Dialog is the presentation offered when going from one application like Random to another such as Sine or in this case, Analyzer. After clicking OK a screen similar to the Analyzer Screen shown in Figure 2-4 appears. Exact screen layout is dependent on the parameters previously set with the menu options under Puma.
Figure 2-2. Puma Program Splash Screen

Getting Started Analyzer Operating Manual
2-2 2400-0131
Figure 2-3. New Dialog Box
Figure 2-4. Default PUMA Analyzer Screen
This part of the window belongs to the Spectral Dynamics Viewer.
Desktop
Two Rows of Different Plots Toolbars Test Control Status Panel
Puma Local Window
Analyzer Operating Manual Getting Started
2400-0131 2-3
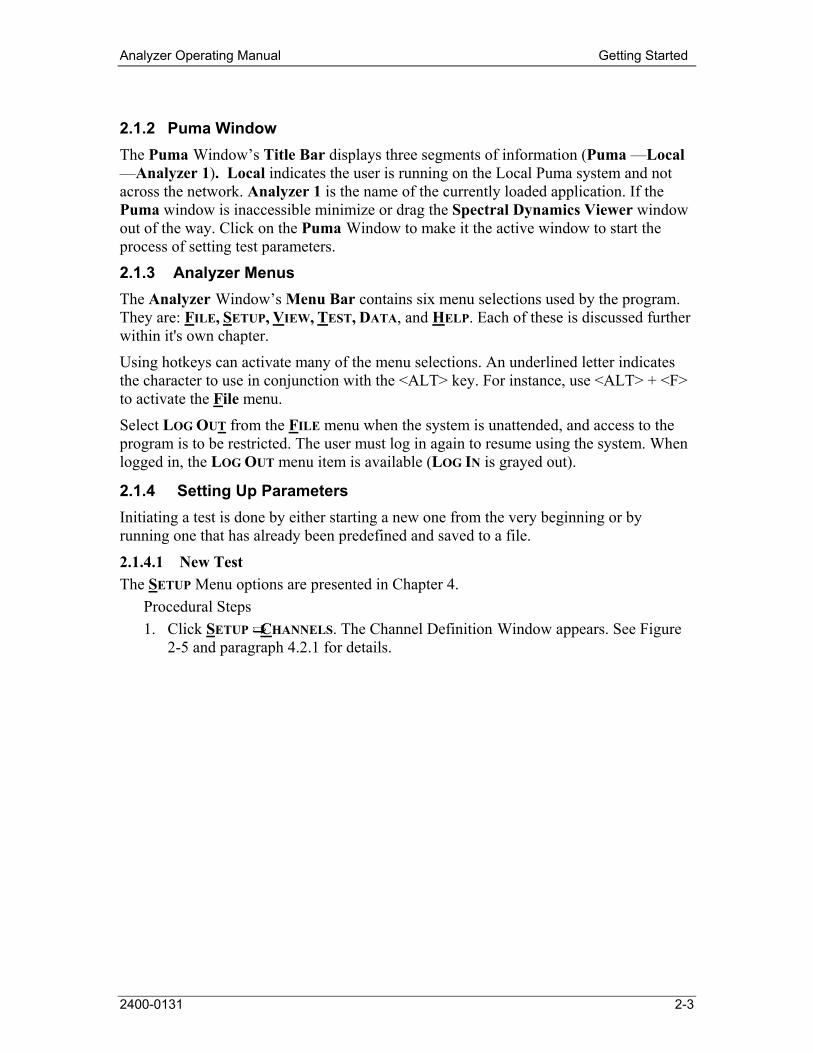
2.1.2 Puma Window The Puma Window’s Title Bar displays three segments of information (Puma —Local —Analyzer 1). Local indicates the user is running on the Local Puma system and not across the network. Analyzer 1 is the name of the currently loaded application. If the Puma window is inaccessible minimize or drag the Spectral Dynamics Viewer window out of the way. Click on the Puma Window to make it the active window to start the process of setting test parameters.
2.1.3 Analyzer Menus The Analyzer Window’s Menu Bar contains six menu selections used by the program. They are: FILE, SETUP, VIEW, TEST, DATA, and HELP. Each of these is discussed further within it's own chapter.
Using hotkeys can activate many of the menu selections. An underlined letter indicates the character to use in conjunction with the <ALT> key. For instance, use <ALT> + <F> to activate the File menu.
Select LOG OUT from the FILE menu when the system is unattended, and access to the program is to be restricted. The user must log in again to resume using the system. When logged in, the LOG OUT menu item is available (LOG IN is grayed out).
2.1.4 Setting Up Parameters Initiating a test is done by either starting a new one from the very beginning or by running one that has already been predefined and saved to a file.
2.1.4.1 New Test The SETUP Menu options are presented in Chapter 4.
Procedural Steps 1. Click SETUP ➯ CHANNELS. The Channel Definition Window appears. See Figure
2-5 and paragraph 4.2.1 for details.
Getting Started Analyzer Operating Manual
2-4 2400-0131
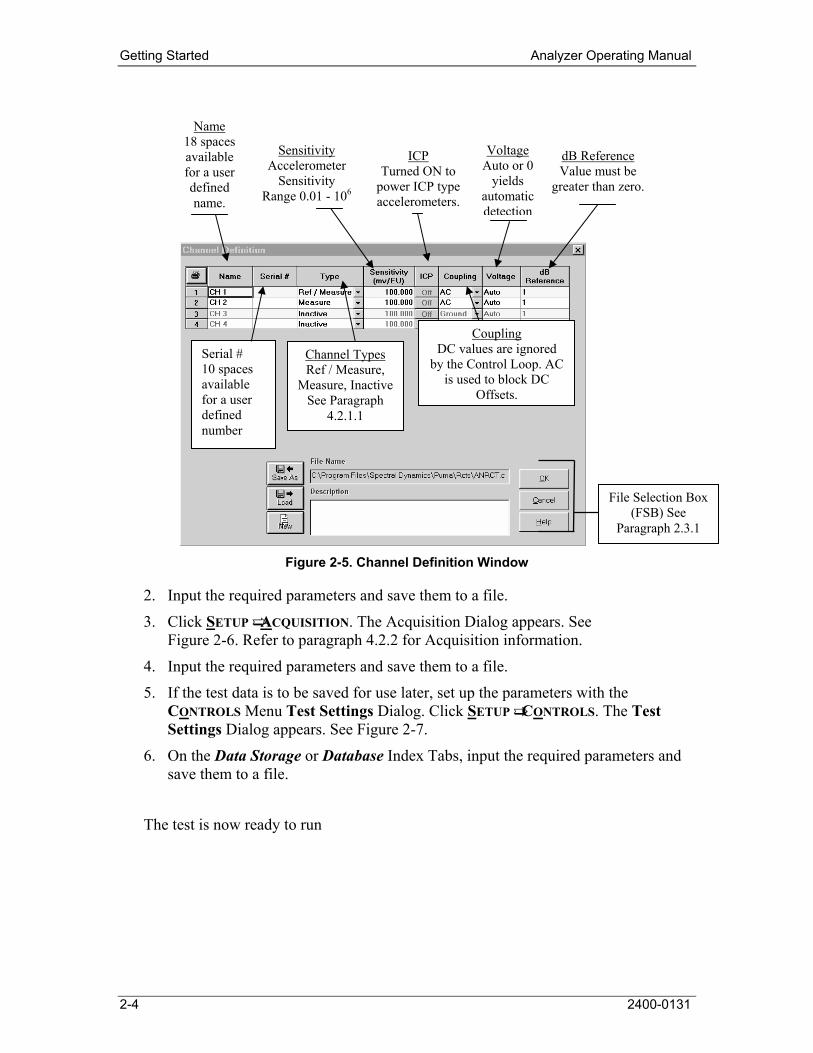
Figure 2-5. Channel Definition Window
2. Input the required parameters and save them to a file.
3. Click SETUP ➯ ACQUISITION. The Acquisition Dialog appears. See Figure 2-6. Refer to paragraph 4.2.2 for Acquisition information.
4. Input the required parameters and save them to a file.
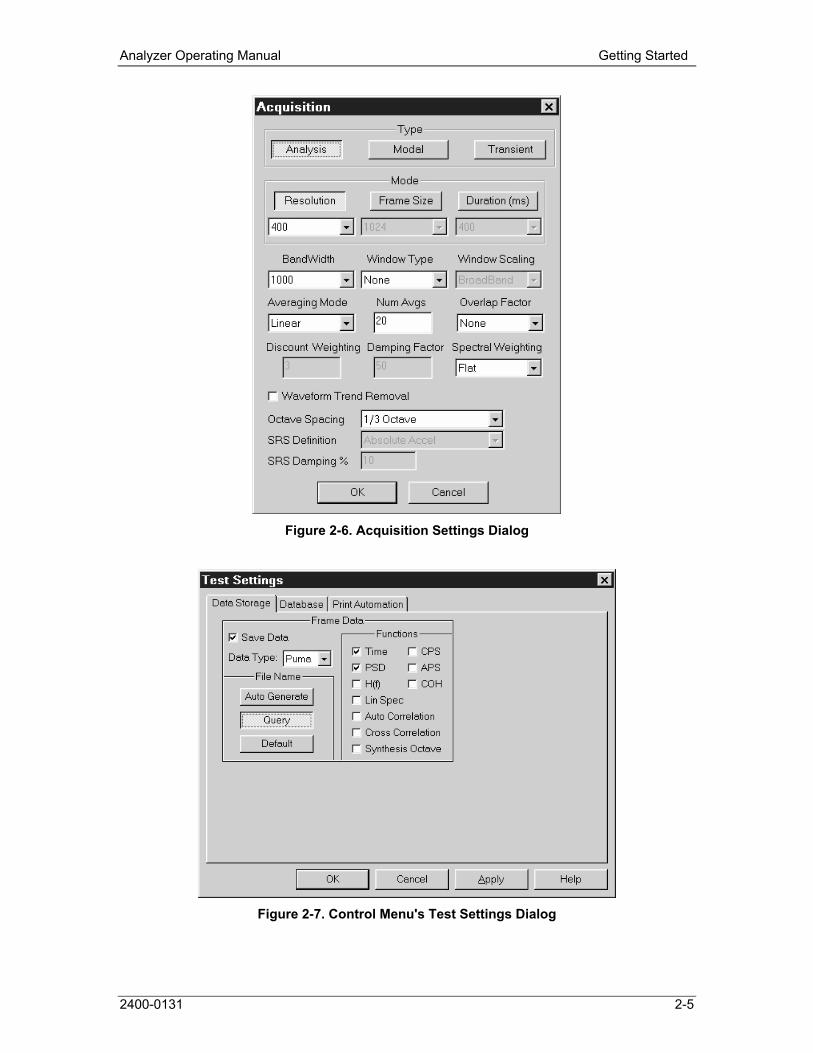
5. If the test data is to be saved for use later, set up the parameters with the CONTROLS Menu Test Settings Dialog. Click SETUP ➯ CONTROLS. The Test Settings Dialog appears. See Figure 2-7.
6. On the Data Storage or Database Index Tabs, input the required parameters and save them to a file.
The test is now ready to run
File Selection Box (FSB) See
Paragraph 2.3.1
Channel Types Ref / Measure,
Measure, Inactive See Paragraph
4.2.1.1
Sensitivity Accelerometer
Sensitivity Range 0.01 - 106
Coupling DC values are ignored
by the Control Loop. AC is used to block DC
Offsets.
ICP Turned ON to
power ICP type accelerometers.
dB Reference Value must be
greater than zero.
Name 18 spaces available for a user defined name.
Voltage Auto or 0
yields automatic detection
Serial # 10 spaces available for a user defined number
Analyzer Operating Manual Getting Started
2400-0131 2-5
Figure 2-6. Acquisition Settings Dialog
Figure 2-7. Control Menu's Test Settings Dialog

Getting Started Analyzer Operating Manual
2-6 2400-0131
2.1.4.2 Existing Test Procedural Steps for launching an Analyzer Test, though user may launch any application required.
1. Click FILE ➯ NEW. The New Dialog Box appears. See Figure 2-8.
2. Click ANALYZER ➯ <OK>. The screen defaults to the open log screen. See Figure 2-4.
3. Click FILE ➯ OPEN. See Figure 2-9.
4. Select appropriate Files of Type filter from the drop down list box.
5. Select drive from the Look In drop down list box.
6. Select and open appropriate directory in the list box.
7. Select and open test file.
8. Click <OPEN> on the standard Windows File Open Dialog Box.
9. The Screen opens with the parameters that were set with the test initially. See Figure 2-10 as an example.
The test is ready to run.
Figure 2-8. NEW Dialog Box
Figure 2-9. Results of File ⇒ Open
Analyzer Operating Manual Getting Started
2400-0131 2-7
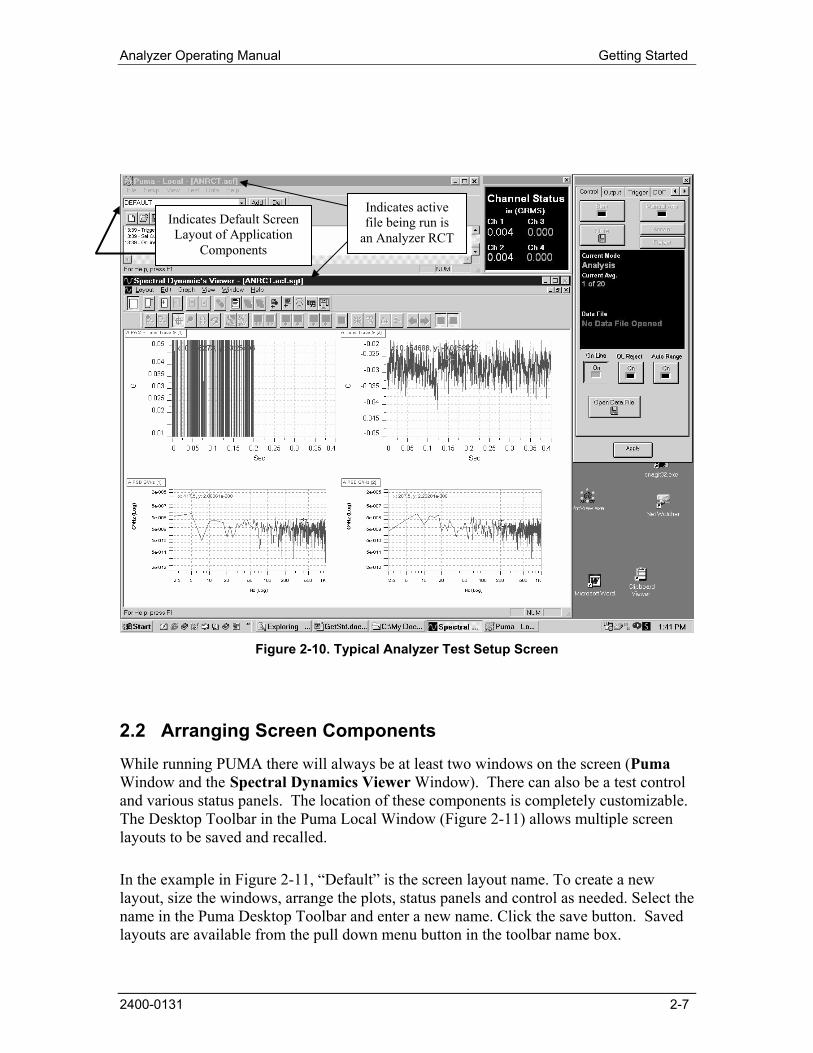
Figure 2-10. Typical Analyzer Test Setup Screen
2.2 Arranging Screen Components While running PUMA there will always be at least two windows on the screen (Puma Window and the Spectral Dynamics Viewer Window). There can also be a test control and various status panels. The location of these components is completely customizable. The Desktop Toolbar in the Puma Local Window (Figure 2-11) allows multiple screen layouts to be saved and recalled.
In the example in Figure 2-11, “Default” is the screen layout name. To create a new layout, size the windows, arrange the plots, status panels and control as needed. Select the name in the Puma Desktop Toolbar and enter a new name. Click the save button. Saved layouts are available from the pull down menu button in the toolbar name box.
Indicates Default Screen Layout of Application
Components
Indicates active file being run is
an Analyzer RCT

Getting Started Analyzer Operating Manual
2-8 2400-0131
Figure 2-11. Puma Local Window
Clicking the Exit Button launches the APPLICATION CONTROL MENU. See Figure 2-12. This is a common Windows menu that can also be launched by right clicking the Title Bar. One set of options is available in the maximized window presentation. Another set of options is available from a restored size window.
Figure 2-12. Application Control Menus
2.3 Common Areas of Host Dialogs
The layout of dialog boxes sometimes differs from one menu option to another. Even though the command buttons may be in a different position they will work the same from one menu option or window to another.
Puma Desktop Toolbar
Application Toolbar
Exit Button
Delete Button
Save Button

Analyzer Operating Manual Getting Started
2400-0131 2-9
2.3.1 File Selection Box Throughout PUMA there is a need to save the parameters of tests, load those same parameters for another test or just start on something brand new. The File Selection Box (FSB) (Figure 2-13) is seen in Figure 2-5. It is a common Windows tool and is used throughout the PUMA platform though sometimes the format is somewhat different. The components of the FSB are outlined below for the primary setup areas of Channel Definition, Profile Settings and Schedule Setup.
Figure 2-13. File Selection Box
2.3.1.1 New Selection Command Button
Channel Definition The path / name of the currently open file is deleted from the File Name text box. It does not delete the numbers from any of the columns. It is not active during a test.
Profile Settings Clears all columns of data. It is not active during a test.
Schedule Setup Clears all columns of data. The path / name of the currently open file is deleted from the File Name text box. It is not active during a test.
2.3.1.2 Load File Command Button This button reacts the same way in all three parameter input areas. The Open Dialog Box is displayed for the user to choose a file to be loaded. All three areas are active during a test.
2.3.1.3 Save As Command Button
This button also reacts the same way in all three parameter input areas. The Save As Dialog Box is displayed for the user to save a file. All three areas are not active during a test.
2.3.1.4 OK Command Button
This button accepts any changes made, applies them and closes the Open Dialog Box.

Getting Started Analyzer Operating Manual
2-10 2400-0131
2.3.1.5 Cancel Command Button
This button closes the Open Dialog Box without applying any changes that may have been made.
2.3.1.6 Apply Command Button
This button applies any changes that have been made and keeps the dialog box open.
2.3.1.7 Help Command Button
This button launches the on-line help. If a dialog box is open it must first be closed to launch the help menus.

Analyzer Operating Manual File Menu
Chapter 3 - File Menu
3.1 Introduction The first of the six menu options in the PUMA Analyzer Application is the FILE Menu. Refer to following chapters for other menu options.
3.2 The File Menu When the Analyzer is first launched the FILE Menu options available are different from those available after test parameters are input. Figure 3-1 displays those options. The menu options available after a test is started are shown in Figure 3-2. The FILE menu option has 16 sub-menus and a seven-file list (called a recent-file list) contained in a seven-section drop-down menu list. The recent-file list allows rapid access to files that have recently been used.
3.2.1 File Sub-Menus The sub-menus of the PUMA Analyzer File Menu option are outlined below.
3.2.1.1 New Menu Option When NEW is selected, the New Option List Box will display. See Figure 3-3. This will
initialize the test parameter settings for the test application chosen. Only test applications
that are licensed for the system will appear in the box. Available test applications could
be:
Analyzer Sine Multi-Ref
Modal Acquisition
Random On Random
Waveform Replication
Sine On Random
Random Classical shock Rotating
Machinery Shock Synthesis
Analyzer Operating Manual
2400-0131
Chapter 4 - Setup Menu
4.1 Introduction The SETUP Menu is where all of the test parameters are entered for the Analyzer application test setup. In most of the test setup submenus the individual test settings may be saved in a separate file that may be recalled by another test setup to speed creation of subsequent tests.
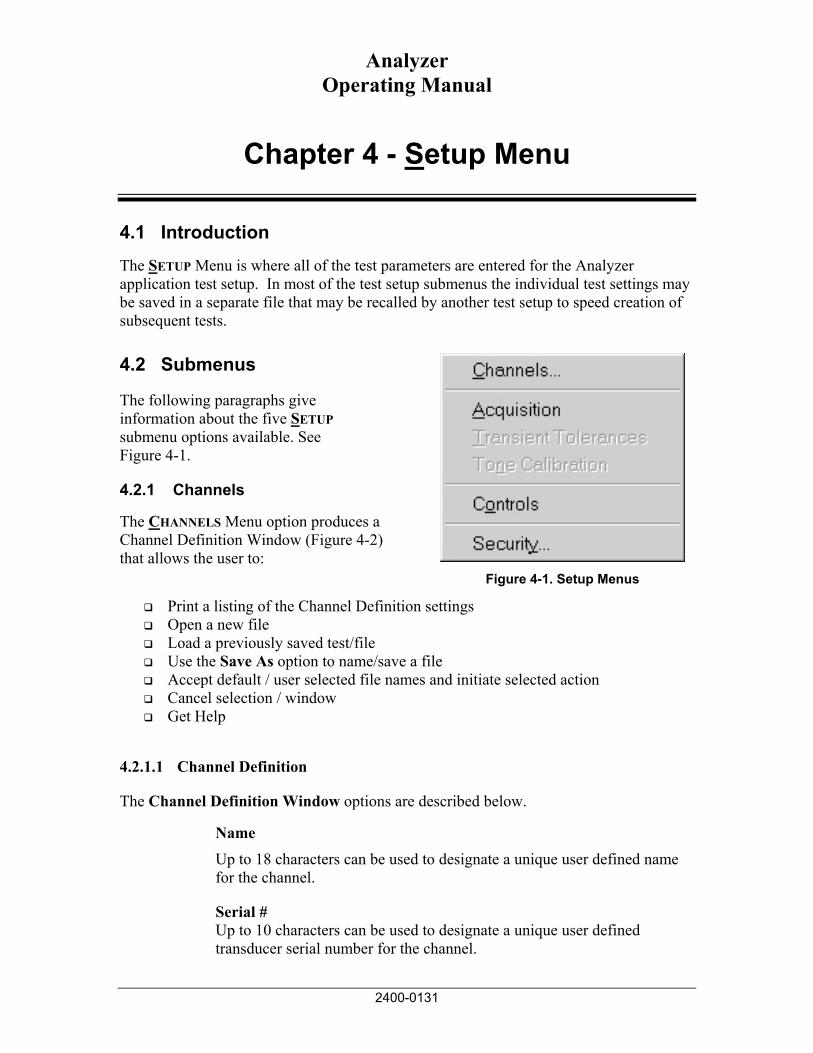
4.2 Submenus
The following paragraphs give information about the five SETUP submenu options available. See Figure 4-1.
4.2.1 Channels
The CHANNELS Menu option produces a Channel Definition Window (Figure 4-2) that allows the user to:
Figure 4-1. Setup Menus
Print a listing of the Channel Definition settings Open a new file Load a previously saved test/file Use the Save As option to name/save a file Accept default / user selected file names and initiate selected action Cancel selection / window Get Help
4.2.1.1 Channel Definition
The Channel Definition Window options are described below.
Name
Up to 18 characters can be used to designate a unique user defined name for the channel.
Serial # Up to 10 characters can be used to designate a unique user defined transducer serial number for the channel.
Setup Menu Analyzer Operating Manual
4-2 2400-0131
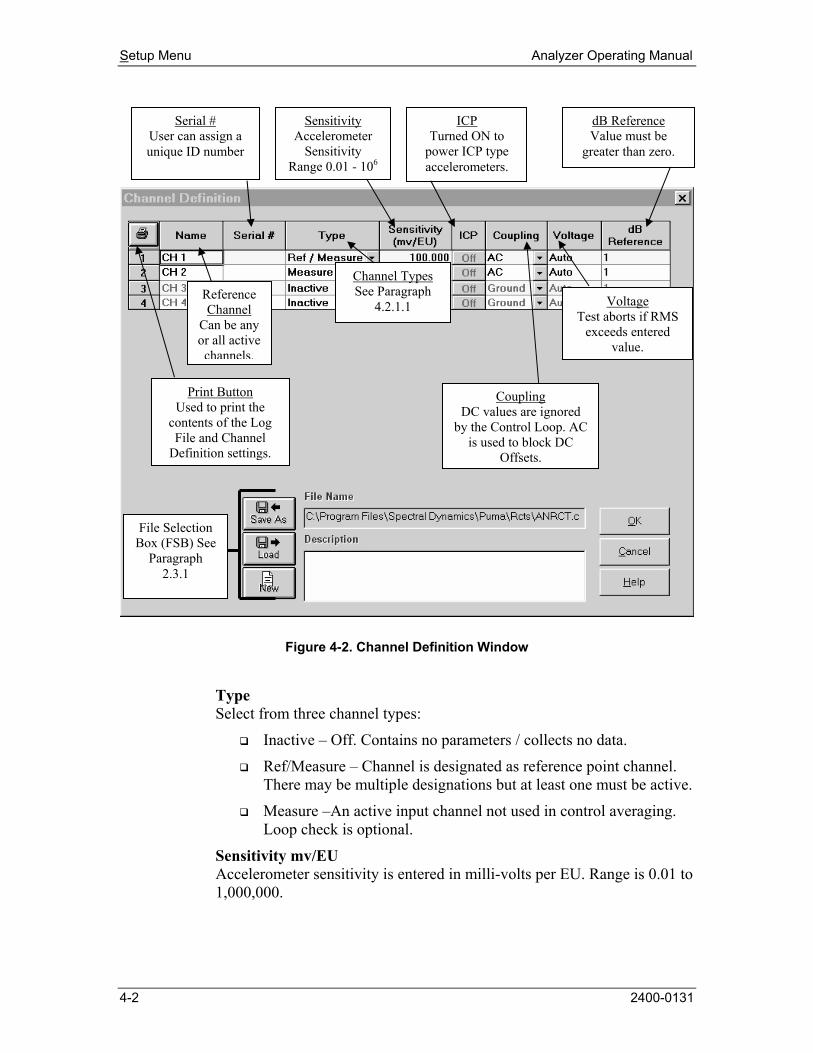
Figure 4-2. Channel Definition Window
Type Select from three channel types:
Inactive – Off. Contains no parameters / collects no data.
Ref/Measure – Channel is designated as reference point channel. There may be multiple designations but at least one must be active.
Measure –An active input channel not used in control averaging. Loop check is optional.
Sensitivity mv/EU Accelerometer sensitivity is entered in milli-volts per EU. Range is 0.01 to 1,000,000.
File Selection Box (FSB) See
Paragraph 2.3.1
Channel Types See Paragraph
4.2.1.1
Print Button Used to print the
contents of the Log File and Channel
Definition settings.
Sensitivity Accelerometer
Sensitivity Range 0.01 - 106
Voltage Test aborts if RMS
exceeds entered value.
Serial # User can assign a unique ID number
ICP Turned ON to
power ICP type accelerometers.
Coupling DC values are ignored
by the Control Loop. AC is used to block DC
Offsets.
dB Reference Value must be
greater than zero.
Reference Channel
Can be any or all active channels.

Analyzer Operating Manual Setup Menu
2400-0131 4-3
ICP The ICP function can either be On or Off (default). It provides a constant DC current source to power ICP type accelerometers. AC Coupling must be on to use this function.
Coupling Input channel coupling:
AC Coupling – A high pass filter with a 3dB cutoff point at 0.2Hz is used to block the DC component of the signal.
DC Coupling – It is used to pass the DC component of the signal. DC values are ignorded by the control loop.
Ground Coupling – It grounds the input channel. This is used when the channel is inactive.
Voltage The user may select Auto or a number between 0 - 10. Auto or zero indicates automatic detection. dB Reference This is the level used in displaying data from this channel on a dB scale, dB = 20 log (level/levelref). The field must be greater than zero and should be in a valid floating-point format.
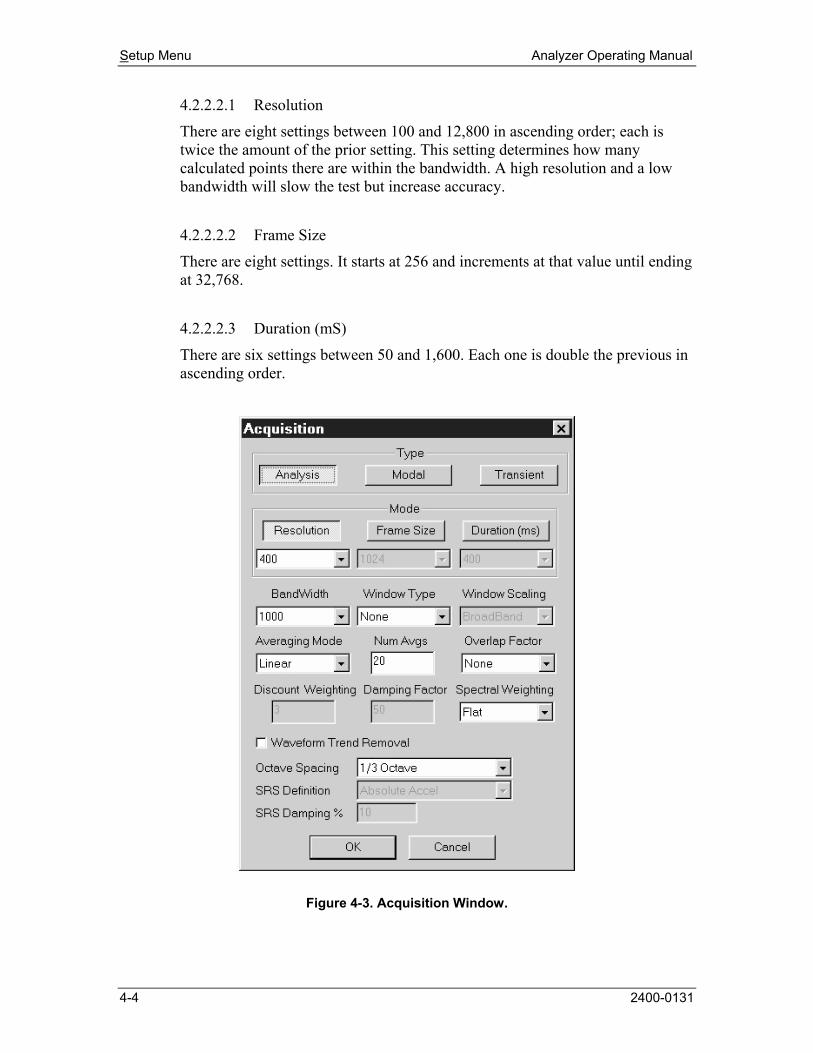
4.2.2 Acquisition
The ACQUISITION menu option displays the Acquisition Dialog. See Figure 4-3. This window allows the user to select a different Type and Mode of data acquisition. Three of each is available.
4.2.2.1 Acquisition Types
Analysis Modal Transient
4.2.2.2 Acquisition Modes
The mode governs the duration, size of the data frames and the resolution. One setting determines the limits of the other two.
Setup Menu Analyzer Operating Manual
4-4 2400-0131
4.2.2.2.1 Resolution
There are eight settings between 100 and 12,800 in ascending order; each is twice the amount of the prior setting. This setting determines how many calculated points there are within the bandwidth. A high resolution and a low bandwidth will slow the test but increase accuracy.
4.2.2.2.2 Frame Size
There are eight settings. It starts at 256 and increments at that value until ending at 32,768.
4.2.2.2.3 Duration (mS)
There are six settings between 50 and 1,600. Each one is double the previous in ascending order.
Figure 4-3. Acquisition Window.

Analyzer Operating Manual Setup Menu
2400-0131 4-5
4.2.2.3 Other Parameters
4.2.2.3.1 Bandwidth The nine settings are; 50 | 100 | 200 | 500 | 1,000 | 2,000 | 5,000 | 10,000 | 20, 000.
4.2.2.3.2 Window Type The types available are:
NONE (default) - Used when all the data in a time a time record is used equally or uniformly.
HANN & BLACKMAN - Generally used for random or non-periodic signals.
CALIBRATION - Used for pure sinusoid input. It is corrected such that a sine wave input at any frequency produces the same spectral amplitude that it would have if no window were applied and the sine frequency fell exactly on one of the computed discrete spectral lines.
FORCE/IMPACT - Applied to the output of a transducer to avoid collecting extraneous signals caused by a device other than a hammer.
CORRELATION - This window must be used for AUTO or CROSS CORRELATION
These are for use in Analysis and Modal Type settings only.
4.2.2.3.3 Window Scaling The choices are BROADBAND or NARROWBAND.
4.2.2.3.4 Averaging Mode Averaging is a technique used to decrease system noise.
The choices are:
LINEAR - All data collected is treated equally in terms of the effect it has on the averaged result.
EXPONENTIAL - This requires a weighting factor, which either increases or decreases the effect of each new data block on the resulting average.
MAX. - The resultant block is a collection of points that represent the peak amplitude for each point. With each new block of data, the current data is compared with the new data on a point-by-point basis. The highest amplitude for each point in the block is retained.
4.2.2.3.5 Num Avgs. This is the number of averages the test will perform. This is the number of repetitive data samples collected.

Setup Menu Analyzer Operating Manual
4-6 2400-0131
4.2.2.3.6 Overlap Factor Choices are: None, 25%, 50%, 75% and Max.
4.2.2.3.7 Discount Weighting
There are 1w
averages used for the initial H(f) calculation. The 1w
weighting
factor is also used as an exponential discount factor for averaging the H(f) from loop to loop. The allowable range is 0.05 to 1.0.
4.2.2.3.8 Damping Factor Available only in Force/Impact Type. This is a percentage of the full-scale voltage available.
4.2.2.3.9 Spectral Weighting The choices are: Flat, A, B or C.
4.2.2.3.10 Waveform Trend Removal This checkbox allows the user to enable (checked) or disable (clear) the DC offset removal from the Acceleration Waveforms before they are integrated to Velocity and Displacement. It should normally be enabled for all cases except Classical Shock Reference where the imported waveform may not have final zero velocity / displacement.
4.2.2.3.11 Octave Spacing This label is for Analysis Type only. When using Transient Type the label reads SRS Spacing. The choices are:
11
13
16
112
124
4.2.2.3.12 SRS Definition Available only with Transient Type. The choices are: ABSOLUTE ACCEL (acceleration) or RELATIVE DISPLACEMENT the latter being based on a base of the single degree of freedom (SDOF) system.
4.2.2.3.13 SRS Damping % Available only with Transient Type. The value must be between 0.1% and 99.0%.
4.2.3 Transient Tolerances
The TRANSIENT TOLERANCES Menu Option is available for use with the Analyzer application of PUMA. Two primary reasons for performing a transient capture is for analysis of a transient data pulse or for the import of a captured pulse into the Analyzer program as a reference pulse.
The acquired data from the trigger and active channels, resulting from each capture event is called a data set. Data may be captured from a transient event or a continuous data stream. Captures from the data stream are only segments of the full stream.
Analyzer Operating Manual Setup Menu
2400-0131 4-7
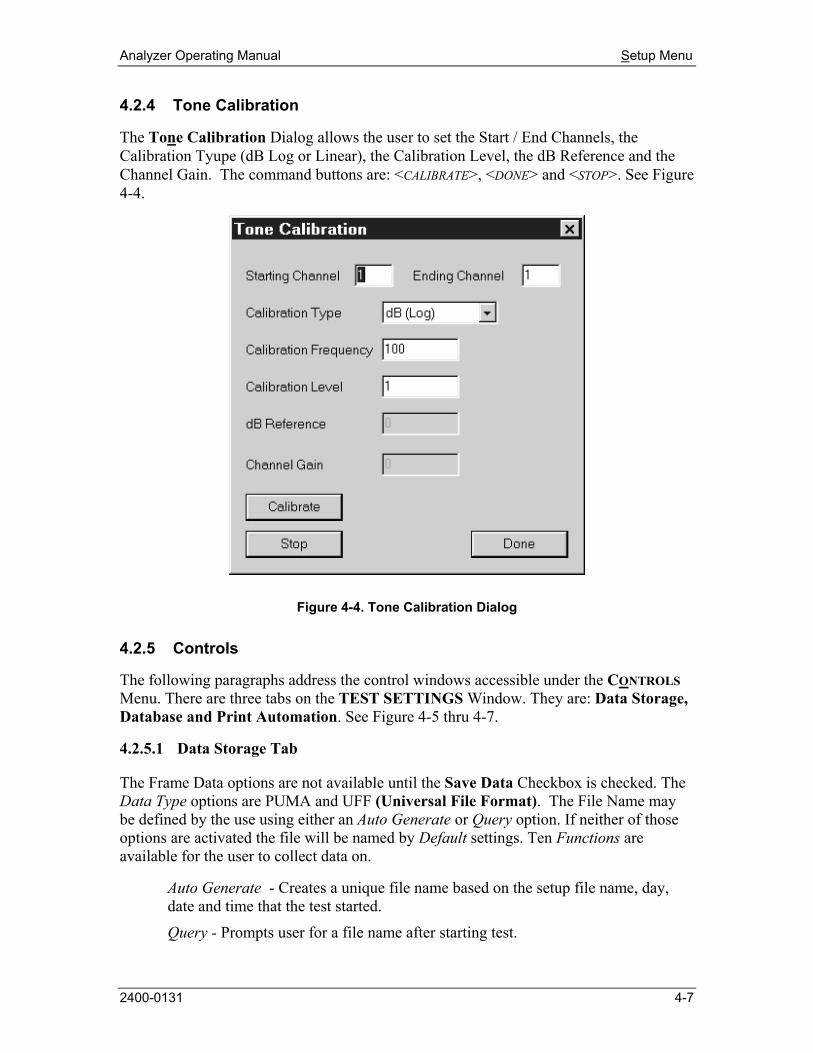
4.2.4 Tone Calibration
The Tone Calibration Dialog allows the user to set the Start / End Channels, the Calibration Tyupe (dB Log or Linear), the Calibration Level, the dB Reference and the Channel Gain. The command buttons are: <CALIBRATE>, <DONE> and <STOP>. See Figure 4-4.
Figure 4-4. Tone Calibration Dialog
4.2.5 Controls
The following paragraphs address the control windows accessible under the CONTROLS Menu. There are three tabs on the TEST SETTINGS Window. They are: Data Storage, Database and Print Automation. See Figure 4-5 thru 4-7.
4.2.5.1 Data Storage Tab
The Frame Data options are not available until the Save Data Checkbox is checked. The Data Type options are PUMA and UFF (Universal File Format). The File Name may be defined by the use using either an Auto Generate or Query option. If neither of those options are activated the file will be named by Default settings. Ten Functions are available for the user to collect data on.
Auto Generate - Creates a unique file name based on the setup file name, day, date and time that the test started.
Query - Prompts user for a file name after starting test.

Setup Menu Analyzer Operating Manual
4-8 2400-0131
Default – All test data is saved in a default file named RandomTestData.sdd. The default file is overwritten each time the test starts.
Figure 4-5. Data Storage Tab of Test Settings Window
4.2.5.2 Database Tab
Storage is enabled on the Database Tab (Figure 4-6). The database is generated according to the parameters input on the DBConfig Dialog, (Figure 4-7) which is launched by clicking on the <SETUP DATABASE> Button. Once the database has been established, test runs may be added to it. With the ENABLE STORAGE Check Box checked, saved data frames will automatically be entered into the selected field(s) of the database as specified by the settings on the Data Storage Tab. The Auto Generate option is recommended for use with the database. See Figure 4-8.

Analyzer Operating Manual Setup Menu
2400-0131 4-9
Figure 4-6. Database Tab of Test Settings Window
Figure 4-7. DBConfig Dialog.
Figure 4-8. Enable Storage Checkbox Notice

Analyzer Operating Manual Setup Menu
4-10 2400-0131
4.2.5.3 Print Automation Tab.
The Print Automation Tab (Figure 4-9) is an optional feature that allows the user to define a series of print layouts to be automatically printed at the end of each test. Depending on graphics options, each layout can be up to 8 pages.
Command Buttons
The Add and Remove buttons are used to build the table of print layouts from existing print layouts. The Add button is used to browse for a template file (.sgt).
The Save and Load buttons are used to load a previously generated database that may be wholly or partially integrated into the current database and saved as a new file.
Check Boxes ENABLE PRINTING
The check box will enable /disable automatic printing at the completion of the test run.
AUTO SCALE
This scales the X and Y data to fit the graphs. Its use is recommended.
Radio Buttons
ALL FRAMES prints each frame of data saved during the test (see Data Storage above).
LAST FRAME prints only the final data frame of the test.
Figure 4-9. Print Automation Tab of Test Settings Window
Analyzer Operating Manual Setup Menu
2400-0131 4-11
Command Buttons
<OK>
<CANCEL>
<HELP>
This button accepts the changes made and closes the dialog box.
This button cancels any changes made and closes the dialog box.
This button opens the on-line help option and enables the user to find answers to questions about the system / settings
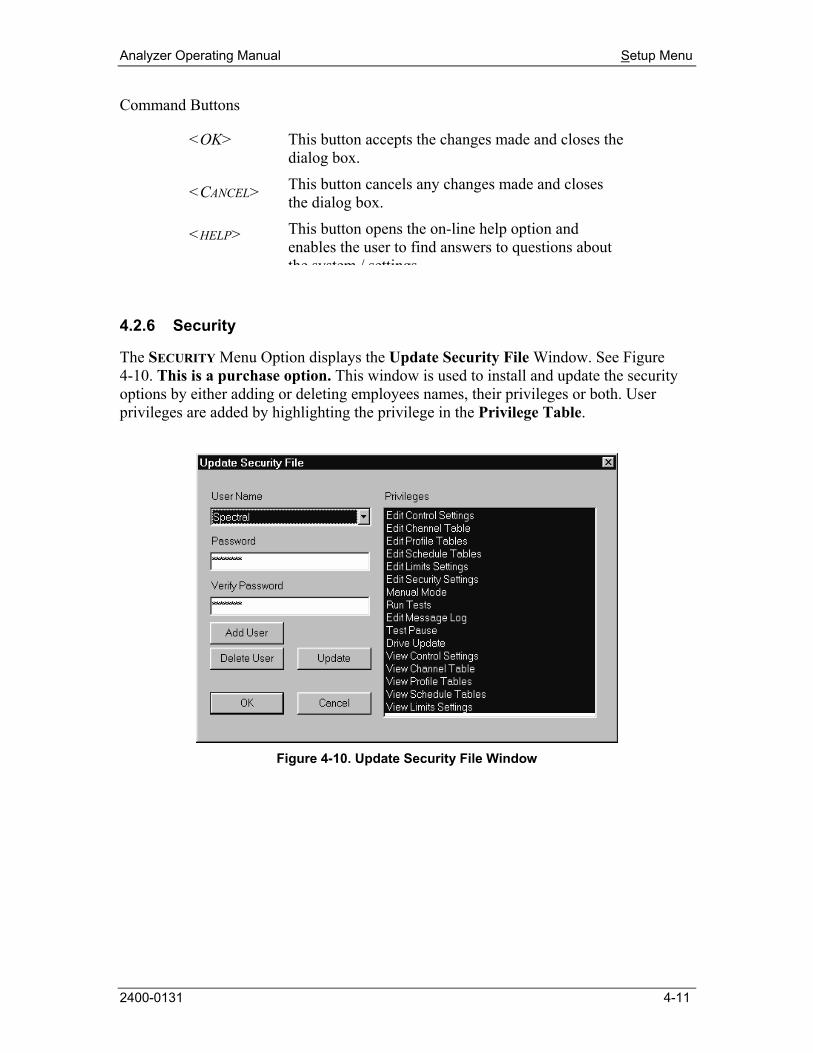
4.2.6 Security
The SECURITY Menu Option displays the Update Security File Window. See Figure 4-10. This is a purchase option. This window is used to install and update the security options by either adding or deleting employees names, their privileges or both. User privileges are added by highlighting the privilege in the Privilege Table.
Figure 4-10. Update Security File Window

File Menu Analyzer Operating Manual
Figure 3-1. File Menu Options at Start UP

Analyzer Operating Manual File Menu
Figure 3-2. File Menu Options During Test
Figure 3-3. New Option List Box
Clicking on the NEW menu option and selecting another test while working on a test will initiate the display of a SAVE prompt unless there were no changes made to the currently selected test.
3.2.1.2 Open Menu Option The OPEN menu option allows the user to select a previously stored test file. It displays a standard Windows Open (file) Dialog Box. The user can navigate to the desired file and open it. If the user wants to load a test type different from that currently being worked on, simply select the application and Puma will automatically launch it.

File Menu Analyzer Operating Manual
3.2.1.3 Close Menu Option
The CLOSE menu option closes the currently loaded test setup. When CLOSE is clicked a SAVE prompt is displayed if the current test setup has had changes made to it. If no changes were made the currently displayed window will close.
3.2.1.4 SAVE Menu Option
When SAVE is clicked the standard Windows Save As Dialog Box appears. It allows the user to save the currently loaded test setup.
3.2.1.5 SAVE AS Menu Option
When SAVE is clicked the standard Windows Save As Dialog Box appears. It allows the user to save the currently loaded test setup.
3.2.1.6 Save As Defaults
This option is no longer available in PUMA. 3.2.1.7 Print Setup
PRINT SETUP is a standard Windows command that allows the user to select a printer, the size and source of paper and the orientation of the page. These selections will affect how things are printed when the Print option is used.
3.2.1.8 Print Preview
This option is no longer available in PUMA. 3.2.1.8 Print Click on PRINT to launch the standard Windows Print Dialog Box. From here the user may select a printer, what is to be printed and how many copies are required. The option to print to a file is also available.
3.2.1.9 Send
SEND is a standard Windows command for sending files / tests via e-mail.
3.2.1.10 Log In
The LOG IN option is not available when the user is already using PUMA. It becomes available after logging out.
3.2.1.11 Log Out
The LOG OUT option is only available when the user is logged in to PUMA.
3.2.1.12 System Lock / System Unlock
These two features come with the security options. When SYSTEM LOCK is selected, the system is locked and that option becomes disabled. The SYSTEM UNLOCK option is then enabled. To regain access to the program, the user must select SYSTEM UNLOCK. The User Log In Dialog Box will display and allow you to login.

Analyzer Operating Manual File Menu
3.2.1.13 Recent File List The recent file list is a standard Windows feature that has been adopted for Puma. It allows the user quick access to the most recently used setup files that have been opened. These files are also available from the Windows Start menu. The path for usage is:
<Start> ➯ DOCUMENTS ➯ File Name
3.2.1.14 Defaults
The DEFAULTS option is no longer available in PUMA. 3.2.1.15 Exit EXIT is a standard Windows command. Clicking on this command will cause the current window to close and the application will terminate.
3.2.2 Menus Not Available During The Test
While a test is running, not all of the FILE Menu options are available for use. The unavailable FILE Menu options during a test are: SAVE AS DEFAULTS
PRINT PREVIEW
SEND LOG IN SYSTEM UNLOCK
DEFAULTS
Analyzer Operating Manual
2400-0131
Chapter 5 - View Menu
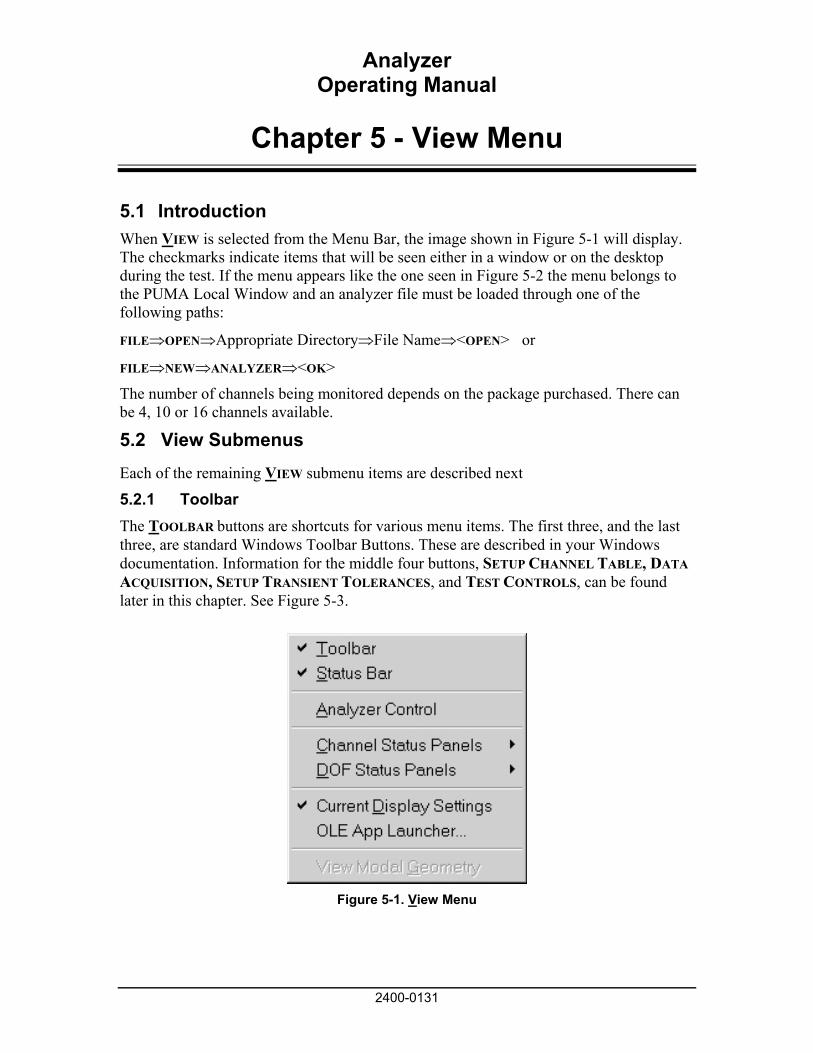
5.1 Introduction When VIEW is selected from the Menu Bar, the image shown in Figure 5-1 will display. The checkmarks indicate items that will be seen either in a window or on the desktop during the test. If the menu appears like the one seen in Figure 5-2 the menu belongs to the PUMA Local Window and an analyzer file must be loaded through one of the following paths:
FILE⇒OPEN⇒Appropriate Directory⇒File Name⇒<OPEN> or
FILE⇒NEW⇒ANALYZER⇒<OK>
The number of channels being monitored depends on the package purchased. There can be 4, 10 or 16 channels available.
5.2 View Submenus Each of the remaining VIEW submenu items are described next
5.2.1 Toolbar The TOOLBAR buttons are shortcuts for various menu items. The first three, and the last three, are standard Windows Toolbar Buttons. These are described in your Windows documentation. Information for the middle four buttons, SETUP CHANNEL TABLE, DATA ACQUISITION, SETUP TRANSIENT TOLERANCES, and TEST CONTROLS, can be found later in this chapter. See Figure 5-3.
Figure 5-1. View Menu
View Menu Analyzer Operating Manual
5-2 2400-0131
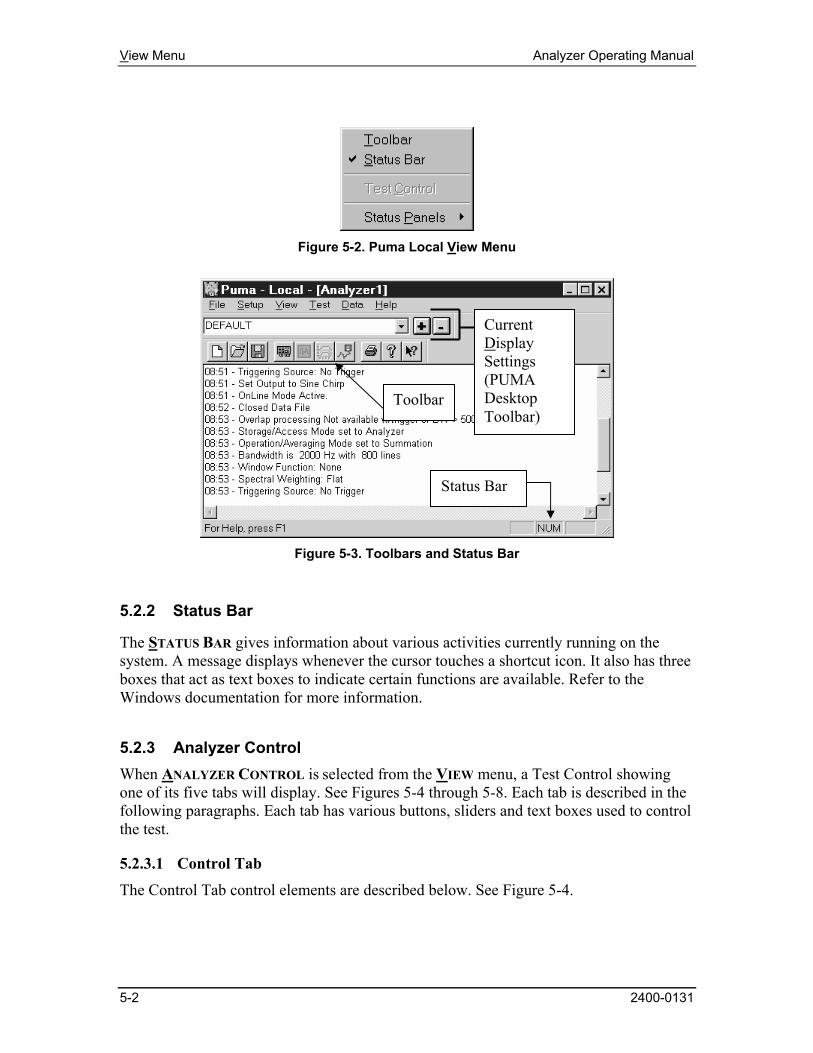
Figure 5-2. Puma Local View Menu
Figure 5-3. Toolbars and Status Bar
5.2.2 Status Bar
The STATUS BAR gives information about various activities currently running on the system. A message displays whenever the cursor touches a shortcut icon. It also has three boxes that act as text boxes to indicate certain functions are available. Refer to the Windows documentation for more information.
5.2.3 Analyzer Control When ANALYZER CONTROL is selected from the VIEW menu, a Test Control showing one of its five tabs will display. See Figures 5-4 through 5-8. Each tab is described in the following paragraphs. Each tab has various buttons, sliders and text boxes used to control the test.
5.2.3.1 Control Tab
The Control Tab control elements are described below. See Figure 5-4.
Toolbar
Status Bar
Current Display Settings (PUMA Desktop Toolbar)
Analyzer Operating Manual View Menu
2400-0131 5-3
Start/Stop Button Select the < Start/Stop> button to begin the currently loaded test as it was defined in the SETUP Menu options.
Manual Arm Button This button is enabled with the settings selected on the Trigger Tab. Click the <Manual Arm> button to activate the trigger event.
Store Click the <Store> button to manually save the current frame of data to a file.
Accept / Reject Buttons If the Arming Mode is set to Manual on the Trigger Tab, these buttons will be enabled. One of these buttons must be selected if a trigger event has occurred.
Log Window The Log Window displays information about the currently running test. The information displayed is listed under headings relating to test parameters applied either from one of the Test Control Tabs or from SETUP Menu Submenus.
Current Mode - This setting is done at SETUP ⇒ ACQUISITION ⇒ Type Current Average - This setting is done at SETUP ⇒ ACQUISITION ⇒ NumAvgs Data File - Lists the name of the current test file selected with the Open/Close
Data File Button below the window. DOF Table File - Lists the mode of the current test file's DOF Table DOF Set - Lists the name of the current test file's DOF Set
There is an <Up> and <Down> button available for the user during Modal Type Data Acquisition as defined in the SETUP⇒ACQUISITION Menu.
On Line Button Select the <On Line> button to activate the online averaging capabilities. A green light indicates the button is active.
OL Reject Select the <OL Reject> button to enable the automatic rejection in the event of an overload on an input channel. A green light indicates the button is active.
Auto Range Button
Select the <Auto Range> button to turn on the auto ranging capabilities. A green light indicates the button is active.
View Menu Analyzer Operating Manual
5-4 2400-0131
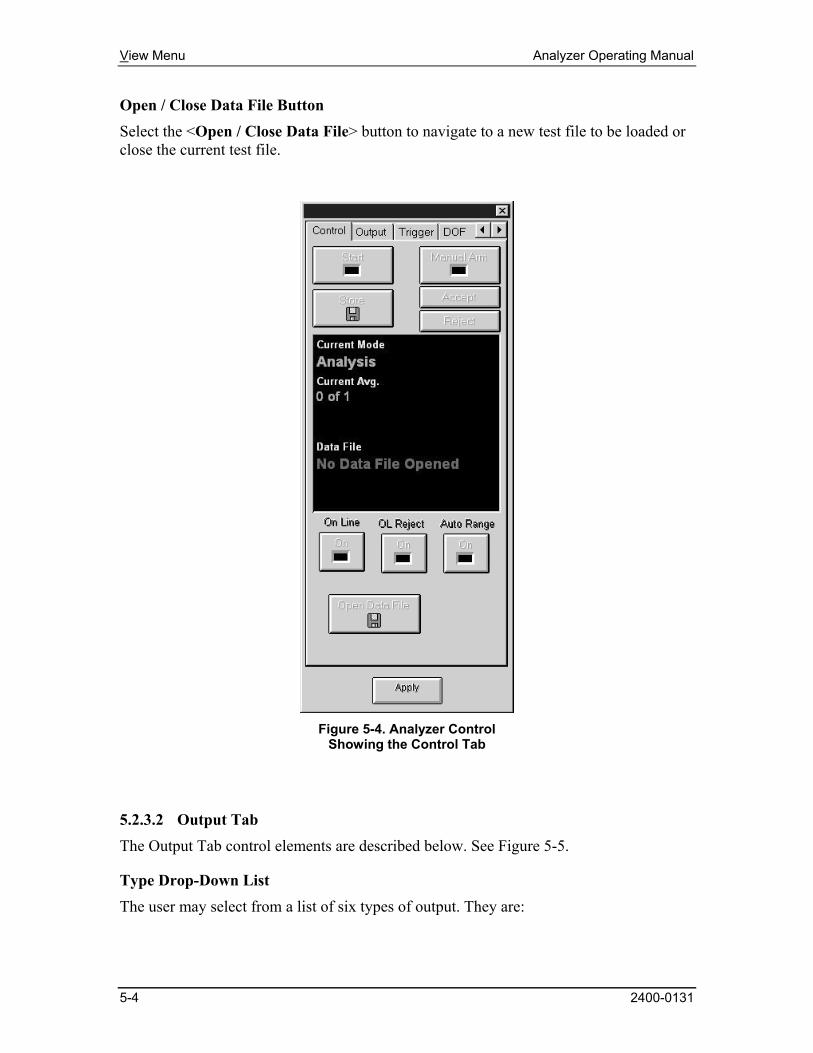
Open / Close Data File Button Select the <Open / Close Data File> button to navigate to a new test file to be loaded or close the current test file.
Figure 5-4. Analyzer Control
Showing the Control Tab
5.2.3.2 Output Tab The Output Tab control elements are described below. See Figure 5-5.
Type Drop-Down List The user may select from a list of six types of output. They are:

Analyzer Operating Manual View Menu
2400-0131 5-5
OFF SINE SINE CHIRP RANDOM PSEUDO(Random)
USER DEFINED
Table 5-1 displays which Type activates which text box.
On / Off Switch Turns waveform generator on or off.
Frequency Text Box Enabled with Sine or Sine Chirp in Type Drop Down List.
Burst Taper Text Box Enabled with Random, Pseudo (Random) and User Defined Types. In order to minimize the start up and shut down transients caused by a burst random event, the waveform generation allows the user to specify a sine^2 tapering function to be applied to the beginning and end of the burst event. The taper is defined as a percentage of the burst duration. The pulse taper has a range of 0 - 50% of the burst duration size.
Delay Text Box Enabled with Random, Pseudo (Random) and User Defined Types. Controls the delay between bursts. Range is 0 - 32ms.
Waveform Duration (%) Enabled with Random, Pseudo (Random) and User Defined Types. The time duration of teh burst. It is a percentage of the maximum allowable duration for the sampling rate.
Output Scale Slider The user may adjust the active waveform output with any Type setting except OFF. The full scale is ± 12 volts peak.
Define Output Button If the Type is set to User Defined the user is allowed to define the output parameters by launching the Output Shape Dialog. See Figure 5-5. Define the frequency and level, and then save the data in an output shape file (.osh).
A = Active
I = Inactive
Freq
uenc
y
Bur
st T
aper
Del
ay
Wav
efor
m
Dur
atio
n
OFF I I I I
Typ
e
SINE A I I I

View Menu Analyzer Operating Manual
5-6 2400-0131
SINE CHIRP
A I A I
RANDOM I A A A
PSEUDO I A A A
USER DEFINED
I A A A
Figure 5-5. Analyzer Control
Showing the Output Tab
Analyzer Operating Manual View Menu
2400-0131 5-7
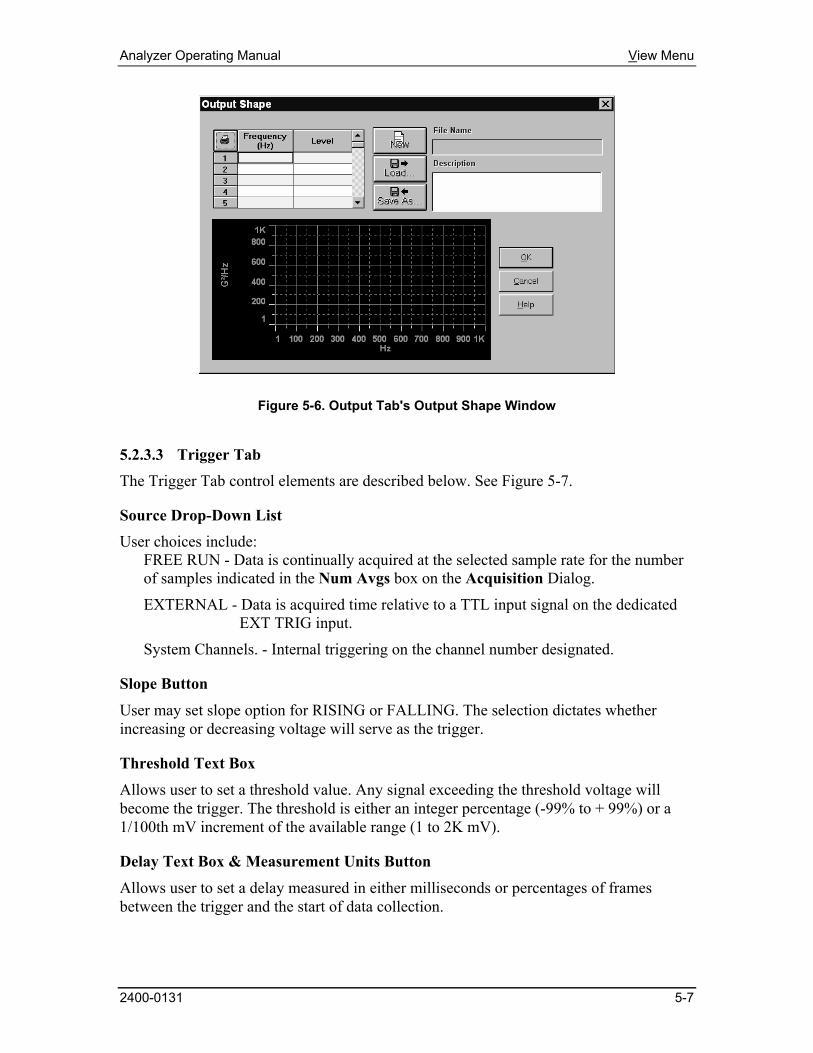
Figure 5-6. Output Tab's Output Shape Window
5.2.3.3 Trigger Tab The Trigger Tab control elements are described below. See Figure 5-7.
Source Drop-Down List User choices include:
FREE RUN - Data is continually acquired at the selected sample rate for the number of samples indicated in the Num Avgs box on the Acquisition Dialog.
EXTERNAL - Data is acquired time relative to a TTL input signal on the dedicated EXT TRIG input.
System Channels. - Internal triggering on the channel number designated.
Slope Button
User may set slope option for RISING or FALLING. The selection dictates whether increasing or decreasing voltage will serve as the trigger.
Threshold Text Box
Allows user to set a threshold value. Any signal exceeding the threshold voltage will become the trigger. The threshold is either an integer percentage (-99% to + 99%) or a 1/100th mV increment of the available range (1 to 2K mV).
Delay Text Box & Measurement Units Button
Allows user to set a delay measured in either milliseconds or percentages of frames between the trigger and the start of data collection.

Analyzer Operating Manual View Menu
2400-0131 5-7
Triggering Button
The options are Pre-Trigger or Post-Trigger. Allows the user to store the result into the data frame before or after the trigger event. The time element value is set in the Delay Text Box.
Duration Text Box
Displays duration of test. This is pre-set at SETUP ⇒ ACQUISITION ⇒ Mode ⇒ Duration.
Arming Mode Button
Allows user to set MANUAL or AUTOMATIC mode of triggering.
Check Boxes Trigger Beep - Initiates an audible alarm when trigger conditions are met.
Manual Accept - This allows acceptance of the last frame of data in averaging.
Figure 5-7. Analyzer Control
Showing the Trigger Tab
View Menu Analyzer Operating Manual
5-8 2400-0131
5.2.3.4 DOF Tab The DOF (Degrees Of Freedom) is the confidence factor related to a statistical measurement. The DOF Tab control elements are described below. See Figure 5-8.
Response DOF Processing Drop-Down List - The user may choose:
NONE - There is no automation. Enter location and direction for each input channel in the channel table. (SETUP⇒CHANNELS)
AUTO - Automatically increments the response channel's location number by the increment specified. This allows the acquisition of banks of channels without the requirement to enter the location number for each channel of each set.
TABLE - If the numbers are not located sequentially or the user is employing a roving hammer the option exists for entering the location, channel label, direction and status of each input channel for each set of channels in separate channel tables. After the data for each set is collected, the system will automatically go to the next channel table set.
Reset Button - Allows the user to reset the DOF input to the Channel Table Setup.
Auto Increment Section
Location Start Text Box - Active when Response DOF Processing is set to AUTO.
Location Direction Drop-Down Box - Active when Response DOF Processing is set to AUTO. Allows the user to set X, Y or Z parameters.
Location Increment Text Box - Active when Response DOF Processing is set to AUTO.
Every time data is saved the location number is specified in the channel table and the Location Increment will increase each response channel. The Location Start and Location Direction numbers will be taken from the channel table for each input channel.
Invert Reference Drop-Down List
The Invert Reference option is either ON or OFF. When on, it inverts the reference and the response channels when calculating the FRF's.
Define Table Button
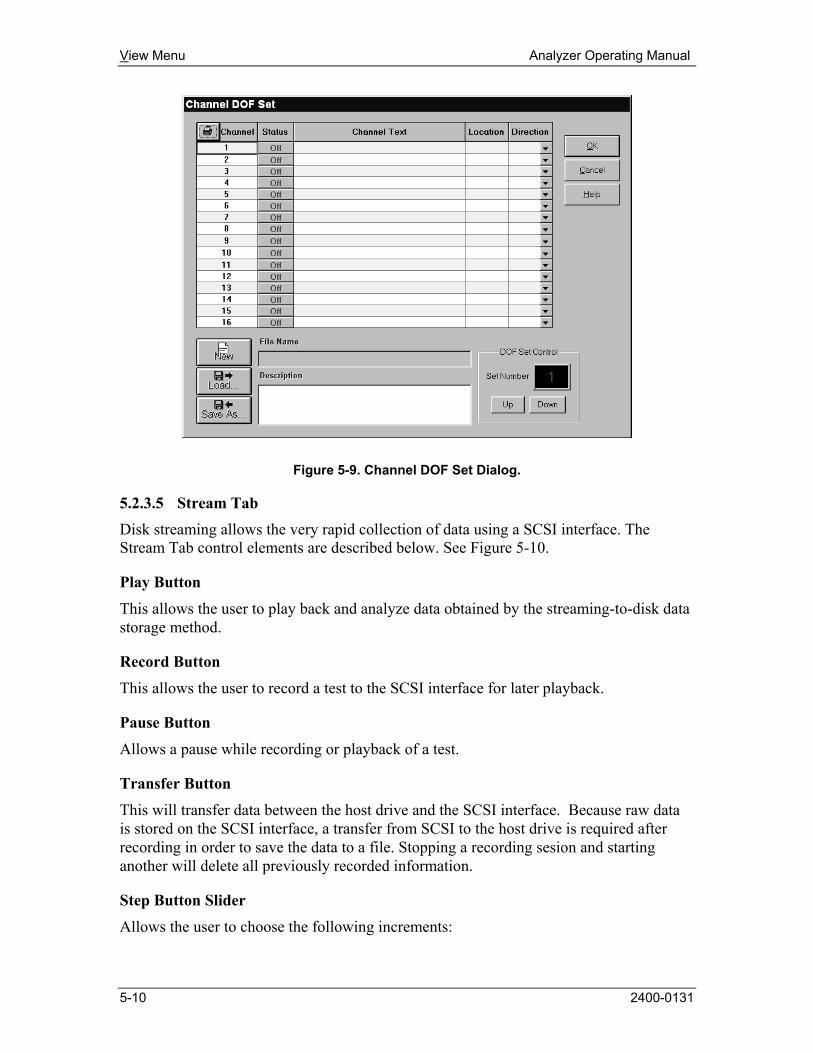
Active only when the Response DOF Processing is set to TABLE. Allows the user to define multiple sets of channel tables in a Channel DOF Set Dialog prior to the start of data acqusition. See Figure 5-9. Every time data is saved it will automatically recall the next channel table set. As a result, the transducers can be moved to the next set of locations and the user will not have to enter the new location(s) for each input channel.

View Menu Analyzer Operating Manual
5-8 2400-0131
Figure 5-8. Analyzer Control Showing the DOF Tab
View Menu Analyzer Operating Manual
5-10 2400-0131
Figure 5-9. Channel DOF Set Dialog.
5.2.3.5 Stream Tab Disk streaming allows the very rapid collection of data using a SCSI interface. The Stream Tab control elements are described below. See Figure 5-10.
Play Button
This allows the user to play back and analyze data obtained by the streaming-to-disk data storage method.
Record Button
This allows the user to record a test to the SCSI interface for later playback.
Pause Button
Allows a pause while recording or playback of a test.
Transfer Button
This will transfer data between the host drive and the SCSI interface. Because raw data is stored on the SCSI interface, a transfer from SCSI to the host drive is required after recording in order to save the data to a file. Stopping a recording sesion and starting another will delete all previously recorded information.
Step Button Slider
Allows the user to choose the following increments:

Analyzer Operating Manual View Menu
2400-0131 5-9
±⅛ ±¼ ±½ ±1 ±2 ±4 ±8
The selected increment is displayed in the text box just below the slider.
Step Button
Initiates the test with the incremental vlaue residing in the text box to the right.
Test Time Text Boxes
Displays the elapsed test time.
Marker Setup Button & Drop-Down List
Clicking the button launches the Marker Properties Window. See Figure 5-11.
Set Marker Button
This sets a break point marker in the data.
Go To Marker Button
Allows the user to find a specific marker.
SCSI Info Section
The four text boxes are labeled: Vendor, ProductID, Device and Status. They assist the user in keeping track of the scuzzy device being used. The Status Text Box indicates either recording or playback mode.
File Info Section
The six text boxes are labeled: Date, Time, Bandwidth, Block Size, Resolution and Test Length. This information makes up the header of the file being worked with.


View Menu Analyzer Operating Manual
5-12 2400-0131
Figure 5-10. Analyzer Control Showing the Stream Tab
Figure 5-11. Marker Properties Window

Analyzer Operating Manual View Menu
2400-0131 5-13
5.2.4 Channel Status Panels
When the CHANNEL STATUS PANELS option (CHANNELS 1 TO 4, CHANNELS 5 TO 8, etc. to include 32 channels) is selected, a Channel Status Panel similar to that shown in Figure 5-12 will display.
The panel(s) displays GRMS information about the channels being used in four-channel increments. The measurement is rounded to the nearest one thousandth.
Figure 5-12. Typical Channel Status Panel
5.2.5 DOF Status Panels
When the DOF STATUS PANELS option is selected from the VIEW menu, a panel similar to that shown in Figures 5-13 will display. This panel gives information about the level of the currently loaded test. Two panels, each containing eight channels each are available for use.
Figure 5-13. Typical DOF Status Panel
GRMS of Each Individual Channel
View Menu Analyzer Operating Manual
5-14 2400-0131
5.2.6 Current Display Settings
When the CURRENT DISPLAY SETTINGS OPTION from the VIEW menu is selected, a set of controls consisting of a text box with a drop-down list, an add (+) button and a delete (-) button are displayed. These controls reside between the menu bar and the tool bar and are also called the PUMA Desktop Toolbar. See Figure 5-2. When selected, each item in the list will arrange the desktop in a previously defined layout. Each template listed has its particular components that are laid out in a specific arrangement. The user can modify each template and arrange the screen components to suit their needs.
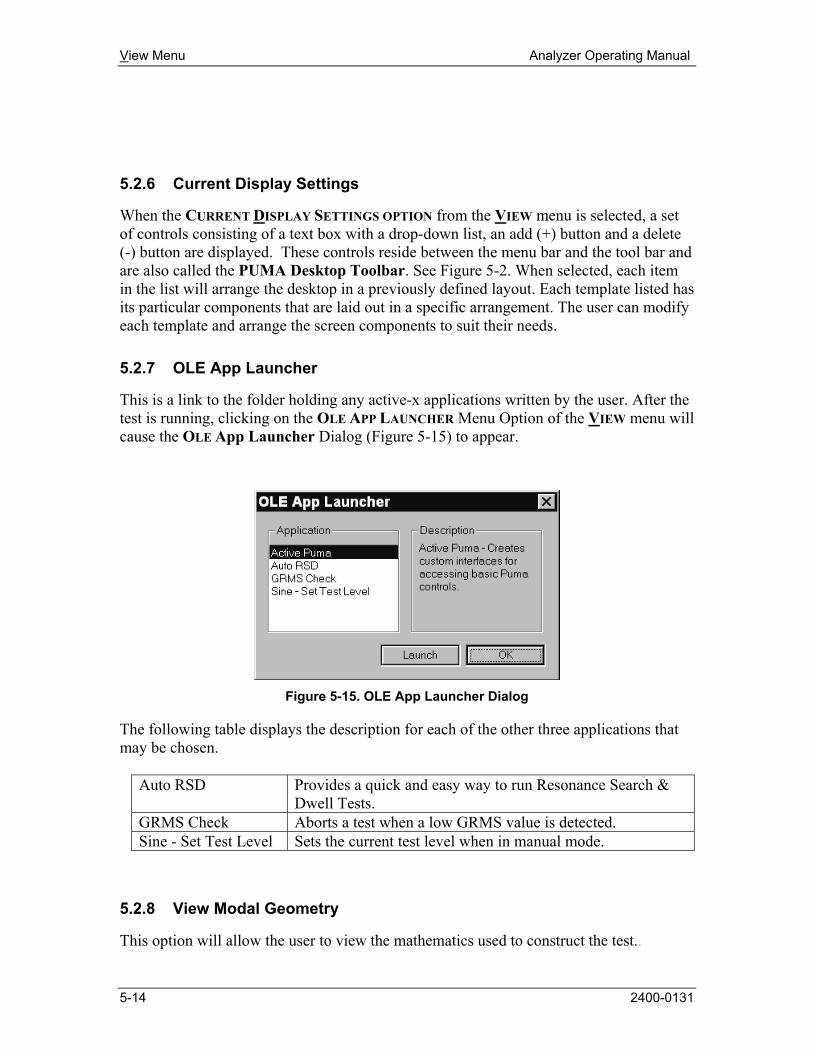
5.2.7 OLE App Launcher
This is a link to the folder holding any active-x applications written by the user. After the test is running, clicking on the OLE APP LAUNCHER Menu Option of the VIEW menu will cause the OLE App Launcher Dialog (Figure 5-15) to appear.
Figure 5-15. OLE App Launcher Dialog
The following table displays the description for each of the other three applications that may be chosen.
Auto RSD Provides a quick and easy way to run Resonance Search & Dwell Tests.
GRMS Check Aborts a test when a low GRMS value is detected. Sine - Set Test Level Sets the current test level when in manual mode.
5.2.8 View Modal Geometry
This option will allow the user to view the mathematics used to construct the test..

Analyzer Operating Manual
2400-0131
Chapter 6 - Test Menu
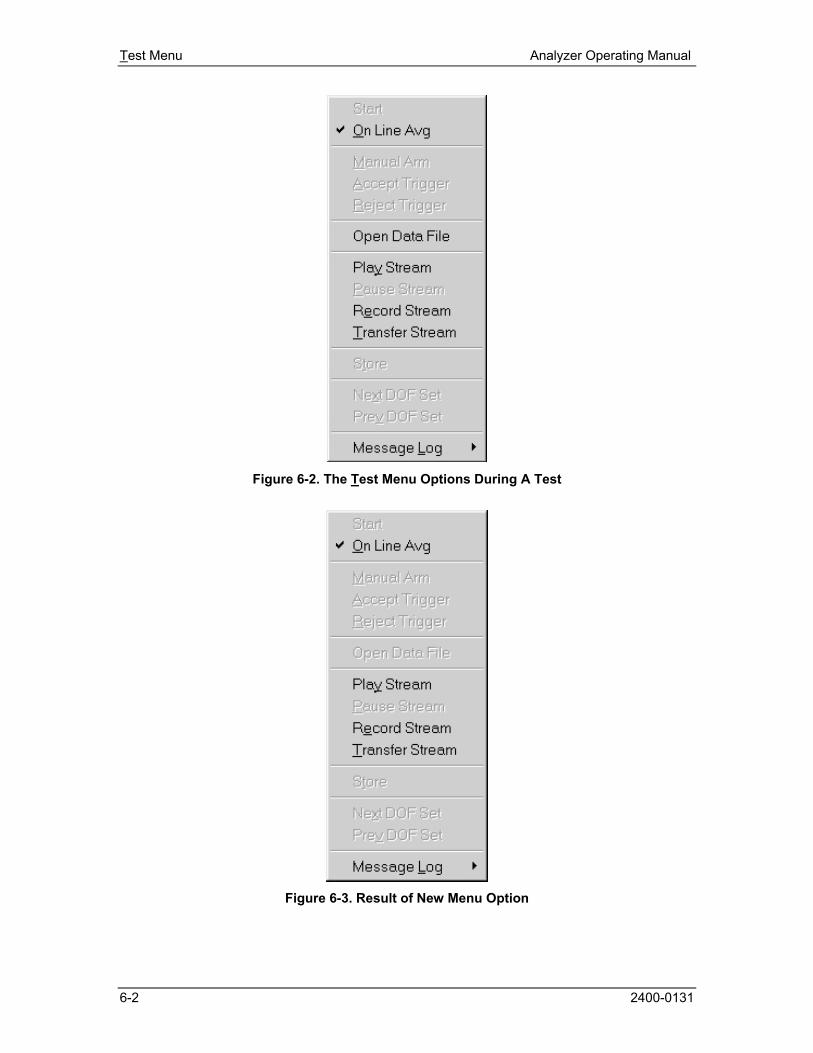
6.1 Introduction When theAnalyzer Application is first started and the TEST Menu option is selected from the Menu Bar, the image shown in Figure 6-1 displays. After the test begins, the options change as shown in Figure 6-2. If the test is terminated and a different file is sought through the NEW Menu Option, the menu options available to the user are shown in Figure 6-3. Most of these commands can also be issued from the Analyzer Control. See Chapter 5.
Figure 6-1. The Test Menu Options Prior To A Test
Test Menu Analyzer Operating Manual
6-2 2400-0131
Figure 6-2. The Test Menu Options During A Test
Figure 6-3. Result of New Menu Option
Analyzer Operating Manual Test Menu
2400-0131 6-3
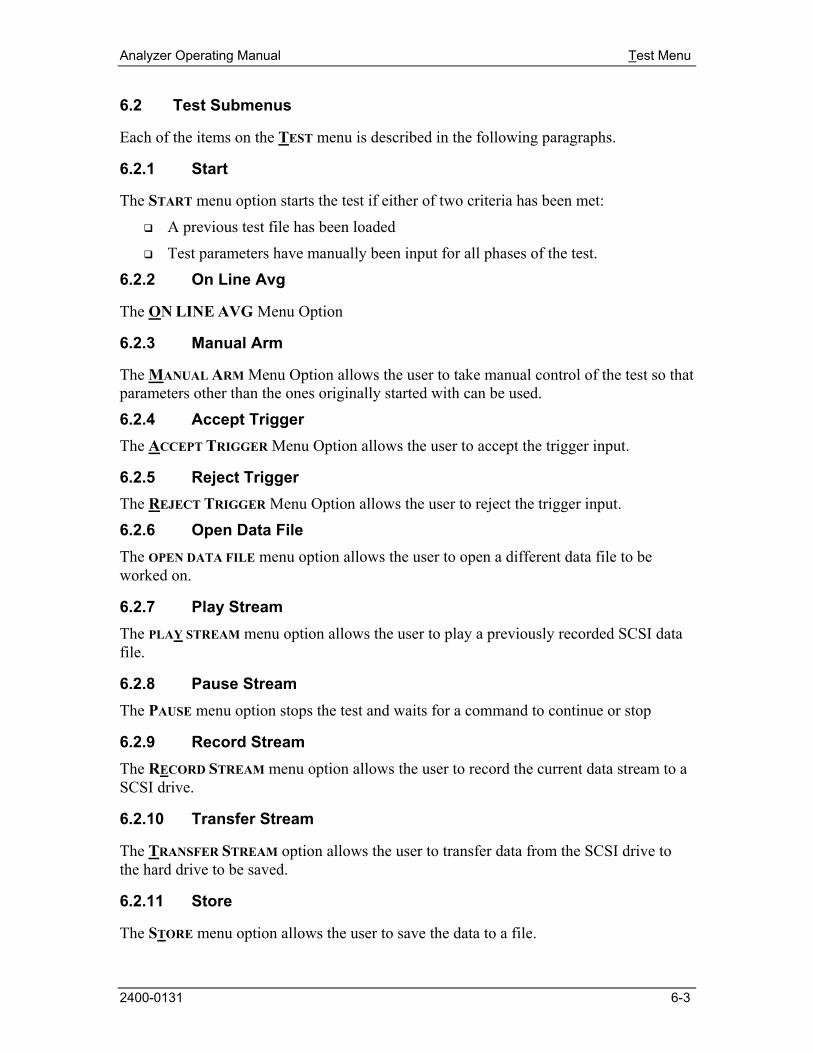
6.2 Test Submenus
Each of the items on the TEST menu is described in the following paragraphs.
6.2.1 Start
The START menu option starts the test if either of two criteria has been met:
A previous test file has been loaded
Test parameters have manually been input for all phases of the test.
6.2.2 On Line Avg
The ON LINE AVG Menu Option
6.2.3 Manual Arm
The MANUAL ARM Menu Option allows the user to take manual control of the test so that parameters other than the ones originally started with can be used.
6.2.4 Accept Trigger The ACCEPT TRIGGER Menu Option allows the user to accept the trigger input.
6.2.5 Reject Trigger The REJECT TRIGGER Menu Option allows the user to reject the trigger input.
6.2.6 Open Data File The OPEN DATA FILE menu option allows the user to open a different data file to be worked on.
6.2.7 Play Stream The PLAY STREAM menu option allows the user to play a previously recorded SCSI data file.
6.2.8 Pause Stream The PAUSE menu option stops the test and waits for a command to continue or stop
6.2.9 Record Stream The RECORD STREAM menu option allows the user to record the current data stream to a SCSI drive.
6.2.10 Transfer Stream
The TRANSFER STREAM option allows the user to transfer data from the SCSI drive to the hard drive to be saved.
6.2.11 Store
The STORE menu option allows the user to save the data to a file.

Test Menu Analyzer Operating Manual
6-4 2400-0131
6.2.12 Next DOF Set
The NEXT DOF SET allows the user to use the next set of DOF parameters in the test.
6.2.13 Prev DOF Set
The PREV DOF SET allows the user to use the preceeding set of DOF parameters in the test.
6.2.14 Message Log The MESSAGE LOG is the file of information that being generated and is displayed as the test is running. The MESSAGE LOG submenu has submenus of its own. See Figure 6-3. There is a PRE-TEST and POST-TEST DUMP and a MESSAGE PRIORITY selection with three submenus of its own. The submenus are discussed below.
6.2.14.1 Message Priority Message Priority The three levels of Message Priority are High, Medium and All. While it is highly recommended that the default (All) is used, the other choices are offered for those users that continually run the same test or repeat a number of cycles of the same tests and do not need to see all the log file messages
.
Figure 6-4. Message Log Sub-Menus
Analyzer Operating Manual
2400-0131
Chapter 8 - Help Menu
8.1 Introduction When the Spectral Dynamics Analyzer HELP Menu Option is selected, the menu shown in Figure 8-1 will display. This menu consists of HELP TOPICS and ABOUT PUMA.
Figure 8-1. The Help Menu
8.1.1 Help Topics
The HELP TOPICS option launches the Welcome Page of the online help application. See Figure 8-2.
Figure 8-2. Help Topics Online Welcome Page

Help Menu Analyzer Operating Manual
8-2 2400-0131
8.1.1.1 Contents Pane
The Contents Pane (Figure 8-3) allows the user to view all of the online help subjects within each application. Each category is introduced by a closed book symbol. Double clicking on the book will open it and display two types of sub-category options. One option is another closed book indicating further sub-categories. The other sub-category option is a page with a question mark on it. Double clicking on this will display the information dealing with the subject. The Analyzer's HELP file can display three levels of information.
Figure 8-3. Help Topics Contents Pane Listing
The main difference between this pane and the main one is that the user can jump around to anywhere within the online HELP topics of any of the applications in the Contents Pane. Navigating the topics in the main pane only allows the user to advance or go back one frame at a time with one exception. An underlined word(s) indicate a link to another subject. The user can click this link to view the information. From here the Forward Arrow will advance the user one frame forward but the Backward Arrow returns the user to the original starting place.
8.3 About PUMA
The About PUMA Window (Figure 8-4) features a rolling, bouncing cube with pictures of a Puma and the CATS PUMA logo. The right side of the window displays version and build information along with copyright information.

Analyzer Operating Manual Help Menu
8-3 2400-0131
Figure 8-4. The About Puma Screen

Analyzer Operating Manual
2400-0131
Chapter 7 - Data Menu
7.1 Introduction When you select the DATA option from the Menu Bar the menu shown in Figure 7-1 will display.
Figure 7-1. The Data Menu After Launching The Analyzer Application
The DATA menu consists of: DISPLAY, CHOOSE REPORT, FILE SUMMARY INFO, GIM IMPORT/EXPORT and SUMMARY.
7.2 Data Submenus
All of the DATA Menu items are described next.
7.2.1 Display The DISPLAY option is not available until after the testing begins.
.
7.2.2 Choose Report
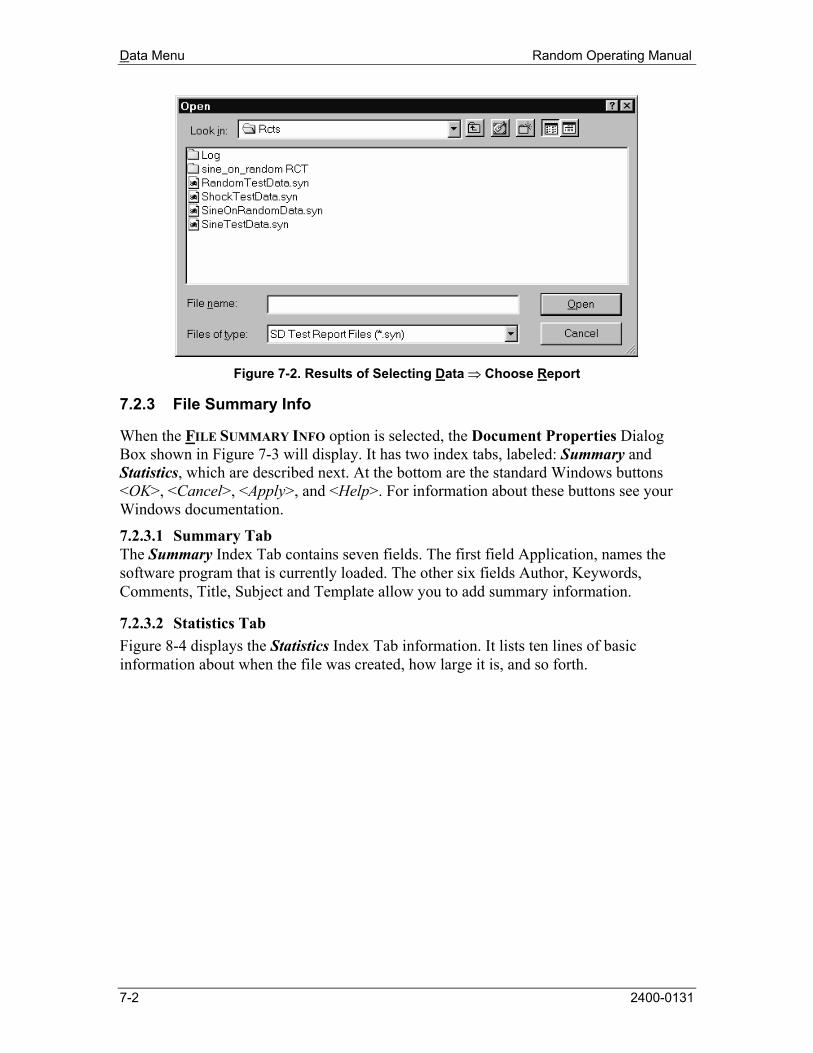
The CHOOSE REPORT option activates an OPEN Dialog Box similar to the SAVEAS Dialog Box, which allows the user to search for and select the file that contains the required report. See Figure 7-2.
Data Menu Random Operating Manual
7-2 2400-0131
Figure 7-2. Results of Selecting Data ⇒ Choose Report
7.2.3 File Summary Info
When the FILE SUMMARY INFO option is selected, the Document Properties Dialog Box shown in Figure 7-3 will display. It has two index tabs, labeled: Summary and Statistics, which are described next. At the bottom are the standard Windows buttons <OK>, <Cancel>, <Apply>, and <Help>. For information about these buttons see your Windows documentation.
7.2.3.1 Summary Tab The Summary Index Tab contains seven fields. The first field Application, names the software program that is currently loaded. The other six fields Author, Keywords, Comments, Title, Subject and Template allow you to add summary information.
7.2.3.2 Statistics Tab Figure 8-4 displays the Statistics Index Tab information. It lists ten lines of basic information about when the file was created, how large it is, and so forth.

Random Operating Manual Data Menu
2400-0131 7-3
Figure 7-3 Document Properties
Dialog Box
Figure 7-4. Statistics Index Tab
7.2.4 Puma Local Data Menu Option
Upon initial launch of Puma if no application has been launched and the DATA Menu Option is selected the available choices are shown in Figure 7-5.

Data Menu Random Operating Manual
7-4 2400-0131
Figure 7-5. Puma Local Menu
Options Prior to Selecting An Application