Embed Size (px)
Citation preview
Defence R&D Canada – Atlantic
DEFENCE DÉFENSE&
Channel amplitude variability characteristics
of the Cycle 3 Multi-Aperture Networked
Towed Array (MANTArray)
S. Pecknold
G. Baker
G. Hemphill
Technical Memorandum
DRDC Atlantic TM 2004-159
May 2004
Copy No.________
Defence Research andDevelopment Canada
Recherche et développementpour la défense Canada

This page intentionally left blank.
Copy No:
Channel amplitude variability characteristicsof the Cycle 3 Multi-Aperture NetworkedTowed Array (MANTArray)
S. Pecknold G. Baker G. Hemphill
Defence R&D Canada – Atlantic Technical Memorandum DRDC Atlantic TM 2004-159 May 2004
2004
2004
Abstract
An analysis of time series data collected during two DRDC Atlantic sea trials revealed significant spatial and temporal variability measured by the MANTArray. It was determined that this variability was consistent with the presence of a high-amplitude infrasonic wave, with a frequency of approximately 0.2 Hz. It is proposed that additional filtering, either hardware or in the processing stream, may remedy this problem.
Résumé
Une analyse de données chronologiques recueillies par le RDDC Atlantique pendant deux essais en mer a montré une importante variabilité spatiale et temporelle mesurée par le réseau MANTArray. Il a été déterminé que cette variabilité correspondait à la présence d’une onde infrasonore de haute amplitude et d’une fréquence d’environ 0,2 Hz. La solution proposée pour remédier au problème est l’ajout de filtrage, soit au niveau du matériel ou du traitement des données
DRDC Atlantic TM 2004-159 i

This page intentionally left blank.
ii DRDC Atlantic TM 2004-159
Executive summary
Introduction TIAPS, the Towed Integrated Active-Passive Sonar, is a Technology Demonstration project designed to explore the potential development of a next-generation sonar system. The integration of a low-frequency, variable-depth active sonar with a high dynamic range passive sonar will allow for greater flexibility in detection, localization and classification of targets. The MANTArray (Multi-aperture Networked Towed Array) is the passive receive array for the TIAPS project. To function well in conjunction with a low-frequency active sonar as part of the TIAPS system, it requires good dynamic range and good self-noise performance. During the course of development of the MANTArray it was found that the gain and noise floor varied with time and between array channels. Investigation of the variations was done using data from past sea trials and through direct manipulation of one of the array modules.
Results The analysis of time series from the Q273 sea trial, which took place from March 31 to April 24, 2003, and the Q277 sea trial, which took place from September 11 to October 17, 2003, showed significant variations in the power spectra measured in different channels of the MANTArray, as well as in the same channels at different times. Several other anomalies were found. The beamformed data was found to contain large spatial sidelobes, most likely due to the (apparent) gain variability demonstrated by the power spectra variations. Additionally, direct examination of the time series data revealed a high-amplitude infrasonic wave of frequency approximately 0.2 Hz propagating along the array. Tests were performed on the array components; they indicated that the problem was elsewhere.
Remarks Given a sufficiently strong infrasonic wave, energy leakage into higher parts of the spectrum can occur. Leakage caused by the infrasonic wave noticed in the time series, which may be cause by ship heave or some other physical mechanism, was confirmed through simulation and direct signal injection into the array to cause effective fluctuations in measured power both in the noise background and when there is a sonar signal present. This result provides an explanation for the variability found in the data collected during the sea trials.
Future plans A possible solution to the problematic fluctuations is a redesign of the DAUs (Data Acquisition Units) to include additional filters. Another possibility is to change the signal processing stream used, including the use of longer FFTs and/or a finite or infinite impulse response filter. This will be tested on future sea trials.
Sean P. Pecknold, Greg Baker, Gavin Hemphill. 2004. Channel amplitude variability characteristics of the Cycle 3 Multi-Aperture Networked Towed Array (MANTArray). DRDC Atlantic TM 2004-159. Defence R&D Canada – Atlantic.
DRDC Atlantic TM 2004-159 iii
Sommaire
Introduction Le TIAPS, sonar actif-passif intégré remorqué, s’inscrit dans le cadre d’un projet de démonstration de technologie qui a été conçu dans le but d’explorer le développement potentiel d’une nouvelle génération de système sonar. L’intégration d’un sonar actif basse fréquence à immersion variable à un sonar passif à grande portée dynamique permettra une plus grande flexibilité dans la détection, la localisation et la classification des cibles. Le MANTArray, nouveau réseau de sonar remorqué raccordé à ouvertures multiples, est le réseau de récepteurs passifs du projet TIAPS. Afin qu’il fonctionne adéquatement avec un sonar actif basse fréquence comme une partie intégrante du TIAPS, il doit présenter une bonne portée dynamique et une bonne performance à l’égard du bruit propre. Pendant le développement du MANTArray nous avons découvert que le seuil de gain et de bruit variait dans le temps et entre les canaux du réseau. Une étude des variations a été faite à l’aide de données d’anciens essais en mer et par la manipulation directe d’un des modules du réseau.
Résultats L’analyse de séries chronologiques de l’essai en mer Q273, qui a eu lieu entre le 31 mars et le 24 avril 2003, et l’essai Q277, qui a eu lieu entre le 11 septembre et le 17 octobre 2003, a montré des variations importantes dans le spectre de puissance mesuré dans différents canaux du MANTArray, et aussi dans un même canal à différents instants. Plusieurs autres anomalies ont été détectées. Nous avons constaté que les données du faisceau mis en forme contenaient de larges lobes secondaires spatiaux qui étaient probablement causés par la variabilité (apparente) du gain démontrée par les variations du spectre de puissance. De plus, une étude directe des données chronologiques a montré qu’une onde infrasonore de haute amplitude d’une fréquence d’environ 0,2 Hz est propagée dans le réseau. Les tests effectués sur les composants du réseau ont indiqué que le problème venait d’ailleurs.
Remarques Si l’onde infrasonore est suffisamment puissante, une fuite d’énergie dans les parties supérieures du spectre peut avoir lieu. Lors de simulation et d’application directe de signaux dans le réseau, nous avons pu confirmer que les fuites causées par une onde infrasonore observée dans les séries chronologiques, onde pouvant être causée par le pilonnement du navire ou d’autres mécanismes physiques, entraînaient des fluctuations de la puissance mesurée du bruit de fond et aussi d’un éventuel signal de sonar. Ces résultats expliquent la variabilité observée dans les données recueillies pendant les essais en mer.
iv DRDC Atlantic TM 2004-159
Recherches futures Une solution possible aux fluctuations problématiques est l’amélioration des DAU (modules d'acquisition de données) afin d’inclure des filtres supplémentaires. Une autre solution possible est la modification du traitement actuel des signaux, dont l’utilisation de plus longues TFR et/ou d’un filtre à réponse impulsionnelle finie ou infinie. Ces méthodes seront testées lors d’essais en mer à venir.
59.
Sean P. Pecknold, Greg Baker, Gavin Hemphill. 2004. Channel amplitude variability characteristics of the Cycle 3 Multi-Aperture Networked Towed Array (MANTArray). (Caractéristiques de variabilité de l’amplitude de canal du nouveau réseau de sonar remorqué raccordé à ouvertures multiples, MANTArray), RDDC Atlantique TM 2004-1R & D pour la défense Canada – Atlantique
DRDC Atlantic TM 2004-159 v
Table of contents
Abstract........................................................................................................................................ i
Executive summary ................................................................................................................... iii
Sommaire................................................................................................................................... iv
Table of contents ....................................................................................................................... vi
List of figures ........................................................................................................................... vii
Acknowledgements ................................................................................................................... ix
1. Background.................................................................................................................... 1
1.1 MANTArray..................................................................................................... 1
1.2 Effect of amplitude fluctuations on beamforming............................................ 2
2. Sea Trial Observations .................................................................................................. 3
2.1 Q277 ................................................................................................................. 3
2.2 Q273 ............................................................................................................... 11
3. Testing and Results...................................................................................................... 12
3.1 In-air tests ....................................................................................................... 12
3.2 Hydrophone/pre-amp calibrations .................................................................. 14
3.3 Signal injection............................................................................................... 16
3.4 Very-low-frequency high amplitude signal .................................................... 17
4. Conclusions ................................................................................................................. 21
5. References ................................................................................................................... 22
List of symbols/abbreviations/acronyms/initialisms ................................................................ 23
Distribution list ......................................................................................................................... 24
vi DRDC Atlantic TM 2004-159
List of figures
Figure 1. Array configurations for Q273 (top), Q277: October 3, (middle) and Q277: October 6 and 8, (bottom). ................................................................................................................ 1
Figure 2. Octave power spectra levels for October 8, 2003, 19:54 Z. ........................................ 3
Figure 3. Octave power spectra levels for October 8, 2003, 19:49 Z. ........................................ 4
Figure 4. Octave power spectra levels for October 3, 2003, 19:07 Z. ........................................ 4
Figure 5. Octave power spectra levels for October 3, 2003, 19:16 Z. ........................................ 5
Figure 6. Octave power spectra levels for October 3, 2003, 21:45 Z. ........................................ 5
Figure 7. Octave power spectra levels for October 3, 2003, 21:54 Z. ........................................ 6
Figure 8. 16-second averaged power per channel for five frequency bins. ................................ 7
Figure 9. Average power for channel 12 for five frequency bins, over 35 16-second intervals. 8
Figure 10. Ratio of power in spectral bins for channels 1 and 12, over 35 16-second intervals.8
Figure 11. Time series data, MANTArray channels................................................................... 9
Figure 12. 16-second averaged power per channel for five different dates and times (HF channels). .......................................................................................................................... 11
Figure 13. Ratio of power of 600 Hz signal measured in neighbouring channels and at different times. .................................................................................................................. 12
Figure 14. Ratio of power of 1 kHz signal measured in neighbouring channels and at different times. ................................................................................................................................. 13
Figure 15. Ratio of power in 1 kHz to 1.1 kHz band (noise) at different times. ...................... 13
Figure 16. Directivity of MANTArray channel 15................................................................... 14
Figure 17. Directivity of MANTArray channel 16................................................................... 15
Figure 18. MANTArray channels 15 and 16 calibration curves............................................... 15
Figure 19. Power at 1 kHz at different time intervals for varying averaging periods. ............. 16
Figure 20. 32768 point FFT and zoom in showing low frequencies. ....................................... 17
Figure 21. 4096 point FFT of rectangular-windowed simulated data. ..................................... 18
DRDC Atlantic TM 2004-159 vii

Figure 22. 4096 point FFT of Hamming-windowed simulated data. ....................................... 18
Figure 23. 4096 point FFT of Hanning-windowed simulated data........................................... 19
Figure 24. 4096 point FFT of Tukey-windowed simulated data. ............................................. 19
Figure 25. Power at 943 Hz and in band around 970 Hz (noise) at different time intervals. ... 20
viii DRDC Atlantic TM 2004-159

Acknowledgements
We wish to acknowledge the contributions of David Hazen, Andrew Keast, Bob Trider, Gary Inglis, and Wescan Systems Ltd.
DRDC Atlantic TM 2004-159 ix

This page intentionally left blank.
x DRDC Atlantic TM 2004-159
1. Background
1.1 MANTArray
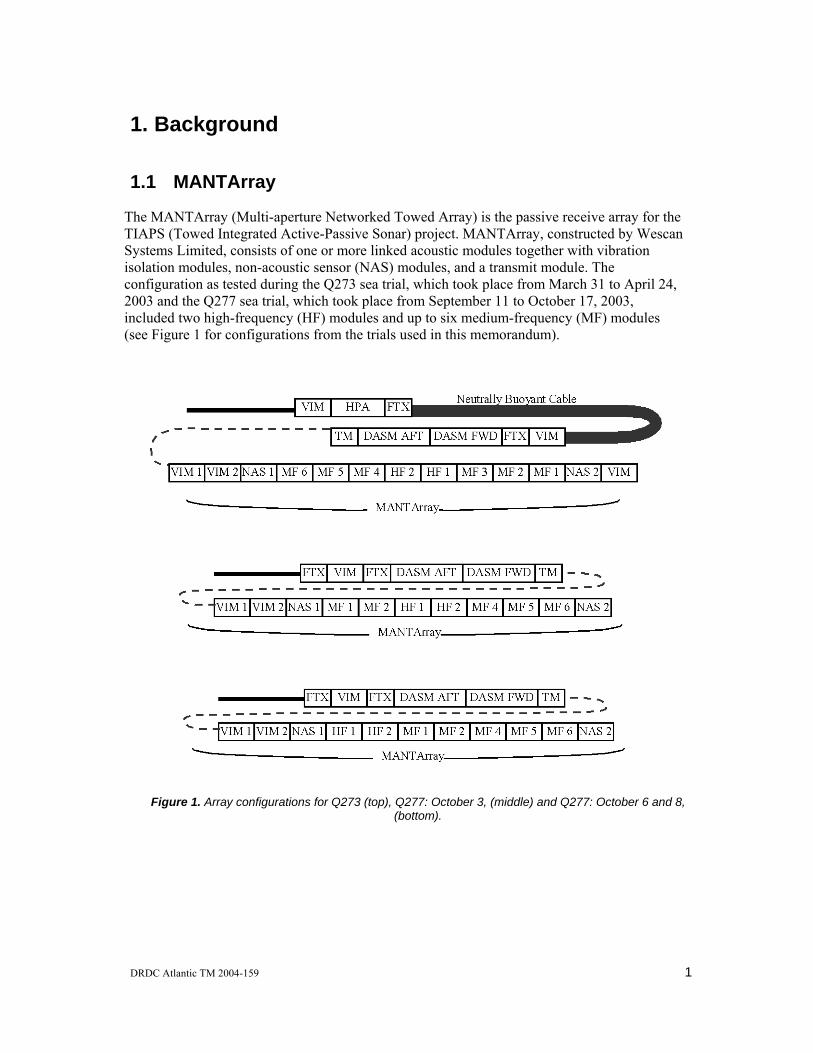
The MANTArray (Multi-aperture Networked Towed Array) is the passive receive array for the TIAPS (Towed Integrated Active-Passive Sonar) project. MANTArray, constructed by Wescan Systems Limited, consists of one or more linked acoustic modules together with vibration isolation modules, non-acoustic sensor (NAS) modules, and a transmit module. The configuration as tested during the Q273 sea trial, which took place from March 31 to April 24, 2003 and the Q277 sea trial, which took place from September 11 to October 17, 2003, included two high-frequency (HF) modules and up to six medium-frequency (MF) modules (see Figure 1 for configurations from the trials used in this memorandum).
Figure 1. Array configurations for Q273 (top), Q277: October 3, (middle) and Q277: October 6 and 8, (bottom).
DRDC Atlantic TM 2004-159 1

The HF modules consist of 48 omni-directional sensor groups of two matched hydrophones each, with a spacing between their acoustical centres of 0.5 m (to a tolerance of 5 mm). The MF modules consist of 24 matched hydrophone groups of four hydrophones each, with an array spacing of 1.0 m. Each module is filled with Bayol 35 (a light mineral oil), and the hydrophones are wrapped in an open-cell foam. The hydrophones have a nominal sensitivity of –200 dBV/µPa, with a pre-amp gain of 36 dB. The pre-amps have a single pole high pass filter at 100Hz. The tow during trial Q273 included the NBC (Neutrally Buoyant Cable) in front of the array.
1.2 Effect of amplitude fluctuations on beamforming
Random amplitude fluctuations, or random gain errors, will have a significant impact on beamforming in a towed array [1]. Given random, uniformly distributed errors in phase bounded by maxδ± and fractional amplitude errors bounded by max±∆ , then the average beam pattern is given by [2]:
( ) ( ) ( )
22max max max
2max max
2 2sin sin0 3( ) ( ) [1 ] n
n
a
aP P δ δ
δ δθ θ ∆ ∑= + − +∑
(1)
where 0 ( )P θ is the error-free beampattern and the are the array element weightings. For a uniformly weighted array, assuming no phase errors, the background sidelobe level then
increases as
na
2max
3N∆ . A 3 dB maximum error in measured power spectrum, assuming a 96-element
array, would therefore result in a background sidelobe level of about -32 dB; an error of 10 dB would result in a background sidelobe level of about -17 dB.
If the random process producing these fluctuations has a time constant much larger than the beamformer integration time, rather than looking at the average beam pattern as calculated by (1) above, one should look at the mean value of the peak sidelobe of a single realization of the process. An estimate of the value of this peak sidelobe is 6 dB higher than the background sidelobe level as calculated from equation (1), with a standard deviation of 1.5 dB.
Applied to the HF aperture of the MANTArray, a random error in measured power spectrum of 10 dB would therefore result in peak sidelobes of -11 dB, with a standard deviation of 1.5 dB.
2 DRDC Atlantic TM 2004-159
2. Sea Trial Observations
2.1 Q277
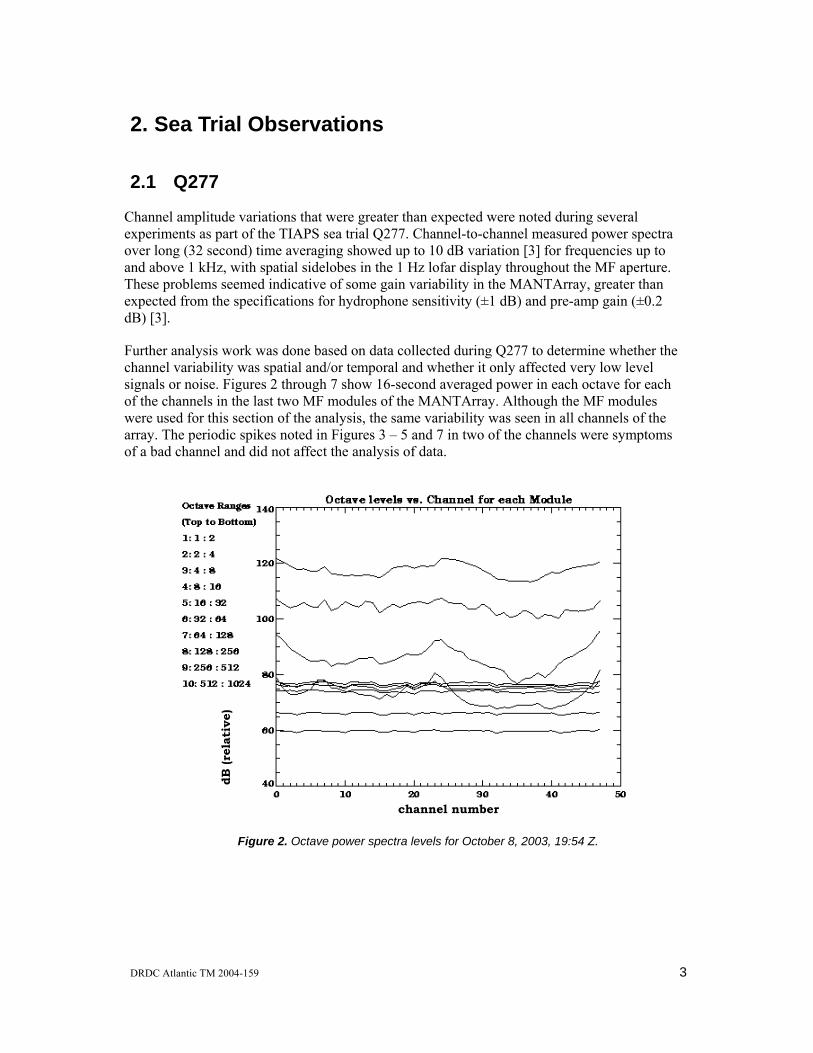
Channel amplitude variations that were greater than expected were noted during several experiments as part of the TIAPS sea trial Q277. Channel-to-channel measured power spectra over long (32 second) time averaging showed up to 10 dB variation [3] for frequencies up to and above 1 kHz, with spatial sidelobes in the 1 Hz lofar display throughout the MF aperture. These problems seemed indicative of some gain variability in the MANTArray, greater than expected from the specifications for hydrophone sensitivity (±1 dB) and pre-amp gain (±0.2 dB) [3].
Further analysis work was done based on data collected during Q277 to determine whether the channel variability was spatial and/or temporal and whether it only affected very low level signals or noise. Figures 2 through 7 show 16-second averaged power in each octave for each of the channels in the last two MF modules of the MANTArray. Although the MF modules were used for this section of the analysis, the same variability was seen in all channels of the array. The periodic spikes noted in Figures 3 – 5 and 7 in two of the channels were symptoms of a bad channel and did not affect the analysis of data.
Figure 2. Octave power spectra levels for October 8, 2003, 19:54 Z.
dB (r
elat
ive)
channel number
DRDC Atlantic TM 2004-159 3
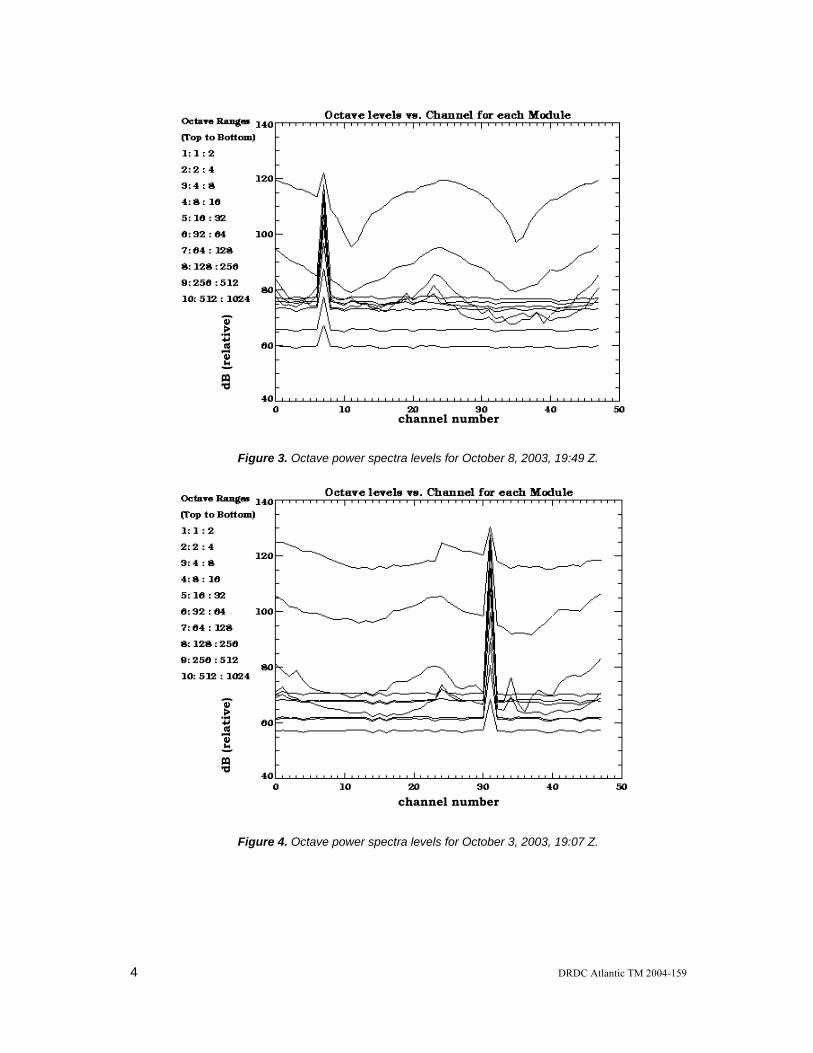
Figure 3. Octave power spectra levels for October 8, 2003, 19:49 Z.
Figure 4. Octave power spectra levels for October 3, 2003, 19:07 Z.
dB (r
elat
ive)
channel number
dB (r
elat
ive)
channel number
4 DRDC Atlantic TM 2004-159
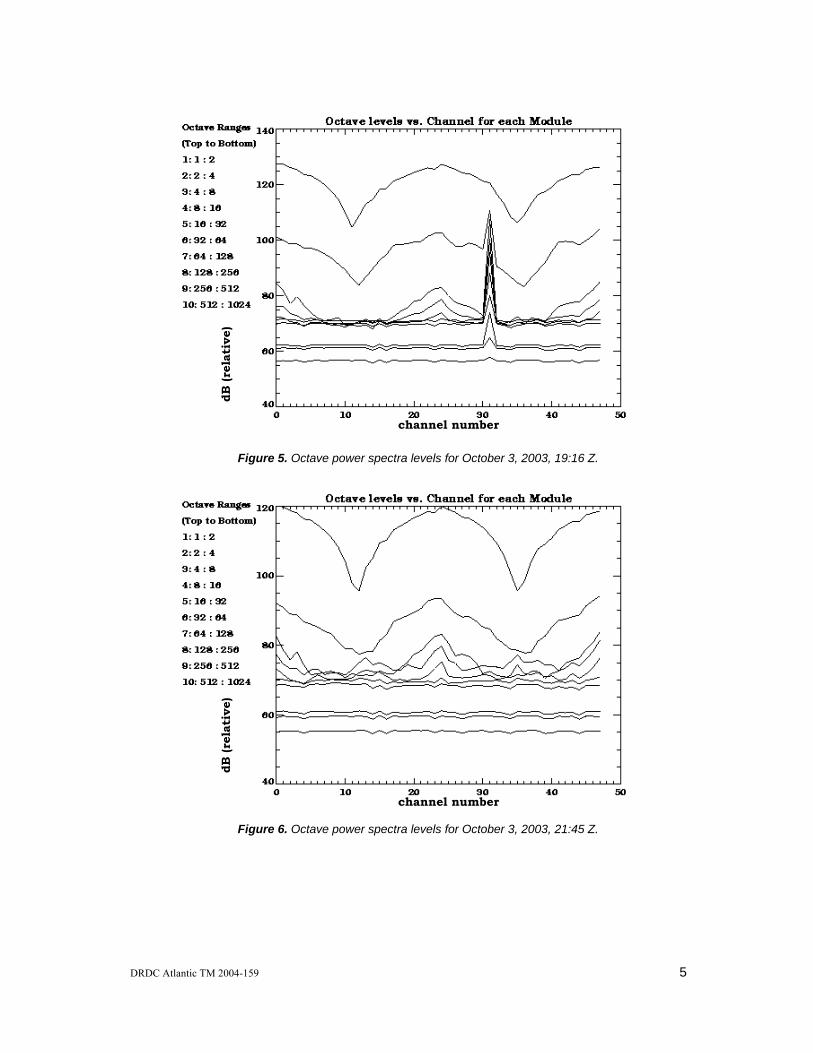
Figure 5. Octave power spectra levels for October 3, 2003, 19:16 Z.
Figure 6. Octave power spectra levels for October 3, 2003, 21:45 Z.
dB (r
elat
ive)
channel number
dB (r
elat
ive)
channel number
DRDC Atlantic TM 2004-159 5
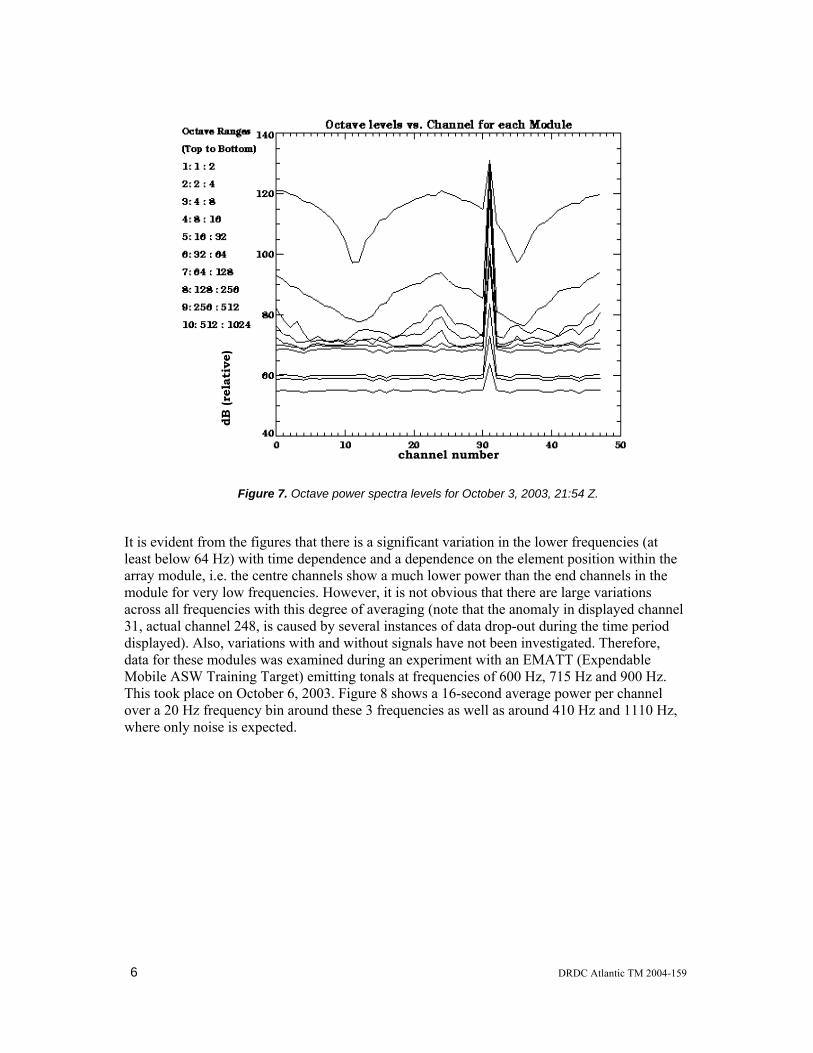
Figure 7. Octave power spectra levels for October 3, 2003, 21:54 Z.
dB (r
elat
ive)
channel number
It is evident from the figures that there is a significant variation in the lower frequencies (at least below 64 Hz) with time dependence and a dependence on the element position within the array module, i.e. the centre channels show a much lower power than the end channels in the module for very low frequencies. However, it is not obvious that there are large variations across all frequencies with this degree of averaging (note that the anomaly in displayed channel 31, actual channel 248, is caused by several instances of data drop-out during the time period displayed). Also, variations with and without signals have not been investigated. Therefore, data for these modules was examined during an experiment with an EMATT (Expendable Mobile ASW Training Target) emitting tonals at frequencies of 600 Hz, 715 Hz and 900 Hz. This took place on October 6, 2003. Figure 8 shows a 16-second average power per channel over a 20 Hz frequency bin around these 3 frequencies as well as around 410 Hz and 1110 Hz, where only noise is expected.
6 DRDC Atlantic TM 2004-159
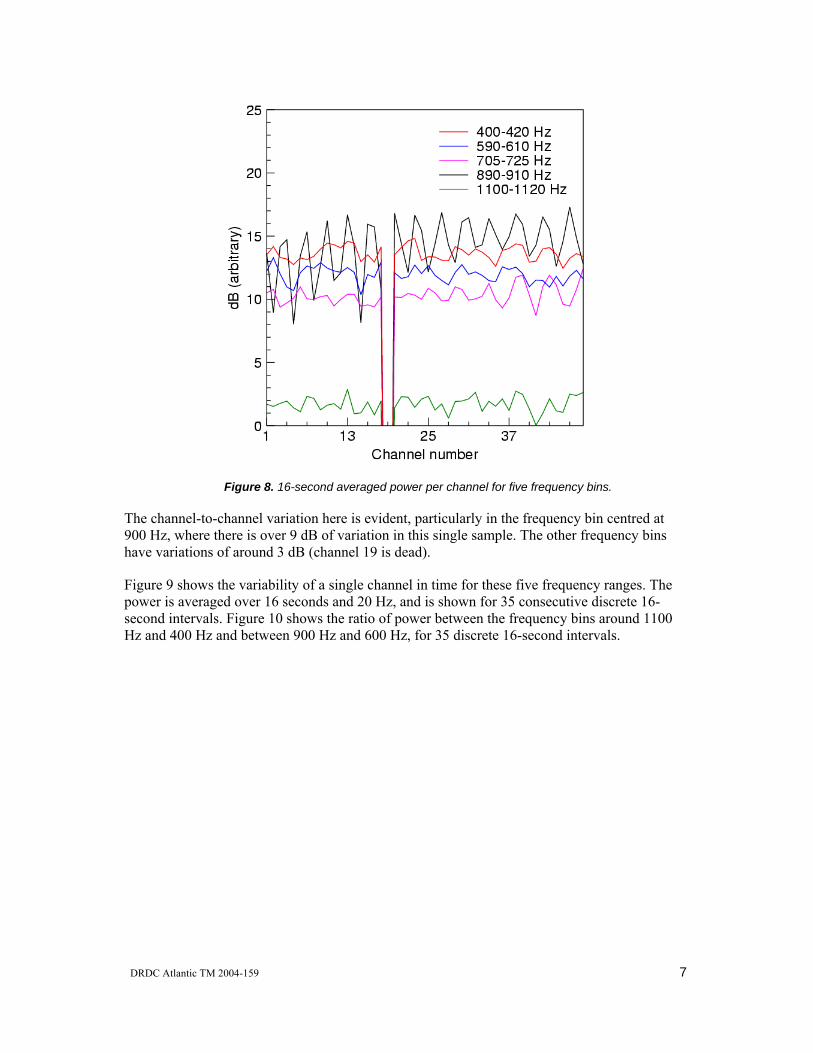
Figure 8. 16-second averaged power per channel for five frequency bins.
The channel-to-channel variation here is evident, particularly in the frequency bin centred at 900 Hz, where there is over 9 dB of variation in this single sample. The other frequency bins have variations of around 3 dB (channel 19 is dead).
Figure 9 shows the variability of a single channel in time for these five frequency ranges. The power is averaged over 16 seconds and 20 Hz, and is shown for 35 consecutive discrete 16-second intervals. Figure 10 shows the ratio of power between the frequency bins around 1100 Hz and 400 Hz and between 900 Hz and 600 Hz, for 35 discrete 16-second intervals.
DRDC Atlantic TM 2004-159 7
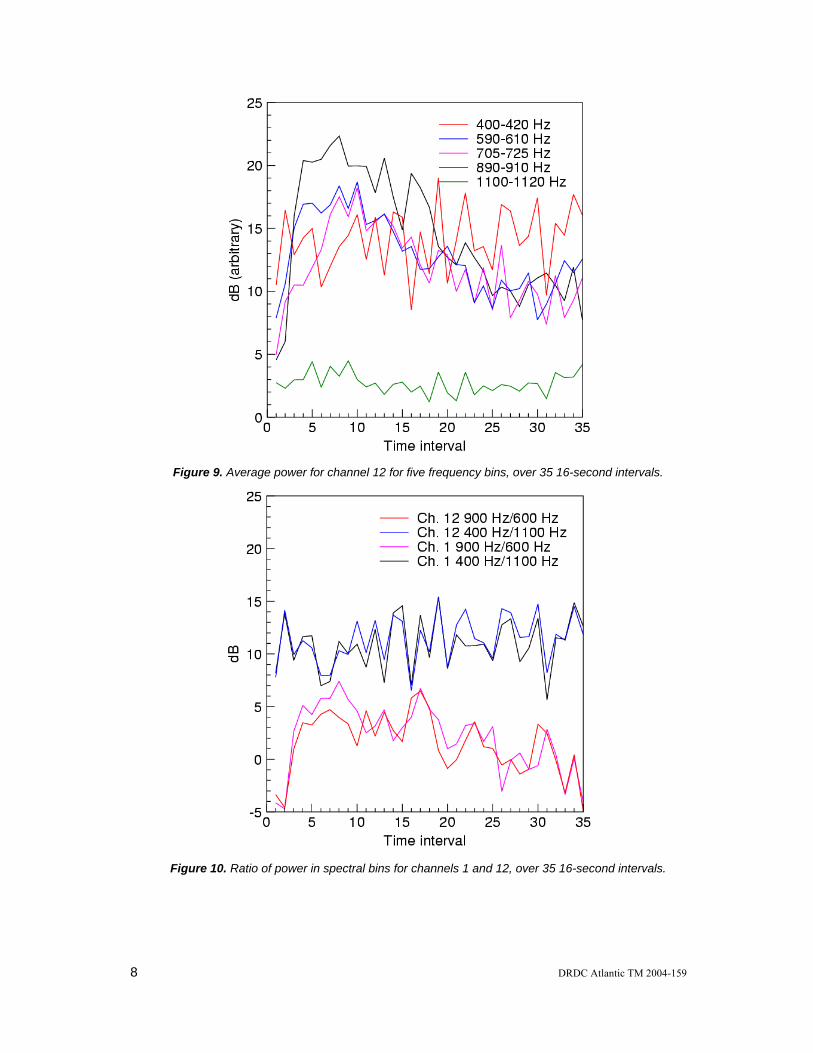
Figure 9. Average power for channel 12 for five frequency bins, over 35 16-second intervals.
Figure 10. Ratio of power in spectral bins for channels 1 and 12, over 35 16-second intervals.
8 DRDC Atlantic TM 2004-159
It can be seen from Figure 9 that there is a significant degree of variation in power measured through time, particularly in the lower frequencies (at least 10 dB for each of the four lower frequency ranges through the space of approximately 10 minutes). Figure 10 shows that the ratio of power in different spectral bands does not remain constant, either. The variability appears to be channel-to-channel, time-to-time and frequency-to-frequency.
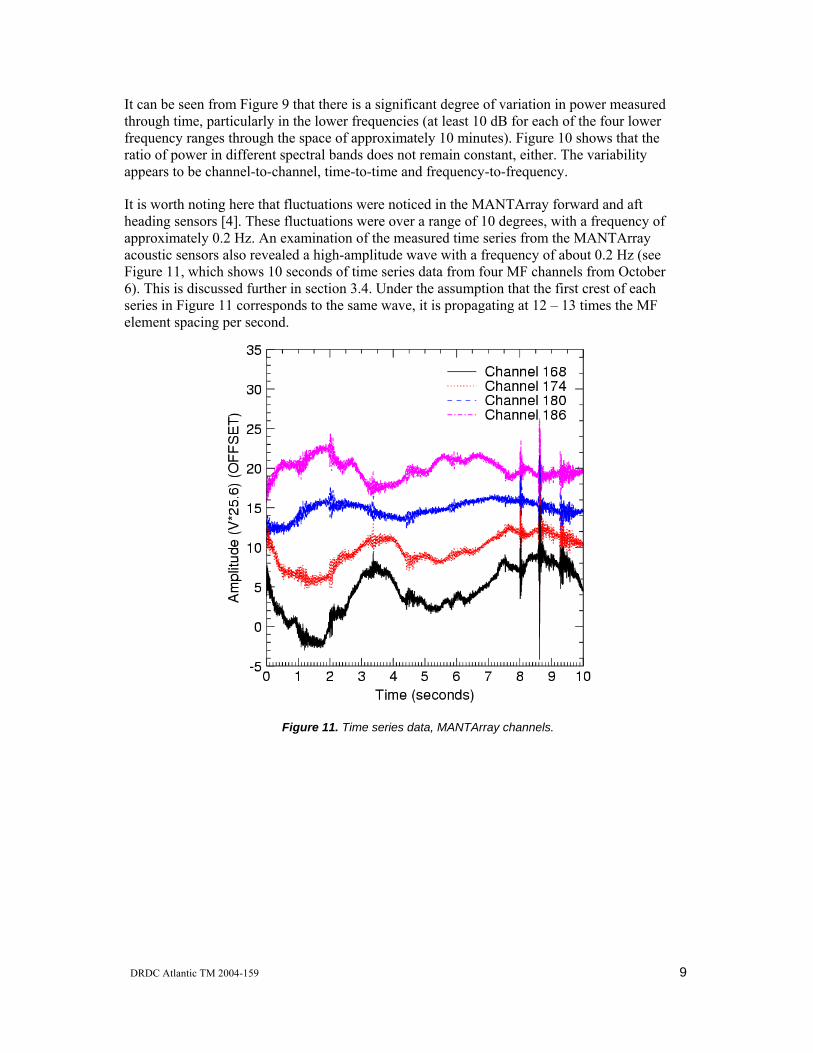
It is worth noting here that fluctuations were noticed in the MANTArray forward and aft heading sensors [4]. These fluctuations were over a range of 10 degrees, with a frequency of approximately 0.2 Hz. An examination of the measured time series from the MANTArray acoustic sensors also revealed a high-amplitude wave with a frequency of about 0.2 Hz (see Figure 11, which shows 10 seconds of time series data from four MF channels from October 6). This is discussed further in section 3.4. Under the assumption that the first crest of each series in Figure 11 corresponds to the same wave, it is propagating at 12 – 13 times the MF element spacing per second.
Figure 11. Time series data, MANTArray channels.
DRDC Atlantic TM 2004-159 9
In order to rule out the array telemetry as the source of the problem, the MANTArray test channels were examined. Channels 31 and 42 are the forward and aft NAS pre-amp with a fixed 256 Hz sinusoidal injected tone channels [5], and channels 33 and 44 are ADC (analog-to-digital converter) with a 440 Hz tone injected. In addition, data from channel 43, the pre-amp with capacitor input termination, was examined. The sine wave in channel 42 is the same as that in channel 31 (256 Hz sine wave), offset by 5 samples (approximately 1.25 ms) with amplitude ratio of 0.9284. This ratio and offset was maintained over a period of 128 seconds. For channels 33 and 44 (ADC with 440 Hz), the amplitude ratio is 0.9865, with both sets of test channels having higher amplitude on the aft NAS channel. These channels also showed a clear and steady sine wave with a frequency of 440 Hz over 128 seconds of time, with no fluctuations. Channel 43, as expected, showed thermal noise of 2.275e-05 Vrms with no tonals or noticeable irregularities and no low-frequency wave.
Given this data, it appeared that the high-amplitude infrasonic waves were in fact a physical phenomenon, possibly caused by cable strum or heave. The apparent gain fluctuations in the MANTArray acoustic sensors also appeared to be caused by either a physical phenomenon, possibly related to the infrasonic waves, or else by actual gain fluctuations in the acoustic sensors, possibly a result of hydrophone or pre-amp capacitance changes.
10 DRDC Atlantic TM 2004-159
2.2 Q273
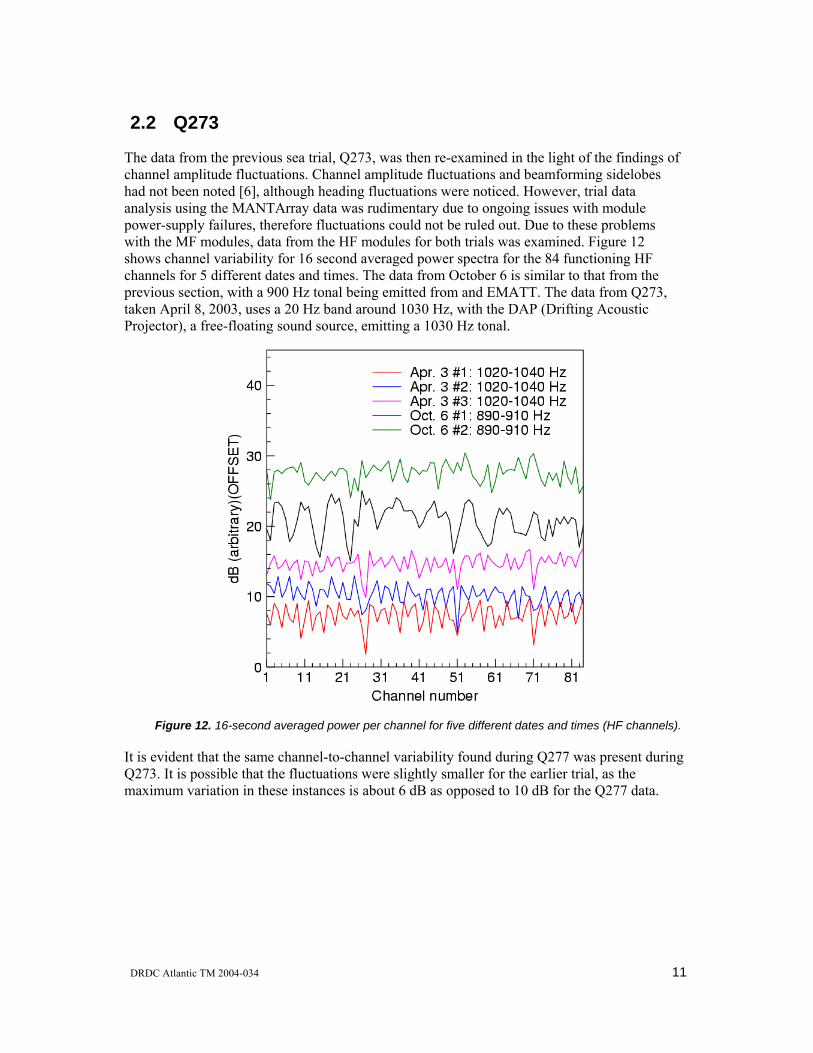
The data from the previous sea trial, Q273, was then re-examined in the light of the findings of channel amplitude fluctuations. Channel amplitude fluctuations and beamforming sidelobes had not been noted [6], although heading fluctuations were noticed. However, trial data analysis using the MANTArray data was rudimentary due to ongoing issues with module power-supply failures, therefore fluctuations could not be ruled out. Due to these problems with the MF modules, data from the HF modules for both trials was examined. Figure 12 shows channel variability for 16 second averaged power spectra for the 84 functioning HF channels for 5 different dates and times. The data from October 6 is similar to that from the previous section, with a 900 Hz tonal being emitted from and EMATT. The data from Q273, taken April 8, 2003, uses a 20 Hz band around 1030 Hz, with the DAP (Drifting Acoustic Projector), a free-floating sound source, emitting a 1030 Hz tonal.
Figure 12. 16-second averaged power per channel for five different dates and times (HF channels).
It is evident that the same channel-to-channel variability found during Q277 was present during Q273. It is possible that the fluctuations were slightly smaller for the earlier trial, as the maximum variation in these instances is about 6 dB as opposed to 10 dB for the Q277 data.
DRDC Atlantic TM 2004-034 11
3. Testing and Results
3.1 In-air tests
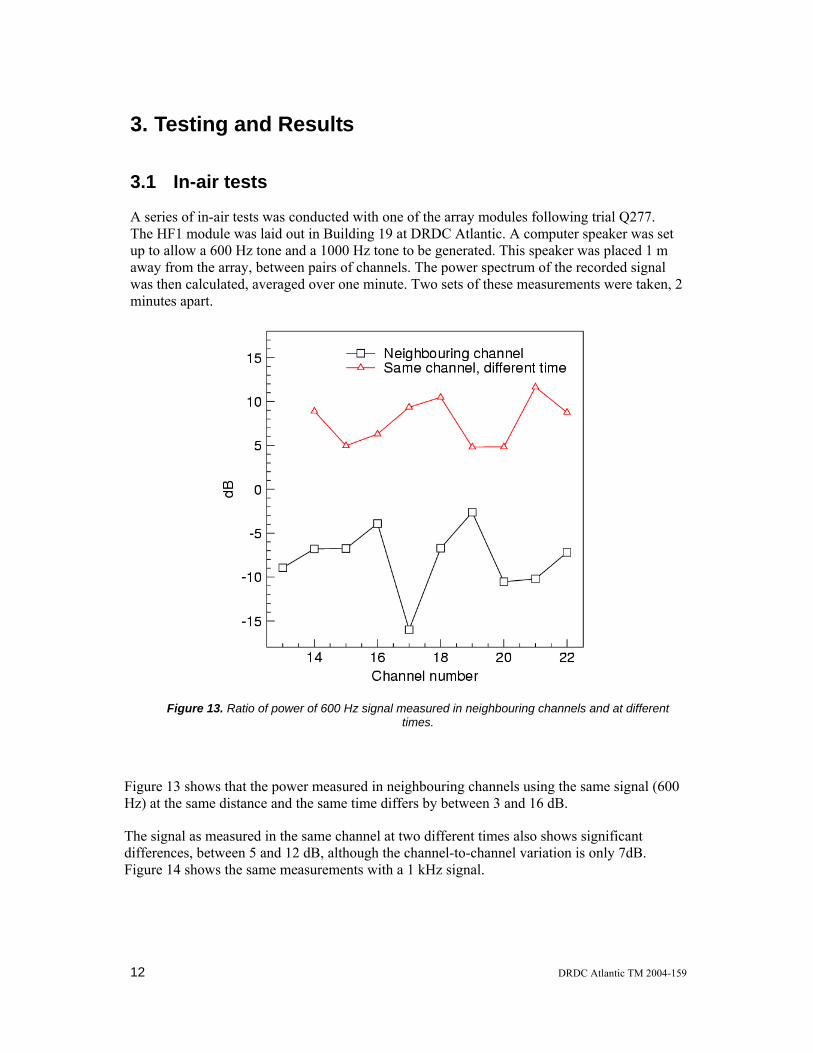
A series of in-air tests was conducted with one of the array modules following trial Q277. The HF1 module was laid out in Building 19 at DRDC Atlantic. A computer speaker was set up to allow a 600 Hz tone and a 1000 Hz tone to be generated. This speaker was placed 1 m away from the array, between pairs of channels. The power spectrum of the recorded signal was then calculated, averaged over one minute. Two sets of these measurements were taken, 2 minutes apart.
Figure 13. Ratio of power of 600 Hz signal measured in neighbouring channels and at different
times.
Figure 13 shows that the power measured in neighbouring channels using the same signal (600 Hz) at the same distance and the same time differs by between 3 and 16 dB.
The signal as measured in the same channel at two different times also shows significant differences, between 5 and 12 dB, although the channel-to-channel variation is only 7dB. Figure 14 shows the same measurements with a 1 kHz signal.
12 DRDC Atlantic TM 2004-159
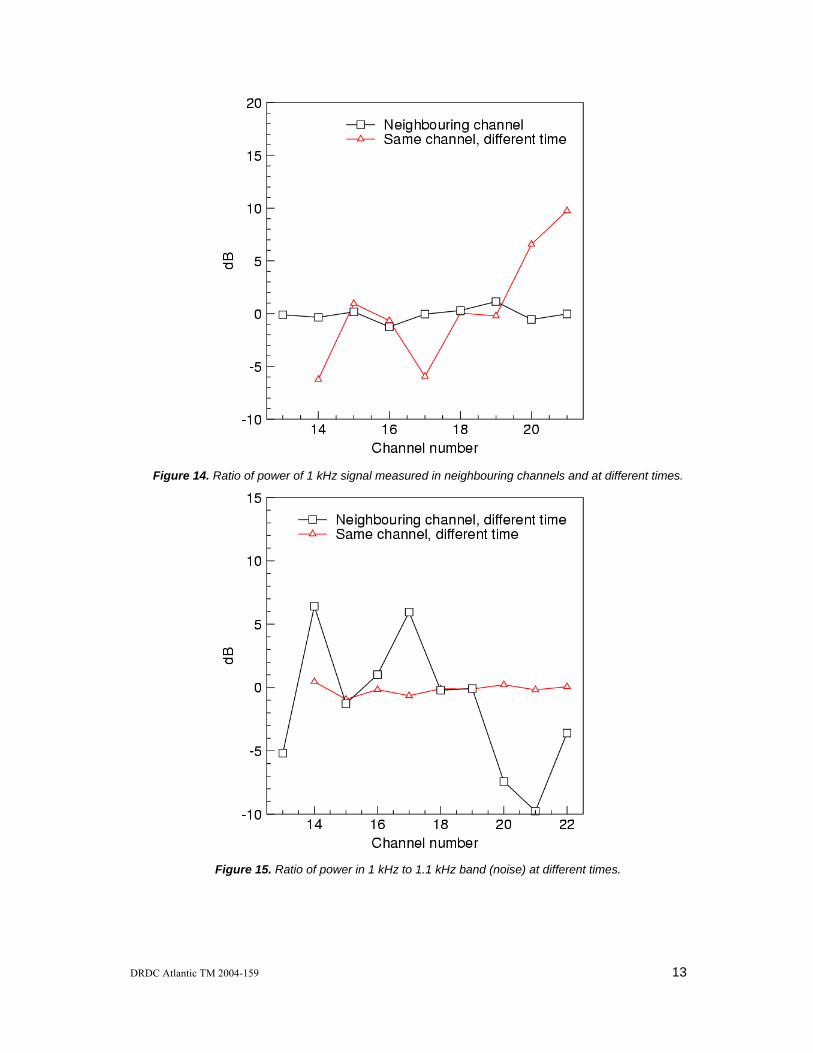
Figure 14. Ratio of power of 1 kHz signal measured in neighbouring channels and at different times.
Figure 15. Ratio of power in 1 kHz to 1.1 kHz band (noise) at different times.
DRDC Atlantic TM 2004-159 13
The 1 kHz signal seems to be measured at similar levels in neighbouring channels with a significant difference in time-to-time levels. Ambient noise in the frequency band 1 kHz to 1.1 kHz was also measured (Figure 15). It is notable that the noise as measured at different times in each channel remains nearly constant, but the channel-to-channel variation is between 7 and –10 dB.
The stability of the power level generated in our experimental setup was questionable. In addition, the acoustic environment was not ideal. Therefore, it is difficult to draw any conclusions from this series of in-air tests. Likewise, a further series of in-air tests, using a speaker enclosure of 4" PVC pipe coupled closely to the array module, was found to be inconclusive.
3.2 Hydrophone/pre-amp calibrations
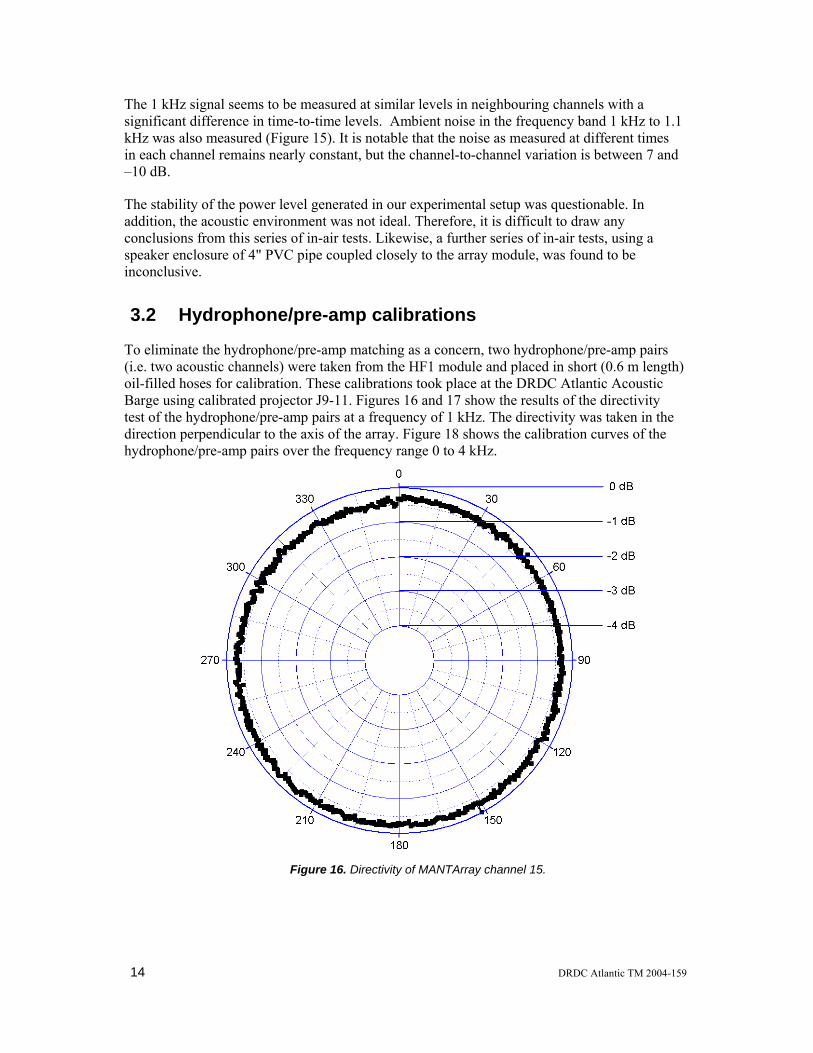
To eliminate the hydrophone/pre-amp matching as a concern, two hydrophone/pre-amp pairs (i.e. two acoustic channels) were taken from the HF1 module and placed in short (0.6 m length) oil-filled hoses for calibration. These calibrations took place at the DRDC Atlantic Acoustic Barge using calibrated projector J9-11. Figures 16 and 17 show the results of the directivity test of the hydrophone/pre-amp pairs at a frequency of 1 kHz. The directivity was taken in the direction perpendicular to the axis of the array. Figure 18 shows the calibration curves of the hydrophone/pre-amp pairs over the frequency range 0 to 4 kHz.
Figure 16. Directivity of MANTArray channel 15.
14 DRDC Atlantic TM 2004-159
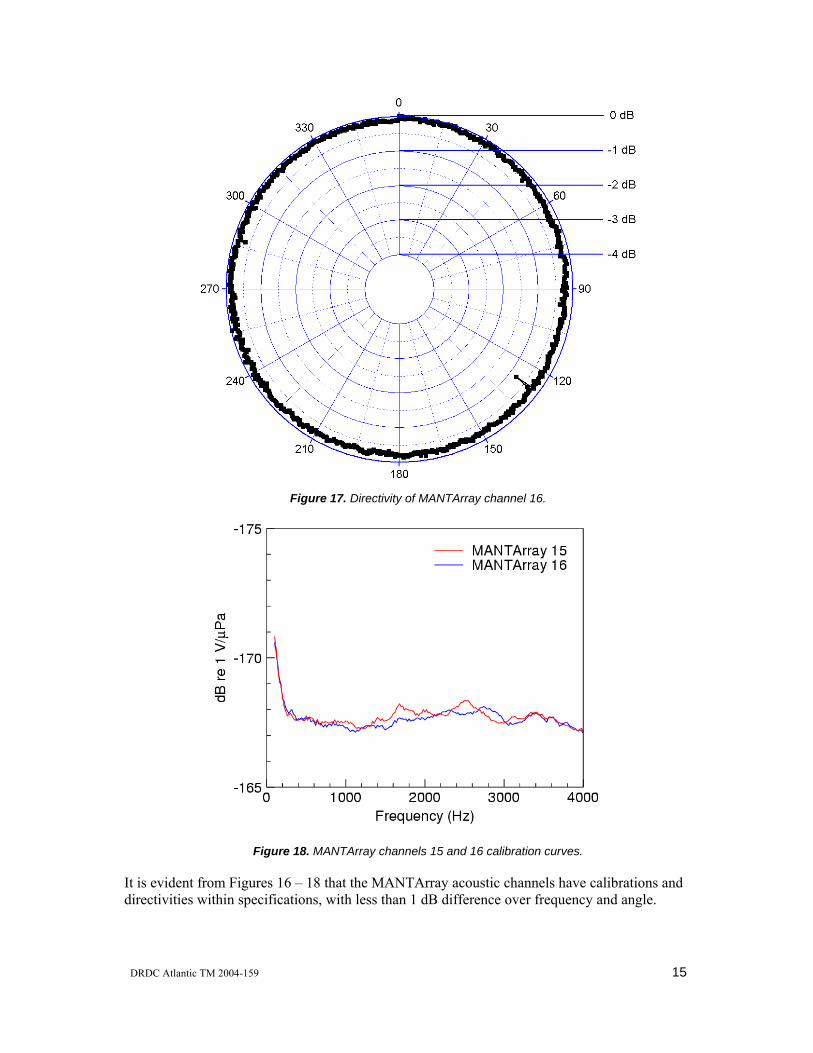
Figure 17. Directivity of MANTArray channel 16.
Figure 18. MANTArray channels 15 and 16 calibration curves.
It is evident from Figures 16 – 18 that the MANTArray acoustic channels have calibrations and directivities within specifications, with less than 1 dB difference over frequency and angle.
DRDC Atlantic TM 2004-159 15
3.3 Signal injection
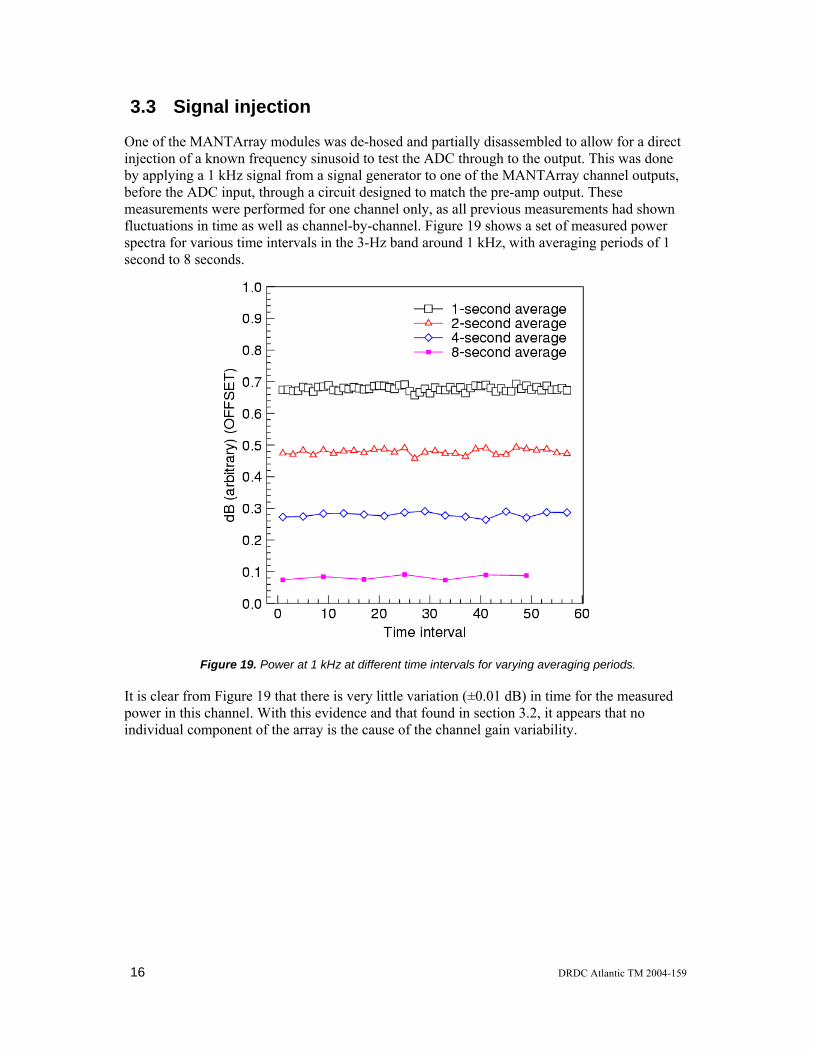
One of the MANTArray modules was de-hosed and partially disassembled to allow for a direct injection of a known frequency sinusoid to test the ADC through to the output. This was done by applying a 1 kHz signal from a signal generator to one of the MANTArray channel outputs, before the ADC input, through a circuit designed to match the pre-amp output. These measurements were performed for one channel only, as all previous measurements had shown fluctuations in time as well as channel-by-channel. Figure 19 shows a set of measured power spectra for various time intervals in the 3-Hz band around 1 kHz, with averaging periods of 1 second to 8 seconds.
Figure 19. Power at 1 kHz at different time intervals for varying averaging periods.
It is clear from Figure 19 that there is very little variation (±0.01 dB) in time for the measured power in this channel. With this evidence and that found in section 3.2, it appears that no individual component of the array is the cause of the channel gain variability.
16 DRDC Atlantic TM 2004-159
3.4 Very-low-frequency high amplitude signal
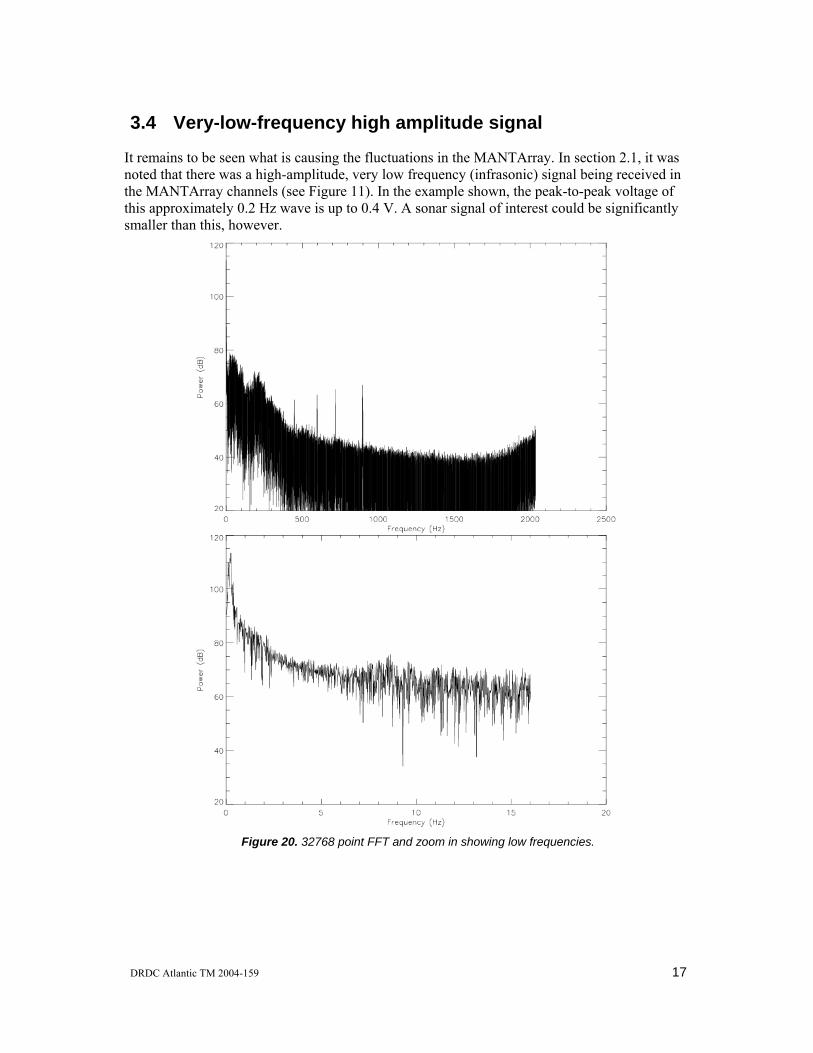
It remains to be seen what is causing the fluctuations in the MANTArray. In section 2.1, it was noted that there was a high-amplitude, very low frequency (infrasonic) signal being received in the MANTArray channels (see Figure 11). In the example shown, the peak-to-peak voltage of this approximately 0.2 Hz wave is up to 0.4 V. A sonar signal of interest could be significantly smaller than this, however.
Figure 20. 32768 point FFT and zoom in showing low frequencies.
DRDC Atlantic TM 2004-159 17
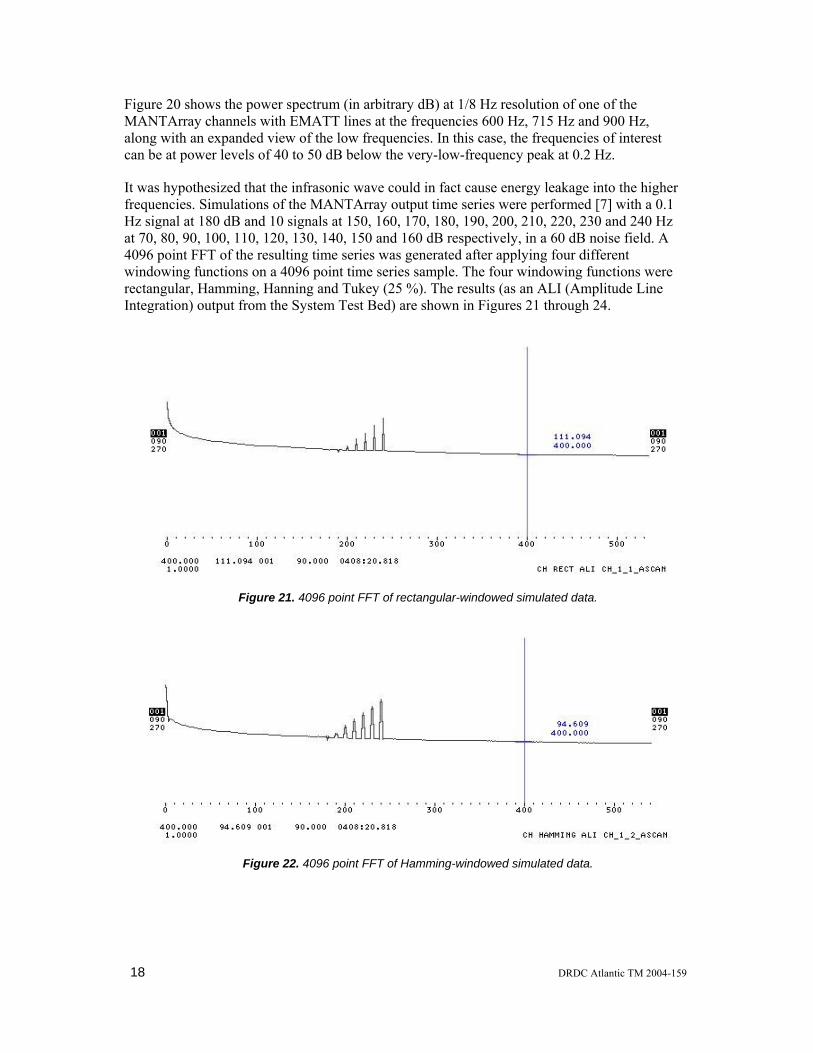
Figure 20 shows the power spectrum (in arbitrary dB) at 1/8 Hz resolution of one of the MANTArray channels with EMATT lines at the frequencies 600 Hz, 715 Hz and 900 Hz, along with an expanded view of the low frequencies. In this case, the frequencies of interest can be at power levels of 40 to 50 dB below the very-low-frequency peak at 0.2 Hz.
It was hypothesized that the infrasonic wave could in fact cause energy leakage into the higher frequencies. Simulations of the MANTArray output time series were performed [7] with a 0.1 Hz signal at 180 dB and 10 signals at 150, 160, 170, 180, 190, 200, 210, 220, 230 and 240 Hz at 70, 80, 90, 100, 110, 120, 130, 140, 150 and 160 dB respectively, in a 60 dB noise field. A 4096 point FFT of the resulting time series was generated after applying four different windowing functions on a 4096 point time series sample. The four windowing functions were rectangular, Hamming, Hanning and Tukey (25 %). The results (as an ALI (Amplitude Line Integration) output from the System Test Bed) are shown in Figures 21 through 24.
Figure 21. 4096 point FFT of rectangular-windowed simulated data.
Figure 22. 4096 point FFT of Hamming-windowed simulated data.
18 DRDC Atlantic TM 2004-159
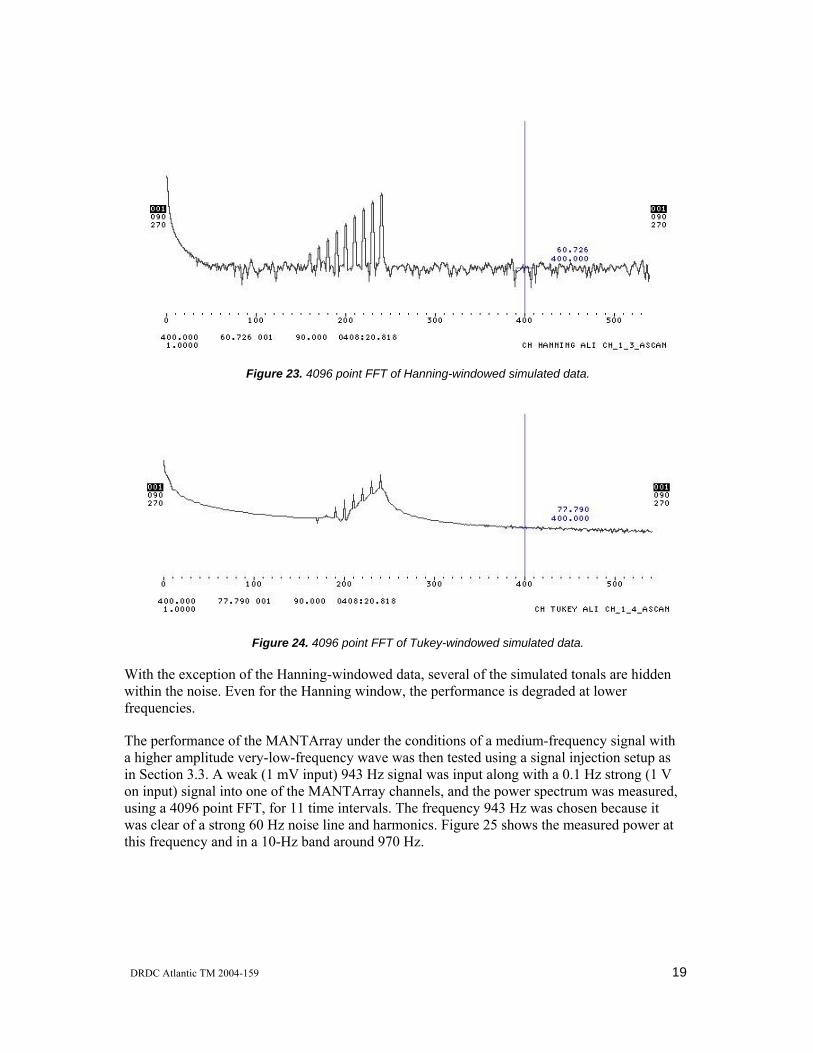
Figure 23. 4096 point FFT of Hanning-windowed simulated data.
Figure 24. 4096 point FFT of Tukey-windowed simulated data.
With the exception of the Hanning-windowed data, several of the simulated tonals are hidden within the noise. Even for the Hanning window, the performance is degraded at lower frequencies.
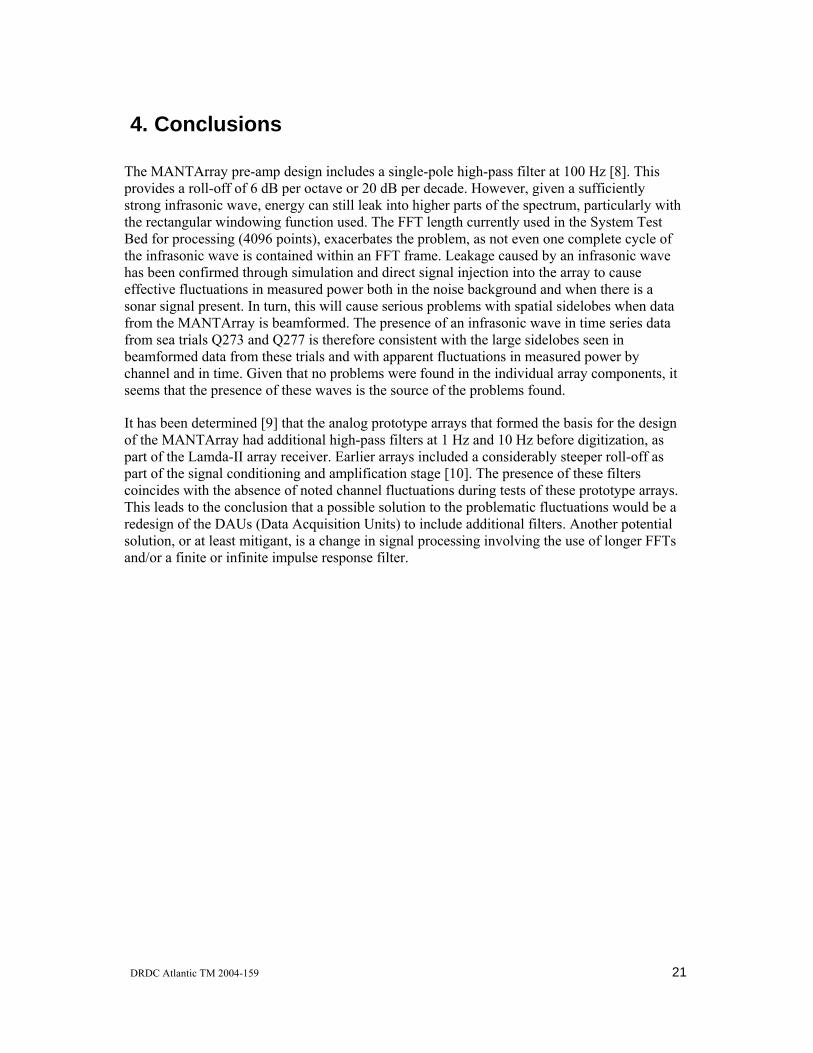
The performance of the MANTArray under the conditions of a medium-frequency signal with a higher amplitude very-low-frequency wave was then tested using a signal injection setup as in Section 3.3. A weak (1 mV input) 943 Hz signal was input along with a 0.1 Hz strong (1 V on input) signal into one of the MANTArray channels, and the power spectrum was measured, using a 4096 point FFT, for 11 time intervals. The frequency 943 Hz was chosen because it was clear of a strong 60 Hz noise line and harmonics. Figure 25 shows the measured power at this frequency and in a 10-Hz band around 970 Hz.
DRDC Atlantic TM 2004-159 19
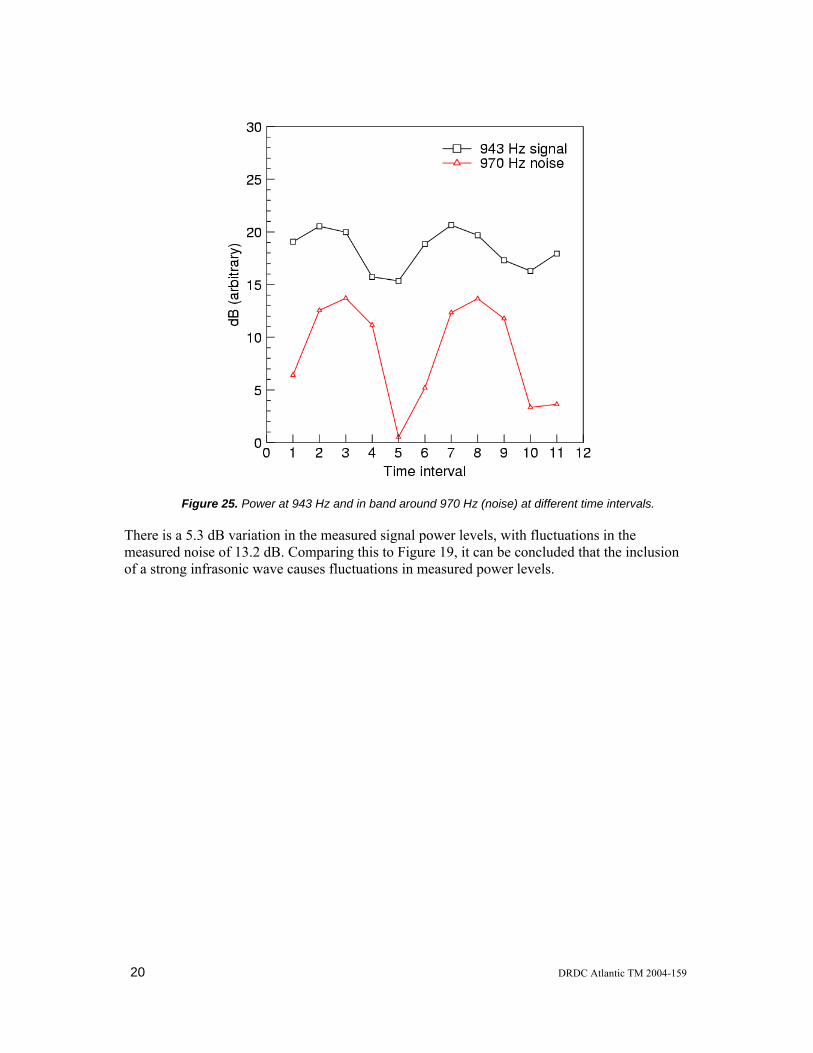
Figure 25. Power at 943 Hz and in band around 970 Hz (noise) at different time intervals.
There is a 5.3 dB variation in the measured signal power levels, with fluctuations in the measured noise of 13.2 dB. Comparing this to Figure 19, it can be concluded that the inclusion of a strong infrasonic wave causes fluctuations in measured power levels.
20 DRDC Atlantic TM 2004-159
4. Conclusions
The MANTArray pre-amp design includes a single-pole high-pass filter at 100 Hz [8]. This provides a roll-off of 6 dB per octave or 20 dB per decade. However, given a sufficiently strong infrasonic wave, energy can still leak into higher parts of the spectrum, particularly with the rectangular windowing function used. The FFT length currently used in the System Test Bed for processing (4096 points), exacerbates the problem, as not even one complete cycle of the infrasonic wave is contained within an FFT frame. Leakage caused by an infrasonic wave has been confirmed through simulation and direct signal injection into the array to cause effective fluctuations in measured power both in the noise background and when there is a sonar signal present. In turn, this will cause serious problems with spatial sidelobes when data from the MANTArray is beamformed. The presence of an infrasonic wave in time series data from sea trials Q273 and Q277 is therefore consistent with the large sidelobes seen in beamformed data from these trials and with apparent fluctuations in measured power by channel and in time. Given that no problems were found in the individual array components, it seems that the presence of these waves is the source of the problems found.
It has been determined [9] that the analog prototype arrays that formed the basis for the design of the MANTArray had additional high-pass filters at 1 Hz and 10 Hz before digitization, as part of the Lamda-II array receiver. Earlier arrays included a considerably steeper roll-off as part of the signal conditioning and amplification stage [10]. The presence of these filters coincides with the absence of noted channel fluctuations during tests of these prototype arrays. This leads to the conclusion that a possible solution to the problematic fluctuations would be a redesign of the DAUs (Data Acquisition Units) to include additional filters. Another potential solution, or at least mitigant, is a change in signal processing involving the use of longer FFTs and/or a finite or infinite impulse response filter.
DRDC Atlantic TM 2004-159 21
5. References
1. Ramsdale, D. J., Howerton R. A. (1980). Effect of element failure and random errors in amplitude and phase on the sidelobe level attainable with a linear array. J. Acoust. Soc. Am., 68(3), 901-906.
2. Rondinelli, L. A. (1959). Effects of Random Errors on the Performance of Antenna Arrays of Many Elements. IRE Natl. Conv. Rec.7, 174-189.
3. Wescan Systems Ltd. (2002). Cycle 3 – System Design Document (SDD) 4A51809. Wescan Systems Ltd.
4. General Dynamics Canada (2004). TIAPS Q277 Trial Report. (DRDC Atlantic TN2003-261). General Dynamics Canada.
5. Bristo, L. (2003). TEST SPECIFICATION FOR THE MANTArray NAS MODULE 416B495G01. (Specification number 4A51824). Wescan Systems Ltd.
6. Gosse, E. (2003). TIAPS Task 3 Report – Engineering Sea Trials. (DRDC Atlantic CR2003-145). General Dynamics Canada.
7. Inglis, G. (2004). Private communication.
8. Gorling, L. (2002). MANTArray Cycle 1 Design Cycle Report Volume 1. (Technical Report No. 1470 Rev. C). Wescan Systems Ltd.
9. Hazen, D. (2004). Private communication.
10. Crowe, D. V. (1987) Q-151 Cruise Quest Logbook. Unpublished.
22 DRDC Atlantic TM 2004-159
List of symbols/abbreviations/acronyms/initialisms
ADC Analog-to-digital converter
DAP Drifting Acoustic Projector
DAU Data Acquisition Unit
DND Department of National Defence
EMATT Expendable Mobile ASW Training Target
FFT Fast Fourier Transform
HF High frequency
MANTArray Multi-Aperture Networked Towed Array
MF Medium frequency
NAS Non-Acoustic Sensor
NBC Neutrally Buoyant Cable
TIAPS Towed Integrated Active-Passive Sonar
VIM Vibration Isolation Module
DRDC Atlantic TM 2004-159 23
Distribution list Document No.: DRDC Atlantic TM2004-159 LIST PART 1: CONTROLLED BY DRDC Atlantic LIBRARY 2 DRDC Atlantic LIBRARY FILE COPIES 3 DRDC Atlantic LIBRARY (SPARES) 3 AUTHORS 1 D. Hazen 1 J. Theriault ___________________ 10 TOTAL LIST PART 1 -------------------------------------------------------------------------------------------------------- LIST PART 2: DISTRIBUTED BY DRDKIM 3 1 NDHQ/ CRAD/ DRDKIM 3 (scanned and stored as black & white image, low resolution - laser reprints available on request ) * Full mailing address must be supplied for units other than NDHQ ___________________ 1 TOTAL LIST PART 2 11 TOTAL COPIES REQUIRED -------------------------------------------------------------------------------------------------------- Original document held by DRDC Atlantic Drafting Office Any requests by DRDC Atlantic staff for extra copies of this document should be directed to the DRDC Atlantic LIBRARY.
24 DRDC Atlantic TM 2004-159
DRDC Atlantic mod. May 02
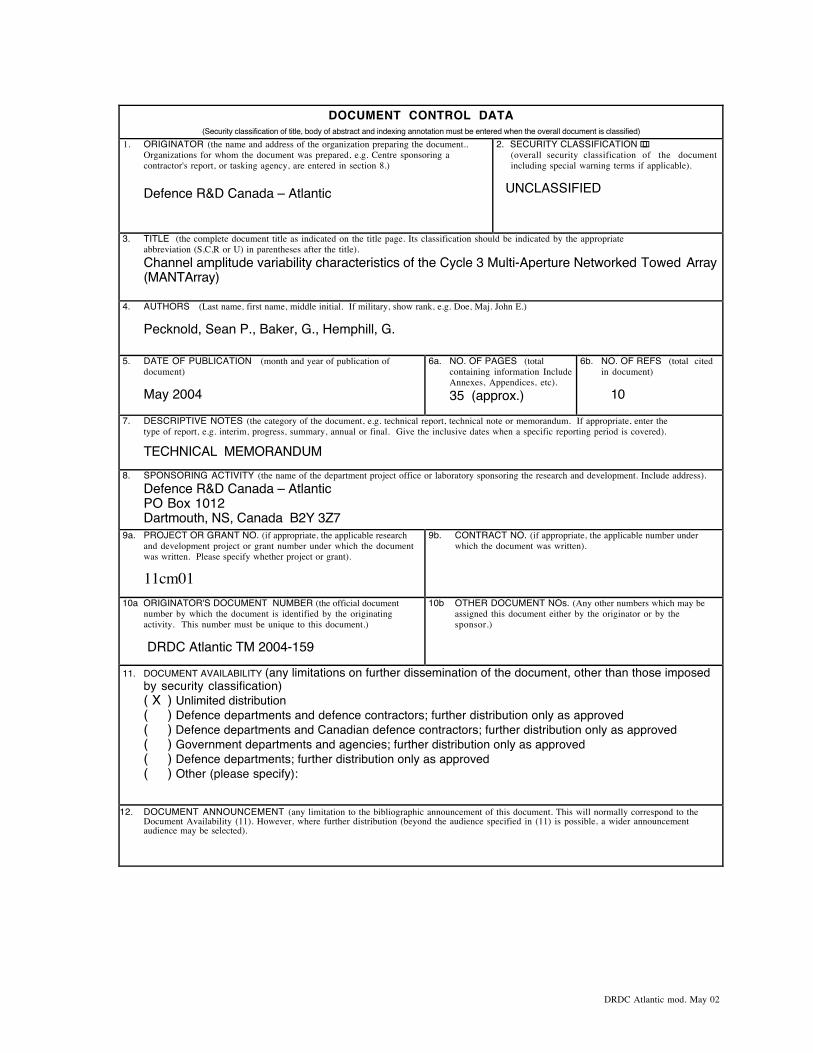
DOCUMENT CONTROL DATA(Security classification of title, body of abstract and indexing annotation must be entered when the overall document is classified)
1. ORIGINATOR (the name and address of the organization preparing the document..Organizations for whom the document was prepared, e.g. Centre sponsoring acontractor's report, or tasking agency, are entered in section 8.)
Defence R&D Canada – Atlantic
2. SECURITY CLASSIFICATION !!(overall security classification of the document including special warning terms if applicable).
UNCLASSIFIED
3. TITLE (the complete document title as indicated on the title page. Its classification should be indicated by the appropriate abbreviation (S,C,R or U) in parentheses after the title).
Channel amplitude variability characteristics of the Cycle 3 Multi-Aperture Networked Towed Array(MANTArray)
4. AUTHORS (Last name, first name, middle initial. If military, show rank, e.g. Doe, Maj. John E.)
Pecknold, Sean P., Baker, G., Hemphill, G.
5. DATE OF PUBLICATION (month and year of publication ofdocument)
May 2004
6a. NO. OF PAGES (totalcontaining information IncludeAnnexes, Appendices, etc).35 (approx.)
6b. NO. OF REFS (total citedin document)
10
7. DESCRIPTIVE NOTES (the category of the document, e.g. technical report, technical note or memorandum. If appropriate, enter thetype of report, e.g. interim, progress, summary, annual or final. Give the inclusive dates when a specific reporting period is covered).
TECHNICAL MEMORANDUM 8. SPONSORING ACTIVITY (the name of the department project office or laboratory sponsoring the research and development. Include address).
Defence R&D Canada – AtlanticPO Box 1012Dartmouth, NS, Canada B2Y 3Z7
9a. PROJECT OR GRANT NO. (if appropriate, the applicable researchand development project or grant number under which the documentwas written. Please specify whether project or grant).
11cm01
9b. CONTRACT NO. (if appropriate, the applicable number underwhich the document was written).
10a ORIGINATOR'S DOCUMENT NUMBER (the official documentnumber by which the document is identified by the originatingactivity. This number must be unique to this document.)
DRDC Atlantic TM 2004-159
10b OTHER DOCUMENT NOs. (Any other numbers which may beassigned this document either by the originator or by thesponsor.)
11. DOCUMENT AVAILABILITY (any limitations on further dissemination of the document, other than those imposedby security classification)( X ) Unlimited distribution( ) Defence departments and defence contractors; further distribution only as approved( ) Defence departments and Canadian defence contractors; further distribution only as approved( ) Government departments and agencies; further distribution only as approved( ) Defence departments; further distribution only as approved( ) Other (please specify):
12. DOCUMENT ANNOUNCEMENT (any limitation to the bibliographic announcement of this document. This will normally correspond to theDocument Availability (11). However, where further distribution (beyond the audience specified in (11) is possible, a wider announcementaudience may be selected).
DRDC Atlantic mod. May 02
13. ABSTRACT (a brief and factual summary of the document. It may also appear elsewhere in the body of the document itself. Itis highly desirable that the abstract of classified documents be unclassified. Each paragraph of the abstract shall begin with anindication of the security classification of the information in the paragraph (unless the document itself is unclassified) representedas (S), (C), (R), or (U). It is not necessary to include here abstracts in both official languages unless the text is bilingual).
An analysis of time series data collected during two DRDC Atlantic sea trials revealedsignificant spatial and temporal variability measured by the MANTArray. It wasdetermined that this variability was consistent with the presence of a high-amplitudeinfrasonic wave, with a frequency of approximately 0.2 Hz. It is proposed that additionalfiltering, either hardware or in the processing stream, may remedy this problem.
14. KEYWORDS, DESCRIPTORS or IDENTIFIERS (technically meaningful terms or short phrases that characterize adocument and could be helpful in cataloguing the document. They should be selected so that no security classification isrequired. Identifiers, such as equipment model designation, trade name, military project code name, geographic location mayalso be included. If possible keywords should be selected from a published thesaurus. e.g. Thesaurus of Engineering andScientific Terms (TEST) and that thesaurus-identified. If it not possible to select indexing terms which are Unclassified, theclassification of each should be indicated as with the title).
Towed ArraysBeamformingSignal Processing

This page intentionally left blank.