Embed Size (px)
Citation preview
Short Communication
Rate-Dependent Repolarization Dynamics:
Correlation between Electrocardiographic T Wave and U Wave
Shioto Yasuda,, MD.1,2, Chiharu Yoshida, MD.1, Satoko Ideishi, MD.1,
Kei Irie, MD.1, Shohei Moriyama, MD.1, Mitsuhiro Fukata, MD.1,
Taku Yokoyama, MD.1, Takeshi Arita, MD.1, Keita Odashiro, MD.1,
Yoichiro Hiramoto, MD.2, Toru Maruyama, MD.1,2, and Koichi Akashi, MD.1
1 Heart Center, Kyushu University Hospital, Fukuoka 812-8582, Japan.
2 Department of Medicine, Koga Central Hospital, Koga 811-3101, Japan.
Running Head: Rate-dependent T-U waves
Word count of the main title: 11 words and 97 characters including spaces.
Word count of the running head: 3 words and 24 characters including spaces.
Word count for the main text: 2063 words, Number of Tables: 0, Number of Figures: 3
Address correspondence to: Toru Maruyama, MD., PhD.
Heart Center, Kyushu University Hospital, Fukuoka 812-8582, Japan
Tel: +81-92-583-7863, Fax: +81-92-592-2866, e-mail address: [email protected]
u.ac.jp
Funding: The authors have declared no financial support.
Conflict of Interest: The authors have declared no competing interest.
Authorship: All authors declare that each author listed has contributed to the creation of this
manuscript to a degree worthy of authorship. All authors had access to the data and a role in
writing this manuscript.
Abstract
1
1
2
3
4
5
6
7
8
9
10
11
12
13
14
15
16
17
18
19
20
21
22
23
24
12

U wave is the last ventricular repolarization component in electrocardiogram
(ECG). Rate-dependent amplitude adaptation of U wave was less known relative to that
of T wave. We experienced a patient presenting palpitation and showing ECG
associated with clear physiologic upward U wave. Echocardiogram demonstrated no
structural heart diseases and normal left ventricular (LV) function. T and U wave
amplitudes were simultaneously plotted as a function of the preceding RR intervals
using ambulatory ECG. U wave amplitude was augmented monotonously according to
an increase of the preceding RR interval, whereas T wave amplitude was increased to
the maximum level in the RR interval ranging from 1,000 to 1,500 msec and decreased
to a steady-state level as RR interval was further prolonged. These indicate that rate-
dependent repolarization gradient in T wave differs from that in physiologic U wave,
which is mediated by mechano-electrical coupling under pause-dependent LV pressure
and/or volume augmentation.
(149 words)
Key words: T wave, U wave, Rate-dependency, wave amplitude
Introduction
T wave amplitude is dependent greatly on the heart rate. This amplitude variability
2
25
26
27
28
29
30
31
32
33
34
35
36
37
38
39
40
41
34

is useful for risk assessment of the occurrence and recurrence of ventricular
tachyarrhythmia in patients with and without structural heart diseases [1-3], whereas U
wave amplitude dynamicity is not fully investigated. U wave is a small wave component
followed by T wave in the electrocardiogram (ECG). Polarity of the U wave determines
its abnormalities, i.e., positive U wave is generally physiologic, whereas negative U
wave is pathologic [4]. The amplitude of the physiologic U wave is less than one fourth
of the positive T wave amplitude [5]. However, rate-dependent U wave dynamics
remains unclear in comparison with T wave dynamics. We experienced an old female
patient showing clear physiologic U wave and analyzed rate-dependent dynamics of
both T and U waves simultaneously.
Case Description
A 80-year-old woman complained of palpitation and visited our hospital in 2012.
On her first visit to our hospital, the results of her serum chemistry were unremarkable,
i.e., serum potassium concentration was 4.0 mEq/l, and calcium concentration was 9.0
mg/dl. ECG showed respectable positive U wave associated with normal sinus rhythm
(heart rate of 50 beats per minute) and normal QRS axis. Automatic measurement of
3
42
43
44
45
46
47
48
49
50
51
52
53
54
55
56
57
56

absolute and rate-corrected QT interval indicated 445 msec and 410 msec, respectively
(Figure 1). QT interval rate correction was based on Bazett’s formula (QTc =
QT/RR1/2). Transthoracic echocardiogram demonstrated normal left ventricular (LV)
function without any structural heart diseases or false tendons. Papillary muscles size
was intermediate. Two-channel ambulatory ECG (Digital Walk, FM-160, Fukuda
Denshi, Tokyo, Japan) demonstrated 69,980 total heart beats per day, and average heart
rate was 49 beats per minute associated with nocturnal sino-atrial conduction block and
repetitive premature supraventricular contractions (PSVCs). Based on symptom diary,
her palpitation was considered to be due to the short runs of PSVCs, and antiarrhythmic
agents (diltiazem 60 mg per day or bisoprolol 1.25 mg per day) were prescribed. U
wave polarity was persistently positive. She complained no symptoms except for
palpitation and demonstrated no signs susceptible for heart failure and coronary heart
disease. Ambulatory ECG showed no diurnal ST-T changes. These indicate that her U
wave is not pathological.
Ambulatory Data Analyses
Based on the ambulatory monitoring applied to this case, U wave amplitude as well
4
58
59
60
61
62
63
64
65
66
67
68
69
70
71
72
73
78

as T wave amplitude was plotted as a function of preceding RR interval. Ambulatory
lead showing greater T and U wave complex (CM5) was adopted. On this analysis,
ECG data satisfying the following three criteria were acceptable; 1) ambulatory data
showing clear positive T wave and consecutive physiologic U wave without baseline
drift, and 2) data demonstrating that incisura between the T wave and U wave was
above the baseline, 3) whether sinus beats or PSVCs did not matter if the beats satisfied
the above two conditions.
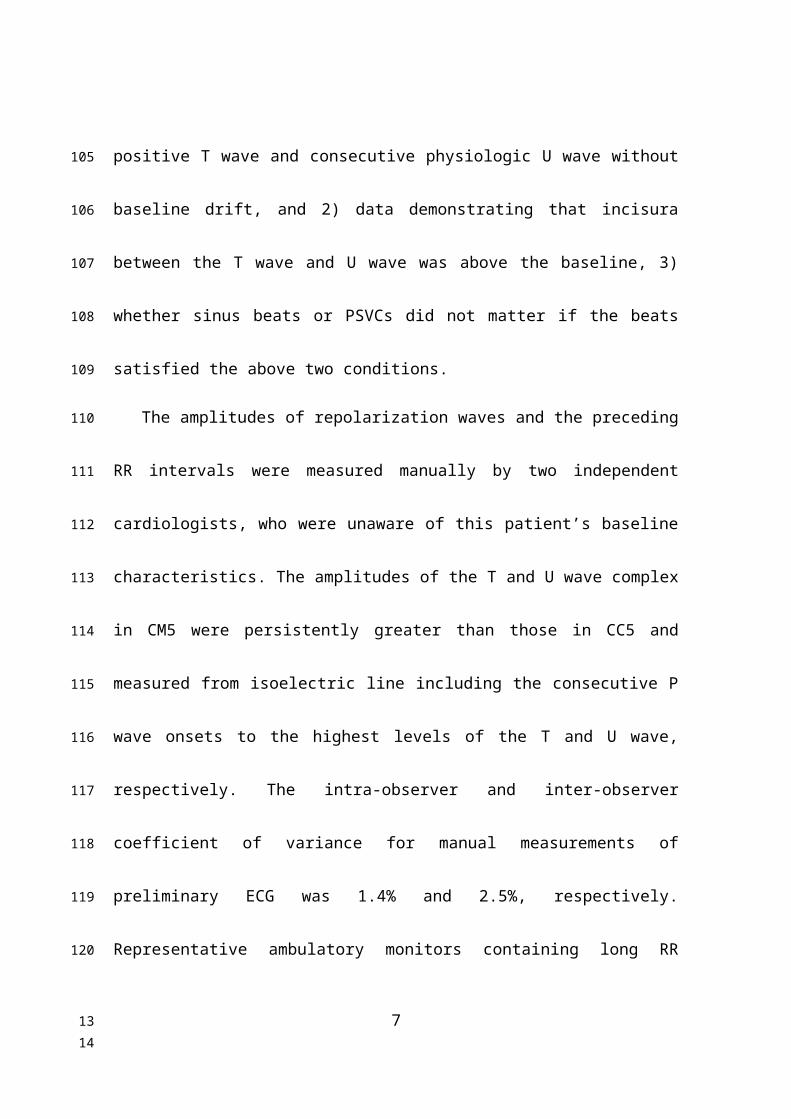
The amplitudes of repolarization waves and the preceding RR intervals were
measured manually by two independent cardiologists, who were unaware of this
patient’s baseline characteristics. The amplitudes of the T and U wave complex in CM5
were persistently greater than those in CC5 and measured from isoelectric line including
the consecutive P wave onsets to the highest levels of the T and U wave, respectively.
The intra-observer and inter-observer coefficient of variance for manual measurements
of preliminary ECG was 1.4% and 2.5%, respectively. Representative ambulatory
monitors containing long RR intervals were demonstrated (Figure 2). Repetitive PSVCs
yielded compensatory pause, and pause-dependent behavior of T wave amplitude
5
74
75
76
77
78
79
80
81
82
83
84
85
86
87
88
89
910

differed from that of U wave. The amplitude of T wave preceded by long pause was
smaller than that of the preceding T wave, whereas the amplitude of the corresponding
U wave was greater than that of the preceding U wave (Figure 2A). These phenomena
were observed also immediately after the sino-atrial block (Figure 2B).
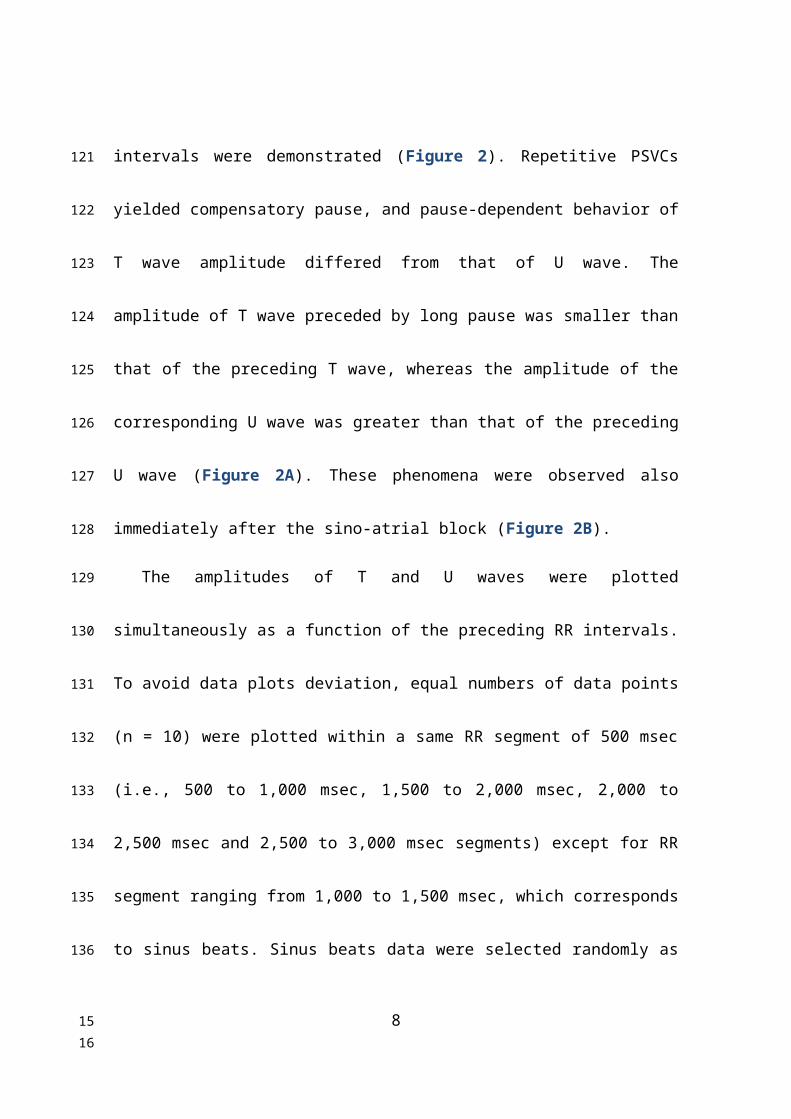
The amplitudes of T and U waves were plotted simultaneously as a function of the
preceding RR intervals. To avoid data plots deviation, equal numbers of data points (n =
10) were plotted within a same RR segment of 500 msec (i.e., 500 to 1,000 msec, 1,500
to 2,000 msec, 2,000 to 2,500 msec and 2,500 to 3,000 msec segments) except for RR
segment ranging from 1,000 to 1,500 msec, which corresponds to sinus beats. Sinus
beats data were selected randomly as one datum sampling of every hour segment (n =
20), if aforementioned inclusion criteria were met. This trial of random sampling was
repeated, and the number of this trial was 10. Inter-trial variance of sampled data (n =
60 in one trial) showed 8.2%, which was considered to satisfy the multiple random
sampling validation. Least square method was applied to fit the scattered plots to
polynomial regression curves by using Microsoft Excel 2010 (Redmond, WA, USA),
and regression curve showing the greatest correlation of coefficient (R) was accepted.
6
90
91
92
93
94
95
96
97
98
99
100
101
102
103
104
105
1112
The amplitudes of both T and U waves were abbreviated according to the shortening of
the preceding RR interval less than 1,000 msec as observed in the occurrence of PSVCs.
However, the behaviors of repolarization dynamics under the preceding RR interval
ranging from 1,000 to 1,500 msec in T wave were quite different from those of
physiologic U wave. The amplitude of T wave in this RR interval range was scattered
but was the maximum, whereas the amplitude of U wave was augmented as the RR
interval was lengthened. According to the further prolongation of the preceding RR
interval, T wave amplitude was diminished and saturated to the steady-state amplitude
around 0.6 mV. On the other hand, physiologic U wave amplitude was further
augmented and reached to the maximum level of approximately 0.25 mV (Figure 3).
Discussion
Physiologic U wave is sometimes clear in healthy individuals [4]. In this study
using ambulatory data in a female patient showing physiologic U wave, polynomial
7
106
107
108
109
110
111
112
113
114
115
116
117
118
119
120
121
122
1314
curve fitting was attempted (Figure 3), which yielded curvilinear augmentation of U
wave amplitude according to an increase of the preceding RR intervals (R2 = 0.51) and
the maximum hump of the T wave amplitude around the RR interval of 1,000 to 1,500
msec (R2 = 0.55).
Ventricular repolarization is greatly influenced by the preceding RR interval and
additionally modified by autonomic nervous system, electrolytes, gender and many
other factors. Rate-dependent adaptation of repolarization amplitude is useful for risk
stratification of ventricular tachyarrhythmia in patients with and without structural heart
diseases [1-3]. Among repolarization waves, genesis of T wave completely differs from
that of physiologic U wave [5], i.e., T wave represents overall ventricular repolarization,
whereas physiologic U wave reflects local repolarization of Purkinje fibers, M cell layer
or papillary muscles [4]. Electrophysiologic features of rate-dependency between the
whole ventricle and the local components underlie the differences between the T wave
and U wave dynamics.
Amplitude of the T wave is reduced according to an increase of the constant atrial
pacing rate, whereas that of the U wave remains unknown [6]. However, such rate-
8
123
124
125
126
127
128
129
130
131
132
133
134
135
136
137
138
1516

adaptation of repolarization wave amplitudes in steady state differs from dynamic
relationship between the wave amplitudes and the preceding RR intervals. As a matter
of fact, pause-dependent augmentation of repolarization wave amplitude was clear in
physiologic U wave but not in positive T wave (Figure 3). T wave amplitude in CM5 is
influenced by LV pressure and/or volume [7], i.e., T wave amplitude is augmented by
increased LV filling pressure and/or volume after the long RR intervals in healthy
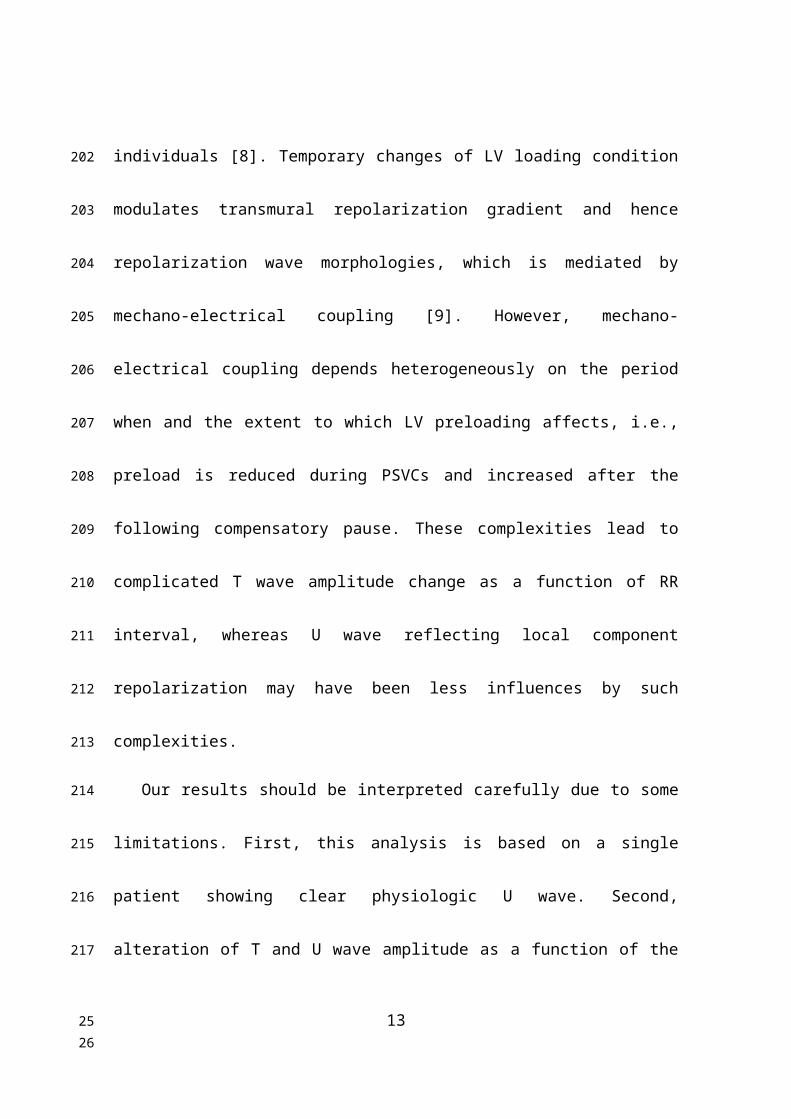
individuals [8]. Temporary changes of LV loading condition modulates transmural
repolarization gradient and hence repolarization wave morphologies, which is mediated
by mechano-electrical coupling [9]. However, mechano-electrical coupling depends
heterogeneously on the period when and the extent to which LV preloading affects, i.e.,
preload is reduced during PSVCs and increased after the following compensatory pause.
These complexities lead to complicated T wave amplitude change as a function of RR
interval, whereas U wave reflecting local component repolarization may have been less
influences by such complexities.
Our results should be interpreted carefully due to some limitations. First, this
analysis is based on a single patient showing clear physiologic U wave. Second,
9
139
140
141
142
143
144
145
146
147
148
149
150
151
152
153
154
1718

alteration of T and U wave amplitude as a function of the preceding RR interval was
mainly obtained at nighttime due to analytical inclusion criteria. Reportedly, nocturnal
rate-dependent repolarization dynamics are different from daytime ones [10]. Third
limitation is manual measurement of repolarization waves using analog ambulatory
data. In spite of such limitations, repolarization dynamics of physiologic U wave is
concluded to be different from that of T wave in structurally normal heart. Rate-
dependent U wave amplitude behavior in heart diseases is a matter of future study with
perspective of arhythmogenicity.
Acknowledgement:
The authors thank Ms. Kanae Nagao for secretarial assistance.
Funding:
None
10
155
156
157
158
159
160
161
162
163
164
165
166
167
168
169
170
171
172
1920

Conflicts of interest:
None
References
1. Sobue Y, Watanabe E, Yamamoto M, Sano K, Harigaya H, Okuda K, Ozaki Y. Beat-
to-beat variability of T-wave amplitude for the risk assessment of ventricular
tachyarrhythmia in patients without structural heart disease. Europace 2011; 13(11):
1612-1618
2. Baumert M, Lambert E, Vaddadi G, Sari CI, Esler M, Lambert G, Sanders P,
11
173
174
175
176
177
178
179
180
181
182
183
184
185
186
187
188
189
190
2122

Nalivaiko E. Cardiac repolarization variability in patients with postural tachycardia
syndrome during graded head-up tilt. Clin Neurophysiol 2011; 122(2): 405-409.
3. Couderc JP, Zareba W, McNitt S, Maison-Blanche P, Moss AJ. Repolarization
variability in the risk stratification of MADIT II patients. Europace 2007; 9(9): 717-
723.
4. Pérez Riera AR, Ferreira C, Filho CF, Ferreira M, Meneghini A, Uchida AH,
Schapachnik E, Dubner S, Zhang L. The enigmatic sixth wave of the
electrocardiogram: the U wave (review). Cardiol J 2008; 15(5): 408-421.
5. Hlaing T, DiMino T, Kowey PR, Yan GX. ECG repolarization waves: their genesis
and clinical implications. Ann Noninvas Electrocardiol 2005; 10(2): 211-223.
6. Vahedi F, Haney MF, Jensen SM, Näslund U, Bergfeldt L. Effect of heart rate on
ventricular repolarization in healthy individuals applying vectorcardiographic T
vector and T vector loop analysis. Ann Noninvasive Electrocardiol 2011; 16(3): 287-
294.
7. Aeschbacher S, Metin F, Bossard M, Schoen T, von Rotz M, Mettler H, Abächerli R,
Risch M, Risch L, Conen D. Relationships of electrocardiographic parameters with
12
191
192
193
194
195
196
197
198
199
200
201
202
203
204
205
206
207
2324
ambulatory hypertension in young and healthy adults. Int J Cardiol 2016; 202(1):
300-304.
8. Nakagawa M, Ooie T, Hara M, Ichinose M, Nobe S, Yonemochi H, Saikawa T.
Dynamics of T-U wave in patients with idiopathic ventricular tachycardia
originating from the right ventricular outflow tract. Pacing Clin Electrophysiol
2004; 27(2): 148-155.
9. Meijborg VMF, Belterman CNW, de Bakker JMT, Coronel R, Conrath CE.
Mechano-electric coupling, heterogeneity in repolarization and the
electrocardiographic T-wave. Prog Biophys Mol Biol 2017; 130: 356-364.
10. Extramiana F, Leenhardt A, Maison-Blanche P. ECG evaluation of ventricular
properties: the importance of cardiac cycle length. Ann Noninvasive Electrocardiol
2009; 14 (Suppl 1): S54-S59.
13
208
209
210
211
212
213
214
215
216
217
218
219
220
221
222
223
224
2526

Legends for Figures
Figure 1: Twelve-lead electrocardiogram (ECG) in a 80-year-old female patient
showing clear physiologic U-wave. Absolute QT interval was 445 msec, whereas rate-
corrected QT interval was 410 msec, respectively.
Figure 2: Ambulatory monitor of this patient demonstrating long RR intervals caused
by sino-atrial block at night (A) and preceding repetitive premature supraventricular
beats observed in the evening (B). Upper lead is CM5 and lower lead is CC5. Note the
pause-dependent increase in the U wave (open triangles) amplitude and decrease in the
T wave (closed triangles) amplitude observed in CM5 lead of both (A) and (B).
Figure 3: Scattered plots of the amplitudes of T wave and U wave as a function of the
14
225
226
227
228
229
230
231
232
233
234
235
236
237
238
239
240
241
242
2728

preceding RR intervals. Regression curves showed R2 of 0.55 for the T waves (closed
squares) and 0.51 for the U waves (closed circles), respectively.
(Total word count of 2063 words)
15
243
244
245
246
247
2930

Figure 1
16
248
249
3132
Figure 2 A
17
▼ ▼ ▽▽
250
251
252
253
254
3334

Figure 2 B
18
▽▽▼▼
255
256
257
258
259
260
3536

Figure 3
0 500 1000 1500 2000 2500 30000
0.2
0.4
0.6
0.8
1
1.2
R² = 0.512322062759414
R² = 0.545172752899131
RR interval (msec)
Wav
e Am
plitu
des
(
mV)
19
261
262
3738


![GEOLOGY AND GEOPHYSICS OF THE CIENEGA BASIN ...repository.azgs.az.gov/sites/default/files/dlio/files/...Ellett [1994] near 31 57'N 1l0034'W is greatly reduced in amplitude, with the](https://img.pdfslide.us/doc/110x75/5f842e30e8b6cf1977714108/geology-and-geophysics-of-the-cienega-basin-ellett-1994-near-31-57n-1l0034w.jpg)