Embed Size (px)
Citation preview
Changing Times, Version 18
Barry Edmonston, Director
Population Research Center The Urban Center
Portland State University Portland, OR 97207-0751
July 10, 2000
CHANGING TIMES, CHANGING ENROLLMENTS:
HOW RECENT DEMOGRAPHIC TRENDS ARE AFFECTING
ENROLLMENTS IN PORTLAND PUBLIC SCHOOLS
Prepared by the Population Research Center College of Urban and Public Affairs
Portland State University
Table of Contents
EXECUTIVE SUMMARY ............................................................................................................................ 1 Main Conclusions ....................................................................................................................................... 1 Narrative ..................................................................................................................................................... 1
BACKGROUND ............................................................................................................................................ 4 1. WHAT ARE THE ENROLLMENT TRENDS FOR PORTLAND PUBLIC SCHOOLS?....................... 4 2. WHAT ACCOUNTS FOR CHANGES IN PORTLAND PUBLIC SCHOOLS' ENROLLMENTS? ...... 7 3. WHAT ARE THE MAJOR POPULATION, HOUSING, AND HOUSEHOLD? .................................... 9
Age Composition ........................................................................................................................................ 9 Housing and Household Trends................................................................................................................ 10 Effects of Housing Changes on Enrollments ............................................................................................ 11
4. DO CHANGES IN BIRTHS ACCOUNT FOR ENROLLMENT TRENDS?......................................... 11 5. DO CHANGES IN MIGRATION ACCOUNT FOR ENROLLMENT TRENDS?................................ 13
1990 to 1996 Migration Trends ................................................................................................................ 13 1980 to 1990 Migration Trends ................................................................................................................ 14 Age Composition of In, Out, and Net Migrants........................................................................................ 14
6. DO CHANGES IN CHOICE OF PUBLIC, PRIVATE, AND HOME SCHOOLING ACCOUNT FOR ENROLLMENT TRENDS? ......................................................................................................................... 15
Private Schools ......................................................................................................................................... 16 Home Schooling ....................................................................................................................................... 16
7. DOES RECENT INTERNATIONAL MIGRATION AFFECT ENROLLMENTS AND THE STUDENT POPULATION? ........................................................................................................................ 17
Trends in International Migration to Metropolitan Portland, 1990 to 2000.............................................. 18 Enrollment in Public or Private Schools, 1996-1998................................................................................ 19 Home Language of Foreign Born Children .............................................................................................. 20 English Language Proficiency of Foreign Born Students ......................................................................... 20 Poverty Status of Foreign Born Students .................................................................................................. 21
APPENDICES .............................................................................................................................................. 23
Data Sources ............................................................................................................................................. 23 Demographic Model ................................................................................................................................. 23 Project Staff .............................................................................................................................................. 24

1
CHANGING TIMES, CHANGING ENROLLMENTS: HOW RECENT DEMOGRAPHIC TRENDS ARE AFFECTING ENROLLMENTS
IN PORTLAND PUBLIC SCHOOLS
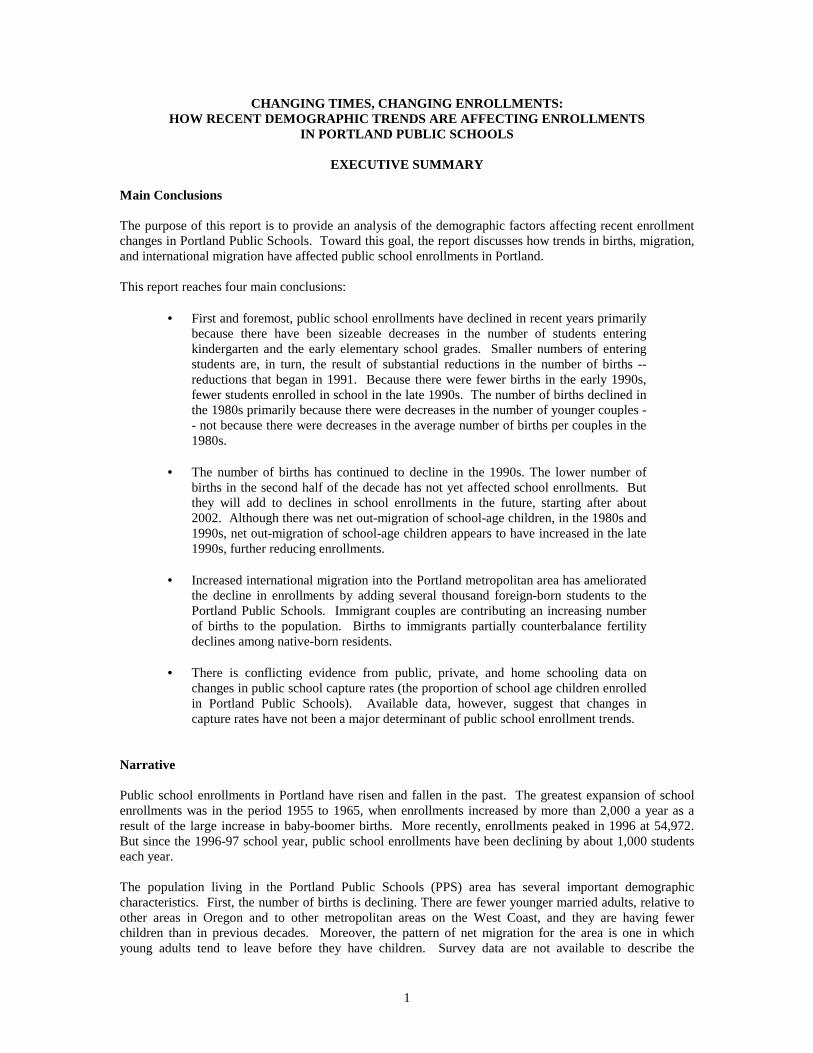
EXECUTIVE SUMMARY Main Conclusions The purpose of this report is to provide an analysis of the demographic factors affecting recent enrollment changes in Portland Public Schools. Toward this goal, the report discusses how trends in births, migration, and international migration have affected public school enrollments in Portland. This report reaches four main conclusions:
• First and foremost, public school enrollments have declined in recent years primarily because there have been sizeable decreases in the number of students entering kindergarten and the early elementary school grades. Smaller numbers of entering students are, in turn, the result of substantial reductions in the number of births -- reductions that began in 1991. Because there were fewer births in the early 1990s, fewer students enrolled in school in the late 1990s. The number of births declined in the 1980s primarily because there were decreases in the number of younger couples -- not because there were decreases in the average number of births per couples in the 1980s.
• The number of births has continued to decline in the 1990s. The lower number of
births in the second half of the decade has not yet affected school enrollments. But they will add to declines in school enrollments in the future, starting after about 2002. Although there was net out-migration of school-age children, in the 1980s and 1990s, net out-migration of school-age children appears to have increased in the late 1990s, further reducing enrollments.
• Increased international migration into the Portland metropolitan area has ameliorated
the decline in enrollments by adding several thousand foreign-born students to the Portland Public Schools. Immigrant couples are contributing an increasing number of births to the population. Births to immigrants partially counterbalance fertility declines among native-born residents.
• There is conflicting evidence from public, private, and home schooling data on
changes in public school capture rates (the proportion of school age children enrolled in Portland Public Schools). Available data, however, suggest that changes in capture rates have not been a major determinant of public school enrollment trends.
Narrative Public school enrollments in Portland have risen and fallen in the past. The greatest expansion of school enrollments was in the period 1955 to 1965, when enrollments increased by more than 2,000 a year as a result of the large increase in baby-boomer births. More recently, enrollments peaked in 1996 at 54,972. But since the 1996-97 school year, public school enrollments have been declining by about 1,000 students each year. The population living in the Portland Public Schools (PPS) area has several important demographic characteristics. First, the number of births is declining. There are fewer younger married adults, relative to other areas in Oregon and to other metropolitan areas on the West Coast, and they are having fewer children than in previous decades. Moreover, the pattern of net migration for the area is one in which young adults tend to leave before they have children. Survey data are not available to describe the
2
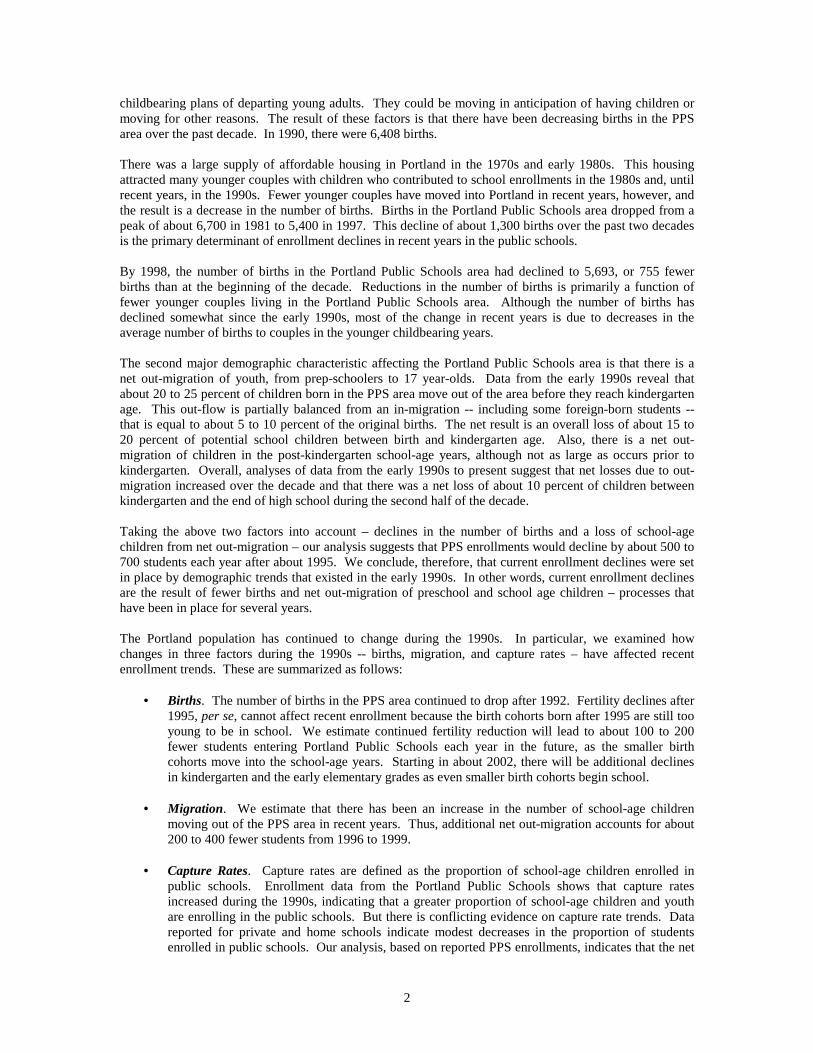
childbearing plans of departing young adults. They could be moving in anticipation of having children or moving for other reasons. The result of these factors is that there have been decreasing births in the PPS area over the past decade. In 1990, there were 6,408 births. There was a large supply of affordable housing in Portland in the 1970s and early 1980s. This housing attracted many younger couples with children who contributed to school enrollments in the 1980s and, until recent years, in the 1990s. Fewer younger couples have moved into Portland in recent years, however, and the result is a decrease in the number of births. Births in the Portland Public Schools area dropped from a peak of about 6,700 in 1981 to 5,400 in 1997. This decline of about 1,300 births over the past two decades is the primary determinant of enrollment declines in recent years in the public schools. By 1998, the number of births in the Portland Public Schools area had declined to 5,693, or 755 fewer births than at the beginning of the decade. Reductions in the number of births is primarily a function of fewer younger couples living in the Portland Public Schools area. Although the number of births has declined somewhat since the early 1990s, most of the change in recent years is due to decreases in the average number of births to couples in the younger childbearing years. The second major demographic characteristic affecting the Portland Public Schools area is that there is a net out-migration of youth, from prep-schoolers to 17 year-olds. Data from the early 1990s reveal that about 20 to 25 percent of children born in the PPS area move out of the area before they reach kindergarten age. This out-flow is partially balanced from an in-migration -- including some foreign-born students -- that is equal to about 5 to 10 percent of the original births. The net result is an overall loss of about 15 to 20 percent of potential school children between birth and kindergarten age. Also, there is a net out-migration of children in the post-kindergarten school-age years, although not as large as occurs prior to kindergarten. Overall, analyses of data from the early 1990s to present suggest that net losses due to out-migration increased over the decade and that there was a net loss of about 10 percent of children between kindergarten and the end of high school during the second half of the decade. Taking the above two factors into account – declines in the number of births and a loss of school-age children from net out-migration – our analysis suggests that PPS enrollments would decline by about 500 to 700 students each year after about 1995. We conclude, therefore, that current enrollment declines were set in place by demographic trends that existed in the early 1990s. In other words, current enrollment declines are the result of fewer births and net out-migration of preschool and school age children – processes that have been in place for several years. The Portland population has continued to change during the 1990s. In particular, we examined how changes in three factors during the 1990s -- births, migration, and capture rates – have affected recent enrollment trends. These are summarized as follows:
• Births. The number of births in the PPS area continued to drop after 1992. Fertility declines after 1995, per se, cannot affect recent enrollment because the birth cohorts born after 1995 are still too young to be in school. We estimate continued fertility reduction will lead to about 100 to 200 fewer students entering Portland Public Schools each year in the future, as the smaller birth cohorts move into the school-age years. Starting in about 2002, there will be additional declines in kindergarten and the early elementary grades as even smaller birth cohorts begin school.
• Migration. We estimate that there has been an increase in the number of school-age children
moving out of the PPS area in recent years. Thus, additional net out-migration accounts for about 200 to 400 fewer students from 1996 to 1999.
• Capture Rates. Capture rates are defined as the proportion of school-age children enrolled in
public schools. Enrollment data from the Portland Public Schools shows that capture rates increased during the 1990s, indicating that a greater proportion of school-age children and youth are enrolling in the public schools. But there is conflicting evidence on capture rate trends. Data reported for private and home schools indicate modest decreases in the proportion of students enrolled in public schools. Our analysis, based on reported PPS enrollments, indicates that the net
3
effect of changes in capture rates has increased public school student enrollments by 100 to 200 from 1996 to 1999.
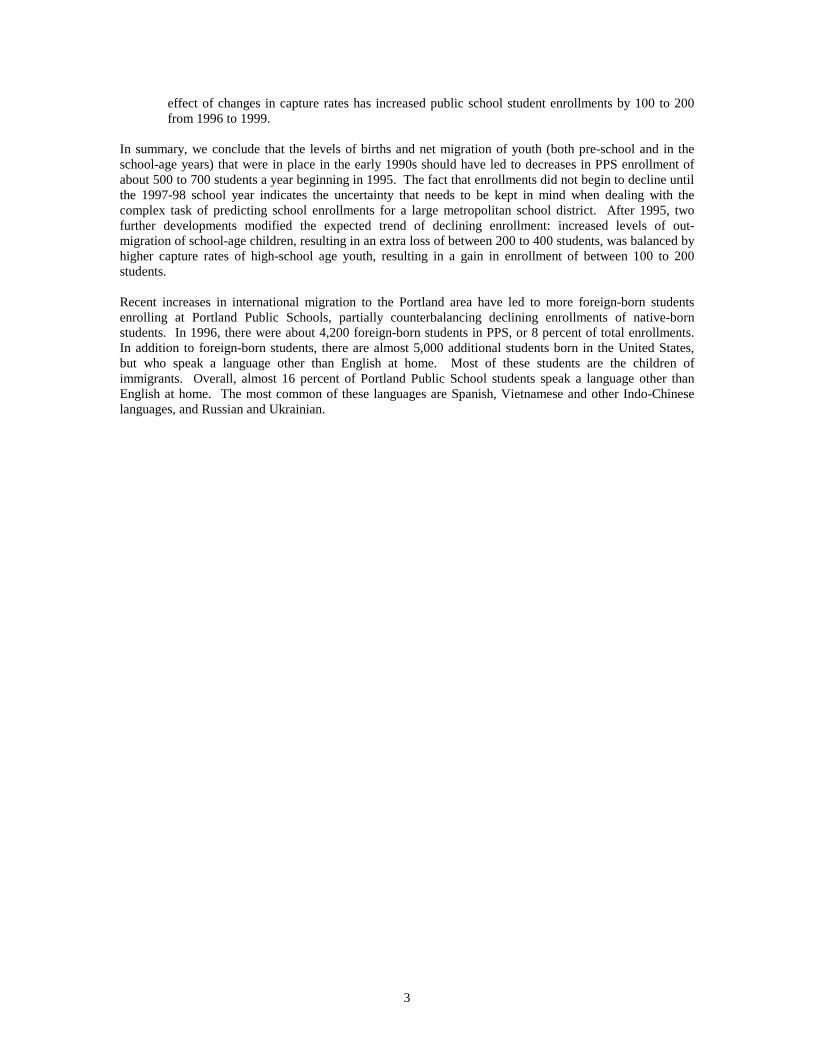
In summary, we conclude that the levels of births and net migration of youth (both pre-school and in the school-age years) that were in place in the early 1990s should have led to decreases in PPS enrollment of about 500 to 700 students a year beginning in 1995. The fact that enrollments did not begin to decline until the 1997-98 school year indicates the uncertainty that needs to be kept in mind when dealing with the complex task of predicting school enrollments for a large metropolitan school district. After 1995, two further developments modified the expected trend of declining enrollment: increased levels of out-migration of school-age children, resulting in an extra loss of between 200 to 400 students, was balanced by higher capture rates of high-school age youth, resulting in a gain in enrollment of between 100 to 200 students. Recent increases in international migration to the Portland area have led to more foreign-born students enrolling at Portland Public Schools, partially counterbalancing declining enrollments of native-born students. In 1996, there were about 4,200 foreign-born students in PPS, or 8 percent of total enrollments. In addition to foreign-born students, there are almost 5,000 additional students born in the United States, but who speak a language other than English at home. Most of these students are the children of immigrants. Overall, almost 16 percent of Portland Public School students speak a language other than English at home. The most common of these languages are Spanish, Vietnamese and other Indo-Chinese languages, and Russian and Ukrainian.
4
BACKGROUND
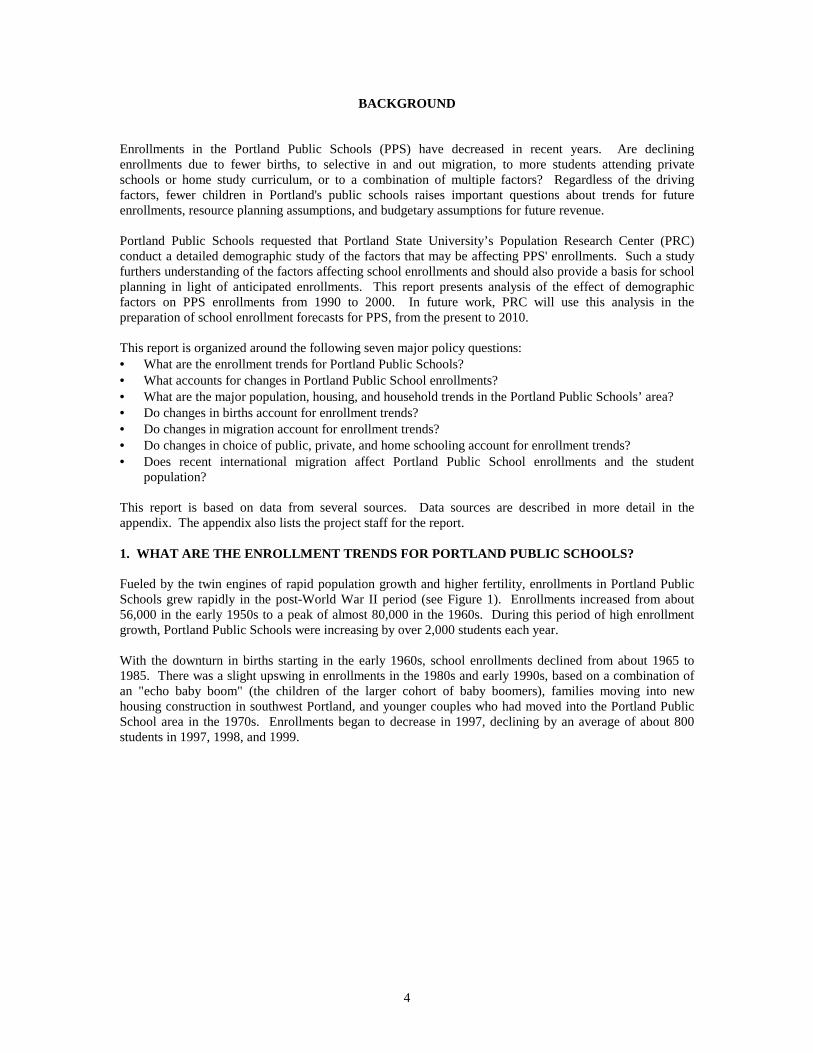
Enrollments in the Portland Public Schools (PPS) have decreased in recent years. Are declining enrollments due to fewer births, to selective in and out migration, to more students attending private schools or home study curriculum, or to a combination of multiple factors? Regardless of the driving factors, fewer children in Portland's public schools raises important questions about trends for future enrollments, resource planning assumptions, and budgetary assumptions for future revenue. Portland Public Schools requested that Portland State University’s Population Research Center (PRC) conduct a detailed demographic study of the factors that may be affecting PPS' enrollments. Such a study furthers understanding of the factors affecting school enrollments and should also provide a basis for school planning in light of anticipated enrollments. This report presents analysis of the effect of demographic factors on PPS enrollments from 1990 to 2000. In future work, PRC will use this analysis in the preparation of school enrollment forecasts for PPS, from the present to 2010. This report is organized around the following seven major policy questions: • What are the enrollment trends for Portland Public Schools? • What accounts for changes in Portland Public School enrollments? • What are the major population, housing, and household trends in the Portland Public Schools’ area? • Do changes in births account for enrollment trends? • Do changes in migration account for enrollment trends? • Do changes in choice of public, private, and home schooling account for enrollment trends? • Does recent international migration affect Portland Public School enrollments and the student
population? This report is based on data from several sources. Data sources are described in more detail in the appendix. The appendix also lists the project staff for the report. 1. WHAT ARE THE ENROLLMENT TRENDS FOR PORTLAND PUBLIC SCHOOLS? Fueled by the twin engines of rapid population growth and higher fertility, enrollments in Portland Public Schools grew rapidly in the post-World War II period (see Figure 1). Enrollments increased from about 56,000 in the early 1950s to a peak of almost 80,000 in the 1960s. During this period of high enrollment growth, Portland Public Schools were increasing by over 2,000 students each year. With the downturn in births starting in the early 1960s, school enrollments declined from about 1965 to 1985. There was a slight upswing in enrollments in the 1980s and early 1990s, based on a combination of an "echo baby boom" (the children of the larger cohort of baby boomers), families moving into new housing construction in southwest Portland, and younger couples who had moved into the Portland Public School area in the 1970s. Enrollments began to decrease in 1997, declining by an average of about 800 students in 1997, 1998, and 1999.
5
Figure 1. Portland Public School Enrollments from 1950 to 1999.
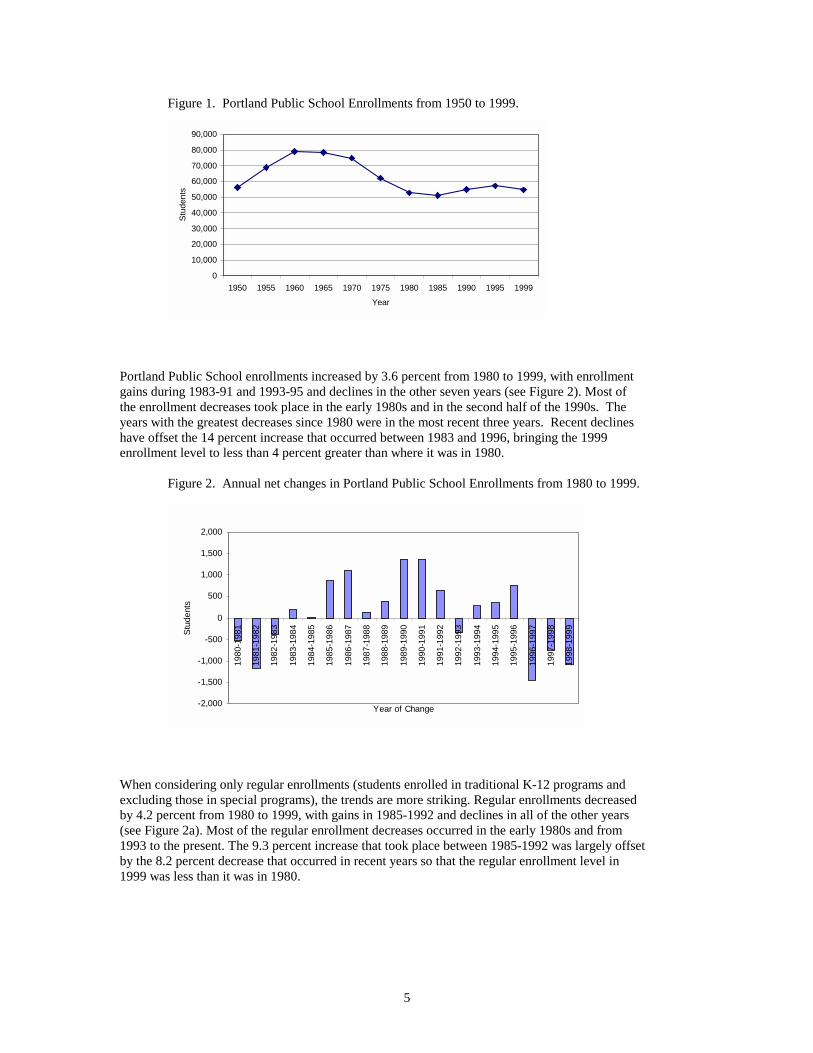
Portland Public School enrollments increased by 3.6 percent from 1980 to 1999, with enrollment gains during 1983-91 and 1993-95 and declines in the other seven years (see Figure 2). Most of the enrollment decreases took place in the early 1980s and in the second half of the 1990s. The years with the greatest decreases since 1980 were in the most recent three years. Recent declines have offset the 14 percent increase that occurred between 1983 and 1996, bringing the 1999 enrollment level to less than 4 percent greater than where it was in 1980.
Figure 2. Annual net changes in Portland Public School Enrollments from 1980 to 1999.
When considering only regular enrollments (students enrolled in traditional K-12 programs and excluding those in special programs), the trends are more striking. Regular enrollments decreased by 4.2 percent from 1980 to 1999, with gains in 1985-1992 and declines in all of the other years (see Figure 2a). Most of the regular enrollment decreases occurred in the early 1980s and from 1993 to the present. The 9.3 percent increase that took place between 1985-1992 was largely offset by the 8.2 percent decrease that occurred in recent years so that the regular enrollment level in 1999 was less than it was in 1980.
0
10,000
20,000
30,000
40,000
50,000
60,000
70,000
80,000
90,000
1950 1955 1960 1965 1970 1975 1980 1985 1990 1995 1999
Year
Stud
ents
-2,000
-1,500
-1,000
-500
0
500
1,000
1,500
2,000
1980
-198
1
1981
-198
2
1982
-198
3
1983
-198
4
1984
-198
5
1985
-198
6
1986
-198
7
1987
-198
8
1988
-198
9
1989
-199
0
1990
-199
1
1991
-199
2
1992
-199
3
1993
-199
4
1994
-199
5
1995
-199
6
1996
-199
7
1997
-199
8
1998
-199
9
Year of Change
Stud
ents
6
Figure 2a. Annual net changes in Portland Public School Regular Enrollments from 1980 to 1999.
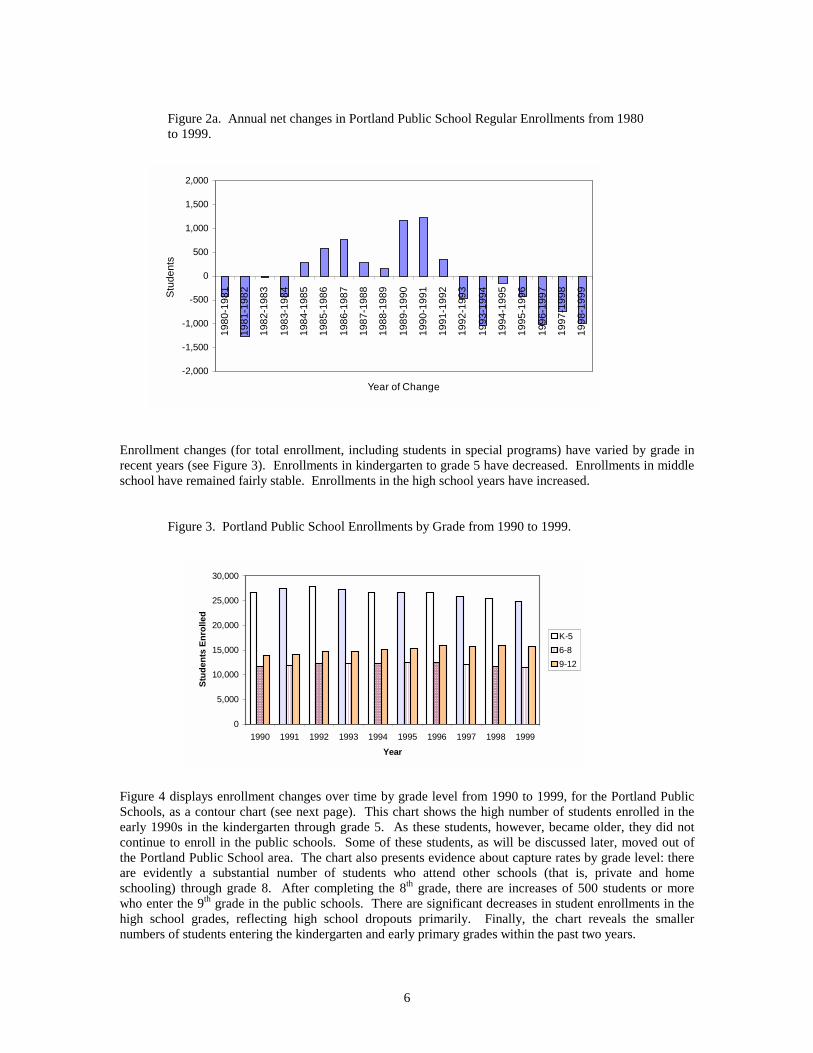
Enrollment changes (for total enrollment, including students in special programs) have varied by grade in recent years (see Figure 3). Enrollments in kindergarten to grade 5 have decreased. Enrollments in middle school have remained fairly stable. Enrollments in the high school years have increased.
Figure 3. Portland Public School Enrollments by Grade from 1990 to 1999.
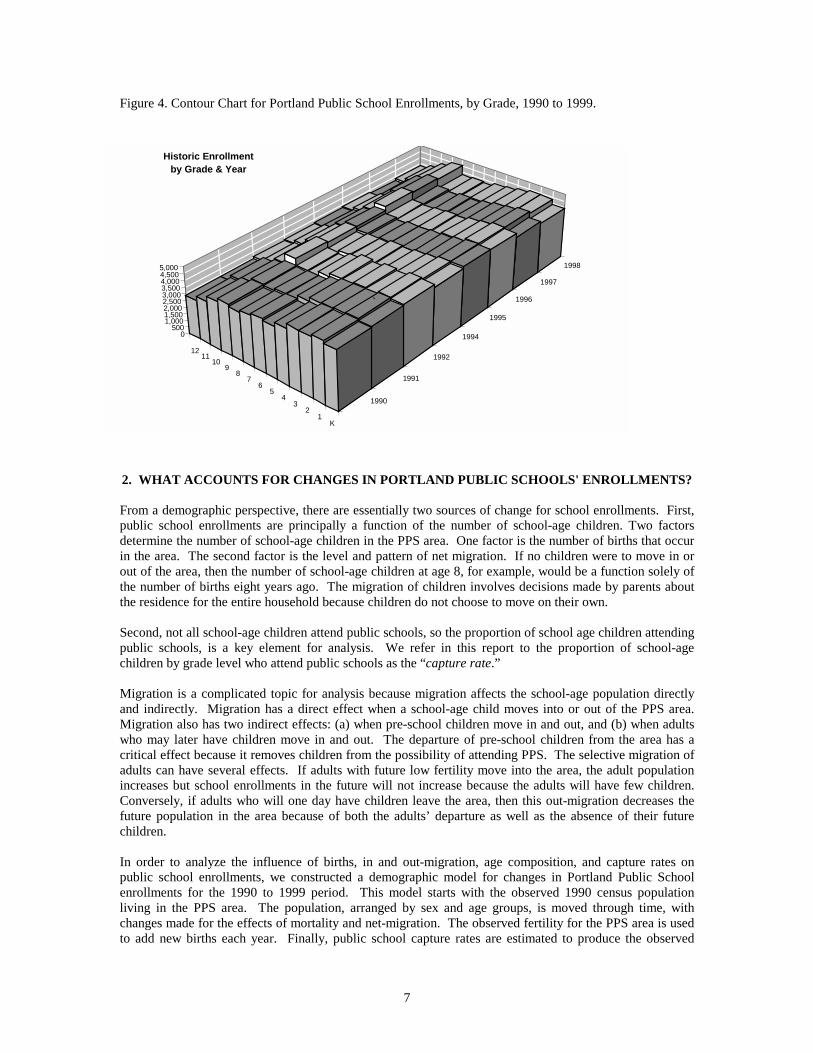
Figure 4 displays enrollment changes over time by grade level from 1990 to 1999, for the Portland Public Schools, as a contour chart (see next page). This chart shows the high number of students enrolled in the early 1990s in the kindergarten through grade 5. As these students, however, became older, they did not continue to enroll in the public schools. Some of these students, as will be discussed later, moved out of the Portland Public School area. The chart also presents evidence about capture rates by grade level: there are evidently a substantial number of students who attend other schools (that is, private and home schooling) through grade 8. After completing the 8th grade, there are increases of 500 students or more who enter the 9th grade in the public schools. There are significant decreases in student enrollments in the high school grades, reflecting high school dropouts primarily. Finally, the chart reveals the smaller numbers of students entering the kindergarten and early primary grades within the past two years.
0
5,000
10,000
15,000
20,000
25,000
30,000
1990 1991 1992 1993 1994 1995 1996 1997 1998 1999
Year
Stud
ents
Enr
olle
d
K-56-89-12
-2,000
-1,500
-1,000
-500
0
500
1,000
1,500
2,000
1980
-198
1
1981
-198
2
1982
-198
3
1983
-198
4
1984
-198
5
1985
-198
6
1986
-198
7
1987
-198
8
1988
-198
9
1989
-199
0
1990
-199
1
1991
-199
2
1992
-199
3
1993
-199
4
1994
-199
5
1995
-199
6
1996
-199
7
1997
-199
8
1998
-199
9
Year of Change
Stud
ents
7
Figure 4. Contour Chart for Portland Public School Enrollments, by Grade, 1990 to 1999.
2. WHAT ACCOUNTS FOR CHANGES IN PORTLAND PUBLIC SCHOOLS' ENROLLMENTS? From a demographic perspective, there are essentially two sources of change for school enrollments. First, public school enrollments are principally a function of the number of school-age children. Two factors determine the number of school-age children in the PPS area. One factor is the number of births that occur in the area. The second factor is the level and pattern of net migration. If no children were to move in or out of the area, then the number of school-age children at age 8, for example, would be a function solely of the number of births eight years ago. The migration of children involves decisions made by parents about the residence for the entire household because children do not choose to move on their own. Second, not all school-age children attend public schools, so the proportion of school age children attending public schools, is a key element for analysis. We refer in this report to the proportion of school-age children by grade level who attend public schools as the “capture rate.” Migration is a complicated topic for analysis because migration affects the school-age population directly and indirectly. Migration has a direct effect when a school-age child moves into or out of the PPS area. Migration also has two indirect effects: (a) when pre-school children move in and out, and (b) when adults who may later have children move in and out. The departure of pre-school children from the area has a critical effect because it removes children from the possibility of attending PPS. The selective migration of adults can have several effects. If adults with future low fertility move into the area, the adult population increases but school enrollments in the future will not increase because the adults will have few children. Conversely, if adults who will one day have children leave the area, then this out-migration decreases the future population in the area because of both the adults’ departure as well as the absence of their future children. In order to analyze the influence of births, in and out-migration, age composition, and capture rates on public school enrollments, we constructed a demographic model for changes in Portland Public School enrollments for the 1990 to 1999 period. This model starts with the observed 1990 census population living in the PPS area. The population, arranged by sex and age groups, is moved through time, with changes made for the effects of mortality and net-migration. The observed fertility for the PPS area is used to add new births each year. Finally, public school capture rates are estimated to produce the observed
K1
23
45
67
89
1011
12
1990
1991
1992
1994
1995
1996
1997
1998
0500
1,0001,5002,0002,5003,0003,5004,0004,5005,000
Historic Enrollment by Grade & Year
`
8
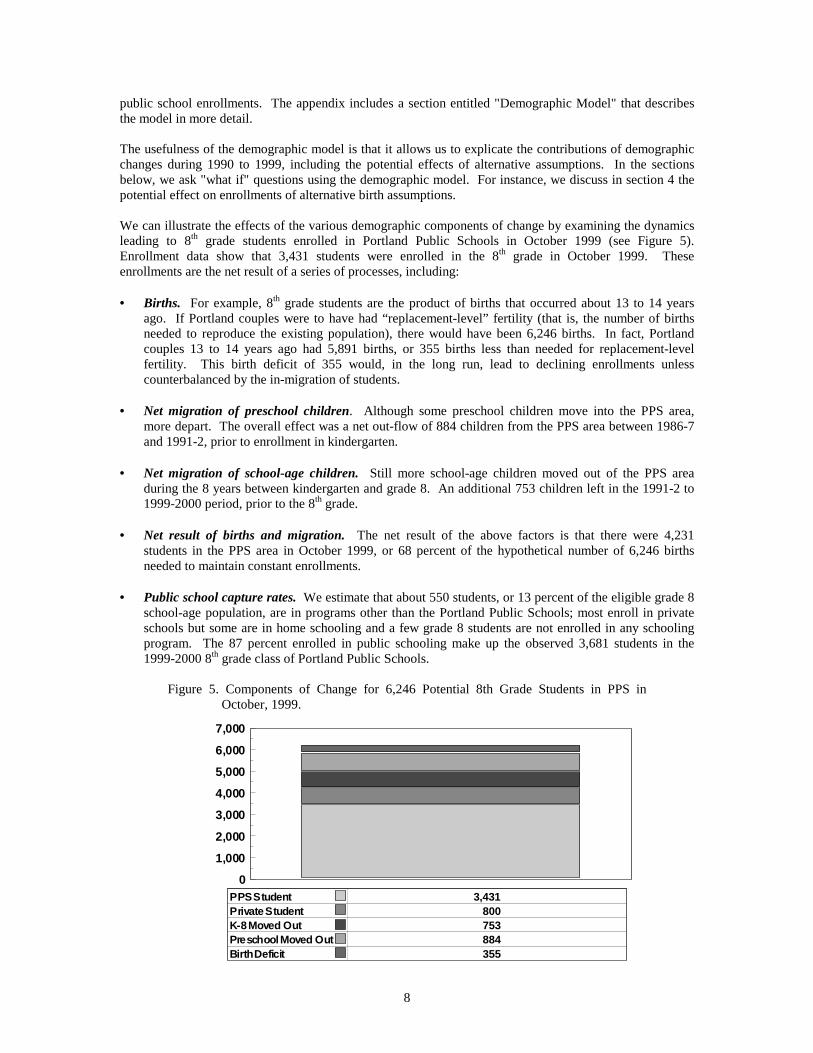
public school enrollments. The appendix includes a section entitled "Demographic Model" that describes the model in more detail. The usefulness of the demographic model is that it allows us to explicate the contributions of demographic changes during 1990 to 1999, including the potential effects of alternative assumptions. In the sections below, we ask "what if" questions using the demographic model. For instance, we discuss in section 4 the potential effect on enrollments of alternative birth assumptions. We can illustrate the effects of the various demographic components of change by examining the dynamics leading to 8th grade students enrolled in Portland Public Schools in October 1999 (see Figure 5). Enrollment data show that 3,431 students were enrolled in the 8th grade in October 1999. These enrollments are the net result of a series of processes, including: • Births. For example, 8th grade students are the product of births that occurred about 13 to 14 years
ago. If Portland couples were to have had “replacement-level” fertility (that is, the number of births needed to reproduce the existing population), there would have been 6,246 births. In fact, Portland couples 13 to 14 years ago had 5,891 births, or 355 births less than needed for replacement-level fertility. This birth deficit of 355 would, in the long run, lead to declining enrollments unless counterbalanced by the in-migration of students.
• Net migration of preschool children. Although some preschool children move into the PPS area,
more depart. The overall effect was a net out-flow of 884 children from the PPS area between 1986-7 and 1991-2, prior to enrollment in kindergarten.
• Net migration of school-age children. Still more school-age children moved out of the PPS area
during the 8 years between kindergarten and grade 8. An additional 753 children left in the 1991-2 to 1999-2000 period, prior to the 8th grade.
• Net result of births and migration. The net result of the above factors is that there were 4,231
students in the PPS area in October 1999, or 68 percent of the hypothetical number of 6,246 births needed to maintain constant enrollments.
• Public school capture rates. We estimate that about 550 students, or 13 percent of the eligible grade 8
school-age population, are in programs other than the Portland Public Schools; most enroll in private schools but some are in home schooling and a few grade 8 students are not enrolled in any schooling program. The 87 percent enrolled in public schooling make up the observed 3,681 students in the 1999-2000 8th grade class of Portland Public Schools.
Figure 5. Components of Change for 6,246 Potential 8th Grade Students in PPS in
October, 1999.
0
1 ,000
2,000
3,000
4,000
5,000
6,000
7,000
PPSStudent
PrivateStudent
K-8Moved Out
Preschool Moved Out
BirthDeficit
3,431
800
753
884
355
9
3. WHAT ARE THE MAJOR POPULATION, HOUSING, AND HOUSEHOLD? Population, housing, and household growth are interlinked and have been changing during the past two decades. This section discusses the key trends for population, housing, and households and how these trends affect school enrollments. Population Trends From 1990 to 1996, the total population residing within the boundaries of the PPS district grew from 397,714 to 413,672. The 15,958 increase represents an annual average growth of 0.7 percent. The PPS area and the City of Portland experienced a similar rate of population growth, but both grew at a slower pace than Multnomah County during the same time period. From 1990 to 1996, Multnomah County's population increased at an average annual rate of 1.9 percent -- more than twice as fast as Portland's population. (Compared to Multnomah County in the 1990s, Clackamas County has been increasing almost twice as fast and Washington County has been increasing about three times as fast.) Year, Population, and Population Change Since
the Last Period Portland
Public School Area
City of Portland
Multnomah County
1990 Population 397,714 486,027 583,887
1996 Population 413,850 503,002 636,000
1990-96 Percentage Increase 4.1% 3.5% 8.9% 1990-96 Average Annual Growth Rate 0.7% 0.6% 1.4%
1999 Population 421,300 512,395 646,850
1996-99 Percentage Increase 1.8% 1.9% 1.7% 1996 -99 Average Annual Growth Rate 0.6% 0.6% 0.6%
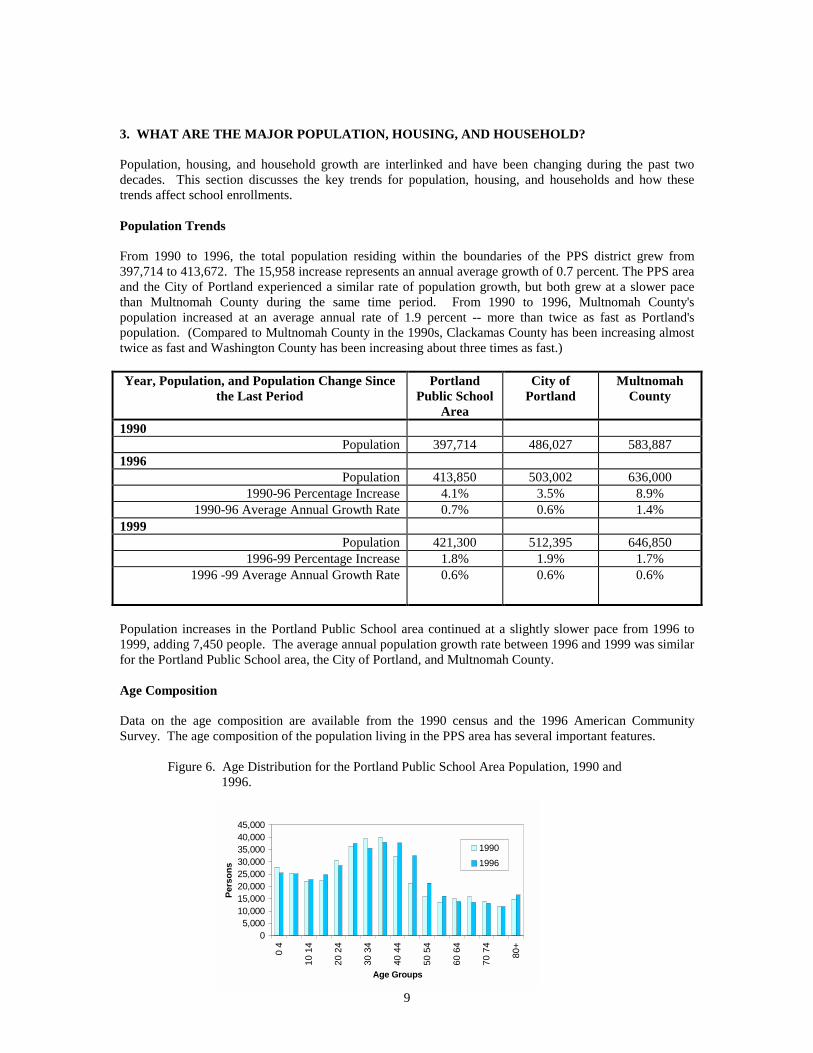
Population increases in the Portland Public School area continued at a slightly slower pace from 1996 to 1999, adding 7,450 people. The average annual population growth rate between 1996 and 1999 was similar for the Portland Public School area, the City of Portland, and Multnomah County. Age Composition Data on the age composition are available from the 1990 census and the 1996 American Community Survey. The age composition of the population living in the PPS area has several important features.
Figure 6. Age Distribution for the Portland Public School Area Population, 1990 and 1996.
05,000
10,00015,00020,00025,00030,00035,00040,00045,000
0 4
10 1
4
20 2
4
30 3
4
40 4
4
50 5
4
60 6
4
70 7
4
80+
Age Groups
Pers
ons
19901996
10
A high proportion of the area’s population is in the younger adult years. During the 1990s, however, the adult population has been aging with increases in the 40 to 59 year age group and decreases in the 30 to 39 year age group (see Figures 6 and 7). There were declines in the 0 to 4 year age group and increases in the 15 to 19 year age group. Persons aged 40 to 59 years experienced the fastest growth in the PPS area, increasing by 30 percent between 1990 and 1996. These large increases primarily reflect the aging of the large baby-boom cohorts into the middle and late middle adult years. There was an increase in the 10 to 19 age group, by 7 percent. This is most likely related to the growth of the 40 to 59 years old category, who tend to have more teenage children. The population aged 80 years and older, increased by 11 percent. Of the age groups that declined between 1990 to 1996, the 60 to 79 age group showed the greatest decrease, declining by 7 percent due to the smaller numbers of births that occurred during the 1930s depression. Both the 0 to 9 and 20 to 39 age groups experienced decreases of 5 percent.
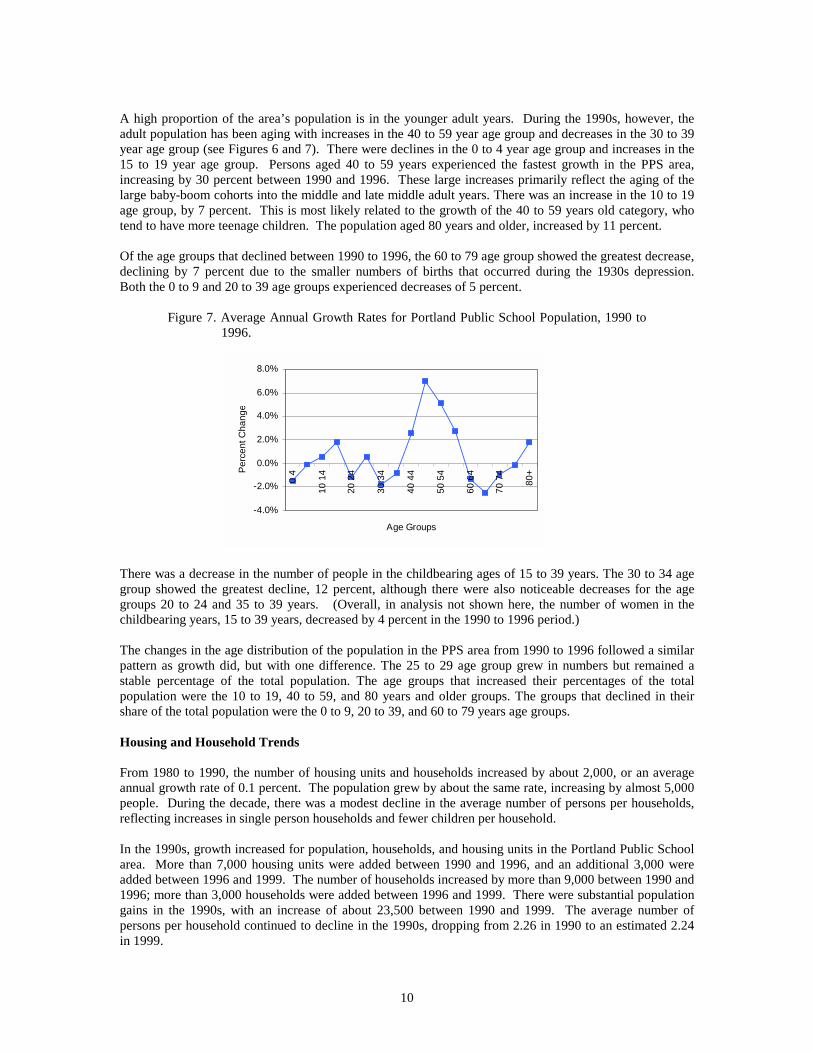
Figure 7. Average Annual Growth Rates for Portland Public School Population, 1990 to 1996.
There was a decrease in the number of people in the childbearing ages of 15 to 39 years. The 30 to 34 age group showed the greatest decline, 12 percent, although there were also noticeable decreases for the age groups 20 to 24 and 35 to 39 years. (Overall, in analysis not shown here, the number of women in the childbearing years, 15 to 39 years, decreased by 4 percent in the 1990 to 1996 period.) The changes in the age distribution of the population in the PPS area from 1990 to 1996 followed a similar pattern as growth did, but with one difference. The 25 to 29 age group grew in numbers but remained a stable percentage of the total population. The age groups that increased their percentages of the total population were the 10 to 19, 40 to 59, and 80 years and older groups. The groups that declined in their share of the total population were the 0 to 9, 20 to 39, and 60 to 79 years age groups. Housing and Household Trends From 1980 to 1990, the number of housing units and households increased by about 2,000, or an average annual growth rate of 0.1 percent. The population grew by about the same rate, increasing by almost 5,000 people. During the decade, there was a modest decline in the average number of persons per households, reflecting increases in single person households and fewer children per household. In the 1990s, growth increased for population, households, and housing units in the Portland Public School area. More than 7,000 housing units were added between 1990 and 1996, and an additional 3,000 were added between 1996 and 1999. The number of households increased by more than 9,000 between 1990 and 1996; more than 3,000 households were added between 1996 and 1999. There were substantial population gains in the 1990s, with an increase of about 23,500 between 1990 and 1999. The average number of persons per household continued to decline in the 1990s, dropping from 2.26 in 1990 to an estimated 2.24 in 1999.
-4.0%
-2.0%
0.0%
2.0%
4.0%
6.0%
8.0%
0 4
10 1
4
20 2
4
30 3
4
40 4
4
50 5
4
60 6
4
70 7
4
80+
Age Groups
Perc
ent C
hang
e
11
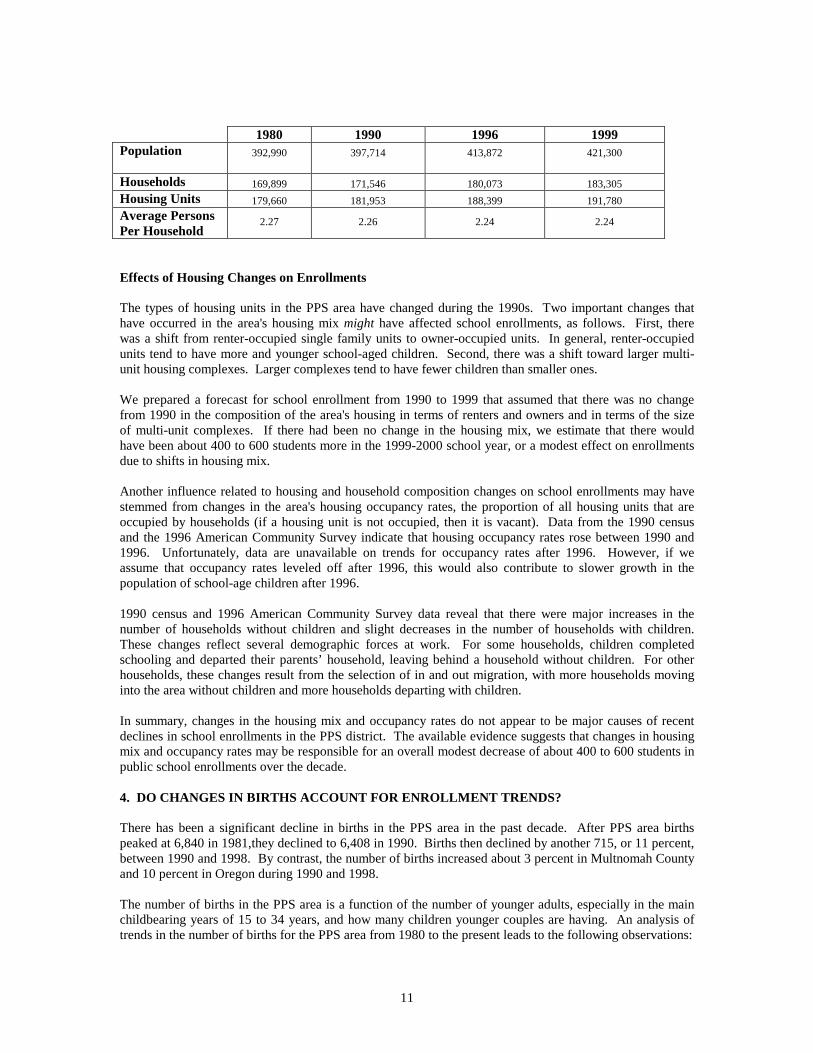
1980 1990 1996 1999 Population 392,990 397,714 413,872 421,300
Households 169,899 171,546 180,073 183,305 Housing Units 179,660 181,953 188,399 191,780 Average Persons Per Household
2.27 2.26 2.24 2.24
Effects of Housing Changes on Enrollments The types of housing units in the PPS area have changed during the 1990s. Two important changes that have occurred in the area's housing mix might have affected school enrollments, as follows. First, there was a shift from renter-occupied single family units to owner-occupied units. In general, renter-occupied units tend to have more and younger school-aged children. Second, there was a shift toward larger multi-unit housing complexes. Larger complexes tend to have fewer children than smaller ones. We prepared a forecast for school enrollment from 1990 to 1999 that assumed that there was no change from 1990 in the composition of the area's housing in terms of renters and owners and in terms of the size of multi-unit complexes. If there had been no change in the housing mix, we estimate that there would have been about 400 to 600 students more in the 1999-2000 school year, or a modest effect on enrollments due to shifts in housing mix. Another influence related to housing and household composition changes on school enrollments may have stemmed from changes in the area's housing occupancy rates, the proportion of all housing units that are occupied by households (if a housing unit is not occupied, then it is vacant). Data from the 1990 census and the 1996 American Community Survey indicate that housing occupancy rates rose between 1990 and 1996. Unfortunately, data are unavailable on trends for occupancy rates after 1996. However, if we assume that occupancy rates leveled off after 1996, this would also contribute to slower growth in the population of school-age children after 1996. 1990 census and 1996 American Community Survey data reveal that there were major increases in the number of households without children and slight decreases in the number of households with children. These changes reflect several demographic forces at work. For some households, children completed schooling and departed their parents’ household, leaving behind a household without children. For other households, these changes result from the selection of in and out migration, with more households moving into the area without children and more households departing with children. In summary, changes in the housing mix and occupancy rates do not appear to be major causes of recent declines in school enrollments in the PPS district. The available evidence suggests that changes in housing mix and occupancy rates may be responsible for an overall modest decrease of about 400 to 600 students in public school enrollments over the decade. 4. DO CHANGES IN BIRTHS ACCOUNT FOR ENROLLMENT TRENDS? There has been a significant decline in births in the PPS area in the past decade. After PPS area births peaked at 6,840 in 1981,they declined to 6,408 in 1990. Births then declined by another 715, or 11 percent, between 1990 and 1998. By contrast, the number of births increased about 3 percent in Multnomah County and 10 percent in Oregon during 1990 and 1998. The number of births in the PPS area is a function of the number of younger adults, especially in the main childbearing years of 15 to 34 years, and how many children younger couples are having. An analysis of trends in the number of births for the PPS area from 1980 to the present leads to the following observations:
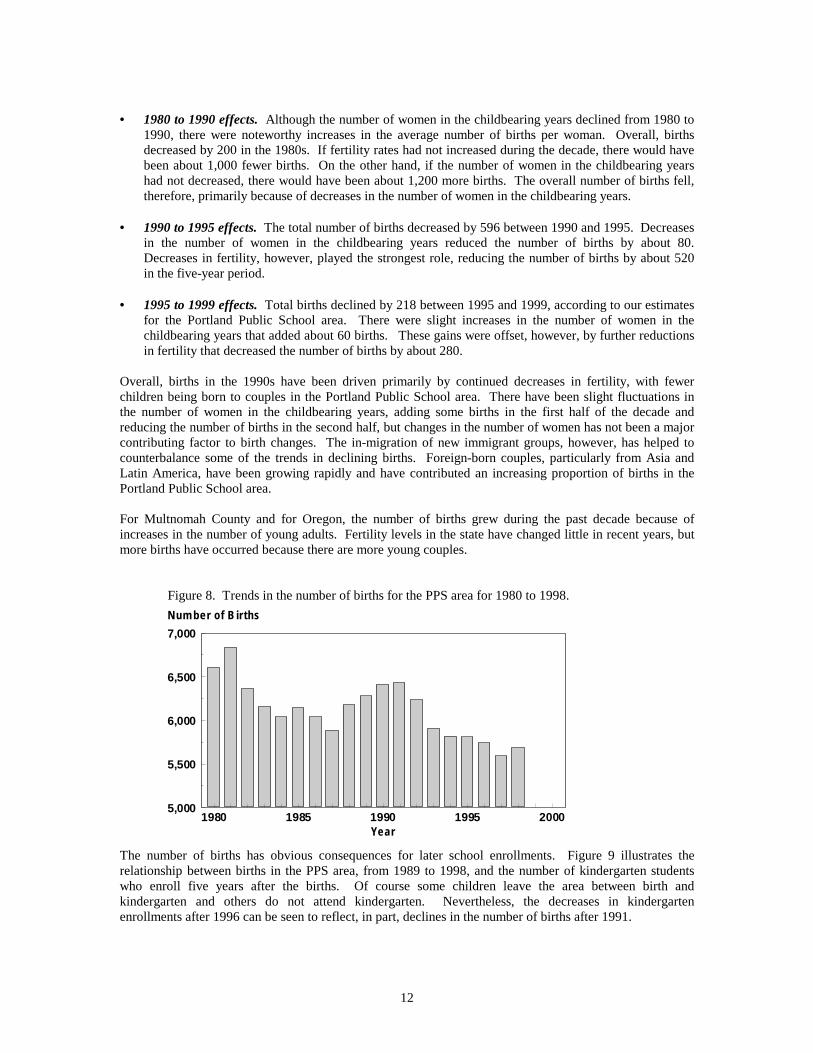
12
• 1980 to 1990 effects. Although the number of women in the childbearing years declined from 1980 to
1990, there were noteworthy increases in the average number of births per woman. Overall, births decreased by 200 in the 1980s. If fertility rates had not increased during the decade, there would have been about 1,000 fewer births. On the other hand, if the number of women in the childbearing years had not decreased, there would have been about 1,200 more births. The overall number of births fell, therefore, primarily because of decreases in the number of women in the childbearing years.
• 1990 to 1995 effects. The total number of births decreased by 596 between 1990 and 1995. Decreases
in the number of women in the childbearing years reduced the number of births by about 80. Decreases in fertility, however, played the strongest role, reducing the number of births by about 520 in the five-year period.
• 1995 to 1999 effects. Total births declined by 218 between 1995 and 1999, according to our estimates
for the Portland Public School area. There were slight increases in the number of women in the childbearing years that added about 60 births. These gains were offset, however, by further reductions in fertility that decreased the number of births by about 280.
Overall, births in the 1990s have been driven primarily by continued decreases in fertility, with fewer children being born to couples in the Portland Public School area. There have been slight fluctuations in the number of women in the childbearing years, adding some births in the first half of the decade and reducing the number of births in the second half, but changes in the number of women has not been a major contributing factor to birth changes. The in-migration of new immigrant groups, however, has helped to counterbalance some of the trends in declining births. Foreign-born couples, particularly from Asia and Latin America, have been growing rapidly and have contributed an increasing proportion of births in the Portland Public School area. For Multnomah County and for Oregon, the number of births grew during the past decade because of increases in the number of young adults. Fertility levels in the state have changed little in recent years, but more births have occurred because there are more young couples.
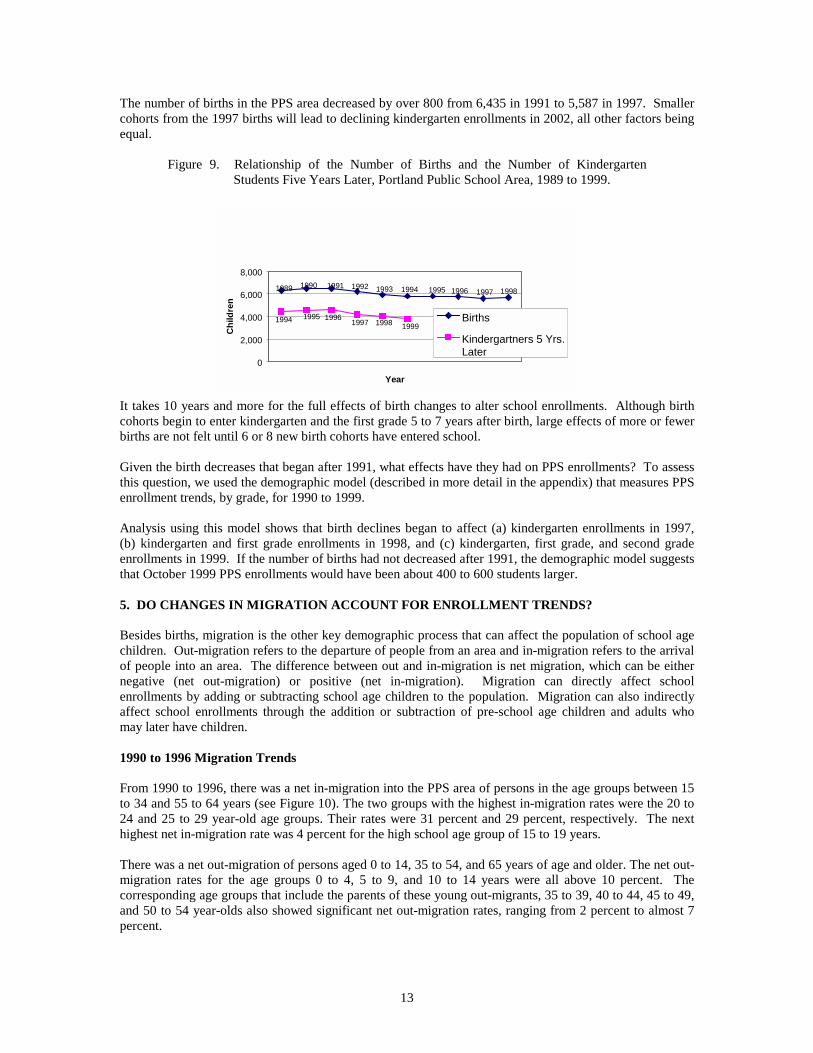
Figure 8. Trends in the number of births for the PPS area for 1980 to 1998. The number of births has obvious consequences for later school enrollments. Figure 9 illustrates the relationship between births in the PPS area, from 1989 to 1998, and the number of kindergarten students who enroll five years after the births. Of course some children leave the area between birth and kindergarten and others do not attend kindergarten. Nevertheless, the decreases in kindergarten enrollments after 1996 can be seen to reflect, in part, declines in the number of births after 1991.
1 980 1 985 1 990 1 995 20005,000
5,500
6,000
6,500
7,000
Year
Number of B irths
13
The number of births in the PPS area decreased by over 800 from 6,435 in 1991 to 5,587 in 1997. Smaller cohorts from the 1997 births will lead to declining kindergarten enrollments in 2002, all other factors being equal.
Figure 9. Relationship of the Number of Births and the Number of Kindergarten Students Five Years Later, Portland Public School Area, 1989 to 1999.
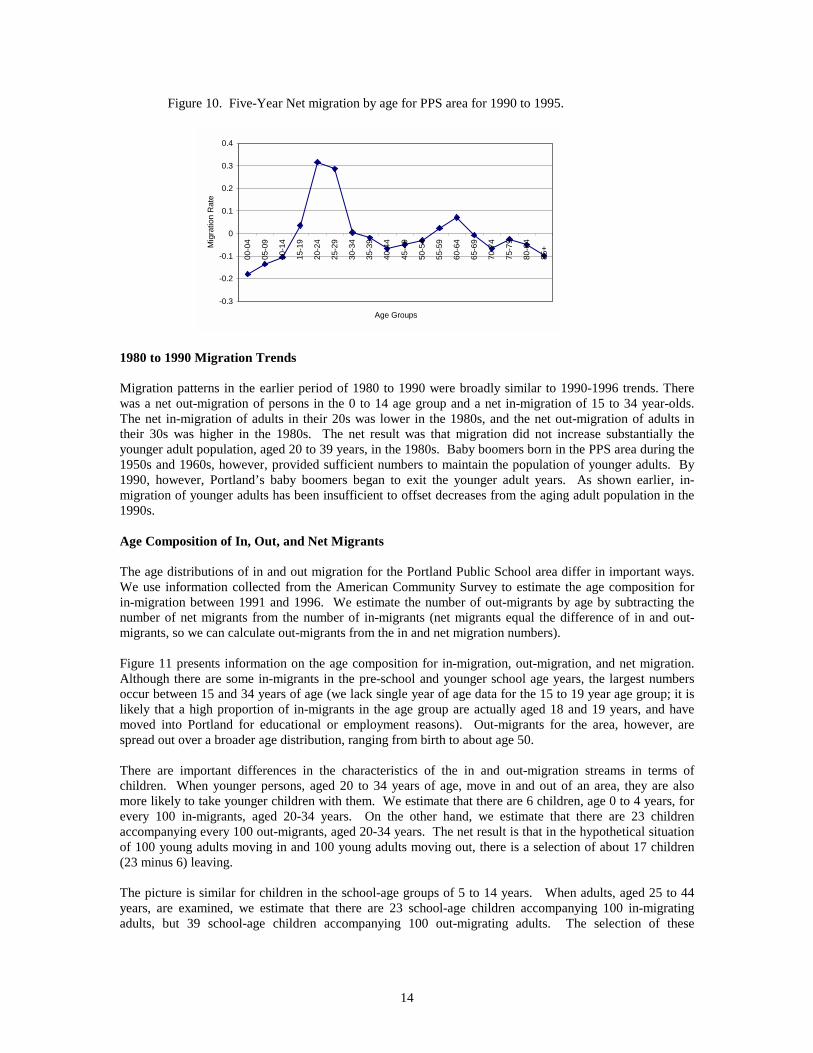
It takes 10 years and more for the full effects of birth changes to alter school enrollments. Although birth cohorts begin to enter kindergarten and the first grade 5 to 7 years after birth, large effects of more or fewer births are not felt until 6 or 8 new birth cohorts have entered school. Given the birth decreases that began after 1991, what effects have they had on PPS enrollments? To assess this question, we used the demographic model (described in more detail in the appendix) that measures PPS enrollment trends, by grade, for 1990 to 1999. Analysis using this model shows that birth declines began to affect (a) kindergarten enrollments in 1997, (b) kindergarten and first grade enrollments in 1998, and (c) kindergarten, first grade, and second grade enrollments in 1999. If the number of births had not decreased after 1991, the demographic model suggests that October 1999 PPS enrollments would have been about 400 to 600 students larger. 5. DO CHANGES IN MIGRATION ACCOUNT FOR ENROLLMENT TRENDS? Besides births, migration is the other key demographic process that can affect the population of school age children. Out-migration refers to the departure of people from an area and in-migration refers to the arrival of people into an area. The difference between out and in-migration is net migration, which can be either negative (net out-migration) or positive (net in-migration). Migration can directly affect school enrollments by adding or subtracting school age children to the population. Migration can also indirectly affect school enrollments through the addition or subtraction of pre-school age children and adults who may later have children. 1990 to 1996 Migration Trends From 1990 to 1996, there was a net in-migration into the PPS area of persons in the age groups between 15 to 34 and 55 to 64 years (see Figure 10). The two groups with the highest in-migration rates were the 20 to 24 and 25 to 29 year-old age groups. Their rates were 31 percent and 29 percent, respectively. The next highest net in-migration rate was 4 percent for the high school age group of 15 to 19 years. There was a net out-migration of persons aged 0 to 14, 35 to 54, and 65 years of age and older. The net out-migration rates for the age groups 0 to 4, 5 to 9, and 10 to 14 years were all above 10 percent. The corresponding age groups that include the parents of these young out-migrants, 35 to 39, 40 to 44, 45 to 49, and 50 to 54 year-olds also showed significant net out-migration rates, ranging from 2 percent to almost 7 percent.
1989 1990 1991 1992 1993 1994 1995 1996 1997 1998
1994 1995 1996 1997 1998 1999
0
2,000
4,000
6,000
8,000
Year
Chi
ldre
n
Births
Kindergartners 5 Yrs.Later
14
Figure 10. Five-Year Net migration by age for PPS area for 1990 to 1995.
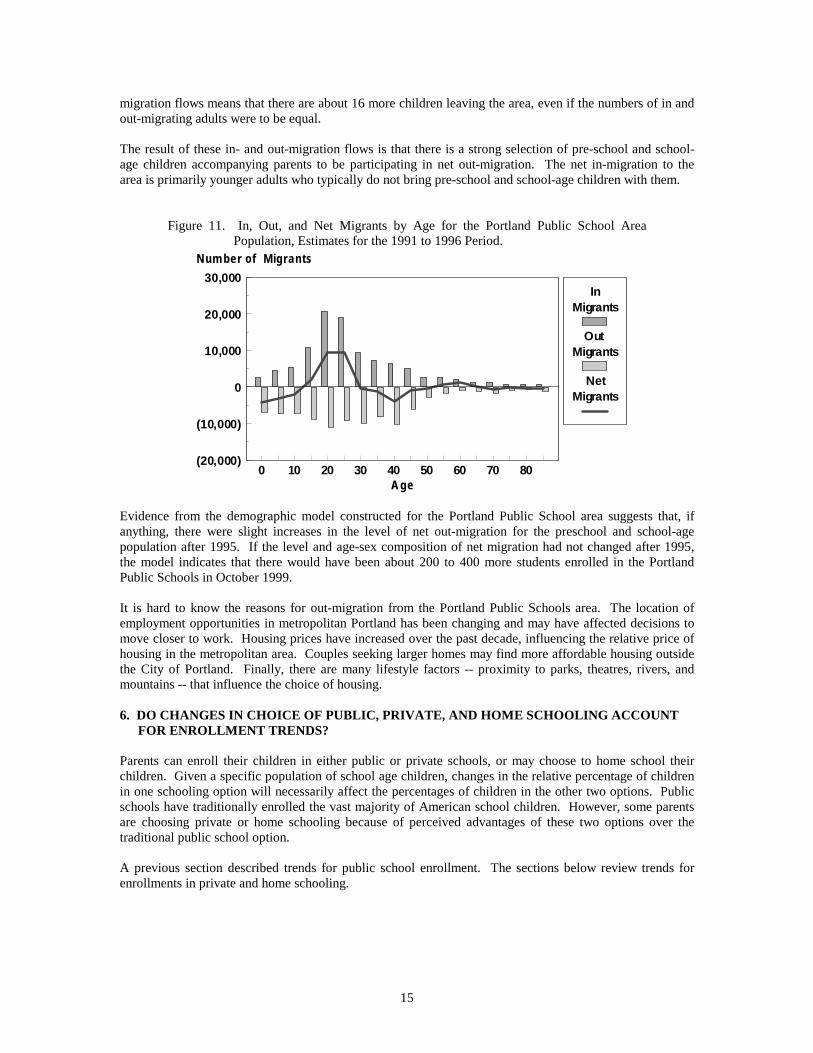
1980 to 1990 Migration Trends Migration patterns in the earlier period of 1980 to 1990 were broadly similar to 1990-1996 trends. There was a net out-migration of persons in the 0 to 14 age group and a net in-migration of 15 to 34 year-olds. The net in-migration of adults in their 20s was lower in the 1980s, and the net out-migration of adults in their 30s was higher in the 1980s. The net result was that migration did not increase substantially the younger adult population, aged 20 to 39 years, in the 1980s. Baby boomers born in the PPS area during the 1950s and 1960s, however, provided sufficient numbers to maintain the population of younger adults. By 1990, however, Portland’s baby boomers began to exit the younger adult years. As shown earlier, in-migration of younger adults has been insufficient to offset decreases from the aging adult population in the 1990s. Age Composition of In, Out, and Net Migrants The age distributions of in and out migration for the Portland Public School area differ in important ways. We use information collected from the American Community Survey to estimate the age composition for in-migration between 1991 and 1996. We estimate the number of out-migrants by age by subtracting the number of net migrants from the number of in-migrants (net migrants equal the difference of in and out-migrants, so we can calculate out-migrants from the in and net migration numbers). Figure 11 presents information on the age composition for in-migration, out-migration, and net migration. Although there are some in-migrants in the pre-school and younger school age years, the largest numbers occur between 15 and 34 years of age (we lack single year of age data for the 15 to 19 year age group; it is likely that a high proportion of in-migrants in the age group are actually aged 18 and 19 years, and have moved into Portland for educational or employment reasons). Out-migrants for the area, however, are spread out over a broader age distribution, ranging from birth to about age 50. There are important differences in the characteristics of the in and out-migration streams in terms of children. When younger persons, aged 20 to 34 years of age, move in and out of an area, they are also more likely to take younger children with them. We estimate that there are 6 children, age 0 to 4 years, for every 100 in-migrants, aged 20-34 years. On the other hand, we estimate that there are 23 children accompanying every 100 out-migrants, aged 20-34 years. The net result is that in the hypothetical situation of 100 young adults moving in and 100 young adults moving out, there is a selection of about 17 children (23 minus 6) leaving. The picture is similar for children in the school-age groups of 5 to 14 years. When adults, aged 25 to 44 years, are examined, we estimate that there are 23 school-age children accompanying 100 in-migrating adults, but 39 school-age children accompanying 100 out-migrating adults. The selection of these
-0.3
-0.2
-0.1
0
0.1
0.2
0.3
0.4
00-0
4
05-0
9
10-1
4
15-1
9
20-2
4
25-2
9
30-3
4
35-3
9
40-4
4
45-4
9
50-5
4
55-5
9
60-6
4
65-6
9
70-7
4
75-7
9
80-8
4
85+
Age Groups
Mig
ratio
n R
ate
15
migration flows means that there are about 16 more children leaving the area, even if the numbers of in and out-migrating adults were to be equal. The result of these in- and out-migration flows is that there is a strong selection of pre-school and school-age children accompanying parents to be participating in net out-migration. The net in-migration to the area is primarily younger adults who typically do not bring pre-school and school-age children with them.
Figure 11. In, Out, and Net Migrants by Age for the Portland Public School Area Population, Estimates for the 1991 to 1996 Period.
Evidence from the demographic model constructed for the Portland Public School area suggests that, if anything, there were slight increases in the level of net out-migration for the preschool and school-age population after 1995. If the level and age-sex composition of net migration had not changed after 1995, the model indicates that there would have been about 200 to 400 more students enrolled in the Portland Public Schools in October 1999. It is hard to know the reasons for out-migration from the Portland Public Schools area. The location of employment opportunities in metropolitan Portland has been changing and may have affected decisions to move closer to work. Housing prices have increased over the past decade, influencing the relative price of housing in the metropolitan area. Couples seeking larger homes may find more affordable housing outside the City of Portland. Finally, there are many lifestyle factors -- proximity to parks, theatres, rivers, and mountains -- that influence the choice of housing. 6. DO CHANGES IN CHOICE OF PUBLIC, PRIVATE, AND HOME SCHOOLING ACCOUNT
FOR ENROLLMENT TRENDS? Parents can enroll their children in either public or private schools, or may choose to home school their children. Given a specific population of school age children, changes in the relative percentage of children in one schooling option will necessarily affect the percentages of children in the other two options. Public schools have traditionally enrolled the vast majority of American school children. However, some parents are choosing private or home schooling because of perceived advantages of these two options over the traditional public school option. A previous section described trends for public school enrollment. The sections below review trends for enrollments in private and home schooling.
0 10 20 30 40 50 60 70 80(20,000)
(1 0,000)
0
1 0,000
20,000
30,000
Age
Number of Migrants
In
Migrants
Out
Migrants
Net
Migrants
16
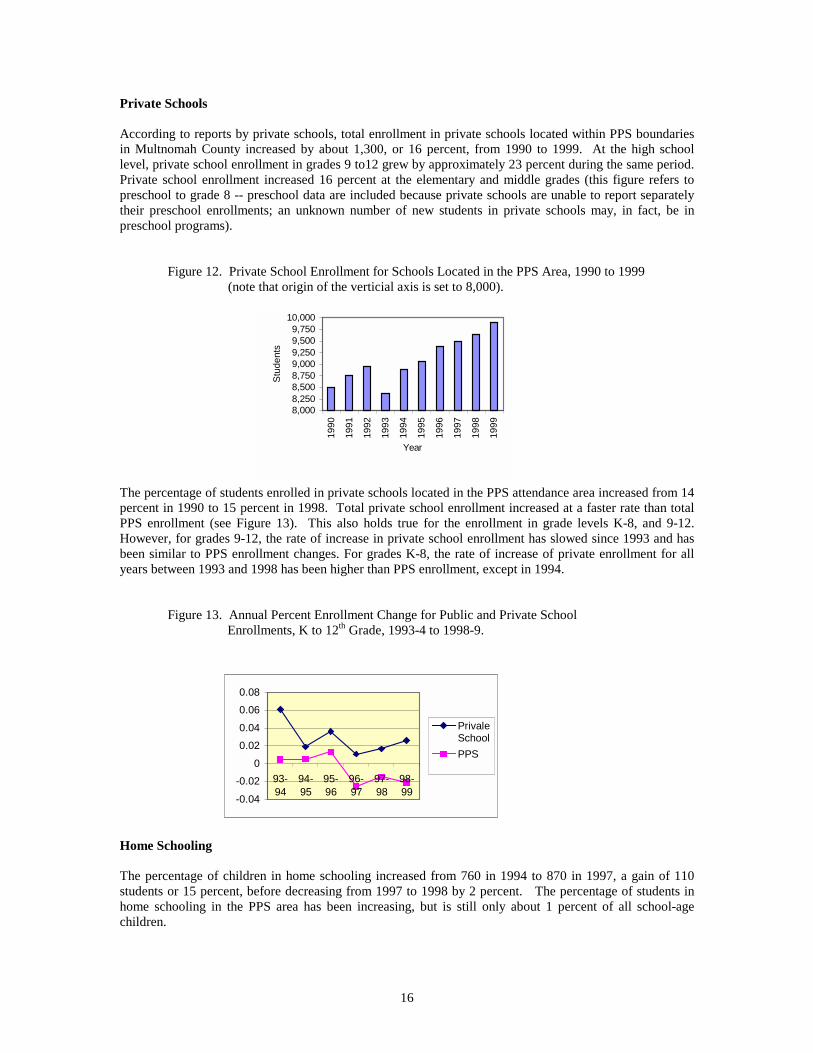
Private Schools According to reports by private schools, total enrollment in private schools located within PPS boundaries in Multnomah County increased by about 1,300, or 16 percent, from 1990 to 1999. At the high school level, private school enrollment in grades 9 to12 grew by approximately 23 percent during the same period. Private school enrollment increased 16 percent at the elementary and middle grades (this figure refers to preschool to grade 8 -- preschool data are included because private schools are unable to report separately their preschool enrollments; an unknown number of new students in private schools may, in fact, be in preschool programs).
Figure 12. Private School Enrollment for Schools Located in the PPS Area, 1990 to 1999 (note that origin of the verticial axis is set to 8,000).
The percentage of students enrolled in private schools located in the PPS attendance area increased from 14 percent in 1990 to 15 percent in 1998. Total private school enrollment increased at a faster rate than total PPS enrollment (see Figure 13). This also holds true for the enrollment in grade levels K-8, and 9-12. However, for grades 9-12, the rate of increase in private school enrollment has slowed since 1993 and has been similar to PPS enrollment changes. For grades K-8, the rate of increase of private enrollment for all years between 1993 and 1998 has been higher than PPS enrollment, except in 1994.
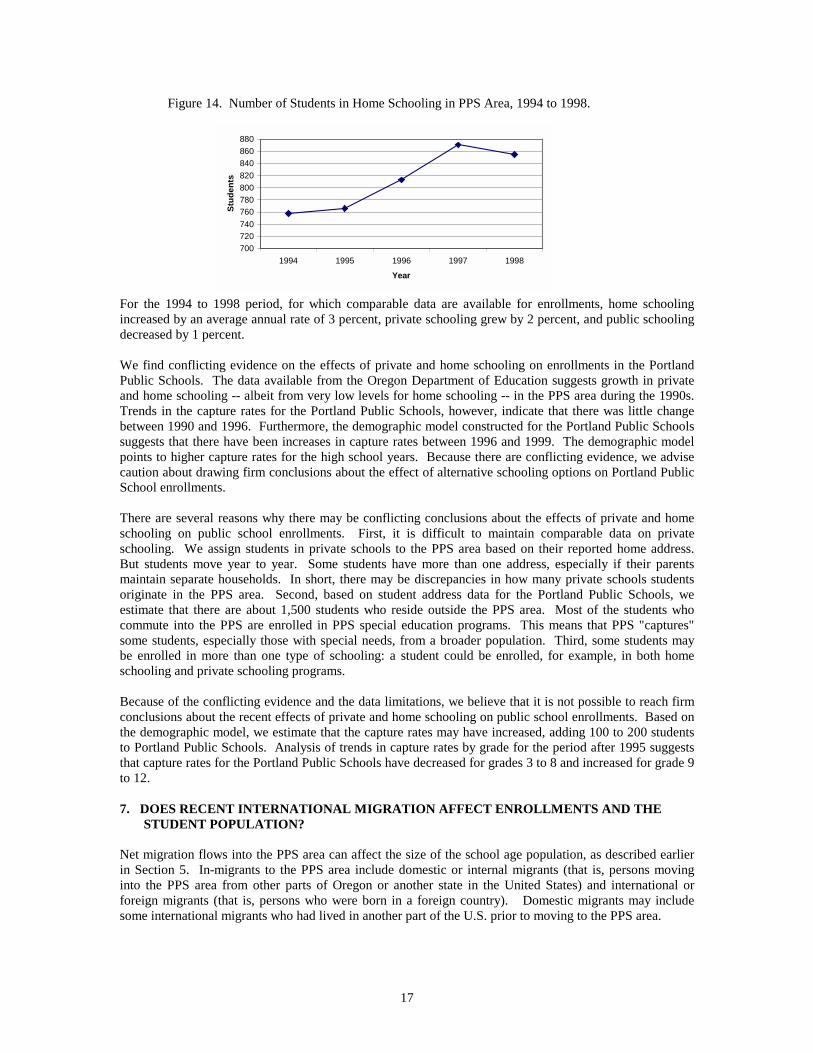
Figure 13. Annual Percent Enrollment Change for Public and Private School Enrollments, K to 12th Grade, 1993-4 to 1998-9.
Home Schooling The percentage of children in home schooling increased from 760 in 1994 to 870 in 1997, a gain of 110 students or 15 percent, before decreasing from 1997 to 1998 by 2 percent. The percentage of students in home schooling in the PPS area has been increasing, but is still only about 1 percent of all school-age children.
-0.04
-0.020
0.020.04
0.060.08
93-94
94-95
95-96
96-97
97-98
98-99
PrivaleSchoolPPS
8,0008,2508,5008,7509,0009,2509,5009,750
10,00019
90
1991
1992
1993
1994
1995
1996
1997
1998
1999
Year
Stud
ents
17
Figure 14. Number of Students in Home Schooling in PPS Area, 1994 to 1998.
For the 1994 to 1998 period, for which comparable data are available for enrollments, home schooling increased by an average annual rate of 3 percent, private schooling grew by 2 percent, and public schooling decreased by 1 percent. We find conflicting evidence on the effects of private and home schooling on enrollments in the Portland Public Schools. The data available from the Oregon Department of Education suggests growth in private and home schooling -- albeit from very low levels for home schooling -- in the PPS area during the 1990s. Trends in the capture rates for the Portland Public Schools, however, indicate that there was little change between 1990 and 1996. Furthermore, the demographic model constructed for the Portland Public Schools suggests that there have been increases in capture rates between 1996 and 1999. The demographic model points to higher capture rates for the high school years. Because there are conflicting evidence, we advise caution about drawing firm conclusions about the effect of alternative schooling options on Portland Public School enrollments. There are several reasons why there may be conflicting conclusions about the effects of private and home schooling on public school enrollments. First, it is difficult to maintain comparable data on private schooling. We assign students in private schools to the PPS area based on their reported home address. But students move year to year. Some students have more than one address, especially if their parents maintain separate households. In short, there may be discrepancies in how many private schools students originate in the PPS area. Second, based on student address data for the Portland Public Schools, we estimate that there are about 1,500 students who reside outside the PPS area. Most of the students who commute into the PPS are enrolled in PPS special education programs. This means that PPS "captures" some students, especially those with special needs, from a broader population. Third, some students may be enrolled in more than one type of schooling: a student could be enrolled, for example, in both home schooling and private schooling programs. Because of the conflicting evidence and the data limitations, we believe that it is not possible to reach firm conclusions about the recent effects of private and home schooling on public school enrollments. Based on the demographic model, we estimate that the capture rates may have increased, adding 100 to 200 students to Portland Public Schools. Analysis of trends in capture rates by grade for the period after 1995 suggests that capture rates for the Portland Public Schools have decreased for grades 3 to 8 and increased for grade 9 to 12. 7. DOES RECENT INTERNATIONAL MIGRATION AFFECT ENROLLMENTS AND THE
STUDENT POPULATION? Net migration flows into the PPS area can affect the size of the school age population, as described earlier in Section 5. In-migrants to the PPS area include domestic or internal migrants (that is, persons moving into the PPS area from other parts of Oregon or another state in the United States) and international or foreign migrants (that is, persons who were born in a foreign country). Domestic migrants may include some international migrants who had lived in another part of the U.S. prior to moving to the PPS area.
700720740760780800820840860880
1994 1995 1996 1997 1998
Year
Stud
ents
18
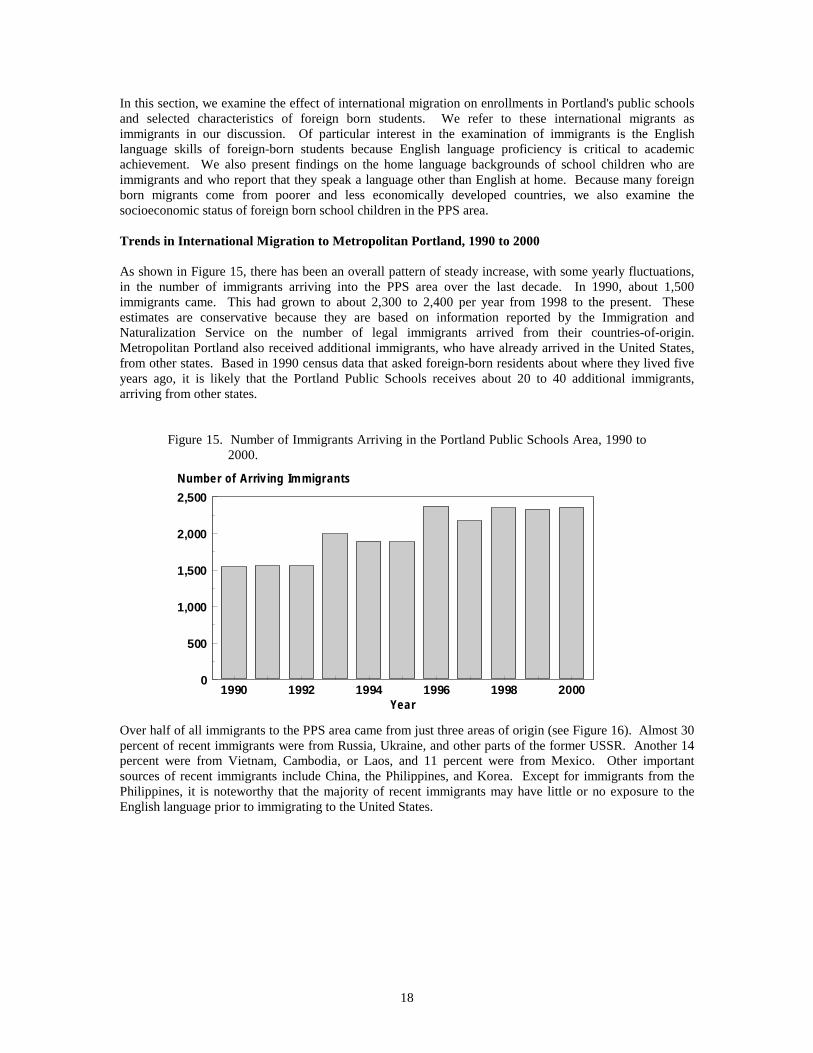
In this section, we examine the effect of international migration on enrollments in Portland's public schools and selected characteristics of foreign born students. We refer to these international migrants as immigrants in our discussion. Of particular interest in the examination of immigrants is the English language skills of foreign-born students because English language proficiency is critical to academic achievement. We also present findings on the home language backgrounds of school children who are immigrants and who report that they speak a language other than English at home. Because many foreign born migrants come from poorer and less economically developed countries, we also examine the socioeconomic status of foreign born school children in the PPS area. Trends in International Migration to Metropolitan Portland, 1990 to 2000 As shown in Figure 15, there has been an overall pattern of steady increase, with some yearly fluctuations, in the number of immigrants arriving into the PPS area over the last decade. In 1990, about 1,500 immigrants came. This had grown to about 2,300 to 2,400 per year from 1998 to the present. These estimates are conservative because they are based on information reported by the Immigration and Naturalization Service on the number of legal immigrants arrived from their countries-of-origin. Metropolitan Portland also received additional immigrants, who have already arrived in the United States, from other states. Based in 1990 census data that asked foreign-born residents about where they lived five years ago, it is likely that the Portland Public Schools receives about 20 to 40 additional immigrants, arriving from other states.
Figure 15. Number of Immigrants Arriving in the Portland Public Schools Area, 1990 to 2000.
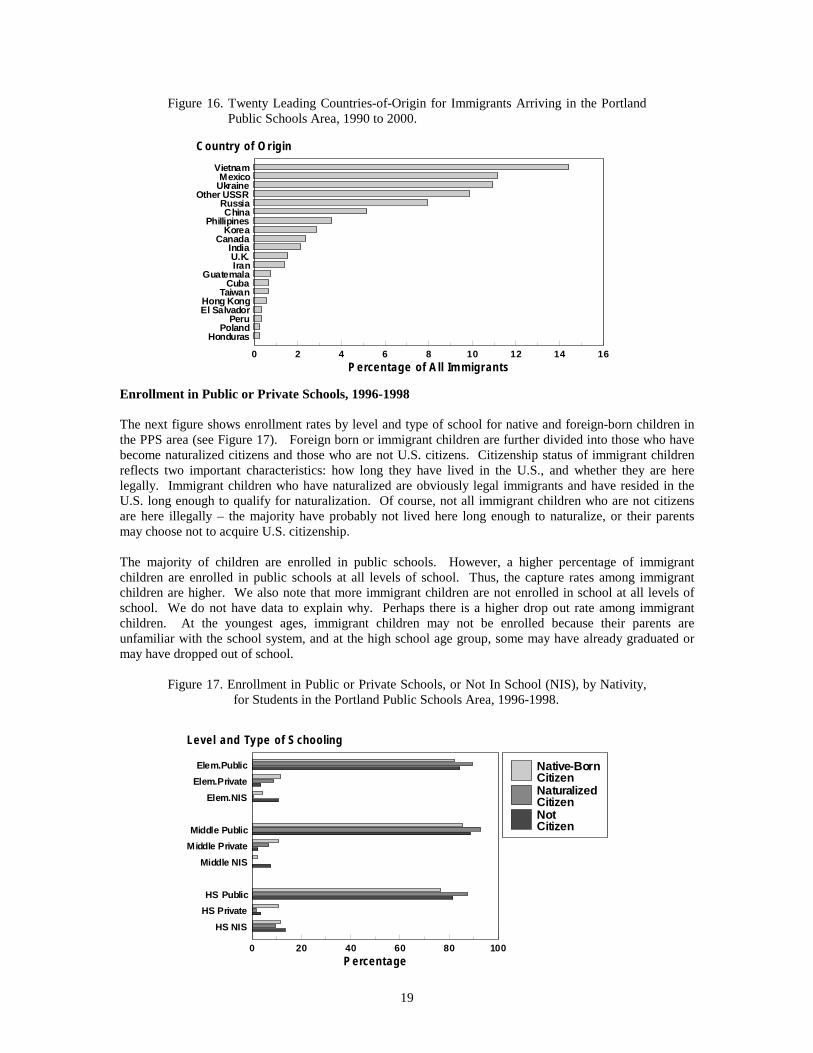
Over half of all immigrants to the PPS area came from just three areas of origin (see Figure 16). Almost 30 percent of recent immigrants were from Russia, Ukraine, and other parts of the former USSR. Another 14 percent were from Vietnam, Cambodia, or Laos, and 11 percent were from Mexico. Other important sources of recent immigrants include China, the Philippines, and Korea. Except for immigrants from the Philippines, it is noteworthy that the majority of recent immigrants may have little or no exposure to the English language prior to immigrating to the United States.
1 990 1 992 1 994 1 996 1 998 20000
500
1 ,000
1 ,500
2,000
2,500
Year
Number of Arriving Immigrants
19
Figure 16. Twenty Leading Countries-of-Origin for Immigrants Arriving in the Portland Public Schools Area, 1990 to 2000.
Enrollment in Public or Private Schools, 1996-1998 The next figure shows enrollment rates by level and type of school for native and foreign-born children in the PPS area (see Figure 17). Foreign born or immigrant children are further divided into those who have become naturalized citizens and those who are not U.S. citizens. Citizenship status of immigrant children reflects two important characteristics: how long they have lived in the U.S., and whether they are here legally. Immigrant children who have naturalized are obviously legal immigrants and have resided in the U.S. long enough to qualify for naturalization. Of course, not all immigrant children who are not citizens are here illegally – the majority have probably not lived here long enough to naturalize, or their parents may choose not to acquire U.S. citizenship. The majority of children are enrolled in public schools. However, a higher percentage of immigrant children are enrolled in public schools at all levels of school. Thus, the capture rates among immigrant children are higher. We also note that more immigrant children are not enrolled in school at all levels of school. We do not have data to explain why. Perhaps there is a higher drop out rate among immigrant children. At the youngest ages, immigrant children may not be enrolled because their parents are unfamiliar with the school system, and at the high school age group, some may have already graduated or may have dropped out of school.
Figure 17. Enrollment in Public or Private Schools, or Not In School (NIS), by Nativity, for Students in the Portland Public Schools Area, 1996-1998.
VietnamMexico
UkraineOther USSR
RussiaChina
PhillipinesKorea
CanadaIndiaU.K.Iran
GuatemalaCuba
TaiwanHong KongEl Salvador
PeruPoland
Honduras
0 2 4 6 8 1 0 1 2 1 4 1 6
C ountry of Origin
P ercentage of All Immigrants
Elem.Public
Elem.Private
Elem.NIS
Middle Public
Middle Private
Middle NIS
HS Public
HS Private
HS NIS
0 20 40 60 80 100
Level and Type of S chooling
P ercentage
Native-BornCitizenNaturalizedCitizenNotCitizen
20
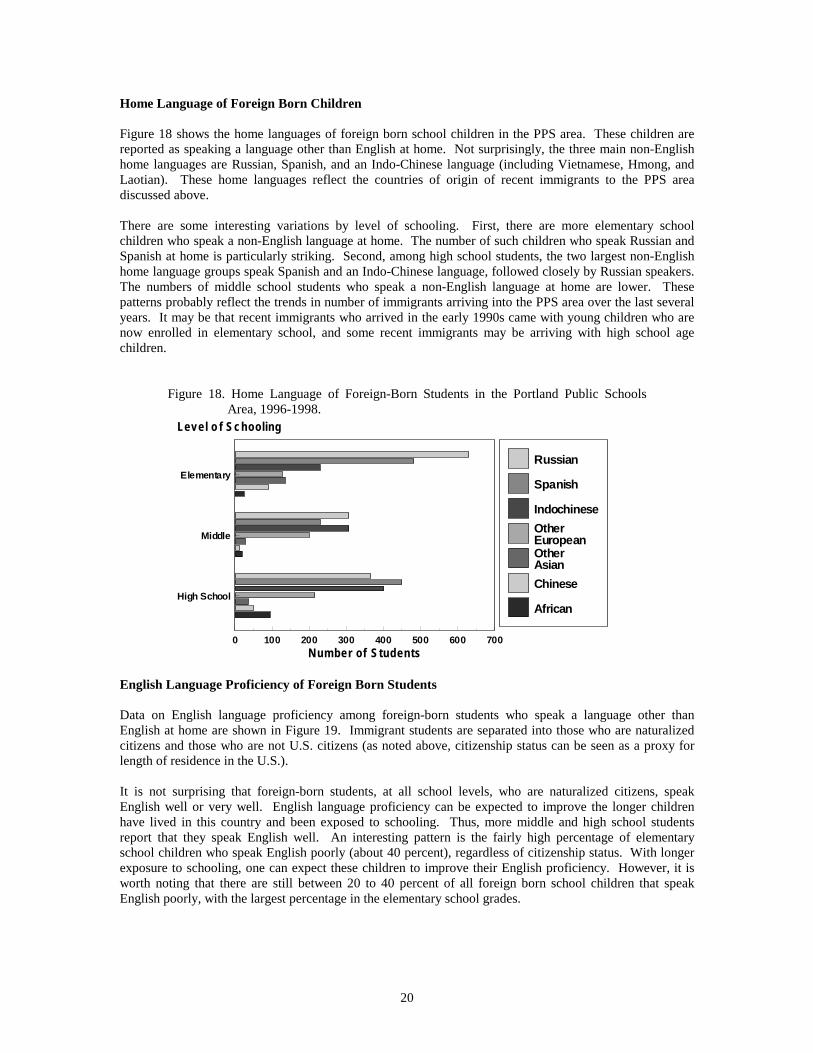
Home Language of Foreign Born Children Figure 18 shows the home languages of foreign born school children in the PPS area. These children are reported as speaking a language other than English at home. Not surprisingly, the three main non-English home languages are Russian, Spanish, and an Indo-Chinese language (including Vietnamese, Hmong, and Laotian). These home languages reflect the countries of origin of recent immigrants to the PPS area discussed above. There are some interesting variations by level of schooling. First, there are more elementary school children who speak a non-English language at home. The number of such children who speak Russian and Spanish at home is particularly striking. Second, among high school students, the two largest non-English home language groups speak Spanish and an Indo-Chinese language, followed closely by Russian speakers. The numbers of middle school students who speak a non-English language at home are lower. These patterns probably reflect the trends in number of immigrants arriving into the PPS area over the last several years. It may be that recent immigrants who arrived in the early 1990s came with young children who are now enrolled in elementary school, and some recent immigrants may be arriving with high school age children.
Figure 18. Home Language of Foreign-Born Students in the Portland Public Schools Area, 1996-1998.
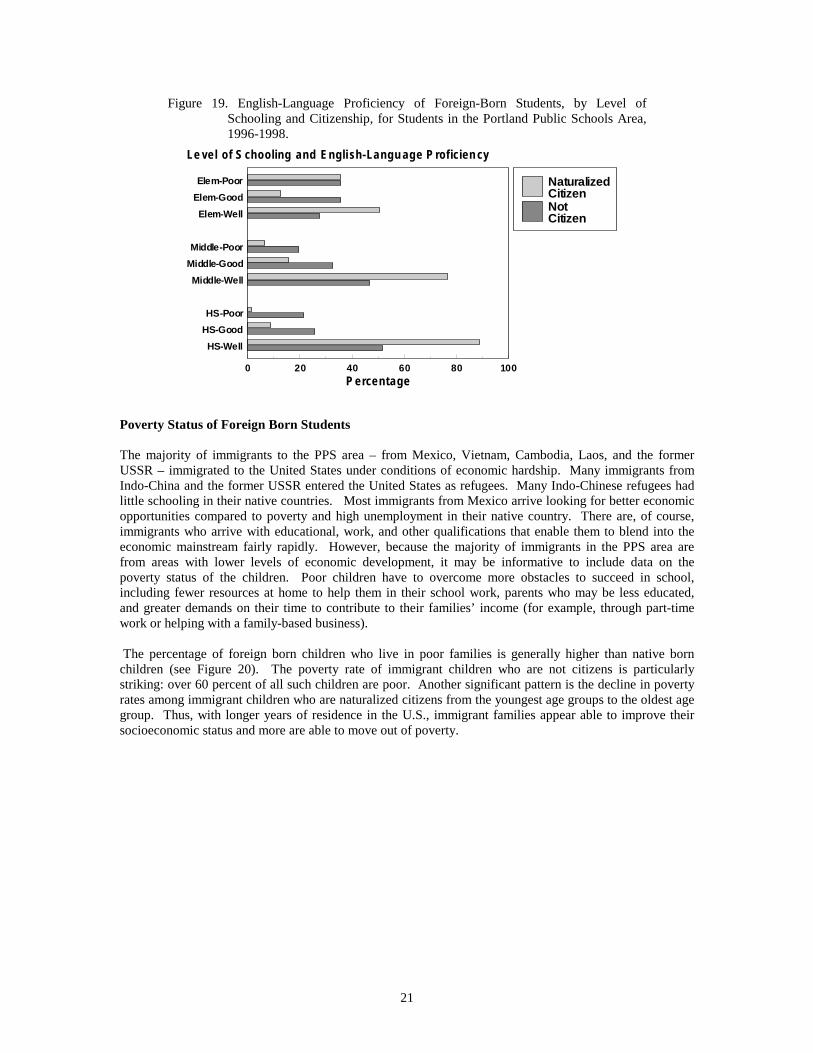
English Language Proficiency of Foreign Born Students Data on English language proficiency among foreign-born students who speak a language other than English at home are shown in Figure 19. Immigrant students are separated into those who are naturalized citizens and those who are not U.S. citizens (as noted above, citizenship status can be seen as a proxy for length of residence in the U.S.). It is not surprising that foreign-born students, at all school levels, who are naturalized citizens, speak English well or very well. English language proficiency can be expected to improve the longer children have lived in this country and been exposed to schooling. Thus, more middle and high school students report that they speak English well. An interesting pattern is the fairly high percentage of elementary school children who speak English poorly (about 40 percent), regardless of citizenship status. With longer exposure to schooling, one can expect these children to improve their English proficiency. However, it is worth noting that there are still between 20 to 40 percent of all foreign born school children that speak English poorly, with the largest percentage in the elementary school grades.
Elementary
Middle
High School
0 100 200 300 400 500 600 700
Level of S c hooling
Number of S tudents
Russian
Spanish
Indochinese
OtherEuropeanOtherAsian
Chinese
African
21
Figure 19. English-Language Proficiency of Foreign-Born Students, by Level of Schooling and Citizenship, for Students in the Portland Public Schools Area, 1996-1998.
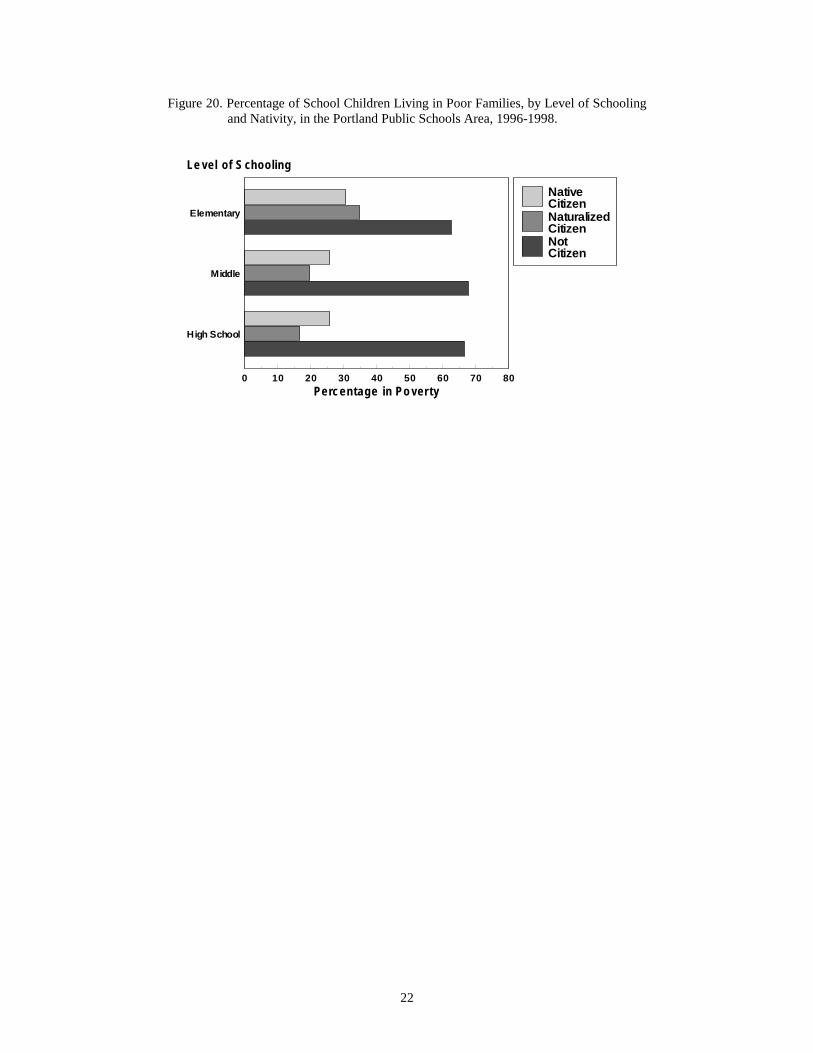
Poverty Status of Foreign Born Students The majority of immigrants to the PPS area – from Mexico, Vietnam, Cambodia, Laos, and the former USSR – immigrated to the United States under conditions of economic hardship. Many immigrants from Indo-China and the former USSR entered the United States as refugees. Many Indo-Chinese refugees had little schooling in their native countries. Most immigrants from Mexico arrive looking for better economic opportunities compared to poverty and high unemployment in their native country. There are, of course, immigrants who arrive with educational, work, and other qualifications that enable them to blend into the economic mainstream fairly rapidly. However, because the majority of immigrants in the PPS area are from areas with lower levels of economic development, it may be informative to include data on the poverty status of the children. Poor children have to overcome more obstacles to succeed in school, including fewer resources at home to help them in their school work, parents who may be less educated, and greater demands on their time to contribute to their families’ income (for example, through part-time work or helping with a family-based business). The percentage of foreign born children who live in poor families is generally higher than native born children (see Figure 20). The poverty rate of immigrant children who are not citizens is particularly striking: over 60 percent of all such children are poor. Another significant pattern is the decline in poverty rates among immigrant children who are naturalized citizens from the youngest age groups to the oldest age group. Thus, with longer years of residence in the U.S., immigrant families appear able to improve their socioeconomic status and more are able to move out of poverty.
Elem-Poor
Elem-Good
Elem-Well
Middle-Poor
Middle-Good
Middle-Well
HS-Poor
HS-Good
HS-Well
0 20 40 60 80 100
Le vel of S chooling and E nglish-Language P roficiency
P ercentage
NaturalizedCitizenNotCitizen
22
Figure 20. Percentage of School Children Living in Poor Families, by Level of Schooling and Nativity, in the Portland Public Schools Area, 1996-1998.
Elementary
Middle
High School
0 1 0 20 30 40 50 60 70 80
Le vel of S chooling
Perc entage in Poverty
NativeCitizenNaturalizedCitizenNotCitizen
23
APPENDICES Data Sources This report is based on data obtained from several sources, including: • Decennial Census. The decennial census is the only source of data collected for small areas across the
nation. We used 1980 and 1990 census data to calculate the population, by age and sex, residing in the Portland Public School area. We compared the changes from 1980 to 1990 to develop an estimate of the age-sex profile for net migrants.
• American Community Survey. This is a new U.S. Census Bureau survey that is being tested in
Multnomah County and several other sites in the United States. It was begun in 1996, with a large survey of households in Multnomah County, followed by smaller surveys in 1997 and following years. The American Community Survey asks the same questions as the 1990 census. We used the 1990 and 1996 American Community Survey data to develop estimates of household and population change, including estimates of net migration for the Portland Public School area. We relied on 1996, 1997, and 1998 American Community Survey information for analysis of foreign-born school-age children.
• Portland Public School Enrollment Data. Portland Public School staff furnished information on
enrollments for recent decades, including enrollments by grade for the past decade. We also obtained data files on all students in 1993, 1996, and 1999 with their residential addresses. These data are valuable for examining the in and out-flows of students in elementary school attendance areas.
• Birth and Death Data. Information on births and deaths reported for the Portland Public School area
were obtained from the Oregon Health Division. The data were used for two purposes. One use was for calculating overall fertility and mortality rates for the School District. These rates were used in the demographic model. The second use was to note the residence of the births in order to examine the correspondence between births and enrollment changes.
• Immigration Data. The Immigration and Naturalization Service provides limited immigration data for
local areas. Their data are restricted to the numbers of legal immigrants and refugees who declare that they intend to live in the metropolitan Portland area at the time of their arrival in the United States. Most of these arrivals do, in fact, move to their intended place of residence. The INS data are tabulated for countries-of-origin, providing information each year about how many legal immigrants and refugees arrive in metropolitan Portland.
• Private Schooling Data. We rely on two sources of information on private schooling for this report.
One source is from the Oregon Department of Education. These data originate from reports at the local level about the number of students who attend private schools. A second source was obtained by a survey that we conducted in February 2000. We phoned all known private schools in the Portland area, requesting information about their enrollments and the places of residence for their students. We compared this information to the reports obtained by the Oregon Department of Education.
• Home Schooling Data. Information on the number of students in home schooling were obtained from
the Multnomah Educational Service Department. Demographic Model Our demographic enrollment model uses a "cohort-component" model, moving cohorts or age groups through time based on the components of birth, death, and migration. Specifically, the model takes a beginning population in the Portland Public School District by age and sex, and moves the population five-years at a time, subject to fertility, mortality, and migration. The model uses the following definition:
Population in 1995 = Population in 1990 + Births - Deaths +/- Net In-Migration
24
The next step in the model is to calculate school enrollment based on the number of children in each age group. To do this, we assign children and youth in the school ages, for single age groups, to grade levels, kindergarten to 12 grade, assuming that most children are enrolled in school. Using 1990 census data, we calculate a "capture rate" that expresses the proportion of children in a grade level that are enrolled in the Portland Public Schools, using 1990 school enrollment data. For the forecast, we used birth rates based on Multnomah County data published by the Oregon Health Division's vital statistics office. Death rates are from mortality rates for the State of Oregon. Net migration is a key variable for our analysis. We make an initial estimate based on a comparison of the Portland Public School District's 1980 and 1990 population by age and sex. We adjust the historical net in-migration data for Portland School District's population in order to predict adequately enrollment from 1990 to 1995. This "calibration" of the model is useful. It makes sure that the assumptions that we make about births, deaths, and migration correspond closely to actual changes in school enrollment from 1990 to 1995. Project Staff This report involves the work of faculty and staff at Portland State University, including: • Barry Edmonston is the Director, Population Research Center, and Professor, School of Urban Studies
and Planning. He was responsible for all aspects of the study and the preparation of the final report. • Richard Lycan is Professor Emeritus of Geography, Population Research Center. He developed
population and fertility estimates, analysis of the relationship of housing and enrollments, and offered his expertise for other data analyses.
• Sharon M. Lee is Associate Professor, Department of Sociology. She prepared the section of the report dealing with immigration, foreign-born students, foreign languages spoken, and English language proficiency of students. She also helped with the overall review and writing of the report.
• Risa Proehl is Research Assistant at the Population Research Center. She developed the research on population, enrollment, and migration trends and directed the data collection on private and home schooling enrollments.
• Carlos Vilalta, a graduate student in the School of Urban Studies and Planning, assisted on the development of the private school enrollment database.
• Sarah Leffert, a student administrative assistant at the Population Research Center, conducted the private school survey.
The work for this report could not have been completed without the assistance and contributions of Portland Public School staff including Pam Brown, Cary Hampton, Theresa White. Dozens of educational staff also cooperated with the work, providing enrollment figures for private schools operating in the metropolitan Portland area. Although these people are too numerous to list, they deserve thanks for their cooperation and assistance. Our thanks to Jennifer Woodward, Oregon Health Division, for her assistance in accessing the birth records for Multnomah County and to Bob Jones, Oregon Department of Education, who helped with the use of Oregon's private school data.