Embed Size (px)
Citation preview
Retrospective Theses and Dissertations Iowa State University Capstones, Theses andDissertations
1943
Changes produced in growth, reproduction, bloodand urine of rats by ingestion and oraladministration of cobalt saltsElbert G. SmithIowa State College
Follow this and additional works at: https://lib.dr.iastate.edu/rtd
Part of the Dietetics and Clinical Nutrition Commons, Human and Clinical NutritionCommons, and the Medical Nutrition Commons
This Dissertation is brought to you for free and open access by the Iowa State University Capstones, Theses and Dissertations at Iowa State UniversityDigital Repository. It has been accepted for inclusion in Retrospective Theses and Dissertations by an authorized administrator of Iowa State UniversityDigital Repository. For more information, please contact [email protected].
Recommended CitationSmith, Elbert G., "Changes produced in growth, reproduction, blood and urine of rats by ingestion and oral administration of cobaltsalts " (1943). Retrospective Theses and Dissertations. 13079.https://lib.dr.iastate.edu/rtd/13079
INFORMATION TO USERS
This manuscript has been reproduced from the microfilm master. UMI films
the text directly from the original or copy submitted. Thus, some thesis and
dissertation copies are in typewriter face, while others may be from any type of
computer printer.
The quality of this reproduction Is dependent upon the quality of the
copy submitted. Broken or indistinct print, colored or poor quality illustrations
and photographs, print bleedthrough, substandard margins, and improper
alignment can adversely affect reproduction.
In the unlikely event that the author did not send UMI a complete manuscript
and there are missing pages, these will be noted. Also, if unauthorized
copyright material had to be removed, a note will indicate the deletion.
Oversize materials (e.g., maps, drawings, charts) are reproduced by
sectioning the original, beginning at the upper left-hand comer and continuing
from left to right in equal sections with small overlaps.
ProQuest Infomiation and Leaming 300 North Zeeb Road, Ann Arbor, Ml 48106-1346 USA
800-521-0600


CHANGES PRODUCED IN GROWTH, REPRODUCTION, BLOOD AND URINE OP RATS BY INGESTION AND ORAL
ADIflNISTRATION OF COBALT SALTS
by
Elbert G. Smith
A Thesis Submitted to the Graduate Faoulty for the Degree of
DOCTOR OP PHILOSOPTfY
Major Subject: PhysloloGlcal and Nutritional Chemistry
* • • •
Approved:
• • • ••• •• • • • • •••• • • • • • • • • • •• • * # • • • • • • • • • • • • • • • » • • • • * • • • •
I Charge of
• .. . • . • • • • * • • • ! • • • • « • • • • • • •. • • •
• ••• •••
In Cnaree of IJaJor Work
Head'of Ma^or Department
Dean or Graduate Cdllege I of Graduate Cdllc
Iowa State College 1943
Signature was redacted for privacy.
Signature was redacted for privacy.
Signature was redacted for privacy.
UMI Number: DP12297
(ft
UMJ UMI Microform DP12297
Copyright 2005 by ProQuest Information and Learning Company.
All rights reserved. This microform edition is protected against unauthorized copying under Title 17, United States Code.
ProQuest Information and Learning Company 300 North Zeeb Road
P.O. Box 1346 Ann Arbor. Ml 48106-1346
q/p&'5 5~ cc
5 vo-1
- li -
TABLE OP COlTTEJiTS
Page
INTRODUCTION 1 Statoment of the Problem 2
T1I5T0RICAL 4 Cobalt In Anlnal Hutpltlon 4 Physiological Effects of Cobalt Salts on Animals.•• 9
Hematopoietic action. 9 Toxic effects * IS Elimination aftor ingestion or 5.nJootion 20 Effects on some enzyme systems 22 Effects on the action of insulin. 25
Analytical Methods for Determination of Cobalt in Biological Material* 20
Cobalt Content of Plant Materials. 33 Cobalt Content of 'nimal Materials. 56
EXPlin^IMENTAL 41 Plan of Experiment 41 Materials and Methods 42
Rations 42 Care of animals 44 Operative methods 46 Analytical methods 49 Chemicals 51
Presentation of Data... 52 Orowth.. 52 Reproduction 65 Lactation* 72 Hemoglobin formation 72 Distribution of cobalt in the tissues 74 Rate of deposition of cobalt in the liver 81 Toxicity of cobalt salts adioinistered by
stomach tube 81 Effect of cobalt salt in tlie diet on raducing
sugar and albumin in the urine 83 Effoot of cobalt salt in the diet on non
protein nitrogen in the blood...........* 86 Effects on blood sugar of peroral administra
tion of cobalt chloride solutions alone and with urea, glucose and glycine 86
Effects of feeding glycine and cobalt chloride simultaneously to rats 98
T T7/3'^
- ill -
Paf;e
DISCUSSION 103
CONCLUSIONS 117
SUllT^iARY 122
LITERATURE CITED 126
ACKNOWLEDGi.narp 138
INTRODUCTION
At the end of the first transition group in the periodic
arrangement of the elements, there occurs a group of elements
which have become of considerable biological Interest. These
elements, atomic mmibers twenty-five to thirty, ore manganese,
iron, cobalt, nickel, copper and zinc. With the exception of
iron, which is needed in larger quantities than the other ele
ments, the animal body apparently requires most of the other
elements in very small amounts in order to maintain health.
Accordingly, these elements are among those known as "trace
elements'* in animal nutrition.
Of these elements, iron is found chiefly in the heme
portion of hemoglobin but it is also found as an indispensable
constituent of all living cells in enzyme systems such as
cytochrome, catalase, peroxidase and other oxidases; copper hns
been shown to be necessary in the diet to permit the body to
utilize iron in hemoglobin formation; manganese deficiency in
the diet of female rats leads to a high mortality rate of the
young; a deficiency of zinc in the diet of rats causes a marked
decrease in intestinal absorption and the growth rate deoreases
50 per cent; nickel has never definitely been shown to be in
volved In animal nutrition, although it Is found in traces In
animal tissues; cobalt has recently been found to be an
- 2 -
Indispensable element In the nutrition of cattle and sheep In
order to prevent a deficiency disease which is usually fatal.
In general, the functions of most of these elements in animal
metabolism are not known. Thus the study of such trace elements
offers a wide field of research opportunities*
Statement of the Problem
Although cobalt salts have been shown to have some phys
iological effects upon various species of animals, there is no
report in the literature of nny integrated investigation of
these various effects of cobalt salts on any one species. Sev
eral studies of different aspects of the problem have been made
on the albino rat, Mua norveKlcus albinus. but some of these
seem to be based on data obtolned from experiments on only two
or three rats. In view of the common uee of the albino rat as
an experimental animal, it seemed that a study of some of the
various physlologicol effects of cobalt salts on this animal
might produce some new knowledge leading to an understanding
of the cobalt requirement of this animal or of the manner in
which cobalt acta within the organism. To that end a nutri
tional and biochemlcnl investigation was planned to furnish
information on the following questions:
1. What is the effect upon the growth of rats when
cobalt salts are added to an adequate basal ration?
2. Will cobalt salts added to the basal ration affect
the ret^roduction of rats?
will added cobalt salt In the diet affect the lacta
tion of female rats as measured by the success In
raising the young?
How Is cobalt distributed in the tissues of normal
rats and In the tissues of rats fed cobalt salts?
Which tissues absorb the greatest proportion of the
added cobalt?
How rapidly is cobalt deposited in those tissues
where It is found to be most abundant?
liVhat is the mlnlmvm lethal dose of cobalt salts when
given to rats by stomach tube?
What is the minimum amount of cobalt in the diet of
rats which will stimulate hematopoiesis?
Do ingested cobalt salts affect the concentrntion of
such normal blood constituents as reducing sugar and
non-protein nitrogen?
Does addition of cobalt salts to the diet affect the
amount of reducing sugar in the urine?
Will amino acids other than cystine, cysteine and
methionine detoxify cobalt within the organism?

- 4 -
HISTORICAL
Cobalt in Animal Nutrition
A "wasting disease" of cattle and especially of sheep
has long been known In various parts of the world. Affected
animals lose their appetites, show progressive emaciation and
develop an anemia. The anemia, however, sometimes does not
appear until very late In the course of the disease (3).
Affected sheep become "dark and sunken In the wool", the face
assumes a dirty gray color, there Is a marked pallor of the
visible membranes and the animals become depressed and listless
(42). The fleece of affected sheep shows a discontinuity co
incident with the onset of the disease, making the wool less
satlsfactox»y for use (74). The progressive emaciation gener
ally terminates fatally, although not usually for many weeks
after the first symptoms appear. In Scotland the disease Is
called "pine"; In Kenya, "Nakurultls" (65). In New Zealand
It Is known as "Morton Mains ailment" or "bush sickness"
(47). In Australia It Is called "wasting disease",'Enzootic
marasmus" (55) or "coast disease" (95). In Florida affected
sheep are "salt sick" or "hill sick" (120). In Michigan the
ailment is known as "Grand Traverse disease", "Lake Shore
disease" or "pica" (84).

- 5 -
Since one characteristic of the syndrome la that sheep
suffer from the disease only when pastured In certain areas and
recover when moved to "healthy" postures, it was long sus
pected that the disease might be due to some dietary defic
iency. In view of the anemic condition of affected animals It
was first thouglit that Iron was the deficient factor and some
workers found that administration of iron compounds cured the
disease (13) (65). In 1934, however, Pilmer (56), in Australia,
was able to show that the curative factor was not iron but some
contaminant In the iron compounds previously used to cure the
diseose. In addition, fJnderwood (142) found that the livers of
bush-sick sheep contained more than five times as much iron as
the livers of normal sheep, IndicHting that tho disease was
due to a deficiency of some substance necessary for the normal
utilisation of iron by the animal rather than a deficiency of
iron Itself. Underwood and Pilmer (148) were soon able to
show that tho deficient factor was cobalt. Seven sheep suf
fering from bush sickness were cured by feeding them cobalt
chloride solution at the rate of 0.1 to 2.0 milligrams of
cobalt per day. Almost simultaneously, Linos (95), working in
another part of Australia, announced the cure of two sheep
suffering from coast disease by doses of cobalt nitrate given
at the rate of one milligram of cobalt per day.
Since the initial discovery of the curative effects of
cobalt salts on this syndrome, investigators in other parts of
the world have reported similar success with such treatments.

- 6 -
These investigations are summarized in Table 1.
Table 1
Reports of Successful Treatment of Nutritional Deficiency Disease with Cobalt Salts
Location tAnimal
New Zealand Sheep New Zealand Sheep
Australia Sheep
South Australia Sheep
South Australia Sheep
Scotland Lambs
Western Canada Sheep
Florida Calves
Michigan Cattle
s Curative dose
4 mg. Co"^^ per week 1-2 mg. C03O4 twice
a week 0,1 mg, Co'^^per day
45 mg, C0SO4+45 mg. CUSO4 every two months Both Co^^ and Cu^"^ needed 1 mg. Co^^ per day
Not stated
5 mg. cobalt per day
Not stated
Investigators
Askew and Dixon (0) Hopklrk (73)
Pilmer and Underwood (57)
Scott (133)
Marston et aL (110)
Corner and Smith (43)
Bowstead and Sackvllle (34) Neal and Ahmann
(120) Klllham (84)
It has been found possible to treat the syndrome by feed
ing the animals salt licks containing cobalt chloride (42).
A close coz*relatlon has been found by a number of inves
tigators (4) (74) between the incidence of bush sickness and
the cobalt content of pastures (pasture plants) eaten by the
animals. In areas where sheep were affected with bush sickness,
the cobalt content of pastures ranged from 0.01 to 0.07 part
per million while pastures from "healthy" areas contained 0.2
to 1,0 part per million of cobalt.
- 7 -
Cobalt deficiency in plant materials has been traced to
n cobalt deficiency In the soils on which the plants were
grown (80) (124) (135) (146) and Investigators In different
parts of the world have found It possible to Increase effec
tively the cobalt content of such soils by treating them with
fertilizers containing cobalt chloride or cobalt nitrate (10)
(103) (139). Such treatment Increased the cobalt content of
pastures grown on the soils and prevented bush sickness In
sheep pastured on them (7) (116).
Although some Investigators seem to believe that cobalt
deficiency Is the sole cause of bush sickness, others maintain
thdt It may be complicated by deficiencies of other elements
such as copper or even Iron. This may very well be true, con
sidering the wide geographic distribution of the ailment and
the consequent wide variation In soil deficiencies which might
be encountered. In addition, the amount of cobalt necessary
to cure the syndrome must be expected to vary since cobalt-
deficient soils of various localities are not all equally
deficient und varying amounts of cobalt would thus be found In
plant materials grown on such soils. Consequently, the amount
of cobalt needed In the diet for adequate nutrition of cattle
and sheep cannot be stated precisely. It Is probably of the
order shown In the table on page ti.
Due to the extreme difficulty In preparing cobalt-free
basal rations, the cobalt requirements. If any, of other animals
are not known. Underwood and Elvehjem (144) fed rats on a milk
- 8 -
diet with added salts of copper. Iron and cobalt. They found
no hemoglobin incroase or growth response over those of rats
fed the diet without added cobalt. Analysis of the ration by
the nitroso-R~salt method showed a cobalt content of eleven
micrograms per liter, corresponding to a daily intake of 0,6
microgram of cobalt per rat. They concluded that if cobalt is
required by the rat, it must be in amounts of 0.6 microgram or
less per day.
Dixon (4B) gave a drench of a cobalt salt at the rate of
four milligrams of cobalt twice weekly to one cow each of
seven poira in a "sheep-sick" area and found that the milk
yield was not altered significantly from that of tlse paired
controls.
Bertrand and Nakamure (29) attempted to prepare a nickel-
and cobalt-free ration (composition unstated) which they fed
to mice, both with and without supplements of cobalt sulfate
and nickel chloride. The mice receiving the supplement axuc-
vived an averngo of 23.1 days while those not receiving the
supplement survived an average of 19.7 days. These workers
interpreted this data as indicating the physiological im
portance of cobalt and nickel. Their method of freeing the
ration of nickel and cobalt, however, would also remove all the
water-soluble vitamins and the growth curves they presented
showed typical vitamin-deficient growth responses by the mice
used in the experiments.
- 9 -
Pfaysiologleal Effects of Cobalt and Cobalt Salts on Animals
Hematopoietic action
In 1929 Waltner and Waltner (150) observed that the hemo
globin and ex*ythrocyte count of rats weighing 130 to 200 grams
increased by 20 per cent within 24 hotirs after subcutaneous in
jection of 100 milligrams of cobalt nitrate in solution. The
hemoglobin values and the erythrocyte count also were increased
20 per cent to 25 per cent when two per cent of metallic cobalt
was added to the ration of rats. These animals died within two
to three weeks, however. With 0.5 per cent of metallic cobalt
added to the ration, rats survived six to seven months, on an
average. The average erythrocyte count rose to 10,500,000 and
the hemoglobin concentration increased to 165 per cent. These
values persisted until the death of the rat. If cobalt was re
moved from the diet, both erythrocyte count and hemoglobin
value decreased to normal levels. Later Waltner (149) fed
daily doses of 10 to 60 milligrams of metallic cobalt and 50 to
300 milligrams of CoAsg to 21 children suffering from secondary
anemia. The number of eirythrocytes increased an average of 32
per cent in 14 oases. The other seven children were not bene
fited. The hemoglobin concentrations and the leucocyte counts
remained unchanged.
Mascherpa (112) fed dally doses of ten milligrams of
metallic cobalt to a normal dog, to a dog which had been bled
- 10 -
to produce anemia, to a dog which had been fed a milk diet and
to a dog which had been bled and kept on a milk diet, each with
another dog as a control, receiving the same treatment but not
receiving cobalt. The dogs receiving cobalt showed a slightly
higher hemoglobin concentration and erythrocyte count than the
controls and Mascherpa considered this evidence of the hemato
poietic action of oobalt.
Brewer (35) later discounted these experiments. He
claimed that variations of 15 to 20 per cent in erythrocyte
count are normal in dogs and that daily doses of powdered
cobalt chloride furnishing 4.0 milligrams of cobalt ion per
day did not produce erythrocytosis in any one of four dogs after
26 days of treatment. Later Brewer (36) reported that a dose in
excess of five milligrams of cobalt (fed as oobalt chloride)
per kilogram of body weight was necessary to increase sig
nificantly the hemoglobin concentration in dogs. Similarly,
no regularly significant increase in ez*ythrocyte count occurred
until the omount of cobalt fed as cobalt salt exceeded ten
milligrams per day per kilogram of body weight.
Davis (44) claimed that the erythrocyte count of normal
dogs should not vary more than seven per cent from one day to
the next. He found that feeding dogs a solution of two milli
grams of cobalt chloride (in l/lOOO dilution) per kilogram of
body weight per day increased the erythrocyte count 20 per cent
in two weeks.
Folonovski and Briskas (126) fed cobalt chloride to dogs
- 11 -
made anemic by a milk diet. Ten to thirty milligrams of the
salt were given every two or three days. The animals' weight
decreased, the erythrocyte count increased from 2,000,000 to
5,000,000 but there was no effect on the hemoglobin concentra
tion.
Davis (46) found that cobalt polycythemia in dogs is
accompanied by an increase of blood volume due chiefly to an
increased volume of cells.
In an investigation of the effect of cobalt on sheep.
Bell (IB) found that cobalt did not stimulate the formation
of abnormal numbers of erythrocytes. Later Bell (10) re
ported that an anemia often accompanies bush sickness in sheep
but that the sickness also occ\u>o without anemia. Josland
(77) gave a drench of cobalt sulfate to four sheep at the
rate of one milligram of cobalt per 200 grams of body weight
per day for seven weeks. One shoop developed a polycythemia and
two sheep developed a mild anemia. Two hoggets drenched with
five milligrams of cobalt (given as cobalt sulfate) per day for
ten months became anemic. No data on the blood picture were
presented.
Josland (76) fed two rats a stock diet with one per cent
of anhydrous cobalt sulfate added. Two other rats received the
stock diet only. He reported an intense polycythemia and loss
of body weight within seven weeks In the rats receiving the
cobalt sulfate. Josland and McNaught (78) found that one
milligram of cobalt (fed as cobalt sulfate) given daily to

- 12 -
eight rats produced persistent polycythemia in only one rat and
transient polycythemia in the others. The early hematopoietic
effect was not sustained. After the first sixteen weeks, the
erythrocyte count fell to the level of the controls. The
hemoglobin concentration increased for 32 weeks and then de
creased.
In a study of the effects of heavy metals on anemia, K. V?.
Schultze (131) reported that dally doses of 0.5 to 2.0 milli
grams of cobalt added as cobalt chloride to a milk diet fed to
rats increased the erythrocyte count from 6,000,000 to
'*0,000,000 within ten days while the hemoglobin concentration
was unaffected. The rats died within ten days. Polonovskl
and Briskas (126) fed one milligram of cobalt chloride per
day to rats made anemic by a milk diet and observed an aver
age erytyirocyte Increase from 4,600,000 to 6,9u0,000. White
cells increased slightly from 20,000 to 25,00J. Hemoglobin
rose from 60 per cent to 70 per cent. Feeding two milligrams
of cobalt chloride per day increased these values somewhat.
The mechanism of the polycythemic action of cobalt la un
known, although several investigators have tried to attack the
problem. Berwald, Arsenau and Dooley (30) found that splen
ectomy prevented daily Injections of cobalt from increasing the
erythrocyte count in rats. They pointed out, however, that
this might be due to an anemia produced by Bartonella murls. a
common Infection in splenectomies. Orten (121) found that the
proportion of reticulocytes Increased somewhat preceding the

- 13 -
increase of hemoglobin and erythrocytes in cobalt polycythemia.
He thought this to represent an increased rate of formotion of
erythrocytes rather than a decreased rate of destruction. He
concluded that the effect of cobelt was due to an active stimu
lation of the hematopoietic organs rather than the enhancing
of a passive accximtilation of erythrocytes.
Barron and Barron (14) injected ten milligrams of cobalt
sulfate subcutaneously into rabbits daily and found a poly
cythemia to appear in six to seven days, accompanied by the
appearance of reticulocytes and erythroblasts. When 60 milli
grams of ascorbic acid were injected intravenously simultaneously
with the cobalt sulfate injection, the polycythemia failed to
appear in ten days. VHien the ascorbic acid injections were
discontinued, the polycythemia appeared within six to seven
days. They suggested that the cobalt inhibits the respira
tory function of immature ez^throcytes, causing them to be
thrown into the circulation as mature non-respiring cells.
They thought ascorbic acid to function as one of the regu
lators of the level of red cells in the circulatory system.
Davis (45) found that while both cobalt and anoxia pro
duce polycythemia In dogs, only the cobalt polycythemia is
depressed when daily injections of ascorbic acid are given at
the rate of eight milligrams per kilogram of body weight. He
found that the ascorbic acid content of blood of the dogs fed
cobalt was diminished. He suggested that cobalt might inter
fere with a respiratory function of vitamin C. Oral
- 14 -
adminlstrritlon of cobalt at the rate of two milligrams per day
produced polycythemia In dogs but had no other apparent effect.
Anderson, Underwood and Elvehjem (2) fed whole liver
powder, liver extract and pantothenic acid concentrnte to rats
with a cobalt polycythemia and found that these substances
aided In producing and maintaining a high level of cobalt
polycythemia when added to a milk diet containing a dally sup
plement of 0.7 mllllgramis of iron as the pyrophosphate, 0.07
mllllgrains of copper as the sulfate, 0,03 milligrams of mang
anese as the chloride and 0,7 milligrams of cobalt as the
chloride,
Michelazzl and Snviano (118) investiguted the polycy
themia caused by cobalt compounds In rabbits and guinea
pigs. They reported that 20 milligrams of cobalt chloride
Injected subcutaneously into rabbits or 15 milligrams in
jected subcutaneously Into guinea pigs produced n numerical
increase in erythrocytes. In the rabbit, the Increase was
as much as 3,000,000 above the original number. The ox*ythro-
cyte count receded spontaneously, however, after 16 to 24
hours*
Since Hart (08) and Potter, Elvehjem and Hart (127)
showed that copper was a necessary dietary factor in order
for anemic rats and dogs, respectively, to utilize iron for
hemoglobin regeneration, several investigators have studied
the effects of cobalt salts on this phenomenon. Underbill
and others (141) showed that cobalt salts, among other

- 15 -
oompounds, could not replace the copper as a supplement to Iron
In curing the nutritional anemia of rets.
McOhee (98) placed an alloy of iron, cobalt, manganese and
copper in milk in an ice box and fed the "metalized milk" so
obtained to rata whose hemoglobin concentration had been
lowered to 75 per cent. The rats to which the "metalized milk"
was fed showed rapid hemoglobin regeneration. There was a
lower mortality than when salts of these metals were added to
the milk. No attempt was made to determine the amounts of
these metals in the "metalized milk" fed nor were any experi
ments made with any other combinations of these metals.
Orten and others (122) added 0.5 milligram of cobalt
chloride or cobalt sulfate per day to a milk diet containing
0.5 milligram of iron and 0.025 milligram of copper and fed
this to young rats. They reported a marked polycythemia with
the hemoglobin content and ex^ythrocyte count Increasing on an
average about 50 per cent above the level of the controls not
given the cobalt salt. The cell volume Increased 25 per cent
but the leucocyte count was not significantly changed. Al
though cobalt and copper together produced a polycythemia,
when the copper was omitted from the diet the rats developed
an anemia and died. Later these workers (123) reported that
a milk-iron-copper-cobalt diet produced a true polycythemia
in rats characterized by an actual increase in cell volume.
They also found that added manganese alleviated the toxic
condition due to long administration of cobalt.
- 16 -
Beard and Andes (16) fed rats a milk diet with 0.25 nilli-
gram of iron added daily. Y.Tien 0.15 to 0.30 milligram of co
balt was added to this ration daily, a polycythemia occurred
without any increase in hemoglobin values. Hemoglobin and
erythrocytes were both increased when vitamin D and 0.30 milli
gram of cobalt ion per day were added to the milk-iron ration
and also when 0.30 milligram of cobalt ion and 0.05 milligram
of copper ion were added to the milk-iron ration. They con
cluded that copper, more than the amount present in the body
of the rat and in miUc, did not influence the production of
cobalt polycythemia.
Marshall (107) fed rats a milk diet to ifl^ich cod liver
oil and yeast had been added, together with a daily supplement
of 0.5 milligram of iron as the chloride, 0.025 millicram of
copper as the sulfate, 0.1 milligram of manganese as the sul
fate and 0.5 milligram of cobalt as the chloride. A poly-
oytheraia developed which was lowered only temporarily by daily
Injections of a concentrated liver extract.
Underwood and ELvehJem (144) fed rots a milk diet with
added copper, iron and cobalt salts. They reported no in
creased hemoglobin or growth response over that of rats fed
the milk, iron and copper without added cobalt salt. However,
they found enough cobalt present in the milk used to furnish
each rat with about 0.6 microgram of cobalt per day. They con
cluded that if cobalt is reqxiired in the nutrition of the rat,
it must be in amounts less than 0.6 microgram per day.

- 17 -
Proafc, Spltzer, Elvehjem and Hart (63) fed dogs on a milk
diet with added salts of copper, iron and manganese. Adding
three to six milligrams of cobalt ion per kilogram of body
weight produced a temporary polycythemia. In addition to this
transient effect, they found that feeding 40 milligrams of cobalt
ion daily to puppies produced no polycythemia at all. Vihen
dogs made anemic by bleeding were fed cobalt ion prior to feed
ing iron and copper, the normal hematopoietic response to the
iron and copper was inhibited. The hematopoietic activity was
resumed when whole dry liver or liver extract was fed.
Frost, Elvehjem and Hart (62) reported that while iron
and copper sufficed for normal hemoglobin regeneration in dogs
made anemic with a milk diet, 0.1 milligram of added cobalt
ion per day stimulated hematopoeisis in dogs where hemoglobin
formation was unusually slow with only iron and copper added
to the milk ration.
In summarizing the work on the hematopoietic effect of
cobalt salts, it may be said that most investigators have found
that cobalt compounds, in sufficient amounts, increase the
erythiTocyte count and the hemoglobin concentration in the
blood of several species of animals when ingested or injected,
although there seems to be considerable biological variation
In hematopoietic response between individual animals. There
is not much agreement in the literature as to the minimal
amount of cobalt necessary to cause hematopoiesis. The mech
anism by which the effect occurs is not definitely known.
- 10 -
although sono inveatlGators havo made tentative auggestions.
Toxic effeota
The physiological effects of ingestion of cobalt salts by
various species of animals have usually been studied in connec
tion with oxperiraonts on their hematopoietic effect or their
use in treating the cobalt deficiency syndrome previously dis
cussed. Josland (76), for example, in studying the hematopo
ietic action of oobalt sulfate on a pair of rats, observed that
addition of one per cent of anhydrous oobalt sulfate to a normal
ration piroduced loss of body weight and, in one rat, death,
within seven weeks. He found no cirrhosis of the liver in
either rat. Davis (44) found that feeding dogs two milligrams
of oobalt per kilogram of body weight per day for five months
produced no toxic symptoms other than polycythemia; similarly,
giving dogs six milligrams of cobalt (as cobalt chloride) per
kilogram per day by stomach tube produced no toxic symptoms in
three weeks. Josland (77) noted no toxic effects in the organs
of sheep which had been given a drench of cobalt sulfate daily
for seven weeks at the rate of one milligram of cobalt per 200
grama of body weight.
Griffith, Pavcek and Mulford (66) fed cobalt sulfate to
rats and supplemented the basal rations with cystine, choline
and cysteine, both individually and in combination. They found
that growth was decreasod by adding 0.12 per cent of cobalt
sulfate heptahydrate but that this toxic effect of the cobalt
- 19 -
salt was alleviated by the supplements of cystine and choline
and was especially relieved by cysteine* Cobalt is known to
form a complex with cystine and they believed that the detox
ification of the cobalt by those substances operated through
such a mechanism*
Sutter (137) subcutaneously injected small anoxmts of co
balt chloride in physiolocical salt solution^ pH seven, into
mice, frogs and guinea pigs* Besides observing a marked poly
cythemia, he determined the toxic dose of cobalt chloride to
be about two to three milligrams per ten grams body woiglit of
frogs and about one milligram per ton grams body weight of
mice* Yosada (153) reported the lethal subcutaneous doses of
cobalt chloride and cobalt sodixm citrate to be 0*1 milligram
of cobalt per ton grams of body welglit in frogs and 0.3
milligram of cobalt per ten grams of body weight in mice*
Caujolle (38) reported the lethal dose of cobalt chloride in
jected intravenously into dogs to be more than 30 milligrams
of cobalt per kilogram of body weight. Massol and Breton
(114) found that one milligra-n of cobalt sulfate injected into
the brain of a guinea pig did not produce death. Villaret,
Bertrand and Juotln-Beaan9on (148) reported that liver cirrho
sis resulted after hypodermic injections for five days a week
of two milliliters of 0.5 per cent cobalt acetate in guinea
pigs and fovir millilltera of one per cent cobalt acetate in
rabbits* They presented little data on their experiments or
observations, however. LeGoff, in a series of articles (90,
•• 20 ••
91, 92, 93), found that cobalt chloride, cobalt citrate and
cobalt salicylate produced a vasodilating action in the heed,
ears and face of men when isotonic solutions were injected
subcutaneously in doses of 0#01 to 0.05 gram of cobalt. The
reaction was instantaneous and lasted five to fifteen minutes
or more. There were no other toxic effects. Larcer doses
led to nausea and intestinal pain. In another study, LeGoff
(88) injected 0.09 gram of cobalt chloride into rabbits dally
for four months without observing any ill effects.
Elimination after ingestion or in .lection
Caujolle (37) injected 1/20 molar cobalt chloride solu
tions parenterally into a dog in whose bile duct a catheter
had been introduced. He found that after 147.5 milligrams of
cobalt chloride were injected parenterally, only 2.1 milU-
grans appeared in the bile. Caujolle and Lafitte (39) in
jected cobalt chloride solutions into dogs intramuscularly
and intravenously and found only traces of cobalt in the
bile. They found cobalt to be eliminated in both urine and
feces under these conditions. They thought that urinary elimi
nation occurred only slov/ly, but since their first urine anal
ysis was not made until ton hours after the injection, it is
difficult to see on v/liat evidence this idea is based. Stuart
(136) injected cobalt acid tartrate subcutaneously into several
species of animals and found that the volume of urine was gen
erally increased. He attributed this to an increased water
- 21 -
Intake by the animals. LoGoff (88) injected cobalt chloride
into rabbits and found that only 20 to 25 per cent of the co
balt was olirainated in the urine in the next 24 hours. The
cobalt was determined electrolytically in the ashed residue
from evaporation of the urine. Later LeOoff (89) injected
0.6 per cent cobalt chloride into men and women. After injec
tions of 24 mllllGrama of cobalt chloride, one subject elim
inated 6.0 milliGrans and 6.4 milHRrama in two teats. Another
subject (e diabetic) eliminated 2.64 mllliRrana. Tlie same
electrolytic method v/as used as before in determininp the
amount of cobalt present. Duval and LoOoff (51) determined
the amount of cobalt in htoman urine after intramuscular injec
tion of one to two milliliters of isotonic cobalt chloride
soliition. They claimed that some people did not eliminate co
balt for 24 hours after Injection. They concentrated the co
balt by electrolysis of the urine in a U-tube and determined
the amount of cobalt with alphanitroaobotanaphthol In acetic
acid. Maacherpa (111) gave docs, by mouth, one milligram of
metallio cobalt per kilogram of body weight and clalmcd tliat
the urinary nitrogen excretion waa increased, although hla data
do not seem to support this view.
In oxporlmento on mineral metabolism v/lth the use of
radioactive isotopes, Copp and Greenberg (40) gave Co®® as co
balt chloride to two 250 gram rats, both Intraperltoneally and
by stomach tube. Ninety-six hours after givlnc doses of ten
micrograms of cobalt ion, 0.46 microgram of cobalt was retained

- 22 -
after tho intraperitoneal Injection and 0»27 micrograia was re
tained nfter adninistrntion by stomnch tube, vnien parenterally
administered, the chief path of excretion was by the urine, al
though there was a small continuous elimination in the feces.
Over 60 per cent of tho cobalt was recovered in the feces after
adniniatration by stomach tube. Host of tho cobalt absorbed
was rapidly excreted in tho urine. In both cases 70 per cent
of the cobalt was excreted in the first ten hovirs and nor© than
90 per cent was excreted within two days.
Askew and Josland (11) dronched sheep with four milligrams
of cobalt chloride and determined tho amount of cobalt present
in tho urino and feooa by tho nitroao-R-salt method. V/ithin
24 hours of tho drenchinc, a large proportion of tho total co
balt found in the urlno had already been excreted and only a
small amount of cobalt appeared in the urine after 72 hours.
The cobalt in tho urlno, however, represented only 2 per cent
of tho total given, tho great bulk of it appearing in the
feces paased during tho first 48 hours aftor drenchlnc* "fter
120 hours, no cobalt from tho drench appeared In either urlno
or fecos. Apparently some cobalt was stored in the tissuos.
Effocts on some enzyme systems
Several investigators have studied the effects of cobalt
on various enzyme systems. Cori, Colowick and Cori (41), in a
study of tho enzymic conversion of glucose-l-phosphoric ester
to tho hexo3e-6-estor in tissue extracts, s2iowed that the
- 23 -
activity of tho phosphogluconutase involved was increased up to
fifteen times by the presence of cobalt ion, among other metal
lic ions tested. Lehmann (94) showed that both cobalt nitrate
and roduced glutathione increased the formation of hexoae-6-
phosphate from glycogen but not the glucose-l-phosphate, the co
balt nitrate being effective at lower concentrations than tho
glutathione, k l/050 molar cobalt nitrato solution added to
an undialyzed rabbit nuncle extract formed 0.1 milligram of
glucoso-l-phonphafce and 3.6 nilligran of tho hexose-6-phosphato
wliile a control run nimultaneously without cobalt nitrate
fomed 0.1 milligram and 2.6 milligrams respoctivoly. Tho co
balt could not act by tho sa:uo mechanion as tho reduced gluta
thione since it not only reacted at a much lower molarity but
actually roinovod free -SH groups, as shown by negative nltro-
prttsside tests*
Thannliauser, Roichel and Gratton (140) found that cobalt
ion increased tho ascorbic acid activation of senan p-glycero-
phosphatase. The cobalt ion and tho ascorbic acid formed a
complox.
Hellenaan and Terkins (70), in an investigation of the
role of metal Ions in the activation of arginase, found that
tho hydrolysis of arginine was induced by the activating action
of cobalt, nickel, manganous or ferrous ions on urease. The
minimum concentration of cobalt ion necessary for maximum acti
vation xinder conditions of the experiment was 1 x lO"^ molar.
Hellerraan and Stock (71) found that liver arginase action was
- 24 -
enhanced by nickel Ion and especially by cobalt ion fron pH
values of 5 to 7.7. Edlbacher and Baur (53) fotind that liver
arginase» Inactivated by several weeks dialysis, was reacti
vated by cobalt sulfate and other laetel sulfates in 0.001
molar concentration. Manganous sulfate was active at a con-
centration of 3.3 x lO" molar while other raetol sulfates were
not, so these workers believed man^^anese to bo the coenzyme.
Jacoby and Shimizu (75) found that 0.2 to 1.0 gram of
powdered metallic cobalt destroyed the activity of 25 milli
liters of 0.3 per cent urease solution in 20 minutes. Adding
five milliliters of five per cent glycocoll solution to ten
milliliters of urease solution inactivated by cobalt or one
milligram of potassium cyanide to 25 milliliters of inactivated
urease solution reactivated the enzyme. The glycocoll was the
more effective, however.
Michaelis and Stem (117) studied the effects of some
heavy metals on the activity of calf spleen cathepsins
against its ov/n spleen proteins. Ferrous sulfate, zinc sul
fate and cobalt sulfate increased the enzyme activity while
mercuric sulfate depressed the enzyme activity. If the activ
ity of the enzyme alone was called 100 per cent, then a mixture
of enzyme and cobalt sulfate (9.6 x 10"^ milligrams of cobalt
Ion per milliliter) showed tm activity of 124 per cent and a
mixture of enzyme and cobalthexamminchloride had an activity of
158 per cent.
- 25 -
Bemheim and Bemhelm (21) found that cobalt sulfate
partially, and manganese chloride completely inhibited the ox
idation of phospholipldes catalyzed by the washed liver pro-
toin-vanadium system. Nickel, iron, titanium and chromium
salts had no effect. Oxidation of cysteine to its sulfonic
acid by washed liver protein was also inhibited by cobalt,
manganese and titanivm salts. Cobalt salts added to rat
liver had little effect on the oxygen uptake.
Effects on the action of insulin
Several articles have appeared in the literature con
cerning a possible relationship between cobalt and the hypo-
glyoemic action of insulin, Bertrand and HScheboeuf (24) re
ported finding 62 to 100 milligrams of cobalt in 200 gram
samples of pancreas from five species—cow, calf, horse, sheep
pig, so feeling that there might be some relation between
cobalt and Insulin, they analyzed four different insulin
preparations and found 15 to 42 milligraras of cobalt per 100
units of insulin. Later (25) they injected rabbits intraper-
itoneally v/lth isotonic salt solutions containing cobalt (as
chloride or sulfate) simultaneoualy with injections of insulin.
Their data, presented in the form of graphs, show no great varia
tion in the blood sugar curves for the rats receiving insulin
alone and those receiving insulin with added cobalt salt, but
nevertheless they concluded that cobalt did prolong the action
of the insulin, although it did not Increase the velocity of
- 26 -
the liypoglycemic action* The same investigators (26) later re
ported the sanie results in experiments on dogs. Insulin action
was prolonged, the blood sugar remaining at low values for a
longer time when cobalt was injected with the insulin.
Labbe, Roubeau and Nepreux (86) obtained similar results
with a rabbit injected with three iinits of insulin and later
with three units of insulin and 0.3 rallllgrara of cobalt sulfate.
Three hours after the injection,v the blood sugar was 77 rallll
grara per cent in the rabbit given insulin alone and 44 milj.1-
gram per cent in the rabbit given Insulin and cobalt sulfate.
Tliroe hours and forty-five minutes after the injection, the
values were 94 and 54 milligram per cent respectively. Al-
tliough those represent data from one experiment on one rabbit,
the investigators concluded that cobalt sulfate Increased the
h3rpoglycenilc action of insulin.
Magenta (106) reported later that cobalt nitrate given to
dogs slightly increased the glyoemia while cobalt nitrate given
with Insulin to dogs did not increase txio hypoglycemic action
of the insulin. He presented no data to substantiate these
assertions.
Blatherwick and Sahyun (31) Injected Intravenously 0.041
milligram of cobalt (as cobalt salt) per kilogram of body
weight Into rabbits and found that there was no effect on the
blood sugar concentration. They Injected intravenously 0.009
milligram of cobalt ion per kilogram of body weight simul
taneously with Insulin Into rabbits and determined the blood
- 27 -
sugar before injection and 1»5 and 3.0 hours after injection.
A week later they determined blood sugar at the sane inter
vals in the same rabbits after injection of the some amount of
Insulin but without any cobalt salt. By comparinc the sets of
data obtained, they fotmd that tliree of the five rabbits
tested had a sonewhat greater hypoglyceniia with the cobalt
present, one rabbit had loss hypoglycemia and the data for the
fifth rabbit wore inconclusive. Subcutaneous injection of
0.04 to 0.06 railligrani of cobalt ion per kilograra of body
weight in the sane type of experiment enhanced the hypogly
cemia in only one of four rabbits. They concluded that co
balt Ion was without appreciable effect on insulin hypogly
cemia in the rabbit.
Rathery and Levina (129) studied the effect of a mix
ture of cobalt and nickel salts on human diabetics. They
claimed that injections of an isotonic salt solution contain
ing 0.1 milligram of the metals at the rate of 2.5, 5 or 10
milliliters every two days exerted a favorable action in five
oases and did not exert a favorable action in six cases* They
presented no data and did not state what they considered a
"favorable action".
Labbe, Roubeau and NeprevK(85) determined blood sugar
concentrations in nine diabetics given nickel or cobalt salts
at various levels. The cobalt solution injected at the rate
of 1.0 milligram of cobalt chloride per kilograra of body weight
had no hypoglycemic action either with or without simultaneous
- 28 -
Insulin injections. Sinilar results were obtained for the
nickel Ion coc^ounds. Tliese workers concluded that those
metals had no hypoclycoraic effect in the human diabetic*
Sahyun, Nixon and Goodell (130) added 1.0 nilligram of
cobalt chloride to 1000 units of insulin and found that the
physiolocical activity of the insulin was preserved after
Incubation at 52® for seven weeks or longer. They concluded
tliat cobalt ion was as effective as zinc ion in preserving insu
lin.
Analytical Methods for Determination of Cobalt in Biolonical Material
It is obvioua that no reliable data on the distribution
of cobalt in plant materials or in animal organs or excre
tions can bo obtained without a satisfactory analytical method
for determininn the amount of cobalt present. A special dif
ficulty is that the amount of cobalt in ouch materials is
usually very small—a few parts per million at the most and
often only a few tenths of a part per million. Several work
ers have attempted to adapt knovm methods or devise now ones
for makinc accurate detenninatlons of such minute quantities of
cobalt.
Bertrand (27) (20) and some of his co-workers, early in
vestigators in this field, determined the cobalt present in
soils, seeds, animal tissues, etc., by precipitating the co
balt as potassium cobaltinitrite. They claimed that five
- 29 -
micrograma of cobalt could be detected in this v/ay« Even if
this remarkable claim is true, this is greater than the
amount of cobalt often found in any manageable weight of
sample. Later (23) they developed another method of separat
ing cobalt and determining it by the brown color developed
with dimethylglyoxime. toujolle and Lafitte (39) precipitated
the potassium cobaltinitrite, oxidized it with standard po
tassium permanganate and titrated the unused excess of per
manganate, They obtained data on the cobalt content of
various animal tissues and excreta in this way.
LoOoff (08) determined cobalt in urine by an electro
lytic method after evaporation of tho urine and ashing the dry
residue. Bayle and Amy (15) deposited traces of cobalt electro
lytically on ooppor or zinc cathodes and determined tho cobalt
spectrographically. Tliey claimed that this method would detect
ten micrograms of cobalt, Dutoit and Zbinden (49, 50) using a
spoctrographic method, reported finding cobalt in tJie human
pancreas and occasionally in htoman blood but never in human
livor. They gave no data on tho amounts of cobalt present.
Pox and Ramage (60, 61) analyzed animal tissues spoctrograph-
ically and reported a spasmodic distribution of cobalt, Thoy
found cobalt only in marine animals. V/ebb (151) was unable to
detect cobalt in animal tissues by spoctrographic means and con
eluded that the concentration of cobalt in such material was be
low the limit of sensitivity of the spectrographic method.
- 30 -
Wright and Papish (152) and Blxmberg and Rask (32) were tmable
to find cobalt spectrofpraphlcally in milk ashes although Under
wood and Elvejhem (144), by moans of a colorimetric method,
later showed milk to contain small amounts of cobalt* Becker
and Oaddum (17) applied a spoctrographic method to the analysis
of limonites. A sample whidi had been foiand effective in cur
ing bush-siclcneas was foimd to contain 0.005 per cent of co
balt* Ho cobalt was found in an ineffective sample. Ho other
element present in the effective ore was absent in the in
effective ore, leading these workers to conclude that cobalt
was tho effective element.
Of the colorimetric methods for determining cobalt, tho
alphanitrosobetanaphthol method was used by McHarguo (100) who
reported finding traces of cobalt in Kentucky blue grass*
Paulais (125) claimed to bo able to detect one to ton micro
grams of cobalt per milliliter by this method and reported
finding cobalt In the organs of a mollusk, Duval and LeGoff
(51) claimed that 0*05 microgram of cobalt cotild bo deter-
minod with alphanitrosobetanaphthol in acetic acid when this
method Y/as applied to tho analysis of himian urine previously
concentrated eleotrolytically in a U-tube*
Bertrand and Macheboeuf (22, 23) separated cobalt from
ashed materials from animals and plants by extracting with
ammonium hydroxide and hydrogen peroxide, precipitating with
hydrogen sulphide, dissolving the nickel and cobalt and pre
cipitating them with dimethylglyoxime* Tliis was extracted
31 -
with chloroform, evaporated in a porcelain dish and the color
obtained compared with standards. This procediire produced
data whose maxinium cobalt values were from 0.05 to 2.0 parts
per million in animal organs.
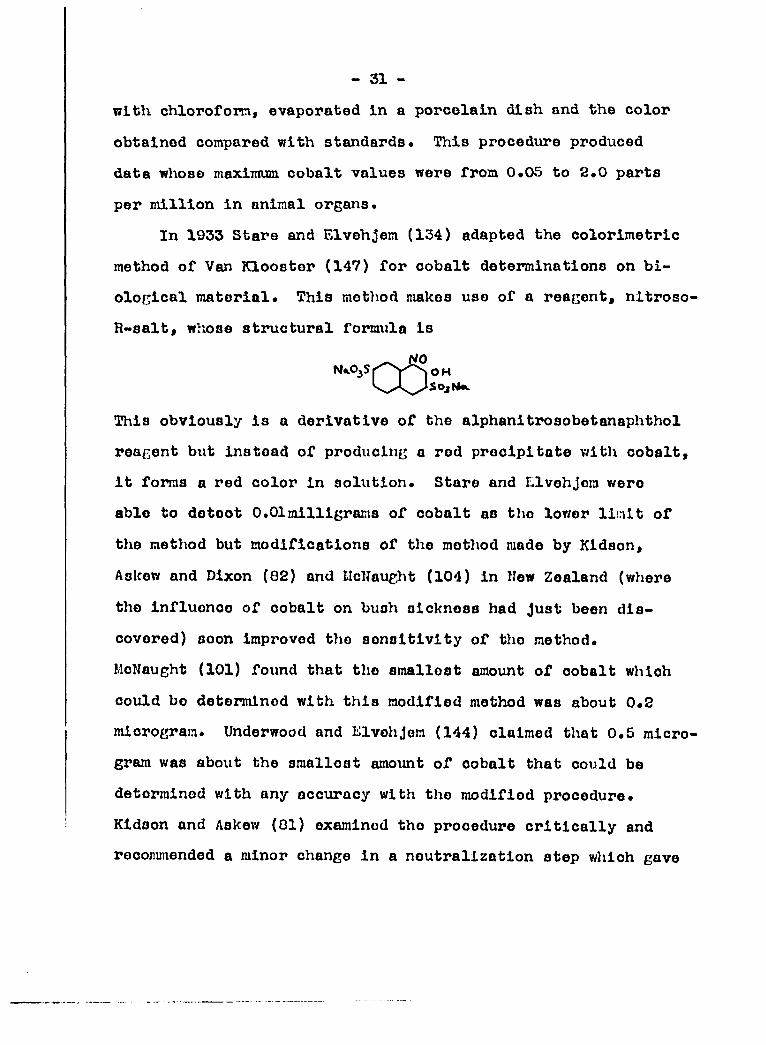
In 1933 Stare and Elvehjem (134) adapted the colorimetric
method of Van Klooster (147) for cobalt determinations on bi
ological material. This method makes use of a reacent, nitroso
R~salt, whose structural formtJla is
This obviously is a derivative of the alphanitrosobetanaphthol
reagent but instead of producing a rod precipitate with cobaltf
it forms a red color in solution. Stare and Elvehjem were
able to doteot 0.01 milligrams of cobalt as the lower liinit of
the method but modifications of the method made by Kidson,
Askew and Dixon (82) and llcllaught (104) in New Zealand (where
the influence of cobalt on bush sickness had Just been dis
covered) soon improved the senoitlvity of tho method.
McNaught (101) found that tho smallest amount of cobalt which
could bo determined with this modified method was about 0.2
microgram. Underwood and lilvehjem (144) claimed that 0.5 micro
gram was about the smallest amount of cobalt that could be
determined with any accuracy with the modified procedure.
Kidson and Askev/ (01) examined tho procedure critically and
reconunended a minor change in a neutralization step which gave
- 32 -
more consistent results. McNaucht (102) found that this slight
change enabled0.05 mlcroErani of cobalt to be detected. No
Interference with tho cobalt determination was noted when 100
mlcrograns of copper and 1000 nicrogranis of iron were present.
Ahmad and McCollvun (1) used the method to analyze plant mater
ials and reported that it was not necessary to remove iron or
copper from these substances before deterninlng the cobalt
present.
The nitroso-R-salt method was found to be unsatisfactory
in tho presence of much calcium duo to precipitation occurring
at tho neutralization stop and carryinc down cobalt, so Lu^g
and Josland (96) devised another modification in which calcium
ion was effectively removed from solution by complex formation
with added citrate salts.
Sylvester and Lampitt (138) found the nitroso-R-salt
method \msultablo for plant materials whore a high ash content
was obtained. They treated the hydrochloric acid extract of
the ash with alphanitrosobetanaphthol, extracted with dithlzone
reagent and finally determined the oobalt present with nitroso-
R-salt, thus avoiding interference of other metal ions.
Marston and Dewey (109) obtained a solution of plant and animal
tissues by treating them with nitric, perchloric and sulfuric
adds. The cobalt present was removed with dithlzone and the
nitroso-R-salt color developed in citrate-sodium carbonate
buffer, the yellow color of tho excess nitroso-R-salt being

- 33 -
destroyed by adding bromine# They were able to recover and
determine two mici?og;rams of cobalt with an error of about one
per cent.
flibbard (72) has suggested a procedure for estimating co
balt with choline in a dithizone extract. This method was par
ticularly adapted to determinations of cobalt in soils.
To summarize the analytical methods for dotormining cobalt
in biolo£;ical materials, it io apparent that the colorimctrlc
nitroso-R-salt method is the most satisfactory one available
at the present tine. Not only does it require less expensive
equipment than the spectrocraphic method, but it io also more
sensitive, as evidenced bj the v/ide disagreement as to tho co
balt content of various biological materials among investi
gators using the spectrographic raethod. This need not be sur
prising in view of tho complexity of tho cobalt spoctrun and
tho relatively recent rise to prominence of very sensitive
colorimotric methods for determination of many eleraents by moans
of varlotia organic roagonts.
Cobalt Content of Plant Materials
Bertrand and Mokragnatz (27, 20) analyzed twenty samples
of food vegetables and found cobalt in moat of them, ranging
from 0.02 to 0.3 part per million. Cobalt was fovmd in all
plants examined in a later study. No data were presented in
these articles, however. McHargue (99, 100) reported finding
- 34 -
traces of cobalt in Kentucky blue G^ass and in soy beans.
Raniago reported the occurrence of cobalt in St. Ignatius beans.
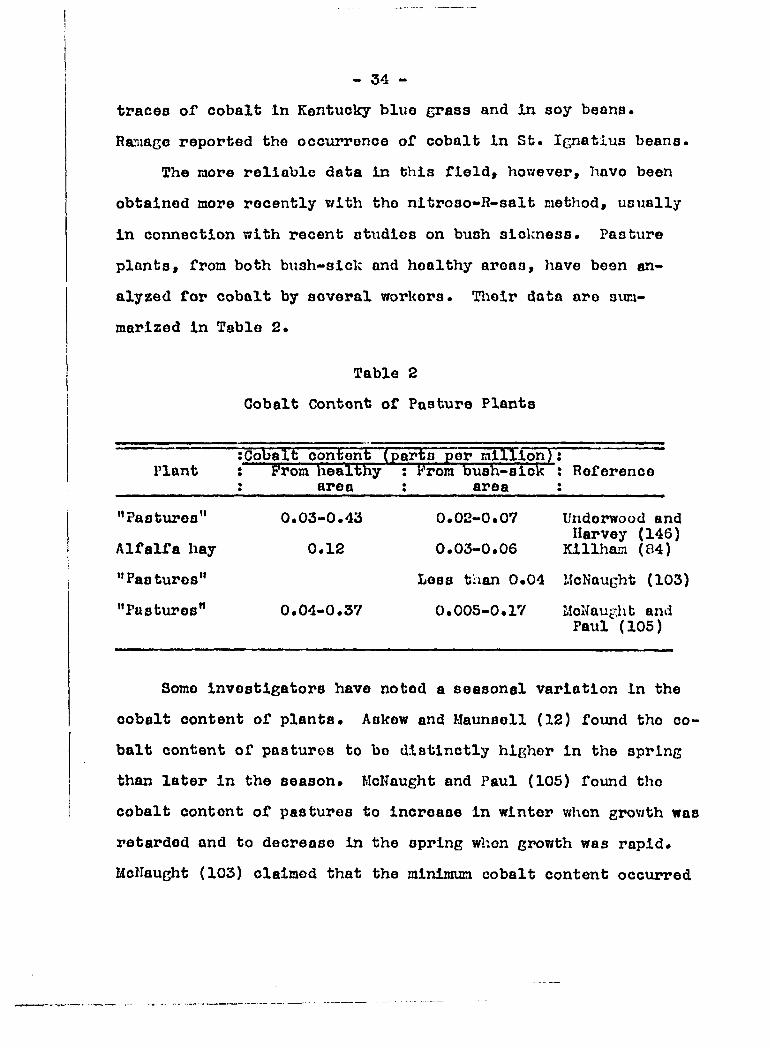
The laore reliable data in this field, hov/ever, have been
obtained more recently with the nitroso-R-salt method, usually
in connection with recent studios on bush sickness. Pasture
plants, from both bush-sick and healthy areos, have been an
alyzed for cobalt by several workers. Tlieir data are sum
marized in Table 2.
Table 2
Cobalt Content of Pasture Plants
:Cobalt content (parts per million) • • Plant : Prom healthy : from bush-sick : Reference
: area : area • •
"Pastures" 0.03-0.43 0.02-0.07 I/nderwood and Harvey (146)
Alfalfa hay 0.12 0.03-0.06 Killham (84)
"Pastures" Loss than 0.04 McNaught (103)
"Pastures" 0.04-0.37 0.005-0.17 McNaught and Paul (105)
Some investigators have noted a seasonal variation in the
cobalt content of plants. Askew and Maunsell (12) found the co
balt content of paaturoa to bo distinctly higher in the spring
than later in the season. McNaught and Paul (105) found tho
cobalt content of paaturoa to increase in winter v/hon growth was
retarded and to decrease in the spring when growth was rapid.
McNaught (103) claimod that the minimum cobalt content occurred
- 35 -
in December (a aumner month in New Zealand where the study was
made). Kidson and Maunsell (83) state that adding cobalt
chloride to superphosphate fertilizers used on cobalt-deficient
soils produced an increased cobalt content in fodder crops
(turnips, swedes, rape, oats). Bonner, McNaucht and Paul (33)
found the cobalt content of pastures to increase from 0.06 to
1.03 part per million when cobalt sulfate was used as a soil
top dressing.
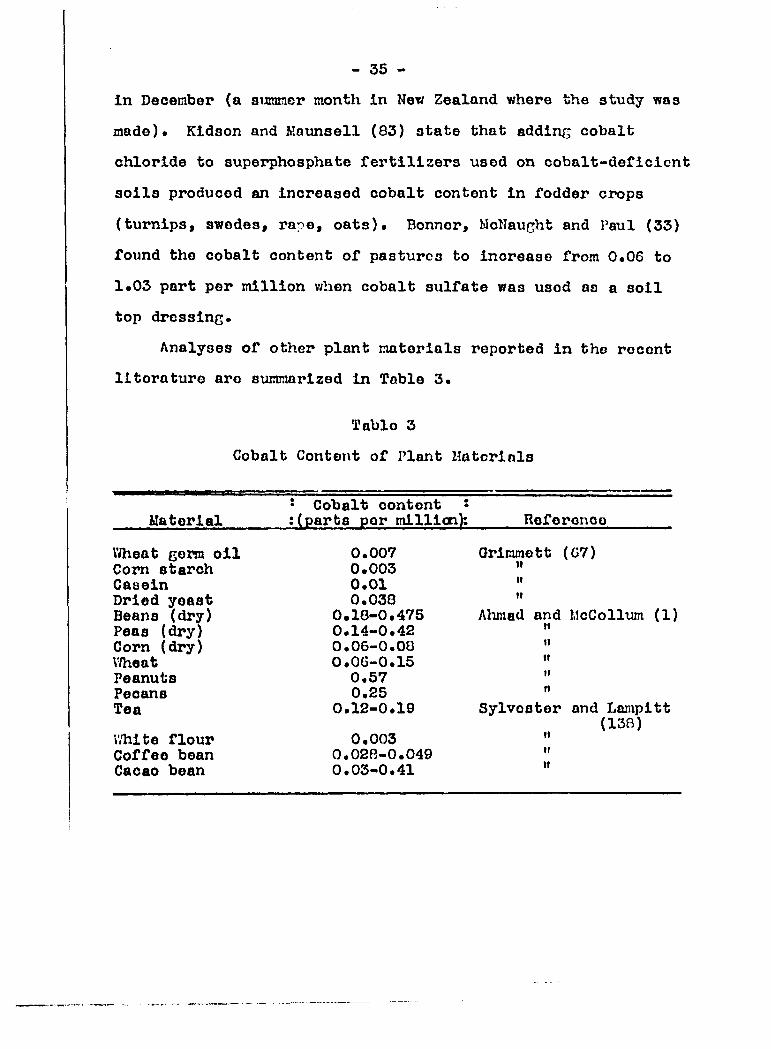
Analyses of other plant materials reported in the recent
literature are sximmarized in Table 3.
Table 3
Cobalt Content of Plant Materials
Material • Cobalt content s : (parts per tnilliai); Reference
V^ieat germ oil 0.007 Qrimmett (67) Corn starch 0,003 It
Casein 0.01 It
Dried yeast 0.038 (1
Beans (dry) 0, ,10-0.475 Alimad and McCollum (1) Peas (dry) 0, .14-0.42 It
Corn (dry) 0, .06-0.08 II
V/heat 0, ,0G-0.15 If
Peanuts 0.57 II
Pecans 0.25 It
Too 0, ,12-0.19 Sylvester and Lampitt (138)
V.Tilte flour 0.003 ft
Coffee bean 0, ,028-0.049 tr
Cacao bean 0, ,03-0.41 tt
36 ••
Cobalt Content of Aniraal Materials
Bertrand and Macheboeuf (23, 24) reported finding more
oobalt in animal tissues than in plant jnaterials by use of
an analytical method utilizing potassim cobaltinifcrito.
They found that beef liver contalnod 0,20 part per million
of cobalt while the pancreas contained 0.23 part per million.
Pancreas of othor animals seemed to oontain less oobalt: cow,
0.075; calff 0.070; horse, 0.100; sheep, 0.075; and pig,
0.062 part per million. Tliey found that insulin preparations
contalnod 0.015 to 0.042 part per million of cobalt. Caujolle
and Lafltte (39) reported that much hlglior concentrations of
cobalt were present In pancreas (94 to 1Q3 parts per million)
and livor (53 to 209 parts por million) of dogs v/hlch had
previously been injeoted with solutions of oobalt salts. Tliey
reported no oobalt analyses on nomal dogs, however.
Dutoit and Zblnden (49), usln^; a spoctrocraphlc nothod,
reportod finding cobalt in the ash of animal organs and blood.
Later (50) they reported finding cobalt in the pancreas but
not in the liver. Fox and Rarnage (00, 61) also dotormined co
balt spectrographlcally and reported finding 0.3 part por
million of oobalt In the livor of Archldoris tuberculata.
They reported finding cobalt only in marine anlraals.
A number of recent Investigators have used the nitroso-
R-salt method for determining cobalt in animal tissues.
- 37 -
Josland (77) gave a cobalt sulfate drench to sheep for seven
weeks at the rate of one milligram of cobalt per 200 grams
body weight and found that the cobalt content of the organs
was much higher than in sheep which had not been fed cobalt*
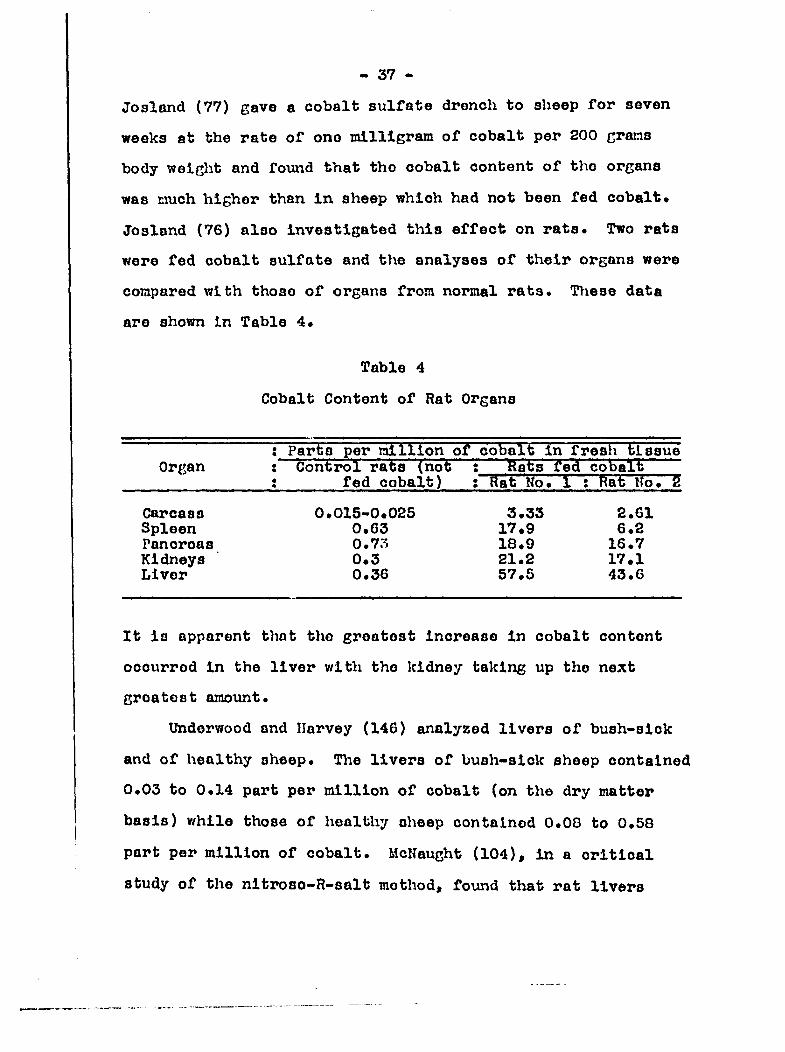
Josland (76) also investigated this effect on rats. Two rats
were fed cobalt sulfate and the analyses of their organs were
compared with those of organs from normal rata. These data
are shown in Table 4.
Table 4
Cobalt Content of Rat Organs
' million of cobalt in fresh tissu'e Organ : Control rats (not ; ' feats fed cobalt
5 fed cobalt) ; Rat No. 1 ; Rat Uo. 5
Carcass 0.015>0«02S 3.33 2.61 Spleen 0*63 17*9 6*2 Pancrcas 0.7o 18.9 16.7 Kidneys 0.3 21.2 17.1 Liver 0.36 57.5 43.6
It is apparent that the greatest increase in cobalt content
occurred in the liver with the kidney taking up the next
greatest amount.
Underwood and Harvey (146) analyzed livers of bush-sick
and of healthy sheep. The livers of bush-sick sheep contained
0.03 to 0.14 part per million of cobalt (on the dry matter
basis) while those of healthy sheep contained 0.00 to 0.58
part per million of cobalt. McHaught (104), in a critical
study of the nitroso-R-salt method, found that rat livers
- 38 -
contained about 0.20 part per million of cobalt on the averac®*
Stare and Elvehjem (134) fed rata on a milk-iron-copper-
mangancse diet and found that the entire bodies of the rats
contained less than 0.01 milligram of cobalt (the limit of
sensitivity of the analytical procedure they used). V^Tien
polycythemia occurred 0.04 to 0.05 milliRram of cobalt was
found in tho entire body. Josland and McNaught (78) reported
that a polycythemic rat contained 0.050 milligram of cobalt in
its entire body after being fed one milligram of cobalt (as
cobalt sulfate) for 48 neeka. Rats which had been fed tlxia
amount of cobalt without developing polycythemia contained
only 0.030 milligram of cobalt in tho entire body. Control
rata not fed cobalt had only 0.0047 milligram of cobalt in
the entire body.
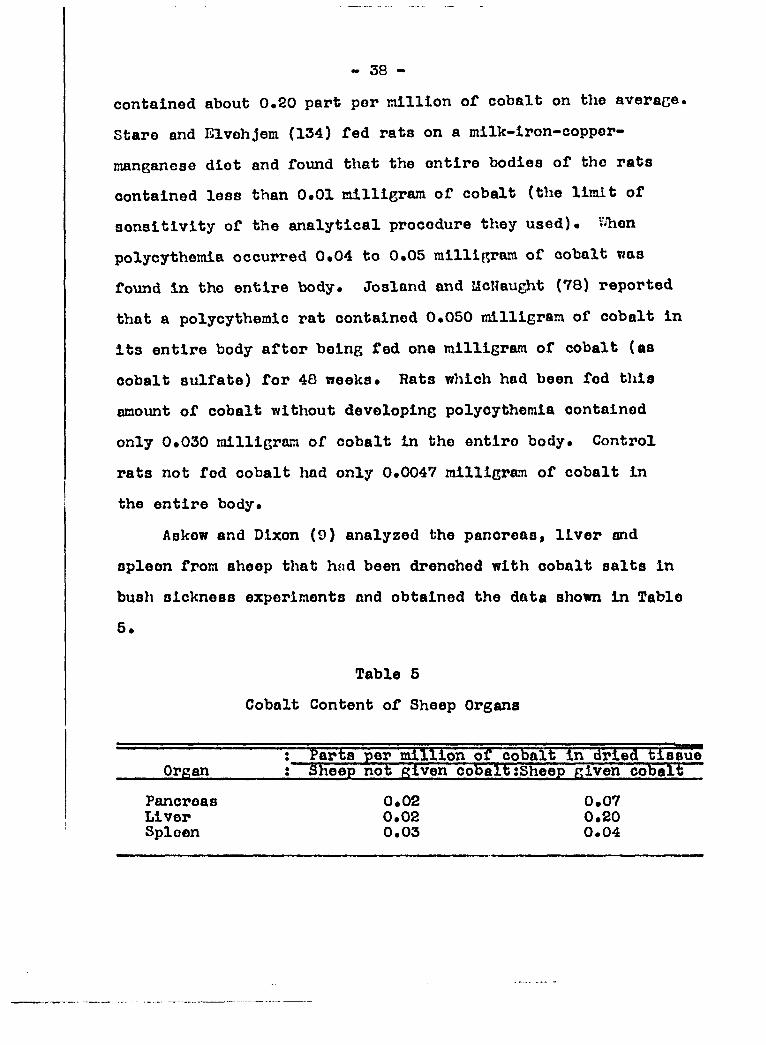
Askew and Dixon (9) analyzed the pancreas, liver and
spleen from aheep that h»d been drenched with cobalt salta in
bush aickneaa experimenta and obtained the data ahown in Table
5.
Table 5
Cobalt Content of Sheep Organs
' million of cobalt in dried tiaaue Organ : Sheep not given cobalt ;Sheep given cobalt
Pancroaa Liver Spleen
0.02 0.02 0.03
0.07 0.20 0.04
- 39 -
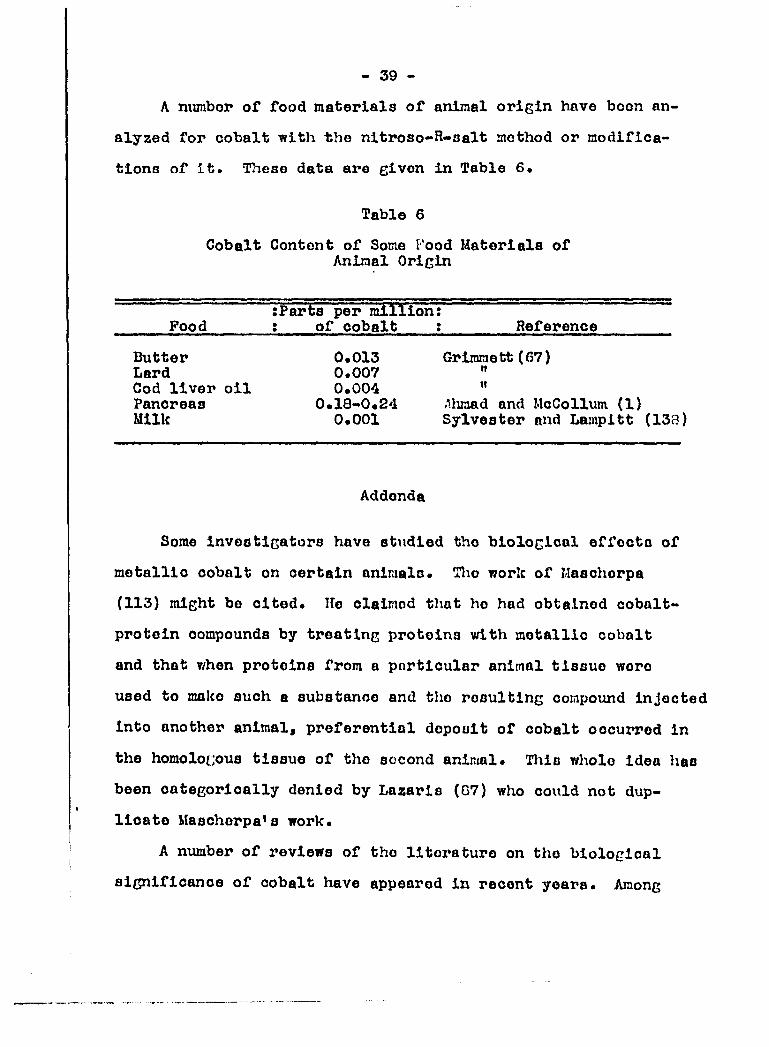
A mnnbor of food materials of animal origin have boon an
alyzed for cobalt with the nitroso-R-salt method or modifica
tions of it. These data are given in Table 6.
Table 6
Cobalt Content of Some Food Materials of Animal Origin
tParts per million: Pood : of cobalt : Reference
Butter 0.013 Grimmett(67) Lard 0.007 " Cod liver oil 0.004 " Pancreas 0.18-0.24 Alimad and McCollum (1) Milk 0.001 Sylvester and Lainpltt (133)
Addenda
Some investigators have sttidled the biolocical effects of
metallic cobalt on certain animals. Tlio norlc of Mascherpa
(113) might be cited. Ife claimed that he had obtained cobalt-
protein compounds by treating proteins with metallic cobalt
and that v/hen proteins from a particular animal tissue were
used to make such a substance and the resulting compound injected
into another animalf preferential deposit of cobalt occuz*red in
the homologous tissue of the socond animal. Tliis whole idea has
been categorically denied by Lazaris (07) who could not dup
licate Mascherpa*a work.
A number of reviews of the literature on the biological
aignificance of cobalt have appeared in recent years. Among

- 40 -
the shorter reviews are those of Godden (64), Fairbanks (54),
Schultsse (132) and McCollum (97). More complete reviews have
been made by Marston (100), Underwood (143) and Maynard (115).
- 41 -
EXPERnffiTiTAL
Plan of Experiment
In investigations such as those for this thesis it is not
always possible to make a detailed plan of all the experiments
to bo made, since results of one experiment often suocest
other studies which might be of interest. In general, how
ever, it was planned to feed rats the laboratory's stock [gcow-
ing ration with cobalt salts addod to fximish various concen
trations of cobalt and to study tho effects of these diets on
growth, reproduction and lactation* It was also planned to
Investigate the composition of blood and urine with respect
to a few of tho more common conatituents for which satis
factory analytical methods are available. Those aro limited
by the very small blood samples obtainable from rats without
causing serious injury to the animal. More specifioally, it
was planned to study the changes produced in the blood in
hemoglobin concentration, erythrocyte coxint, non-protein
nitrogen concentration and blood sugar concentration and to
examine the urine for albumin and for reducing sugar after the
rat had ingested simple cobalt salts, either fed in tho diet
or administered by stomach tube* It was thought best to re
strict the investigation to those means of entry of cobalt
- 42 -
Ion Into the organisn (through the digestive tract) since
these are more closely related to nutritional probloias than
other means of injection of test solutions into animals. Of
Interest in this connection was the determination of the mini
mum lethal dose of cobalt (as cobalt salt) when given by
stomach tube and the minimum concentration of cobalt salt in
the diet necessary to stimulate hemafcopoiesis. It was also
planned to make cobalt analyses of such tissues as liver, kid
ney, pancreas, spleen, heart, lungs, stomach, intestine and
testes, both from rats which had been fed cobalt salt and from
those which had not received added cobalt s«lt in the diet.
Materials and Methods
Rations
The basal ration fed all the rats in this study was the
growing ration on which the stock rats of the colony of the
chemistry department have been grown successfully for many
years. It consisted of a mixture of natural feeds in the fol
lowing parts per volume: ground hulled oats, 4 parts; ground
yellow com, 4 parts; grotind wheat, 1 part; alfalfa meal, 1
part; tankage, 0.5 part; buttermilk powder, 0.5 part; linseed
meal, 0.5 part. To this mixture 0.35 poimd of bone meal and
0.5 pound of sodiiom chloride were added for each 100 pounds of
ration. These materials were obtained from a dealer in Ames,
Iowa, and were mixed every two weeks by the regular laboratory
staff.
- 43 -
Analyses of the gi*owlng ration for cobalt by the nitroso-
R-salt method showed a variation in the cobalt content from
0.27 to 0.42 part per million over a period of six months. The
averacQ cobalt content was 0*33 part per million and this is
so much less thsin tho lowest concentration of cobalt ion fed
(5 parts per million) that it need not be considered in these
experiments•
No investigator of the cobalt problem has described his
method for incorporating small amoimts of cobalt salts into
the rations used in his oxporimonts. Since failure to obtain
a feed mixture of approximately uniform cobalt content is
obviously important to tho validity of tho oxperiraent, special
attention was given to the method of adding the cobalt salts
to tho basal ration. The calculated aiaount of cobalt salt was
weighed out on an analytical balance to at least three sig
nificant figures, transferred to a small wash bottle, dissolved
in 10-15 milliliters of distilled water and sprayed over the
surface of a weighed amount of basal ration in a large flat
pan. Tliis was then mixed by liand so that the clumps of feed
moistened with the cobalt salt solution seemed evenly dis
tributed and not larger than tho size of a bean. Tlie ration
was allowed to stand until the clumps containing the cobalt
salt were thoroughly dry. The entire ration was then sifted
through a small flour sieve (holding about 200 grams of ra
tion) into another large flat pan and the tinaiftable residue
from each slevefull was ground in a mortar and pestle. This
- 44 -
was then reaifted over the contents of the pan, the unsiftable
residue acaiti grotind in the niortar and reslfted on to the con
tents of the pan as before. This alvrays reduced the cobalt
clvnaps to such a fine powder that none was apparent in the
small amount of unsiftable residue remaininn. This, consist
ing mostly of pieces of cracked com and a few oat hulls* was
added to the previously sifted material so that its composi
tion might remain the same as the growing ration used for the
control groups, except for the added cobalt salt. The entire
sifted ration was next mixed thoroughly by hand and stored in
glass jars with screw tops.
Those rations wore mixed in this way every two to three
weeks for each group of rats and their homogeneity is demon
strated by the smooth growth curves obtained during experi
mental periods of as long as 40 weeks.
Care of animals
The rats used for the feeding experiments were selected
from the young of the stock colony at weaning ac© (approxi
mately 28 days), their initial weif^t being 45-55 grams when
each experiment was started. They were assembled into groups
of three males and three females and housed in metal cages
measuring 24 inches long, 12 inches wide and 8 inches high. The
cages v/ere arranged in batteries and kept in the same room as
the stock colony rats whore the temperature was maintained at
approximately 28® C. the year aroimd. Each cage, except as
- 45 -
noted below, had a removable screen bottom with a sliding pan
underneath. The bottom of the pan was covered with wood shav
ings and the pans wore removed, cleaned and filled with fresh
shavings each week. The wire screens were removed regularly,
cleaned in running water and dried before being replaced.
Water was supplied to each cage from an inverted bottle
fitted with a one-hole rubber stopper and a bont glass tube
drinking foxintaln. The rats were allowed to drink as much
water as they wanted. Fresh water was supplied at all times
and the bottlos wore cleaned thoroughly with a brush every
week*
Peed was supplied to each cage in a tin cup soldered to a
tin plate and sot inside a pan with high walls to prevent
scattering of tho food. '.11 the groups (except certain con
trol groups) were supplied with all tho feed they would eat.
At regular Intervals tho cups and pans were washed thoroughly
and dried.
Pregnant females were segregated from thoir groups and
placed in cages provided with wood shavings but no screen
bottoms. In experiments where lactation was studied, the mothers
were permitted to rear their young until 20 days after birth
when the young were destroyed and tho females were returned to
the original group.
For experiments where cobalt salts and other substances
were injected into the stomach, young or mature rats were

- 46 -
selected from the stock colony, placed in screen bottom cages
and supplied with water but no food# They vfere fasted in this
way for approximately 24 hours before use. Their welchts were
recorded prior to the experiment.
Operative methods
Collection of urine* Urine specimens were collected by
placinc rats Individually in a circular metabolism cace made
of Kalvanizod screen wire with three meshes per inch. Tlie
cage was 8 inches in diameter and 0 inches hi£^h. It was
equipped with two small circular openings through which the
rat could put its head to obtain feed and water. The cage
was set on an eight inch glass funnel which directed the
urine excreted into a test tube graduated in tenths of a
milliliter. A porcelain Qooch disc in the apex of tho funnel
prevented feces from falling into the urine. The feed and water
roooptaclos were placed outside tho rim of tho funnel so tliat
no feed or water could fall into the urine. Rats were placed
in t)xo cage in the morning and the urine collected was taken
for analysis at the aamo hour tlio following morning. The
cage and fxmnel wore washed thoroughly with water and dried
each time they v/ere used.
Anesthesia. In order to pass a stomach tube into rats
without exciting them, they were anesthetized with intra
peritoneal injections of a nembutal solution containing 3
milligrams of nembutal per milliliter and injected at tho rate
- 47 -
of one nilliliter per 100 grams of body wolcht. In order to
make the injection, the rat was placed on the table, covered
with one thickness of a towel to avoid danger from bitinc and
grasped with the left hand with the rat*s head toward the
wrist and the fingers encircling the body, the little finger
encircling the throat. The rat was turned over, the head
lowered to allow the gut to slip forward, and the needle of
an injection syringe containing the calculated volume of
nembutal solution inserted into the peritoneum near the mid
line of the body with the needle directed toward the posterior.
The solution was Injccted, the needle withdrawn and the rat
placed in a bucket until needed. The entire operation can be
done rapidly and there is usually little struggling. Anesthesia
was usually complete in 10-15 minutes and lasted one to two
hours. The hypodermic syringe and the 22 guage needles used
tf'ere obtained from Decton, Dickinson and Company.
Use of stomach tube. In order to inject tost solutions
into the stomachs of rats, a French No* 0 cathoter aboitt six
inches long was used as a stomach tube. One end of the txibe
was fitted to the hub of a hypodermic needle out off for this
purpose and was attached by this means to a hypodermic syringe.
The end of the cathoter was dipped below the surface of some of
the tost solution in a small test tube and drawn into the
syringe. Tlie syringe was then inverted and enough of the con
tents expelled to remove all air bubbles from the syringe and
catheter. V/lth the desired volume of test solution in the
- 48 -
syringe, the catheter was passed into the rat's stomach by
grasping the tongue and pulling it forward while tlie catheter,
moistened v/ith water, was inserted with a rotary notion dovm
the esophagus. With a little experience it was found possible
to insert tho tube into the esophagus and not the trachea.
The rat was raised into a vertical position, head up, tho
syringe emptied and the catheter removed. It will be noted
that tho catheter itself reraained filled with test solution
both before and after the injection, making possible tho in
jection of precise volumes of solution from the syringe
itself.
Blood sampling. Blood samples for counting erythrocytes
and determining blood sugar were obtained from the tail. The
larger samples (0.1 ml.) noeded for determination of non
protein nitrogen were obtained from tho external saphenous
vein. In each case, however, blood was drawn from a free-
flowing incision.
To draw blood from tlio tail, tho rat was wrapped in a
towel with tho tall protruding, tho tail wiped and stroked
once or twice toward tho tip. An incision was made with a
sharp scalpel in the prominent vein near tho tip of tho tall
and a sample of blood drawn into a pipette of suitable size.
Trenner pipettes were used for the erytlwocyte counts and
pipettes marked at 0.05 milliliter were used for the blood
sugar samples.
- 49 -
To draw blood fron the external saphenous vein, the rat
was rolled in a tov/el with one hind leg extended outside, the
inside of the leg v/qs shaved and trie saphenous vein punctured
with 8 lancet. Blood was drawn from the xree-flowino puncture
into a 0.1 milliliter pipette. Care was taken to avoid sever
ing tho vein and producing blood clots under tho skin.
Analytical methods
Ilenonlobin. Eomoglobin was determiiaed by tho acid
hematin motliod as described by Tfawk and Bergein (69) • Read-
inf^s wore laado in e hemoplobinometer obtained from tho Rausoh
and Lomb Optical Company.
Erythrocyte counts. Erythrocyte counts were made witli a
Trennor dilviting pipette and a Levy countinc chaiaber with tho
improved Neubauor rulinp,. Phyaiolo£^oal salt solution was
used as the diluting* fluid.
Doterminntion of £H. The pH of tho cobalt chloride solu
tions and tho pH of tho hydrochloric acid solution were
measured on a Cameron p!I Meter manufactured by tho V/obster
Electric Company, Racino, V/isconsin. Tho current was turned
on and the instrument allov/ed to oporato lonp enough before
making tho pll detorminntions so that there was no drift in the
meter reading.
Blood supiar. Blood su^ar was determined by the method of
Polin and Malmros (59) as modified by Keil and Nelson (79).
Mon-protein nitrogen in blood, llon-protein nitrogen was
- 50 -
defceminod in blood by fcho raefchod of Polin and V/u described by
Hawk and Bergeim (69) as modified by V. B, Fish (58) for
small samples of blood*
Reducing suf:^ar in urine* Reducing sugar in the urine was
determined by Sumner* s method as described by Hawk and
Bergeim (69).
Cobalt* Cobalt was determined by the colorimetric
nitroso-R-solt method of Stare and Elvehjem (134) as modi
fied by Kidson^ Askew and Dixon (82) and Kidson and Askew
(Gl)* The procedure outlined in the following paragraphs was
found to give consistent results and showed excellent re
coveries of cobalt salts added to animal and plant tissues*
KtLnce the tissues with a scalpel and ash the weighed
sample in a muffle furnace, raising the temperature gradually
to avoid spattering* Finally maintain at a rod heat for
tlireo hours to insure complete destruction of organic matter.
Dissolve the residue in 15 ml , of HCl (specific gravity
1*12), warm till dissolved, cool and extract with ether using
20 ml* of other for each 10 ml. of solution. Warm to expel
ether from the water phase and extract again with ether*
Evaporate the water phase to dryness*
Take up tho residue with 0*5 ml* of HCl (specific gravity
1.12) and six drops of HNOg (1:1)* Add enough water to bring
the voliwie to 15 ml* and boil to oxidize any reducing sub
stances. Cool* Add two ml. of 0.1 per cent nitroso-R-salt
solution and then two grams of sodium acetate. Heat to 70°*

- 51 -
Add five drops of phonolphthaleln and then ten per cent KOH
drop by drop with shaking vmtll pink. Add three nore drops of
phenolphthaleln and just destroy the pink color with 0.5 N
HCl. Boil exactly two minutes, keeping the solution just acid
to phenolphthaleln. Add 20 drops of HNO^ (1:1) and boil two
minutes more. Cool under the tap and make up to voltuae in
Hessler tubes, filtering into the tubes if there is any pre
cipitate or cloudiness. Compare with standards prepared the
same day using known (and comparable) araounts of cobalt
according to the procedure of this last paragraph
Chemicnls
Cobaltous chloride. The cobalt chloride used was Baker
and Adamson's reagent quality CoClg.Gll20» The maxlram limits
of Impuritios stated on the label were: SO3, 0.0025 per cent;
Cu, 0*000 per cent; Fe, 0*005 per cent; Pb, 0*000 per cent*
Cobaltous nitrate. Cobalt nitrate, Co(1103)2*61120, abso
lutely chemically pure and nickel free, was obtained from the
City Chemical Corporation, New York, N* Y*
Cystine* The cystine used was originally prepared from
hair in these laboratories* It was dissolved in 20 per cent
hydrochloric add and repreclpitated with a hot concentrated
solution of sodium acetate. The precipitate was allowed to
stand over night In a refrigerator, filtered, washed with water
and then with alcohol and finally allowed to dry in air on a
- 52 -
porous plate. A fine white powder was obtained which con
sisted of typical hexagonal cystine ci»ystals v/hen examined
under a microscope. A hot saturated solution of the powder,
when allowed to cool, formed similar typical hexagonal crystals
easily visible to the naked eye.
Glucose. The glucose used for standard solutions and for
injoction solutions was Baker and Adonson's reagent quality
anhydrous glucose.
Glycine. Glycine, ammonia free, was obtained frori the
Kastman Kodak Company, Rochester, N. Y.
Nitroso-R-salt. The nitroso-R-salt used was obtained from
the Eastman Kodak Company, Rochester, N. Y.
Sodixon tungstate. The sodium tungstate used for prepar
ing blood filtrates was obtained from the Mallinckrodt Chemical
Works and was free of raolybdeniim.
Presentation of Data
Growth
Since the literature is not clear with respect to the
amount of addod cobalt salts v/hich rats can tolerate in their
diet, Q preliminary oxporinent was planned to determine the
maximvmi level of cobalt salt in the ration which rats can ingest
without dying. To the growing ration xised for the rat colony
of the physiological chemistry section of the chemistry depart
ment, cobalt chloride was added in amounts to give 1.0 per cent.
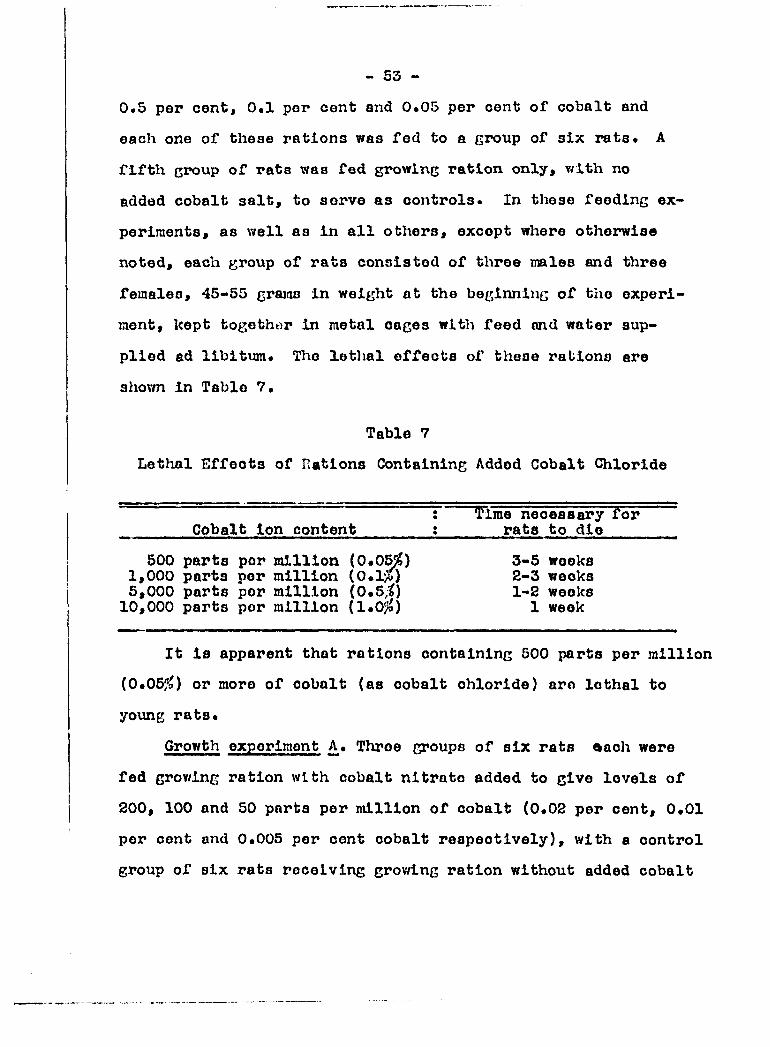
- 53 -
0»5 per centf 0.1 per cent and 0*05 per cent of cobalt and
each one of these rations was fed to a group of six rats. A
fifth group of rata waa fed growing ration only, with no
added cobalt salt, to serve as controls. In those feeding ex
periments, as well as in all others, except where otherwise
noted, each group of rats consisted of three males and three
females, 45-55 grains in weight at the beginning of the experi
ment, kept together in metal cages with feed ond water sup
plied ad libitum. The lethal effects of these rations ere
shovm in Table 7,
Table 7
Lethal Effects of Rations Containing Added Cobalt Chloride
j IFime necessary for Cobalt Ion content t rats to die
500 parts per million (0*0^) 3-5 weeks 1,000 parts per million (O.rX) 2-3 weeks 5,000 parts per million (0.5,1-2 weeks
10,000 parts per million (1.0^^) 1 week
It is apparent that rations containing 500 parts per million
(0.055^) or more of cobalt (as cobalt chloride) are lethal to
young rats.
Growth experiment A, Three groups of six rats aach were
fed growing ration with cobalt nitrate added to give levels of
200, 100 and 50 parts per million of cobalt (0.02 per cent, 0.01
per cent and 0.005 per cont cobalt respectively), with a control
group of six rata receiving grov/ing ration without added cobalt
- 54 -
salt. Til© rats were weighed each week, feed conaianption
records were kept for each group and a dated record was kept
of all pregnancies, the niimber and weight of younc in each
litter at birth and at 28 days of nge and the weight of each
female before and after parturition. Growth data are shovna
in Table 8. Growth curves for each level of cobalt (as cobalt
nitrate) are plotted in Pigr'-ire 1. Peed consumption by these
groups of rats is shown in Table 9.
Growth experinent D« It was noted in growth experlinent
A that tho feed consumption of groups of rats receiving cobalt
salt was always less than that of tho controls receiving no
added cobalt salt, so another scries of growth and reproduc
tion experiments was planned where the control groups receiv
ing no added cobalt salt v/ere fed only the weight of ration
consumed on the previous day by tho rata roceiving added co
balt salts and supplied v/ith all the feed they desired to eat.
Cobalt was fed at a level of 50 parts per million to a group
of twelve rats (six males and six females) and at a level of
200 parts per million to a group of six rats (three males and
three females). Each group was paired with a control group
consisting of similar numbers of rats whose feed was re
stricted as described above. Cobalt nitrate was used as the
source of cobalt, as in growth experiment A, Growth, feed con
sumption and reproduction records were kept as before. In
addition, since these rats were ingesting equivalent quantities
of ration, the wine of both groups and their controls was

55 -
Table 8
Growth Experiment A Average V/elght in Grama of Groups of Six Rats Fed Growing
Ration with Added Cobalt Nitrate
Weeks : Concentration of added cobalt Fed ration : None : 50 p.p.m* :100 p.p. m* :200 p.p.m.
0 57 52 54 50 1 74 70 64 50 2 88 80 74 52 3 101 91 36 51 4 114 106 99 50 5 144 119 104 54 6 151 130 111 55 7 165 136 120 59 8 194 157 138 72 9 202 158 143 76 10 210 161 145 83 11 12 13 216 170 149 94 14 217 176 164 103 15 251 184 161 103 16 255 201 179 116 17 266 200 179 128 18 266 199 131 131 19 279 215 190 141 20 282 218 187 140 21 295 229 185 136 22 300 233 191 144 23 309 237 196 150 24 313 248 198 155 25 317 234 205 162 26 321 241 211 166 27 327 244 217 168 28 331 251 222 169 29 330 257 221 179 30 338 263 232 179 31 338 273 233 189 32 357 257 246® 208® 33 342 258 259 221 34 338 250 254 233 35 336 258 266 229 36 338 263 265 248 37 334 261 266 248 38 326 261 270 255 39 348 280 272 267
®Fed growing ration without added cobalt salt from thirty-second week imtll the end of the experiment.
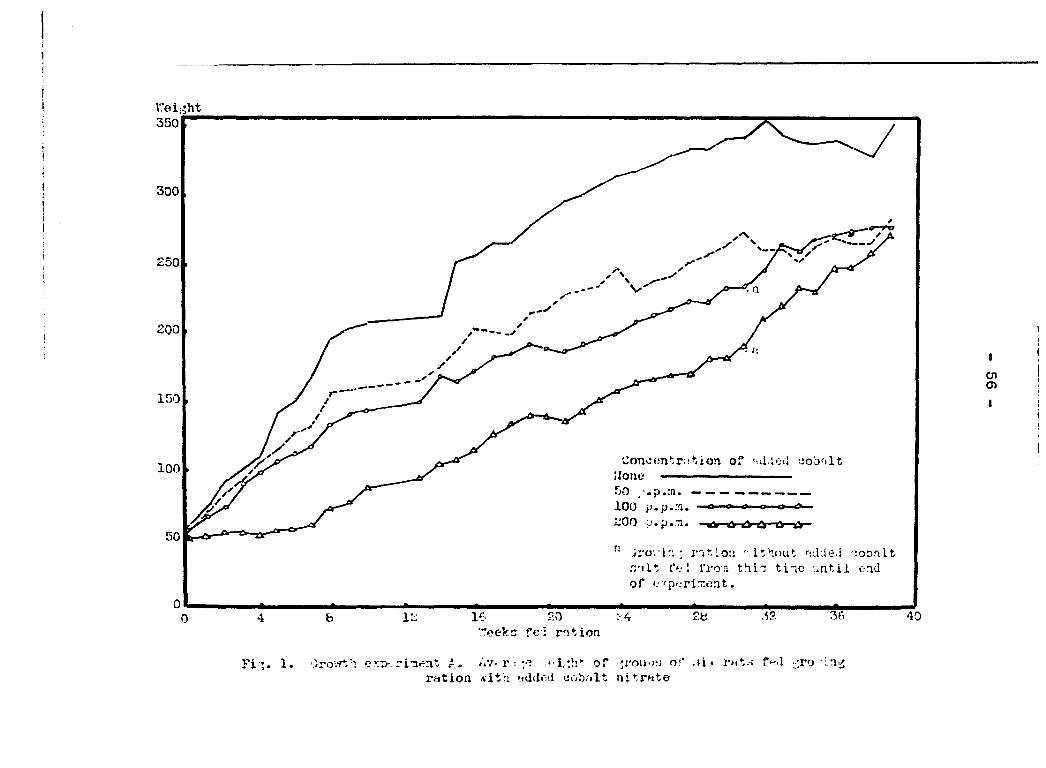
v:ei:iht 350
500
£50
200
150
'Jono(;n'".r:!tion of -id.ieil «o'o''ilt lone —————— 100
50 r'ltioii ithout nddeJ 'jonrtlt
of '•p'-Timont
36 40 2b 16 i: b 4 0 •"etks fci rntioa
Fi 1« •ro'.Tt''! c-p-A. Av-r : oT o!' .-u • -^ro ration ^ith >nlclr-d oob.'ilt nitrHte
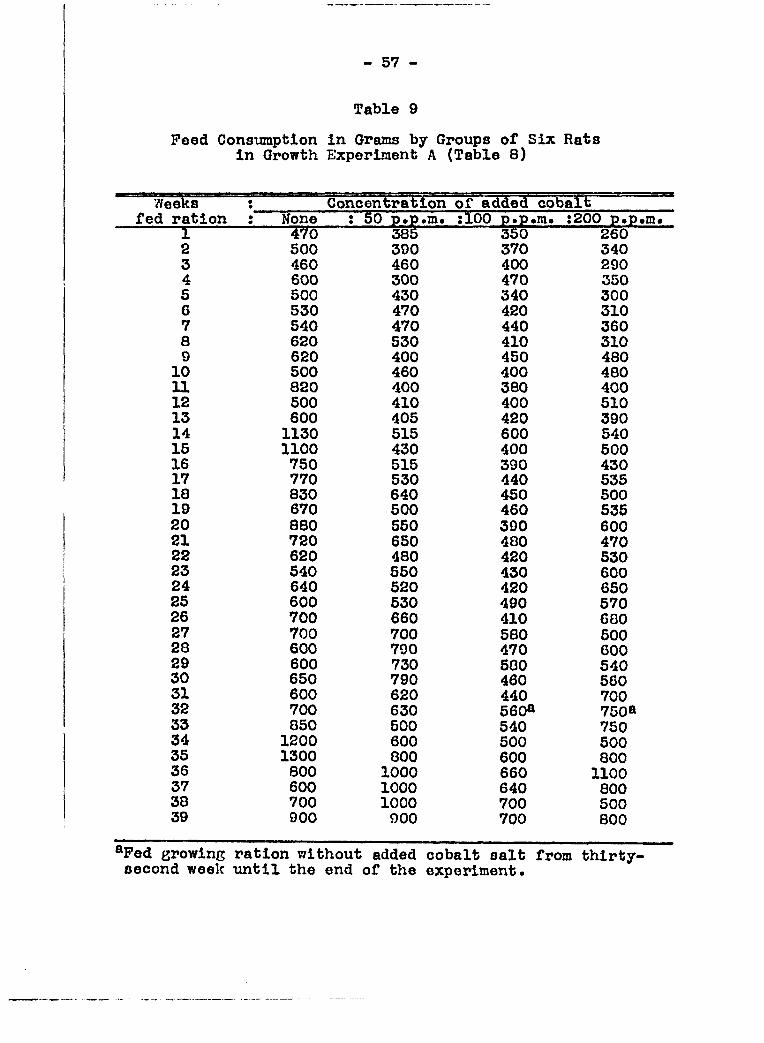
- 57 -
Table 9
Peed Conamnption in Grams by Groups of Six Rats in Growth Experiment A (Table 8)
Weeica t Concentration of added cobalt fed ration : None : 50 p*p.m» :100 p.p.m. :200 p.j>*m«
1 Aio 385 350 260 2 500 390 370 340 3 460 460 400 290 4 600 300 470 350 5 500 430 340 300 6 530 470 420 310 7 540 470 440 360 8 620 530 410 310 9 620 400 450 480 10 500 460 400 480 11 820 400 380 400 12 500 410 400 510 13 600 405 420 390 14 1130 515 600 540 15 1100 430 400 500 16 750 515 390 430 17 770 530 440 535 18 830 640 450 500 19 670 500 460 535 20 880 550 390 600 21 720 650 480 470 22 620 480 420 530 23 540 550 430 600 24 640 520 420 650 25 600 530 490 570 26 700 660 410 680 27 700 700 580 500 28 600 790 470 600 29 600 730 580 540 30 650 790 460 560 31 600 620 440 700 32 700 630 560® 7508 33 850 500 540 750 34 1200 600 500 500 35 1300 800 600 800 36 800 1000 660 1100 37 600 1000 640 800 38 700 1000 700 500 39 900 900 700 800
®Pod growing ration without added cobalt salt from thirty-second week tmtil the end of the experiment.

- 58 -
analyzed quantitatively Tor reducing sugar and tested quali
tatively for albumin* Tlie blood of the rnts receivino 50
parts per million of cobalt ion and tliat of their controls
was analyzed for non-protein nitrocon. At tlie end of the
feeding experiment, tissues were pooled and analyzed for co
balt by the nitroso-R-aalt method. Growth data are shown in
Table 10 and are plotted in Figures 2 and 3.
After being fed these rations for 23 weeks, l.ho rata re
ceiving 200 parte per laillion of added cobalt onJ thoir con
trol rats had consumed an average of 1.30 kilograms of feed
each* T}ie rats receiving only 50 parts per :aillion of added
cobalt ion and their controls had each conaumed an avera^o of
1*92 kilograms of food in the sane length of tiiae.
Qrowth experiment C. In order to observe any effects of
smaller concentrations of added cobalt nitrate than usod in
the preceding experiments, a ration containing 25 parts per
million of added oobalt nitrate was fed to a group of fifteen
males and fifteen females while another group of fifteen males
and fifteen females, receiving growing ration without added
oobalt nitrate,served as controls. Records were kept as be
fore on growth, feed consumption and reproduction. Tissues
from these rats were analyzed for cobalt by the nitroso-R-
salt method at the close of the experiment. Growth data are
presented in Table 11 and are plotted in Figure 4. Feed con
sumption data are shown in Table 12.
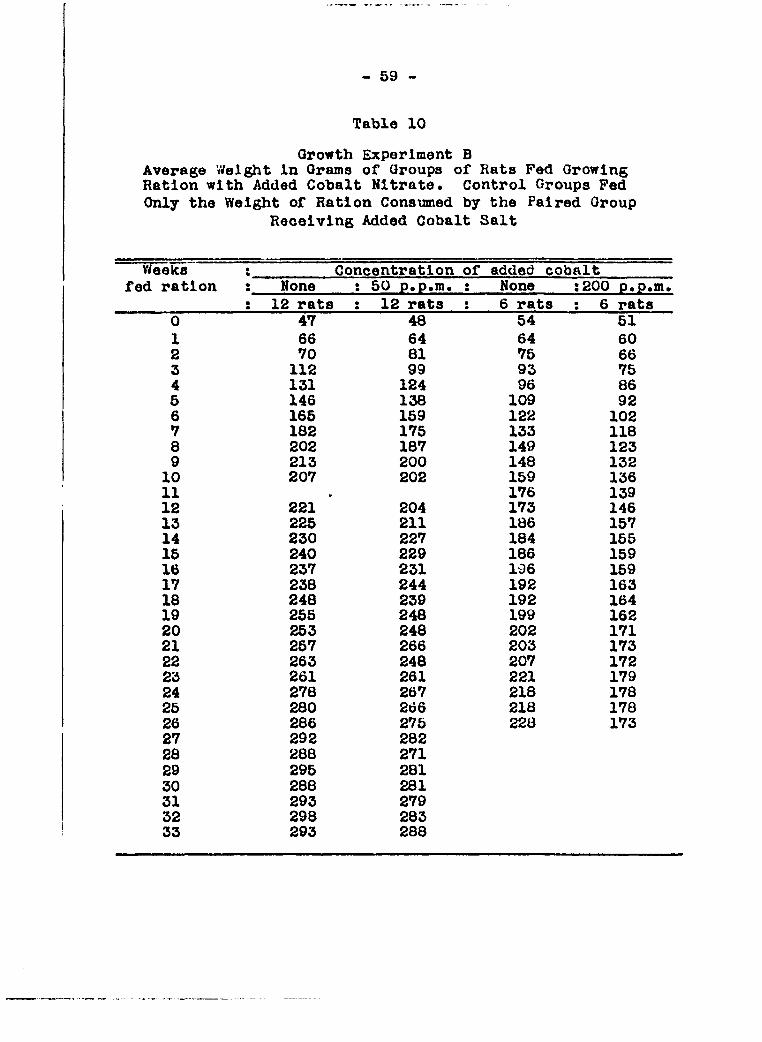
- 59 -
Table 10
Qrowth Experiment B Average Weight in Grams of Groups of Rats Fed Growing Ration with Added Cobalt Nitrate. Control Groups Fed Only the Weight of Ration Consumed by the Paired Group
Receiving Added Cobalt Salt
Weeks Concentration of added cobalt fed ration : None : 50 p.p.m. : None :200 p.p.m
: 12 rats : 12 rats : 6 rats : 6 rats 0 47 48 54 51 1 66 64 64 60 2 70 81 75 66 3 112 99 93 75 4 131 124 96 86 5 146 138 109 92 6 165 159 122 102 7 182 175 133 118 8 202 187 149 123 9 213 200 148 132 10 207 202 159 136 11 176 139 12 221 204 173 146 13 225 211 186 157 14 230 227 184 155 15 240 229 186 159 16 237 231 196 159 17 238 244 192 163 18 248 239 192 164 19 255 248 199 162 20 253 248 202 171 21 257 266 203 173 22 263 248 207 172 23 261 261 221 179 24 278 267 218 178 25 280 266 218 178 26 286 275 228 173 27 292 282 28 288 271 29 295 281 30 288 281 31 293 279 32 298 283 33 293 288

j i
i i i.'ei.'Tht
500
50
150
loo
Joncenti" Ion of con* It
IC i • J* •20 4 I 0 V'ccks foi rr:t-ioa
ri(:. i'. j.veni-i' in .-r^r-a or .:ro';ri.': of rut - <:•••. - •.ith n'!af-t ':o'r>"it r.i^rritc. L;on*roI :roup r«.-c: only tht; •:vi ir.* or r'.t, loa eonr, t'-;; n.l iija .jnbnlt
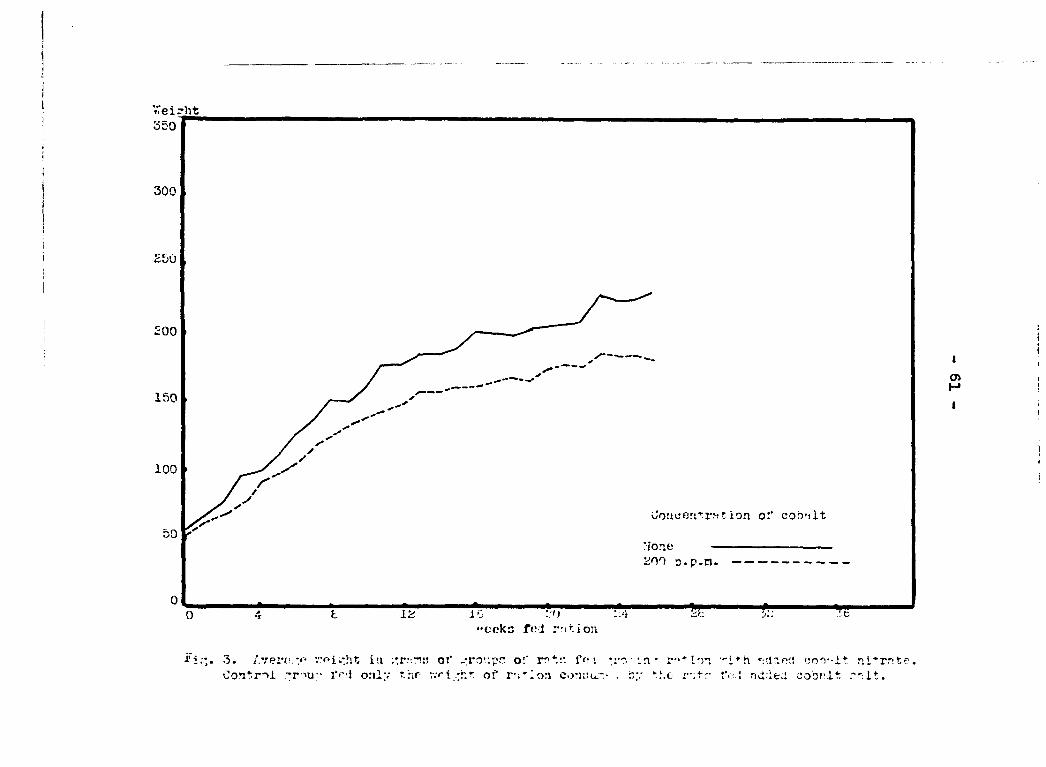
".Veirht
300
00
150
100
ion ol* cob'ilt 50
p.n
cckn foi ivition
•Ti;*. 3. v*pi.-,ht iu o!" -:ro';pn oi' ri*;: fc: •!"" -n • -i*h con'-lt r.lTnte. •Jont-r"*! -*r">u;- I ' r J only the •.vri -r.* of r-;'lon co-u;u.~- . by r.tr f. l nvirie.: cobrit rr-.it.
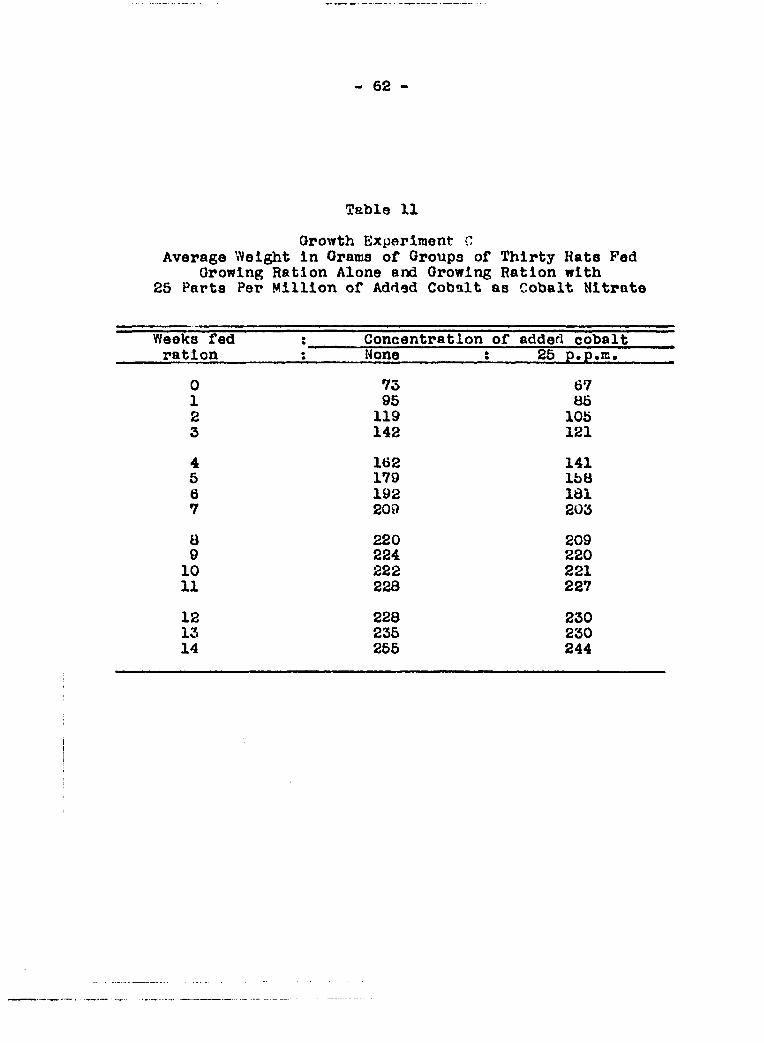
62
TBble 11
Growth Experiment C Average Wei^t in Orama of Groups of Thirty Rata Pod
Growing Ration Alone and Growing Ration with 25 Parta Per Million of Added Cobalt as Cobalt Nitrate
Weeks fed ration
: Concentration of added cobalt Weeks fed ration : None : 25 p.p.m.
0 73 67 1 95 85 2 119 105 3 142 121
4 162 141 5 179 158 6 192 181 7 209 203
8 220 209 9 224 220 10 222 221 11 228 227
12 13 14
228 235 255
230 230 244
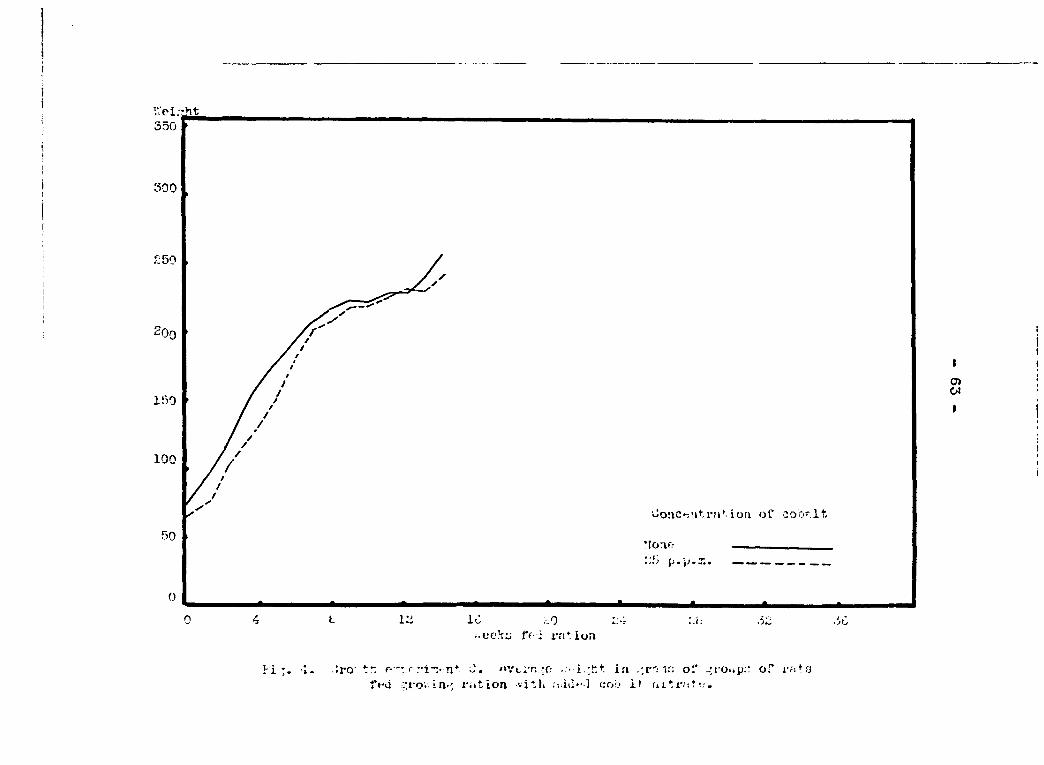
•ht 350
300
S50
100
Oonc»^!itrMMori of coo'lt
Iti 10 0 t. 0 "ccki: fr : r.'i'ion
Fi 1. Jro' C. "Vci-n ro , - in .;r'; i;: o!' _;ioup;: of rfitfj fea rrov.in-'; I'.ition '-ith cob if fiitrat*.-.
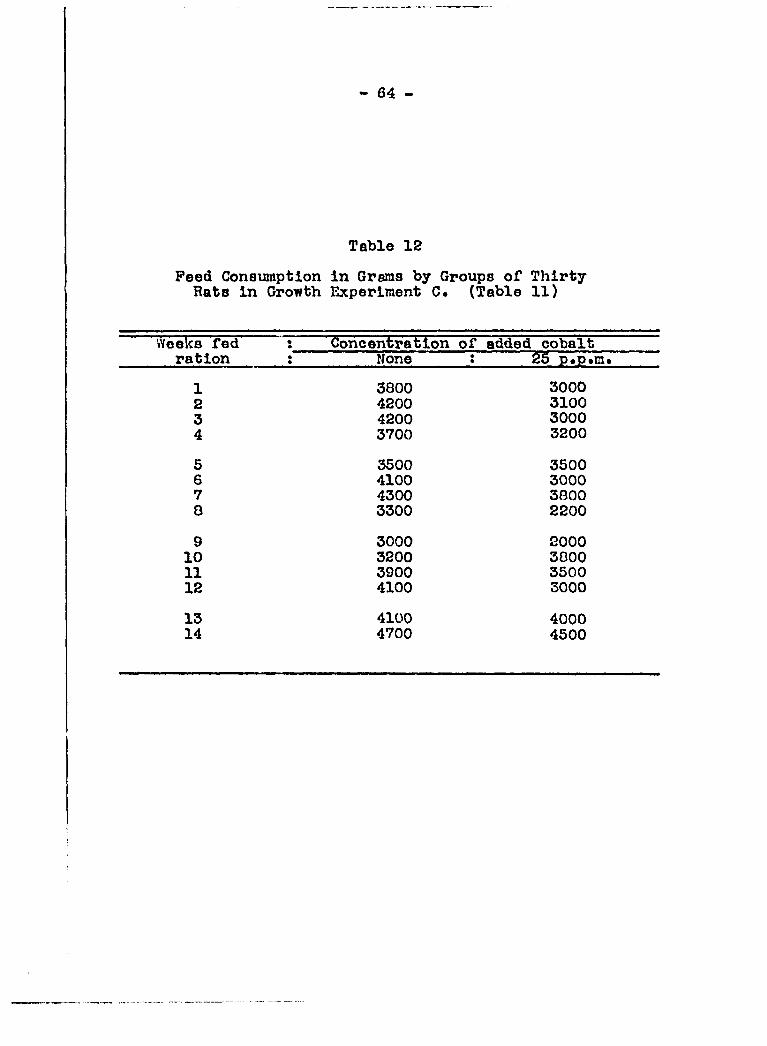
64 -
Table 12
Peed Consumption in Grams by Groups of Thirty Rats in Growth Experiment C. (Table 11)
Weeks fed ration
: Conceniraiion of added cobalt Weeks fed ration : None : 25 p«p*m*
1 3800 3000 2 4200 3100 3 4200 3000 4 3700 3200
5 3500 3500 6 4100 3000 7 4300 3800 a 3300 2200
9 3000 2000 10 3200 3000 11 3900 3500 12 4100 3000
13 4100 4000 14 4700 4500
- 65 -
Growth experlnent D» Groups of six rats each were fed
growing ration with 5 and 10 parts per million of added co
balt as cobalt nitrate, respectively, and a control group of
rats receiving no added cobalt salt was grown simultaneously.
Hemoglobin determinations were made on these rats at regular
intervals and growth, feed consumption and reproduction records
were kept as before. Some of the tissues of the group receiv
ing 10 parts per million of added cobalt and some tissues
from the controls were analyzed for cobalt as in the preced
ing experiments. Growth data are given in Table 13 and plotted
in Figure 5.
Reproduction
Reproduction data were recorded for all the rats in
growth experiments A, D, C and D but aome variations in the
conditions of the different experiments should be noted. In
all cases, however, when litters of more tlian nix young v/ere
produced, the litters were reduced to six before the females
v/ere allowed to rear them to weaning age (approximately 20
days)•
In grov/th experiment A, where cobalt nitrate was added
to the ration to give cobalt concentrations of 0, 50, 100 and
200 parts per miULon, the females were allowed to raise six
of their young to weaning age. In the case of the controls
(receiving no added cobalt ion), the females were not returned
to the males for some time after weaning of their first litters.
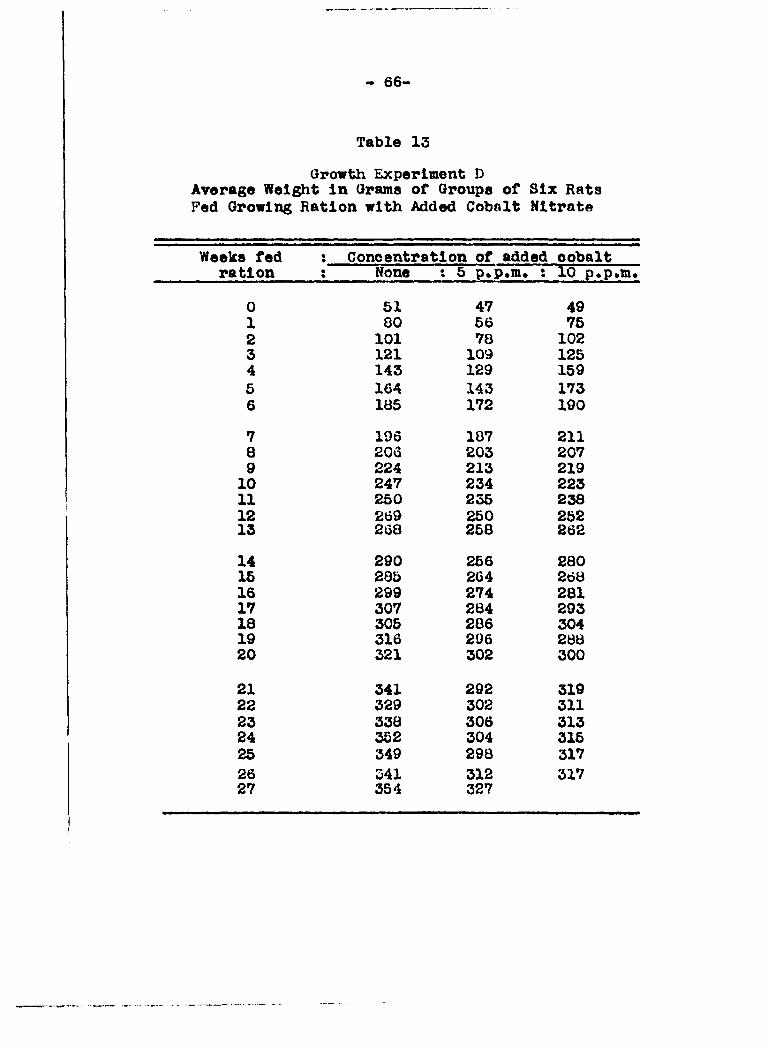
*• 66*"
Table 13
Growth Experiment D Average Weight in Grama of Groups of Six Rats Fed Growing Ration with Added Cobalt Nitrate
Weeks fed : Concentration of added cobalt ration : None * 5 p*p»ni» t 10 p.p.m.
0 51 47 49 1 00 56 75 2 101 78 102 3 121 109 125 4 143 129 159 5 164 143 173 6 185 172 190
7 196 187 211 8 206 203 207 9 224 213 219 10 247 234 223 11 250 255 238 12 269 250 252 13 2G8 258 262
14 290 256 280 15 285 264 268 16 299 274 281 17 307 284 293 18 305 286 304 19 316 296 288 20 321 302 300
21 341 292 319 22 329 302 311 23 338 306 313 24 352 304 315 25 349 298 317
26 341 312 317 27 354 327
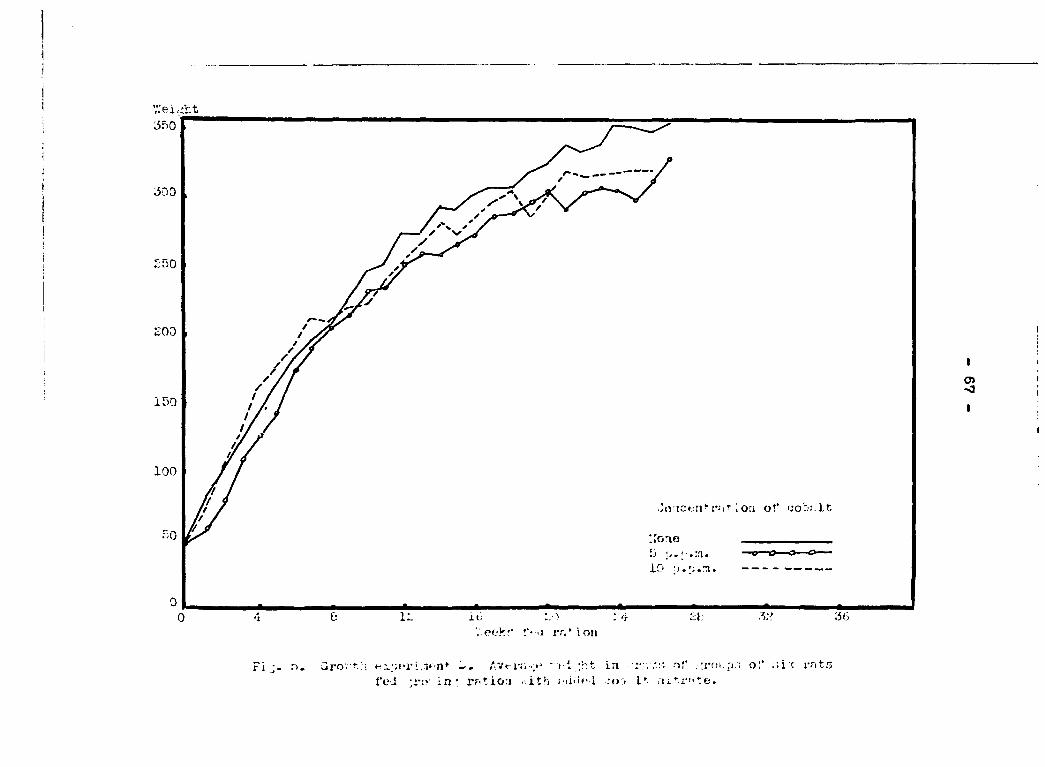
500
150
100
• 'o ictri'iM*: ion of cobi.it
fc 4 0 V.eekr !'• .j it.'ion
Fi J. n. Grovn • ci ;ht Tei :r!-' in - rfitiotj . ith .- aiU"!
in r ; .n;* n!' , 1' .ji'.r'tte-.
ol' .'.ic i-nts
- 68 -
When the control females were returned to the males, however,
they promptly reproduced again.
In growth experiment B, where the feed intake of the con
trol groups was restricted to the amount eaten by the paired
groups receiving 50 and 200 parts per million of added cobalt
ion, respectively, the females were not allowed to raise their
litters but were returned to the males after each parturition.
In growth experiment C, reproduction data Included only
the first litters raised by the females, since these rats were
Intended primarily for tissue analysis studies.
In growth experiment D In which added cobalt ion was fed
at conoentrrtlons of 0, 5 and 10 parts per million, reproduc
tion data were kept throughout the entire experiment (27
weeks) and each female was allowed to raise litters of six or
less to weaning age after each parturition.
It la apparent that due to the different conditions of
the experiments, the data from all four main groups are not
all strictly comparable. However, the conditions up to the
production of the first litter in each group are comparable
and these data are shown in Table 14. Table 15 shows a
similar comparison of data for the second litters from growth
experiments A and D only. Table 16 shows a compilation of
data for growth experiment B for the entire duration of the
experiment (25 weeks).
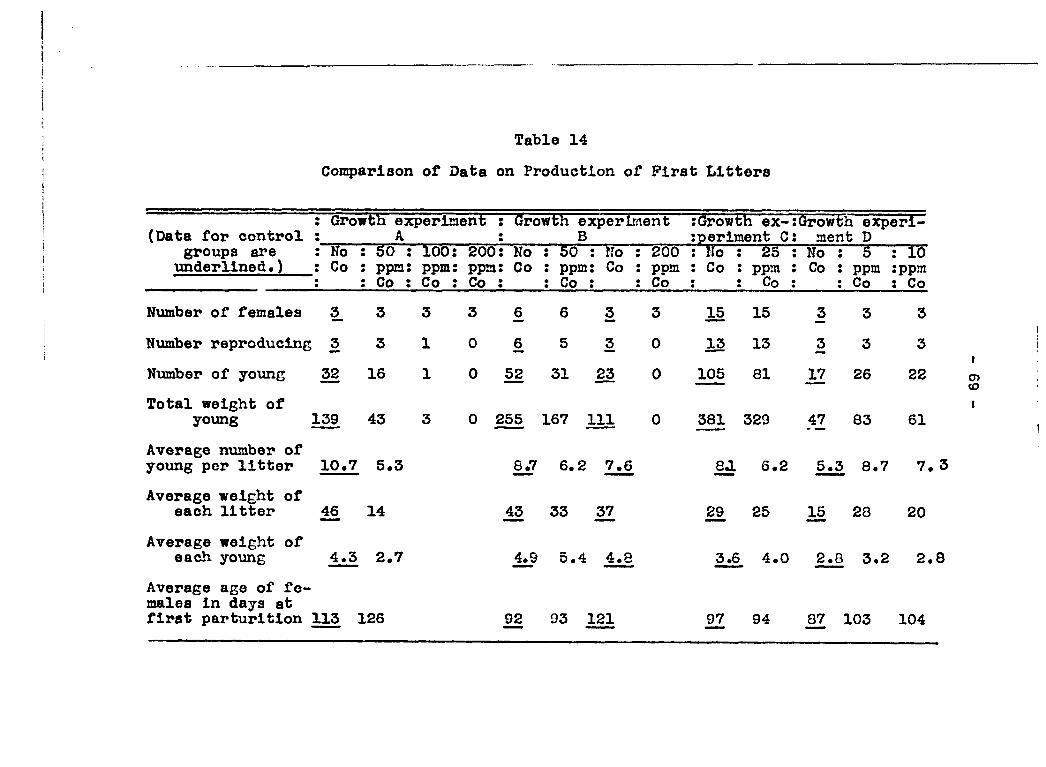
Table 14
Con^jarison of Data on Production of First Litters
: Growth experinent : Growth experLment :(3rowth ex-;Growth experi-(Data for control : A i B iperiment C: laent D
groups are underlined.)
: No : Co • •
: 50 : : ppm: : Co :
100: ppm: Co :
200 ppm Co
: No : Co • •
: 50 : ITo : : ppm: Co : : Co : :
200 ppm Co
: No : : Co : • • • •
25 : ppm : Co :
No Co
• • • • • •
5 ppm Co
: lO :ppm : Co
Number of females 3 3 3 3 6 6 3 3 M 15 3 3 3
Number reproducing 3 3 1 0 6 5 3 0 12 13 3 3 3
Number of young 16 1 0 31 ^ 0 105 81 17 26 22
Total weight of young 139 43 3 0 : 255 167 111 0 381 329 47 83 61
Average number of young per litter 10.7 5.3 8£7 6.2 7^ 6.2 3 8.7 7,
Average weight of each litter 14 43 33 ^ 25 28 20
Average weight of each young 4.5 2.7 4^9 5.4 3.6 4.0 8 3.2 2,
Average age of females in days at first parturition 113 126 92 93 121 97 94 103 104
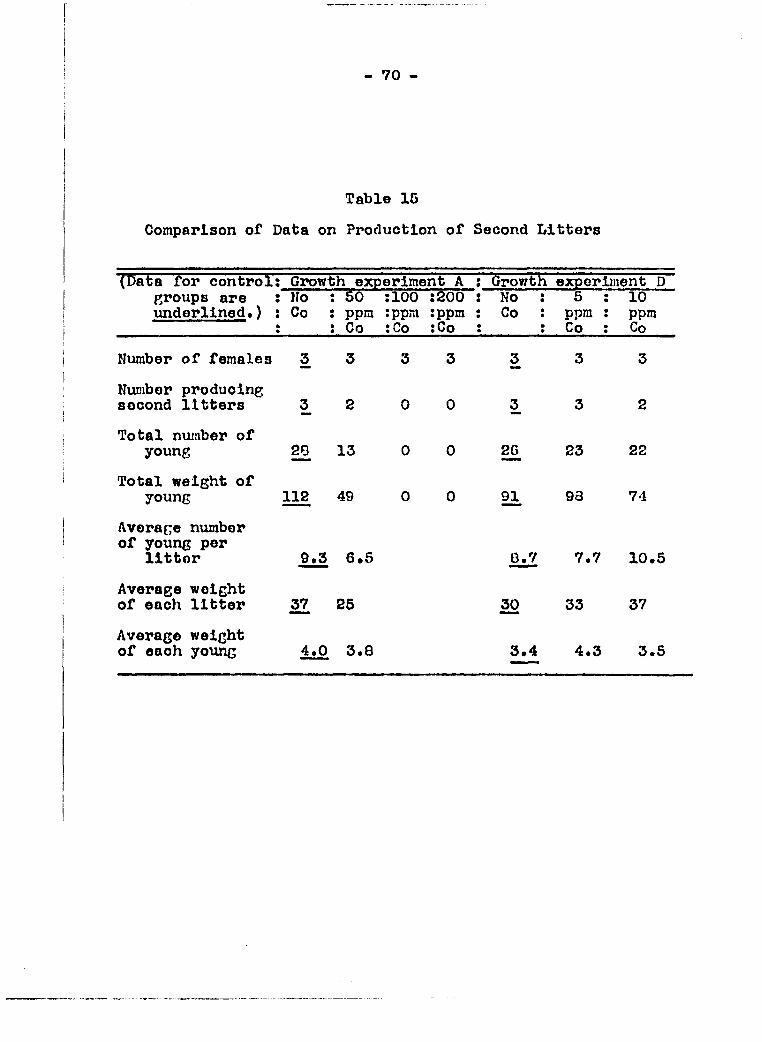
- 70 -
Table 15
Comparison of Data on Production of Second Litters
(Data for control; Growth experiment A ; Growth experiment D groups are underlined.)
: Ho : Co • •
: So : ppra : Co
:100 :ppm :Co
z2oo : tppm : :Co :
No : Co :
• •
5 : ppra : Co :
10 ppm Co
Number of females 3 3 3 3 3 3 3
Nmber producing second litters 3 2 0 0 3 3 2
Total number of young 13 0 0 26 23 22
Total weight of young 112 49 0 0 91 93 74
Average number of young per
litter 9.3 6.5 0.7 7.7 10.5
Average weight of each litter 37 25 30 33 37
Average weight of each young 4.0 3.8 3.4 4.3 3.5
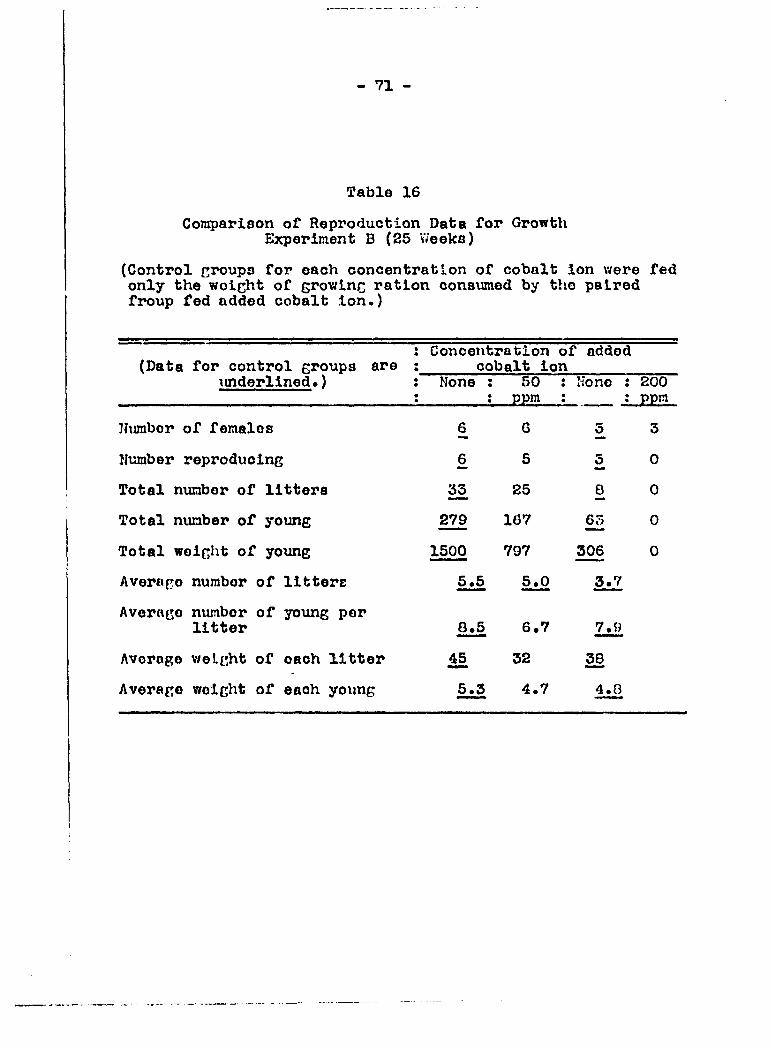
71 -
Table 16
Coiiipariaon of Reproduction Data for Growth Experiment B (25 Weeks)
(Control for each concentration of cobalt ion were fed only the weight of growinc ration consumed by the paired froup fed added cobalt ion.)
. Concentration of added (Data for control groups are : cobalt ion
underlined*) : None : 50 : None : 200 I : ppm : t pptn
Number of females
Number reproducing
Total number of litters
Total nxuaber of young
Total weight of young
Averopo number of litterE
Avernce number of yo\mg per litter
Average v/ei.Kht of oach litter
Average weight of each young
6 G 5 3
6 5 5 0
25 8 0
279 167 65 0
1500 797 306 0
5.5 5.0 3.7
8.5 6.7 7.9
32
5.3 4.7 4.0
- 72 -
Lactation
Success of lactation was Judged by the per cent of
litters raised from birth to an age of 28 days and by com
parison of the average weights of the young at birth and at
28 days of age. These data were obtained during the course of
growth experiments A, C and D for the groups of rats fed ra
tions with a sufficiently low concentration of added cobalt
ion to permit reproduction to occur. The data are summarized
in Table 17.
Hemoglobin formation
Since it is well established in the literature that
administration of sufficient amounts of cobalt salts stimu
lates hemoglobin formation In rats, an attempt was made to
determine the minimum amount of added cobalt necessary in
the diet of rats to produce such a stimulating effect.
The blood of the rats in growth experiment D, receiving
0, 5 and 10 parts per million of added cobalt (as cobalt
nitrate) was analyzed for hemoglobin at regular Intervals
for 25 weeks. Feed consvmiption records were kept. The
data from the hemoglobin determinations are summarized in
Table 19 and plotted in Figure 6. The feed consianption at
representative periods is shown in Table 18.

Table 17
Sumnapy of Data on Lactation Per Cent Success in Raising Litters* Average Weights of Each Yovmg
at Birth and at 28 Days of Age
(Data for control givjups are underlined.)
Gi?owth experiment A
experi-ment C
Growth ex^ri-ment D (Data for control givjups
are underlined.) Ho : 50 Co : ppm
: Co
No : 25 : Co ; ppm
; Co
No Co
5 ppm Co
Nuinber reproducing
Nuniber of litters born
Number of litters raised
3
6
6
Per cent success in raising litters 100^
First litter
Weight of each young at birth iVeight of each young at 28 days
Weight of each yoimg at birth
Second litter V7eight of each young at 28 days
4.5
34
4.0
40
Third litter
iVeight of each young at birth V/ei^t of each yoiing at 28 days
3
7
5
71^
2.7
26
3.5
36
4.0
29
13
13
12
9^
3.8
30
13
13
12
92fo
3.8
30
3
M
9
90^
2.8
43
3.6
65
3
8
8
lOOJ^
3.1
52
4.2
55
3.7 2.9
63 57
-J O)
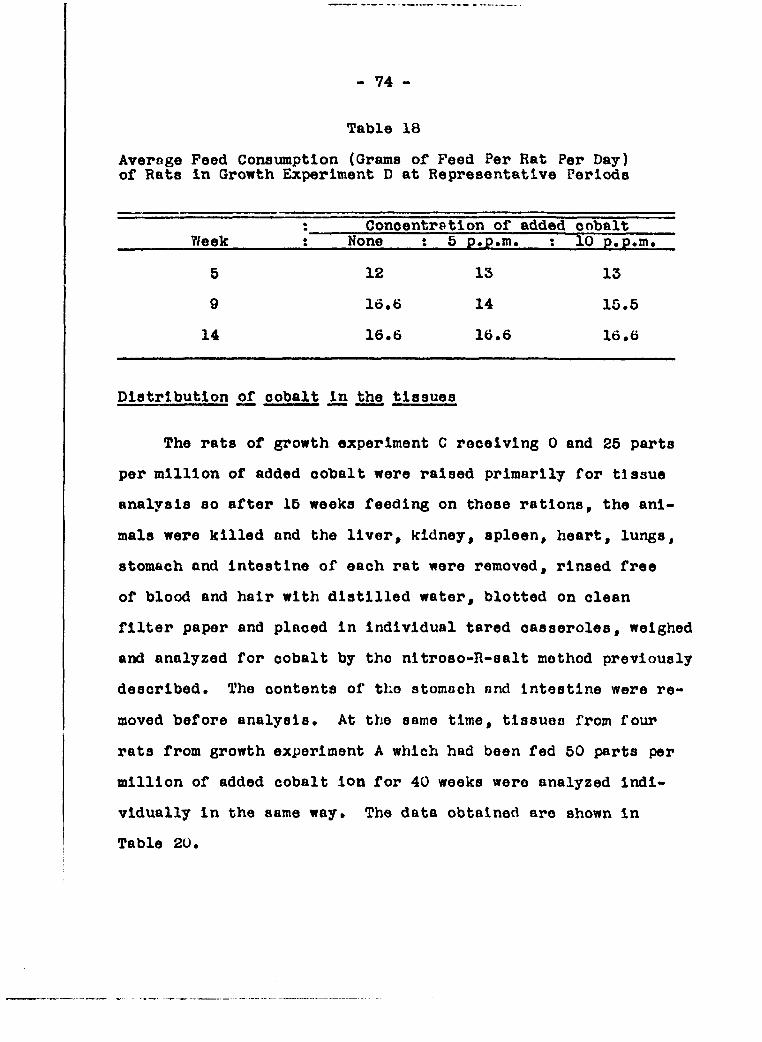
- 74 -
Table 18
Average Peed Consumption (Grams of Peed Per Rat Per Day) of Rats In Growth Experiment D at Representative Periods
7/eek : Concentration of added cobalt
7/eek : None : 5 p.p.m. : 10 p.p.m.
5 12 13 13
9 16.6 14 15.5
14 16.6 16.6 16.6
Distribution of cobalt in the tissues
The rats of growth experiment C receiving 0 and 25 parts
per million of added oolsalt were raised primarily for tissue
analysis so after 16 weeks feeding on those rations, the ani
mals were killed and the liver, kidney, spleen, heart, lungs,
stomach and Intestine of each rat were removed, rinsed free
of blood and hair with distilled water, blotted on clean
filter paper and placed in individual tared casseroles, weighed
and analyzed for cobalt by tho nitroso-R-salt method previously
described. The contents of tho stomach nnd intestine were re
moved before analysis. At the same time, tissues from four
rats from growth experiment A which had been fed 50 parts per
million of added cobalt ion for 40 weeks were analyzed indi
vidually in the same way. The data obtained are shown in
Table 20.
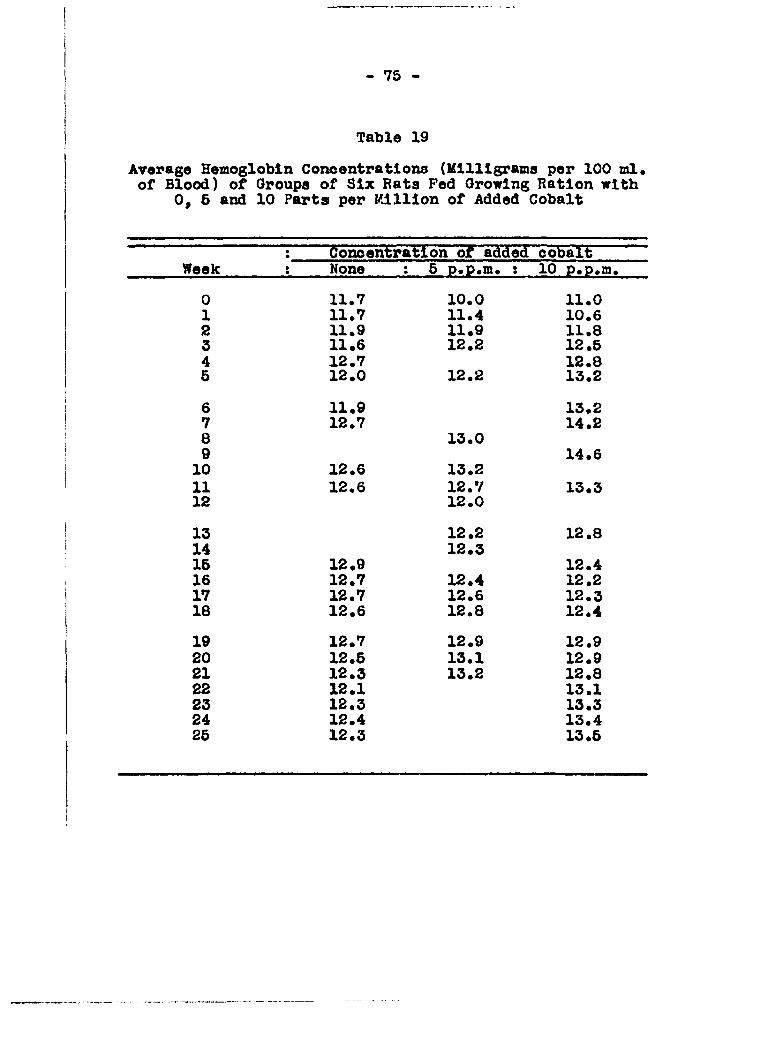
- 75 -
Table 19
Average Hemoglobin Concentrations (Kllllgrams per 100 ml. of Blood) of Groups of Six Rats Fed Growing Ration with
0, 5 and 10 Parts per Million of Added Cobalt
Concentration of added cobalt Week : None : 5 p.p.m. : 10 p.p.m
0 11.7 10.0 11.0 1 11.7 11.4 10.6 2 11.9 11.9 11.8 S 11.6 12.2 12.5 4 12.7 12.8 5 12.0 12.2 13.2
6 11.9 13.2 7 12.7 14.2 8 13.0 9 14.6 10 12.6 13.2 11 12.6 12.7 13.3 12 12.0
13 12.2 12.8 14 12.3 15 12.9 12.4 16 12.7 12.4 12.2 17 12.7 12.6 12.3 18 12.6 12.8 12.4
19 12.7 12.9 12.9 20 12.5 13.1 12.9 21 12.3 13.2 12.8 22 12.1 13.1 23 12.3 13.3 24 12.4 13.4 25 12.3 13.5
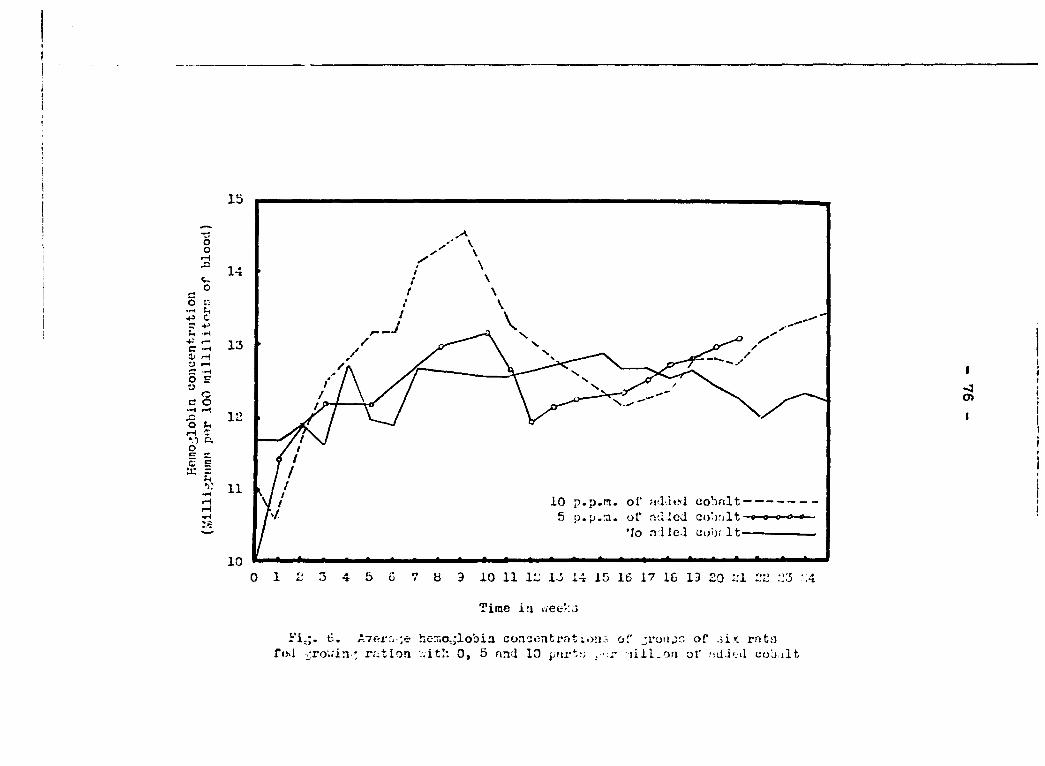
10 p.p.m. ol" aJiwl cobnlt 5 p.p.m.. oV ndicd aobrilt
"lo nlieJ Ci>b; It
Tirao in wee';3
Fi^. 6, Averr. ;e hc-:r.o,jlobia conoentrntioiji of jruapn of .jir. rnta fol ^ro./in-: ration .-.ith 0, 5 nn'l 10 lill-on of .-id.l'.il uob.ilt
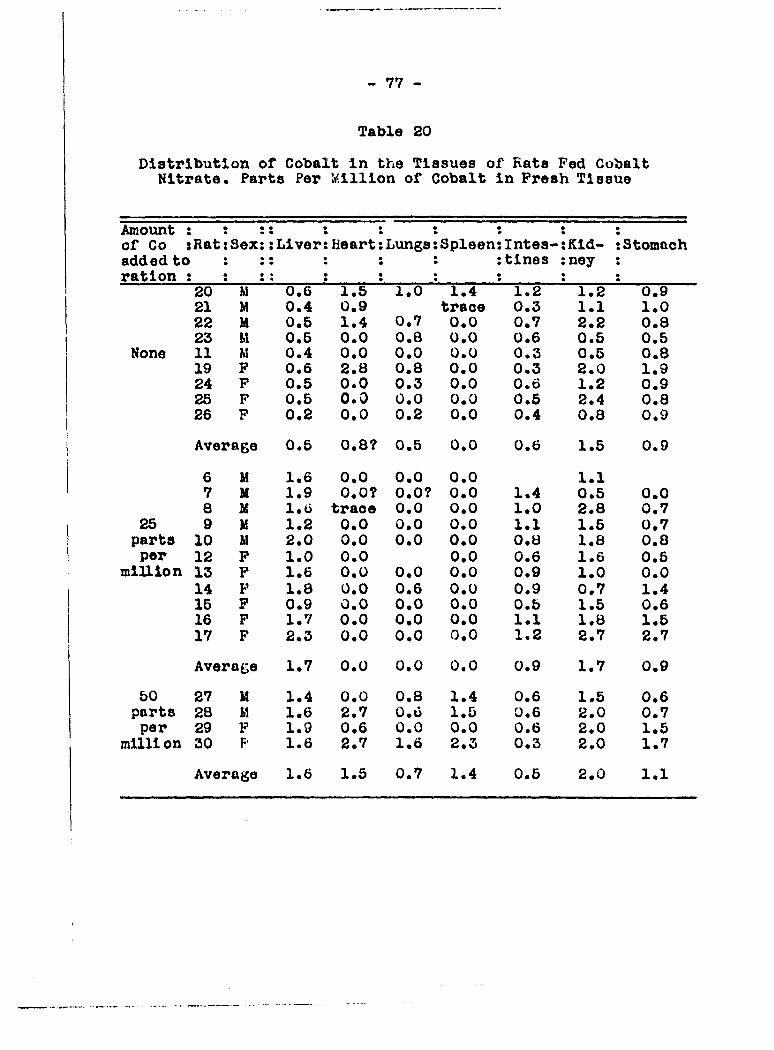
- 77 -
Table 20
Distribution of Cobalt in the Tissues of Rats Fed Cobalt Nitrate. Parts Per Million of Cobalt in Fresh Tissue
Amount • •
• • m •
• •
of Co :Rat :Sex: ;Liver Heart Lungs Spleen Intes:Kid- tStoma ( added to • •
• » tines :ney ration •
• • • • •
• •
20 M 0.6 1.5 1.0 1.4 1.2 1.2 0.9 21 M 0.4 0.9 trace 0.3 1.1 1.0 22 H 0.5 1.4 0.7 0.0 0.7 2.2 0.8 23 M 0.5 0.0 0.8 0.0 0.6 0.5 0.5
None 11 M 0.4 0.0 0.0 0.0 0.3 0.5 0.8 19 P 0.6 2.8 0.8 0.0 0.3 2.0 1.9 24 P 0.5 0.0 0.3 0.0 0.6 1.2 0.9 25 P 0.5 0.0 0.0 0.0 0.5 2.4 0.8 26 P 0.2 0.0 0.2 0.0 0.4 0.8 0.9
Average 0.5 0.8? 0.5 0.0 0.6 1.5 0.9
6 H 1.6 0.0 0.0 0.0 1.1 7 M 1.9 0.0? 0.0? 0.0 1.4 0.5 0.0 8 M 1.6 trace 0.0 0.0 1.0 2.8 0.7
25 9 H 1.2 0.0 0.0 0.0 1.1 1.5 0.7 parts 10 M 2.0 0.0 0.0 0.0 O.B 1.8 0.8 per 12 P 1.0 0.0 0.0 0.6 1.6 0.5
million 13 F 1.6 0.0 0.0 0.0 0.9 1.0 0.0 14 P 1.8 0.0 0.6 0.0 0.9 0.7 1.4 15 P 0.9 0.0 0.0 0.0 0.5 1.5 0.6 16 P 1.7 0.0 0.0 0.0 1.1 1.8 1.5 17 F 2.3 0.0 0.0 0,0 1.2 2.7 2.7
Average 1.7 0.0 0.0 0.0 0.9 1.7 0.9
50 27 M 1.4 0.0 0.8 1.4 0.6 1.5 0.6 parts 28 M 1.6 2.7 0.6 1.5 0.6 2.0 0.7 per 29 P 1.9 0.6 0.0 0.0 0.6 2.0 1.5
mllli on 30 F- 1.6 2.7 1.6 2.3 0.3 2.0 1.7
Average 1.6 1.5 0.7 1.4 0.5 2.0 1.1
- 70 -
Tissues of three rats which had been fed 10 parts per
million of added cobalt in growth experiment h were next
analyzed individually as before, along with tissues from six
of the control rata which had not been fed added cobalt salt.
Tissues analyzed were liver, kidney, spleen, pancreas and
heart. These data are shown in Table 21.
A third series of analyses was made on the tissues of
24 rats of growth expnriment B in which added cobalt ion was
fed in concentr Jit ions of 50 r.nd 200 parts per million along
with control groups receiving no added cobalt ion. Organs
annlyzed were liver, kidney, spleen, pancreas, heart, lungs
and testes. In these analyses, similar organs fr(m throe
rats receiving the same concentration of added cobalt salt
were pooled so that the cobalt present might bo more easily
determined due bo tho increased amount in each sample
analyzed. For these reasons (the greater niunber or rata
used, the increased amount of cobalt in each sample) as
well as the fact tliHt these analyses were made after much
valuable experience with tho method had been obtained, these
data must bo considered the moat acciurate of all the data
shown for distribution of cobalt in the tissues. These
data are presented in Table 22.
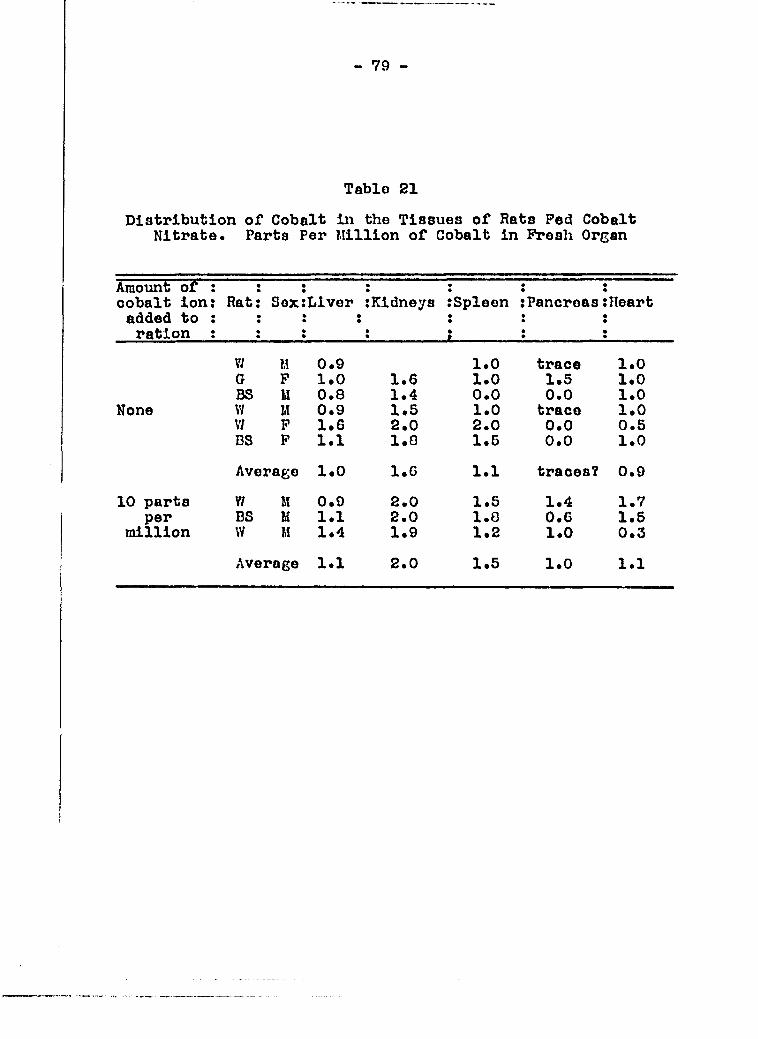
- 79
Tablo 21
Distribution of Cobalt in the Tissues of Rats Fed Cobalt Nitrate. Parts Per Million of Cobalt in Fresh Organ
Araotont of : I i i : I i cobalt ion: Rat: Sox:Llver tKidneys :Spleon :Pancreas:Heart added to : : : : : : : ration t ; : ? j i z
None
w M 0.9 1.0 trace 1.0 G P 1.0 1.6 1.0 1.5 1.0 BS U 0.8 1.4 0.0 0.0 1.0 W M 0.9 1.5 1.0 trace 1.0 \7 P 1.6 2.0 2.0 0.0 0.5 BS P 1.1 1.0 1.5 0.0 1.0
Average 1.0 l.G 1.1 traces? 0.9
10 parts W M 0.9 2.0 1.5 1.4 1.7 per BS H 1.1 2.0 1.0 0.6 1.5
million W M 1.4 1.9 1.2 1.0 0.3
Average 1.1 2.0 1.5 1.0 1.1
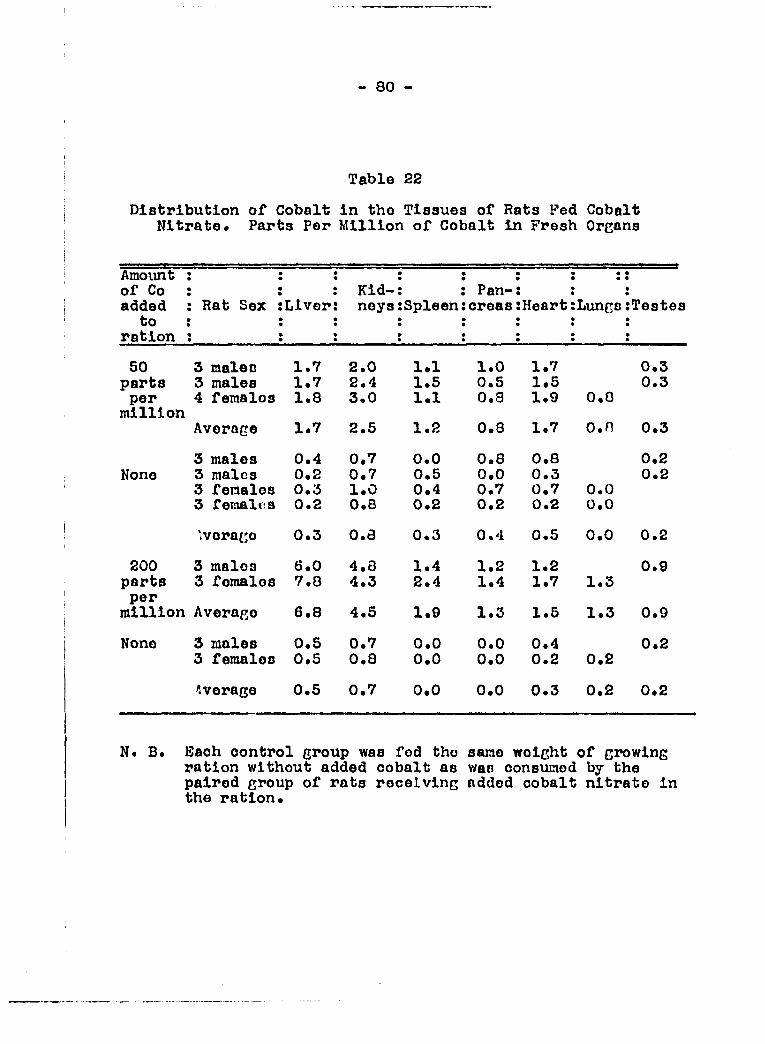
- 80
Table 22
Distribution of Cobalt in tho Tissues of Rats Fed Cobalt Nitrate. Parts Per Million of Cobalt in Fresh Organs
Amount • •
of Co Kid Panadded Bat Sex Liver: neys Spleen creas Heart Lvings Testes
to neys
ration
50 3 males 1.7 2.0 1.1 1.0 1.7 0.3 parts 3 males 1.7 2.4 1.5 0.5 1.5 0.3 per 4 females 1.8 3.0 1.1 0.8 1.9 0.8
million Average 1.7 2.5 1.2 0.8 1.7 o.n 0.3
3 males 0.4 0.7 0.0 0.8 0.8 0.2 None 3 malos 0.2 0.7 0.5 0.0 0.3 0.2
3 females 0.3 1.0 0.4 0.7 0.7 0.0 3 females 0.2 0.8 0.2 0.2 0.2 0.0
Average 0.3 0.8 0.3 0.4 0.5 0.0 0.2
200 3 malos 6.0 4.8 1.4 1.2 1.2 0.9 parts 3 females 7.0 4.3 2.4 1.4 1.7 1.3 per
million Average 6.8 4.5 1.9 1.3 1.5 1.3 0.9
None 3 males 0.5 0.7 0.0 0.0 0.4 0.2 3 females 0.5 0.8 0.0 0.0 0.2 0.2
Average 0.5 0.7 0.0 0.0 0.3 0.2 0.2
N. B. Each control group was fed tho same weight of growing ration without added cobalt as v;aa consumed by the paired group of rats receiving added cobalt nitrate in the ration.
81 -
Rate of deposition of cobalt In the liver
The study on the distribution of cobalt In tha tissues
showed that cobalt was deposited in greater proportion In the
liver than in any other organ. For this reason it was
thought of interest to determine the length of time nec
essary for the cobalt concentrr tion to reach a majclmian in
the liver when rats were fed a diet containing added cobalt
salt.
Young rats (80-100 grams in weight) were fed growing
ration to which 100 parts per million of cobalt had been
added in the form of cobalt nitrate. One male and one fe
male were killed each day, the livers removed and analysed
for cobalt in duplicate. To serve as controls, the livers
of two males and two females were analyzed for cobalt before
the feeding of added cobalt salt was started. Food consump
tion and weight records were kept. The data obtained are
shown in Table 23.
Toxicity of cobalt salts administered by stomach tube
Since there is little agreement in the literature as to
the minimum lethal dose of cobalt ion for rats, it was thought
advisable to determine the toxicity of the cobalt salts used
in previous experiments when given by stomach tube in solution
in varying amounts to rats of different weights.

- 62 -
Table 23
Rate of Deposition of Oobalt in the Liver of Ration with 100 Parts Per Million of Ad
Nunber of days rats were fed
ration with added oobalt
nitrate
0 1 2 3
• •
Average food : oonsumption per:
rat (grams) : 12 13 10
1 1 1 I 1 1 1 Oobalt intake (niorograms) : 1200
•
1300 : 1000
S e x : F P M M ! F M ! F M : F M • • • •
Weight (grams) : a<S tO 98 • 126: 109 120: l46
• Weight of fresh
liver (grams) ' (part) :
3.07 2.99 3.11 3.0'^: 1.30 3.39: 3.66 2.83 4.35. •
Cobalt found (micrograms) 7 .0 5 .0 6.8 k.7
•
4 .5 12 .3 18 23 21 14.5 21
Cobalt concentration, parts per million 8 .2 1 .7 2 .2 1.5 3 .5 3 .6 4 .9 4 .6 7 .5 3 .4 (
Average cobalt concentration,
males and females
1
1.9 3 .6 4 .8 5 .4


Liver of Rats Fed Orovlng Ion of Added Cobalt
J I
4 5 6 7 8
10 11 12 13 14
1000 1100 1200 130 c l4oo
M
lk6
F F M M
112 62 120 106
F F
92 114
F M
93 13«
F M
101 143
F M
118 118
3.37 2.05 4.22 3.39 3.16 3.36- 2.82 3'( 7 •3.17 5.13
Ipart)
2.42 3.64
14.5
t ' ' " '
22.5 20 17 23 21.5 32 29 20 27 21 .5 13.5 23.5
3.4 6 .9 9.6 4.4 6 , 6 6 . 6 9.9 10.3 5.5 6 . J 4.2 7 .5 6.6
.4 7 .0 (0.4) (females
only)
7.9 6 .5
1
7.0
»

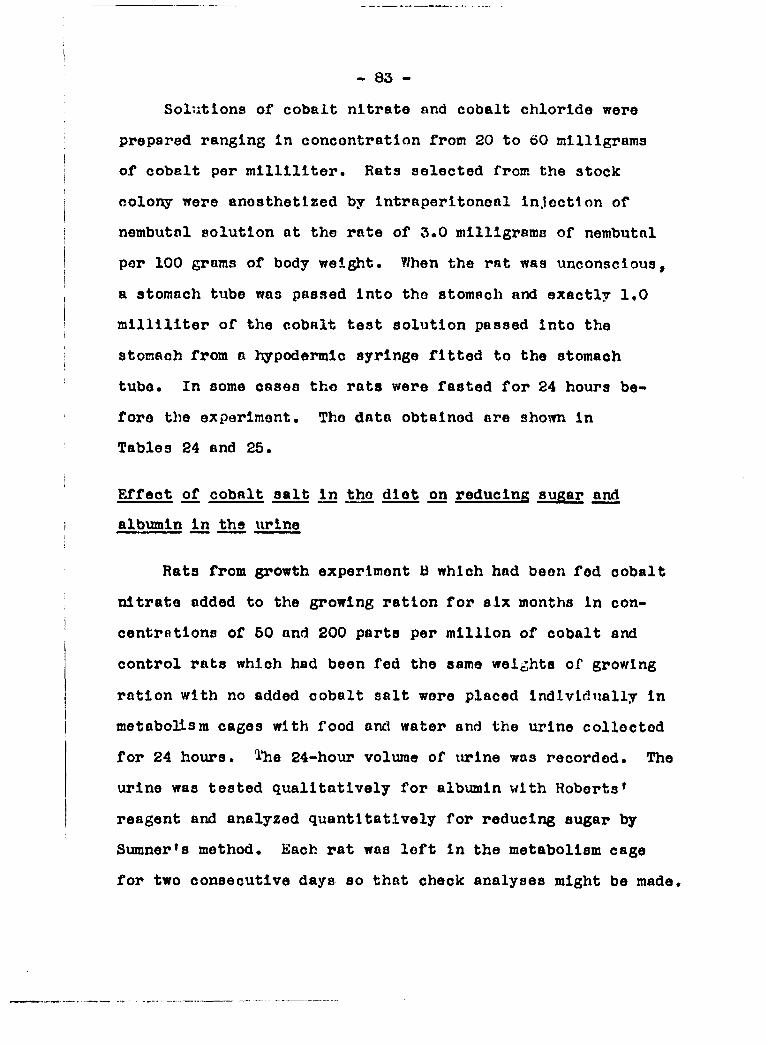
- 83 -
Solutions of cobalt nitrate and cobalt chloride were
prepared ranging in concentration from 20 to 60 mllligrama
of cobalt per milliliter. Rata selected from the stock
colony were anesthetized by intraperitoneal injection of
nembutal solution at the rate of 3.0 milligrams of nembutal
per 100 grams of body weight. ?ihen the rat was unconscious,
a stomach tube was passed into the stomach and exactly 1.0
milliliter of the cobalt test solution passed into the
stomach from a hypodermic syringe fitted to the stomach
tube. In some cases the rats were fasted for 24 hoiirs be
fore the experiment. The data obtained are shown in
Tables 24 and 25.
Effect of cobalt salt In the diet on reducing sugar and
albumin in the urine
Rats from growth experiment B which had been fed cobalt
nitrate added to the growing ration for six months In con
centrations of 60 and 200 parts per million of cobalt and
control rats which had been fed the same weights of growing
ration with no added cobalt salt were placed individually in
metabolism cages with food and water and the urine collected
for 24 hours, llie 24-hour volume of urine was recorded. The
urine was tested qualitatively for albumin with Roberts*
reagent and analyzed quantitatively for reducing sugar by
Sumner's method. Each rat was left in the metabolism cage
for two consecutive days so that check analyses might be made.

- 04
Table 24
Effects of Administering Cobalt Chloride Solution to Rats by Stomach Tube
(None of the rats in tliis experiment were fasted*)
Sex
Rat
: Weight
:Uilligrams of : cobalt ion : injected • •
:Milllgrams of : cobalt ion :per 100 crasia :of body weisht
Effect
M 220 30 14 Recovered M 277 40 14 Recoverod M 274 40 15 Recovered M 273 40 15 Recovered P 166 30 18 Recovered
P 165 30 18 Recoverod P 154 30 20 Died M 270 60 22 Died M 250 60 24 Died M 244 60 25 Died
P 160 40 25 Died P 163 40 25 Died M 220 60 27 Died P 144 40 20 Died
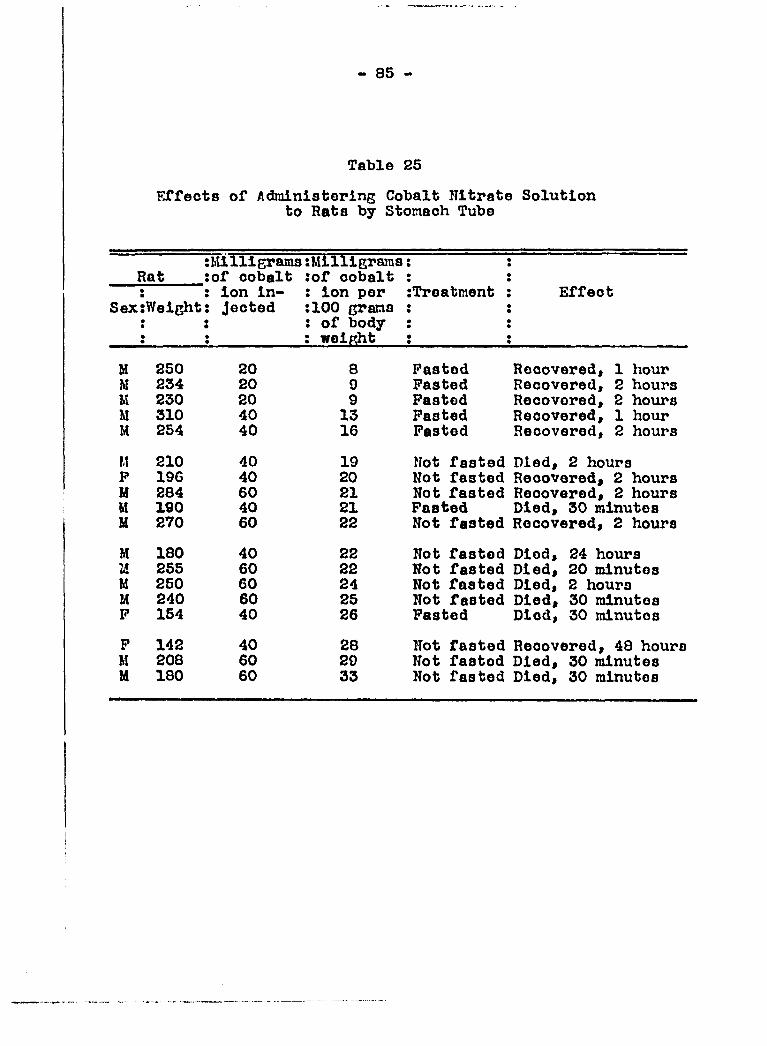
- 85 -
Table 25
Effects of Administering Cobalt Nitrate Solution to Hats by Stomach Tube
:Hiiligrams tMilligraras • • Rat :of cobalt :of cobalt •
•
: ion in- : ion per rTreatment Effect Sex Weight : Jected :100 grans •
•
« • : of body •
•
• • : weifJit •
•
M 250 20 8 Pasted Recovered, 1 hour M 234 20 9 Pasted Recovered, 2 hours U 230 20 9 Pasted Recovered, 2 hours M 310 40 13 Pasted Recovered, 1 hour M 254 40 16 Pasted Recovered, 2 hours
H 210 40 19 Not fasted Died, 2 hours P 196 40 20 Not fasted Recovered, 2 hours H 284 60 21 Not fasted Reoovered, 2 hours M 190 40 21 Pasted Died, 30 minutes M 270 60 22 Not fasted Recovered, 2 hours
M 180 40 22 Not fasted Died, 24 hours Id 255 60 22 Not fasted Died, 20 minutes M 250 60 24 Not fasted Died, 2 hours M 240 60 25 Not fasted Died, 30 minutes P 154 40 26 Pasted Died, 30 minutes
P 142 40 28 Not fasted Recovered, 48 hours M 208 60 29 Not fasted Died, 30 i^nutes M 180 60 33 Not fasted Died, 30 minutes
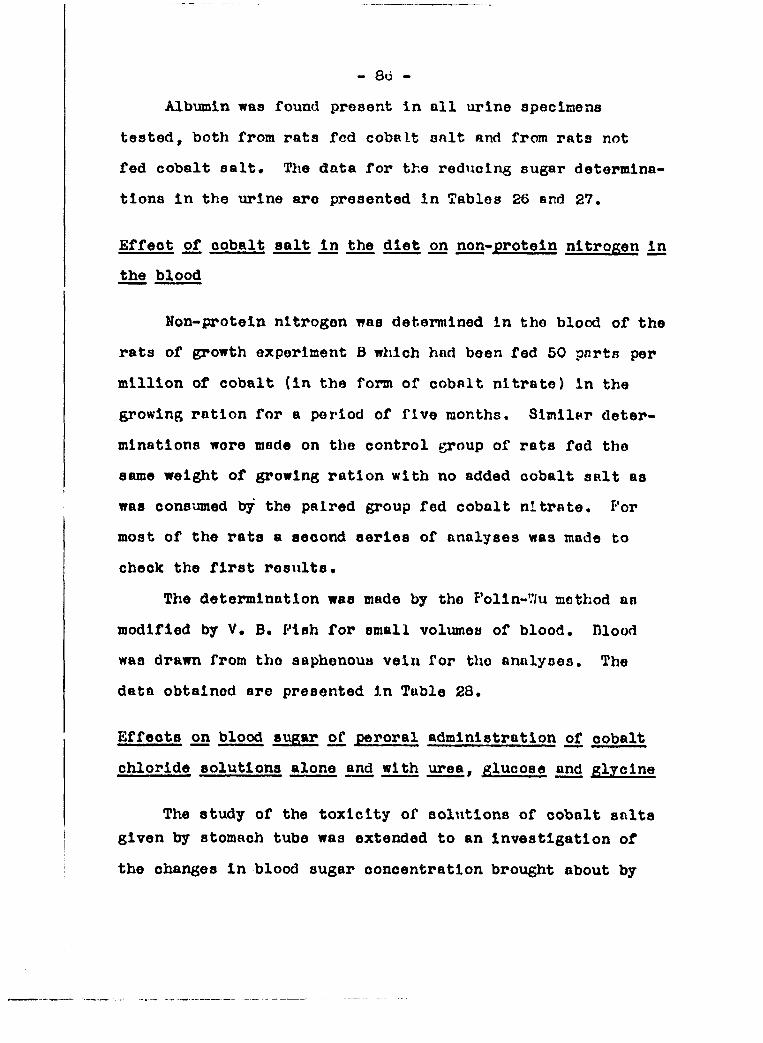
- 8d -
Albvanin was found present in oil urine specimens
tested, both from rats fod cobalt salt and from rats not
fed cobalt salt. Tlie data for the reducing sugar determina
tions in the urine are presented in Tables 26 and 27,
Effect of cobalt salt in the diet on non-protein nitrogen in
the blood
Non-protein nitrogen was determined in tho blood of the
rats of growth experiment B which had been fed 50 pnrta per
million of cobalt (in the form of cobalt nitrate) in the
growing ration for a period of five months. Similar deter
minations wore made on the control group of rats fed the
same weight of growing ration with no added cobalt salt as
was consumed by the paired group fed cobalt nitrate. I'or
most of the rats a second series of analyses was made to
check the first results.
The determination was made by the Folin-V/u method an
modified by V. B. Pish for small volumes of blood, niood
was drawn from tho saphenous vein for tho analyses. The
data obtained are presented in Table 28.
Effects on blood sugar of peroral administration of cobalt
chloride solutions alone and with urea, glucose and glycine
The study of the toxicity of solxitlons of cobalt salts
given by stomach tube was extended to an investigation of
the changes in blood sugar concentration brought about by
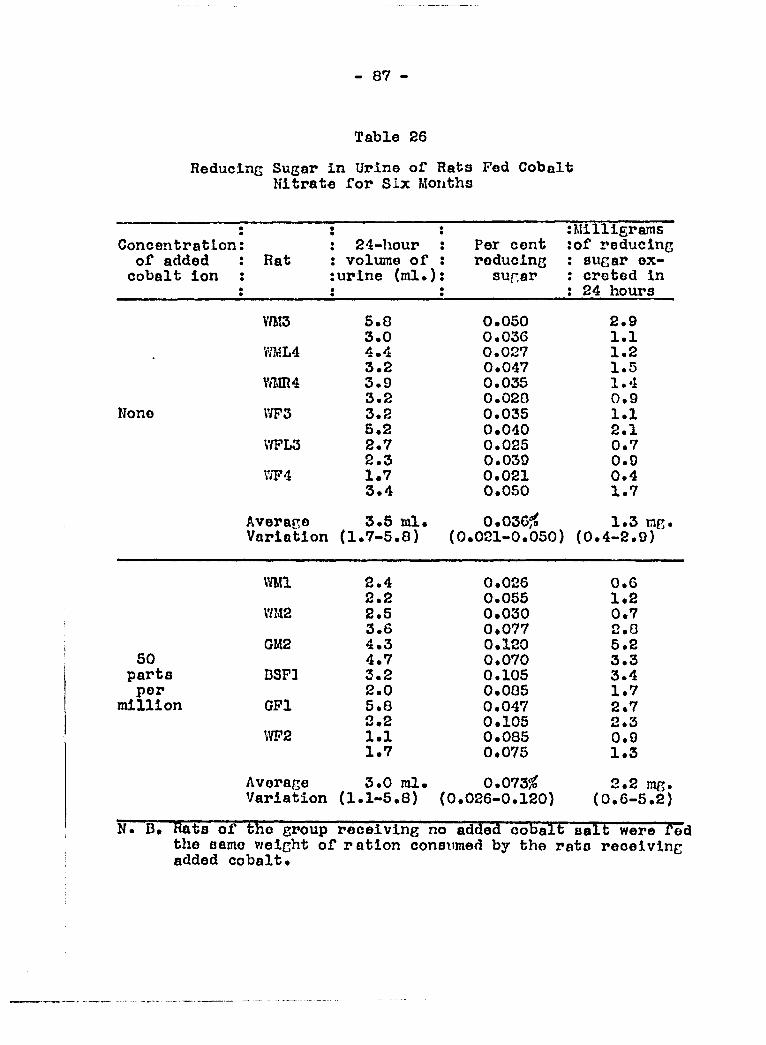
- 87
Table 26
Reducing Sugar in Urine of Hats Fed Cobalt Nitrate for Six Months
:Milllgrains Concentration 24-hour : Per cent :of reducing of added Rat volume of : reducing ; sugar ex-cobalt ion urine (ml.) : sup,ar : croted in
; 24 hours
miz 5.8 0.050 2.9 3.0 0.036 1.1 4.4 0.027 1.2 3.2 0.047 1.5
V/MR4 3.9 0.035 1.4 3.2 0.020 0.9
None WPS 3.2 0.035 1.1 5.2 0.040 2.1
V/PL3 2.7 0.025 0.7 2.3 0.039 0.9
iYF4 1.7 0.021 0.4 3.4 0.050 1.7
Average 3.5 ml. 0.036? 1.3 ng. Variation (1.7-5.8) (0.021-0.050) (0.4-2.9)
W1 2.4 0.026 0.6 2.2 0.055 1.2
WM2 2.5 0.030 0.7 3.6 0.077 2.0
GM2 4.3 0.120 5.2 50 4.7 0.070 3.3 parts DSP] 3.2 0.105 3.4 per 2.0 0.085 1.7
million GPl 5.8 0.047 2.7 2.2 0.105 2.3
\VP2 1.1 0.085 0.9 1.7 0.075 1.3
Average 3.0 ml. 0.073 2.2 mg. Variation (1.1-5.8) (0.026-0.120) (0.6-5.2)
N. B* Rats of the group receiving no added cobalt aalt were fed the same v/elcht of ration consumed by the rats reoelvlng added cobalt.
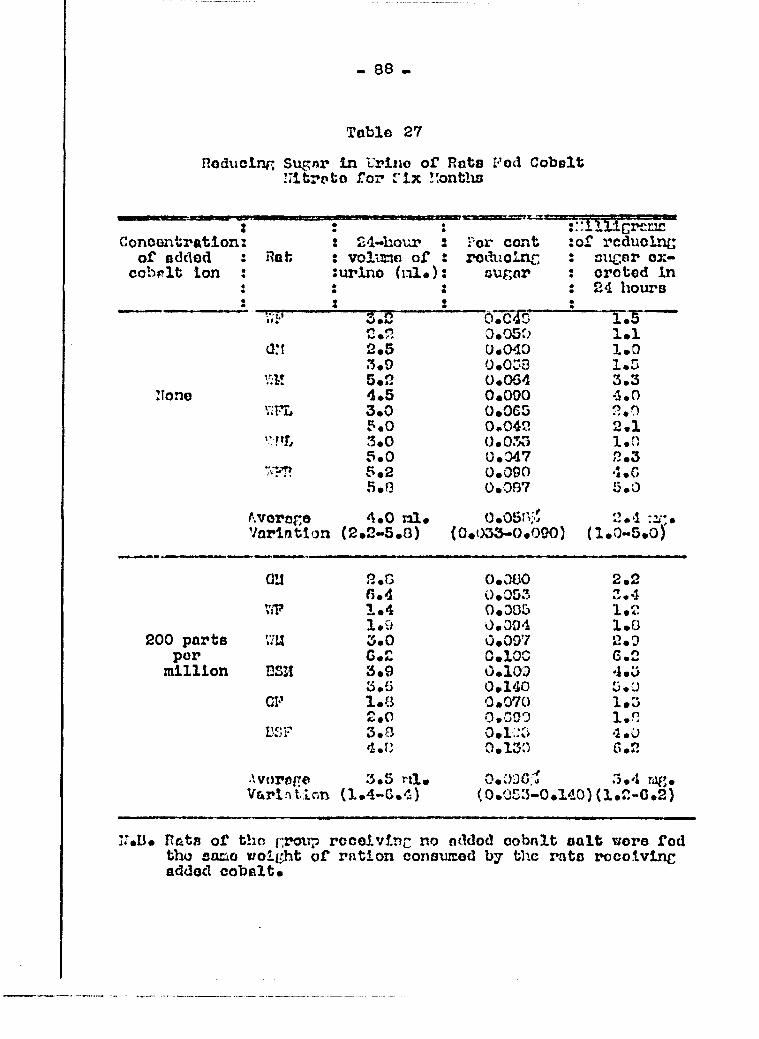
- 88 -
Toble 27
Roduclnf; Sugfir In Vrlne of Rota Fed Cobelt 'Iltrpto for Tlx !'onths
• • « • • • "illiGTcnic
Concentration : : Ed-hovir • Tor cont of rcducinc of added : Hat : volisno of • • roiSiiclnc ciiG®*' o ~
cobplt Ion • • urine « « sugor croted in « • • •
i X • • • •
sugor 24 hours
0.C40 1.5 2.9, 0.050 1.1
art 2.5 0.040 1.0 3,9 0.033 1.5
m 5.2 0.064 3.3 Ifone 4.5 0.000 4.0
'UFL 3.0 0.065 2.0 ?.o 0.042 2.1
''VL 3.0 0.053 1.0 5.0 0.047 2.3
"•TFP. 6.2 0.090 4.C 5.f3 0.0f37 5.0
/".vorono 4.0 al. O.OSfv^ 2.4 Variation (2.2- .0) (0.1)33-0.090) (1.0-"5.0)
au 2.8 0.000 2.2 r>.4 0.053 3.4
ViT? 1.4 0.005 1.2 1.9 0.094 1.0
200 parts V/U 3.0 0.097 2.0 por 6.2 O.IOC 6.2
million DS2I 3.9 0.100 'ImO 3.6 0.140 5.U
ai' l.B 0.070 1.3 2.0 0.000 i.n 3.B o.i;jc> 4.0 4.n 0.130 6.2
Avorofie 3.5 ra. O.J)OG> 3.4 rof'. Varintlnn (1.4-G.4) (0.053-0.140)(1.2-C.2)
"•t)« Rftts of the niwp rocelvlnc no nddod oobnlt oalt wore fed tho soEio weight of ration conoxjced by tlie rats rcco.lvtnc eddocT oobelt*
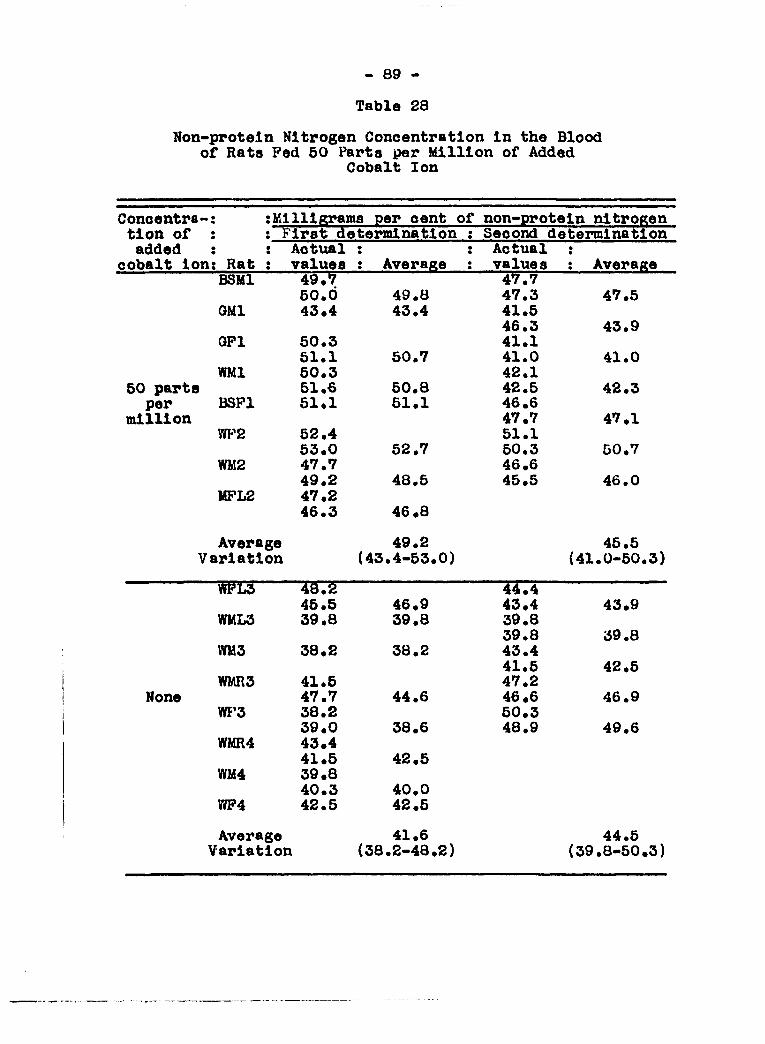
- 89 -
Table 28
Non-protein Nitrogen Concentration in the Blood of Rats Fed 50 Parts per Million of Added
Cobalt Ion
Conoentra-• % tMilliRrems per cent of non-protein nitrogen
tion of • • : First determination ; Second determination
added • • : Actxxal • •
• • Actual • •
cobalt ion : Rat : values : Averapce : values : Average BSHl 49,7 47.7
50.6 49.8 47.3 47.5 OMl 43,4 43.4 41.5
46.3 43.9 QFl 50.3 41.1
51.1 50.7 41.0 41.0 WMl 50.3 42.1
50 parts 51.6 50.8 42.5 42.3 per BSFl 51.1 51.1 46,6
million 47,7 47,1 WP2 52.4 51.1
53.0 52.7 50.3 50.7 WH2 47.7 46,6
49.2 48.5 45.5 46.0 MFIi2 47.2
46.3 46,8
Average 49.2 45.5 Variation (43.4-53.0) (41.0-50.3)
WPL3 48.2 44.4 45.5 46.9 43.4 43,9
WML3 39.8 39.8 39.8 39.8 39.8
\VM3 38.2 38.2 43.4 41.5 42.5
WMR3 41.5 47.2 None 47.7 44.6 46,6 46.9
TO'3 38.2 50.3 39.0 38.6 48.9 49.6
WMR4 43,4 41,5 42,5
WM4 39,8 40.3 40.0
V?P4 42.5 42,5
Average Variation
41.6 (38.2-48.2)
44.5 (39.8-50,3)

- 90 -
administration of less than the minimum lethal dose of cobalt.
Changes in blood sugar concentration often reflect funda
mental metabolic changes within the animal* An additional con
sideration was the availability of a suitable analytical method,
worked out by Keil (79) in these laboratories, for determining
blood sugar in such small samples of blood as can be obtained
from rata without inflicting permanent injury.
Rats weighinr 200 to 400 grams wore fasted 24 hours. A
blood sample was then drawn from the tail and analyzed for
glucose. The rat was next anesthetized by intraperitoneal in
jection of nembutal at the rate of 3.0 milligrams of nembutal
per 100 grams of body weight. Anesthesia was usually complete
in 15 mimttes so that a stomach tube could be passed into the
stomach and 1.0 or 2.0 milliliters of the solution to be
tested could bo injected into the stomach from a hypodermic
syringe attached to the stomach tube. The stomach tube was
withdrawn and the tail blood analyzed for glucose at inter
vals of 15, iOf 60, 90 and 180 minutes after the time of in
jection of the tost solution. Cobalt chloride solutions v/ere
used in concentrations of 20 milligrams of cobalt in 1.0
milliliter, 20 milligrams of cobalt in 2.0 milliliters and 10
milligrams of cobalt in 1.0 milliliter.
In order to show that tiio effects produced were due to
the cobalt and were not caused by the slight acidity due to
hydrolysis of the cobalt chloride, the pH of the cobalt
chloride solutions used was measured on a Cameron pH Meter, a
- 91 -
very dilute hydrochloric acid solution was made up to approx
imately the same pH, this solution was injected into the
stomach and the glucose concentration in the blood determined
as before. With 20 milligrams of cobalt per milliliter, the
pH of the solution was found to be 4.9. iVith 10 milligrams of
cobalt per milliliter, the pH of the solution was 5.3. The
hydrochloric acid solution used was made up to a pH of 5.0
by adding 0.1 normal hydrochloric acid drop by drop to a liter
of distilled water until the desired pH was reached.
The blood sugar data obtained in these experiments are
presented in Table 29 and plotted in Figure 7.
Since some amino acids have been shown to detoxify co
balt salts, cobalt chloride solutions were administered by
stomach tube simultaneously with a solution of urea and
with a solution of glycine to study the effect of these com
pounds on the hyperglycemia produced by cobalt ion. These
data are shown In Table 30 end plotted in Figure B, together
with the data from Table 29 for the effect of distilled
water injoctiona and injections of 20 milligrams of cobalt in
2.0 milliliters of solution for purposes of comparison.
The effect of cobalt ion on glucose tolerance was studied
by simultaneous injection of cobalt chloride and glucose solu
tions into the stomach in varying concentrations. As before,
blood sugar was determined at intervals after the injection.
Data are presented in Table 31 and are plotted in Figure 9.
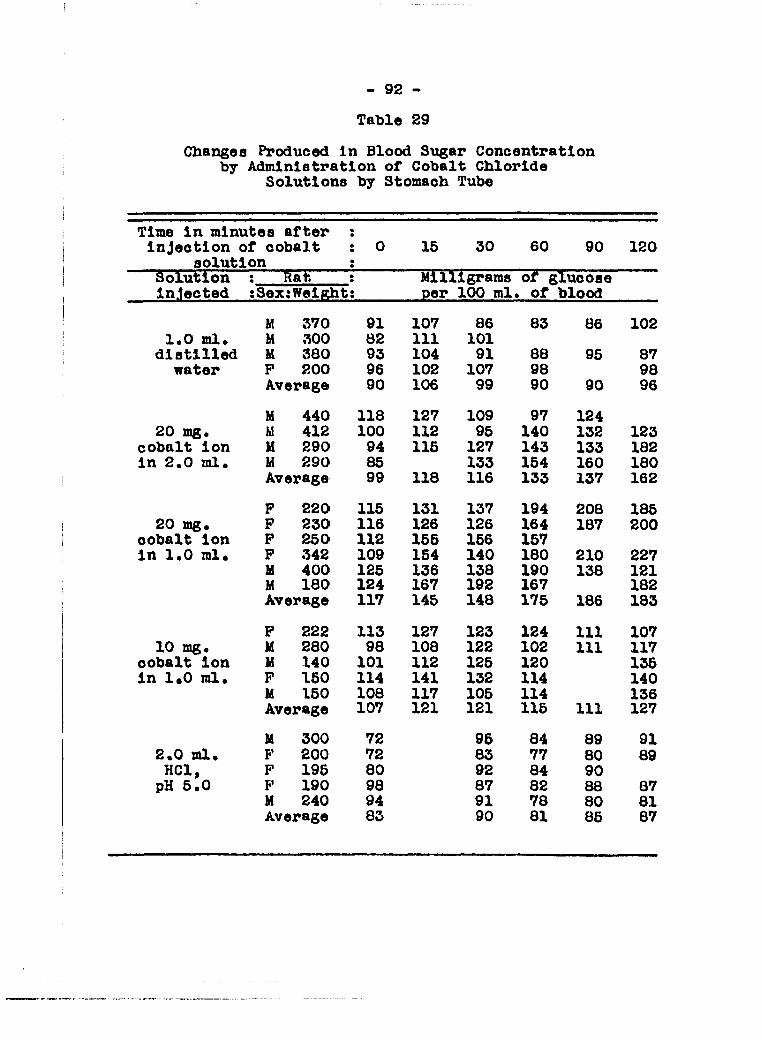
- 92
Table 29
Changes Produced in Blood Sugar Concentration by Administration of Cobalt Chloride
Solutions by Stomach Tube
Time in minutes after injection of cobalt 0 15 30 60 90 120
solution Solution •
• Rat Milligrams of glucose in.lected :Sex:Weight per 100 ml . Of blood
M 370 91 107 86 83 86 102 1.0 ml. M 300 82 111 101
distilled M 380 93 104 91 88 95 87 water P 200 96 102 107 98 98
Average 90 106 99 90 90 96
H 440 118 127 109 97 124 20 mg« M 412 100 112 95 140 132 123
cobalt ion M 290 94 115 127 143 133 182 in 2.0 ml. M 290 85 133 154 160 180
Average 99 118 116 133 137 162
F 220 115 131 137 194 208 185 20 mg. P 230 116 126 126 164 187 200
cobalt ion P 250 112 155 156 157 in 1.0 ml. P 342 109 154 140 180 210 227
M 400 125 136 138 190 138 121 M 180 124 167 192 167 182 Average 117 145 148 175 186 183
P 222 113 127 123 124 111 107 10 mg. M 280 98 108 122 102 111 117
cobalt ion M 140 101 112 125 120 135 in 1«0 ml. P 160 114 141 132 114 140
M 150 108 117 105 114 136 Average 107 121 121 115 111 127
M 300 72 95 84 89 91 2.0 ml. P 200 72 83 77 80 89 HCl, P 195 80 92 84 90 pH 5.0 P 190 98 87 82 88 87 pH 5.0
M 240 94 91 78 80 81 Average 83 90 81 85 87
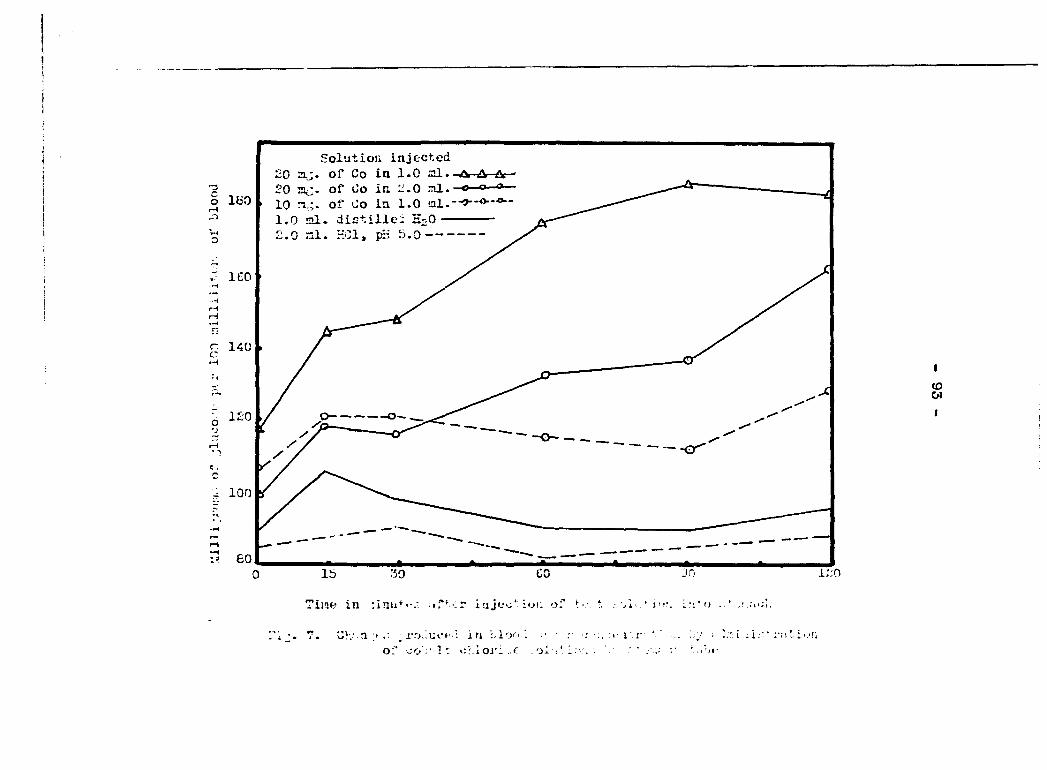
Solution injected
o 180
, 160
n 140 c
iiue in xaj»-'o :ui: oi t ' lor.
- 100
i2;0
i a \ A o ' : ; :o' :• 1 : ohloi'i oil*.'
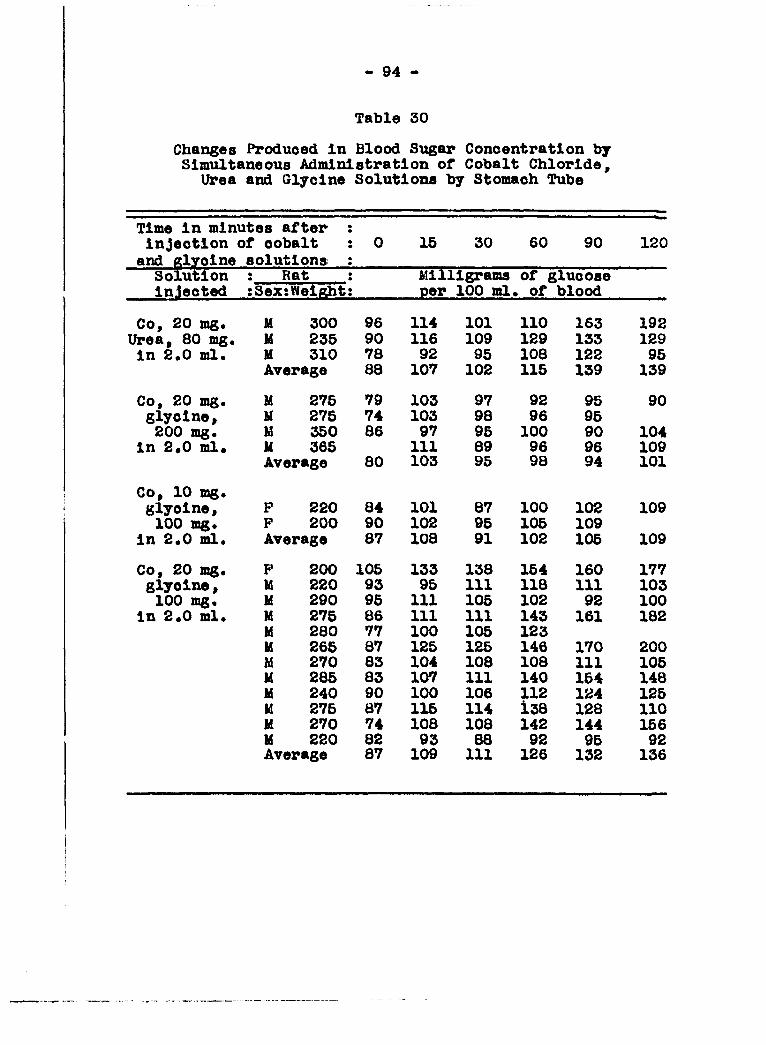
- 94 -
Table 30
Changes Produced in Blood Sugar Concentration by Simultaneous Administration of Cobalt Chloride,
Urea and Glycine Solutions by Stomach Tube
Time in minutes after injection of cobalt 0 15 30 60 90 120
and pclyoine solutions Solution •
• Rat Milligrams Of glucose injected :Sex:Weiptht per 100 ml . of blood
Co, 20 mg. M 300 96 114 101 110 163 192 Urea, 80 mg. M 236 90 116 109 129 133 129 in 2.0 ml. H 310 78 92 95 108 122 95
Average 88 107 102 115 139 139
Co, 20 mg. M 275 79 103 97 92 95 90 glycine. H 275 74 103 98 96 95 200 mg. M 350 86 97 95 100 90 104
in 2«0 ml. M 365 111 89 96 96 109 Average 80 103 95 98 94 101
Co, 10 mg. glycine. F 220 84 101 87 100 102 109 100 mg. P 200 90 102 95 105 109
in 2.0 ml. Average 87 108 91 102 105 109
Co, 20 mg. P 200 105 133 138 154 160 177 glycine, M 220 93 95 111 118 111 103 100 mg. H 290 95 111 105 102 92 100
In 2.0 ml. M 275 86 111 111 143 161 182 H 280 77 100 105 123 M 265 87 125 125 146 170 200 H 270 83 104 108 108 111 105 U 285 83 107 111 140 154 148 H 240 90 100 106 112 124 125 IS 275 87 115 114 138 128 110 M 270 74 108 108 142 144 156 U 220 82 93 88 92 95 92 Average 87 109 111 126 132 136
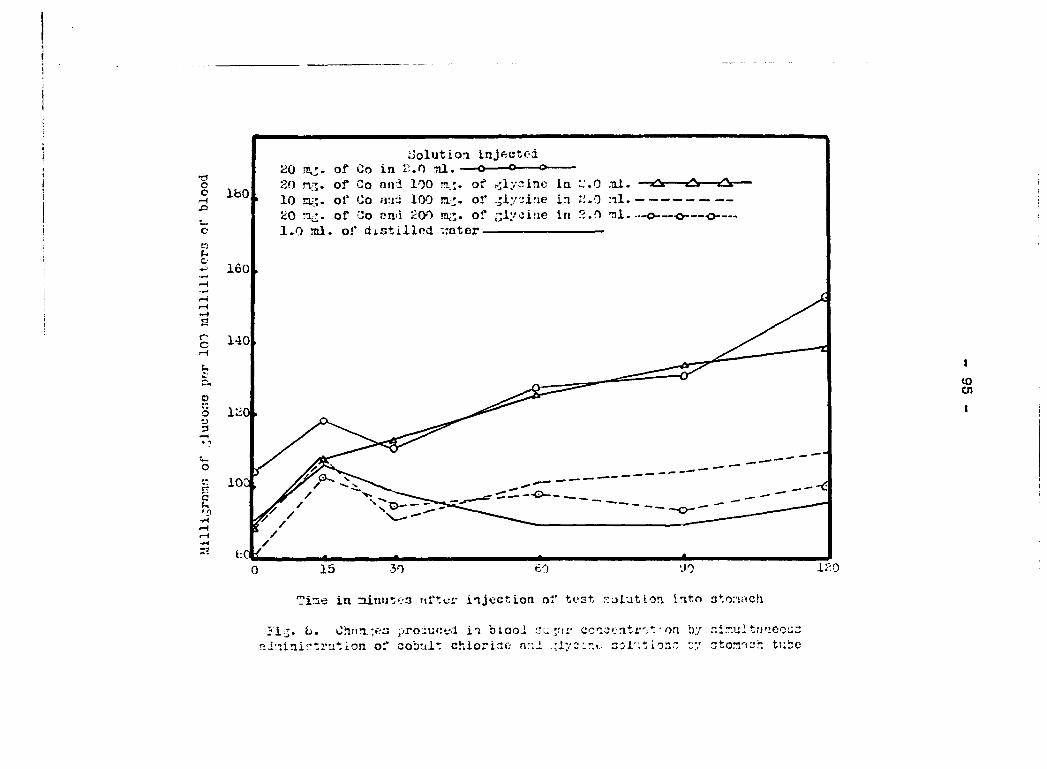
t3 O O
c.-
c c
o 3
rr C Ph "t
IfaO
160
140
l:;0
IOC
bC £
uolutioi Injftctcci .0 nl. —o o—o of Co
of oo nni 100 rrt;. of ^ly::lne in :.'.0 .ul. and 100 ix-^. of .'iyjine in it.O nl. nu'i 200 of jjlyci'xe in 2.0 tiI.
10 nu;-20 n 1.0 ml. of distilled '..•oter
to Ol
15 30 60 yo
?ime in -linuten rtftc-i- i-ijcction of test rcaiutlon Into atonnch
120
Jig. b. Ohnn,:eo pro:;i:«t.<i in biooi ;ru j'sr coicjcntr-it • on by ni'iini^trution of oobult chloride nni .-:ly2:".< soi'.tio:i~ sy
ni.T.ui tnneoi::: "tonn^h tube
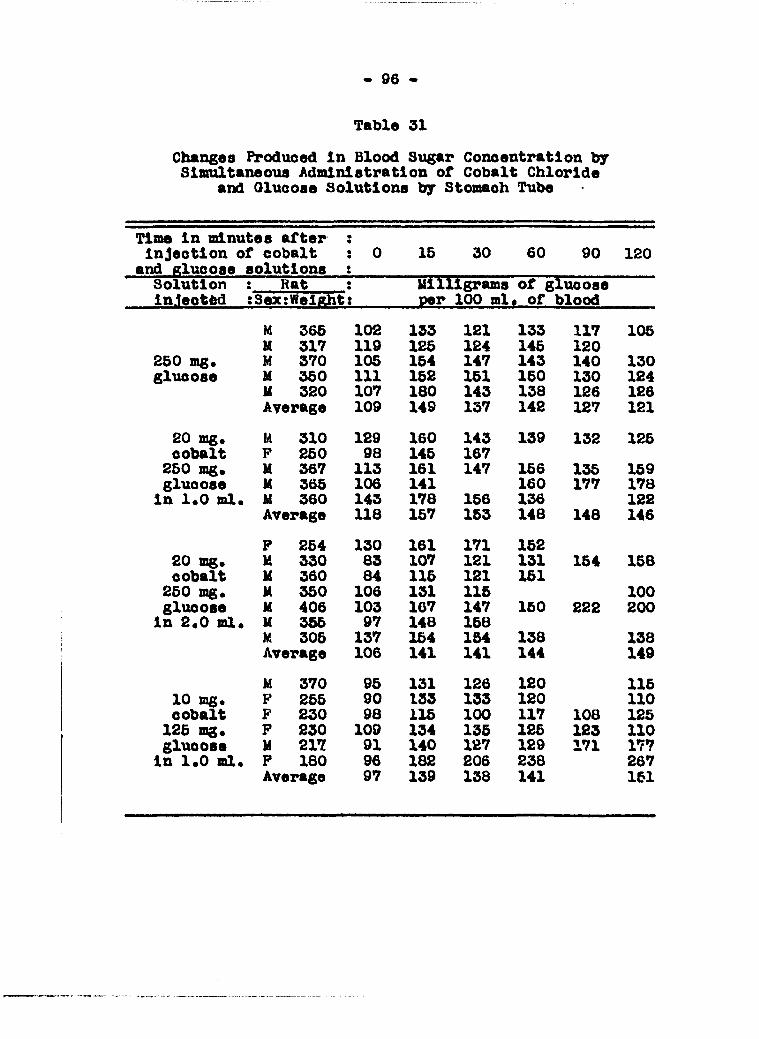
- 96 -
Table 31
Chmngea Produced in Blood Stigar Concentration by Slmultaneoiui Administration of Cobalt Chloride
and Olucoae Solutions by Stomach Tube
Time in minutes after ; injection of cobalt : 0 15 30 60 90 120
and glucose solutions t Solution t Rat t Ullligrams of glucose ln.1eot6d ; Sex tWeight t per 100 ml> of blood
M 365 102 133 121 133 117 105 U 317 119 125 124 145 120
250 mg. M 370 105 154 147 143 140 130 glucose M 350 111 152 151 150 130 124 glucose
tf 320 107 180 143 138 126 126 Average 109 149 137 142 127 121
20 mg. U 310 129 160 143 139 132 125 cobalt P 250 98 145 167
250 mg. M 367 113 161 147 156 135 159 glucose M 365 106 141 160 177 178
in 1.0 ml. M 360 143 178 156 136 122 Average 118 157 153 148 148 146
P 254 130 161 171 152 20 mg. H 330 83 107 121 131 154 158 cobalt M 360 84 115 121 151
250 mg. M 350 106 131 115 100 glucose M 406 103 167 147 150 222 200
in 2.0 ml. U 355 97 148 158 M 305 137 154 154 138 138 Average 106 141 141 144 149
M 370 95 131 126 120 115 10 mg. P 255 90 133 133 120 110 cobalt P 230 98 115 100 117 108 125
125 mg. P 230 109 134 135 125 123 110 glucose M 217 91 140 127 129 171 177
in 1.0 ml. P 180 96 182 206 238 267 Average 97 139 138 141 151
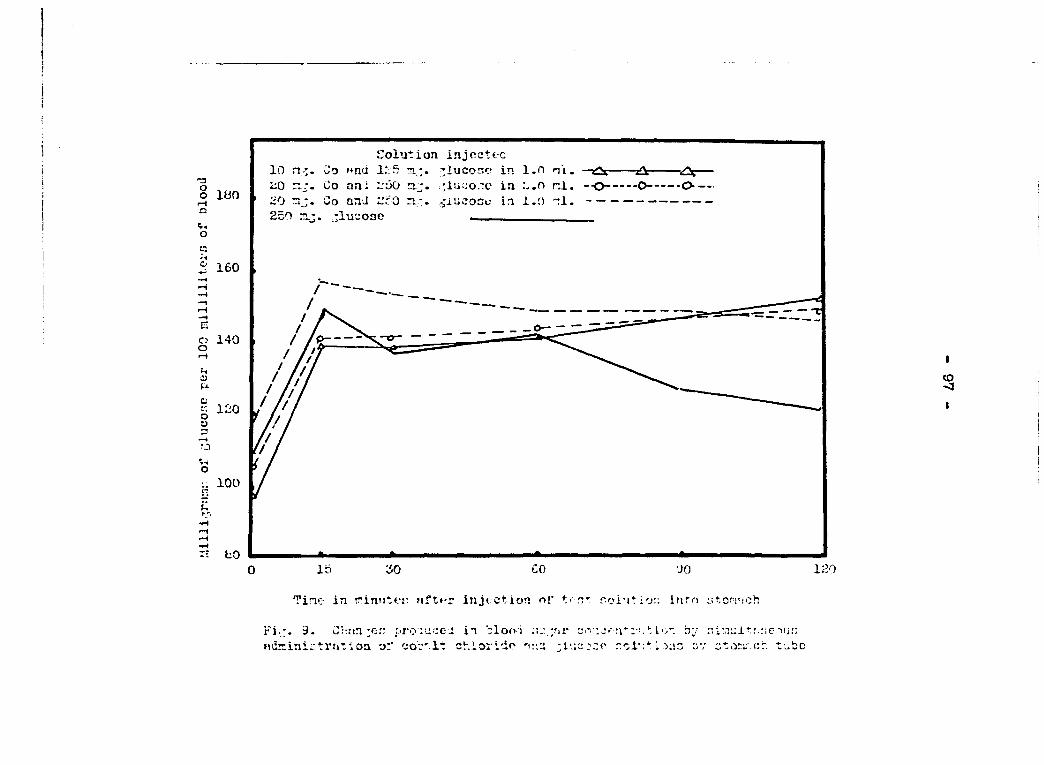
o o
V. o
180
Solution injectc-G 10 n-*. Co "iiu 1.' S Ti;. ;^luco.r.c in 1 i;0 "i- Co an: i-uO nj. .:lu::o~c In 20 Co and ZzO nr. ^iucoso in 1 250 jlu'-oso
160
o 140 o
a
• ISO
o 100
bO 15 30
Tine in rinuter injection.
Fi :. 9. Cr:!in *en proiuce.: in '"loo i fidriinirtrnflon of coc'It chloride -i
'ji- iv,-'-Ti*:-. t io". by ninuit.'.nc ni;: 'jocr r.oi";*: 1 :):i" dv ctorr.cr. tube
- 98 -
Effects of feeding glycine and cobalt chloride simultaneously
to rats
The data presented In the previous experiment Indicated
that glycine was able to detoxify the cobalt In some way
which seemed to prevent the hyperglycemia produced by cobalt
salt alone. It was thought of Interest to Investigate the
effects of feeding cobalt chloride and glycine simultaneously
to growing rats to observe the effects upon growth, repro
duction, the hemoglobin concentration In the blood and the
erythrocyte count. Groups of six rats of weaning age were
fed growing ration with 200 parts por million of added
cobalt (as cobalt chloride) with supplements of 0, 0.05 per
cent, 0.1 per cent and 0.2 per cent glycine. In addition, a
control group received only the growing ration. Hemoglobin
determinations and erythrocyte counts were mHde on all the
rats In this experiment ofter they had been receiving these
diets for 13 weeks. These data are shown in Table 32.
After the rats had been receiving these rations for 17
weeks and It was apparent that the glycine was having no
detoxifying effect upon the added cobalt chloride, it was de
cided to feed cystine In place of the glycine In two of the
diets. Accordingly the 0.05 per cent glycine was replaced
with 0.3 per cent cystine and the 0.1 per cent glycine was
replaced with 0.5 per cent cystine. All other diets re
mained unchanged. All growth data is shown In Table 33 and
is plotted In Figure 10.
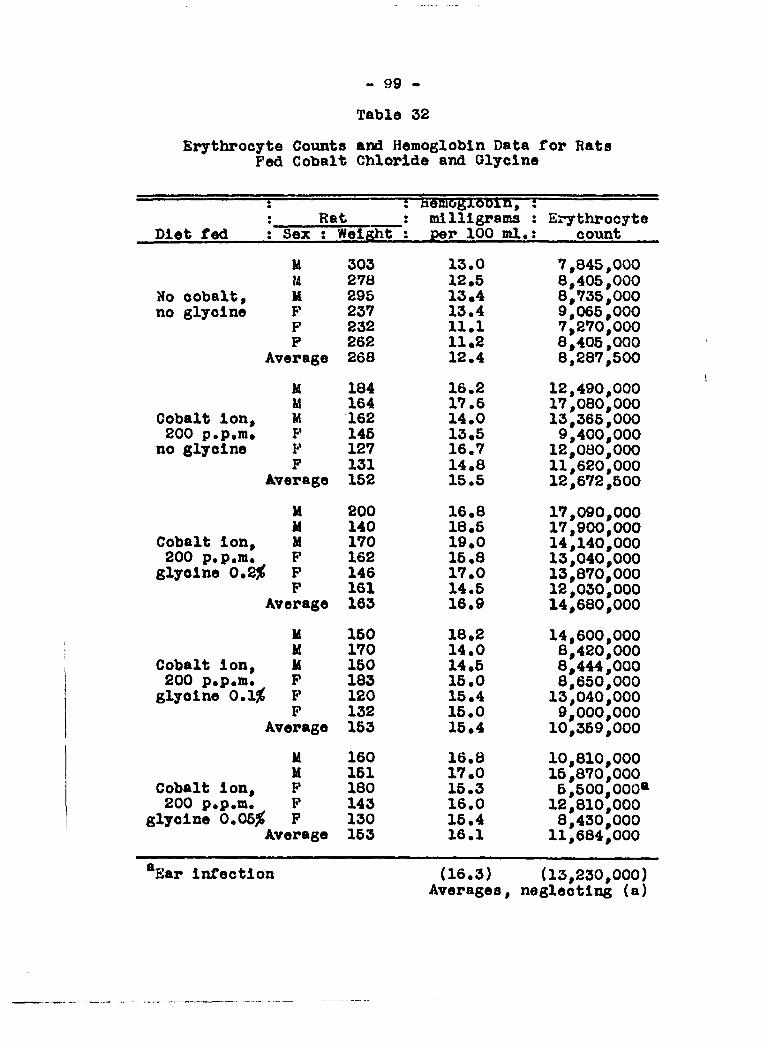
- 99 -
Table 32
Erythrocyte Counts and Hemoglobin Data for Rats Fed Cobalt Chloride and Glycine
i h^m6glOPlB, i : Rat I milligrams ; Erythrocyte
Diet fed : Sex : WelKht : per 100 ml .: count
H 303 13.0 7,845,000 U 278 12.5 8,405,000
No cobalt. U 295 13.4 8,735,000 no glycine F 237 13.4 9,065,000 no glycine
F 232 11.1 7,270,000 P 262 11,2 8,405,000
Average 268 12.4 8,287,500
M 184 16.2 12,490,000 U 164 17.6 17,080,000
Cobalt Ion, M 162 14.0 13,365,000 200 p.p.m. F 145 13,5 9,400,000 no glycine F 127 16.7 12,080,000
F 131 14.8 11,620,000 Average 152 15.5 12,672,500
M 200 16.8 17,090,000 M 140 18.5 17,900,000
Cobalt ion. M 170 19.0 14,140,000 200 p.p.m. F 162 15.8 13,040,000 glycine 0.2^ F 146 17.0 13,870,000
F 161 14.5 12,030,000 Average 163 16.9 14,680,000
M 150 18.2 14,600,000 H 170 14.0 8,420,000
Cobalt ion. M 150 14.5 8,444,000 200 p.p.m. F 183 15.0 8,650,000 glycine 0.1^ P 120 15.4 13,040,000
F 132 15.0 9,000,000 Average 153 15.4 10,359,000
M 160 16.8 10,810,000 M 151 17.0 15,870,000
Cobalt ion. F 180 15.3 5,500,000* 200 p.p.m. F 143 16.0 12,810,000
glycine 0.05/b F 130 15.4 8,430,000 Average 153 16.1 11,684,000
®Ear infection (16.3) (13,230,000) Averages, neglecting (a)
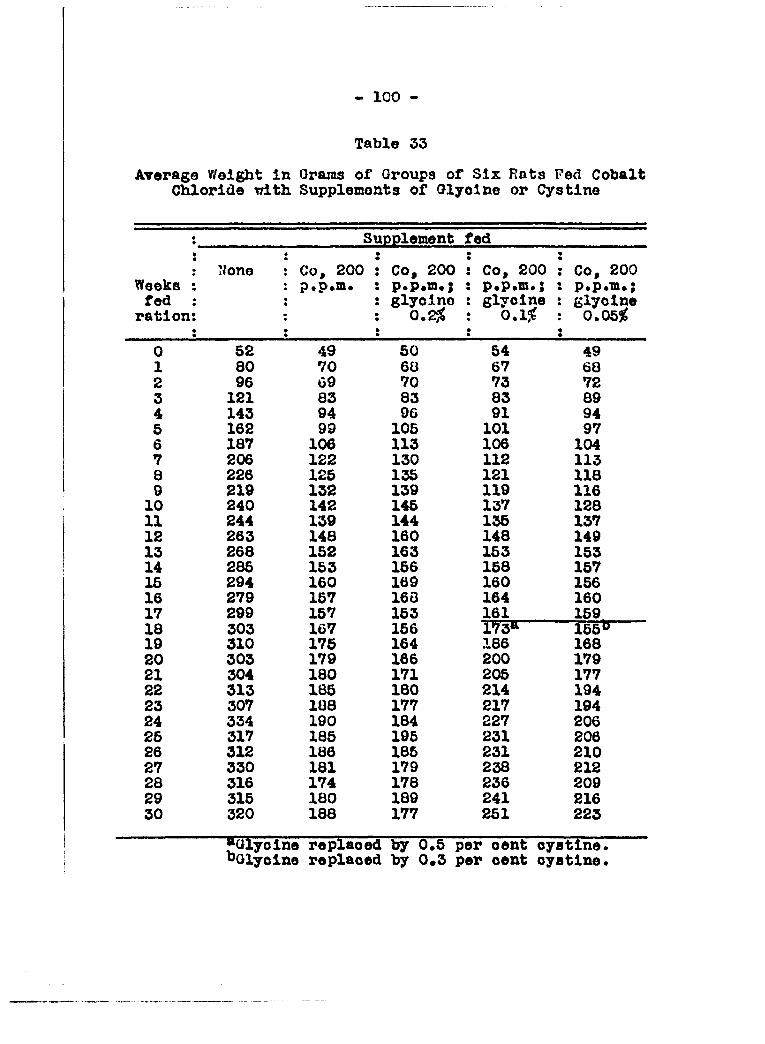
- 100
Table 33
Average Weight in Orama of Groups of Six Rata Fed Cobalt Chloride with Supplements of Glycine or Cystine
Supplement fed
None Co, 200 Co, 200 Co, 200 Co, 200 Weeks P • p p.p.m. 3 p.p.m.; p.p.m.; fed glycine glycine glycine ration O.25C 0.1 0.053
0 52 49 50 54 49 1 80 70 68 67 68 2 96 09 70 73 72 3 121 83 83 83 89 4 143 94 96 91 94 5 162 99 105 101 97 6 187 106 113 106 104 7 206 122 130 112 113 8 226 125 135 121 118 9 219 132 139 119 116 10 240 142 145 137 128 11 244 139 144 135 137 12 263 148 160 148 149 13 268 152 163 153 153 14 285 153 156 158 157 15 294 160 169 160 156 16 279 157 168 164 160 17 299 157 153 161 159 18 303 1G7 156 173" 155 19 310 175 164 186 168 20 303 179 166 200 179 21 304 180 171 205 177 22 313 185 180 214 194 23 307 188 177 217 194 24 334 190 184 227 206 25 317 185 195 231 206 26 312 186 185 231 210 27 330 181 179 238 212 28 316 174 178 236 209 29 315 180 189 241 216 30 320 188 177 251 223
•Olycino replaced by 0,6 per cent cystine. "Olycine replaced by 0»3 per cent cystine.
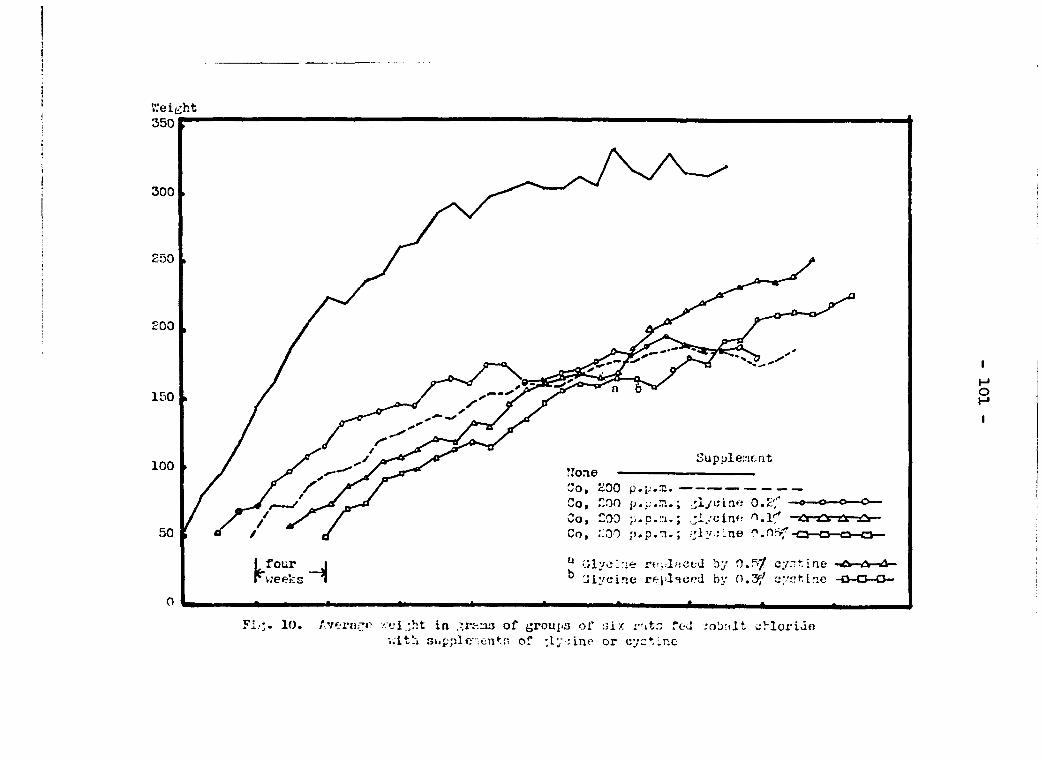
i
i ' V.'eij/ht
350
300
250
£00
150
100 rjone —— Co, 200 p.p
•jlyuiaw 0.5:'; jiyoim: O.IT' :oo
50
'Jiycine replaced by n.3^^ t Lie
Fi > 10. /.vernc' -fi ;ht ia Jn-.ras of groujia of six i-utr. red -*f>b!)lt cMox'iJo •i.lth siipple:ent£- of *,ly :Lne or Lnc
- 102 -
No reproduction occurred in any of the groups fed cobalt
chloride with or without added glycine or cystine except for
two litters produced 53 days apart by one of the females re
ceiving 200 parts per million of cobalt and 0.2 per cent
glycine, 'i'he first litter was not produced until all the
control group females had reproduced three times.
103 -
DISCUSSION
Growth
It Is apparent from the data of Tables 11 and 13 and
from Figures 4 and 5 tliat rations containing 5, 10 or 25
parts per million of added cobalt (as cobalt nitrate) do not
appreciably affect the growth of rats. Tlie curves of Figure
5 show that the growth rate of tho rats receiving added co
balt ion in those concentrations is very similar to that of
tho control group not fed added cobalt salt. Table 8 and
Figure 1 show that rats receiving 50 parts per million of
cobalt (as cobalt nitrate) do not grow as rapidly as tho con
trols when tho controls are allowed to oat all the ration
they want. Table 10 and Figure 2 show that when tho control
animals not fed cobalt nitrate aro fed only as much ration as
eaten by tho rats consuming tho ration with 50 parts per
million of added cobalt, no appreciable difference in growth
Is apparent between tho two groups. Neither group, however,
grows as well as rata eating all the growing ration they want-
compare tables 8 and 10 or Figures 1 and 2*
This indicates that at least a large part of the growth
decrease caused by the presence of 50 parts per million of
added cobalt in tho diet is due to the restriction of feed

- 104 -
Intake by the rata.
Table 8, Figure 1 and Table 10, Figure 3 show the effects
of cobalt (as cobalt nitrate) at the 200 part per million
level. In addition to the reduced growth rate due to re
stricted feed intake, there is an additional toxic effect
within the organism, since rats receiving 200 parts per mil
lion of cobalt grow very appreciably slower than the controls
eating the same weight of growing ration without added cobalt
salt.
Feed consumption of rats receiving 200 parts per million
of cobalt was considerably less than that of rats fed only
50 parts per million of cobalt (an average of 1,38 and 1.92
kilograms of feed In 23 weeks por rat for each group, re
spectively). This accounts for at least part of the differ
ence In growth rates of the two groups.
The greatly decreased growth rate occurring on rations
containing 200 parts per million of cobalt is apparently not
due to any permanent Injury to the rat, since the growth rate
Increased at once when the cobalt was omitted from the grow
ing ration. This la shown in the lower curve of Figure 1.
Figure 1 shows that the decrease In growth resulting from
adding cobalt nitrate to the ration is approximately propor
tional to the amount of cobalt added.
- 105 -
Reproduction
It la readily apparent from the data of Tables 14, 15
and 16 that when cobalt Is present In the ration (as cobalt
salt) In concentrr.tlons of 100 parts i)er million or more, re
production ceases entirely.
Table 14 shows that when 5, 10 or 25 parts per million of
cobalt ion are added to the ration, there is little difference
in the reproduction of first litters by rats receiving cobalt
salt and those receiving no added cobalt salt. Apparently co
balt in the diet at the 25 parts per million level or less
exerta little harmful influence on reproduction as far as the
first litter is concerned. Table 15 shows that cobalt in the
ration at the 5 or 10 parts per million level does not affect
reproduction of the second litter.
When 50 parts per million of added cobalt are present
in the diet, the effect on reproduction seems to be more com
plex. Inspection of the data in Table 14, growth experiment
A, shows the marked decrease in the average number of young
and the average weight of the first litter when 50 parts per
million of cobalt are added to the ration. The reproduction
data of growth experiment B, Table 14, (where the control anl-
males were fed only the weight of ration consumed by the rats
receiving added cobalt ion) show a much less striking decrease
in the number of young produced. It is probable that as far
- 106 -
as first litters are concerned, the decreased reproduction
caused by 50 parts per million of added cobalt in the diet may
come about through the effect of this concentration of cobalt
on growth, which in turn depends mainly upon the decreased feed
intake of rats fed cobalt salts at this level. Table 15 shows
a decrease in the averace number and weight of the second
litter of rats fed 50 parts per million of cobalt, not quite
so striking as that of the first litter. Table 16 shows that
for longer periods of time, the average number of young and
the weight of each litter are slightly smaller for rats receiv
ing 50 parts per million of added cobalt than for the control
animals fed the limited amounts of ration described previously.
It should bo noted that of the six females fad cobalt salt at
this concentration, only five reproduced, one dying in first
pregnancy. All of the control females reproduced.
It seems, then, that the initial decrease of reproduction
caused by 50 parts per miillion of cobalt added to the diet as
cobalt nitrate may be due in part to decreased growth but that
over longer periods of time, when the more slowly growing rats
receiving added cobalt salt have had an opportunity to mature,
the flifferences in reproduction become smaller. The delay in
attaining maturity and the decreased reproduction caused by
restricted feed intake alone are clearly shown in tho data for
the control groups of growth experiment B, Tables 14 and 16.
- 107 -
Lactation
The data of Table 17 show that the per cent swccess in
raising young from birth to 28 days of age is practically
identical for the control rats receiving no cobalt salt and
rats receiving 5 and 25 parts per million of added cobalt. In
addition, the weights of young at birth and at 23 days show
little difference between control groups and groups receiving
cobalt. It must be concluded that 5 or 25 parts per million
of cobalt ion in the ration do not affect lactation of rata.
When cobalt ion is fed at a concentration of 50 parts per
million, only five of seven litters born were successfully
raised. The average weights of the first litter at birth and
at 28 days are smaller for the rats receiving cobalt. The
second litters show no great differences. It may be con
cluded that a concentrHtion of 50 parts per million of cobalt
in the diet affects lactation of rats to a small extent but
that lower concentrations of cobalt are without influence on
lactation.
Hemoglobin Formation
The rats fed 10 parts per million of cobalt (as cobalt
nitrate) showed a definite stimulation of hemoglobin formation
during the first ten weeks of the experiment as shown in Table
19 and Figure 6. This early increase in hemoglobin

- 109 -
concentration in the young rata caused by the cobalt salt la
not permanent and the values decrease to the level of the con
trols after the foiu'teenth week.
The feed consumption data of Table 18 show that this
stimulation of hemoglobin formation was brought about by an
average cobalt intake of 0*15 mllllgramQ per rat per day. An
averaj-e intake of 0.07 milligrams of cobalt ion per day by
the rats fed 5 parts per million of cobalt ion failed to stimu
late hemoglobin formation above the c^r^Qral level of the con
trols.
It is apparent that the minimum amoimt of cobalt In the
diet which is necessary to atlmulate hemoglobin formntion in
young rats lies between 0.07 and 0.15 milligrams of cobalt
per day.
Distribution of Cobalt In the Tissues
The third series of analyses of rat organs for cobalt
presented in Table 22 must be considered the most acctirahe
since these analyses were made last, after much experience
with the analytical method had been obtained. In addition,
organs of three rats were pooled for these determinations, thus
making the estimation of low concentrations of cobalt more
accurate.
In general* the data of Tables 20, 21 and 22 indicate
that the amount of cobalt present in the tissues of rata fed
- 109 -
growing ration without added cobalt salt Is less than ono part
per million. Adding cobalt salt to tl^e diet Increases the co
balt content of most of the organs studied. Liver and kidney
show the greatest Increase In deposition of cobalt under these
conditions while stomach and intestine show the least. Spleen,
pancreas, heart, lungs and testes show some Increosed cobalt
deposition but the Increase Is much less than proportional to
the concentration of cobalt salt fed. Only In the liver does
the Increased deposition of cobalt seem to be proportional to
the concentration in the diet. The deposition of cobalt In
the kidneys, while less than proportional to the amount of co
balt fed. Is still considerably greater than that of other
organs except that of the liver. Since other workers have
shown that o portion of the Ingested cobalt Ion Is excreted
In the urine, this detjosltlon In the kidneys might be ex
pected. The most striking observation from the data of Table
22, however. Is the great Increase In the cobalt content of
the liver that occurs when cobalt salt Is added to the diet.
Rate of Deposition of Cobalt In the Liver
Allowing for the biological variations Inherent In the
experiment. It Is apparent from the data of Table 23 that the
concentration of cobalt In the liver reaches a maximum aver
age value of about 7.0 parts per million In about four days
when young rats are fed a ration containing 100 parts per
million of cobalt as cobalt nitrate. It should be noted In

- 110 -
Table 22 that the cobalt concentration in the livers of rata
fed 200 parts per million of cobalt for 26 weeks was 6.8 parts
per million, agreeing very well with the maximtan value found
In this experiment.
It is of interest that the livers of female rats showed a
uniformly greater concentration of cobalt than the livers of
male rats under the conditions of t>iis experiment.
It is seen from the food consumption data of Table 23
that the amount of cobalt deposited in the liver in any one
day (12-15 micrograms maximvan) is only about one per cent of
the daily intake of cobalt (1000-1400 micrograms).
Toxicity
It is apparent from the data of Tables 24 and 25 that
the minimum lethal dose of cobalt salt for rats, when in
jected into the stomach of the anesthetized animals, is approx
imately 20 milligrams of cobalt per 100 grams of body weight.
There is little apparent difference between the toxic
effects of cobalt nitrate and cobalt chloride.
Effect of Cobalt Salt in the Diet on Reducing Sugar and Albumin in the Urine
Comparing the data in Tables 26 and 27 for each level of
cobalt with that of its own control group, it is evident that
addition of cobalt ion to the diet at levels of 50 and 200

- Ill -
parts per million approximately doubles the per cent of reduc
ing sugar In the virlne. The actual nvmiber of milligrams of
reducing sugar excreted In 24 hours Is Increased by adding co
balt nitrate to the diet but the values are not affected to
the same extent as the per cent reducing sugar since the 24-
hour volume of urine tends to be slightly lower for the rats
receiving added cobalt nitrate In the ration. The average
per cent reducing sugar, excretion of reducing sugar per 24
hours and the limits of variation of these values are all
greater for the rats fed 200 parts per million of cobalt Ion
than for those fed 50 parts per million.
The lower limits of the variation of the values are
about the same for rats fed cobalt nitrate and the controls
receiving no added cobalt salt. The upper limits of the varia
tion are invariably greater for the rats fed cobalt salt.
Qualitative tests for albumin with Roberts' reagent
showed albumin present in urine of rata fed cobalt salt as
well as in the urine of the rats fed growing ration with no
added cobalt.
Effect of Cobalt Salt in the Diet on Non-Protein Nitrogen in the Blood
Considering the variation in the values for the determin
ations of non-protein nitrogen in thn blood cf individual rats
and for all rats shown within one group shown in Table 28, it
la probable that the differences between the non-protein
- 112 -
nitrogen concentration In the blood of rats fed cobalt salt
and those not fed cobalt salt are not great enough to Indi
cate any change caused by the additional cobalt In the diet.
It may be concluded that cobalt fed at the 50 part per million
level does not affect the blood non-protein nitrogen.
Effects on Blood i^ugsr of Peroral Administration of Cobalt Chloride Solutions Alone and with
Urea, Olucose and Glycine
The data of Table 29 plotted In Figure 7 show that 20
milligrams of cobalt (as cobalt chloride) Injected Into the
stomach by stomach tube causes the blood sugar concentration
to Increase markedly, especially In the period from 3 0 to
120 minutes after tl» injection. The hyperglycemia is much
greater If the 20 milligram sample of cobalt is injected in
1.0 milliliter of solution than if it is injected in 2.0
milliliters. The anesthesia and manipulation probably cause
the Initial Increase in blood sugar since such an Increase is
noted under these conditions when only distilled water is In
jected into the stomach. The hyperglycemia caused by the co
balt salt does not apjear until 30 to 60 minutes after injec
tion of the cobalt solution. The hyperglycemia is not due to
the slight acidity caused by the hydrolysis of the cobalt
chloride since injection of a hydrochloric acid solution of the
same pH as the cobalt chloride solutions did not increase the
blood sugar concentration at all. It had approximately the

- 113 -
same effect on the blood sugar concentration as did Injec
tion of distilled water.
Table 30 and Figure 8 show that when glycine In suffic
ient aroounts is injected Into the stomach simultaneously with
the cobalt salt, the blood sugar concentration does not rise
but remains approximately at the same level as when distilled
water is Injected, Urea, on the other hand, in two experi
ments of the tliree made, did not prevent cobalt from causing
the hyperglycemia noted with injections of cobalt salt alone.
It should be noted from Table 30 that glycine depresses
the hyperglycemia caused by cobalt only with injections of
ten times as much glycine as cobalt by weight. The mole
ratio for these weights is approximately eight glycine
molecules to one cobalt ion. With injections In a ratio of
four glycine molecules to each cobalt ion (100 milligrams of
glycine and 20 milligrams of cobalt), it should be noted that
approximately half of the values for the glucose concentra
tion in the blood 120 minutes after the injection show the
marked hyperglycemia typical of injections of cobalt salt
alone. The other half of these values tends to approximate
the low level produced by glycine and cobalt In the eight to
one mole ratio. The five higher values lie between 148 and
200 milligram per cent while the five lower values lie between
92 and 110 milligram per cent. Only two values, 125 and 136
milligram per cent, lie in the range between. This concen
tration of blood sugar values in relatively narrow ranges.
- 114 -
especially at the lower values, apparently indicates that the
mole ratio of four glycine molecules to each cobalt ion
approaches the limiting value for detoxification of the cobalt
in its hyperglycemic action.
Table 31 and Figure 9 show the effects on glucose toler
ance of injecting cobalt salt into the stomach by stomach tube.
The blood sugar curve after injection of glucose only starts to
fall 60 minutes after the injection while all the curves for
the effects of injecting cobalt salt and glucose into the
stomach simultaneously do not fall after 60 minutes but remain
at a practically constant value. Inspection of the curves of
Figure 9 suggests thnt the normal decrease of blood sugar be
ginning 60 minutes after injection of glucose solutions into
the stomach is apparently Just offset by the increased blood
sugar formed by the toxic action of cobalt salt which apoears
in the period from 30 to 60 minutes and especially in the
period from 60 to 120 minutes after injection of the test so
lutions into the stomach.
Effects of Feeding Glycine and Cobalt Chloride Simultaneously to Rats
Table 33 and I'igiire 10 show that glycine, when fed in the
diet, does not prevent added cobalt salt from inhibiting
growth, the growth curves for rats fed both cobalt chloride
and glycine at vorious concentrations not only being almost
identical but also following closely the growth curve for rats
-115 -
fed cobalt chloride without added glycine. Similarly, added
glycine In the diet does not markedly alleviate the inhibiting
effects of cobalt on reproduction, no reproduction occurring
among any of the nine females receiving added cobalt chloride
with added glycine with the exception of two litters produced
by one female receiving 0.2 per cent glycine In addition to the
200 parts per million of cobalt.
Table 32 shows the effects of added cobalt chloride and
glycine in the diet on the erythrocyte count and hemoglobin
concentration in the blood of rats which had received these ra
tions for about 13 weeks. The striking increnses in erythro
cyte count and hemoglobin concentrntion caused by adding 200
ports per million of cobalt to the diet were not lowered by
adding 0.2 per cent glycine to the ration. Addition of 0.1
per cent glycine to the ration with 200 parts per million of
cobalt apparently caused the erytlucocyte count to decrease in
some of the animals but not in others while the hemofilobin
concentration remained at the higher level associated with co
balt feeding. A still lower concentration of glycine, 0.05
per cent, lowered the erythrocyte count in only one rat out
of four. Anomalous results in cobalt polycythemia have been
reported by others In the literature and apparently must be
attributed to the biological variation to be expected in such
experiments, ^'ith this In mind, it may be concluded that
added glycine in the diet of rats probably has little effect
In lowering the elevated hemoglobin concentrations and
- 116 -
orythrocyto counts caused by adding cobalt chloride to the
ration.
When the rats had been fed rations with added glycine and
cobnlt chloride for 17 weeks and It was apparent that glycine
was not detoxifying the cobalt, the glycine was replaced with
larger concentrations of cystine. Table 33 and Plgtiro 10 both
show the Ixoinedlate Increase In growth rate which occurred when
cystine feeding was begtin. This agrees with the recently pub
lished work of Griffith, Pavcek and Mulford (66) who found
that cystine and other sulfur containing amino acids were
able to detoxify cobalt salts within the organism.
- 117
CONCLUSIONS
Prom the data presented In this thesis the following
conclusions have been drawn:
1« Rations containing 500 parts per million of cobalt
(as cobalt chloride) are lethal to yoimc rata in 3-5 weeks*
Greater concentrations of cobalt salt are lethal in a shorter
time*
2. Rations containing: 25 parts per million of cobalt (as
cobalt nitrate) or less do not approciobly decreaso the irrowth
rate of rats*
3* Vflien cobalt nitrate Is fed at the rate of 50 parts
per million of cobalt in the growing ration, decreased growth
of rats results primarily because of decreased feed intake*
4* when cobalt nitrate is fed at the rate of 200 parts
per million of cobalt^ decreased growth of rats results both
bocauoe of decreased feed intake and because of an additional
toxic effect of the cobalt salt within the organism*
5* The decreased growth caused by 200 parts per million
of cobalt in the diet la not due to any permanent injury to
the rat as far as growth is concerned, since the growth rate
Increases immediately when the added cobalt salt is omitted
from the diet*
- 118 -
6. The decreased growth of rats caused by adding cobalt
salt to the diet Is approximately proportional to the amount
of cobalt added*
7. Reproduction of rats ceases entirely when 100 parts per
million of cobalt or more are added to the diet as cobalt
nitrate.
8. When 25 parts per million of cobalt are in the diet
(as cobalt nitrate),reproduction of the first litter is not
affected in any way,
9. When 50 parts per million of cobalt are added to the
diet (as cobalt nitrate), the number of young per litter, the
number of litters born and the weight of each young are all
decreased. The effects aro probably due in large measure to
the decreased growth of the mothers caused by this concentra
tion of cobalt salt in tho diet.
10. When 50 parts per million of cobalt are fed in the
ration, successful lactation, as Judged by the successful
raising of the young, is decreased to a small extent. Lower
levels of cobalt salt do not affect lactation.
11. The amount of cobalt present in the tissues of rats
fed growing ration without added cobalt salt is, in general,
less than one part per million.
12. Adding cobalt salts to the diet increases the amount
of cobalt most markedly in the liver and kidneys. Spleen,
pancreas, heart, lungs and testes show some increased cobalt
- 119 -
deposition while intestine and stomach show the least in
crease.
13. Only in the liver is the deposition of cobalt pro
portional to the amount of cobalt salt fed, this organ taking
up far more of the cobalt than any other. Deposition of co
balt in the kidneys is less than in the liver but is greater
than that of other organs.
14. yrtien cobalt nitrate or cobalt chloride solutions are
injected Into the r.tomach of anesthetized rats by stomach
tube, the minimum lethal dose is approxiinotely 20 milllgrnms
of cobalt per 100 grama of body weight. There Is little
apparent difference in toxicity of the two salts under these
conditions.
15. Vflien young rata are fed 100 parts per million of
cobalt (as cobalt nitrate), the deposition of cobalt in the
liver roaches a maxlm\J2n in foiu* to five days. The maximum
amount of cobalt deposited per day is only about one per
cent of the total cobalt intake.
16. Ten parts per million of cobalt in the diet (as co
balt nitrate) is the lowest concentrntion thwt will stimulate
the formation of hemoglobin in young rata. The stimulation
is not permanent at ttils concentration of cobalt, the hemo
globin concentration decreasing to that of the controls after
about 14 v/eeks. The intake of cobalt to cause this initial
stimulation of hemoglobin formation lies between 0.07 and 0.15
milligrams per day.
- 120 -
17« Addition of cobalt nitrato to the diet at leveSa of 50
or 200 parts per million of cobalt approximately doubles the
per cent of reducing sugar in the urine. Pso't of this effect
is duo to a small decrease in the volume of urine of rats fed
the added cobalt salt but the major part of the effect is due
to an increase in the amount of reducing sugar excreted.
18. Albtmiin is present in the urine of rats fed cobalt
nitrate as well as in the urine of rats not receiving added
cobalt salt in the diet.
19. Addition of cobalt nitrate to the diet does not
apprecinbly affect the amount of non-protein nitrogen in the
blood.
20. When a solution containing 20 milligrams of cobalt
(as cobalt chloride) is injected into the stomach of rats, the
blood sugar concentration is markedly increased in 30 to 60
minutes after the injection. The effect is more pronotinced
ifhen the solution of cobalt chloride la more concentrated, even
though the same amount of cobalt is given.
21. When glucose and cobalt cliloride solutions are injeoted
flimulbaneoualy into the stomach of the rat by stomach tube, the
normal decrease of glucose in the blood after 60 minutes or
more io offset by the increased blood sugar formed by the effect
of the cobalt salt, maintaining the blood sugar concentration at
a constant elevated value for 60 to 120 minutes after the
injection.
- 121 -
22. '.Then 200 rallllErams of glycine are injected with 20
milligrans of cobalt (as cobalt chloride) into the atomacli,
the glycine prevents the cobalt salt from increasing the blood
svigar concentration. When 100 milligrans of glycine are in
jected with 20 milligrams of cobalt, the hyperglycemia is pre
vented in about half of the cases.
23. '.Vlien glycine and cobalt chloride are added to the
grov/ing ration, the glyoino does not prevent the added cobalt
salt from iriiiibiting growth or reproduction of rats.
24. The increased homoglobin concentration and erythrocyte
count caused by adding cobalt chloride to the growing ration
are not appreciably decreased toward the normal values by
aimultaneoua feeding of glycine.
122
SUMMARY
A study was made of the effects of feeding cobalt chlo
ride and cobalt nitrate on the growth, reproduction and lac
tation of rats* Concentrations of 25 parts per million or
less of cobalt added to the diet were foTond to be without
appreciable effect on the grov/th rate, success of lactation
or reproduction of the first litter. Vihen 50 parts per million
of cobalt were added to the diet, growth of rats was decreased,
primorily due to the decreased feed intake; the number of
young per litter, the weight of each litter and the average
weiglit of each yoimg were all decreased and succoss in lac
tation was decreased to a small extent* V/ith concentrations
of 100 parts per million or more of cobalt added to the
diet, reproduction ceased entirely. With 200 parts per million
of cobalt in the diet groY/th was docroasod both because of
decreased feed intake and because of some other toxic effect
of the cobalt salt within the organism* The decreased growth
rate caused by 200 parts per million of cobalt in the diet was
not due to any permanent injury to the rat (as far as growth
was concerned) since growth was resumed when the cobalt salts
were omitted from tho diet. In all cases, the decreased
growth caused by adding cobalt salts to tho diet was approx
imately projjjortional to tho concentration of cobalt salt fed.

- 123 -
V»Tien concentrations of 500 parts per million of cobalt wore
fed to yotmc rats, thoy diod within 3-5 weeks* Higher cobalt
concentrations in the ration were lethal in a shorter tine.
Cobalt analyses were made on tissues of rats fed cobalt
salt and on tissues of rats which had not received added co
balt salt in their diet. In tissues of rats not
fod cobalt salts containod less than ono pnrt per million of
cobalt. Tlie tissues of rats fed cobalt salts showed marked
increase in cobalt content in the liver and kidneys with
leaser increases in the spleen, pancreas, heart, lungs and
tostop. The least increases In cobalt content occurred in
the Intestine and the stomach. Only in the liver was the
concentration of deposited cobalt proportional to the concen
tration of cobalt fod in the diet. Deposition of cobalt in
the kidneys was loss than in liver but creator tlian in the
other organs stutlied. V.lien young rata were fod a diet con
taining 100 parts per million of added cobalt, the concentration
of cobalt deposited in the liver reached Its maximum value in
4 to 5 days after the feeding of such a ration was started.
I'/lien rata were fed 50 or 200 parts per million of added
cobalt and control groups were fed the same weight of ration as
consumed by the rats receiving cobalt, the amount of reducing
sugar in tlie urine of the rats fod cobalt salt was markedly in
creased over that of the controls. Albumin was present in the
urine of rata fed cobalt salt as well as in that of rats not
fed cobalt salt. The concentration of non-protein nitrogen in

- 124 -
the blood was apparently not altered by feeding cobalt salt
under these circumstances#
Ten parts per million of cobalt (as cobalt nitrate) in the
diet soenod to be the lowest concentration that would stimulate
hemoglobin formation and this stimulation was not lasting, the
hemoglobin concentration decreasing after about 14 weeks to that
of the controls not fed added cobalt salt.
V.lien cobalt nitrate or cobalt chloride solutions v/ere in
jected by stomach txibo into tho stomachs of anesthetized rats,
the miniraiBtt lothal dose v/as found to bo approximately 20 milli
grams of cobalt per 100 grams of body weif^t. There was little
difference in the toxicity of tho two salts*
When loss than the lethal amount of cobalt salt was in
jected by stomach tube, tho blood sugar concentration increased
markedly in 30 to 60 minutes after the Injection and increased
still more from 60 to 120 minutes after ttie injection. The
effect was more pronounced when more concentrated solutions
were injected, oven though the same amount of cobalt was given.
Tho hyperglycemia wus not due to tho alight acidity caused by
hydrolysis of tho cobalt chloride, vvhen 200 milligrams of
glycine were injectcd by stomach tube, along with 20 milligrams
of cobalt, no such Increase in blood sugar concentration
occurred, the glycine apparently detoxifying the cobalt salt.
When glucose solutions were injected into tho stomach with cobalt
suit in a similar manner, tho normal decrease in blood sugar
concentration in 60 to 120 minutes after injection (expected of
- 125 -
glucose Injections alone) did not occur, the blood sugar con
centration remaining at a constant, elevated value dtiring the
60 to 120 minute period after injection. Apparently the normal
blood sugar decrease expected from the glucose injection was
just offset by the blood sugar increase caused by the toxic ac
tion of the cobalt salt*
V/hen glycine and cobalt chloride were fed to rata in the
growing ration, glycine failed completely to prevent the cobalt
salt from decreasing growth and stopping reproduction. In
addition, the added lod to prevent the added cobalt
salt from increasing the hemoglobin concentration and the
erythrocyte count in the blood.
- 126 -
LITERATURE CITED
(1) Ahmad, Bashlr and KoCollum, E. V. Cobalt oontent of some food materials from different parts of the United States. Am. J. Hyg. 29A: 24-26. 1939.
(2) Anderson, H. D., Underwood, E. J. and Blvehjem, G. A. Factors affecting maintenance of cobalt polycythemia in the rat. Am. J. Physiol. 130: 373-378. 1940.
(3) Anonymous. Cobalt deficiency in sheep and cattle. New Zealand J. Agr. 59; 385-389. 1939.
(4) Askew, H. 0. Control of bush sickness by means of cobalt. New Zealand Dept. Sci. Ind. Research. Eleventh annual report. 1936-1937: 46-47.
(5) Askew, H. 0. Value of cobalt supplements for breeding ewes at Sherry River, Nelson. New Zealand J. Sci. Tech. 20A: 192-196. 1938.
(6) Askew, H. 0. Cobalt deficiency at ^lenhope. Nelson, New Zealand. Ibid. 20A: 302-309. 1939.
(7) Askew, H. 0. Successful use of cobnlt salts for pasture top-dressing in the treatment of stock ailments at Olenhope, Nelson. Ibid. 20A: 315-318. 1939.
(8) Askew, 11. 0. and Dixon, J. K. Importance of cobalt in treatment of stock ailment in South Island, New Zealand. Ibid. 18: 73-92. 1936.
(9) Askew, H. 0. and Dixon, J. K. Cobalt status of animal organs from South Island (N. Z.) drench experiments. Ibid. 18: 707-716. 1937.
(10) Askew, H. 0. and Dixon, J. K. The value of cobalt salts for pasture top-dressing in the treatment of stock ailment at Olenhope, Nelson and Morton Mains, Southland. Ibid. 19: 317-325. 1937.
(11) Askew, H. 0. and Josland, S. iV. Rate of excretion of cobalt by sheep after drenching with cobalt chloride. Ibid. 18: 888-892. 1937.
-127 -
(12) Askew, H. 0, and Maunsell, P. W, The cobalt content of some Nelson pastxires. Ibid. 19: 337-342. 1937,
(13) Aston, D. C. Treatment of iron hunger in stock. N, Zealand J. Agr. 33: 98. 1926.
(14) Barron, Alberto Guzman and Barron, E. S. Guzman. Mechanism of cobalt polycythemia. Effects of ascorbic acid. Proc. Soc. Exptl. Biol. Ked. 35: 407-409. 1936.
(15) Bayle, Edmond and Amy, Lucien. Sxir la depot electrolytique d« traces metalliquos et lexir caracterisation par I'analyse spectrale. Bull. soc. chim. 45: 604-624. 1928.
(16) Beard, Howard H. and Andes, Erlene J. The effect of Iron with and without other elements upon the production of polycythemia. Am. J. Physiol. 109: 316-319. 1934.
(17) Becker, R. B. and Gaddum, L. W. The composition of limonites effective and ineffective in correcting "bush sickness" in cattle. J. Dairy Sci. 20: 737-739. 1937.
(18) Bell, Muriel BI. Physiological investigations at Morton Mains. New Zealand Dept. Sci. Ind. Research. Eleventh annual report. 1936-1937: 49.
(19) Bell, Kiiriel E. iiome physiological aspects of the cobalt problem. New Zealand J. Sci. Tech. 18: 716-719. 1937.
(20) Bennetts, H. W. Coast disease in Western Australio. J. Dept. Agr. W. Australia. 17: 41-48. 1940.
(21) Bernheim, Frederick and Dernheim, Mary L. C. The action of manganose and some other metals on the oxidation of certain substances in the liver. J. Biol. Chem. 128: 79-82. 1939.
(22) Bertrand, Gabriel and Mdcheboeuf, M. Sur la teneur relative-ment dlevee du pancreas en nickel et en cobalt. Bull, soc. chim. ser. 4, 39: 1646. 1926,
(23) Bertrand, Gabriel and MScheboeuf, M. Sur les proportions de cobalt contenues dan les organes des animaux. Compt. rend. 180: 1993-1997. 1925.

- 12B -
(24) Bortrand- Gabriel and Macheboeuf, M. Sur la teneur rolativoment elevee du pancreas en nickel et en cobalt. Compt, rend, 182: 1306-1307, 1926,
(25) Bertrand, Gabriel and Mficheboeuf, I!, Influence du nickel et du cobalt sxir 1'action exercee par I'insullne chez le lapln. Compt. rend. 182: 1504-1507, 1926,
(26) Bertrand, Gabriel and Mficheboeuf, M, Influence du nickel et du cobalt sur 1'action exercee par I'insullne chez le chien, Compt, rend. 183: 5-8, 1926,
(27) Bertrand, Gabriel and Mokragnatz, M, Sur la presence du cobalt et du nickel chez les v^getaux, Compt, rend, 175; 458-460, 1922.
(28) Bertrand, Gabriel and Mokragnatz, M, Repartition du nickel et du cobalt dans les plantes. Compt, rend. r..O: 21-25. 1930,
(29) Bertrand, Qabriol and Nakamura, Hirosi, Reoherches axu* 1'importance phyaiologique du nickel ot du cobalt. Bull, aoc, chlm, blol, 16: 1366-1371, 1934,
(30) Berwald, W,P,E,, Arseneu, J. H. and Dooley, M. S. Effect of cobalt sulfate on erythrocyte count of the spfbnectom-ized albino rat. Proc, i>oc, Exptl, Biol, Mod, 32: 430-431, 1934,
(31) Blathorwiok, N, R. and Sahyun, Melvlllo. The effect of cobalt and insulin hypoglycemia in rabbits. Am. J. Physiol. 81: 560-562. 1927,
(32) Blujnberg, Harold and Bask, 0, S, Spoctrographlc analysis of milk ashes. J, Nutrition 6: 255-288. 1933,
(33) Bonner, W. G., McNaught, K. J. and Paul, Q. V/. Cobalt top-dressing experiments. New Zealand J, Agr. 58: 493-494, 1939,
(34) Bowstead, J, £. and Sackville, J. P, Studies with a deficient ration for sheep. Can. J, Hesearch, 17D: 15-28, 1939,
(35) Brewer, George. The erythrocyte reaction of the dog to cobalt. Am. J, Physiol, 118: 207-210, 1937,
(36) Brewer, George. A statistical study of cobalt polycythemia in the dog. Ibid. 345-348. 1940,
129 -
(37) Caujolle, Pernand. L*elimination biliaire du cobalti Bull* soc« chim* biol* 18: 1081. 1936*
(38) Caujollof Pernand. Toxicitos comparees du cobalt et du nickel. J» phami. chim. 29: 410-415• 1939*
(39) Caujolle, P. and Lafitte, S. Contribution a 1'etude tox-icologique du cobalt. J, phorm. chin. 25; 351-371. 1937.
(40) Copp» D. Harold and Greenberg, David M. Studies in mineral metabolism with the aid of artificial radioactive isotopes. VI. Cobalt. Proc. Natl. Acad. Sci. U. S. 27: 153-157. 1941.
(41) Cori, Oerty T,, Golowick, Sidney P. and Cori, Carl P» The enaymic conversion of glucose-l-phosphoric eator to 6-estor in tissuo extracts. J. Biol. Chetn. 124: 543-555. 1938.
(42) Corner, H. H. Pine disease in sheep. Ap-.r. Progress 16: 181-107. 1939.
(43) Corner, H. H. and Smith, A. M. The influence of cobalt on pine disease in sheep. Blochom. J. 32: 1800-1805. 1938.
(44) Davis, John E. Cobalt polycythemia in tho dog. Proc. Soc Exptl. Biol. Med. 37: 96-99. 1937.
(45) Davis, John E. Tho effects of ascorbic acid administration upon experimental polycythemias: the mechanism of cobalt polycythemia. Am. J. Physiol. 129: 140-145. 1940.
(46) Davis, John E. Blood voltmie in cobalt polycythemia. Proc Soc. Exptl. Biol. Med. 45: 671-673. 1940.
(47) Dixon, J. K. The use of cobaltized salt lick in the control of a lamb ailment at Morton Mains, Southland. Hew Zealand J. Sol. Tech. 18: 892-897. 1937.
(48) Dixon, J. K. A trial of tho effect of cobalt drench on milk production of cows at Morton Mains. Ibid. 19: 343-344. 1937.
(49) Dutoit, Paul and Zblnden, Christian. Analyse speotro-graphlque des cendrea de sang et d*organes. Compt. rend. 188: 1628-1629. 1923.
(50) Dutoit, P. and Zblnden, Chr. Analyse spectrographique des oendres d»organes. Ibid. 190: 172-173. 1930.
- 130 -
(51) Duval, Raymonde and LeGoff, Jean-Marie. Recherche de petites quantites do cobalt dan 1'urine humaine. Ibid. 204* 817-318. 1936.
(52) Dixon, J. K, The value of nickel salts in the treatment of Morton Mains ailment. New Zealand J. Sci. Tech. 19: 326-329. 1937.
(53) Edlbacher, S. and Baur, H. V/eitere Mittellung zur Kenntnis der Natur der Hefe- imd Leberarginase. Z. physiol. Chem. 254: 275-284. 1938.
(54) Fairbanks, B. \'U Cobalt in nutrition. North 'merican VeteriBrlan 20, No. 3; 33-33. 1939.
(55) Pilracr, J. P. Enasootic marasmus of cattle and sheep. Auat. Vet. J. 9: 163-179. 1933.
(56) Pilmor, J. F. Treatment with limonite fractions. Ibid. 10: 85-87. 1934.
(57) Pilmor, J. P. and Underwood, E. J, Enzootic marasmus. Further data concerning the potency of cobalt as curative for enzootic marasmus. Ibid. 13: 57-64. 1937.
(58) Pish, Velraor Bemel. The determination of ethyl alcohol in the blood and tissues, its absorption and distribution and its effect upon some of the blood constituents of the rat. Unpublished Ph. D. thesis. Ames, la., Iowa State College Library. 1942.
(59) Polin, 0. and Ilalmros, 11. fin Improved form of Polin's micro method for blood sugar determination. J. Biol. Chem. 83: 115-120. 1929.
(60) Pox, H. Mtinro and Ramage, Hugh. Speotrographic analysis of animal tissues. Nature 126: 682. 1930.
(61) Pox, K. Uunro and Ramage, Hugh. Speotrographic analysis of animal tissues. Proc. Roy. Soc. (London) lOBB: 157-173. 1931.
(62) Frost, Douglas V., Elvehjem, C. A. and Hart, K. n. Need for cobalt in dogs on milk diets. J. Nutrition 21: 93-100. 1941.
(63) Prost, D. v., Spitzer, E. H., Elvehjem, C. A. and Ilart, E. Some effects of cobalt and liver substances on blood building in dogs. Am. J. Physiol. 134: 746-754. 1941.
- 131 -
(64) Godden, W. "Trace" elements in htiman and animal nutrition. Chemistry and Industry 17: 791-796* 1939.
(65) Qrele* Russell and others. Pine; a disease affectinc sheep and cattle. Vet. J. 89: 99-110. 1933.
(66) Griffith, V/endell n., Pavcek, Paul L. and Mulford, Dwight J. The relation of the sulphur amino acids to the toxicity of cobalt and nickel in the rat. J» Nutrition 23: 603-611. 1942.
(67) Grimmett, R. E. R. Cobalt in limonite and foods. New Zealand Dept. Agr. Annual report, 1036-1937: 47-51. Original not seen. Abstracted in Chem. Abst. 32: 4266. 1930,
(68) Hart, E. B. Iron in nutrition; a new Inorganic factor as a supplenent to Iron in hemoglobin building. Vis-consln Med. J. 20: 60. 1929. Original not seen, 'ibstracted in Cliem. 'bst. 23:2742. 1929.
(69) Hawk, P. B. and Bergelm, 0. Practical Physiological Chemistry. 9th ed. Philadelphia, P. Blaklston and Co. 1937.
(70) Hellerman, Leslie and Perkins, Marie B. Activation of enzymes. III. The role of metal ions in the activation of arglnase. Tho hydrolysis of arglnine Induced by certain metal ions with urease. J. Biol. Chem. 112: 175-194. 1935.
(71) Hellerman, Leslie and Stock, C. Chester. Metal ion activation in enzymic catalysis. Arglnase. J. Am. Chem. Soc. 50: 2654-2655. 1936.
(72) Hlbbard, P» L. Estimation of copper, zinc and cobalt (with nickel) in soil extracts. Ind. Eng. Chem., Anal. Ed. 10: 615-618. 1930.
(73) Hopkirk, C. E. M » Cobalt-feeding experiment at /Srohena. New Zealand J. Agr. 54: 344-349. 1937.
(74) Hopkirk, C. S. M. and Grimmett, R. E. R. The importance of cobalt relationship to tho health of farm animals. Ibid. 56: 21-24. 1938.
(75) Jacoby, Martin and Shlmlzu, T. fhier Winstllche Zymogene. IV. uber die Elnwirkung von dem Nickel nahestehenden Metallen auf die Sojaurease. Biochem. Z. 128: 89-94. 1922.
(76) Josland, S. W« Tho effect of feeding cobalt to rats. New Zealand J. Sol. Tech. 18: 474-480* 1936.

- 132 -
(77) Josland, S. W. The effect of feeding excess cobalt to healthy sheep. New Zealand J. Sci. Tech. 19: 31-37. 1937.
(78) Josland, S. W. and McNaught, K. '.7. Further observations on the production of cobalt polycythemia In rata. New Zealand J. Sol. Tech. 19: 536-540. 1938.
(79) Kellj H. L. and Nelson, Victor E. The role of copper In carbohydrate metabolism. J. Biol. Chem. 106: 343-349. 1934.
(80) Kldson, E. B. Some factors Influencing the cobalt content of soils. J. Soc. Chem. Ind. 57: 95-96T. 1938.
(81) Kldson, E. B. and Askew, H. 0. Critical examination of the nltroso-R-salt method for the deteinnlnatlon of cobalt In pastures. New Zealand J. Scl. Tech. 21B: 178-189. 1940.
(82) Kldson, E. B., Askew, TI. 0* and Dixon, J. K. Colorl-metrlc determination of cobalt In soils and animal organs. Ibid. 18: 601-607. 1936.
(83) Kldson, E. B. and Maunsell, P. V.'. The effect of cobalt compoimda on the cobalt content of supplementary fodder crops. Ibid. 21A: 125^^128. 1939.
(04) Klllham, B. J. Cobalt deficiency In some Ulchlgan cattle. J* Am» Vet. Med. Assoc. 99: 270-282. 1941.
(85) Labb^, Marcel, Roubeau, II. and Neproux, P. Influence du nickel et du cobalt aur Inaction hypoglyc^mlante de I'lnoullne chez le lapln. Compt. rend. 185: 1532-1534. 1927.
(86) Labb($, Marcel, Roubeau, II. and Nepreux, P. Action dee sels^de nickel et de cobalt sur la pouvolr hypo-glycemlant de 1* Insulin chez le dlabetlque. Ibid. 186: 181-183. 1928.
(87) Lazarls, J. A. Specific action of products of Intermediate tissue disintegration. Platz. Utschen. Med. 1036: 220-230. Original not seen. Abstracted in Chem. Abst. 31: 3986. 1937.
(88) LeQoff, J. U. Elimination du cobalt par le rein. Compt. rend. soc. blol. 96: 455-456. 1927.
(89) LeOoff, J. M. Elimination du cobalt par le rein chez I'hommo. Ibid. 97: 21-22. 1927.

- 133 -
(90) LeGoff, J. M» Action vasodllatatrice des sels de cobalt. Compt. rend. 186; 171-172. 1928.
(91) LeGoff, J. M. Cobalt as a vasodilator. J. Pharmacol. 38: 1-9. 1930.
(92) LeGoff, J. M. Cobalt as a vasodilator. Prease raed. 42: 231-232. 1934. Original not seen. Abstracted In Chom. Abst. 28: 5886. 1934.
(93) LeGoff, J. M. Reaction blolocique differoncielle des composes cobalteux et de certain complexes cobaltlques (cobaltiaraiaines) • Compt. rend. 201: 531-532. 1935.
(94) Lehmann, Hennanri. Factors Influencing the formation of Roblson ester. Dlochen. J. 33: 1241-1244. 1939.
(95) Lines, E. V/. Effect of ingestion of minute quantities of cobalt by sheep affected with "coast disease". J. Council Sol. Ind. Research 8: 117-119. 1935.
(96) LugR, J. V/, n. and Josland, S. V», •' note on the color-imetric estlmablon of cobalt in solution by means of nitroso-R-salt. Aust. J. Exp. Biol. Med. Sci. 14: 319-321. 1936.
(97) McCollm, Elmer V. Inorganic elements In nutrition. Univ. Penna. Bicentennial Conf. Nutrition 1941: 46-55.
(98) MoGhee, J. L. Metallized food in the regeneration of hemoglobin in the rat and man. Science 73: 347-348. 1931.
(99) McHargue, J. S. The occvirrenoe of copper, tuanganeoe, zinc, nickel and cobalt in soils, plants and animals and their possible function ao vital factors* J. Agr. Research 30: 193-196. 1925.
(100) McIIargue, J. S. Significance of the occurrence of manganeoe, copper, zinc, nickel and cobalt in Kentucky blue-grass. Ind. Eng. Chem. 19: 274-276. 1927.
(101) McNaught, K. J. Cobalt content of llmonites used in the treatment of bush sickness. Hew Zealand J, Sci. Tech. 18: 655-661, 1937.
(102) McNaught, K. J. Cobalt content of North Island pastiu'es. New Zealand J. Sci. Tech. 20A: 14-30. 1938.
(103) McNaught, K. J. Cobalt content of pastures. Nev/ Zealand J. Agr. 57: 209-212. 1938.
- 134 -
(104) McNaxight, K. J. Determination of cobalt in animal tissues* Analyst 64: 2Z-2n * 1939*
(105) Mc?Iought, K. J. and Paul, G. W. Seasonal variation in cobalt content of llorth Island pastures. New Zealand J. Sci. Tech. 21B: 95-101. 1939.
(106) Magenta, M. A, Action des sels do nickel et de cobalt sur I'hypoglycemie insulinique. Compt, rend. soc. biol. 98: 169-170. 1928.
(107) Marshall, Louise H. Antianemic treatment in experimental polycythemia. Am. J. Physiol. 114: 194-203. 1935.
(103) Marston, Hedley R. Rtmlnant nutrition. Ann. Rev. Biochom. 9: 557-578. 1939.
(109) Marston, Hedley R. and Dewey, Douglas W. The estimation of cobalt in plant and animal tissues. Aust. J. Exp. Biol. Hod. Sci. 18: 343-352. 1940.
(110) Marston, H. R. and othors. Studios on coast disease of sheep in South Australia. Australia Council Sci. Ind. Research. Bull. no. 113. 1938.
(111) Masoherpa, P. Azionc dol cobalt sul ricambio azotato. Boll. soc. ital. biol. sper. 4: 582-506. 1929.
(112) Mascherpa, Pietro. Le pouvoir homatopoi^tique du cobalt. Aroh. ital. biol. 82: 112-120. 1930.
(113) Masoherpa, Pietro. Sulla possibilita' di voicolare ad un organo il cobalto legato alle proteine doll* organo stosso. Risultati attenuti. Programma dl ulteriori richorche. Bull. soc. ital. biol. sper. 10: 140-152. 1935.
(114) Masaol, L. and Breton, II. Toxicity intracerebralo de qiielques sels metalllquos chez le cobalt. Compt. rond. soc. biol. 66: 818-820. 1909.
(115) Maynard, L. A. Relation of soil and plant deficiencies and of toxic constltuenta in soils to animal nutrition. Ann. Rev. Biochem. 10: 449-470. 1941.
(116) Melrose, G. B. Arohena experiment. New Zealand J. Agr. 57: 211-212. 1938.
(117) Mlchaolis, Leonor and Storn Kurt G. Uber den Einfluss von Schwermetallon und Metallkomplexen auf proteolytische Vorgange. Biochem. 2. 240: 192-217. 1931.
- 155 -
(118) Mlchelazzl, A. M. and Savlano, M. Investigotions on the polycythemia from cobalt. Arch, Scl. biol« (Italy) 26: 515-544. 1940. Ori/^inal not read. Abstracted in Cheia. '.bst. 55: 8108. 1941.
(119) Neal, W. M. and Ahraann, C. F.' Tlie essentiality of cobalt In bovine nutrition. J. Dairy Sci. 20: 741-755. 1937.
(120) Noal, w. M. and Ahmaiin, C. P. Cobalt au an oaaential element in aninal nutrition. Science 86: 225-226. 1937.
(121) Orten, J. M. The mechanian of the hematopoietic action of cobalt. Am. Physiol. 114: 414-422. 195G.
(122) Orten, James Id., Underhill, P. Aline, I^ugrafre, Edward n. and Lewis, Robert C. Polynythemi« in the rat on a railk-iron-copper dieb sxipplomented by cobalt. J. Biol. Cheia. 96: 11-16. 1932.
(123) Orten, James M., Underhill, P. Aline, ?.!ugrace, Edward R. and Lewis, Hobort C. Blood volurao studies in cobalt polycythemia. J. Biol. Chem. 99: 457-463. 1933.
(124) Patterson, J. B. E. Some observations on a diseane of sheep in Dartmoor. Empire J. Exotl. Agr. 6: 262-267. 1930.
(125) Paulain, Robert. Lo cuivre, lo zinc ot le cobalt dans lea organes dea nollusques lanellibranches. Compt. rend 204: 1508-1510. 1937.
(12S) Polonovski, Michel and Briskas, Sotirin. Contribution a I'etudedo 1'action homopoiotique du cobalt au cours de I'andmie provoqu^e chez le jeune rat carence. Compt. rend. aoc. biol. 130: 1588-1590. 1939.
(127) Potter, V, R., L'lvehjom, C. A. and Hart, E. B. Anemia studies 'flith dof-a. J. Biol. Cbom. 126; 155-173. 1938.
(128) Ramaco, Hugh. Biolocical distribution of metals. Nature 137: 67. 1936.
(129) Rathery, P. and Lovina, L. Influence des sels de nickel et de cobalt our quelquos diabetiques. Compt. rend. 10:5 326-328. 1926.
(130) Sahyun, Melyllle, JJixon, Arthur and Goodoll, 11, Inflnence of certain metals on the stability of insulin. J.
' Pharmacol. 65: 143-149. 1939,
- 15(3 -
(131) Schulfcze, Kurt v;. Die Bedoutimg der Schwemetalle fur die anaTnlebehandlunrr. Klin. Y/ochschr. 11: 497-499. 1932.
(132) Schultze} U. 0» Metallic ele.rients and blood Torraation. Physiol. Rev. 20: 37-GO. 1940.
(133) Scott, R. C. Control of coast disease on Tliistle Island. J. Dept. S. Australia 42: 272-277. ll'Sa.
(134) Staro, 1'. J. and Klvchjor.), C. A, Cobslt in ani-aal nutrition. J. Biol, Ch<?]n, 09: 473-403. 1933.
(li'.S) Stewart, Jamos, Mitchell, .1. L. and Stewart, A. B. Pininc in sheep; its control by adrainistration of cobalt and by use of cobalt-rich fertilizer. JSnplro J. E-^ptl. Agr. 9: 115-152. 1941.
(136) Stuart, T, P, Anderson. Nickcl ana cobalt: thoir phys-iolorical action on tho aninal orr;aniain. J. Anst. Physiol. 17: 89-123. 1082.
(137) Sutter, Jean. Cobalt ot hyperglobullo. Comi^t. rend. soc. biol. 116: 994-996. 1934.
(13D) Sylvester, lu D. and Lenpitt, L. U. 'Ilie dotermir.otion of cobalt in foods. J. Soc. Chein. Ind. 59: 57-GG. 1940.
(139) Taylor, C. R. Top-di'ooslnfj with cobalt. Kxperimonts in btioh-sick country, llev/ 7.oaland J. A(»r. 57; 206-207. 1930.
(140) Thannhauser, S. J., Roichel, Wax and Cratton, Jorome K. Soruni phosphatase activity. I. Ascorbic acid activation on serum phosphatase. J. Biol. Chen. 121: 607-70n. 1937,
(141) Underbill, F. Alino, Orten, James M. and Lewis, Robert C. llae inability of motnls other than copper to supplement iron in ctirinc the nutritional aneiaia of rats. J. biol. Chem. 91: 13-25. 1931.
(142) Underv/ood, E, J, F.'nzootic marasmus. Iron content of liver, kidney and spleen. Australian Vet. J. 10: 87-92. 1934.
(143) Underwood, K. J. The significance of "trace elenonta" in nutrition. Cobalt. Nutrition Abst. and Revs. 9: 520-523. 1940.
- 137 -
(144) Underwood, E, J# and Elvehjom, C. A. Is cobalt of any significance in treatment of milk anemia with iron and coppor? J« Biol# Chem. 124: 419-424• 1330•
(145) iJnderwood, 13, J# and i'lln;or, J. Tlie dotenaination of tho biologically potent elanent (cobalt) in linonito. Auotralian Vet. J. 11: S4-92. 1955.
(146) Underwood, J. and Harvoy, R. J, Enzootic r.iarasnua: the cobnlt content of soils, pastures and animal organs. Australian Vot. J. 14: 103-139. 1938.
(147) Van Klooster, II. S. Mitroso-R-salt; a new reagent for the detection of cobalt. J. Am. Chem. Soc. 43: 746-749. 1921.
(140) Villaret, Maurice, Bertrand, Ivan, Justin-Bescanpon L. and .von, noger. I.os cirrhoaes cobaltiques. Goapt. rend. aoc. blol. 1C8: 956-957. 1931.
(149) V'altnor, K. Tlierapeutiaohe Versucho mit Kobalt. Acta. pacdiat. 11: 438-440. 1930.
(150) .Valtner, Klara and V/altner, Karl. Kobalt \ind Blxit. Klin. V.ochocl'r. 8: :'.13. 1929.
(151) V/obb, D, A. Studies on tho ultimate conpooition of biolo(',lcai material. II. Spectrographio analyais of Taurine invortebratoa with special reference to the chemical composition of their environment. Sci. Proc. Roy. Dubliii Soc. 21: 505-539. li'dV.
(152) V/ricbt^ Ilorman C« and Papiah, Jacob. Inorganic constituents of milk. Scionce 09: 7B. 1929.
(153) Touada, CitJoai. Tho phariiiacolo[^ of cobalt. Mitt. med. Pak. Kais. Univ. Tolcyo 32: 103-195. 1924. Original not seon. *.bstraotod in Chem. Abst. 20: 1857. 1926.
- 138
ACKNOY/LEDO^tENT
The author wlahos to express his slncero
appreciation to Prof. Victor E. Nelson who
directed the work of this thesis.


![The Utilization of Struvite Produced from Human Urine in … · ing valuable materials in human urine and faeces [7]. There are different methods for using human waste . directly](https://img.pdfslide.us/doc/110x75/60a5cdb53a0d8a03d43efab8/the-utilization-of-struvite-produced-from-human-urine-in-ing-valuable-materials.jpg)