Embed Size (px)
Citation preview

Smart Rivers Conference 14 September 2011
Kevin Knight Economist
Institute for Water Resources U.S. Corps of Engineers 1
Challenges with Evaluating Container Port Projects and the Corps of Engineers

Trends in Containerized Trade Containers on the Inland River System Challenges with Evaluating “Container Gateway Ports” Studies/Products aimed at Reducing the Uncertainties Linkages to the Inland River System
U.S. Navigation System

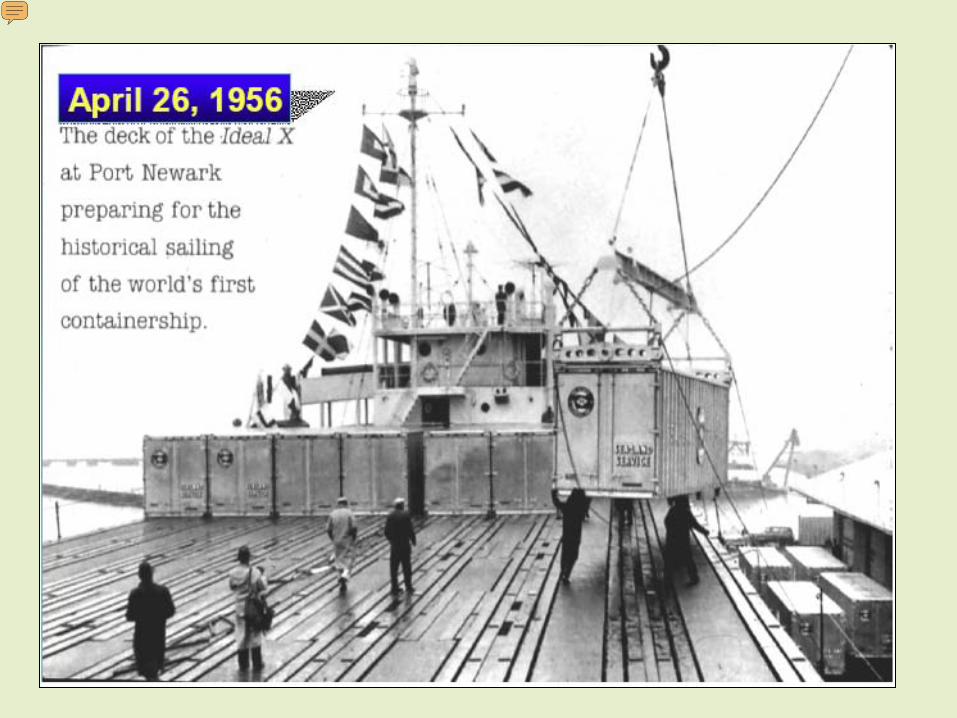
Forecast Total World Container Trade 2000 - 2024
Doubled from 60 million TEUs in 2000 to about 120 million in 2008
Slight decline forecast in 2009
Renewed growth to about 260 million TEUs by 2024
That is down 40 million TEU from earlier forecasts
Source: IHS Global Insight, Inc. Dec 08
Million TEUs
Decline from Previous forecast
7

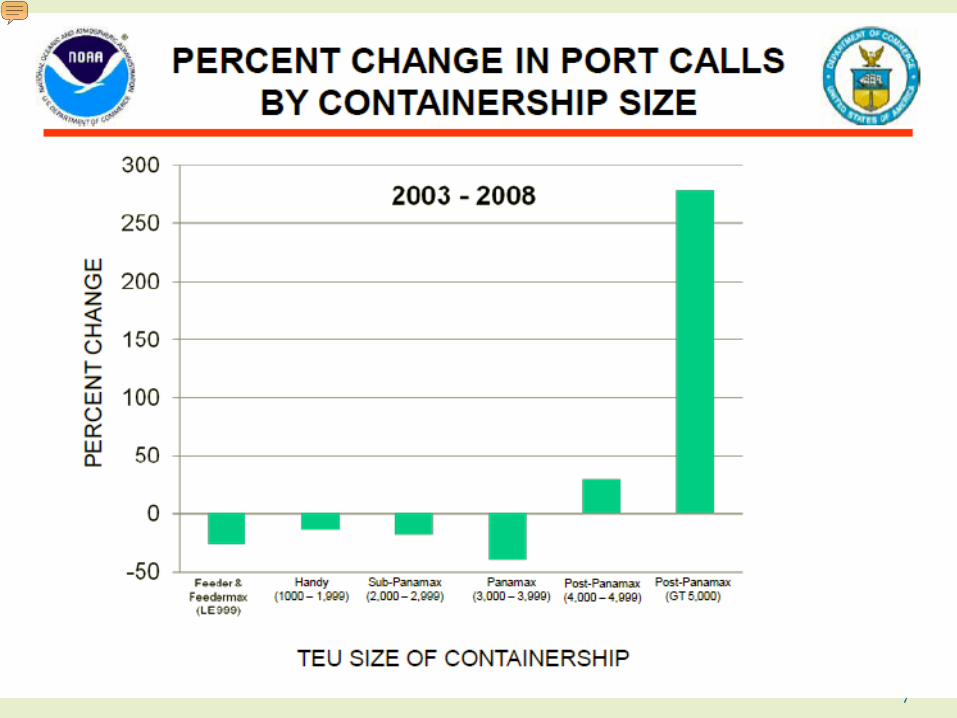
Source: Lloyds Register (2006), “Ultra-large containerships: the green ships of the future?
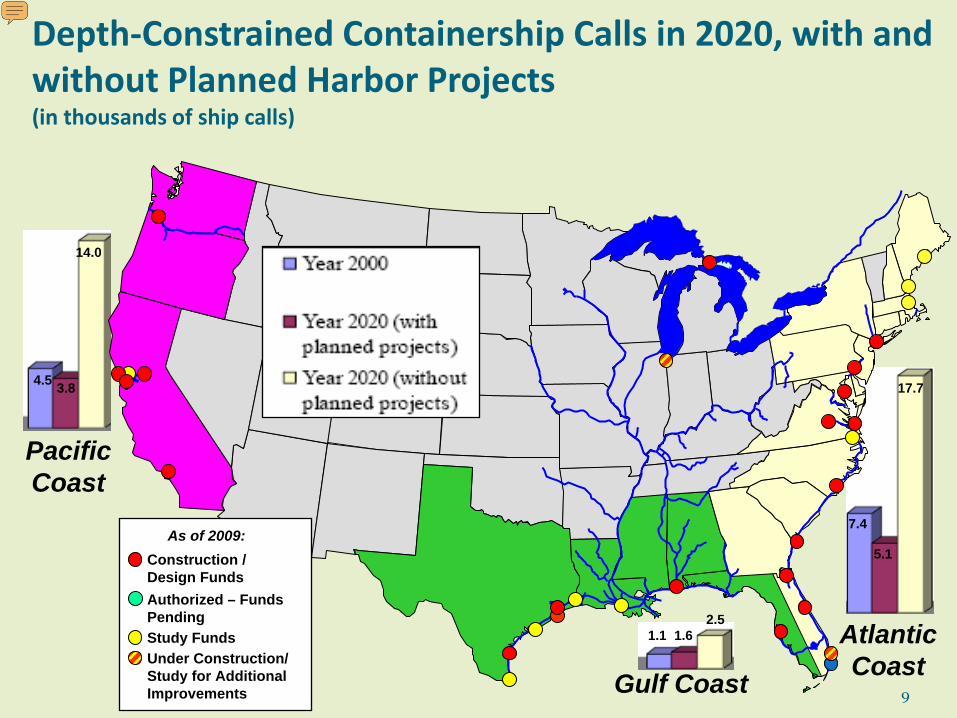
Pacific Coast
4.5 3.8
14.0
Atlantic Coast
7.4
5.1
17.7
Depth-Constrained Containership Calls in 2020, with and without Planned Harbor Projects (in thousands of ship calls)
Gulf Coast
1.1 1.6 2.5
Construction / Design Funds
Study Funds Under Construction/ Study for Additional Improvements
Authorized – Funds Pending
As of 2009:
9
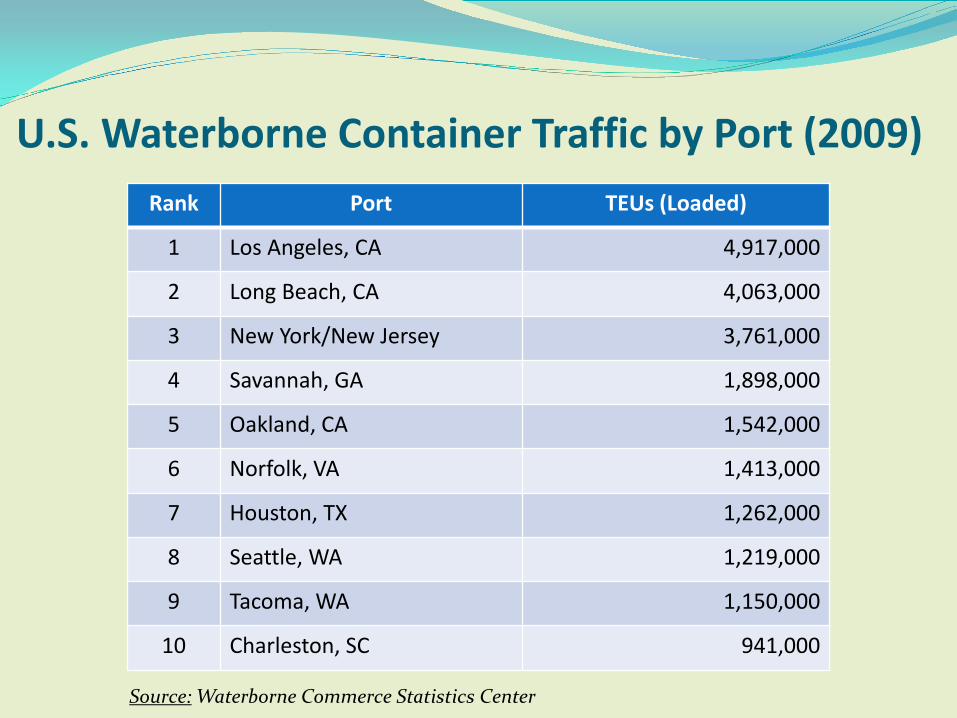
U.S. Waterborne Container Traffic by Port (2009) Rank Port TEUs (Loaded)
1 Los Angeles, CA 4,917,000
2 Long Beach, CA 4,063,000
3 New York/New Jersey 3,761,000
4 Savannah, GA 1,898,000
5 Oakland, CA 1,542,000
6 Norfolk, VA 1,413,000
7 Houston, TX 1,262,000
8 Seattle, WA 1,219,000
9 Tacoma, WA 1,150,000
10 Charleston, SC 941,000
Source: Waterborne Commerce Statistics Center

Containers on the Coastal/Inland System
U.S. domestic COB services began about 30 years ago Initially along Atlantic Coast and Columbia River system in Pacific
Northwest Few major COB services continue today
Columbia Coastal Transport (COB feeder services along Atlantic Coast), vessel capacities of 450 to 912 TEUs—weekly
James River Barge Line “I64 Express” (COB Norfolk-Richmond) - weekly Osprey (Gulf Coast and Inland waterways) Tidewater and Foss (Columbia River/PNW)
Sea Point – (trans-shipment site located at Mile 12 of the Mississippi River at Venice, Louisiana to reach design capacity by 2013)
Columbia-Snake COB (Lewiston, ID to Portland, OR) Illinois-Gulf Marine Highway Initiative
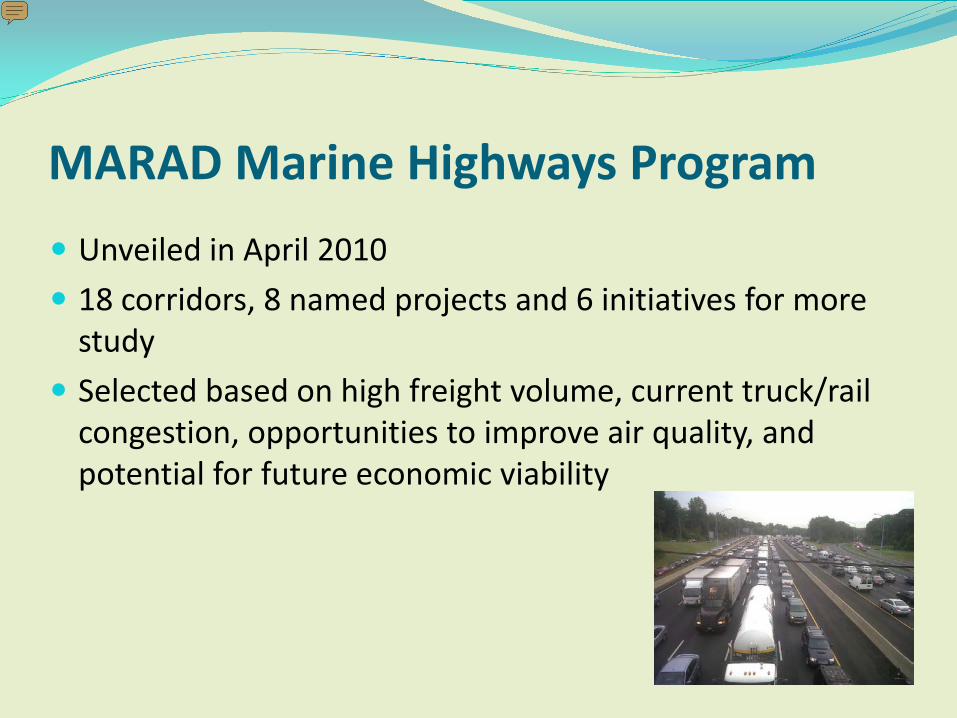
MARAD Marine Highways Program Unveiled in April 2010 18 corridors, 8 named projects and 6 initiatives for more
study Selected based on high freight volume, current truck/rail
congestion, opportunities to improve air quality, and potential for future economic viability

Some Marine Highway Projects James River Expansion Project
Expand frequency of existing COB services between Hampton Roads and Richmond, VA
Gulf-Atlantic Marine Highway Project Support construction of vessels designed to serve COB market,
focus on connecting Gulf and South Atlantic ports Tenn-Tom Freight Project
A new COB service between the Port of Itawamba, MS and the Port of Mobile, AL
East Coast Marine Highway Initiative Use existing and new vessels to provide COB services between
Florida, Maryland and Massachusetts (I-95)

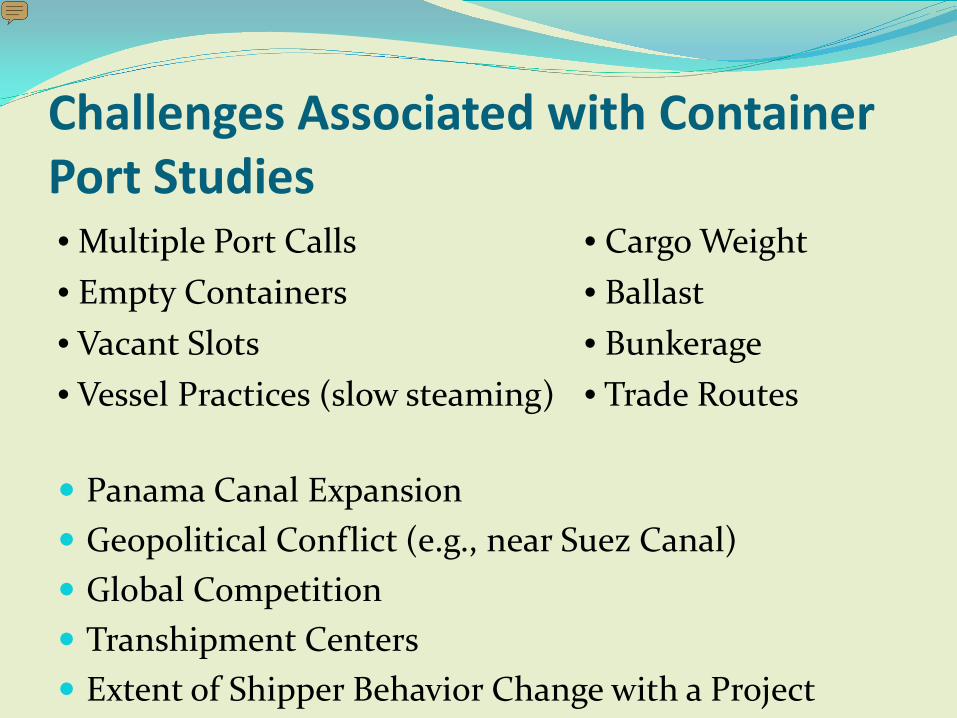
Challenges Associated with Container Port Studies
Panama Canal Expansion Geopolitical Conflict (e.g., near Suez Canal) Global Competition Transhipment Centers Extent of Shipper Behavior Change with a Project
• Multiple Port Calls • Cargo Weight • Empty Containers • Ballast • Vacant Slots • Bunkerage • Vessel Practices (slow steaming) • Trade Routes
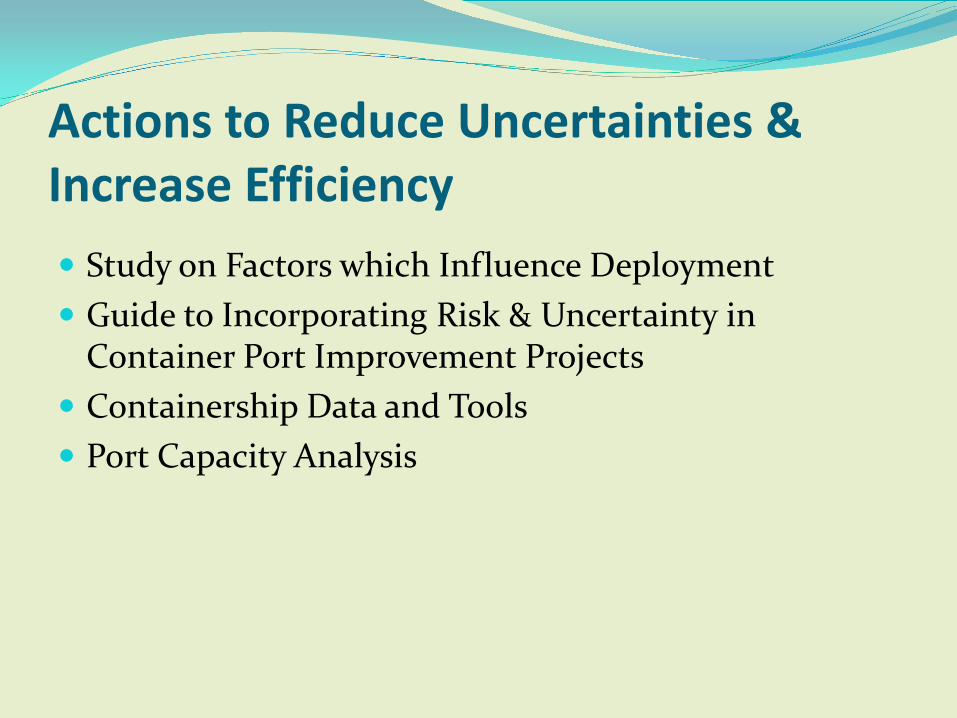
Actions to Reduce Uncertainties & Increase Efficiency Study on Factors which Influence Deployment Guide to Incorporating Risk & Uncertainty in
Container Port Improvement Projects Containership Data and Tools Port Capacity Analysis
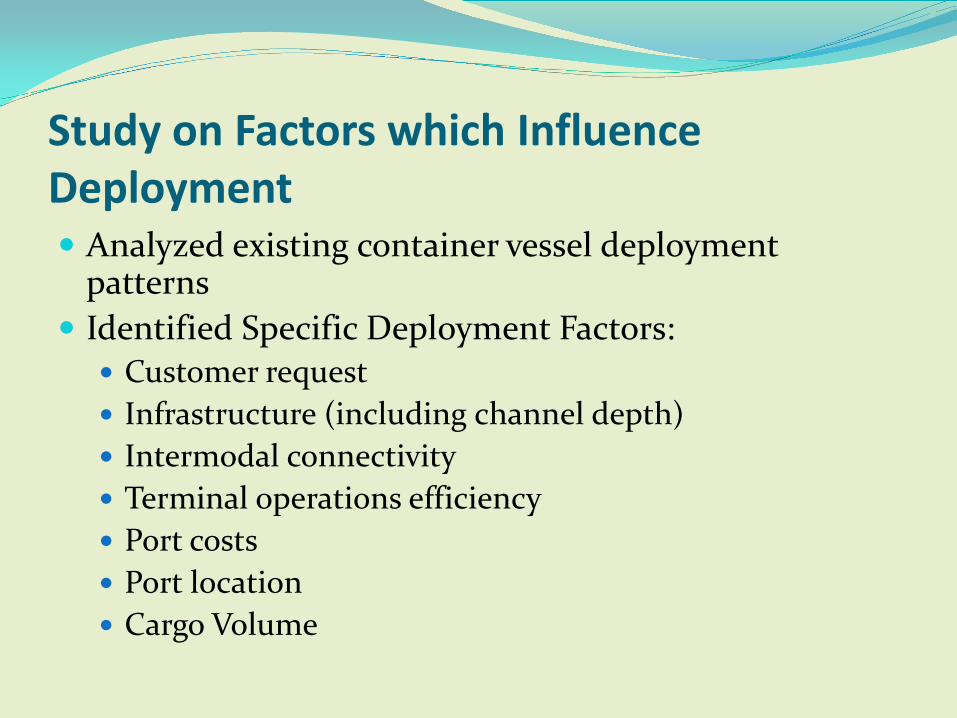
Study on Factors which Influence Deployment Analyzed existing container vessel deployment
patterns Identified Specific Deployment Factors:
Customer request Infrastructure (including channel depth) Intermodal connectivity Terminal operations efficiency Port costs Port location Cargo Volume

Guide to Incorporating Uncertainty into Container Port Projects Identifies the key sources of uncertainty and variability
in Various NED Benefits Modeling Components Physical Conditions Commodity Forecasts Fleet Projections Vessel Operating Practices
Provides suggested ways of dealing with uncertainty
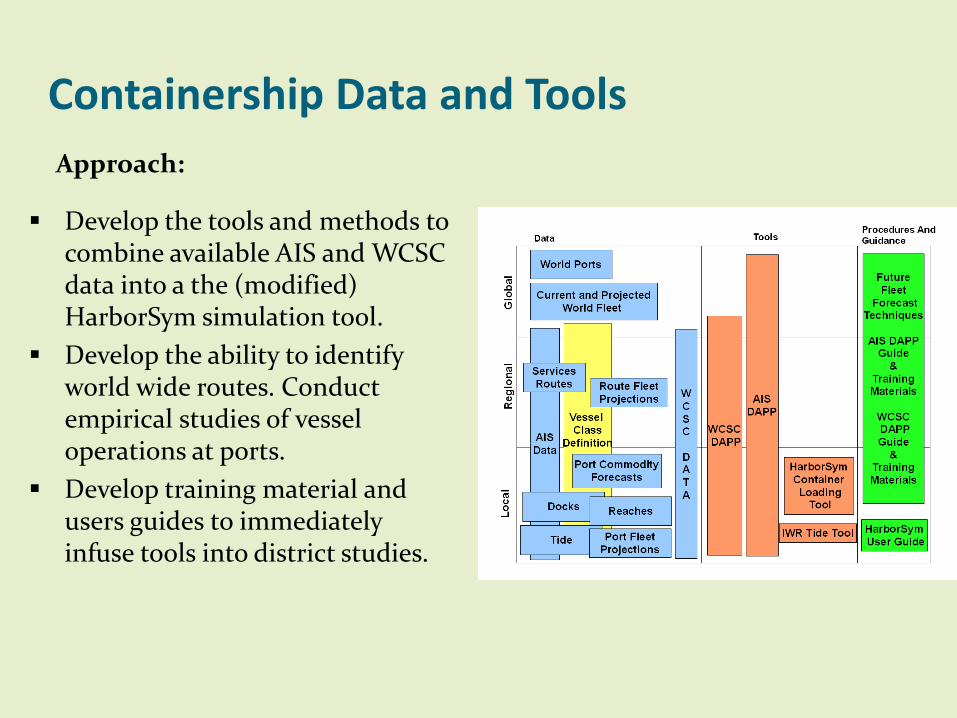
Containership Data and Tools
Approach:
Develop the tools and methods to combine available AIS and WCSC data into a the (modified) HarborSym simulation tool.
Develop the ability to identify world wide routes. Conduct empirical studies of vessel operations at ports.
Develop training material and users guides to immediately infuse tools into district studies.

Port Capacity Analysis: Key Questions
What are the near-term and long-term capacities of the major East Coast and Gulf Coast container ports?
What factors constrain the capacities of those ports? How well is capacity currently utilized? How well are the major ports prepared to handle larger
vessels? How do the smaller container ports or terminals fit
into the picture?

23
Five Dimensions of Terminal Capacity
DRAFT
BERTH LENGTH
STACKING HEIGHT CY DEPTH (AREA)
OPERATING HOURS
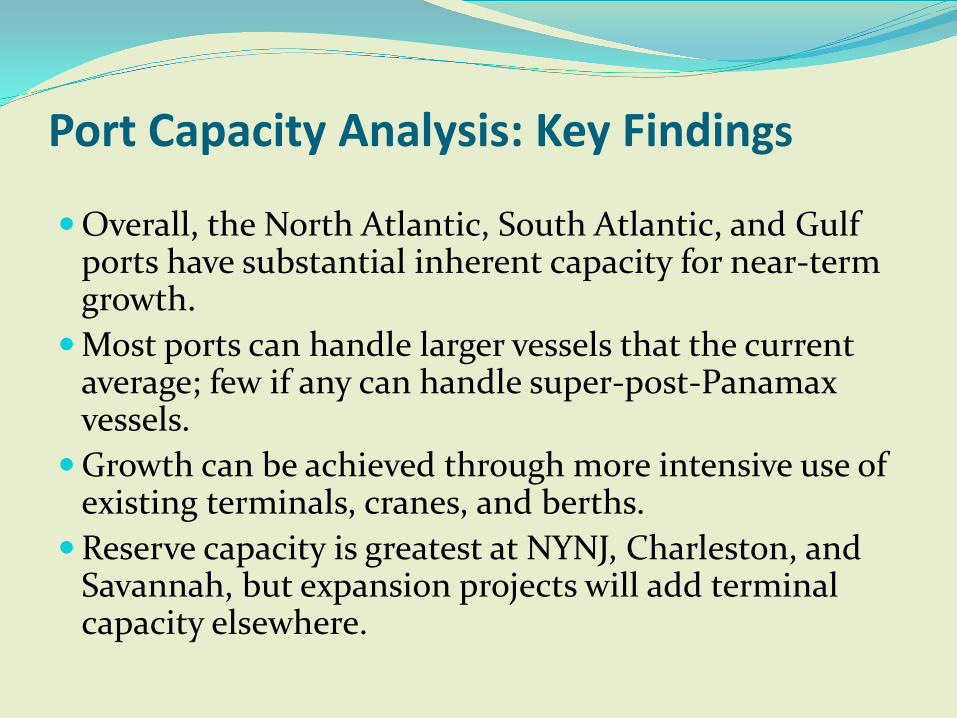
Port Capacity Analysis: Key Findings
Overall, the North Atlantic, South Atlantic, and Gulf ports have substantial inherent capacity for near-term growth.
Most ports can handle larger vessels that the current average; few if any can handle super-post-Panamax vessels.
Growth can be achieved through more intensive use of existing terminals, cranes, and berths.
Reserve capacity is greatest at NYNJ, Charleston, and Savannah, but expansion projects will add terminal capacity elsewhere.

Other Products on the Horizon? Panama Canal Expansion Studies
Toll Structure Analysis Expansion of Port Capacity Analysis Rerouting Cargo/Hinterland Analysis Change in Shipbuilding Practices
Monitoring Manufacturing Centroid
Summary Better understanding of port “gateways” lead to
better decisions over port improvement projects Better predictions of viability and container volume
on inland system Systems approach Acceptability and Transparency

Questions? Kevin Knight Institute for Water Resources US Corps of Engineers 7701 Telegraph Road, Casey Building Alexandria, VA 22315 Ph: 1-703-428-7250 [email protected]
28