Embed Size (px)
DESCRIPTION
Challenges in Business Analytics An industrial research perspective 30 October 2008. Eleni Pratsini IBM Zurich Research Laboratory. Alexis Tsoukiàs LAMSADE-CNRS, Université Paris Dauphine. Fred Roberts DIMACS, Rutgers University. 1945 1 st IBM Research Lab in NY (Columbia U). Watson. - PowerPoint PPT Presentation
Citation preview

Zurich Research Lab
© Copyright IBM Corporation 2005
Challenges in Business AnalyticsAn industrial research perspective
30 October 2008 Eleni Pratsini
IBM Zurich Research Laboratory
Alexis Tsoukiàs LAMSADE-CNRS, Université Paris Dauphine
Fred Roberts DIMACS, Rutgers University

2 Challenges in Business Analytics; An industrial research perspective 30 October 2008
60 Years of IBM Research The Sun Never Sets at IBM Research
1945 1st IBM Research Lab
in NY (Columbia U)
Established: 1995Employees: 40
Established: 1972Employees: 500
Established: 1982Employees: 200
Established: 1961Employees: 1750
Established: 1998Employees: 60
ZürichBeijing
AustinDelhi
Tokyo
Established: 1956Employees: 300 Established: 1995
Employees: 90
1952San JoseCalifornia
Established: 1986Employees: 500
AlmadenWatson
Haifa

3 Challenges in Business Analytics; An industrial research perspective 30 October 2008
Evolution of Role
Corporate funded research agenda
Technology transfer
Centrally funded
1970's 1980's 1990's 2000's
Collaborative team
Shared agenda
Effectiveness
Joint programs
Work on client problems
Research in the marketplace
Create business advantage for clients
Industry-focused research
On Demand Business Research
Work on client-specific technology, business problems

4 Challenges in Business Analytics; An industrial research perspective 30 October 2008
What is Science?
Science is looking for the black cat in a black room …

5 Challenges in Business Analytics; An industrial research perspective 30 October 2008
Philosophy is looking for the black cat in a black room …
When there is none!
What is Philosophy?

6 Challenges in Business Analytics; An industrial research perspective 30 October 2008
Psychology is looking for the black cat in a black room …
When there is none!
What is Psychology?
And still finding it!!!

7 Challenges in Business Analytics; An industrial research perspective 30 October 2008
Overview
Business Environment need for analytics in a world of increasing complexity
Technical Challenges: Example from the Pharma Industry- Solution architecture- Data availability – a pleasure and a plague
quality, uncertainty, missing
- Prescriptive models depend on predictive models Optimization under uncertainty
Business Challenges- Client external projects- Client internal projects- Academic projects

8 Challenges in Business Analytics; An industrial research perspective 30 October 2008
Business Environment
We live in a highly constrained resource world
Rapidly reaching capacity for many resources- natural, infrastructure, human
Study: What do you see as the primary business challenges currently affecting your organization?- Improving operational effectiveness
• Analytics are essential to address the constrained resources challenge. The historical barriers to the use of analytics are rapidly disappearing, enabling us to tackle complex high-value problems.

9 Challenges in Business Analytics; An industrial research perspective
Analytics Landscape
Degree of Complexity
Com
petit
ive
Adv
anta
ge
Standard Reporting
Ad hoc reporting
Query/drill down
Alerts
Forecasting
Simulation
Predictive modeling
Optimization
What exactly is the problem?
How can we achieve the best outcome?
What will happen next?
What will happen if … ?
What if these trends continue?
What actions are needed?
How many, how often, where?
What happened?
Based on: Competing on Analytics, Davenport and Harris, 2007
Reporting
Analytics
Stochastic OptimizationHow can we achieve the best outcome including the effects of variability?

10 Challenges in Business Analytics; An industrial research perspective
Analytics Landscape
Degree of Complexity
Com
petit
ive
Adv
anta
ge
Standard Reporting
Ad hoc reporting
Query/drill down
Alerts
Forecasting
Simulation
Predictive modeling
Optimization
What exactly is the problem?
How can we achieve the best outcome?
What will happen next?
What will happen if … ?
What if these trends continue?
What actions are needed?
How many, how often, where?
What happened?
Based on: Competing on Analytics, Davenport and Harris, 2007
Descriptive
Prescriptive
Predictive
Stochastic OptimizationHow can we achieve the best outcome including the effects of variability?

11 Challenges in Business Analytics; An industrial research perspective 30 October 2008
Challenges in a world of increasing complexity
Advances in computer power bring capabilities (and expectations) for solving larger problem sizes- Problem decomposition not always obvious- Sequential optimization- Exact vs approximate solution or mixed- Hybrid methods
Information Explosion- There is a lot of data (too much!) but how about data quality?
Not enough of the “right” data Missing values Outdated information
- Data in multiple formats
Can our optimization models handle the information?

12 Challenges in Business Analytics; An industrial research perspective 30 October 2008

13 Challenges in Business Analytics; An industrial research perspective 30 October 2008
Where do we start?
14 Challenges in Business Analytics; An industrial research perspective 30 October 2008
Overview
Business Environment need for analytics in a world of increasing complexity
Technical Challenges: Example from the Pharma Industry- Solution architecture- Data availability – a pleasure and a plague
quality, uncertainty, missing
- Prescriptive models depend on predictive models Optimization under uncertainty
Business Challenges- Client external projects- Client internal projects- Academic projects

15 Challenges in Business Analytics; An industrial research perspective 30 October 2008
Example: Risk Based Approach to Manufacturing
Post-Marketing Adverse Event Reports
156,477
191,865212,843
247,604
278,143 266,991
286,755
0
150,000
300,000
1995 1996 1997 1998 1999 2000 2001
Calendar yearN
umbe
r
‘FDA’s GMPs for the 21st Century – A Risk-Based Approach’
- Manage risk to patient safety – “Critical to Quality”- Apply science in development and manufacturing - Adopt systems thinking – build quality in
*Horowitz D.J. Risk-based approaches for GMP programs, PQRI Risk management Workshop, February 2005

16 30 October 2008Challenges in Business Analytics; An industrial research perspective 16
Risk Management and Optimization
Using company’s knowledge, industry expertise and industry guidelines & regulations we identify the sources of risk that need to be considered in the analysis.
Based on historical data, industry expertise and other sources of causal relationships, we set the causal link strengths (conditional probabilities) and develop a model for risk quantification
Given the risk values, financial and physical considerations, we determine the best sequence of corrective actions for minimizing exposure to risk and optimizing a given performance metric.
Phase 1: Identify Risk Sources Phase 2: Quantify Risk Values Phase 3: Optimal Transformation
client
data
experts
industry
ekjjke
ep jpjepe
jpjepje
jpjepje
jpjepe RRiskTXX
,,,jkeCRRevCTCRev
j
pjeX 1 ep,
k
jkeY 1 ejp ,,
k p
pjejke XY ej,
p
pjeX jepj CAPa ej,
pjek
jkepjkepje XYRisk Haz ejp ,,
pjepje TX ejp ,,
pjeipjepje TXX 1 ejp ,,
j
pjeT 1 ep,
11 pjepje XT ejp ,,
jkejkejke RYY 1 ekj ,,
1 jkejke YY
jkejke RY
1/0,,,,0 RTYXRisk
ekj ,,
ekj ,,
0 2000 4000 6000 8000 10000 12000 14000 16000 18000clientRevenue at Risk as a percentage of Revenue
1.6%7%
9.7%6.4%
11%10.6%
5.3%1%1%1.3%
CAPE BLST 4
CAPE CRD 1
CAPE PCH 1
CAPE PTCH 1
CAPE BOT 1
CAPE BOT 2
CAPE BOT 3
CAPE VIAL 1
CAPE VIAL 2
CAPE VIAL 3
industry /experts

17 Challenges in Business Analytics; An industrial research perspective 30 October 2008
Definition of “Risk”
Fitness for Use- Quality: product conforms to specifications- Efficacy: ensures product has a positive effect (drugs treats a
patient)- Safety: end product is not harmful (patient does not suffer
from fatal side effects)
Compliance: failure to comply with regulations (quality, efficacy and safety not fully under control), e.g. lack of documentation

18 Challenges in Business Analytics; An industrial research perspective 30 October 2008
Risk: Three sources of hazards
Products: Traditional focus; Based on portfolio analysis- product is unstable or contaminated
Technologies: some technologies may not be appropriate given risk they create. - a new blender does not work well and the
mixing is not done properly
Systems: basis for regulatory inspection. Create transfer risks between product profile classes. Systems capabilities & technologies.- a biotech product is developed and there is
no control of the specification of its components

19 30 October 2008Challenges in Business Analytics; An industrial research perspective 19
Refactoring
Model
Data Collection
Routemap
Envisioning supported by Re-factoring model
Products
Systems
Technology
Define Scenarios Product/AssetConfiguration
Implementation Strategy
Review Cost base of
Sites Collect key data
Establish Risk Profile
Assess readiness for change
Test scenarios:Prioritise on impact on
Revenue Risk, and
Profitability
Adapt scenarios Optimise route-map for implementationbased on Impact on:
Revenue @ Riskprofile
Investment StrategyImpact of Change
Output
Input
1
3
4
2
Review route maps
select finalscenario options
Select scenarioDefine
implementation strategy
5
6
Input
Calculate Revenue
profileInput
Overview of Approach

20 30 October 2008Challenges in Business Analytics; An industrial research perspective 20
Refactoring
Model
Data Collection
Routemap
optimization model
Products
Systems
Technology
Define Scenarios Product/AssetConfiguration
Implementation Strategy
Review Cost base of
Sites Collect key data
Establish Risk Profile
Assess readiness for change
Test solution:Prioritise on impact on
Revenue Risk, and
Profitability
Adapt model
Output
Input
1
3
4
2
Review route maps
select finalsolution options
Define implementation
strategy
5
6
Input
Calculate Revenue
profile
Input
Overview of Approach

21 Challenges in Business Analytics; An industrial research perspective 30 October 2008
Effect of uncontrolled data collection
A pharmaceutical firm is assessing the risk of two of their sites: Country A and Country X. Engineers at both sites are asked to collect non-compliant and defective batches in the last two years. Analysis of the data indicates that site A has 50% more defective / non-compliant batches than site X. They deduce that they should move their manufacturing processes to X or drastically change their operations at A.
Just before launching an audit of their site A, they receive a letter from the FDA mentioning many recalls of batches all coming from site X.
Further investigation indicates that site X does not report the many defects they notice every week and they are indeed more risky.
Lack of observations does not mean no events; it means no reporting of events
Extract knowledge from non statistical sources, e.g. experts

22 Challenges in Business Analytics; An industrial research perspective 30 October 2008
Technology, product and system failure are all linked via common root causes. The risk model starts from building a dependency graph of all these root causes.
Cause Effect Analysis industry Expertise
Client Constraints
Past Experiences
Different sub-models created:• Dosage form variability• Employee execution• Process control• Technology level

23 Challenges in Business Analytics; An industrial research perspective 30 October 2008
Employee Ability to Execute Sub-model
Directly linked to GMPs. Example events: reporting not done properly, quality control protocol not implemented, etc.

24 Challenges in Business Analytics; An industrial research perspective 30 October 2008
Elicitation of Expert Opinion - Challenges
Network parameters can be estimated from data and manual entry of probabilities.
Using expert knowledge in Bayesian networks can be an intractable task due to the large number of probabilities that need to be elicited
We need an elicitation method that is fast and gives not only a probability but also a
confidence in the probability
an aggregation method for combining the elicitated probabilities taking into account the experts’ confidence in their assessments
A probability estimation method to reduce the number of probabilities to elicit in a noisy MAX node

25 Challenges in Business Analytics; An industrial research perspective 30 October 2008
Elicitation / Aggregation / Estimation

26 30 October 2008Challenges in Business Analytics; An industrial research perspective 26
Based on location, technologies or any previously identified components involved in the drug production process, the network model computes an estimate of the quality risk. Changing the way a drug is produced will (a priori) induce a change in the quality risk estimate.
Site A
Site B
Quality failure: 2.4%
Quality failure: 1.9%
Optimization model

27 Challenges in Business Analytics; An industrial research perspective 30 October 2008
Risk Exposure
Performance measure for exposure to risk:
(Insurance premium)
Risk value:
j
pjepe RiskskRevenue@ri peRevenue
k
pjejkepje XYRisk pjkeHaz

28 Challenges in Business Analytics; An industrial research perspective 30 October 2008
Formulation
MAX
ekjjke
ep jpjepe
jpjepje
jpjepje
jpjepe RRiskTXX
,,,jkeCRRevCTCRev
ST
j
pjeX 1 ep,
k
jkeY 1 ejp ,,
k p
pjejke XY ej,
p
pjeX jepj CAPa ej,
pjek
jkepjkepje XYRisk Haz ejp ,,
pjepje TX ejp ,,
pjeipjepje TXX 1 ejp ,,
j
pjeT 1 ep,
11 pjepje XT ejp ,,
jkejkejke RYY 1 ekj ,,
1 jkejke YY
jkejke RY
1/0,,,,0 RTYXRisk
Transfer
Remediation
Capacity, Risk
State, Level
ekj ,,
ekj ,,
29 Challenges in Business Analytics; An industrial research perspective 30 October 2008
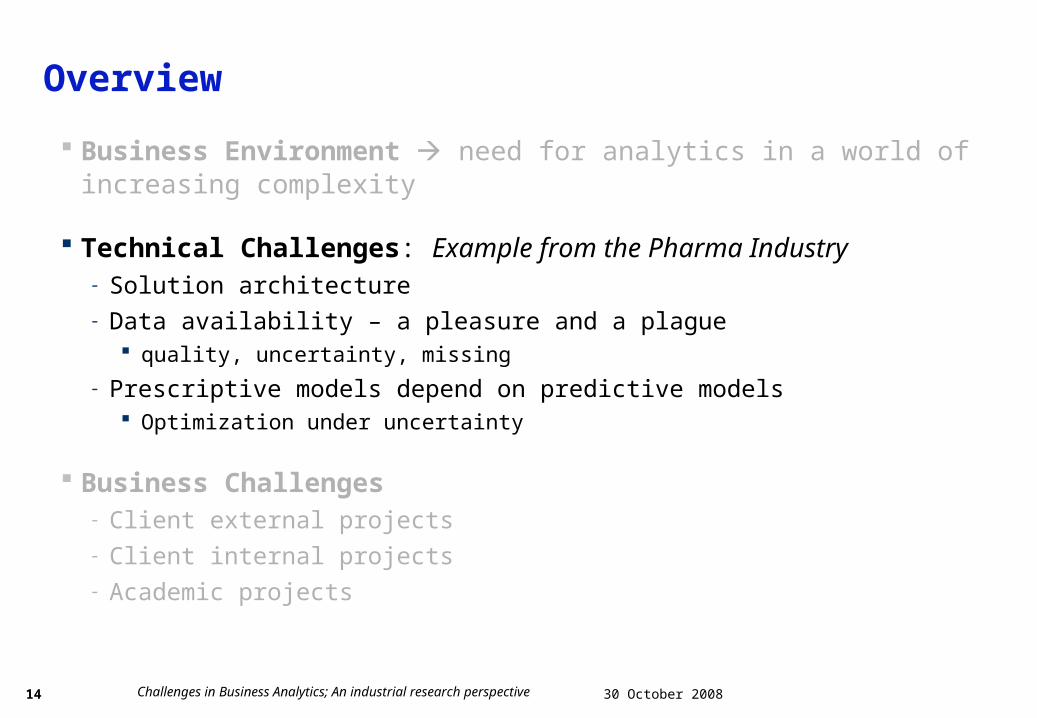
17 product families 3 systems plus one for subcontracting 14 technology platforms – most available in all systems Planning horizon: 5 years split into 10 periods of 6 months Restriction on rate of change Statistical analysis gave risk values based on historical data Revenue projections available Aggregated costs per scenario – later disaggregated Simulation of given scenarios (ending result); optimization
Problem characteristics

30 Challenges in Business Analytics; An industrial research perspective 30 October 2008
Work center Current Scenario XTech 1Tech 2Tech 3Tech 4 Site BTech 5Tech 6 Site ATech 7Tech 8Tech 9Tech 10Tech 11Tech 12Tech 13Tech 14 Site D
2005 2006 2007 2008
Site B
Site C
Site B
2009
Site C
Site A
Site C
Site A / Site C
Site A
Example Analysis
Va
lue
s in 1
0^ -4
Values in Thousands
0.0000.5001.0001.5002.0002.5003.0003.5004.0004.500
Mean=
3 5 7 9 113 5 7 9 11
5% 90% 5% 5.7013 8.625
Mean=7208
Optimal sequence of actions for minimizing risk exposure
ii
i prevE )(exposure
)p(prev)(prev)Var( iii
iii
i 1var 22exposureRevenue@risk distributions
0 5000 10000 15000 20000
Revenue@risk
Den
sit
y Scenario 1
Scenario 2
As Is
Fully Opt
Calculate Business Exposure
Scenario Comparison

31 Challenges in Business Analytics; An industrial research perspective 30 October 2008

32 Challenges in Business Analytics; An industrial research perspective 30 October 2008
Data Variability
The consideration of the frequency distribution of each solution is essential when there is uncertainty in the input parameters
Robust Optimization techniques to determine the solution that is optimal under most realizations of the uncertain parameters
Which Solution / Plan is be tte r?
0 2000 4000 6000 8000 10000 12000 14000 16000
Rev@ Risk
fre
qu
en
cy
dis
trib
uti
on
Plan A
Plan B
6200
= 4300
= 3900
area = 5%
area = 20%
Which Solution / Plan is be tte r?
0 2000 4000 6000 8000 10000 12000 14000 16000
Rev@ Risk
fre
qu
en
cy
dis
trib
uti
on
Plan A
Plan B
Which Solution / Plan is be tte r?
0 2000 4000 6000 8000 10000 12000 14000 16000
Rev@ Risk
fre
qu
en
cy
dis
trib
uti
on
Plan A
Plan B
6200
= 4300
= 3900
area = 5%
area = 20%

33 Challenges in Business Analytics; An industrial research perspective 30 October 2008
Possible Approaches
Stochastic Programming- Average Value certainty equivalent- Chance constraints (known CDF – continuous)
Robust Optimization- Soyster (1973)- Bertsimas & Sim (2004)
CVaR - Rockafeller & Uryasev (2000)

34 Challenges in Business Analytics; An industrial research perspective 30 October 2008
Modeling with the approach of Bertsimas and Sim
Formulation adjusted to incorporate a constraint that could be violated with a certain probability:
Uncertain parameters have unknown but symmetric distributions Uncertain parameters take values in bounded intervals:
Uncertain parameters are independent
estpx
epx
)Rev@Risk(x
fit(x)SecuredPro
estp
stestp
,,, }1,0{
, 1
valuecritical s.t.
max
,,,
,,,,
E Xx
es,t,es,t,es,t,es,t, H + H ; H-H ˆˆes,t,Haz

35 Challenges in Business Analytics; An industrial research perspective 30 October 2008
Bertsimas & Sim cont’d
Provided guarantee:
value critical)Rev@Risk(Pr x
Example Values of Γ:
1
2n1
n
n
l
l 1
n
n total number of uncertain parameters , n
2
,

36 Challenges in Business Analytics; An industrial research perspective 30 October 2008
Application to pharma example
Robust Formulation:
0
,,0
,,0
}1,0{
,1
,,
,,
ˆ
max
,,
,,
,,,
,,,,,,,
,,,,
Z
estY
estV
estpX
epX
estYXY
estYVZ
VZX
est
est
estp
stestp
estp
estpest
estest
t,s,ep,t,s,e
,,,
HRev
value critical Rev s.t.
,,,,
es,t,ep,
es,t,p, es,t,ep,es,t, ++H
fitSecuredPro )(E xXx

37 Challenges in Business Analytics; An industrial research perspective 30 October 2008
Results!

38 Challenges in Business Analytics; An industrial research perspective 30 October 2008
Observations
Provides solutions that are much more conservative than expected
Plans satisfying risk requirement are discarded by the optimization - suboptimal solutions
Adjustments to calculation of parameters to improve results- Extreme distribution - Consider the number of expected basic variables and not the
total number of variables affected by uncertain coefficients e.g. production of 100 products, 3 possible sites, uncertainty in
capacity absorption coefficient:- 300 possible variables (value of n)
- each product can only be produced on one site i.e. only 100 variables > 0 (use this value for the calculation of Γ)
value critical)Rev@Risk(Pr x

39 Challenges in Business Analytics; An industrial research perspective 30 October 2008
Bertsimas & Sim approach
Production – Distribution
continuous variables
Pharma Regulatory Risk
binary variables

40 Challenges in Business Analytics; An industrial research perspective 30 October 2008
Related work
Robust optimization Models for Network-based Resource Allocation Problems, Prof. Cynthia Barnhart, MIT- Robust Aircraft Maintenance Routing (RAMR) minimizing expected
propagated delay to get schedule back on track (taken from Ian, Clarke and Barnhart, 2005) Among multiple optimal solutions, no incentive to pick the solution with “highest”
slack Relationship of Γ (per constraint) to overall solution robustness?
- Comparison with Chance constrained Programming Explicitly differentiates solutions with different levels of slack Extended Chance Constrained Programming
- Introduce a “budget” constraint setting an upper bound on acceptable delay
- Improved results

41 Challenges in Business Analytics; An industrial research perspective 30 October 2008
Value at Risk & Conditional Value at Risk
VaR Maximum loss with a specified
confidence level- Non sub-additive- Non-convex
Density of f (x)
-Quantile
1-
CVaR
-Quantile αβ(x) (=95%)
E [ f (x) | f (x) > αβ(x)]
Advantages- Sub-additive- Convex
Density of f (x)
CVaR(x)
αβ(x)

42 Challenges in Business Analytics; An industrial research perspective 30 October 2008
CVaR in Math Programming: Linear Program with Random Coefficients
CVaR can be used to ensure 'robustness' in the stochastic
constraint:
Min
CVaR ( )
T
T b
c x
x
Dx d, x 0
Consider a LP where, coefficient vector, is random:
Min
T
T b
c x
x
Dx d, x 0

43 Challenges in Business Analytics; An industrial research perspective 30 October 2008
Reformulation of Rockafellar & Uryasev (2000)
Good news: Fully linear reformulation, so presentable to any LP solver Bad news: New variables, and New constraints = O (Number of Samples)
- Reformulated LP has grown in both dimensions!- Large number of CVaR constraints & large number of samples => Very Large
LP
1
Each CVaR expression, say a constraint:
CVaR ( )
is reformulated as:
1 ( )
(1 )
: sample of random vector
(out of N total samples)
T
NTi
i
thi
b
t t bN
i
x
x -
1
1
(1 )
0
N
ii
Ti i
i
t z bN
z t
z
x -
Linear ReformulationReformulation

44 Challenges in Business Analytics; An industrial research perspective 30 October 2008
Observations
Number of scenarios necessary for a good estimation of CVaR(α, x) and thus meaningful results?
>20,000 scenarios necessary for stable results (Kuenzi–Bay A. and J. Mayer. ”Computational aspects of minimizing conditional value–at–risk”,NCCR FINRISK Working Paper No. 211, 2005).
Can handle up to 300 scenarios – computational complexity

45 Challenges in Business Analytics; An industrial research perspective 30 October 2008
Recent advances in CVaR
Kunzi-Bay & Mayer (2006) presented a 2-stage interpretation if CVaR appears only in the Objective Function & their algorithm CVaRMin led to an order of magnitude speed-up
Interesting work on Robust Optimization techniques & CVaR David B. Brown, Duke University:
- Risk and Robust Optimization (presentation)- Constructing uncertainty sets for robust linear optimization (with Bertsimas)- Theory and Applications of Robust Optimization (with Bertsimas and Caramanis)
P. Huang and D. Subramanian. ”Iterative Estimation Maximization for Stochastic Programs with Conditional-Value-at-Risk Constraints”. IBM Technical Report, RC24535, 2008
-They exploit a different linear reformulation, motivated by Order Statistics, and this leads to a new and efficient algorithm.-The resulting algorithm addresses CVaR in both the Objective Function, as well as Constraints

46 Challenges in Business Analytics; An industrial research perspective 30 October 2008
Overview
Business Environment need for analytics in a world of increasing complexity
Technical Challenges: Example from the Pharma Industry- Solution architecture- Data availability – a pleasure and a plague
quality, uncertainty, missing
- Prescriptive models depend on predictive models Optimization under uncertainty
Business Challenges- Client external projects- Client internal projects- Academic projects
47 Challenges in Business Analytics; An industrial research perspective 30 October 2008
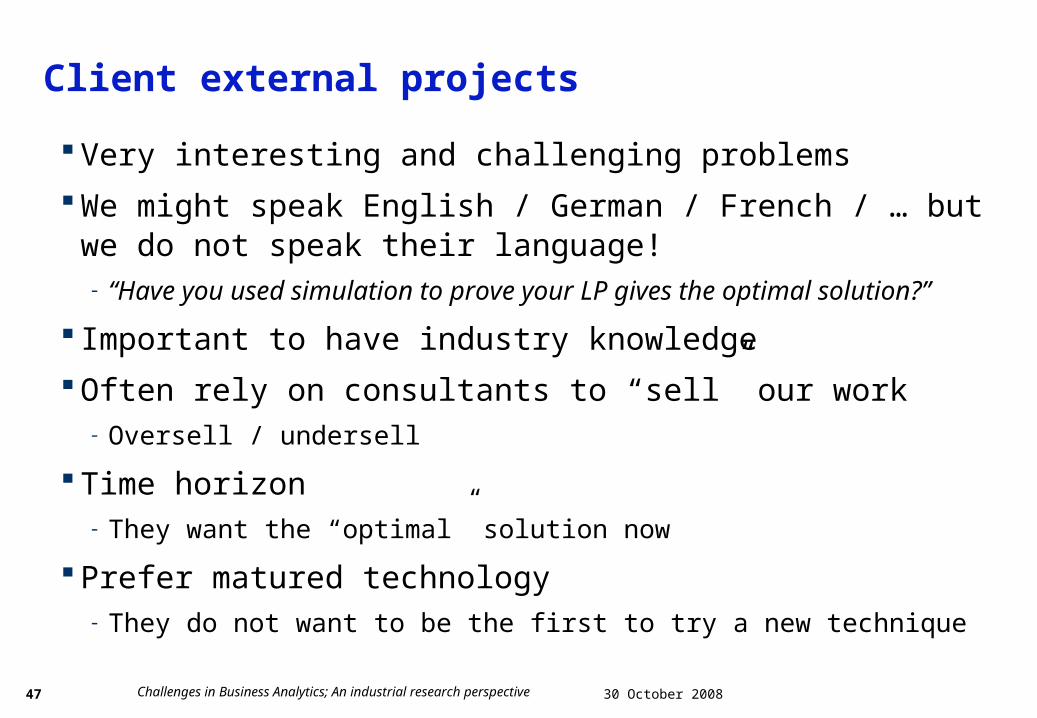
Client external projects
Very interesting and challenging problems
We might speak English / German / French / … but we do not speak their language! - “Have you used simulation to prove your LP gives the optimal solution?”
Important to have industry knowledge
Often rely on consultants to “sell” our work- Oversell / undersell
Time horizon- They want the “optimal” solution now
Prefer matured technology- They do not want to be the first to try a new technique

48 Challenges in Business Analytics; An industrial research perspective 30 October 2008
*http://xkcd.com/
All they need is a simple solution …
The fastest traveling salesman solution
49 Challenges in Business Analytics; An industrial research perspective 30 October 2008
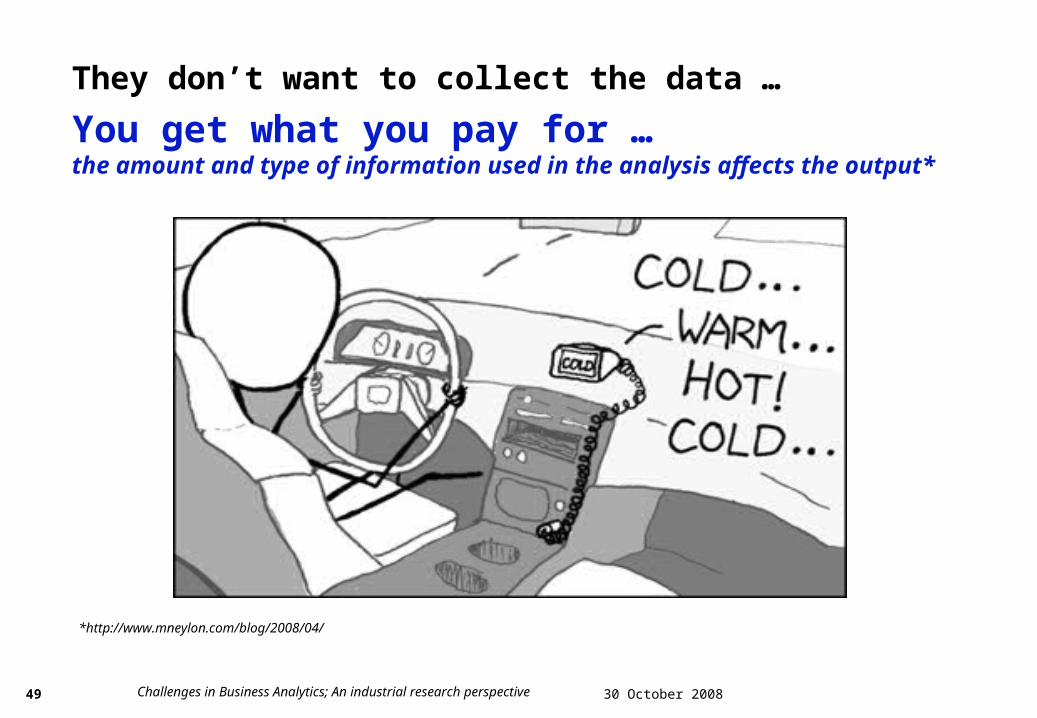
You get what you pay for …the amount and type of information used in the analysis affects the output*
*http://www.mneylon.com/blog/2008/04/
They don’t want to collect the data …

50 Challenges in Business Analytics; An industrial research perspective 30 October 2008
Client internal projects
Interesting real life application and client eager to use advanced analytics, often deal with very technical business partners so we understand each other
Limited in scope - often consider a small aspect of the whole problem
Medium time horizon- Usually 1 year but often continues for 2 or more years
Internal politics!

51 Challenges in Business Analytics; An industrial research perspective 30 October 2008
Academic projects
Life is good!! Academic collaborations:
- Often “killed” by the lawyers because of IP (dis)agreement
It does not pay the bills!!

52 Challenges in Business Analytics; An industrial research perspective 30 October 2008
Due to the current financial crisis we decided to enter the field of financial mathematics …

53 Challenges in Business Analytics; An industrial research perspective 30 October 2008

54 Challenges in Business Analytics; An industrial research perspective 30 October 2008
Introduce Decision Theoretic / AI approaches to tackle Business Optimization problems*
Decision Theoretic methods of concensus- Combining partial information to reach decisions
Algorithmic decision theory- Sequential decision making models and algorithms- Graphical models for decision making- AI and computer-based reasoning systems- Information management: representation and elicitation
Aggregation
- Decision making under uncertainty or in the presence of partial information
*Computer Science and Decision Theory, Fred Roberts, DIMACS Center, Rutgers University

55 Challenges in Business Analytics; An industrial research perspective 30 October 2008
56 Challenges in Business Analytics; An industrial research perspective 30 October 2008

57 Challenges in Business Analytics; An industrial research perspective 30 October 2008
• Background Bcp (a paralle l CO IN-O R M ILP
code) (Cbc-)Bonm in (our seria l M INLP
code) Nature of B ranching m ethods M INLP m odel size (sm all) NLP re-solves (slow) Architecture of B lueG ene (little
m em ory per node)• Bcp-Bonm in
(Cbc-)Bonm in’s B&B ported to Bcp fram ework
Running on B lueG ene w ith access from AM PL
Paralle l M INLP

58 Challenges in Business Analytics; An industrial research perspective 30 October 2008