Embed Size (px)
Citation preview
Challenges ForThe Marine Transportation System
Captain David B. Captain David B. MacFarlandMacFarland

The MARINE TRANSPORTATION SYSTEMThe Nation’s network of oceans, lakes, rivers, canals, locks and dams
• 95,000 miles of U.S. coastline
• 25,000 miles of navigable channels
• 326 public/private ports, 3700 marine terminals
• Supports 13M jobs, contributes $718B to U.S. GDPSupports 13M jobs, contributes $718B to U.S. GDP
• 78% of foreign trade in/out of U.S. by ship78% of foreign trade in/out of U.S. by ship
• 78M recreational boaters; 78M recreational boaters; $26B spent in FY00 for $26B spent in FY00 for boatersboaters
• Every U.S. citizen relies on the MTS:Every U.S. citizen relies on the MTS: energy delivery, energy delivery, exports, transportation, cost-effective consumer goods, exports, transportation, cost-effective consumer goods, recreation, environmental protectionrecreation, environmental protection
U.S. Coast Guard

TagHeuer Watch - Swiss made Imported Port of NY/NJ
Salomon SnowBlades Made
in France Imported Port of Philadelphia
Renault toy car Made in Taiwan Imported Port of
LA/Long Beach
Canon Ixus Made in
Japan Imported
Port of Tacoma
Brought to you courtesy of the U.S. Marine Transportation System
From Renault advertisement
Everyone depends on the MTS for
something… food, work or play!
BMW 3 Series Made in Germany Imported Port of Baltimore
Puma Running Shoes Made in China Imported Port of New Orleans

Shipping is the cheapest and most environmentally friendly form of transport
Challenge:
Uninterrupted delivery to meet increasing needs
Oil [Crude and Finished]
•2000 Imports 4B barrels
•2000 Exports 379M barrels
•2000 U.S. Transship’d 2.6B barrels
Total 7B Barrels
Liquid Natural Gas•1999 Imports 217.9 BCF
•1999 Exports 167.3 BCF
Total 385.2BCF
Coal•2000 Imports 11M tons
•2000 Exports 58M tons
•2000 U.S. Transship’d 218M tons
Total 287M tonsNOAA
Energy Transportation

U.S. Depends on Uninterrupted Flow of Goods
and Energy Products that Fuel A Nation
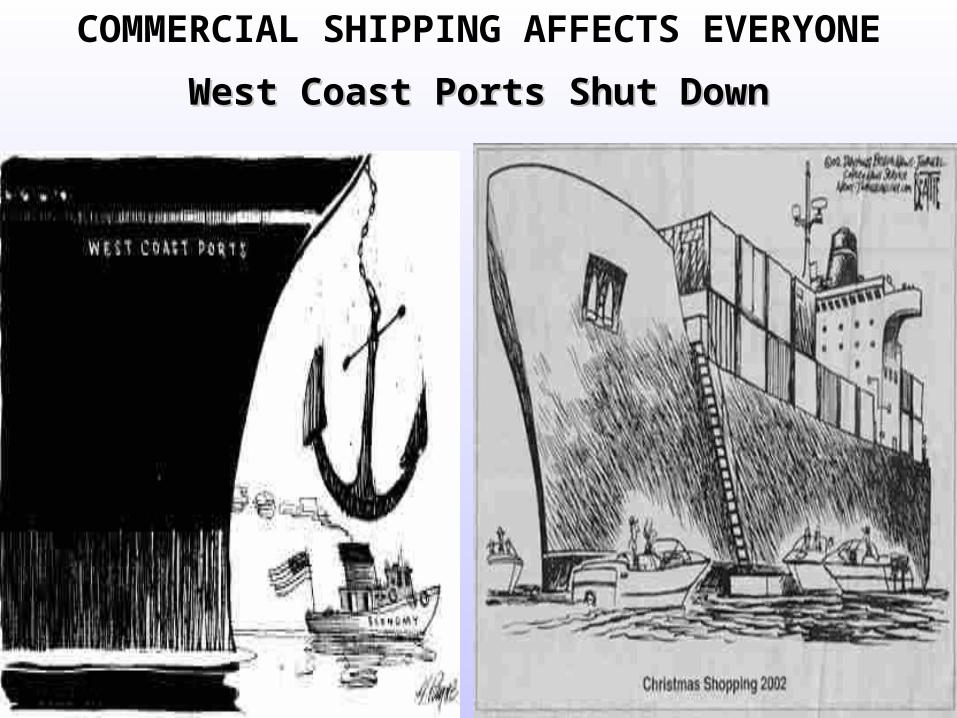
COMMERCIAL SHIPPING AFFECTS EVERYONEWest Coast Ports Shut DownWest Coast Ports Shut Down

Critical MTS Issues
’99 Report to Congress: An Assessment of the U.S. Marine Transportation System
Critical MTS Issues • ECONOMY – total volume
of maritime trade will more than DOUBLE in 20 years
• INFRASTRUCTURE – Crumbling, undersized, aging; compromises safety
• TRAFFIC – More ships, more CONGESTION
• SECURITY – fewer overseas bases … rely on deployment• Homeland Security
PortsU.S. Coast Guard

• SAFETY – 3500 commercial shipping accidents annually on U.S. waterways, 6500 recreational
• HAZMAT – over 50% cargo is oil or hazardous material
• ENVIRONMENT – Increased Stress Dredging, Port expansion
St. P
etersburg Tim
es
NO
AA
Critical MTS Issues

Data Needs:Critical Underkeel Clearance Issues require more accurate information
1’ of draft =
$3M in autos
$100K in coal

EMISSIONS PRODUCED
Pollutants (in pounds) produced in moving one ton of cargo 1,000 miles
Towboat Train Truck
Hydro-Carbon
.09 .46 .63
CarbonMonoxide
.20 .64 1.90
NitrousOxide
.53 1.83 10.17
Source: Environmental Advantages of Inland Barge Transportation, DOT MARAD, 1994
TRANSPORTATION MODE COMPARISON –
ENERGY/ENVIRONMENT EFFICIENCY

Container Ship EvolutionContainer Ship Evolution

0 60 1200 60 120
Source: Containerisation International Yearbook, 2000Source: Containerisation International Yearbook, 2000
Number of OrdersNumber of OrdersVessel SizeVessel Size
<1000 TEUs<1000 TEUs
1,000 - 1,999 TEUs1,000 - 1,999 TEUs
2 , 0 0 0 - 2 , 9 9 9 T E U s2 , 0 0 0 - 2 , 9 9 9 T E U s
3,000 - 3,900 TEUs3 , 0 0 0 - 3 , 9 0 0 T E U s
5 , 0 0 0 + T E U s5 , 0 0 0 + T E U s6 2 % “ M e g a S h i p s ” 6 2 % “ M e g a S h i p s ”
4 , 0 0 0 - 4 , 9 0 0 T E U s4 , 0 0 0 - 4 , 9 0 0 T E U s
167 Vessels on Order
167 Vessels on Order
2000 New Build OrdersExpansion of World Post-Panamax Container
Fleet
2000 New Build OrdersExpansion of World Post-Panamax Container
Fleet

L.O.A. = 400 m (1,312 ft.)Draft = 14 m (46 ft.)L.O.A. = 400 m (1,312 ft.)Draft = 14 m (46 ft.)BEAM = 69 m (226 ft.)BEAM = 69 m (226 ft.)
15,000 TEU Containership15,000 TEU Containership

MEGA SHIPSMEGA SHIPS
Cruise IndustryCruise Industry
$11B 1997 $18B 2000$11B 1997 $18B 20008+% Annual Growth8+% Annual Growth
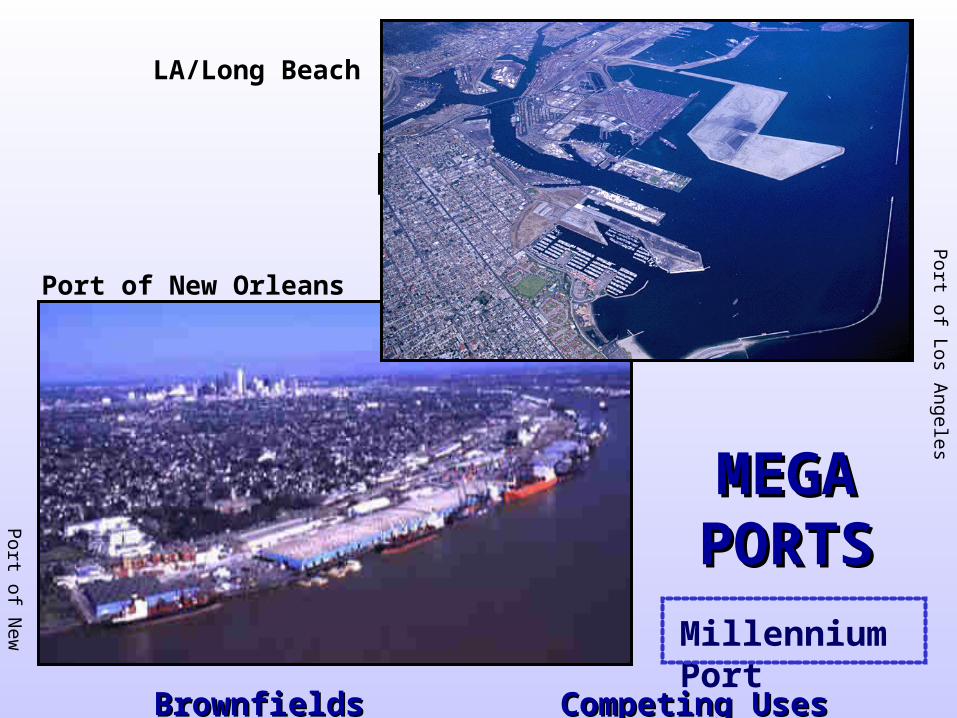
Mega Ports
MEGA MEGA PORTSPORTS
LA/Long Beach
Port of New Orleans
Millennium Port
Port of L
os Angeles
Po rt of N
ew O
rleans
BrownfieldsBrownfields Competing UsesCompeting Uses

San Pedro Bay Ports Cargo Growth Implications
• At current growth and per acre productivity, 9,400 new acres of container terminal will be required by 2020
• Current POLB/POLA container terminal acreage = 1,880 acres
• By 2010, the POLB/POLA will require over 5000 new acres dedicated to containers
• By 2020, a 6,800 acre shortfall !

China Shipping – 9800 TEUS!
CHINA SHIPPING HAS 33 VESSELS ON ORDER… 3 ARE 9800 TEU for TRANSIT FROM FAR EAST
TO U.S. WEST COAST
CO
SC
O photo

COSCO’s 9800 TEU Vessel = 4900 Trucks
Traveling at 60 MPH, that’s a line of trucks stretching over 320 miles down the
highway!

Overseas Inland Trade: Truck Trafficon U.S. Highway Network, 2020 (Tons)
with Transshipment Routes

Mega Problems
MEGA PROBLEMSMEGA PROBLEMS
The QE2
Tug Mauvilla
Jessica -- Galapagos
Nat
iona
l Tra
nspo
rtat
ion
Saf
ety
Boa
rdR
icardo Mazalan/A
P

MEGA PROBLEMSMEGA PROBLEMSU
.S.
Coa
st G
ua
rd
NO
AA
Nat
ion
al T
ran
spo
rta
tion
Sa
fety
B
oard

U.S. Coast Guard
Houston Ship Channel: The Texas Chicken

Port of Houston -
•Direct costs for deep-sea vessels delayed due to fog est’d at $4.9M in 2000
•One petrochemical company est’d total ancillary costs at $30-40M 1st Qtr 2001
HOUSTON. Feb 27 2001 (Reuters) – Fog closed the Houston Ship Channel to inbound traffic again on Tuesday… Earlier this month fog led to long delays for vessels using the channel, causing a backlog of almost 80 ships at one point…
NOAA
Houston Ship Channel: a frequent condition

““Accurate Positioning Key to Safe Navigation”Accurate Positioning Key to Safe Navigation”
NOAA GPSNOAA GPS
Continuously Operated Reference SystemContinuously Operated Reference System

NOAA’s Navigation Services: Surveying

WRECKS AND OBSTRUCTIONS

ELECTRONIC NAVIGATIONAL CHARTSELECTRONIC NAVIGATIONAL CHARTSAvailable for Free on the Internet (400,000 in first 2 years) 1,800,000 last year
Reduce transportation delays with low visibility navigation
Available for Free on the Internet (400,000 in first 2 years) 1,800,000 last year
Reduce transportation delays with low visibility navigation

Air GapAir Gap
PORTSPORTS®® Water Levels, Currents, Winds, Salinity, (Visibility)Water Levels, Currents, Winds, Salinity, (Visibility)

MARINE WEATHER FORECASTS
Issues marine warnings and forecasts
Continually monitors and analyzes maritime data
Provides guidance of marine atmospheric variables

Spill Trajectory Modeling – Contingency Planning
700+ hazardous waste sites contaminate our coasts
2M gallons of oil spilt a year from marine accidents
Spill Management
Hazmat spill prevention and response

NOAA
•PORTS®
•ENC’s, Nautical Charts
•Marine Weather Forecasts
•Accurate GPS Positioning
•Hydrographic Surveys
•Hazmat Cleanup
U.S. Coast Guard•Vessel Traffic Management
•Aids to Navigation
•Notices to Mariners
•Law Enforcement
•Automatic Identification System
Army Corps of Engineers•Channel Maintenance
•Dredging
•Lock and Dam Repair
EPA•Dredged Material Use
•Invasive Species
•Ballast Water
MARAD•Intermodal, Port Development
•Domestic Merchant Marine Fleet
•National Defense
•Shipbuilding
•US Merchant Marine Academy
Major MTS Players and Pieces:

A COMPLETE PICTURE
INTEGRATED MTS INFRASTRUCTURE