Embed Size (px)
Citation preview
Challenger Financial Services Group Limited and its controlled entities ACN 106 842 371
Interim Financial Report For the half-year ended 31 December 2006
Chal lenger F inanc ia l Serv ices Group L imited Inter im F inanc ia l Report
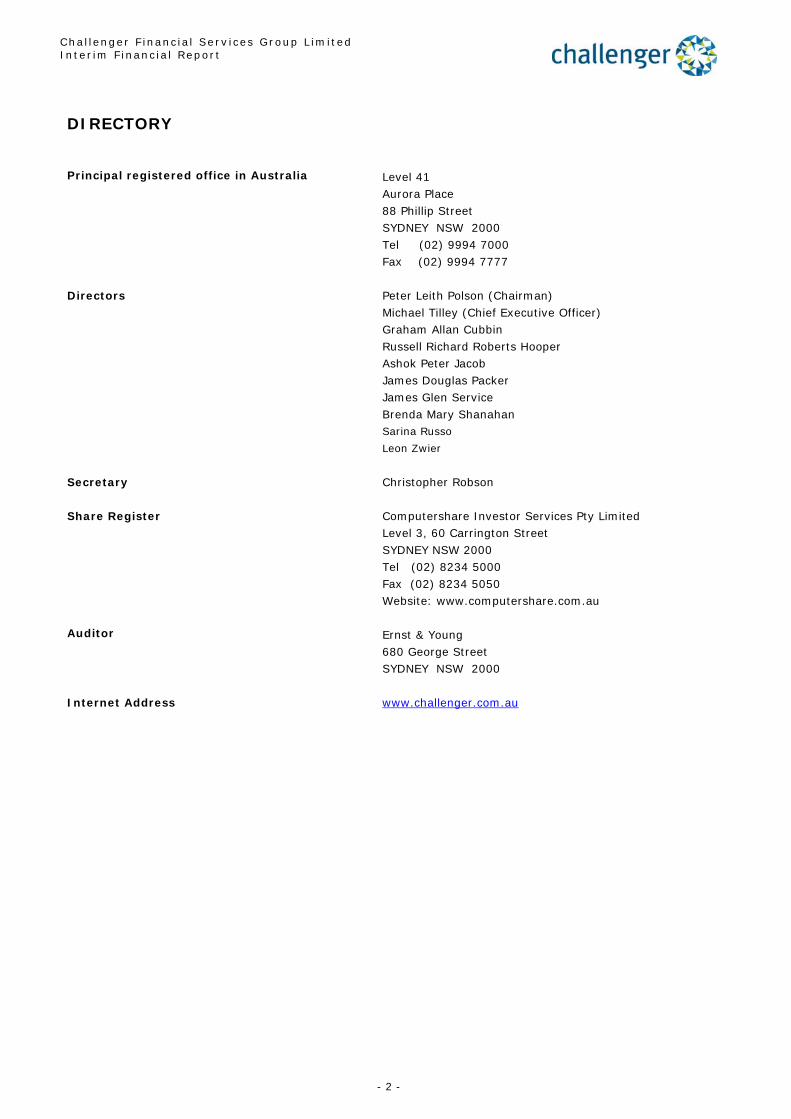
DIRECTORY
Level 41 Aurora Place 88 Phillip Street
Principal registered office in Australia
SYDNEY NSW 2000 Tel (02) 9994 7000 Fax (02) 9994 7777 Directors Peter Leith Polson (Chairman) Michael Tilley (Chief Executive Officer) Graham Allan Cubbin Russell Richard Roberts Hooper Ashok Peter Jacob James Douglas Packer James Glen Service Brenda Mary Shanahan Sarina Russo
Leon Zwier
Secretary Christopher Robson Share Register Computershare Investor Services Pty Limited Level 3, 60 Carrington Street SYDNEY NSW 2000 Tel (02) 8234 5000 Fax (02) 8234 5050 Website: www.computershare.com.au
Ernst & Young 680 George Street
Auditor
SYDNEY NSW 2000 Internet Address www.challenger.com.au
- 2 -

Chal lenger F inanc ia l Serv ices Group L imited Inter im F inanc ia l Report
Directors’ report The Directors of Challenger Financial Services Group Limited (‘the Company’) submit their report together with the financial report of the Company and its controlled entities (‘the Group’), for the half year ended 31 December 2006. 1. Directors The names and details of the Company’s Directors holding office during the half year and until the date of this report are as follows. Directors were in office for this entire period unless otherwise stated. Name Peter Leith Polson Independent Chairman Michael Tilley Chief Executive Officer Graham Allan Cubbin Non-Executive Director Russell Richard Roberts Hooper Non-Executive Director, Independent Ashok Peter Jacob Non-Executive Director James Douglas Packer Non-Executive Director James Glen Service Non-Executive Director, Independent Brenda Mary Shanahan Non-Executive Director, Independent Sarina Russo Non-Executive Director, Independent (appointed 15 September 2006) Leon Zwier Non-Executive Director, Independent (appointed 15 September 2006) 2. Review and results of the Group’s operations during the half year The consolidated net profit after tax for the six months ended 31 December 2006 attributable to the shareholders of the Company was $129.9 million compared with $60.2 million for the half year ended 31 December 2005, an increase of 115%. Total revenue increased 21% to $1,368.3 million compared to the half year ended 31 December 2005. Operating expenses increased by 16% to $1,158.9 million and basic earnings per share grew 111% to 23.7 cents compared to the half year ended 31 December 2005. On 29 November 2006, Challenger Life No.2 Limited, a 100% owned subsidiary within the Challenger Financial Services Group sold 39.3 million Challenger Infrastructure Fund (‘CIF’) Class A securities (16.3% of securities on issue) to a non-related third party. Key features of the transaction included:
• securities sold for $3.50 per unit for a total consideration of $138 million • the Group continued to hold 91 million securities in CIF (37.7% of securities on issue) post sale • the Group ceased to consolidate CIF resulting in the derecognition of $751.9 million in net assets
(including $1,030.3 million of goodwill) and the residual interest (91 million securities) is recorded as an infrastructure investment.
• Refer to Note 15 Acquisition and disposal of Controlled Entities for further details. 3. Dividends On 23 February 2007, the Directors of the Company declared an interim dividend on ordinary shares. The total amount of the dividend is $29.9 million which represents a fully franked dividend of 5.0 cents per share from current year profits. This dividend will be paid on 20 April 2007. On 25 August 2006 the Directors of the Company declared a final dividend on ordinary shares in respect of the year ending 30 June 2006. The amount of the dividend was $30.2 million which represents a fully franked dividend of 5 cents per share from profits generated in the year ended 30 June 2006. The dividend was paid on 18 October 2006. 4. Significant events after the balance date Details of subsequent events are given in Note 16. As at the date of this report there are no other significant events that have occurred since 31 December 2006. 5. Rounding The amounts contained in the annual financial report have been rounded off to the nearest $1,000,000 under the option available to the Company under Australian Securities & Investments Commission (ASIC) Class Order 98/0100. The Company is an entity to which the class order applies.
- 3 -

Challenger Financial Services Group Limited Interim Financial Report
Auditor independence and non-audit services
The directors received the following declaration from the auditor of Challenger Financial Services Group Limited.
ME ERivsr&YOUNG
Brian Long Partner Sydney 23 February 2007
Signed in accordance with a resolution of the directors of Challenger
2007
9 Ernst & Young Centre 680 George Street Sydney NSW 2000 Australia
GPO Box 2646 Sydney NSW 2001
Auditor's Independence Declaration to the directors of Challenger Financial Services Group Limited
In relation to our review of the financial report of Challenger Financial Services Group Limited for the half year ended 31 December 2006, to the best of my knowledge and belief, there have been no contraventions of the auditor independence requirements of the Corporations Act 2001 or any applicable code of professional conduct.
Ernst & Young
1-i Limited liability by the Accountants Scheme, approved under the Professional Standards Act 1994 (NSW)
G A Cubbin Director Sydney
challenger
z Tel
61 2 9248 5555 Fax
61 2 9248 5959 DX
Sydney Stock Exchange 10172
2007

Chal lenger F inanc ia l Serv ices Group L imited Inter im F inanc ia l Report
Half Year Interim Financial Report 31 December 2006 Contents Page Page Consolidated income statement - 6- Consolidated balance sheet - 7- Consolidated statement of changes in equity - 8- Consolidated statement of cash flows -10- Notes to the financial statements -12- Directors’ declaration -31- Independent review report -32- This half year financial report covers Challenger Financial Services Group Limited (the Company) and its controlled entities (the Group).
- 5 -
Chal lenger F inanc ia l Serv ices Group L imited Inter im F inanc ia l Report
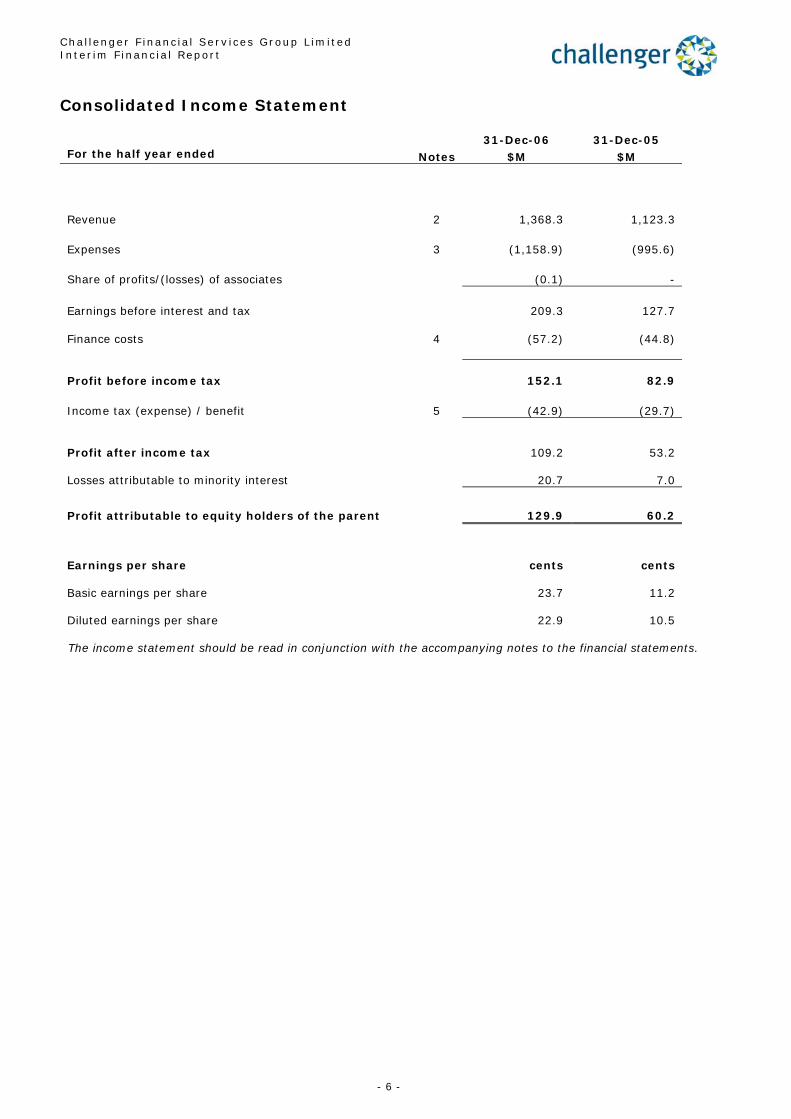
Consolidated Income Statement 31-Dec-06 31-Dec-05 For the half year ended Notes $M $M
Revenue 2
1,368.3
1,123.3
Expenses 3 (1,158.9) (995.6)
Share of profits/(losses) of associates (0.1)
-
Earnings before interest and tax
209.3
127.7
Finance costs 4 (57.2) (44.8)
Profit before income tax
152.1
82.9
Income tax (expense) / benefit 5 (42.9) (29.7)
Profit after income tax
109.2
53.2
Losses attributable to minority interest
20.7
7.0
Profit attributable to equity holders of the parent
129.9
60.2 Earnings per share cents cents
Basic earnings per share
23.7
11.2
Diluted earnings per share
22.9
10.5 The income statement should be read in conjunction with the accompanying notes to the financial statements.
- 6 -

The balance sheet should be read in conjunction with the accompanying notes to the financial statements.
Consolidated Balance Sheet
Chal lengerInter im F inanc ia l Report
31-Dec-06 30-Jun-06
As at Notes $M $M
Assets
Cash and cash equivalents 1,009.2 425.5
Receivables 301.3 503.3
Derivative assets 10.1 6.7
Financial assets fair valued through income statement 1,215.0 903.6
Available for sale assets - 318.5
Infrastructure investments 564.9 183.1
Other financial assets 12.0 10.9
Investment properties 1,452.2 1,800.7
Plant and equipment 7.0 281.5
Securitised assets 10 20,043.8 19,667.9
Deferred tax assets 15.2 14.3
Investment in associates 7.3 6.3
Goodwill 7 557.8 1,583.1
Other intangible assets 7 15.6 17.1
Other assets 181.7 172.2
Total assets 25,393.1 25,894.7
Liabilities Payables 390.2 390.0 Derivative liabilities 10.3 74.9
Financial liabilities fair valued through income statement 70.6 18.4
Interest bearing liabilities 8 1,227.4 1,820.7
Provisions 9 47.1 64.8 Securitised liabilities 10 20,053.7 19,680.2 Deferred tax liabilities 155.6 147.1 Life insurance contract liabilities 88.2 91.1 Life investment contract liabilities 2,012.4 1,997.3
Total liabilities 24,055.5 24,284.5
Net assets 1,337.6 1,610.2
Equity
Contributed equity 11 1,250.4 1,244.0
Reserves 81.9 96.1
Accumulated profits/(losses) 6.7 (93.0)
Total equity attributable to equity holders of the parent 1,339.0 1,247.1
Cash flow hedge reserve- Special Purpose Vehicles 10 (9.9) (12.3)
Minority interests 8.5 375.4
Total equity 1,337.6 1,610.2
F inanc ia l Serv ices Group L imited
- 7 -
Chal lenger F inanc ia l Serv ices Group L imited Inter im F inanc ia l Report
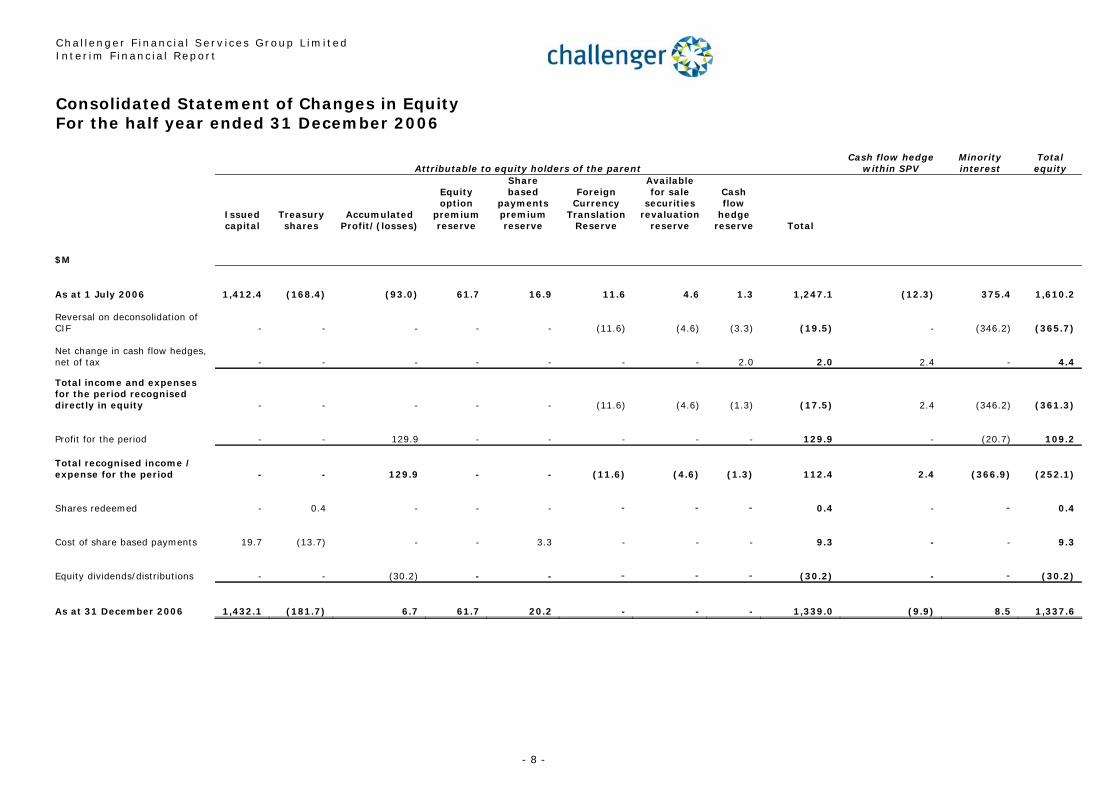
Consolidated Statement of Changes in Equity For the half year ended 31 December 2006 Attributable to equity holders of the parent
Cash flow hedge within SPV
Minority interest
Total equity
Issued capital
Treasury shares
Accumulated Profit/(losses)
Equity option
premium reserve
Share based
payments premium reserve
Foreign Currency
Translation Reserve
Available for sale
securities revaluation
reserve
Cash flow
hedge reserve Total
$M
As at 1 July 2006
1,412.4 (168.4) (93.0)
61.7
16.9
11.6
4.6
1.3
1,247.1 (12.3)
375.4
1,610.2
Reversal on deconsolidation of CIF
-
- -
-
- (11.6) (4.6) (3.3) (19.5) - (346.2) (365.7)
Net change in cash flow hedges, net of tax
-
- -
-
-
-
-
2.0
2.0 2.4
-
4.4
Total income and expenses for the period recognised directly in equity
-
- -
-
- (11.6) (4.6) (1.3) (17.5) 2.4 (346.2) (361.3)
Profit for the period
-
- 129.9
-
-
-
-
-
129.9 -
(20.7)
109.2
Total recognised income / expense for the period
-
- 129.9
-
- (11.6) (4.6) (1.3)
112.4 2.4 (366.9) (252.1)
Shares redeemed
-
0.4 -
-
-
-
-
-
0.4 -
-
0.4
Cost of share based payments
19.7 (13.7) -
-
3.3
-
-
-
9.3 -
-
9.3
Equity dividends/distributions
-
- (30.2)
-
-
-
-
- (30.2) -
- (30.2)
As at 31 December 2006
1,432.1
(181.7) 6.7 61.7 20.2
-
- - 1,339.0 (9.9) 8.5 1,337.6
- 8 -
F inanc ia l Serv ices Group L imited
- 9 -
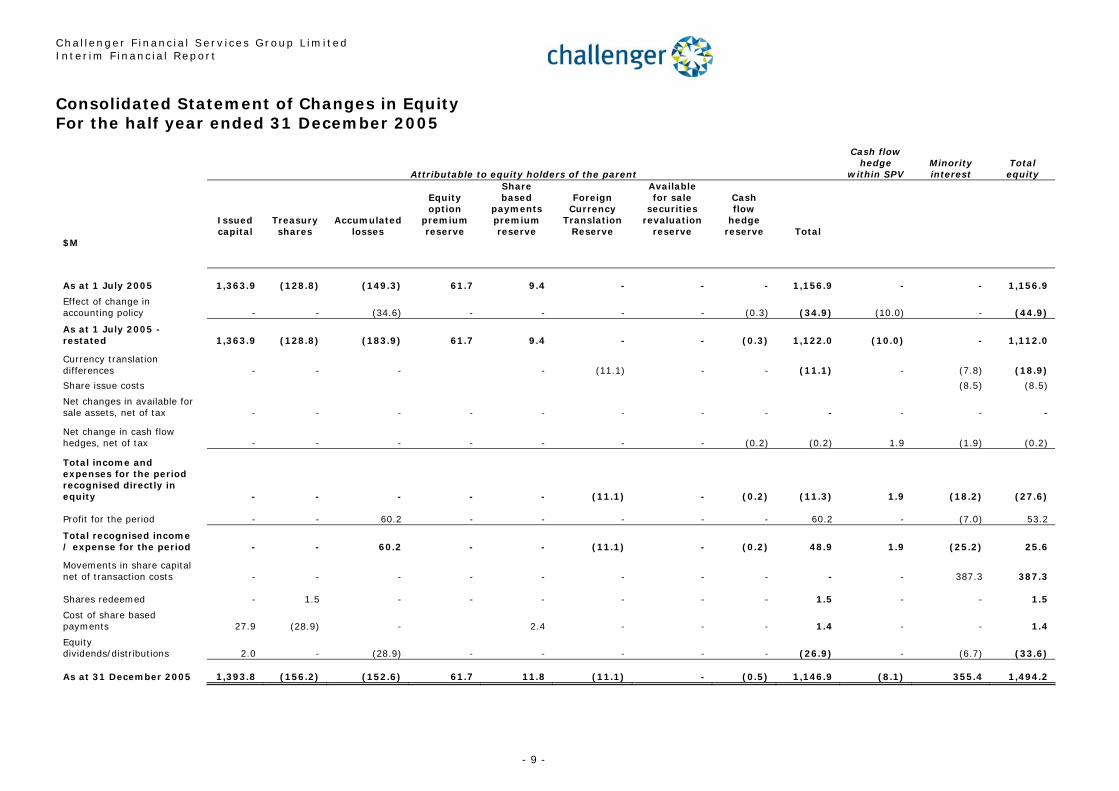
Attributable to equity holders of the parent
Cash flow hedge
within SPV Minority interest
Total equity
Issued capital
Treasury shares
Accumulated losses
Equity option
premium reserve
Share based
payments premium reserve
Foreign Currency
Translation Reserve
Available for sale
securities revaluation
reserve
Cash flow
hedge reserve Total
$M
As at 1 July 2005
1,363.9 (128.8) (149.3)
61.7
9.4
-
-
-
1,156.9
-
-
1,156.9
Effect of change in accounting policy
-
- (34.6)
-
-
-
- (0.3) (34.9) (10.0)
- (44.9)
As at 1 July 2005 - restated
1,363.9 (128.8) (183.9)
61.7
9.4 -
- (0.3)
1,122.0 (10.0)
-
1,112.0
Currency translation differences
-
-
-
- (11.1)
-
- (11.1)
- (7.8) (18.9)
Share issue costs
(8.5) (8.5)
Net changes in available for sale assets, net of tax
-
-
-
-
-
-
-
-
-
-
-
-
Net change in cash flow hedges, net of tax
-
-
-
-
-
-
- (0.2) (0.2)
1.9 (1.9) (0.2)
Total income and expenses for the period recognised directly in equity
-
-
-
-
- (11.1)
- (0.2) (11.3)
1.9 (18.2) (27.6)
Profit for the period
-
-
60.2
-
-
-
-
-
60.2
- (7.0)
53.2
Total recognised income / expense for the period
-
-
60.2
-
- (11.1)
- (0.2)
48.9
1.9 (25.2)
25.6
Movements in share capital net of transaction costs
-
-
-
-
-
-
-
-
-
-
387.3
387.3
Shares redeemed
-
1.5
-
-
-
-
-
-
1.5
-
-
1.5
Cost of share based payments
27.9 (28.9)
-
2.4
-
-
-
1.4
-
-
1.4
Equity dividends/distributions
2.0
- (28.9)
-
-
-
-
- (26.9)
- (6.7) (33.6)
As at 31 December 2005
1,393.8 (156.2) (152.6)
61.7
11.8 (11.1)
- (0.5)
1,146.9 (8.1)
355.4
1,494.2
Consolidated Statement of Changes in Equity For the half year ended 31 December 2005
Chal lengerInter im F inanc ia l Report
Chal lenger F inanc ia l Serv ices Group L imited Inter im F inanc ia l Report
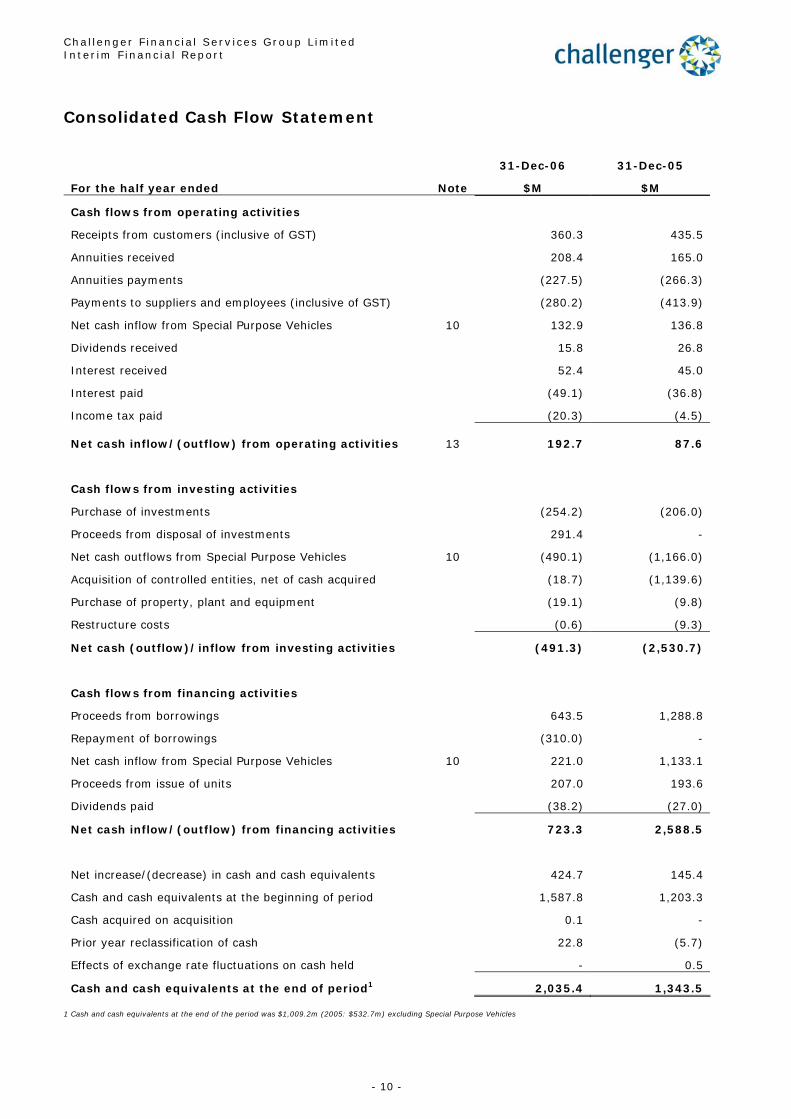
Consolidated Cash Flow Statement
31-Dec-06 31-Dec-05
For the half year ended Note $M $M
Cash flows from operating activities
Receipts from customers (inclusive of GST) 360.3 435.5
Annuities received 208.4 165.0
Annuities payments (227.5) (266.3)
Payments to suppliers and employees (inclusive of GST) (280.2) (413.9)
Net cash inflow from Special Purpose Vehicles 10 132.9 136.8
Dividends received 15.8 26.8
Interest received 52.4 45.0
Interest paid (49.1) (36.8)
Income tax paid (20.3) (4.5)
Net cash inflow/(outflow) from operating activities 13 192.7
87.6
Cash flows from investing activities
Purchase of investments (254.2) (206.0)
Proceeds from disposal of investments 291.4 -
Net cash outflows from Special Purpose Vehicles 10 (490.1) (1,166.0)
Acquisition of controlled entities, net of cash acquired (18.7) (1,139.6)
Purchase of property, plant and equipment (19.1) (9.8)
Restructure costs (0.6) (9.3)
Net cash (outflow)/inflow from investing activities (491.3) (2,530.7)
Cash flows from financing activities
Proceeds from borrowings 643.5 1,288.8
Repayment of borrowings (310.0) -
Net cash inflow from Special Purpose Vehicles 10 221.0 1,133.1
Proceeds from issue of units 207.0 193.6
Dividends paid (38.2) (27.0)
Net cash inflow/(outflow) from financing activities 723.3 2,588.5
Net increase/(decrease) in cash and cash equivalents 424.7 145.4
Cash and cash equivalents at the beginning of period 1,587.8 1,203.3
Cash acquired on acquisition
0.1 -
Prior year reclassification of cash
22.8 (5.7)
Effects of exchange rate fluctuations on cash held - 0.5
Cash and cash equivalents at the end of period1 2,035.4 1,343.5 1 Cash and cash equivalents at the end of the period was $1,009.2m (2005: $532.7m) excluding Special Purpose Vehicles
- 10 -

Chal lenger F inanc ia l Serv ices Group L imited Inter im F inanc ia l Report
- 11 -
Summary Consolidated Cash Flow Statement (excluding Special Purpose Vehicles)
31-Dec-06 31-Dec-05
For the half year ended $M $M
Net cash inflow/(outflow) from operating activities 59.8 (49.2)
Net cash (outflow)/inflow from investing activities (1.2) (1,364.7)
Net cash inflow/(outflow) from financing activities 502.3 1,455.4
Net increase/(decrease) in cash and cash equivalents 560.9 41.5
Cash and cash equivalents at the beginning of period 425.4 496.4
Prior year reclassification of cash
22.9 (5.7)
Effects of exchange rate fluctuations on cash held
- 0.5
Cash and cash equivalents at the end of period 1,009.2 532.7 The cash flow statement should be read in conjunction with the accompanying notes.

Chal lenger F inanc ia l Serv ices Group L imited Inter im F inanc ia l Report
- 12 -
Notes to the Financial Statements
Note 1. Summary of Significant Accounting Policies The financial report for the six months ended 31 December 2006 was authorised for issue in accordance with a resolution of the Directors on 23 February 2007. This consolidated interim financial report of the Company as at and for the six months ended 31 December 2006 comprises the Company and its subsidiaries (together referred to as ‘the Group’) and the Group’s interest in associates. (a) Basis of preparation
The half year financial report is a general purpose financial report which has been prepared in accordance with the requirements of the Corporations Act 2001, applicable Accounting Standards, including AASB 134: Interim Financial Reporting. The consolidated interim financial report does not include all of the information required for a full annual financial report. This half year report should be read in conjunction with the consolidated annual financial report of the Group as at and for the year ended 30 June 2006, which was prepared in accordance with Australian equivalents to International Financial Reporting Standards (‘AIFRS’), together with any public announcements made by the Group during the half year ended 31 December 2006 in accordance with the continuous disclosure obligations arising under the Corporations Act 2001. The financial report has been prepared on a historical cost basis, except for investment properties, derivative financial instruments, available for sale financial assets and assets supporting the life insurance business, which have been measured at fair value. Where necessary, the comparative information has been reclassified to be consistent with current period disclosure. (b) Significant accounting policies The accounting policies applied by the Group in this consolidated half year financial report are the same as those applied by the Group in its consolidated financial report as at and for the year ended 30 June 2006. (c) Estimates The preparation of the interim financial report requires management to make judgements, estimates and assumptions that affect the application of accounting policies and the reported amount of assets, liabilities, income and expense. Actual results may differ from these estimates. In preparing this consolidated interim financial report, the significant judgements made by management in applying the Group’s accounting policies and the key sources of estimation uncertainty were the same as those that applied to the consolidated financial report as at and for the year ended 30 June 2006.

Chal lenger F inanc ia l Serv ices Group L imited Inter im F inanc ia l Report
- 13 -
Note 2. Revenue Half year ended: 31-Dec-06 31-Dec-05 $M $M Revenue
Rental income 69.7 72.8 Management fee income 302.7 250.2 Interest income 47.6 40.5 Dividend income 29.4 17.0 Fair value adjustments of: - investment property (net of exchange fluctuations) 22.7 24.5 - infrastructure investments (net of exchange fluctuations) 22.6 - Net realised gain/(loss) on: - properties (0.8) - - investments and disposal of subsidiaries 69.0 5.6 - foreign exchange 7.8 2.3 Unrealised gain/(loss) on/from: - trading securities 2.0 4.3 - Interest rate derivative assets and liabilities 1.5 - - FX forward derivative assets and liabilities 1.3 (0.6) Other income 5.6 16.6 581.1 433.2 SPV revenue Interest and fee income 794.0 667.9 794.0 667.9
Challenger Infrastructure Fund (CIF) revenue 1 Investment revenue 10.9 15.8 Transportation revenue 28.1 21.1 Unrealised gain on FX derivative assets and liabilities - 4.1 Unrealised loss on interest rate derivative assets and liabilities (45.8) (18.8) (6.8) 22.2 Total revenue 1,368.3 1,123.3
1 CIF revenue is for the period up until 29 November 2006.
Chal lenger F inanc ia l Serv ices Group L imited Inter im F inanc ia l Report
- 14 -
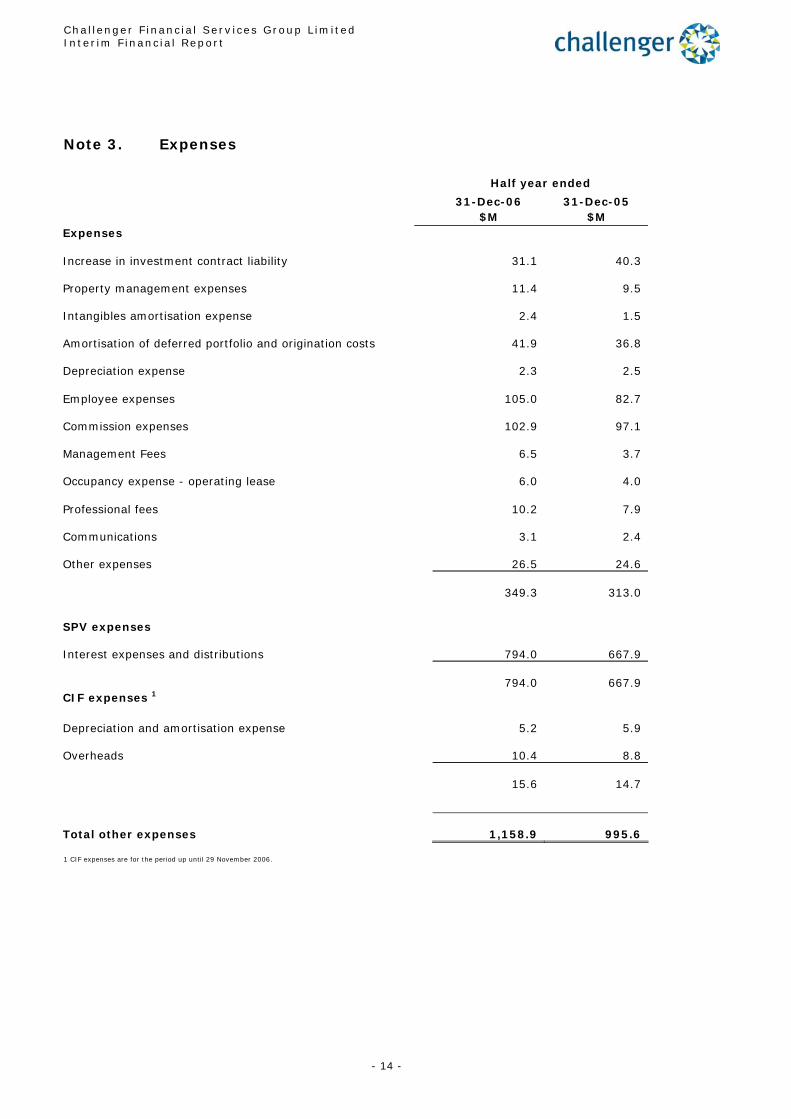
Note 3. Expenses Half year ended 31-Dec-06 31-Dec-05 $M $M Expenses
Increase in investment contract liability
31.1
40.3
Property management expenses
11.4
9.5
Intangibles amortisation expense
2.4
1.5
Amortisation of deferred portfolio and origination costs
41.9
36.8
Depreciation expense
2.3
2.5
Employee expenses
105.0
82.7
Commission expenses
102.9
97.1
Management Fees
6.5
3.7
Occupancy expense - operating lease
6.0
4.0
Professional fees
10.2
7.9
Communications
3.1
2.4
Other expenses
26.5
24.6
349.3
313.0
SPV expenses
Interest expenses and distributions
794.0
667.9
794.0
667.9
CIF expenses 1
Depreciation and amortisation expense
5.2
5.9
Overheads
10.4
8.8
15.6
14.7
Total other expenses
1,158.9
995.6
1 CIF expenses are for the period up until 29 November 2006.
Chal lenger F inanc ia l Serv ices Group L imited Inter im F inanc ia l Report
- 15 -
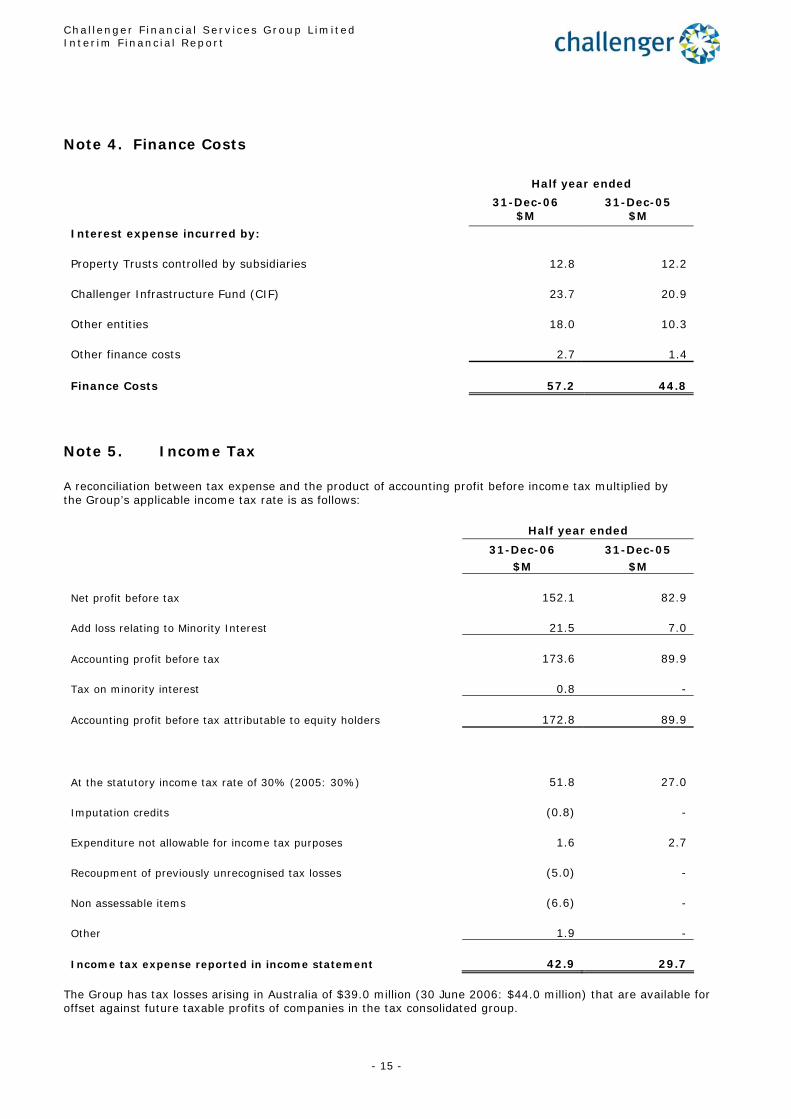
Note 4. Finance Costs Half year ended
31-Dec-06 31-Dec-05 $M $M
Interest expense incurred by:
Property Trusts controlled by subsidiaries 12.8 12.2
Challenger Infrastructure Fund (CIF) 23.7 20.9
Other entities 18.0 10.3
Other finance costs 2.7 1.4
Finance Costs 57.2 44.8
Note 5. Income Tax A reconciliation between tax expense and the product of accounting profit before income tax multiplied by the Group’s applicable income tax rate is as follows: Half year ended 31-Dec-06 31-Dec-05 $M $M
Net profit before tax
152.1
82.9
Add loss relating to Minority Interest
21.5
7.0
Accounting profit before tax
173.6
89.9
Tax on minority interest
0.8 -
Accounting profit before tax attributable to equity holders
172.8
89.9
At the statutory income tax rate of 30% (2005: 30%) 51.8
27.0
Imputation credits (0.8)
-
Expenditure not allowable for income tax purposes
1.6
2.7
Recoupment of previously unrecognised tax losses (5.0) -
Non assessable items (6.6)
-
Other
1.9
-
Income tax expense reported in income statement
42.9
29.7 The Group has tax losses arising in Australia of $39.0 million (30 June 2006: $44.0 million) that are available for offset against future taxable profits of companies in the tax consolidated group.
Chal lenger F inanc ia l Serv ices Group L imited Inter im F inanc ia l Report
- 16 -
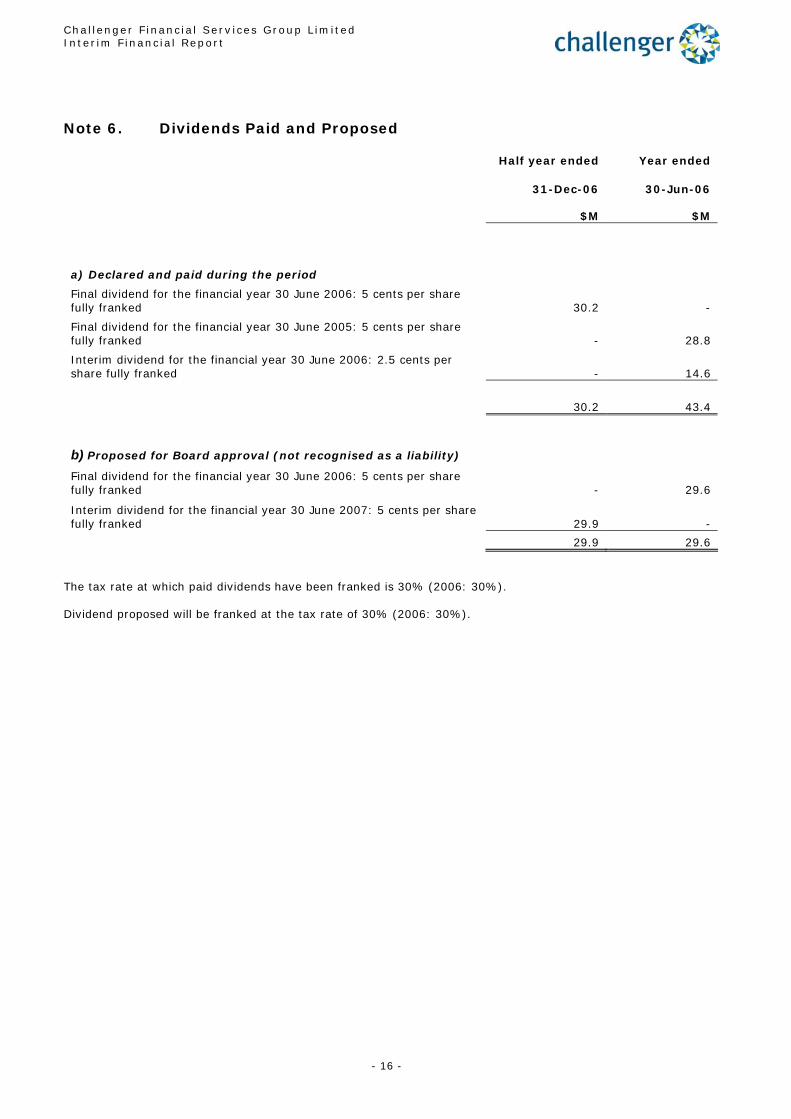
Note 6. Dividends Paid and Proposed Half year ended Year ended
31-Dec-06 30-Jun-06
$M $M
a) Declared and paid during the period
Final dividend for the financial year 30 June 2006: 5 cents per share fully franked 30.2 -
Final dividend for the financial year 30 June 2005: 5 cents per share fully franked - 28.8
Interim dividend for the financial year 30 June 2006: 2.5 cents per share fully franked - 14.6
30.2 43.4
b) Proposed for Board approval (not recognised as a liability)
Final dividend for the financial year 30 June 2006: 5 cents per share fully franked - 29.6
Interim dividend for the financial year 30 June 2007: 5 cents per share fully franked 29.9 -
29.9 29.6 The tax rate at which paid dividends have been franked is 30% (2006: 30%). Dividend proposed will be franked at the tax rate of 30% (2006: 30%).
Chal lenger F inanc ia l Serv ices Group L imited Inter im F inanc ia l Report
- 17 -
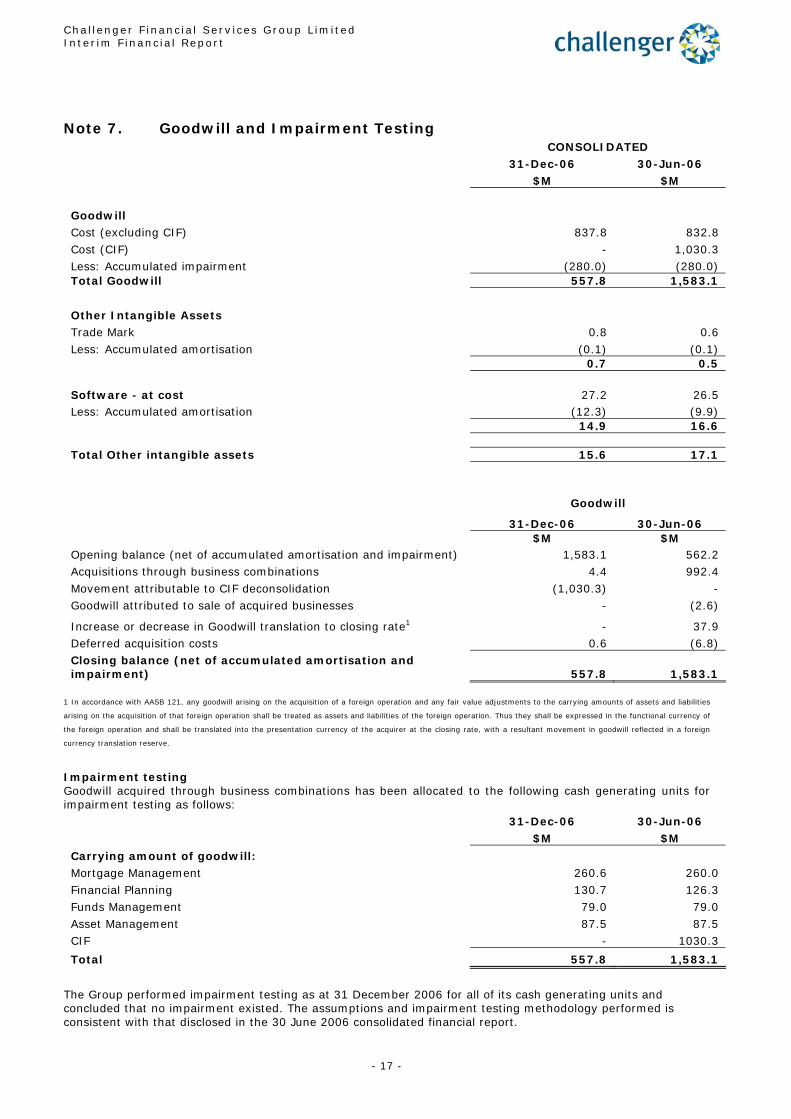
Note 7. Goodwill and Impairment Testing CONSOLIDATED 31-Dec-06 30-Jun-06 $M $M
Goodwill Cost (excluding CIF) 837.8 832.8 Cost (CIF) - 1,030.3 Less: Accumulated impairment (280.0) (280.0) Total Goodwill 557.8 1,583.1
Other Intangible Assets Trade Mark 0.8 0.6 Less: Accumulated amortisation (0.1) (0.1) 0.7 0.5 Software - at cost 27.2 26.5 Less: Accumulated amortisation (12.3) (9.9) 14.9 16.6 Total Other intangible assets 15.6 17.1 Goodwill
31-Dec-06 30-Jun-06 $M $M Opening balance (net of accumulated amortisation and impairment) 1,583.1 562.2 Acquisitions through business combinations 4.4 992.4 Movement attributable to CIF deconsolidation (1,030.3) - Goodwill attributed to sale of acquired businesses - (2.6)
Increase or decrease in Goodwill translation to closing rate1 - 37.9 Deferred acquisition costs 0.6 (6.8) Closing balance (net of accumulated amortisation and impairment) 557.8 1,583.1
1 In accordance with AASB 121, any goodwill arising on the acquisition of a foreign operation and any fair value adjustments to the carrying amounts of assets and liabilities
arising on the acquisition of that foreign operation shall be treated as assets and liabilities of the foreign operation. Thus they shall be expressed in the functional currency of
the foreign operation and shall be translated into the presentation currency of the acquirer at the closing rate, with a resultant movement in goodwill reflected in a foreign
currency translation reserve.
Impairment testing Goodwill acquired through business combinations has been allocated to the following cash generating units for impairment testing as follows: 31-Dec-06 30-Jun-06 $M $M
Carrying amount of goodwill: Mortgage Management 260.6 260.0 Financial Planning 130.7 126.3 Funds Management 79.0 79.0 Asset Management 87.5 87.5 CIF - 1030.3
Total 557.8 1,583.1
The Group performed impairment testing as at 31 December 2006 for all of its cash generating units and concluded that no impairment existed. The assumptions and impairment testing methodology performed is consistent with that disclosed in the 30 June 2006 consolidated financial report.

Chal lenger F inanc ia l Serv ices Group L imited Inter im F inanc ia l Report
- 18 -
Note 8. Interest Bearing Liabilities
CONSOLIDATED 31-Dec-06 30-Jun-06 Outstanding Facility Unused Outstanding Facility Unused $M $M $M $M $M $M
Bank Loans Controlled property trusts
539.0 570.3 31.3 285.5 285.5
-
Corporate
160.0 350.0 190.0 120.0 350.0
230.0
Wholesale annuity
50.0 50.0 - 50.0 50.0
-
CIF debt1 - - - 1,050.4 1,503.3
452.9
Less capitalised line fees - - - (7.0) -
-
Total bank loans
749.0 970.3 221.3
1,498.9 2,188.8
682.9
Non-bank loans
Corporate
230.0 230.0 - 230.0 230.0
-
Subordinated debt issuance
186.9 186.9 - - -
-
Real estate note finance
61.4 61.4 - - -
-
Loan Notes to Inexus minority shareholders1 - - - 14.7 -
-
Inexus preference shares1 - - - 77.0 -
-
Total non-bank loans
478.3 478.3 - 321.7 230.0
-
Lease liabilities
0.1 - - 0.1 -
-
Total interest bearing liabilities
1,227.4 1,448.6 221.3
1,820.7 2,418.8
682.9
1 Relates to interest bearing liabilities of the consolidated Challenger Infrastructure Fund (CIF) which were consolidated into the Group’s balance sheet as at 30 June 2006.
Bank Loans Controlled property trusts Bank loans and non-bank loans in the controlled property trusts are secured solely by first mortgages over properties. During the period an additional facility of $284.8m was raised. Corporate The corporate bank facility amounting to $350,000,000 is secured by; fixed and floating charges granted by Challenger Group Holdings Limited and Challenger Life Holdings Pty Limited; a fixed charge over the rights of Challenger Managed Investments Limited and Challenger Commercial Lending Limited in the Howard Mortgage Trust; and an Equitable Mortgage of Shares from Challenger Group Holdings Limited over all its shares in Challenger Commercial Lending Limited. In addition, there are cross guarantees in place between certain Group companies.

Chal lenger F inanc ia l Serv ices Group L imited Inter im F inanc ia l Report
- 19 -
Wholesale annuity Limited recourse secured notes issued by Challenger Capital Markets Limited, a wholly owned subsidiary of Challenger Life No.2. Challenger Capital Markets Limited is a bankruptcy remote special purpose vehicle (SPV). The notes issued by the SPV are secured by and restricted in their recourse to a Life investment contract annuity issued by Statutory Fund No.2 of Challenger Life No.2 Limited. Non-bank loans Corporate Working capital was raised via a Net Interest Margin Bond securitisation through the NIM Master Trust Series 2004-A2, 2004-A3 and 2006-A1. The facility is limited in its recourse to the manager to the extent of $1 and holds security over the residual incomes of all Australian securitised trusts. The NIM represents a long term financing alternative. It is anticipated total outstanding principal will be repaid within 4 years from June 2006. Interest is fixed and is payable monthly. Subordinated Debt Challenger Life No. 2 Limited issued US$150,000,000 of subordinated notes into the US private placement market in December 2006. The notes were issued under an APRA approved Instrument of Issue and, when issued, count as Approved Subordinated Debt for regulatory capital purposes. The notes are unsecured and were issued in two maturities (US$25 million at 10 years with a non-call period of 5 years; and US$125m at 20 years with a non-call period of 10 years). The proceeds from the issuance were made available to Statutory Fund No. 2 of Challenger Life No. 2 Limited. The repayment obligations and other liabilities of Challenger Life No. 2 Limited in respect of the principal, interest and other amounts owing with respect to the Notes are liabilities of, and referable to, Statutory Fund No. 2. The notes rank in right of payment either pari passu with or senior to all other unsecured and subordinated indebtedness of Challenger Life No. 2 Limited allocated to Statutory Fund No. 2, except for such indebtedness preferred by operation of bankruptcy laws or similar laws of general application.
Real estate note finance Challenger Life No 2 Limited has entered into a £25m loan that is restricted in its recourse to £25m loan notes that has been recognised in Financial Assets fair valued through income statement. The interest will be capitalised and is expected to be repaid together with the principal in 2012 (but no later than 2015). Lease liabilities Lease liabilities are effectively secured as the rights to the leased asset revert to the lessor in the event of default.
Chal lenger F inanc ia l Serv ices Group L imited Inter im F inanc ia l Report
- 20 -
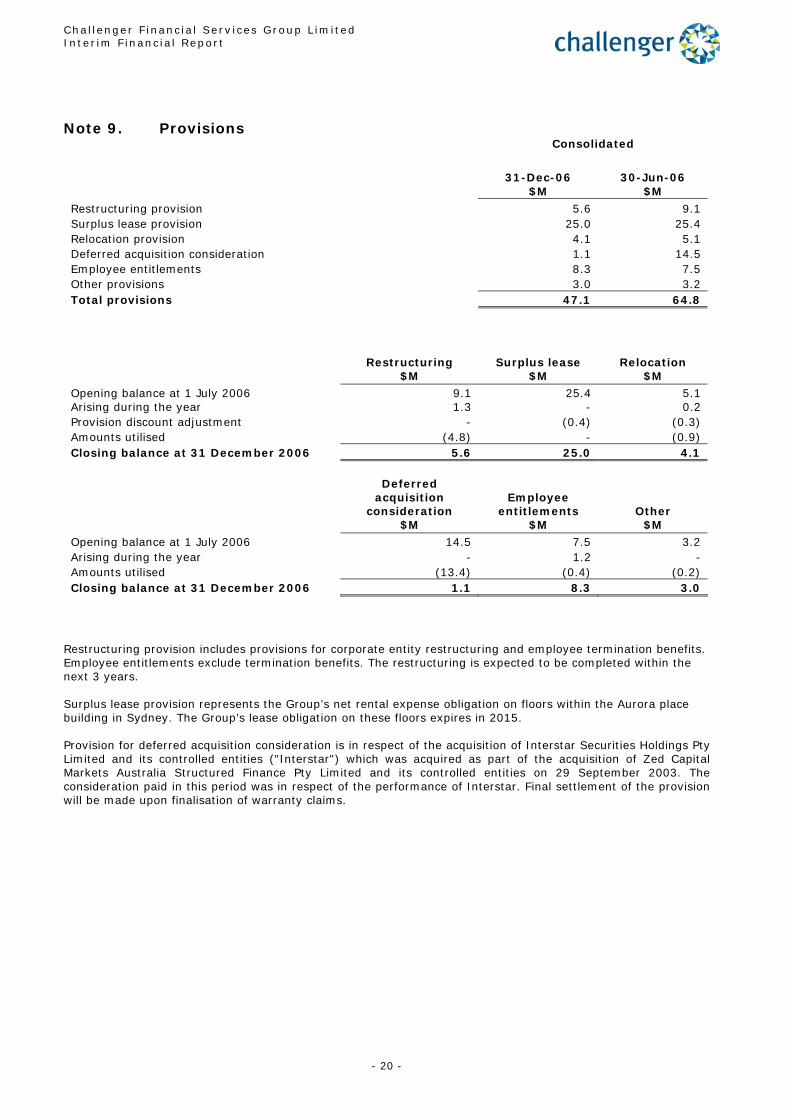
Note 9. Provisions
Consolidated
31-Dec-06 30-Jun-06 $M $M
Restructuring provision 5.6 9.1 Surplus lease provision 25.0 25.4 Relocation provision 4.1 5.1 Deferred acquisition consideration 1.1 14.5 Employee entitlements 8.3 7.5 Other provisions 3.0 3.2 Total provisions 47.1 64.8 Restructuring Surplus lease Relocation $M $M $M Opening balance at 1 July 2006 9.1 25.4 5.1 Arising during the year 1.3 - 0.2 Provision discount adjustment - (0.4) (0.3) Amounts utilised (4.8) - (0.9) Closing balance at 31 December 2006 5.6 25.0 4.1
Deferred
acquisition consideration
Employee entitlements Other
$M $M $M Opening balance at 1 July 2006 14.5 7.5 3.2 Arising during the year - 1.2 - Amounts utilised (13.4) (0.4) (0.2) Closing balance at 31 December 2006 1.1 8.3 3.0
Restructuring provision includes provisions for corporate entity restructuring and employee termination benefits. Employee entitlements exclude termination benefits. The restructuring is expected to be completed within the next 3 years. Surplus lease provision represents the Group’s net rental expense obligation on floors within the Aurora place building in Sydney. The Group’s lease obligation on these floors expires in 2015. Provision for deferred acquisition consideration is in respect of the acquisition of Interstar Securities Holdings Pty Limited and its controlled entities ("Interstar") which was acquired as part of the acquisition of Zed Capital Markets Australia Structured Finance Pty Limited and its controlled entities on 29 September 2003. The consideration paid in this period was in respect of the performance of Interstar. Final settlement of the provision will be made upon finalisation of warranty claims.

Chal lenger F inanc ia l Serv ices Group L imited Inter im F inanc ia l Report
- 21 -
Note 10. Consolidation of Special Purpose Vehicles The details of the Group’s Special Purpose Vehicles (SPVs) are consistent with that disclosed in the 30 June 2006 Financial Report. The consolidated balance sheet and cash flow statement for the securitised Special Purpose Vehicles is contained below. Balance Sheet
Consolidated Special Purpose
Vehicles 31-Dec-06 30-Jun-06
As at $M $M
Assets - securitised
Cash and cash equivalents 1,026.2
1,162.4 Receivables 19,010.1 18,495.8 Other assets 7.5 9.7
Total assets 20,043.8
19,667.9
Liabilities - securitised Payables 102.6 91.5
Derivative liability 11.9 15.3 Interest bearing liabilities 19,939.2 19,573.4
Total liabilities 20,053.7
19,680.2
Net liabilities (9.9) (12.3)
Equity Cash Flow Hedge Reserve - Special Purpose Vehicles (9.9) (12.3)
Total equity (9.9) (12.3)
Chal lenger F inanc ia l Serv ices Group L imited Inter im F inanc ia l Report
- 22 -
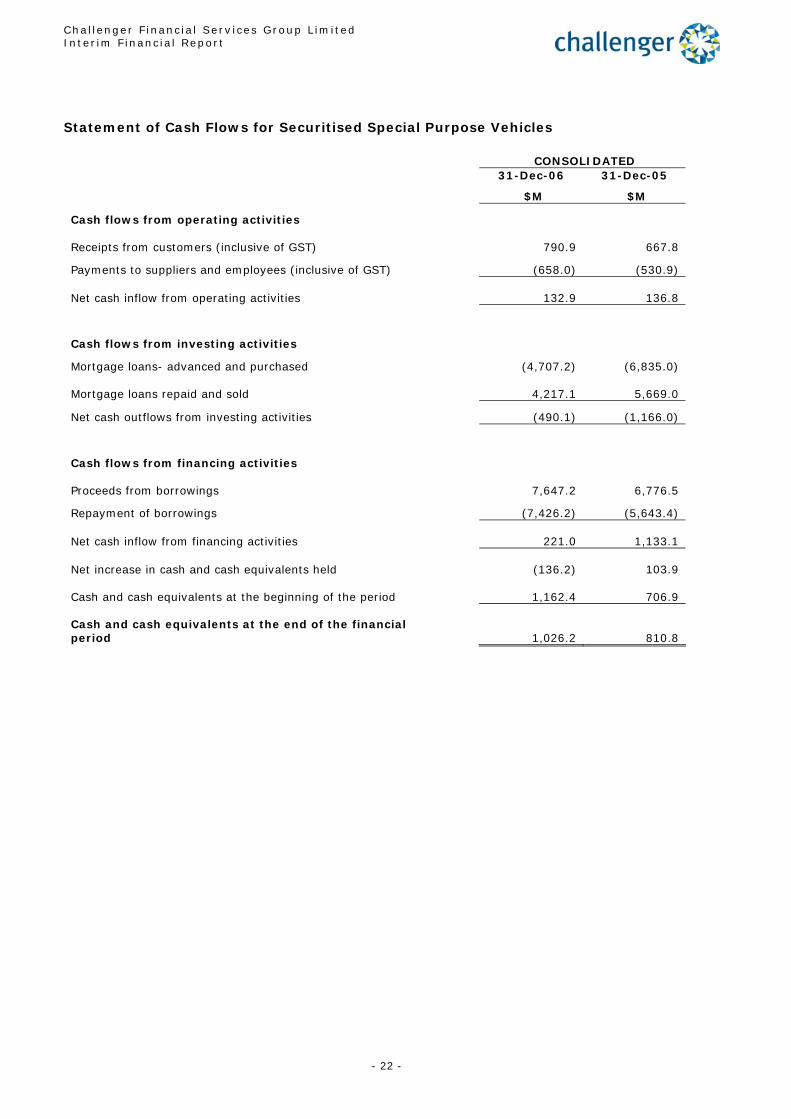
Statement of Cash Flows for Securitised Special Purpose Vehicles
CONSOLIDATED
31-Dec-06 31-Dec-05
$M $M
Cash flows from operating activities
Receipts from customers (inclusive of GST)
790.9
667.8
Payments to suppliers and employees (inclusive of GST) (658.0) (530.9)
Net cash inflow from operating activities
132.9
136.8
Cash flows from investing activities
Mortgage loans- advanced and purchased (4,707.2) (6,835.0)
Mortgage loans repaid and sold
4,217.1
5,669.0
Net cash outflows from investing activities (490.1) (1,166.0)
Cash flows from financing activities
Proceeds from borrowings
7,647.2
6,776.5
Repayment of borrowings (7,426.2) (5,643.4)
Net cash inflow from financing activities
221.0
1,133.1
Net increase in cash and cash equivalents held (136.2)
103.9
Cash and cash equivalents at the beginning of the period
1,162.4
706.9
Cash and cash equivalents at the end of the financial period
1,026.2
810.8
Chal lenger F inanc ia l Serv ices Group L imited Inter im F inanc ia l Report
- 23 -
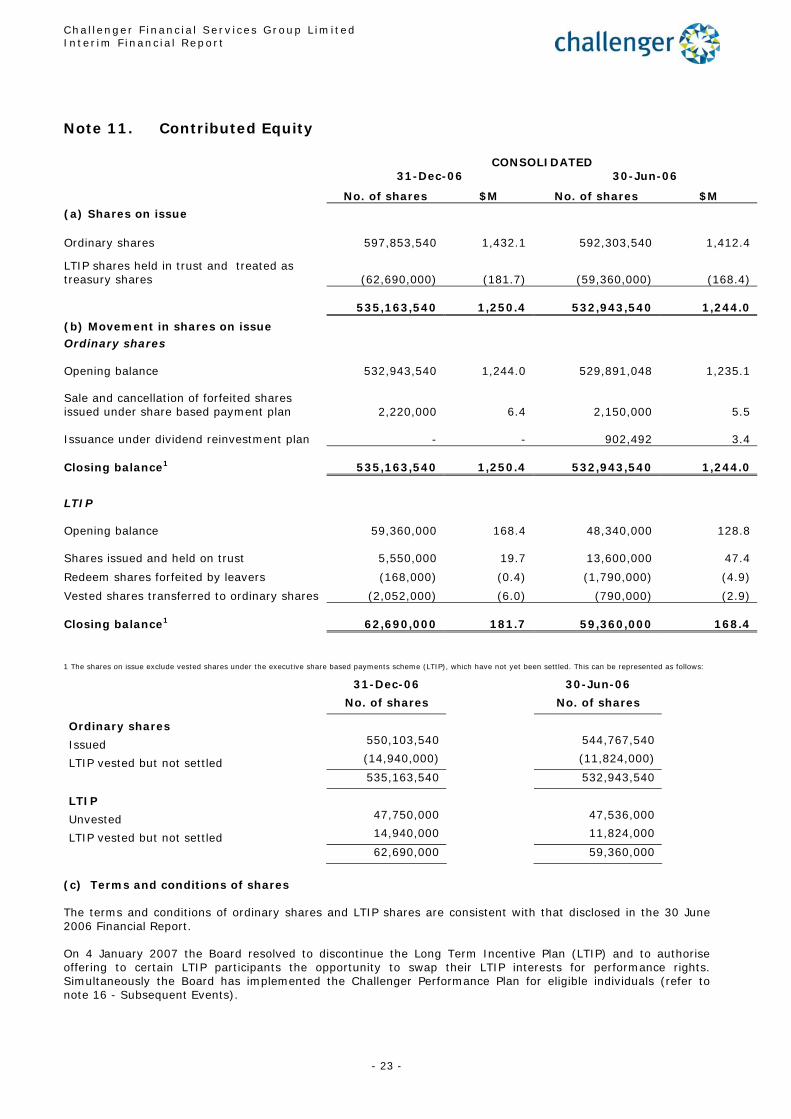
Note 11. Contributed Equity
CONSOLIDATED 31-Dec-06 30-Jun-06
No. of shares $M No. of shares $M
(a) Shares on issue
Ordinary shares 597,853,540 1,432.1 592,303,540
1,412.4
LTIP shares held in trust and treated as treasury shares (62,690,000) (181.7) (59,360,000) (168.4)
535,163,540
1,250.4 532,943,540
1,244.0
(b) Movement in shares on issue Ordinary shares
Opening balance 532,943,540
1,244.0 529,891,048
1,235.1
Sale and cancellation of forfeited shares issued under share based payment plan 2,220,000
6.4 2,150,000
5.5
Issuance under dividend reinvestment plan - -
902,492
3.4
Closing balance1 535,163,540
1,250.4 532,943,540
1,244.0 LTIP
Opening balance 59,360,000
168.4 48,340,000
128.8
Shares issued and held on trust 5,550,000
19.7 13,600,000
47.4
Redeem shares forfeited by leavers (168,000) (0.4) (1,790,000) (4.9)
Vested shares transferred to ordinary shares (2,052,000) (6.0) (790,000) (2.9)
Closing balance1 62,690,000
181.7 59,360,000
168.4
1 The shares on issue exclude vested shares under the executive share based payments scheme (LTIP), which have not yet been settled. This can be represented as follows:
31-Dec-06 30-Jun-06
No. of shares No. of shares
Ordinary shares
Issued 550,103,540 544,767,540
LTIP vested but not settled (14,940,000) (11,824,000)
535,163,540 532,943,540
LTIP
Unvested 47,750,000 47,536,000
LTIP vested but not settled 14,940,000 11,824,000
62,690,000 59,360,000
(c) Terms and conditions of shares The terms and conditions of ordinary shares and LTIP shares are consistent with that disclosed in the 30 June 2006 Financial Report. On 4 January 2007 the Board resolved to discontinue the Long Term Incentive Plan (LTIP) and to authorise offering to certain LTIP participants the opportunity to swap their LTIP interests for performance rights. Simultaneously the Board has implemented the Challenger Performance Plan for eligible individuals (refer to note 16 - Subsequent Events).

F inanc ia l Serv ices Group L imited
- 24 -
$M MORTGAGE
MANAGEMENT SPECIAL PURPOSE
VEHICLES 4FINANCIAL PLANNING
FUNDS MANAGEMENT ASSET MANAGEMENT CIF 1 CORPORATE 2 ELIMINATIONS 3 TOTAL CONSOLIDATED
For the half year ended 31 December 2006 2005 2006 2005 2006 2005 2006 2005 2006 2005 2006 2005 2006 2005 2006 2005 2006 2005
Revenue from external customers 145.2 133.4 794.0 667.9 81.3 71.7 68.2 52.5 282.2 165.9 (6.8) 22.2 4.2 9.7 - - 1,368.3 1,123.3 Intersegment revenue 6.2 3.7 - - - 4.6 2.6 3.2 - - - - - - (8.8) (11.5) - - Share of net profits of associates - - - - (0.1) - - - - - - - - - - - (0.1) -
Total segment revenue 151.4 137.1 794.0 667.9 81.2 76.3 70.8 55.7 282.2 165.9 (6.8) 22.2 4.2 9.7 (8.8) (11.5) 1,368.2 1,123.3
Expenses Depreciation and amortisation (41.9) (37.2) - - (0.4) (0.1) - - - - (5.2) (5.9) (4.3) - - - (51.8)
(43.2)
Other expenses (66.5) (63.6) (794.0) (667.9) (77.5) (70.7) (53.8) (51.4) (124.6) (109.6) (34.1) (8.8) (22.6) (36.7) 8.8 11.5 (1,164.3) (997.2)Total segment expenses (108.4) (100.8) (794.0) (667.9) (77.9) (70.8) (53.8) (51.4) (124.6) (109.6) (39.3) (14.7) (26.9) (36.7) 8.8 11.5 (1,216.1) (1,040.4)Net profit/(loss) before tax 43.0 36.3 - - 3.3 5.5 17.0 4.3 157.6 56.3 (46.1) 7.5 (22.7) (27.0) - - 152.1 82.9 Income tax expense (42.9) (29.7) Net profit after tax 109.2 53.2
Segment assets 574.1 545.2 20,043.8 19,667.9 167.3 162.6 159.5 153.8 4,079.3 3,744.8 - 2,045.0 369.1 254.3 - (679.0) 25,393.1 25,894.6 Segment liabilities (124.4) (132.6) (20,053.7) (19,680.2) (18.8) (16.7) (18.1) (19.0) (3,204.2) (2,861.7) - (1,242.1) (636.3) (558.7) - 226.6 (24,055.5) (24,284.4)
Net assets 5 449.7 412.6 (9.9) (12.3) 148.5 145.9 141.4 134.8 875.1 883.1 - 802.9 (267.2) (304.4) - (452.4) 1,337.6 1,610.2 Acquisition of non-current assets - - - - 4.4 - - - 16.4 30.4 - - - - - - 20.8 30.4
Note 12. Segment Information The primary business units of the Group have been identified as follows:
1. Represents 100% of CIF’s earnings and net assets (including CL2’s investment in CIF) up to the date of deconsolidation.
2. Corporate segment includes non-core activities of the Group. (The 2005 balance includes businesses to be restructured or sold as previously announced to the Australian Stock Exchange). Corporate expenses consist of costs that fall outside the day-to-day
operations of Asset Management, Mortgage Management, Financial Planning and Funds Management. These costs include the costs of the Group CEO and CFO, shared services across the Company, directors' fees, corporate borrowings and associated
borrowing costs and shareholder registry services for the Group.
3. Reverses Asset Management’s investment in CIF (53.89%)
4. Special Purpose Vehicles is part of the Mortgage Management segment. It is being separately disclosed to provide greater transparency.
5. Comparative figures for segment assets and segment liabilities are as at 30 June 2006.
Chal lengerInter im F inanc ia l Report

Chal lenger F inanc ia l Serv ices Group L imited Inter im F inanc ia l Report
Note 13. Statement of Cash Flows Reconciliation of profit after income tax to net cash flows from operating activities
31-Dec-06 31-Dec-05 For the half year ended $M $M
Profit after tax 129 .9 60.2
Adjustments for:
(Profit) / loss on sale of investments 1.7 (20.2)
Net unrealised losses on investments (11.5) (9.9)
Losses from minority interest (20.7) (7.0)
Share of associates' net (profits) and losses 0.1 -
Amortisation and depreciation 54.4 46.7
Other 0.6 75.4
Change in assets and liabilities, net of effects from purchase of controlled entity:
Decrease / (increase) in receivables 1 0.2 (244.4)
(Increase) / decrease in other assets (20.7) (36.4)
(Decrease) / increase in payables (67.1) 76.9
(Decrease) / increase in provisions and employee benefits (15.3) 8.8
Increase/(decrease) in current tax liability 9.5 -
(Decrease) / increase in deferred tax assets/liabilities (11.3) 0.7
Net cash inflow from operating activities before SPV 59.8 (49.2)
Net cash inflow from Special Purpose Vehicles 132.9 136.8
Net cash inflow from operating activities 192.7 87.6
- 25 -
Chal lenger F inanc ia l Serv ices Group L imited Inter im F inanc ia l Report
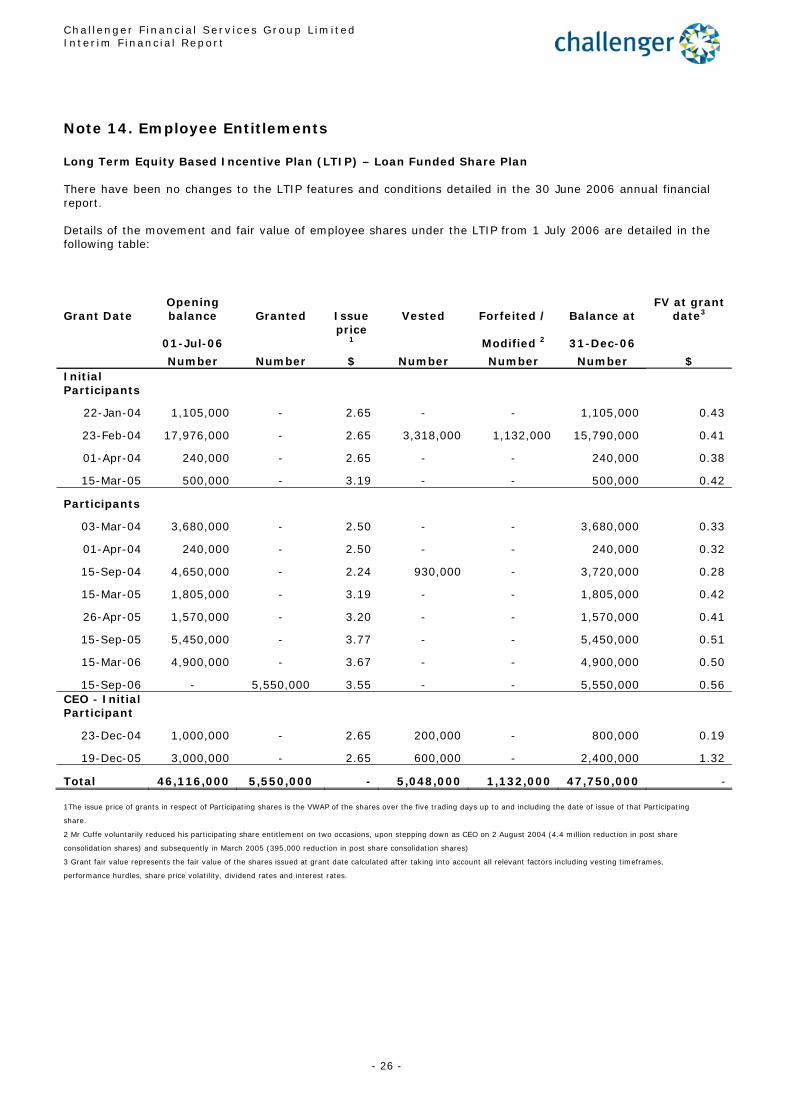
Note 14. Employee Entitlements Long Term Equity Based Incentive Plan (LTIP) – Loan Funded Share Plan There have been no changes to the LTIP features and conditions detailed in the 30 June 2006 annual financial report. Details of the movement and fair value of employee shares under the LTIP from 1 July 2006 are detailed in the following table:
Grant Date Opening balance Granted Issue Vested Forfeited / Balance at
FV at grant date3
01-Jul-06 price
1 Modified 2 31-Dec-06
Number Number $ Number Number Number $ Initial Participants
22-Jan-04 1,105,000 - 2.65 - - 1,105,000 0.43
23-Feb-04 17,976,000 - 2.65 3,318,000 1,132,000 15,790,000 0.41
01-Apr-04 240,000 - 2.65 - - 240,000 0.38
15-Mar-05 500,000 - 3.19 - - 500,000 0.42
Participants
03-Mar-04 3,680,000 - 2.50 - - 3,680,000 0.33
01-Apr-04 240,000 - 2.50 - - 240,000 0.32
15-Sep-04 4,650,000 - 2.24 930,000 - 3,720,000 0.28
15-Mar-05 1,805,000 - 3.19 - - 1,805,000 0.42
26-Apr-05 1,570,000 - 3.20 - - 1,570,000 0.41
15-Sep-05 5,450,000 - 3.77 - - 5,450,000 0.51
15-Mar-06 4,900,000 - 3.67 - - 4,900,000 0.50
15-Sep-06 - 5,550,000 3.55 - - 5,550,000 0.56 CEO - Initial Participant
23-Dec-04 1,000,000 - 2.65 200,000 - 800,000 0.19
19-Dec-05 3,000,000 - 2.65 600,000 - 2,400,000 1.32
Total 46,116,000 5,550,000 - 5,048,000 1,132,000 47,750,000 - 1The issue price of grants in respect of Participating shares is the VWAP of the shares over the five trading days up to and including the date of issue of that Participating
share.
2 Mr Cuffe voluntarily reduced his participating share entitlement on two occasions, upon stepping down as CEO on 2 August 2004 (4.4 million reduction in post share
consolidation shares) and subsequently in March 2005 (395,000 reduction in post share consolidation shares)
3 Grant fair value represents the fair value of the shares issued at grant date calculated after taking into account all relevant factors including vesting timeframes,
performance hurdles, share price volatility, dividend rates and interest rates.
- 26 -
Chal lenger F inanc ia l Serv ices Group L imited Inter im F inanc ia l Report
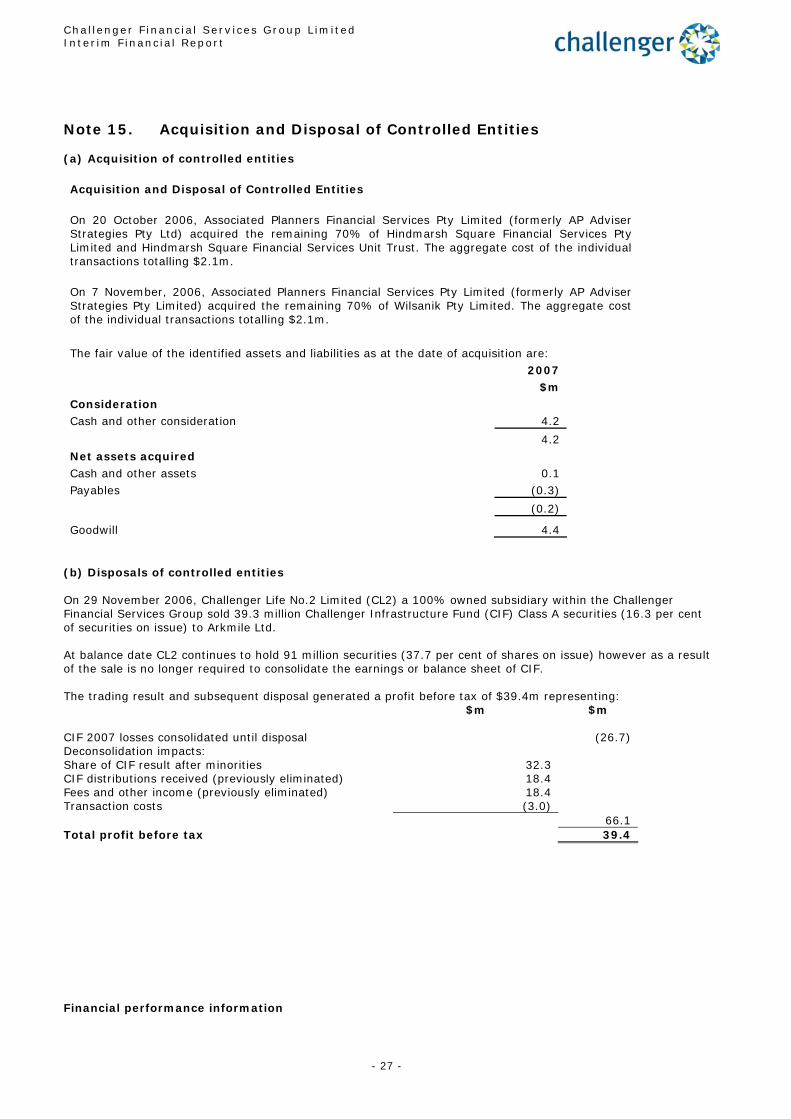
Note 15. Acquisition and Disposal of Controlled Entities (a) Acquisition of controlled entities Acquisition and Disposal of Controlled Entities On 20 October 2006, Associated Planners Financial Services Pty Limited (formerly AP Adviser Strategies Pty Ltd) acquired the remaining 70% of Hindmarsh Square Financial Services Pty Limited and Hindmarsh Square Financial Services Unit Trust. The aggregate cost of the individual transactions totalling $2.1m. On 7 November, 2006, Associated Planners Financial Services Pty Limited (formerly AP Adviser Strategies Pty Limited) acquired the remaining 70% of Wilsanik Pty Limited. The aggregate cost of the individual transactions totalling $2.1m. The fair value of the identified assets and liabilities as at the date of acquisition are: 2007
$m
Consideration
Cash and other consideration 4.2
4.2
Net assets acquired
Cash and other assets 0.1
Payables (0.3)
(0.2)
Goodwill 4.4
(b) Disposals of controlled entities On 29 November 2006, Challenger Life No.2 Limited (CL2) a 100% owned subsidiary within the Challenger Financial Services Group sold 39.3 million Challenger Infrastructure Fund (CIF) Class A securities (16.3 per cent of securities on issue) to Arkmile Ltd. At balance date CL2 continues to hold 91 million securities (37.7 per cent of shares on issue) however as a result of the sale is no longer required to consolidate the earnings or balance sheet of CIF. The trading result and subsequent disposal generated a profit before tax of $39.4m representing: $m $m
CIF 2007 losses consolidated until disposal (26.7) Deconsolidation impacts: Share of CIF result after minorities 32.3 CIF distributions received (previously eliminated) 18.4 Fees and other income (previously eliminated) 18.4 Transaction costs (3.0) 66.1 Total profit before tax 39.4 Financial performance information
- 27 -
Chal lenger F inanc ia l Serv ices Group L imited Inter im F inanc ia l Report
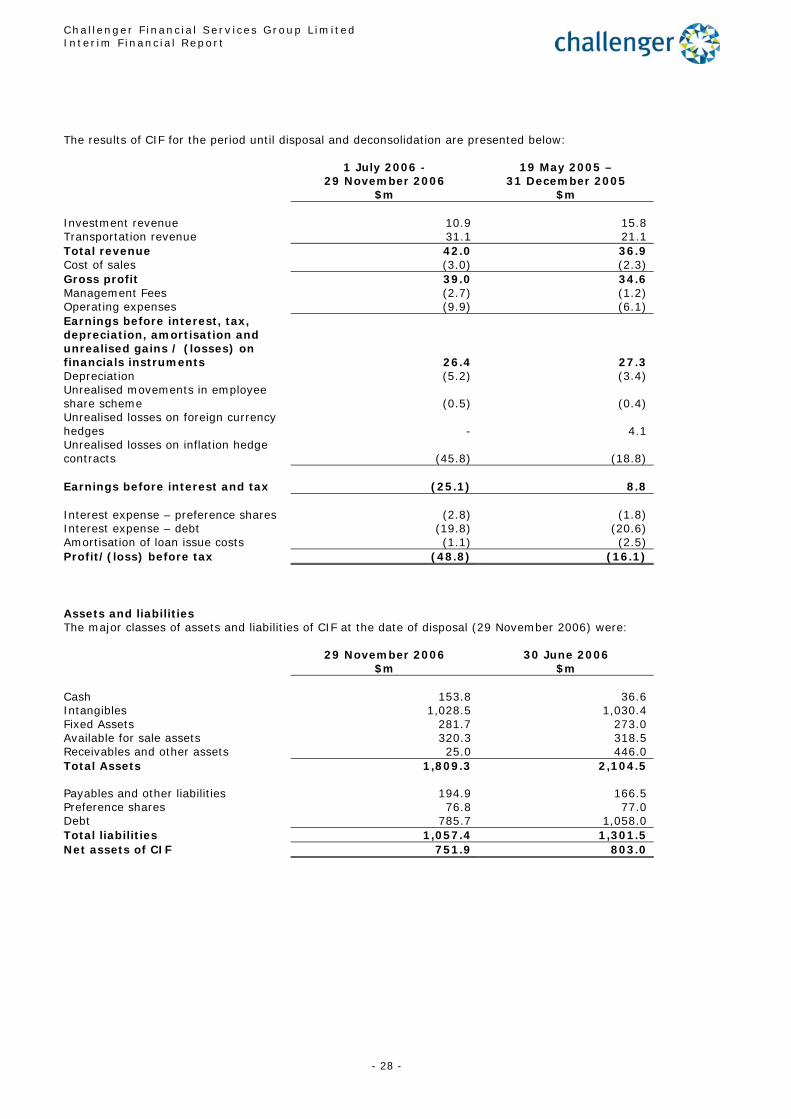
The results of CIF for the period until disposal and deconsolidation are presented below: 1 July 2006 -
29 November 2006 $m
19 May 2005 – 31 December 2005
$m Investment revenue 10.9 15.8 Transportation revenue 31.1 21.1 Total revenue 42.0 36.9 Cost of sales (3.0) (2.3) Gross profit 39.0 34.6 Management Fees (2.7) (1.2) Operating expenses (9.9) (6.1) Earnings before interest, tax, depreciation, amortisation and unrealised gains / (losses) on financials instruments
26.4
27.3 Depreciation (5.2) (3.4) Unrealised movements in employee share scheme
(0.5)
(0.4)
Unrealised losses on foreign currency hedges
-
4.1
Unrealised losses on inflation hedge contracts
(45.8)
(18.8)
Earnings before interest and tax
(25.1)
8.8
Interest expense – preference shares
(2.8)
(1.8) Interest expense – debt (19.8) (20.6) Amortisation of loan issue costs (1.1) (2.5) Profit/(loss) before tax (48.8) (16.1) Assets and liabilities The major classes of assets and liabilities of CIF at the date of disposal (29 November 2006) were: 29 November 2006 30 June 2006 $m $m Cash 153.8 36.6 Intangibles 1,028.5 1,030.4 Fixed Assets 281.7 273.0 Available for sale assets 320.3 318.5 Receivables and other assets 25.0 446.0 Total Assets 1,809.3 2,104.5
Payables and other liabilities 194.9 166.5 Preference shares 76.8 77.0 Debt 785.7 1,058.0 Total liabilities 1,057.4 1,301.5 Net assets of CIF 751.9 803.0
- 28 -
Chal lenger F inanc ia l Serv ices Group L imited Inter im F inanc ia l Report
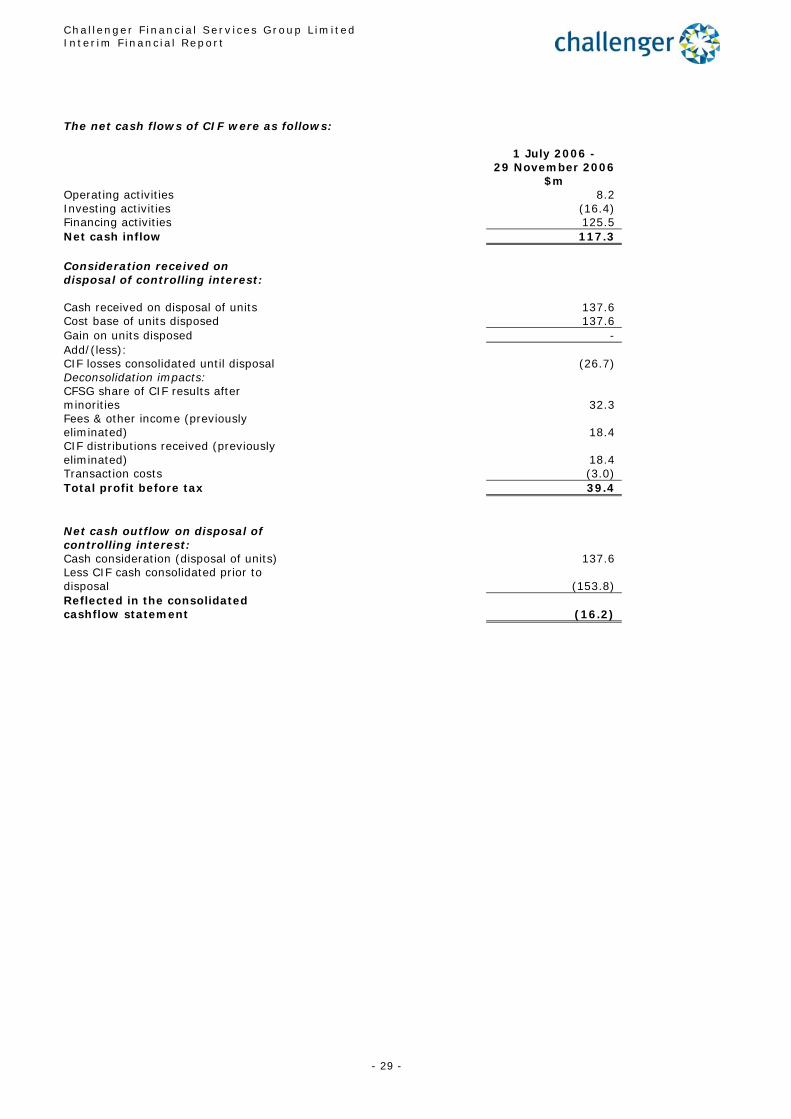
The net cash flows of CIF were as follows:
1 July 2006 - 29 November 2006
$m Operating activities 8.2 Investing activities (16.4) Financing activities 125.5 Net cash inflow 117.3 Consideration received on disposal of controlling interest:
Cash received on disposal of units 137.6 Cost base of units disposed 137.6 Gain on units disposed - Add/(less): CIF losses consolidated until disposal (26.7) Deconsolidation impacts: CFSG share of CIF results after minorities
32.3
Fees & other income (previously eliminated)
18.4
CIF distributions received (previously eliminated)
18.4
Transaction costs (3.0) Total profit before tax 39.4 Net cash outflow on disposal of controlling interest: Cash consideration (disposal of units) 137.6 Less CIF cash consolidated prior to disposal (153.8) Reflected in the consolidated cashflow statement (16.2)
- 29 -
Chal lenger F inanc ia l Serv ices Group L imited Inter im F inanc ia l Report
Note 16. Subsequent Events On 4 January 2007 the Board approved the establishment of a plan, to be called the Challenger Performance Plan, in accordance with the Plan Rules, for the provision of incentives to executives, senior managers and other key contributors to the business of the Company and its subsidiaries (“Eligible Participants”) by the grant of options and performance rights. On 23 February 2007 Challenger Financial Services Group Limited announced it had agreed to subscribe for 8.3 million new shares in Homeloans Limited at 80 cents per share. Subject to shareholder approval by Homeloans Limited, the Group has also agreed to subscribe for an additional tranche of 31.7 million new shares at $1.20 per share – bringing the total investment to approximately $44.7 million. Following issue of the shares, Challenger will have approximately a 40 per cent interest in Homeloans Limited. Except as disclosed in this note, as at the date of this report no matters or circumstances have arisen that has affected or may significantly affect:
(a) the Group's operations in future financial years; or (b) the results of those operations in future financial years; or (c) the Group's state of affairs in future financial years.
Note 17. Contingent Assets and Liabilities During the 2005 financial year a claim for fees relating to the 13 August 2004 acquisition of Associated Planners was lodged against Challenger Financial Services Limited. The Company has denied liability and during the current financial year commenced proceedings in the NSW Supreme Court seeking a declaration that the claim is invalid. The Directors remain of the view that no material loss will be incurred. A class action, on behalf of a minority of the number of investors in the Challenger Howard Property Trust for Penrith Mega Homemaker Centre Sydney (the trust), has been filed in the Supreme Court of New South Wales against Challenger Managed Investments Limited, a controlled subsidiary and responsible entity for the trust. Challenger Managed Investments Limited is defending the proceedings and denies the allegations made against it. During the previous financial year a controlled entity, Challenger Life No. 2 Ltd had received certain warranty claims in connection with the sale of a subsidiary. Under the terms of the sale agreement the Company’s maximum financial exposure for warranty claims cannot exceed $5 million. In addition the Group has over the course of its corporate rationalisation activity, given warranties to the purchasers on several agreements which are still outstanding at 31 December 2006. At the date of this report no material claims against these warranties have been received by the Group. At balance date the Company was in discussions with the ATO in relation to the appropriate application of GST to certain transactions entered into at the time of the corporatisation in December 2003. At the date of signing the interim financial statements, resolution of this matter had not been reached with the ATO. The amount of GST involved is not considered to be material by the Directors. In the normal course of business, the Group enters into various types of business contracts that could give rise to contingent liabilities in relation to performance obligations under those contracts by certain members of the group. The information usually required by AASB 137 Provisions, Contingent Liabilities and Contingent Assets, is not disclosed on the grounds that it may seriously prejudice the outcome of the claims. At the date of this report significant uncertainty exists regarding any potential liability under these claims, however the Directors are of the opinion that no material loss will be incurred.
- 30 -

Challenger Financial Services Group Limited Interim Financial Report
Directors' Declaration
In the opinion of the Directors of Challenger Financial Services Group Limited (the Company) :
On behalf of the Board
M Tilley
G A Cubbin Director
Director
007 ,r~z ~-Icj~ 2007
challenger
In accordance with a resolution of the Directors of Challenger Financial Services Group Limited, I state that :
a) the financial statements and notes of the Group are in accordance with the Corporations Act 2001, including :
(i) giving a true and fair view of the financial position as at 31 December 2006 and of their performance for the half year ended on that date of the Group; and
(ii) complying with Australian Accounting Standard AASB 134 : Interim Financial Reporting and the Corporations Regulations 2001; and
b) there are reasonable grounds to believe that the Company will be able to pay its debts as and when they become due and payable.
JERNST &YOUNG
To the members of Challenger Financial Services Group Limited
Report on the Half-Year Financial Report
ff Ernst & Young Centre
a Tel
61 2 9248 5555 680 George Street
Fax
61 2 9248 5959 Sydney NSW 2000
DX
Sydney Stock Australia
Exchange 10172
GPO Box 2646 Sydney NSW 2001
We have reviewed the accompanying half-year financial report of Challenger Financial Services Group Limited (the company) and the entities it controlled during the half-year period, which comprises the balance sheet as at 31 December 2006, and the income statement, statement of changes in equity and cash flow statement for the half-year ended on that date, a summary of significant accounting policies, other explanatory notes and the directors' declaration.
Directors' Responsibility for the Half-Year Financial Report The directors of the company are responsible for the preparation and fair presentation of the half-year financial report in accordance with Australian Accounting Standards (including the Australian Accounting Interpretations) and the Corporations Act 2001. This responsibility includes designing, implementing and maintaining internal controls relevant to the preparation and fair presentation of the financial report that is free from material misstatement, whether due to fraud or error; selecting and applying appropriate accounting policies ; and making accounting estimates that are reasonable in the circumstances .
Auditor's Responsibility Our responsibility is to express a conclusion on the half-year financial report based on our review. We conducted our review in accordance with Auditing Standard on Review Engagements ASRE 2410 Review of an Interim Financial Report Performed by the Independent Auditor of the Entity, in order to state whether, on the basis of the procedures described, we have become aware of any matter that makes us believe that the financial report is not in accordance with the Corporations Act 2001 including : giving a true and fair view of the consolidated entity's financial position as at 31 December 2006 and its performance for the half-year ended on that date ; and complying with Accounting Standard AASB 134 Interim Financial Reporting and the Corporations Regulations 2001 and other mandatory financial reporting requirements in Australia. As the auditor of Challenger Financial Services Group Limited and the entities it controlled during the half-year, ASRE 2410 requires that we comply with the ethical requirements relevant to the audit of the annual financial report .
A review of a half-year financial report consists of making enquiries, primarily of persons responsible for financial and accounting matters, and applying analytical and other review procedures. A review is substantially less in scope than an audit conducted in accordance with Australian Auditing Standards and consequently does not enable us to obtain assurance that we would become aware of all significant matters that might be identified in an audit. Accordingly, we do not express an audit opinion.
Independence In conducting our review, we have complied with the independence requirements of the Corporations Act 2001 . We have given to the directors of the company a written Auditor's Independence Declaration, a copy of which is included in the Directors' Report . In addition to our review of the financial report, we were engaged to undertake non-audit services . The provision of these services has not impaired our independence .
Liability limited by a scheme approved under Professional Standards Legislation

JERNST&YOUNG
Conclusion Based on our review, which is not an audit, we have not become aware of any matter that makes us believe that the interim financial report of Challenger Financial Services Group Limited and the entities it controlled during the half-year, is not in accordance with: (a)
the Corporations Act 2001, including: (i)
giving a true and fair view of the consolidated entity's financial position as at 31 December 2006 and of its performance for the half-year ended on that date ; and
(ii)
complying with Accounting Standard AASB 134 Interim Financial Reporting and the Corporations Regulations 2001; and
(b)
other mandatory financial reporting requirements in Australia.
Ernst & Young
Brian Long Partner Sydney 23 February 2007