Embed Size (px)
Citation preview
i
CFD ANALYSIS OF FLOW PATTERN IN ELECTROCHEMICAL MACHINING
A THESIS SUBMITTED IN PARTIAL FULFILMENT
OF THE REQUIREMENTS FOR THE DEGREE OF
Bachelor of Technology
In
Mechanical Engineering
By
SURESH SAIN
107ME047
Under the Guidance of
Dr. C.K.BISWAS
Department of Mechanical Engineering
National Institute of Technology
Rourkela
2011

ii
National Institute of Technology
Rourkela
CERTIFICATE
This is to certify that thesis entitled, ―CFD ANALYSIS OF FLOW PATTERN IN
ELECTROCHEMICAL MACHINING‖ submitted by Mr. SURESH SAIN in partial fulfillment
of the requirements for the award of Bachelor of Technology Degree in Mechanical Engineering
at National Institute of Technology, Rourkela is an authentic work carried out by him under my
supervision and guidance.
To the best of my knowledge, the matter embodied in this thesis has not been submitted to any
other university/ institute for award of any Degree or Diploma.
Date: 11th
may, 2011 Dr. C.K.BISWAS
Dept. of Mechanical Engineering
National Institute of Technology
Rourkela-769008

iii
ACKNOWLEDGEMENT
Successful completion of work will never be one man’s task. It requires hard work in right
direction. There are many who have helped to make my experience as a student a rewarding one.
In particular, I express my gratitude and deep regards to my project supervisor, Dr. C.K. Biswas,
Associate professor, Dept. of Mechanical Engineering, NIT Rourkela for kindly providing me to
work under his supervision and guidance. I extend my deep sense of indebtedness and gratitude
to him first for his valuable guidance, constant encouragement & kind co-operation throughout
period of work which has been instrumental in the success of thesis.
I express my sincere thanks to Dr. R.K. Sahoo, Head of the Department of Mechanical
Engineering, NIT, Rourkela for providing me the necessary facilities in the department.
I express my sincere gratitude to Prof. A.K. Satpathy, faculty-in-charge, CFD lab for his timely
help during the course of work.
I am also thankful to all the staff members of the department of Mechanical Engineering and to
all my well-wishers for their inspiration and help.
Special thanks to my parents & elders without their blessings & moral enrichment I could not
have landed with this outcome. Above all, even though, he does not need any credit, but my
prayers & ovations to the Omnipotent, who strengthened me to stand with smile against the odds
coming in this course of work without fail & blessed me with this fruit of work for my
dedication.
Date: 11th
may, 2011 SURESH SAIN
107ME047
iv
ABSTRACT:-
Electrochemical machining is the advanced machining method and it has been applied to many
highly specialize field like aerospace and medical industries. But, in this technology still we have
many problems to overcome such as electrolytic processing and disposal of metal hydroxide
sludge etc.. Many of machine tools used in this machining method works in a pulsating mode. So
besides these vibrations we can’t get accuracy in the results. So to obtain the accurate results we
have to overcome these problems, and CFD is considered to be the most powerful tool for that.
But there is no such numerical method which can satisfactorily predict the flow. It is necessary to
take into account that the unsteady character of electrolyte flow in the inter-electrode space. For
this purpose orthogonal coordinate system it to introduce on the anode surface.
For the description of the electrolyte flow the system of the equation of preservation for mass of
liquid and we have to find the solutions of different parameters used in this technology and also
compare these quantities with the standard values. For these entire CFD analysis purpose one can
use Gambit-Fluent software which can provide an overview about the machining parameters
like, how they affect the process, which flow velocity is suitable for a particular value of current
density.

v
CONTENTS
Description Page No.
CERTIFICATE ii
ACKNOWLEDGEMENT iii
ABSTRACT iv
LIST OF FIGURES vii
LIST OF TABLES viii
NOMENCLATURE viii
CHAPTER-1 INTRODUCTION
1.1 Overview of ECM 1
1.2 Principle of ECM 2
1.3 Chemical reactions involves in ECM process 4
1.4 ECM machine parameters 6
1.5 Specifications of ECM 8
CHAPTER-2 LITERATURE SURVEY
2.1 Overview of ECM and CFD process 9
2.2 Objective of the present work 12
CHAPTER-3 MATHEMATICAL MODELLING
3.1 Governing equations 13
3.2 Assumptions 15
3.3 Simulation condition and procedure 16

vi
3.3.1 Element type 17
3.3.2 Material properties and applied boundary condition 17
CHAPTER-4 RESULT AND DISCUSSION
4.1 Temperature, Inlet Velocity and Pressure profiles 19
4.2 Graphical Solution 27
CHAPTER-5 CONCLUSION 29
REFERENCES 30
APPENDIX 32
BIBLIOGRAPHY 32
vii
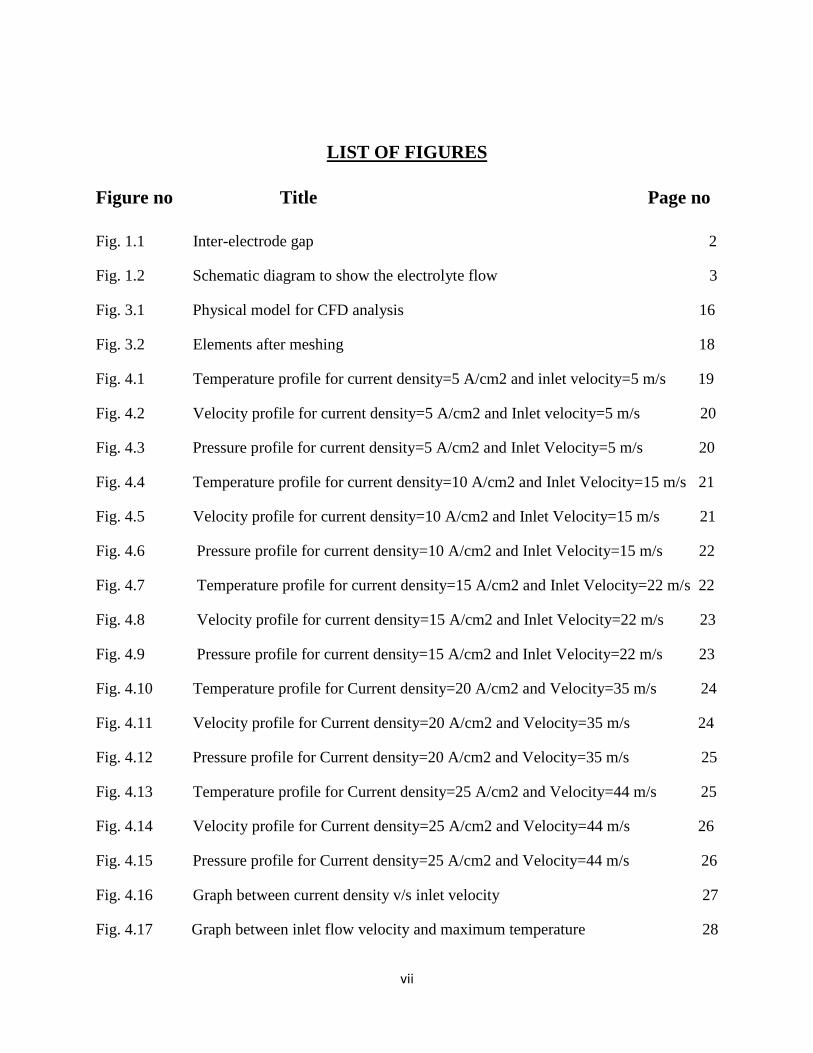
LIST OF FIGURES
Figure no Title Page no
Fig. 1.1 Inter-electrode gap 2
Fig. 1.2 Schematic diagram to show the electrolyte flow 3
Fig. 3.1 Physical model for CFD analysis 16
Fig. 3.2 Elements after meshing 18
Fig. 4.1 Temperature profile for current density=5 A/cm2 and inlet velocity=5 m/s 19
Fig. 4.2 Velocity profile for current density=5 A/cm2 and Inlet velocity=5 m/s 20
Fig. 4.3 Pressure profile for current density=5 A/cm2 and Inlet Velocity=5 m/s 20
Fig. 4.4 Temperature profile for current density=10 A/cm2 and Inlet Velocity=15 m/s 21
Fig. 4.5 Velocity profile for current density=10 A/cm2 and Inlet Velocity=15 m/s 21
Fig. 4.6 Pressure profile for current density=10 A/cm2 and Inlet Velocity=15 m/s 22
Fig. 4.7 Temperature profile for current density=15 A/cm2 and Inlet Velocity=22 m/s 22
Fig. 4.8 Velocity profile for current density=15 A/cm2 and Inlet Velocity=22 m/s 23
Fig. 4.9 Pressure profile for current density=15 A/cm2 and Inlet Velocity=22 m/s 23
Fig. 4.10 Temperature profile for Current density=20 A/cm2 and Velocity=35 m/s 24
Fig. 4.11 Velocity profile for Current density=20 A/cm2 and Velocity=35 m/s 24
Fig. 4.12 Pressure profile for Current density=20 A/cm2 and Velocity=35 m/s 25
Fig. 4.13 Temperature profile for Current density=25 A/cm2 and Velocity=44 m/s 25
Fig. 4.14 Velocity profile for Current density=25 A/cm2 and Velocity=44 m/s 26
Fig. 4.15 Pressure profile for Current density=25 A/cm2 and Velocity=44 m/s 26
Fig. 4.16 Graph between current density v/s inlet velocity 27
Fig. 4.17 Graph between inlet flow velocity and maximum temperature 28

viii
LIST OF TABLES
Table no. Title Page no
Table 1.1 ECM specification 8
Table 3.1 The element type used in the analysis 17
Table 3.2 The material properties for copper, Iron and Electrolyte used 17
NOMENCLATURE
= Mass-averaged velocity
= Mixture density
= Volume fraction of phase k
n = no. of phases
F= Body force
= Viscosity of mixture
= Drift velocity for secondary phase k
= Effective conductivity
= Turbulent thermal conductivity
Gb = Turbulent K.E. due to buoyancy
Gk = Turbulent K.E. due to mean velocity gradient
σ = Turbulent Prandtl no.
1
CHAPTER 1
INTRODUCTION
1.1 Overview of ECM process:-
It is very difficult to machine a high strength, heat-resistant material into complex shapes by
conventional techniques, but such materials can be effectively machined by electrochemical
machining (ECM) method. Therefore it stemmed the requirement of electrochemical machining
process in many industries. ECM is an electrochemical process in which the work piece acts as
an Anode and the tool acts as a Cathode. An electrolyte generally sodium chloride or sodium
nitrate with a velocity of 5-50 m/s is supplied through the concentric hole in the cathode and it
falls over the anode surface, a small gap of 0.05-0.8 mm is provided in between the two
electrodes. When a small voltage of 5-30 V is applied across the inter electrode gap, a high
current density of the order of 5-100 A/cm2 is producing which results in dissolution of metal
from anode (work-piece) electrochemically and gas generation occurs at cathode-tool electrode.
Allowing the electrolyte to flow through the inter-electrode gap to remove the solid and gaseous
products as well as the heat generated caused by the passes of current and electrochemical
reactions. The rates of electrochemical dissolution depend strongly on the temperature. The
energy losses in the gap are large but the heat can be removed by high flow of electrolyte and,
thus, depends on the geometry. Accordingly the temperature at the anode surface is not exactly
known, it can be in the range from 40 to 85 oC. The ECM method is quite effective and accurate
to obtain a required shape of work-piece within a given tolerance on the shape and dimensions
using the cathode-tool electrode with a shape which is geometrically close to the final shape of
the work-piece.

2
1.2 Principal of ECM:-
ECM is the controlled removal of metal by anodic dissolution in an electrolytic cell in which the
work piece is the anode and the tool is cathode. Electrochemical machining is developed on the
principle of Faradays and Ohm. In this process, an electrolyte cell is formed by the anode (work-
piece) and the cathode (tool) in the midst of a following electrolyte. The metal is removed by the
controlled dissolution of the anode according to the well-known Faradays law of electrolysis.
Fig1.1 shows two electrodes which are placed closely with a gap of about 0.5 mm and immersed
in an electrolyte which is a solution of sodium chloride (common salt).
Figure 1. 1 Inter-electrode gap
The high current densities promote rapid generation of metal hydroxides and gas bubble in the
small spacing between the electrodes. These become a barrier to the electrolyzing current after a
few seconds. To maintain a continuous high density current, these products of machining must
be continuously removed. This is achieved by circulating the electrolyte at a high velocity
through the gap between the electrodes. It is also to be noted that the machining gap size
increases as the metal is removed. The larger gap leads to a decrease in the metal removal rate.
3
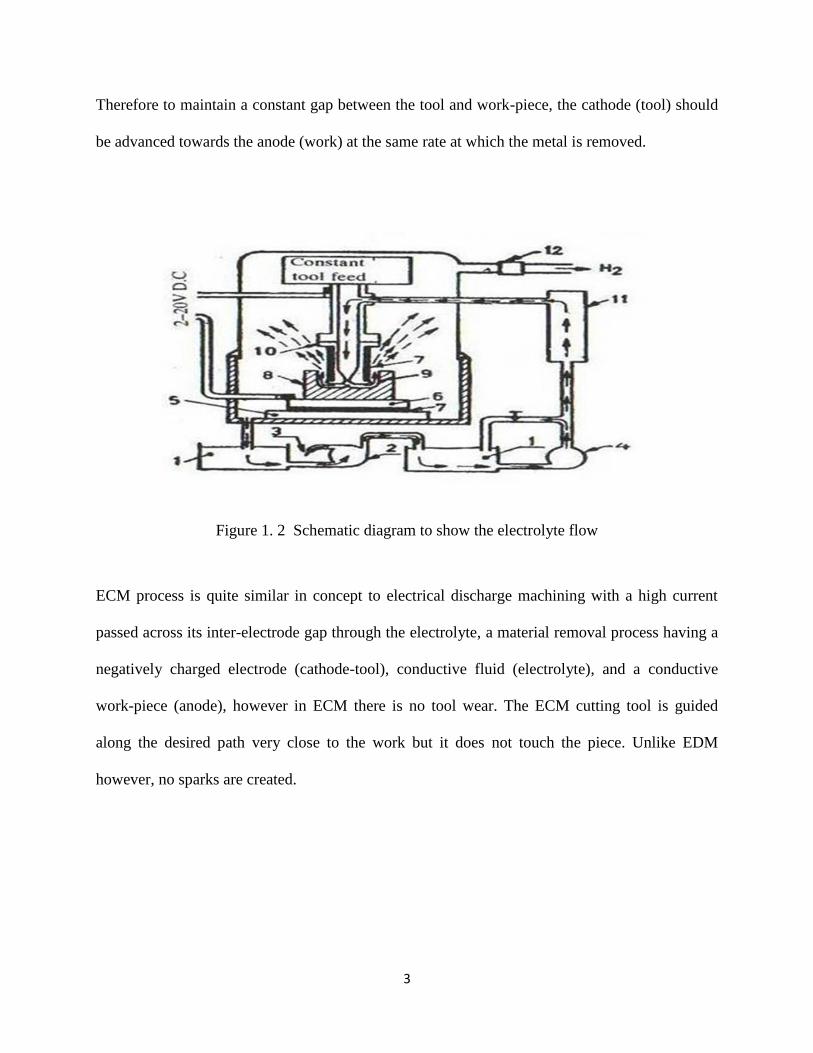
Therefore to maintain a constant gap between the tool and work-piece, the cathode (tool) should
be advanced towards the anode (work) at the same rate at which the metal is removed.
Figure 1. 2 Schematic diagram to show the electrolyte flow
ECM process is quite similar in concept to electrical discharge machining with a high current
passed across its inter-electrode gap through the electrolyte, a material removal process having a
negatively charged electrode (cathode-tool), conductive fluid (electrolyte), and a conductive
work-piece (anode), however in ECM there is no tool wear. The ECM cutting tool is guided
along the desired path very close to the work but it does not touch the piece. Unlike EDM
however, no sparks are created.

4
1.3 Chemical reactions involves in ECM process:-
When a potential difference is applied across the inter-electrode gap, the water and electrolyte
present in the gap undergo ionic dissociation as shown below,
NaCl ↔ Na+ + Cl
-
H2O ↔ H
+ + (OH)
-
Also the positive ions move towards the tool and negative ions move towards work-piece. Thus
the hydrogen ions will take away electrons from the cathode (tool) and from hydrogen gas as:
2H+ + 2e
- = H
2↑ at cathode
Similarly, iron from work-piece material, forms iron ion and it combines with hydroxyl ion to
form sodium hydroxide as,
Fe = Fe+ +
+ 2e-
Na+ + OH
- = NaOH
In practice FeCl2 and Fe (OH)2 would form and get precipitated in the form of sludge. In this
manner it can be noted that the work piece gets gradually machined and gets precipitated as the
sludge. Moreover there is not coating on the tool, only hydrogen gas evolves at the tool.
5
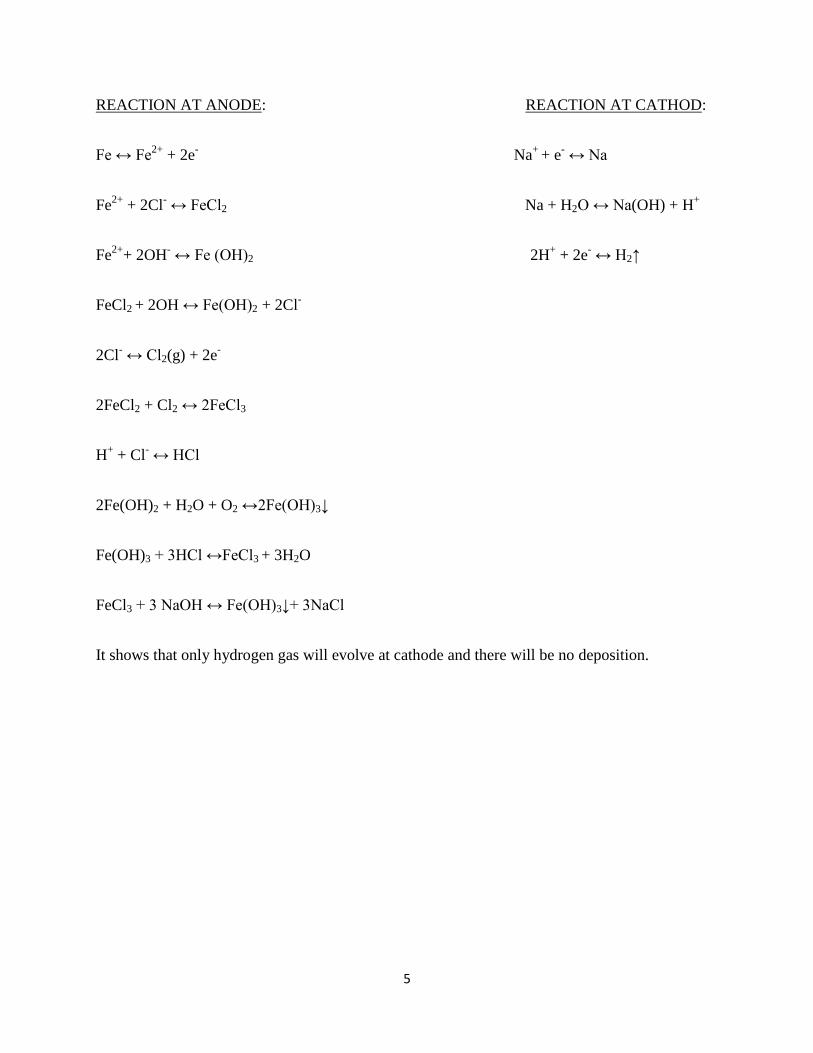
REACTION AT ANODE: REACTION AT CATHOD:
Fe ↔ Fe2+
+ 2e- Na
+ + e
- ↔ Na
Fe2+
+ 2Cl- ↔ FeCl2 Na + H2O ↔ Na(OH) + H
+
Fe2+
+ 2OH- ↔ Fe (OH)2 2H
+ + 2e
- ↔ H2↑
FeCl2 + 2OH ↔ Fe(OH)2 + 2Cl-
2Cl- ↔ Cl2(g) + 2e
-
2FeCl2 + Cl2 ↔ 2FeCl3
H+ + Cl
- ↔ HCl
2Fe(OH)2 + H2O + O2 ↔2Fe(OH)3↓
Fe(OH)3 + 3HCl ↔FeCl3 + 3H2O
FeCl3 + 3 NaOH ↔ Fe(OH)3↓+ 3NaCl
It shows that only hydrogen gas will evolve at cathode and there will be no deposition.

6
1.4 ECM machine parameters:-
1.4.1 Electrolyte:-
The electrolyte is very essential parameter for the electrolytic process to work. In ECM process the
electrolyte is used to perform three main functions:-
1. It dissipates heat produced in the operation.
2. It carries the current between the tool and the work-piece.
3. It removes the products of machining from the cutting region.
For ECM process the electrolytes must have high electrical conductivity, low toxicity and low
corrosiveness. The electrolyte is pumped at about 14 Kg/cm2 and at speed ranging from 5-50 m/s.
1.4.2 Servo system:-
The servo system controls the tool motion relative to the work piece to follow the desired path. It
also controls the gap width within such a range that the discharge process can continue. If tool
electrode moves too fast and touches the work piece, short circuit occurs. Short circuit
contributes little to material removal because the voltage drop between electrodes is small and
the current is limited by the generator. If tool electrode moves too slowly, the gap becomes too
wide and electrical discharge never occurs. Another function of servo system is to retract the tool
electrode when deterioration of gap condition is detected.
1.4.3 Temperature control:-
To avoid the variation in the conductivity, the temperature of the electrolyte in ECM process
must keep constant. Lower the temperature of the electrolyte; lower be the rate of metal removal
7
and higher value of temperature may lead to the vaporization of the electrolyte. Therefore
temperature of electrolyte must be maintained between 30 to 80°C.
1.4.4 Pumps:-
Single or multi-stage centrifugal pumps are used on ECM equipment. A minimum flow rate 20
liters/min per 100 A. Electrolyzing current is generally required. A pressure of 5-30 kg/cm2
meets most of the requirements of ECM application.
1.4.5 Tool feed rate:-
In ECM process, a gap of about 0.05 to 0.8 mm is maintained between tool and work piece. For
smaller gap, the electrical resistance between the tool and work-piece is very less and hence the
current is high and accordingly maximum metal is removed. The tool is fed in to the work
depending upon the how fast the metal is to be removed. The movement of the tool slide is
controlled by a hydraulic cylinder giving some range of feed rate.
1.4.6 Material removal rate:-
It is a function of feed rate which dictates the current passed between the work and the tool. As
the tool advances towards work, gap decreases and current increases which increases more metal
at a rate corresponding to tool advance. A stable spacing between tool and work is thus
established.
1.4.7 Tool design:-
As no tool wear takes place in ECM process, so any good conductor can be satisfactory used as a
tool material, but it must be designed strong enough to withstand the hydrostatic force, caused by
8
electrolyte being forced at high speed through the inter-electrode gap. The tool is made hollow
for drilling holes so that electrolyte can pass along the bore in tool.
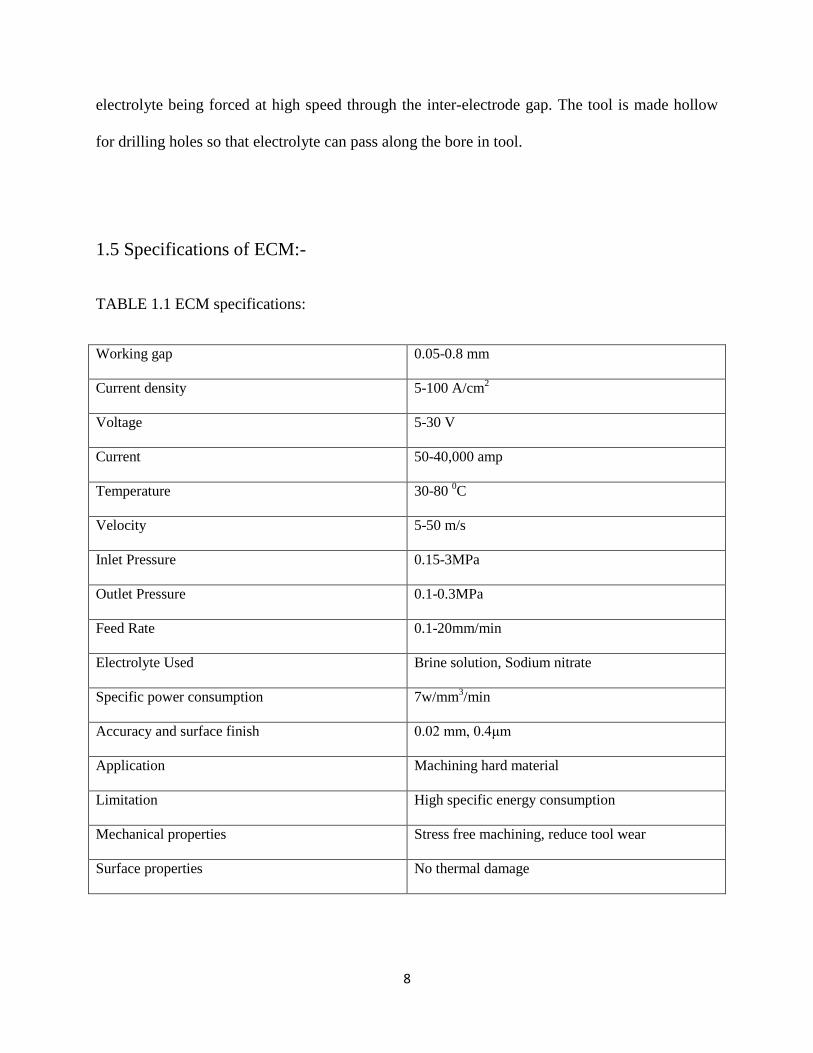
1.5 Specifications of ECM:-
TABLE 1.1 ECM specifications:
Working gap 0.05-0.8 mm
Current density 5-100 A/cm2
Voltage 5-30 V
Current 50-40,000 amp
Temperature 30-80 0C
Velocity 5-50 m/s
Inlet Pressure 0.15-3MPa
Outlet Pressure 0.1-0.3MPa
Feed Rate 0.1-20mm/min
Electrolyte Used Brine solution, Sodium nitrate
Specific power consumption 7w/mm3/min
Accuracy and surface finish 0.02 mm, 0.4μm
Application Machining hard material
Limitation High specific energy consumption
Mechanical properties Stress free machining, reduce tool wear
Surface properties No thermal damage

9
CHAPTER 2
LITERATURE SURVEY
2.1 Overview of ECM and CFD process:-
Evgueny I. Filatov [1] In this paper, for the simulation of electrolyte flow, the process of EC
machining of a two-dimensional surface of a machine part is the focus of this investigation. The
linear approximation for electrostatic field is assumed and also assumes that a part of a small
volume is occupied by liquid and remaining volume is occupied by both air and hydrogen
together. For the description of the electrolyte flow, the system of the equations of preservation
for mass of liquid, mass of air and mass of hydrogen, as well as equations of preservation for
energy and pulse of the whole mixture was taken.
J. Kozak [2] presented the physical and mathematical models on the basis of which the
simulation process module in the computer-aided engineering system for ECM (CAE-ECM) has
been developed. It is desirable for accuracy that the final shape of work-piece should be achieved
under steady state of ECM conditions, determined by prescribing the characteristic equilibrium
gap Sf , hydrodynamic parameters such as pressures at the inlet and outlet of the gap and
properties of electrolyte. The mathematical model of the ECM process, referring to the
formulated problem consists of a sequence of mutual conjugated partial models which describe
in the gap: distribution of the local gap size S, distribution of the flow parameters such as the
static pressure p and the velocity v, distribution of temperature T, distribution of the void fraction
b (volumetric gas concentration) or the thickness layer with two phase flow (electrolyte and gas)
h, distribution of the electrical conductivity k and the current density i.

10
J. Kozak et al. [3] presented a new variant of ECM a universal tool electrode of simple shape
with complex, controlled kinematics along the work-piece is presented and a mathematical
model and computer simulation results of ECM-CNC.
An appropriate electrolyte, such as aqueous Natrium chloride solution, is chosen so that when a
small voltage of 10–15 V is applied between the electrodes, metal is dissolved electrochemically
from the anode-workpiece, and gas generation occurs at the cathode-tool electrode. Allowing the
electrolyte to flow through the inter-electrode gap, the solid and gaseous products, as well as the
heat generated are rapidly removed.
M.M. Lohrengel et al. [4] illustrated that the work-pieces of steel and other metals are
structured in neutral NaNO3 solution by anodic dissolution at large current densities (about 100
A/cm2) and high electrolyte flow rates (some m/s). Accordingly, an identification of the
processes, the structure and the current distribution at the interface of the work-piece is critical.
Since available simulation software for ECMM neglects details of the work-piece*/electrolyte
interface and needs detailed information on rate determining processes, two new strategies are
presented.
Huaiqian et al. [5] proposed a precise and ecofriendly micromachining technology for
aerospace application called electrochemical machining in pure water (PW-ECM). On the basis
of the principles of water dissociation, a series of test setups and tests are devised and performed
under different conditions. These tests explain the need for technological conditions realizing
PW-ECM, and further explore the technological principles. The results from the tests
demonstrate a successful removal of electrolytic slime by means of ultrasonic vibration of the
work piece.
11
B. Bhattacharyya et al. [6] this paper includes the analysis of the basic material removal
mechanism in the ECDM process for the effective machining of non-conducting ceramic
materials with enhanced machining rate and higher machining accuracy. The ECDM process is
influenced by various process parameters such as the applied voltage; the inter-electrode gap, the
temperature, concentration and type of electrolyte; the shape, size and material of the electrodes;
and the nature of the power supply, etc.
T.R. Idrisov et al. [7] proposed a model of anode dissolution at the electrochemical machining
by bipolar microsecond pulses at current densities up to 100 A/cm2, taking into account the non-
stationary nature of anode and cathode potentials installation during the pulse effect and a
preliminary reverse polarity pulse influence on anode potential, as well as change of temperature
and gas-filling of an electrolyte in inter-electrode space (IES).
Lyubimov et al. [8] illustrated the peculiarities of synthetic diamond wear in tools for
electrochemical grinding are studied for the machining of metal–ceramic hard alloys. The
influence of structure, mechanical characteristics of both diamond grains and hard alloys as well
as the regimes of grinding on diamond wear are considered. Data of diamond consumption
during electrochemical grinding are presented in comparison with the routine grinding process.
Initiation and development and the mutual relation of various components of the diamond
deterioration-cracking, abrasion, adhesion, diffusion and chemical wear at the electrochemical
grinding – are discussed. Optimum regimes of hard alloy electrochemical grinding are
recommended: working voltage 5–8 V; current density 20–60 A/cm2; normal component of
grinding force 1.5–2.0 MPa; grinding speed 12–15 m/s.
12
Jerzy Kozaka et al. [9] presented a mathematical model, the results of computer simulation and
experimental investigations of electrochemical machining with a spherical tool-electrode.
Accuracy of computer simulation evaluated by differences between results of experimental tests
and computer simulation depends on accuracy of a priori estimation of electrochemical
machining coefficient, total over potential of electrode processes, electrical conductivity of
electrolyte, etc.
2.2 Objective of the present work:-
The main objective of this paper is an attempt to find out the temperature and velocity
distribution of the electrolyte by using Fluent software, and also determine how much inlet
velocity is required corresponding to a particular value of current density so that the maximum
temperature of the electrolyte shouldn’t exceeds the boiling temperature of the electrolyte. And
finally a graph showing a relationship between inlet velocity & current density and inlet velocity
& maximum temperature is to be drawn.

13
CHAPTER 3
MATHEMATICAL MODELLING
In this chapter the governing equations for the FLUENT software used in modal analysis have
been depicted. And it also has been presented the element selection, assumptions made and
simulation procedure used in this analysis.
When the electrical current flows through a conductor, then according to Joule’s heating effect
the electrical energy is converted into thermal energy and produces heat. Also the electrical
conductivity is temperature dependent and the internal heat generation depends on electrical
current.
3.1 Governing equation:-
In present work, if boiling of electrolyte takes place, then there exist two phases a liquid and
vapors, and these two phases interacting with each other everywhere in the computational
domain. The motion of each phase is governed by their respective mass and momentum
conservation equations.
Continuity equation:-
(1)
Where, is the mass-averaged velocity
And is the mixture density
(2)

14
(3)
Momentum equation:-
The total momentum can be obtained by summing individual momentum of both phases. It can
be expressed as:-
(4)
Where, n is the number of phases, is the viscosity of the mixture and F is a body force,
is the drift velocity for secondary phase k.
Energy equation:-
(5)
Where, Kt is the turbulent thermal conductivity (electrolyte),
keff is the effective conductivity (∑αk (kk + kt))
The energy transferred due to conduction is represented by the first term on the right hand side,
where SE includes any other volumetric heat sources.
Turbulence kinetic energy:-
The turbulence kinetic energy and its rate of dissipation can be obtained by solving the given
transport equation:
(6)
15
And,
(7)
Where, in these equations, GK represents the generation of kinetic energy due to mean velocity
gradient, YM represents the contribution of the fluctuating dilatation in compressible turbulence
to the overall dissipation rate and Gb is the generation of turbulence kinetic energy due to
buoyancy.
σk and σε are the turbulent Prandtl numbers for k and ε respectively, C1ε, C2ε and C3ε are
constants, .
Sk and Sε are user-defined source terms.
3.2 Assumptions:-
1. In present analysis, the heat is generated in the inter-electrode gap only.
2. The domain is considered as axis-symmetric.
3. The channel through which electrolyte flows is considered to be a uniform cylinder
4. It is considered that the height of the electrode is much larger than the size of inter-
electrode gap and the outer wall of the cylinder is considered to be adiabatic.
5. The current and voltage is kept constant throughout the analysis.
6. The material properties of both the electrodes will not change with temperature, but they
will change for electrolyte.
7. The tool and work-piece are homogeneous and isotropic.
8. In the inter-electrode gap, there is a partial conversion of electrical energy into thermal
energy by joule’s heating effect.
16
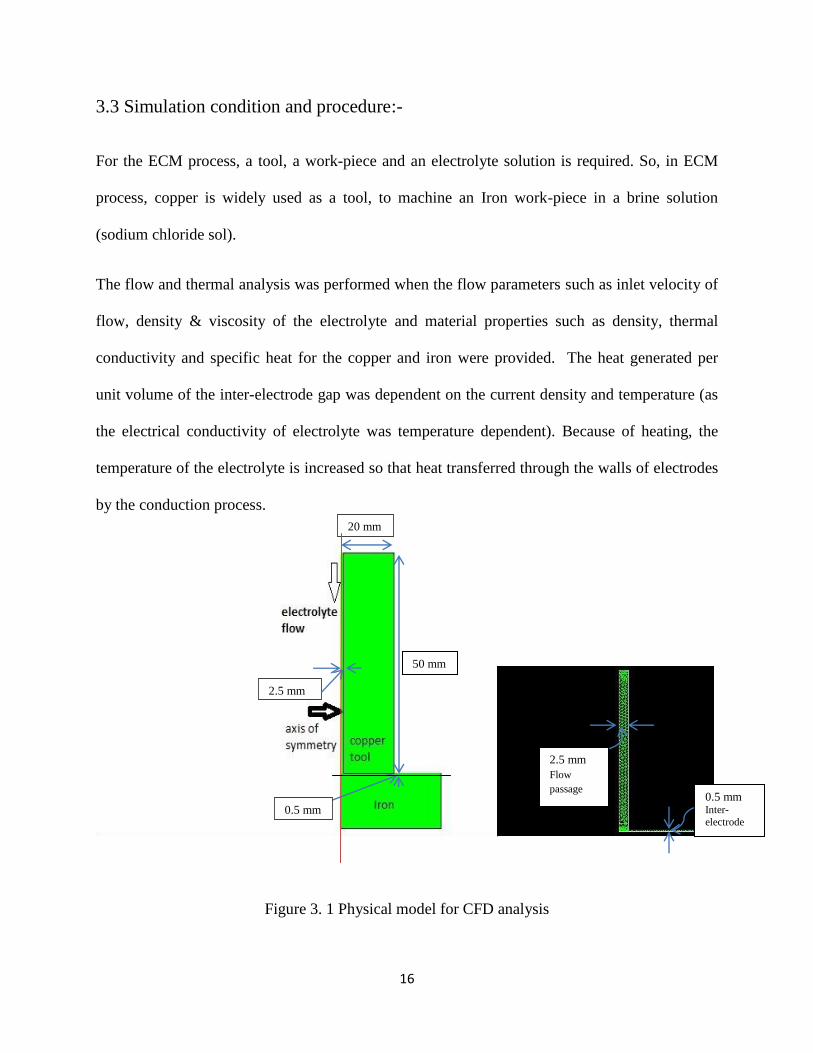
3.3 Simulation condition and procedure:-
For the ECM process, a tool, a work-piece and an electrolyte solution is required. So, in ECM
process, copper is widely used as a tool, to machine an Iron work-piece in a brine solution
(sodium chloride sol).
The flow and thermal analysis was performed when the flow parameters such as inlet velocity of
flow, density & viscosity of the electrolyte and material properties such as density, thermal
conductivity and specific heat for the copper and iron were provided. The heat generated per
unit volume of the inter-electrode gap was dependent on the current density and temperature (as
the electrical conductivity of electrolyte was temperature dependent). Because of heating, the
temperature of the electrolyte is increased so that heat transferred through the walls of electrodes
by the conduction process.
Figure 3. 1 Physical model for CFD analysis
20 mm
2.5 mm
0.5 mm
50 mm
2.5 mm
Flow
passage 0.5 mm Inter-
electrode gap
17
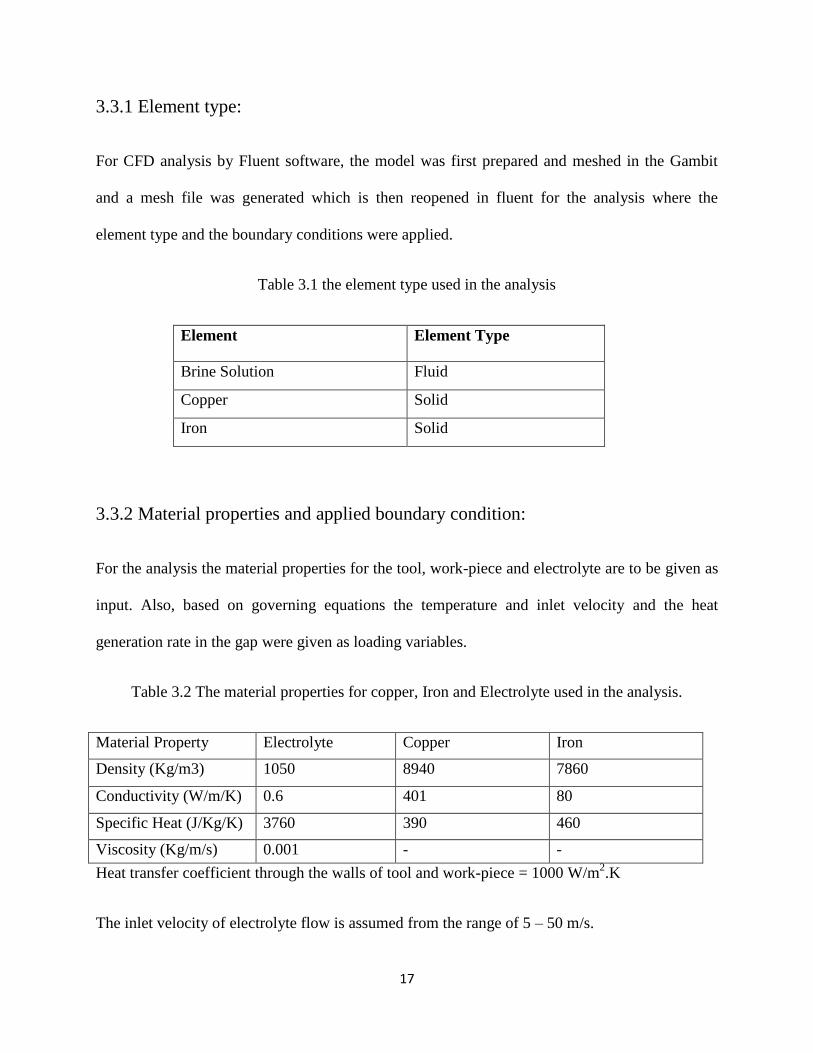
3.3.1 Element type:
For CFD analysis by Fluent software, the model was first prepared and meshed in the Gambit
and a mesh file was generated which is then reopened in fluent for the analysis where the
element type and the boundary conditions were applied.
Table 3.1 the element type used in the analysis
Element Element Type
Brine Solution Fluid
Copper Solid
Iron Solid
3.3.2 Material properties and applied boundary condition:
For the analysis the material properties for the tool, work-piece and electrolyte are to be given as
input. Also, based on governing equations the temperature and inlet velocity and the heat
generation rate in the gap were given as loading variables.
Table 3.2 The material properties for copper, Iron and Electrolyte used in the analysis.
Material Property Electrolyte Copper Iron
Density (Kg/m3) 1050 8940 7860
Conductivity (W/m/K) 0.6 401 80
Specific Heat (J/Kg/K) 3760 390 460
Viscosity (Kg/m/s) 0.001 - -
Heat transfer coefficient through the walls of tool and work-piece = 1000 W/m2.K
The inlet velocity of electrolyte flow is assumed from the range of 5 – 50 m/s.

18
Thermal boundary condition:
The outer surface of the tool-electrode was assumed to be adiabatic, also the inlet temperature of
the electrolyte was considered to be 27 0C.
Electrical boundary condition:
A voltage of 10V and a current 100 amp were applied across the two electrodes.
The current density can be taken from the range of 5 – 30 A/cm2
.
The pressure outlet boundary condition:
Gauge pressure= 0 Pascal
The heat generated in the gap is introduced by an UDF (user defined function).
After applying boundary conditions the solution was carried out and the temperature, velocity
and pressure profiles were obtained.
Figure 3. 2 Elements after meshing
19
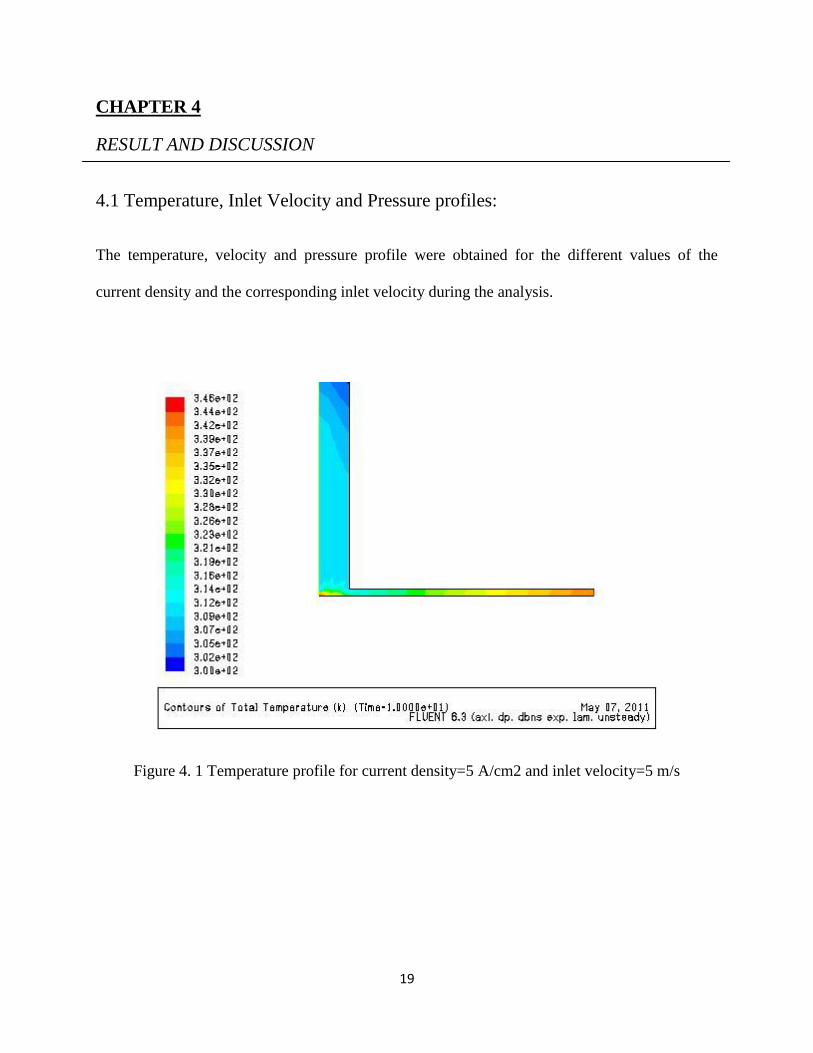
CHAPTER 4
RESULT AND DISCUSSION
4.1 Temperature, Inlet Velocity and Pressure profiles:
The temperature, velocity and pressure profile were obtained for the different values of the
current density and the corresponding inlet velocity during the analysis.
Figure 4. 1 Temperature profile for current density=5 A/cm2 and inlet velocity=5 m/s
20
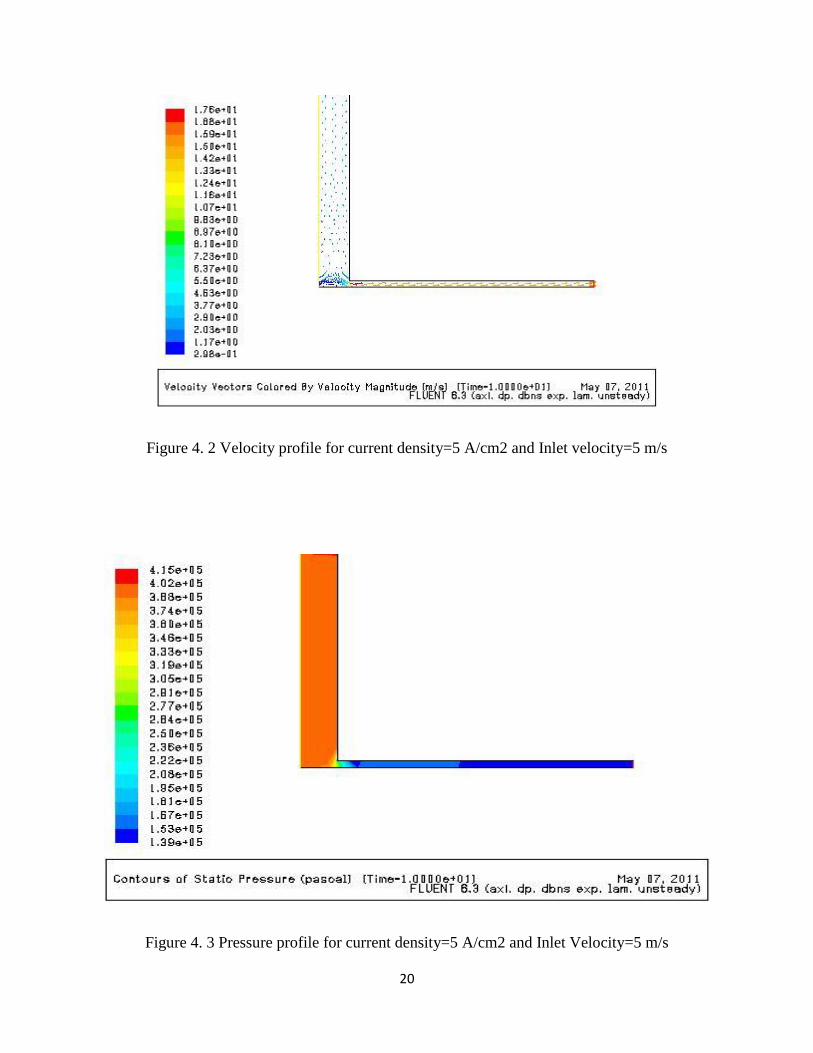
Figure 4. 2 Velocity profile for current density=5 A/cm2 and Inlet velocity=5 m/s
Figure 4. 3 Pressure profile for current density=5 A/cm2 and Inlet Velocity=5 m/s
21
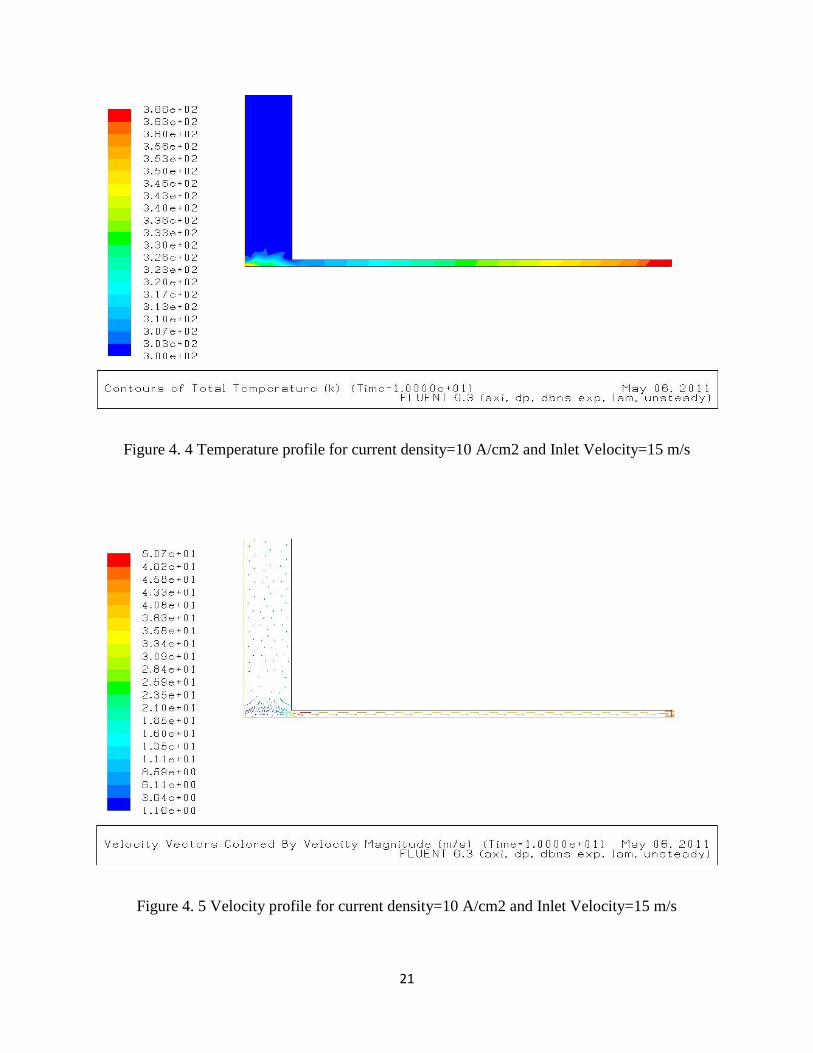
Figure 4. 4 Temperature profile for current density=10 A/cm2 and Inlet Velocity=15 m/s
Figure 4. 5 Velocity profile for current density=10 A/cm2 and Inlet Velocity=15 m/s
22
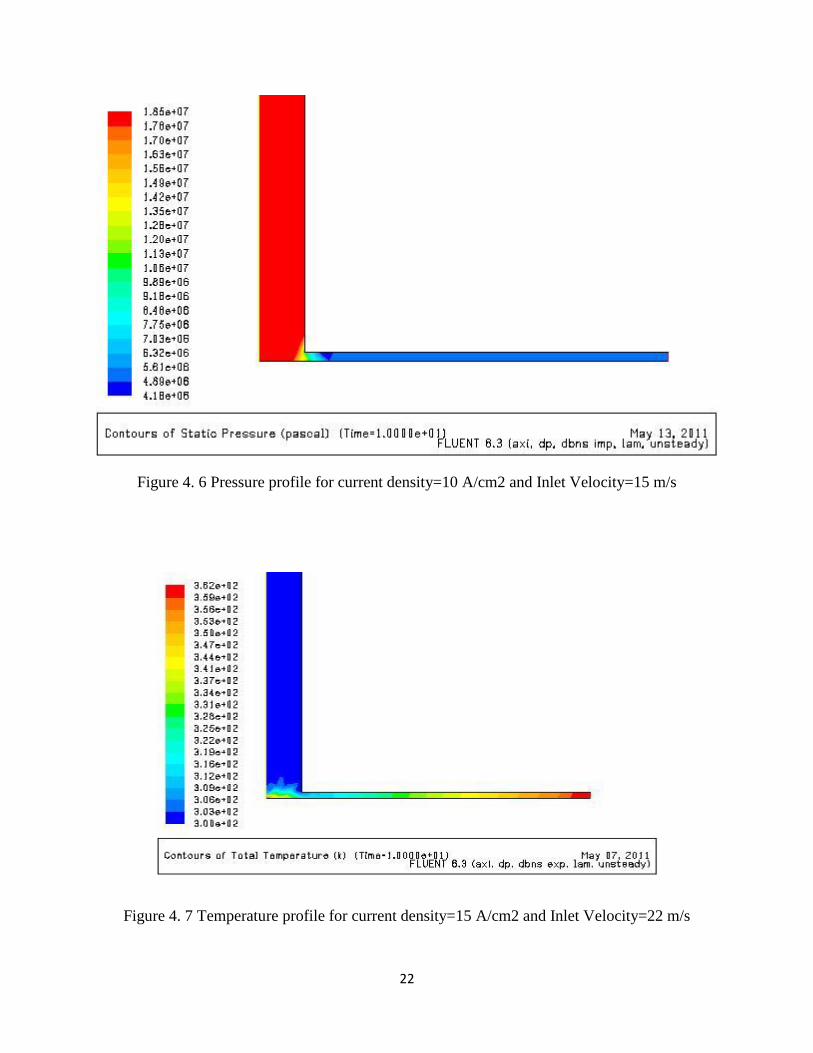
Figure 4. 6 Pressure profile for current density=10 A/cm2 and Inlet Velocity=15 m/s
Figure 4. 7 Temperature profile for current density=15 A/cm2 and Inlet Velocity=22 m/s

23
Figure 4. 8 Velocity profile for current density=15 A/cm2 and Inlet Velocity=22 m/s
Figure 4. 9 Pressure profile for current density=15 A/cm2 and Inlet Velocity=22 m/s
24
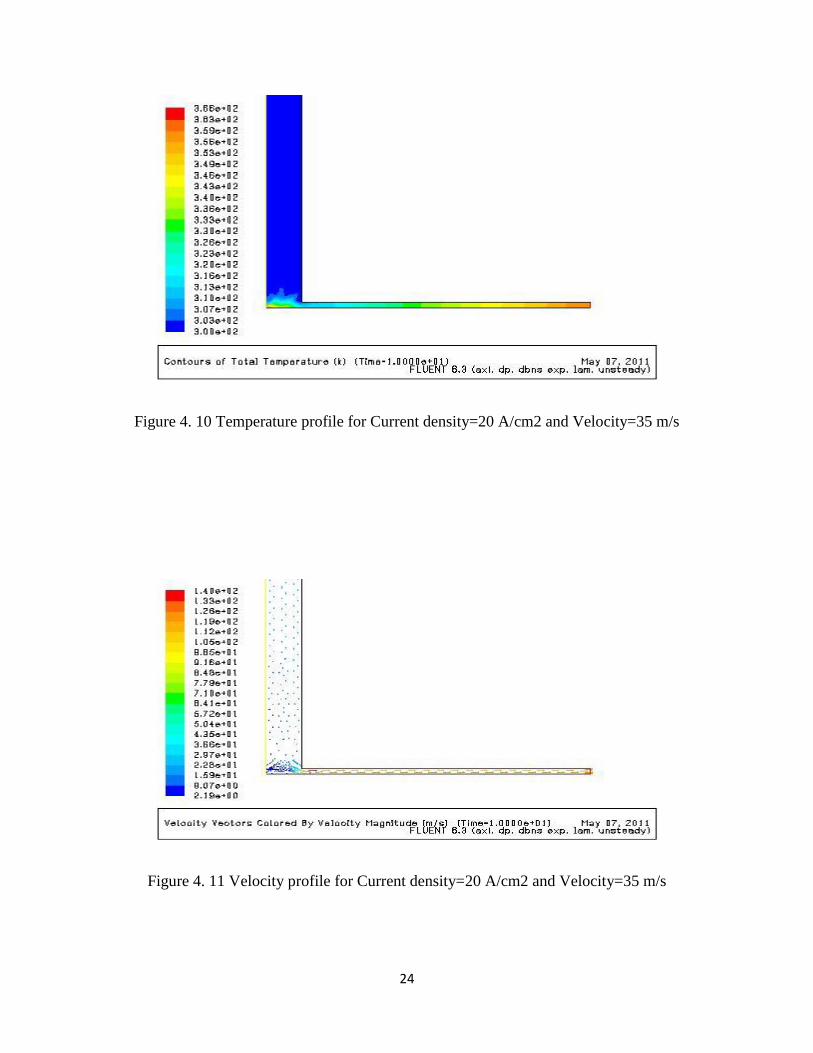
Figure 4. 10 Temperature profile for Current density=20 A/cm2 and Velocity=35 m/s
Figure 4. 11 Velocity profile for Current density=20 A/cm2 and Velocity=35 m/s
25
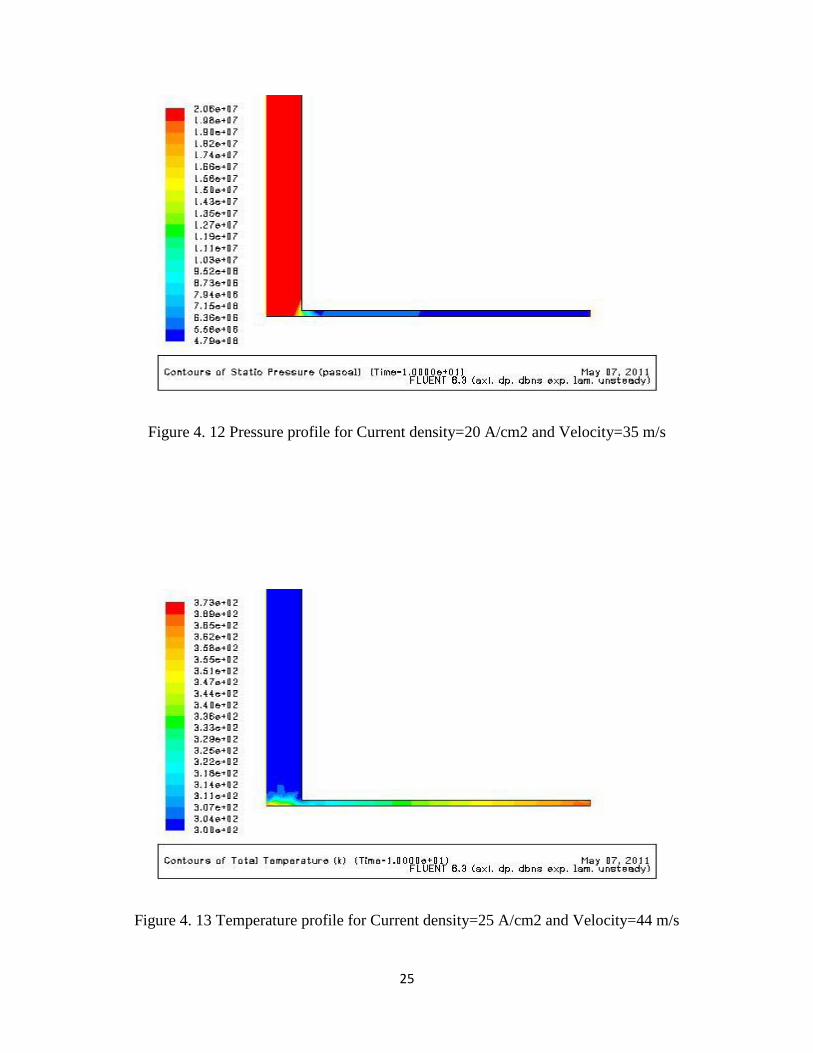
Figure 4. 12 Pressure profile for Current density=20 A/cm2 and Velocity=35 m/s
Figure 4. 13 Temperature profile for Current density=25 A/cm2 and Velocity=44 m/s
26
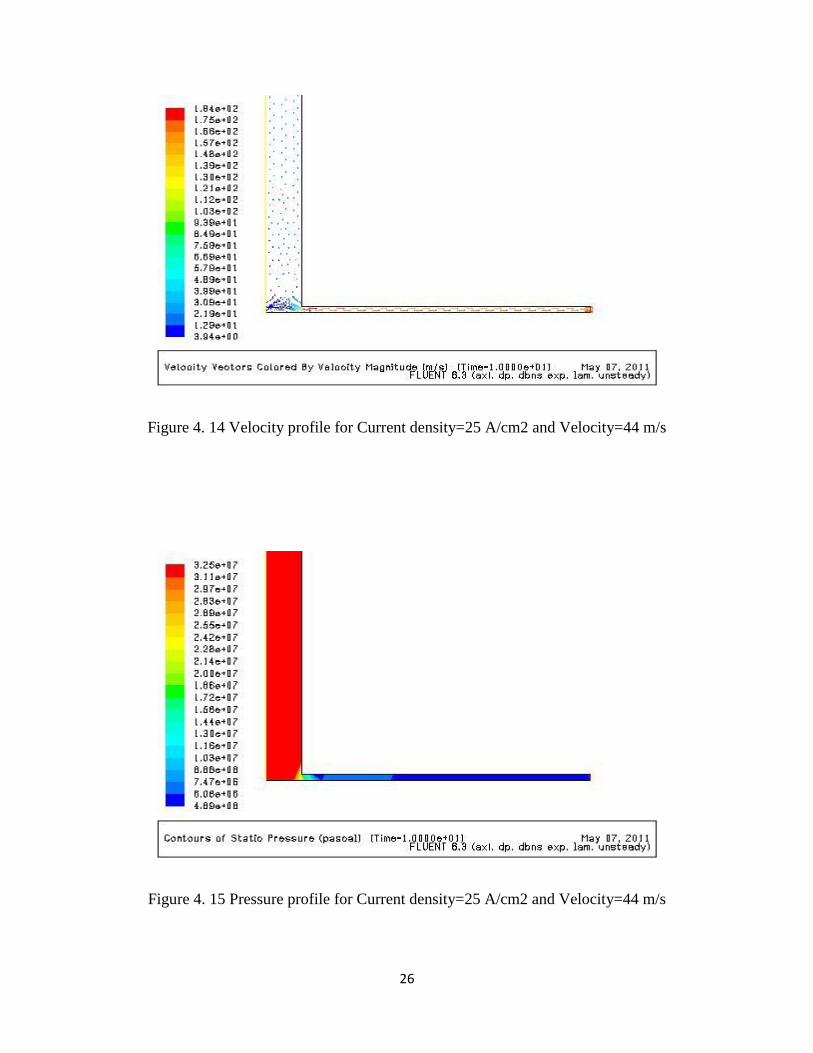
Figure 4. 14 Velocity profile for Current density=25 A/cm2 and Velocity=44 m/s
Figure 4. 15 Pressure profile for Current density=25 A/cm2 and Velocity=44 m/s

27
The above analysis shows that how the outlet temperature, velocity and pressure of the
electrolyte varies with due course of time during the machining operation. During the machining,
the heat was generated in the inter-electrode gap which results in increase in electrolyte
temperature, but simultaneously the heat was dissipated through the walls of tool and the work-
piece by the process of conduction and also by cooling action of electrolyte. So, that final
temperature of the electrolyte couldn’t reach very high. But this condition was achieved for a
particular value of inlet velocity corresponding to a current density.
28
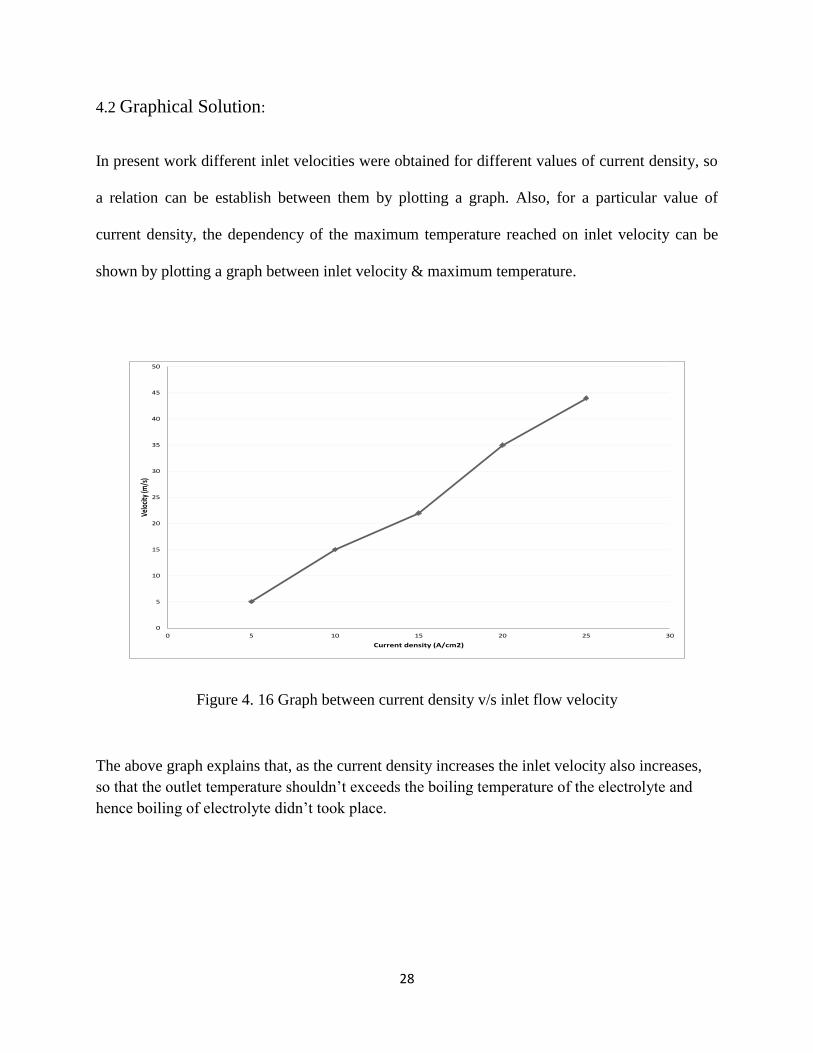
4.2 Graphical Solution:
In present work different inlet velocities were obtained for different values of current density, so
a relation can be establish between them by plotting a graph. Also, for a particular value of
current density, the dependency of the maximum temperature reached on inlet velocity can be
shown by plotting a graph between inlet velocity & maximum temperature.
Figure 4. 16 Graph between current density v/s inlet flow velocity
The above graph explains that, as the current density increases the inlet velocity also increases,
so that the outlet temperature shouldn’t exceeds the boiling temperature of the electrolyte and
hence boiling of electrolyte didn’t took place.
0
5
10
15
20
25
30
35
40
45
50
0 5 10 15 20 25 30
Velo
city
(m/s
)
Current density (A/cm2)

29
Figure 4. 17 Graph between inlet flow velocity and maximum temperature
The above graph explains that during the analysis, for a particular value of current density, the
maximum temperature of electrolyte decreases with increase in temperature.
In present work this graph was plotted for a current density of 25 A/cm2, and the inlet velocity
ranges from 30 – 45 m/s. so that the maximum outlet temperature lies in a range of 350 – 389 0C.
During the analysis the outlet temperature of the electrolyte shouldn’t reach its boiling point.
350
355
360
365
370
375
380
385
390
395
0 5 10 15 20 25 30 35 40 45 50
Max
imum
Tem
p.(K
)
373
Inlet Velocity (m/s)

30
CHAPTER 5
CONCLUSION
In present work, since there is electrical energy source, so according to Joule’s heating effect, the
heat is generated in the process, and hence the electrolyte temperature rises. This analysis predict
the maximum temperature reached and also predict that the inlet flow velocity required for the
process corresponding to a particular value of current density, so that boiling of electrolyte
shouldn’t take place.
The main conclusions are:
1. The inlet flow velocity increases with increasing current density.
2. The maximum temperature of the electrolyte decreases with the increase in inlet velocity.
The maximum outlet temperature decreases rapidly but for a certain range of velocity the
change in temperature is not abrupt. For the higher value of inlet velocity the decrease in
temperature is abrupt.
3. The flow velocity decreases when electrolyte moves towards the work-piece and it increases
at the outlet.
4. The pressure is maximum at the inlet and minimum in the inter-electrode gap.
5. The 2D axisymmetric CFD analysis of flow using Fluent can be solved easily and it takes
few seconds only.
31
REFERENCES
1. Evgueny I. Filatov, The numerical simulation of the unsteady ECM process. Journal of
Material Technology 109(2001) 327-332.
2. J. Kozak, mathematical model for computer simulation of electrochemical machining
processes. Journal of Material Processing Technology 76(1998) 170-175.
3. Jerzy kozak, Antoni F. Budzynski, Piotr Domanowski, Computer simulation electrochemical
shaping (ECM-CNC) using a universal tool electrode. Journal of Material Technology
76(1998) 162-164.
4. M.M. Lohrengel*, I. Klu¨ ppel, C. Rosenkranz, H. Bettermann, J.W. Schultze, Microscopic
investigations of electrochemical machining of Fe in NaNO3. Electrochimica Acta 48 (2003)
3203/3211.
5. Bao Huaiqiana,b
, Xu Jiawena,*
, Li Yinga,c
, Aviation-oriented Micromachining Technology—
Micro-ECM in Pure Water. Chinese Journal of Aeronautics 21(2008) 455-461.
6. B. Bhattacharyya*, B.N. Doloi, S.K. Sorkhel, Experimental investigations into
electrochemical discharge machining (ECDM) of non-conductive ceramic materials. Journal
of Materials Processing Technology 95 (1999) 145±154.
7. T.R. Idrisov∗, A.N. Zaitzev, V.P. Zhitnikov, Estimation of the process localization at the
electrochemical machining by microsecond pulses of bipolar current. Journal of Materials
Processing Technology 149 (2004) 479–485.
8. V.V. Lyubimov, A.L. Yerokhin *, M.Ya. Tchmir, Mechanisms of synthetic diamond wear in
tools for electrochemical grinding. Diamond and Related Materials 7 (1998) 1267–1271.
32
9. Jerzy Kozaka, Maria Chuchro
b,*, Adam Ruszaj
b, Krzysztof Karbowski
c, The computer aided
simulation of electrochemical process with universal spherical electrodes when machining
sculptured surfaces. Journal of Materials Processing Technology 107 (2000) 283±287.
BIBLIOGRAPHY
1. www.scopus.com
2. www.sciencedirect.com
3. www.nitrkl.ac.in
4. Computational fluid dynamics by H.Choi, H.G.Choi and J.Y.YOO (EDS)
5. Text book of Production technology HMT.

33
APPENDIX:-
User Define Function (UDF) to define the heat generation:
#include"udf.h"
DEFINE_SOURCE(heatgeneration,c,t,dS,eqn)
{
real temp;
real source;
temp=C_T(c,t);
source=(j)2/{20(0.02*temp-5.)};
return(source);
}
Where, j is the current density.

34
APPENDIX:-
Program in FLUENT 6.3