Embed Size (px)
Citation preview
Journal of Mechanical Science and Technology 28 (9) (2014) 3499~3510
www.springerlink.com/content/1738-494x DOI 10.1007/s12206-014-0810-2
Development of noise pattern map for predicting refrigerant-induced noise
in refrigerators† Min Seong Kim1, Weui Bong Jeong1,* and Hyung Suk Han2
1School of Mechanical Engineering, Pusan National University, Pusan, 609-735, Korea 2Naval Vessel Technology Team, Busan Center, Defense Agency for Technology and Quality, 525-2, Gwangan 1 dong, Busan, Korea
(Manuscript Received September 27, 2013; Revised May 16, 2014; Accepted May 27, 2014)
----------------------------------------------------------------------------------------------------------------------------------------------------------------------------------------------------------------------------------------------------------------------------------------------
Abstract In refrigeration systems, flow state in evaporators is two-phase. Acoustic characteristics of noise generated in pipes with two-phase
flow depend on flow patterns and instantaneous cycle conditions. Refrigerant-induced noises are irregular and have a band frequency. Therefore, it is difficult to predict the occurrence conditions of refrigerant-induced noise in evaporators. Hence, the development of a design guide that anticipates the occurrence of refrigerant-induced noise is important. Flow pattern maps have been proposed by Baker, Hewitt, Taitel-Dukler, etc. However, these do not consider the acoustic viewpoint and cannot predict refrigerant-induced noise based solely on the estimated flow patterns. Therefore, in this study, we suggest a noise pattern map for directly anticipating refrigerant-induced noise from various flow patterns. We performed experiments using R600a refrigerant and refrigerant-supply equipment designed for flow visualization and flow regime transition. Based on experimental data, we suggest a noise pattern map for determining the level of refrig-erant-induced noise.
Keywords: Annular flow; Churn flow; Slug flow; Noise pattern map; Refrigerant-induced noise; Two-phase flow ---------------------------------------------------------------------------------------------------------------------------------------------------------------------------------------------------------------------------------------------------------------------------------------------- 1. Introduction
A refrigerant passing through the expansion valve ex-changes heat in the evaporator. At this moment, the gas and liquid phases are mixed in the evaporator, and the flow state changes to two-phase. Two-phase flow can be classified into several flow patterns based on a few factors. Many flow pat-tern maps can be used to predict the state of a two-phase flow, such as Baker, Hewitt, and Taitel-Dukler. Theoretical and experimental approaches for distinguishing among flow pat-terns have been studied (Hewitt and Roberts [1]; Taitel and Dukler [2]; Oshimowo and Charles [3]).
Many studies have been conducted to determine the rela-tionship between refrigerant-induced noise and two-phase flow patterns because Refrigerant-induced noise is generally related to two-phase flow patterns. Umeda [4] studied refrig-erant-induced noise at orifices and the relationship between upstream to downstream flow pressure variation and refriger-ant-induced noise. He found that the noise as well as pressure variation increased when large bubbles passed through the orifice. Park et al. [5] identified the refrigerant-induced noise at the refrigerator accumulator. He found that bubble noise is
produced at the sleeve located under the accumulator and that the noise disappears when the orifice on the sleeve is removed. Han et al. [6] predicted the flow pattern in pipes over a refrig-erator operating cycle based on the size and layout of the evaporator inlet pipe. The flow pattern changed from intermit-tent flow to annular flow for the noise reduction. In addition, he found that the vertical pipe section connected with the cap-illary tube outlet was a significant source of refrigerant-induced noise at the evaporator. The study dealt with the con-nection between flow patterns and the refrigerant-induced noise in air conditioners and refrigerators.
However, from the acoustic noise viewpoint, the direct rela-tionship between flow patterns and refrigerant-induced noise is very important for designing heat exchangers such as evap-orators and condensers. There is an inherent limit to determin-ing acoustic characteristics using only flow pattern maps, be-cause those are developed on the basis of the flow visualiza-tion by experiments or of theoretical relationship derived from fluid dynamics. Therefore, we need a new type of pattern map that considers acoustic characteristics. We call this type of map a “noise pattern map.” Therefore, in this study, we cre-ated flow patterns using the refrigerant-supplying equipment and measured noise levels simultaneously under various re-frigerant cycle conditions. Based on the experimental results, we developed a noise pattern map that can predict the refriger-
*Corresponding author. Tel.: +82 51 510 2337, Fax.: +82 51 517 3805 E-mail address: [email protected]
† Recommended by Editor Yeon June Kang © KSME & Springer 2014
3500 M. S. Kim et al. / Journal of Mechanical Science and Technology 28 (9) (2014) 3499~3510
ant-induced noise at the evaporator inlet pipe.
2. Theory
2.1 Two-phase flow
Homogeneous single-phase flow models with average ve-locity, density, and viscosity quantity have been used widely. In such models, it is assumed that the two phases are well mixed and travel with uniform velocities. However, in a two-phase flow model, the velocities of the liquid and gas phases are considered separately. In separated flow models, the pres-sure gradient is given by Eq. (1) (Lee et al. [7]).
2 2 2
1 (1 ) sin
1 (1 )(1 )
l l
g l
dp dF gdz A dz
m d x xA dz A
a r ar q
r a a r
- = + - +é ùë û
é ùæ ö¢ -ê ú+ +ç ÷ç ÷-ê úè øë û .
(1)
From Eq. (1), the pressure drop is divided into frictional,
gravitational, and accelerative components. In this equation, x and α can be fluctuated as the variation of the flow pattern with time. Thus, x and α can be expressed as a function of time. Consequently, we can express the time derivative of the pressure drop in the following form:
( )( ), ( ),...d dp d f x t tdt dz dt
aæ ö é ù=ç ÷ ë ûè ø. (2)
According to the distribution of void fraction, two-phase
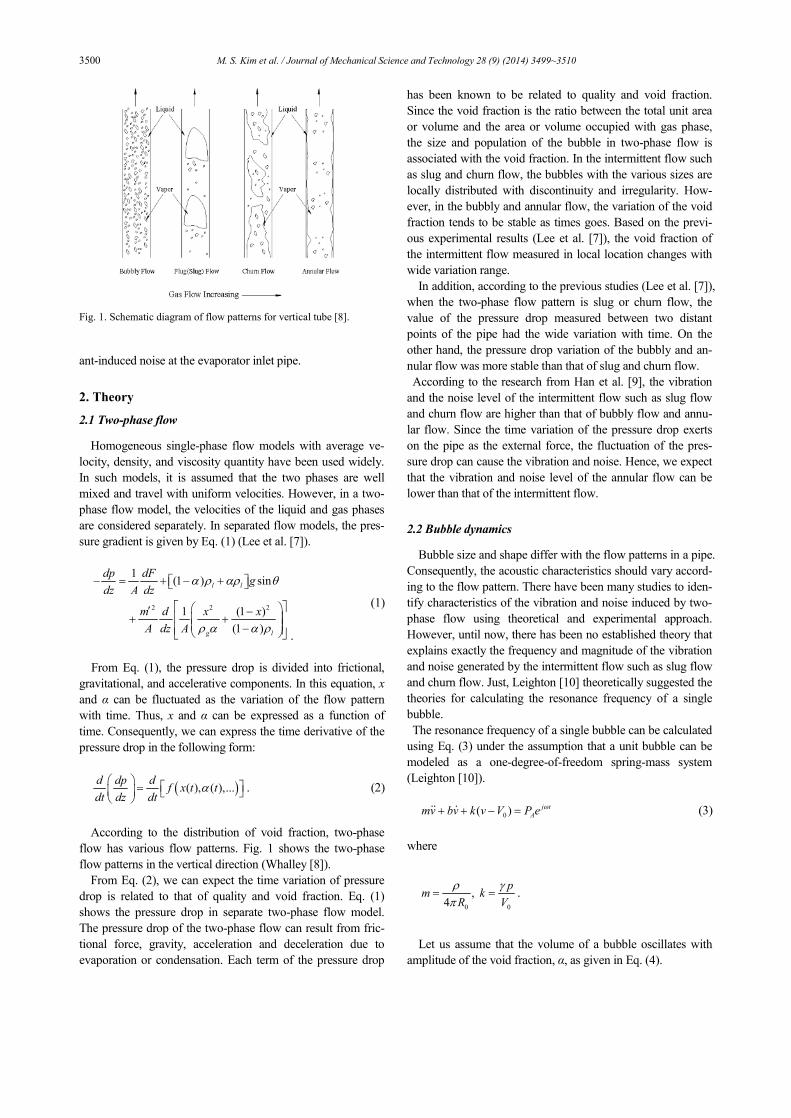
flow has various flow patterns. Fig. 1 shows the two-phase flow patterns in the vertical direction (Whalley [8]).
From Eq. (2), we can expect the time variation of pressure drop is related to that of quality and void fraction. Eq. (1) shows the pressure drop in separate two-phase flow model. The pressure drop of the two-phase flow can result from fric-tional force, gravity, acceleration and deceleration due to evaporation or condensation. Each term of the pressure drop
has been known to be related to quality and void fraction. Since the void fraction is the ratio between the total unit area or volume and the area or volume occupied with gas phase, the size and population of the bubble in two-phase flow is associated with the void fraction. In the intermittent flow such as slug and churn flow, the bubbles with the various sizes are locally distributed with discontinuity and irregularity. How-ever, in the bubbly and annular flow, the variation of the void fraction tends to be stable as times goes. Based on the previ-ous experimental results (Lee et al. [7]), the void fraction of the intermittent flow measured in local location changes with wide variation range.
In addition, according to the previous studies (Lee et al. [7]), when the two-phase flow pattern is slug or churn flow, the value of the pressure drop measured between two distant points of the pipe had the wide variation with time. On the other hand, the pressure drop variation of the bubbly and an-nular flow was more stable than that of slug and churn flow. According to the research from Han et al. [9], the vibration and the noise level of the intermittent flow such as slug flow and churn flow are higher than that of bubbly flow and annu-lar flow. Since the time variation of the pressure drop exerts on the pipe as the external force, the fluctuation of the pres-sure drop can cause the vibration and noise. Hence, we expect that the vibration and noise level of the annular flow can be lower than that of the intermittent flow.
2.2 Bubble dynamics
Bubble size and shape differ with the flow patterns in a pipe. Consequently, the acoustic characteristics should vary accord-ing to the flow pattern. There have been many studies to iden-tify characteristics of the vibration and noise induced by two-phase flow using theoretical and experimental approach. However, until now, there has been no established theory that explains exactly the frequency and magnitude of the vibration and noise generated by the intermittent flow such as slug flow and churn flow. Just, Leighton [10] theoretically suggested the theories for calculating the resonance frequency of a single bubble. The resonance frequency of a single bubble can be calculated using Eq. (3) under the assumption that a unit bubble can be modeled as a one-degree-of-freedom spring-mass system (Leighton [10]).
0( ) j t
Amv bv k v V P e w+ + - =&& & (3)
where
0 0
,4
pm kR Vr gp
= = .
Let us assume that the volume of a bubble oscillates with
amplitude of the void fraction, α, as given in Eq. (4).
Fig. 1. Schematic diagram of flow patterns for vertical tube [8].
M. S. Kim et al. / Journal of Mechanical Science and Technology 28 (9) (2014) 3499~3510 3501
02sin tv VTpa= + (4)
Then, the natural frequency fn of the oscillating bubble can
be given according to Eq. (5), same as that in Ref. [11].
0
1 32n
kpfRp r
= . (5)
From Eq. (5), we regard the small bubbles as contributing to
the high-frequency components and the large bubbles as con-tributing to the low-frequency ones. The theoretical review in this section shows that the refrigerant-induced noise is strongly related to the flow patterns in a pipe.
3. Experiment
3.1 Refrigerant-supplying equipment and test conditions
The theoretical review in the previous section showed that the refrigerant-induced noise is strongly associated with the flow patterns in the pipe. Before developing a noise pattern map, we examined the relations between flow patterns and the generated noise. Based on the results, we defined noise char-acteristics according to the two-phase flow patterns. For this objective, we required experimental apparatus for controlling refrigerant cycle conditions taking into account refrigerator operating conditions. We evaluated the acoustic features based on various flow patterns. The noise levels in the test unit’s pipe were measured for the following flow patterns: single-phase, slug, churn, and annular. Fig. 2 shows a schematic dia-gram of the test setup for measuring the refrigerant-induced noise based on the flow patterns that can form under typical refrigeration cycle conditions. The experimental apparatus consists of two parts. The first part on the left-hand side of Fig. 2 shows the refrig-erant-supplying equipment. This equipment, installed outside the anechoic chamber, is designed to control the refrigeration cycle and measure variables such as pressure, temperature, and mass flow rate. It comprises a compressor, condenser, evaporator, and expansion valve. The condenser and the evap-orator chamber help maintain the temperature and pressure of the refrigerant through electronic heating tubes and cooling
pipelines. The cooling pipeline is from the second refrigera-tion cycle system.
The second refrigeration cycle system, indicated by the dot-ted red line in Fig. 2, works with R12 refrigerant. The propor-tional-integral-derivative (PID) feedback controller adjusts the balance between the heating and cooling levels based on user-defined temperature or pressure settings. Therefore, we can specify the pressure and temperature of the refrigerant in the evaporator and condenser of the main refrigerant cycle system. In particular, we can control the quality of the refrigerant at the pipe by using the heater installed in the refrigerant-supplying equipment, as shown in Fig. 2. The vapor quality can be estimated from enthalpy calculation, as given by Eqs. (6)-(8). Adding heat to the refrigerant in the pipe shifts the level of enthalpy with higher quality.
l
Tg l
h hxh h¢ -
=-
(6)
, , pipeheatersc heater pipe heater pipe
qqh h h h where h hm m
¢ = + D + D D = D =¢ ¢
(7)
1 21 2
( ) 1 1, ln ,2 (2 )
pipe insulpipe
pipe insul
T T rq where R RR R Kl r h r lp p¥
æ ö-= = =ç ÷ç ÷+ è ø
.
(8) Heat from the electronic heating tube in the heater increases
the enthalpy of the refrigerant passing through it. Additionally, because of heat exchange with the environment, refrigerant enthalpy will vary when the refrigerant passes through the pipe between the expansion valve outlet and the evaporator inlet. Hence, this heat exchange should be considered while calculating the vapor quality.
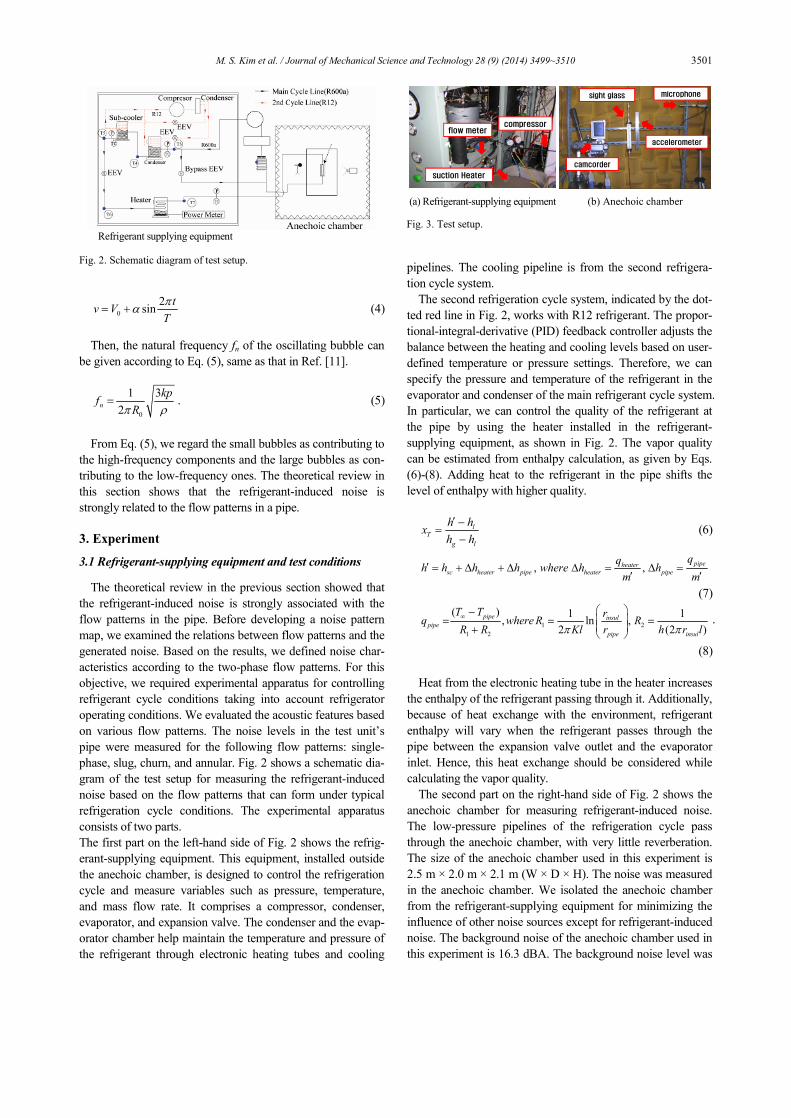
The second part on the right-hand side of Fig. 2 shows the anechoic chamber for measuring refrigerant-induced noise. The low-pressure pipelines of the refrigeration cycle pass through the anechoic chamber, with very little reverberation. The size of the anechoic chamber used in this experiment is 2.5 m × 2.0 m × 2.1 m (W × D × H). The noise was measured in the anechoic chamber. We isolated the anechoic chamber from the refrigerant-supplying equipment for minimizing the influence of other noise sources except for refrigerant-induced noise. The background noise of the anechoic chamber used in this experiment is 16.3 dBA. The background noise level was
Refrigerant supplying equipment
Fig. 2. Schematic diagram of test setup.
suction Heater
compressorflow meter
sight glass microphone
camcorder
accelerometer
(a) Refrigerant-supplying equipment (b) Anechoic chamber Fig. 3. Test setup.
3502 M. S. Kim et al. / Journal of Mechanical Science and Technology 28 (9) (2014) 3499~3510
so small that we could assume that the influence of noise on the values of the measured signals was not considerable. We designed a supporting structure, a framework, within the an-echoic chamber for fixing the vertical pipe, or the test unit section. The flow patterns were observed and recorded using a digital video camera through a sight-glass tube installed at the center of the vertical pipe section. The temperature of the re-frigerant flowing into the sight glass was measured using thermocouples attached to the pipe. In addition, the noise was measured simultaneously using a microphone placed at a dis-tance of 300 mm from the sight-glass tube. The microphone was located on the rear side of the test unit. Fig. 3 shows evaluation equipment for test setup. The sampling frequency for measuring noise signals is 51.2 kHz. This sampling value was applied, because we were interested in the frequency range of acoustics signal and the refrigerant-induced noise is characterized by a broadband frequency spectrum.
3.2 Relationship between flow patterns and generated noise
Before creating a noise pattern map from the experimental results here, we discuss the acoustic characteristics of the re-frigerant-induced noise for various flow patterns. We gener-ated various flow patterns and measured the resulting sound signal using the test equipment according to the experimental cases listed in Table 1.
Two-phase flow patterns can be transitioned according to several factors such as a diameter of the pipe, the direction of the pipe, quality, mass flow rate, properties of the fluid, etc. Since the quality was controlled by using the heating chamber installed on refrigerant-supplying equipment, it takes a long time to settle down to the equilibrium cycle conditions during experiment. Therefore, in Sec. 3.2, we mainly changed the mass flow rate to shift from one type of two-phase flow pat-tern to another in order to obtain typical acoustic characteris-tics of two-phase flow patterns such as slug flow, churn flow and annular flow.
Based on observations through the sight glass and on the es-timated flow patterns using the map created by Taitel-Dukler, the flow pattern was varied from single-phase to annular.
We used the Taitel-Dukler flow pattern map, which has the variables Kutateladze number and Martinelli number, to de-termine the vertical two-phase flow patterns. These variables can be defined as follows (Lee et al. [7]).
The variable Kutateladze number:
( )
1/ 2
1/ 4g g
g
l g
jKu
g
r
r r s=é ù-ë û
. (9)
The variable Martinelli number:
1/ 2 0.1250.50.875
, ,
1/ g l
l gF l F g
dp dp xXdz dz x
r mr m
é ù æ öæ ö-æ ö æ ö æ ö= = ç ÷ê ú ç ÷ç ÷ ç ÷ ç ÷ ç ÷ ç ÷è ø è ø è øê ú è ø è øë û.
(10) The mass quality means the ratio between total mass flow
rate and mass flow rate of gas phase. Otherwise, from the view of thermodynamics, vapor quality is the mass fraction in a saturated mixture that is vapor. In the thermodynamic equi-librium state which means two-phase flow in a saturated mix-ture, the mass quality is same as the vapor quality. Therefore, the vapor quality calculated by Eq. (6) can be assumed to be same as the mass quality.
Tx x» . (11)
Superficial velocity of the gas jg can be expressed as the fol-
lowing equation.
2
4g gg
g g g
Q G xm xmjA A Dr r p r
¢ ¢= = = = . (12)
Table 1. Experimental results.
Case Flow pattern Inner pipe diameter [mm] Mass flow [kg/hr] Vapor quality Overall sound pressure
level [dBA]
1 Single phase flow 4.35 2.51 0.00 19.3
2 Slug flow 4.35 2.67 0.10 20.7
3 Churn flow 4.35 5.44 0.08 27.9
4 Chun - annular flow 4.35 4.07 0.18 26.4
5 Annular flow 4.35 3.93 0.22 27.1
10-2
10-1
100
101
10210
-1
100
101
Annular
Slug&Churn
XK
u g
TransitionCurveSlugChurnChurn - AnnularAnnular
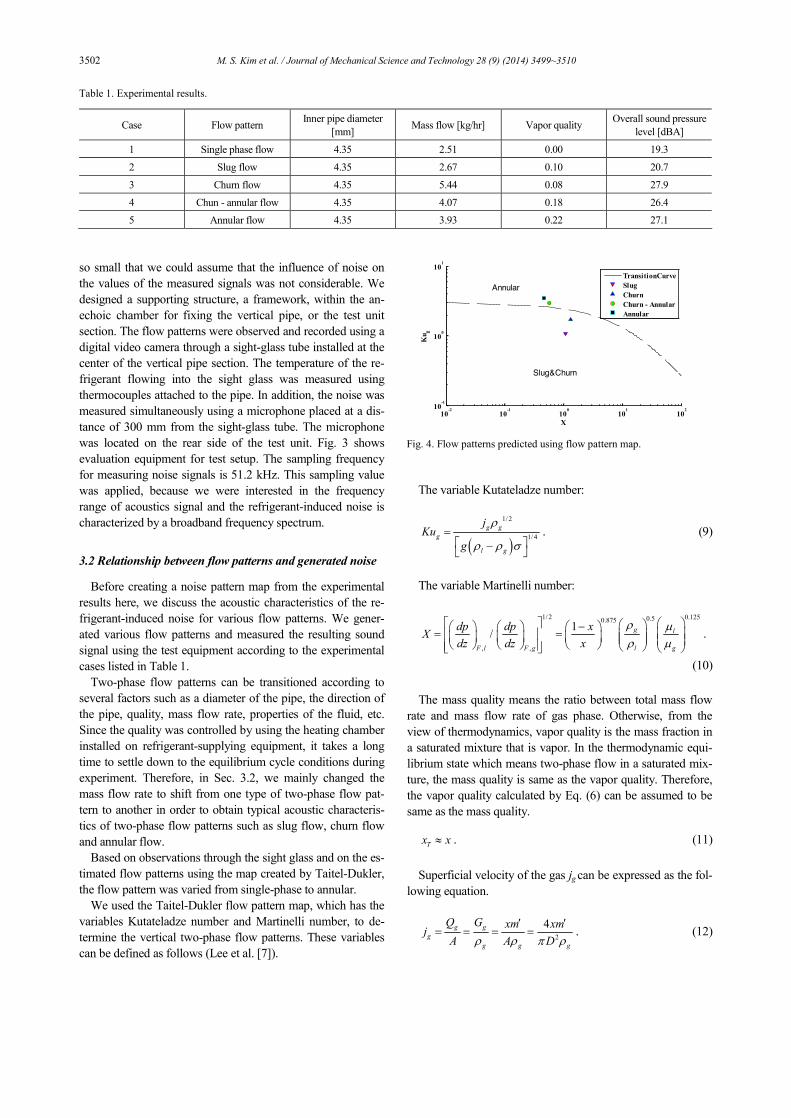
Fig. 4. Flow patterns predicted using flow pattern map.

M. S. Kim et al. / Journal of Mechanical Science and Technology 28 (9) (2014) 3499~3510 3503
liquid
(a) Single phase flow pattern (b) Acoustic spectrogram in case of single flow Fig. 5. Flow pattern and acoustic spectrogram for single-phase flow.
vapor
liquid
vapor
liquid
(a) Slug flow pattern
(b) Churn flow pattern
(c) Acoustic spectrogram in case of slug flow (d) Acoustic spectrogram in case of churn flow
Fig. 6. Flow pattern and acoustic spectrogram for slug and churn flows.

3504 M. S. Kim et al. / Journal of Mechanical Science and Technology 28 (9) (2014) 3499~3510
Fig. 4 shows the flow pattern transition on the map. The flow pattern was changed from single phase to annular, and the sound pressure level was measured under each experimen-tal case for 6 min. Figs. 5-7 show the flow pattern and its sound spectrum.
Fig. 6 shows the flow pattern and acoustic spectrogram for slug and churn flows. The flow pattern and acoustic character-istic between the slug and churn flow were completely differ-ent.
From Fig. 6(a), the shape of the bubble in slug flow was a bullet shape. When the slug bubble passed periodically through the pipe and the orifice, the noise and vibration level increased periodically. From Fig. 6(c), which shows a 1/3 octave spectrogram of the slug flow, the range of dominant frequency of the refrigerant-induced noise was 3~4 kHz and the corresponding frequency band increased periodically. When slug bubbles passed through the orifice, we assumed that slug bubbles will collapse into the small bubbles which have the same radius as the orifice radius (r = 2 mm). From
calculation using Eq. (5), the natural frequency of the col-lapsed bubbles with the radius 2 mm is 3.43 kHz. Therefore, we estimated that the noise distribution at 3~4 kHz was the natural frequency of the collapsed bubbles when slug bubbles are passing through the orifice periodically.
From Fig. 6(b) showing churn flow pattern, the liquid and gas phases were mixed locally and the bubble shape was ir-regular. We observed the velocity variation of irregular shaped bubbles of the churn flow through the recorded video. From the observation, instantaneous velocity variation level of ir-regular shaped bubbles was very high. Since the variation of the local velocity is related to that of the local dynamic pres-sure, we assumed that the variation level of local pressure was also very high. From Fig. 6(d), the acoustic characteristics under the churn flow were outstanding. With the passage of time, the generated noise was very loud, durable, and broad frequency range. The range of frequency of refrigerant-induced noise was from 4 kHz to 12 kHz. Based on the obser-vation with recorded video, the bubble-rising velocity of the
vapor
liquid
vaporliquid
(a) Churn- annular flow pattern (b) Annular flow pattern
(c) Acoustic spectrogram in case of annular -churn flow (d) Acoustic spectra in case of annular flow
Fig. 7. Flow pattern and acoustic spectrogram for churn-annular and annular flows.

M. S. Kim et al. / Journal of Mechanical Science and Technology 28 (9) (2014) 3499~3510 3505
churn flow was faster than that of the slug flow and the bubble shape and size of the churn flow were irregular. Due to the high bubble-rising velocity and various bubble shapes and sizes, the bubbles in the churn flow can be collapsed into small bubbles that have a diameter less than the orifice diame-ter. Assuming that the refrigerant-induced noise of the churn flow originates from the resonance of the bubbles, the equiva-lent radius is 1.45 mm for 4 kHz and 0.48 mm for 12 kHz. Therefore, we estimated that the broadband noise of the churn flow showed a spread of frequencies ranging from 4 kHz to 12 kHz when the bubbles of the churn flow with the irregular shapes and sizes passed through the orifice.
From the churn-annular and annular flow shown in Figs. 7(a) and (b), we observed that the liquid flows along the pipe wall and the liquid film inside the sight-glass tube has a wavy mo-tion. In addition, we observed that the gas phase flowed closer to the center of the pipe and passed through the center of the pipe continuously. The annular flow pattern’s complexity was less than that of the churn flow pattern. Comparing Fig. 6(d) with Figs. 7(c) and (d), the acoustic variation of annular flow in time and frequency was different from that of churn flow. Since the gas phase of the annular flow passed through the pipe continuously, there were no separate bubbles surrounded by liquid phase. Therefore, for annular flow, there was less contribution to the noise of frequency distributed from 4 kHz to 12 kHz because the annular flow has fewer bubbles than the churn flow. However, because the gas phase flows at high speeds along the centerline of the pipe, high-frequency noise at 3~4 kHz was generated when passing through the orifice.
In this section, we have described the acoustic characteris-tics of various flow patterns—single, slug, churn, and annular flow. The single flow does not fluctuate and the associated noise level is very low. In case of the slug flow, a periodic signal is detected as slug bubbles pass through. From Table 1, which summarizes the overall SPL (sound pressure level) values of the tested flow patterns, case 3, which was estimated as churn flow, was the noisiest among all cases. From an acoustic viewpoint, churn flow is noisier than all other flow patterns. In case 5, the flow pattern was regarded as annular flow from observation and evaluation using the flow pattern map. However, the sound pressure level was adequate for it to be considered as churn flow. Thus, the noise level of the annu-lar flow pattern, as estimated from the flow pattern map, is not always low. From this result, we conclude that under certain conditions, the sound pressure level is not low for annular flow. Therefore, there is a limit to anticipating the refrigerant-induced noise using only the flow pattern map. The noise pattern map is necessary for directly connecting the two-phase flow pattern with its noise level.
3.3 Development of noise pattern map for refrigerant-
induced noise
To develop the noise pattern map, a database relating flow patterns and their associated noise levels is essential. In Fig. 8,
we show the experimental results on the flow pattern map. The temperature range is –5~10℃, corresponding to that of the mass flow rate of 1~6.5 kg h-1. Given that pipe diameter is one of the important factors that determine the flow pattern, we considered pipe inner diameters of 3.56~8.0 mm. For flow pattern transition, we changed the quality from 0.1 to 0.7 us-ing the heater installed in the refrigerant-supplying equipment. Under these conditions, we measured the noise signal simul-taneously.
We can calculate the Kutateladze and Martinelli numbers from the size of the pipe and refrigeration cycle data such as mass flow rate, pressure, and temperature of the refrigerant. It was observed that both the temperature and the mass flow rate increased as the quality was improved.
Using the results of the refrigerant-induced noise experi-ment under various cycle conditions, we evaluated the noise level for each experimental case. From the facts described above, it is understood that the refrigerant-induced noise is related to the flow patterns. The flow pattern is determined using variables Kug and X. Therefore, we assume that these variables are the major factors affecting the noise level of the two-phase flow. Consequently, we adopted the flow pattern map variables for defining the noise level. We matched the noise level with the Kutateladze and Martinelli numbers and derived the second-order polynomial regression equation from the input variables of Kutateladze and Martinelli numbers and the output variable of the corresponding noise level. In order to reveal effectively the relative magnitude of the noise level
10-2
10-1
100
10110
-1
100
101
Annular
Slug&Churn
X
Ku g
(a) Inner pipe diameter Φ3.56
10-2 10-1 100 10110-1
100
101
Annular
Slug&Churn
X
Ku g
(b) Inner pipe diameter Φ8.0
Fig. 8. Estimation of the flow patterns for typical cycle conditions.

3506 M. S. Kim et al. / Journal of Mechanical Science and Technology 28 (9) (2014) 3499~3510
measured in the experiment, we suggested that the noise level, which we call RINL (refrigerant-induced noise level), is a function of Kug and X. The definition of RINL presented nor-malized sound pressure level using the measured noise data was denoted in Eq. (13). In Eq. (13), dBA means the measured noise data in sound pressure level with A-weighting and dBAmax means the maximum value of measured noise data. The form of the variable RINL was suggested by referring to the inverse data transformation in statistics to improve the interpretability of the measured results [12]. Since unit of dBA is nondimensional, RINL in Eq. (13) has also nondimensional unit.
1
1Max
RINLdBA dBA
=- +
. (13)
The corresponding equation is given below.
2 21 2 3 4 5 6g g gRINL a a X a Ku a X a Ku a X Ku= + + + + + . (14)
The regression coefficients ai were determined for minimiz-
ing the mean square value of errors by using the 51 data en-tries shown in Fig. 9. Fig. 9 shows noise level mapping onto the flow pattern map using RINL suggested in this paper. For Fig. 9, the center of the circle was determined by variables of X and Kug. The size of each circle represents for the relative magnitude of RINL defined as normalized SPL. The definition of RINL was shown in Eq. (13). Table 2 lists the estimated regression coefficient values. The numerical values used for the calculation listed in Table 3.
Fig. 10 shows the noise pattern map generated according to Eq. (14). Using this noise pattern map and Fig. 10 instead of flow pattern estimation, we can estimate the noise level in the vertical pipe with the two-phase flow under specific refrigera-
tion cycle conditions.
4. Validation
4.1 Experiment in real refrigerator
To validate the developed noise pattern map, the noise and cyclic temperature of a commercial refrigerator were meas-ured in the anechoic chamber. The sound pressure level was measured using a microphone installed on the rear-side, at a distance of 300 mm from the center of the refrigerator, where the evaporator is located. The cyclic temperature was meas-ured using a T-type thermocouple and an Agilent 34970A data logger. The sound pressure level was measured simultane-ously with the cyclic temperature to reveal the relationship between noise and operational cycle conditions.
Fig. 11 shows the overall noise level, temperature of the evaporator, and quality, with the passage of time. In Fig. 11, the inner diameter of the pipe and mass flow rate are 4.35 mm and 2.77 kg/hr respectively. The quality was calculated using Eqs. (6) and (7). However, enthalpy variations owing to heat exchange with the environment were not considered, because pipe length in the commercial refrigerator was relatively short and the inner part of the refrigerator was insulated. From Fig 11, it can be seen that the overall noise level and quality in-creased during 60 min, but the evaporator temperature de-creased from 12°C to -19.5°C. After 270 s from the start, the
Table 2. Estimated regression coefficient values. Regression coefficients a1 a2 a3 a4 a5 a6
Estimation value 0.09564 0.17358 0.08870 0.27124 -0.00468 -0.21452
10-1
10010
-1
100
101
Annular
Slug & Churn
X
Ku g
TransitionCurve
Fig. 9. Noise level mapping onto flow pattern map.
Fig. 10. Noise pattern map of refrigerator with R600a.
0 10 20 30 40 50 60
-20
-10
0
10
20
30
40
time[min]
SPL
(dBA
), Te
mpe
ratu
re[C
o ]
0 10 20 30 40 50 600.1
0.15
0.2
0.25
0.3
0.35
0.4
0.45
Qua
lity
OverallEva.TemperatureQuality
42.59 dBA
42.58 dBA 43.46 dBA 43.46 dBA 43.43 dBA42.33 dBA
0.3120.326
0.3430.356
0.282
0.365
-10.3oC
-11.3oC-12.5oC
-14.6oC-16.4oC -17.6oC
Fig. 11. Overall noise level, mass quality and temperature in evapora-tor with passage of time.
M. S. Kim et al. / Journal of Mechanical Science and Technology 28 (9) (2014) 3499~3510 3507
overall noise level was 42.33 dBA, quality was 0.28, and evaporator temperature was –10.3°C. With the passage of time from 270 s to 36 min, the overall noise level increased from 42.33 dBA to 43.55 dBA and the quality improved from 0.28 to 0.36. Hence, from the results obtained using the com-mercial refrigerator, it was found that the overall noise level increased during 40 min from start.
4.2 Refrigerant-induced noise estimation using noise pattern map
Fig. 12 shows the result of the flow pattern and noise pat-tern estimations from flow and noise pattern maps, respec-tively, under operating cycle conditions of the commercial refrigerator. In Fig. 12, the inner pipe diameter is 4.35 mm.
Table 3. Numerical values for developing noise pattern map.
Case Kutateladze number Martinelli number Vapor quality Superficial velocity of the gas [m/s] Refrigerant-induced noise level
1 2 3 4 5 6 7 8 9 10 11 12 13 14 15 16 17 18 19 20 21 22 23 24 25 26 27 28 29 30 31 32 33 34 35 36 37 38 39 40 41 42 43 44 45 46 47 48 49 50 51
1.629 3.624 5.671 8.014 9.500 10.701 1.575 2.304 2.952 3.864 4.266 5.005 5.676 1.660 2.101 2.548 2.997 3.409 3.876 4.341 1.701 2.045 2.442 2.780 3.165 3.443 3.870 0.750 1.009 1.284 1.524 1.689 0.346 0.525 0.687 0.839 0.995 1.211 1.368 0.335 0.423 0.511 0.594 0.690 0.822 0.955 0.348 0.421 0.493 0.562 0.621
1.335 0.551 0.308 0.142 0.106 0.070 0.689 0.434 0.305 0.228 0.202 0.155 0.140 0.441 0.334 0.261 0.211 0.173 0.141 0.115 0.293 0.232 0.185 0.151 0.127 0.106 0.083 0.548 0.379 0.269 0.206 0.166 0.698 0.450 0.321 0.245 0.193 0.131 0.099 0.459 0.308 0.242 0.195 0.157 0.116 0.083 0.277 0.219 0.174 0.135 0.123
0.078 0.191 0.318 0.534 0.619 0.723 0.140 0.218 0.296 0.371 0.404 0.480 0.511 0.199 0.255 0.313 0.368 0.425 0.482 0.539 0.265 0.321 0.381 0.438 0.489 0.541 0.608 0.190 0.269 0.357 0.434 0.499 0.137 0.209 0.281 0.351 0.417 0.534 0.612 0.192 0.268 0.327 0.385 0.445 0.534 0.627 0.275 0.331 0.391 0.459 0.492
1.887 4.114 6.320 8.799 10.169 11.497 2.027 2.936 3.727 4.850 5.345 6.223 6.991 2.352 2.964 3.582 4.196 4.728 5.386 6.031 2.672 3.192 3.789 4.314 4.872 5.299 5.934 0.861 1.122 1.395 1.625 1.779 0.451 0.678 0.881 1.058 1.242 1.472 1.651 0.475 0.612 0.735 0.847 0.986 1.164 1.348 0.555 0.671 0.789 0.912 0.976
0.197 0.297 0.478 0.470 0.184 0.317 0.150 0.160 0.173 0.184 0.169 0.186 0.266 0.174 0.177 0.183 0.191 0.194 0.207 0.208 0.174 0.209 0.217 0.207 0.221 0.185 0.157 0.364 0.350 0.313 0.620 0.529 0.185 0.190 0.189 0.194 0.199 0.215 0.234 0.160 0.159 0.163 0.168 0.170 0.176 0.179 0.159 0.166 0.153 0.141 0.141

3508 M. S. Kim et al. / Journal of Mechanical Science and Technology 28 (9) (2014) 3499~3510
Fig. 12(a) shows the flow pattern map developed by Taitel-Dukler. We marked the estimated flow pattern with a triangle on the map using the Kutateladze and Martinelli numbers calculated based on the pipe size and operational cycle data of the commercial refrigerator, such as mass flow rate, pressure, and temperature of refrigerant R600a. From Fig. 12(a), the estimated flow pattern is still the annular flow under the cycle condition of x = 0.36 and T = -17.63°C. Since we consider that the noise level in the annular flow pattern should be low, we estimated incorrectly that the noise level remains low un-der the cycle condition of x = 0.36 and T = - 17.63°C. How-ever, as shown in Sec. 3.2, not all of annular flow patterns estimated using the flow pattern map have low noise levels. Furthermore, based on the experimental results of the com-mercial refrigerator shown in Fig. 11, the overall noise level remains high under the cycle condition of x = 0.36 and T=-17.63°C. Therefore, from this viewpoint, we can say that there is a limit to predicting the noise level using only the flow pat-tern map.
Fig. 12(b) shows the noise pattern map developed in this study. Similarly, we marked the estimated noise pattern with triangles on this map under operational cycle conditions of the commercial refrigerator. Based on the estimated noise patterns, it was found that the estimated noise level increased gradually with time. The noise level under cycle conditions of x = 0.36 is higher than that under x = 0.28. The trend of the noise level estimated using the noise pattern map agrees well with that of
the overall noise level of the commercial refrigerator shown in Fig. 11. From the facts mentioned above, we conclude that the noise pattern map developed in this study can be used to make reasonably good predictions of the refrigerator’s refrigerant-induced noise.
In addition, comparing the results shown in Fig. 12 and in Sec. 3.2, we found that they are consistent with respect to the fact that the annular flow established at certain condition can generate high noise level. Based on the result of Sec. 3.2, the noise level of the annular flow estimated from the flow pattern map was not low. From Fig. 12(a), the flow patterns were estimated to transition toward the annular flow with increasing quality. However, from Fig. 12(b), the noise level of each flow pattern marked in Fig. 12(a) was estimated to increase. Con-sidering the above comparison of the results, we found that although the flow pattern was estimated to be annular flow from flow pattern map, the annular flow formed at certain condition could have high noise level.
5. Conclusions
We developed a noise pattern map based on the experimen-tal data for evaluating the refrigerant-induced noise of a re-frigerator. To this end, we evaluated the refrigerant-induced noise under various refrigerant cycle conditions such as mass flow rate, pipe diameter, refrigerant pressure and temperature, and quality. The following conclusions were drawn.
(1) Based on the theoretical and experimental analysis of several two-phase flow patterns, we derived a relationship between the flow patterns and characteristics of the generated noise. The noise level increased dramatically when the slug bubble passed through the pipe and orifice. However, because the speed of the slug flow was low, the overall noise level was low. In the case of churn flow, the shape of the gas bubble in the pipe was irregular, and instant variations in its velocity were very high. Therefore, we concluded that churn flow was the noisiest among flow patterns.
(2) The flow pattern map was used for evaluating two-phase flow patterns and predicting the tendency of noise. However, based on the experimental results, the annular flow estimated using Taitel-Dukler’s flow pattern map is not always less nois-ier than other flow patterns. It was found that there can be a limit to predicting the refrigerant-induced noise using only a flow pattern map.
(3) The refrigerant-induced noise of under operational cycle conditions was well predicted using the noise pattern map. Furthermore, the map was very useful for analyzing the rela-tive noise level of a commercial refrigerator under specific cycle conditions with the passage of time. In addition, we used the noise pattern map for reducing the refrigerant-induced noise. Using this noise map, we will be able to simulate in advance the noise patterns of the evaporator and the refrigera-tion cycle of a refrigerator based on the pipe size and refriger-ant cycle conditions such as mass flow rate, pressure and tem-perature of refrigerant, and quality.
10-1
100
100
101
Annular
Slug&Churn
X
Ku g
x:0.365, T=-17.6oC
x:0.282, T=-10.3oC
(a) Flow pattern estimation using Taitel and Dukler map
(b) Noise pattern estimation using Eq. (14)
Fig. 12. Estimation of flow and noise patterns under operating cycle conditions of commercial refrigerator.

M. S. Kim et al. / Journal of Mechanical Science and Technology 28 (9) (2014) 3499~3510 3509
Acknowledgment
This research was supported by Basic Science Research Program through the National Research Foundation of Korea (NRF) funded by the Ministry of Education, Science and Technology (2010-0021800).
Nomenclature------------------------------------------------------------------------
A : Sectional area of the pipe [m2] b : Radiation resistance of the bubble [N s m-1] D : Diameter of the pipe [m] F : The shear stress on the pipe due to friction [N m-2] fn : Natural frequency of oscillating bubble [Hz] Gg : Mass flux of the gas [kg m-2 s-1] Gl : Mass flux of the liquid [kg m-2 s-1] g : Acceleration of gravity [m s-2] h : Convection coefficient [kJ m-2℃-1] h' : Enthalpy of the sub-cooler [kJ kg-1] hl : Enthalpy of the saturated liquid at low pressure [kJ
kg-1] hg : Enthalpy of the saturated gas at low pressure [kJ kg-1] hsc : Enthalpy of the sub-cooler [kJ kg-1] ∆hheater : Enthalpy increment by the heater [kJ kg-1] ∆hpipe : Enthalpy increment by the heat exchanging from the
connecting pipe to the environment [kJ kg-1] jg : Superficial velocity of the gas [m s-1] K : Conductivity of the insulation [kJ m-1℃-1] Kug : Kutateladze parameter of the gas k : Equivalent stiffness term of the bubble [N m-5] l : Length of the pipe [m] m : Equivalent mass of the bubble [kg m-4] m' : Mass flow rate [kg s-1] PA : Acoustic pressure of the bubble [Pa] p : Pressure of the liquid surrounding of the bubble [Pa] Qg : Volumetric flow rate of the gas [m3 s-1] qheater : Heat input from the heater [ kJ] qpipe : Heat transferred from the connection pipe to the envi-
ronment [ kJ] R : Inner radius of the pipe [m] R0 : Equivalent radius of the bubble assuming its shape is
spherical [m] R1 : Thermal resistance for conduction [℃ kJ-1] R2 : Thermal resistance for convection [℃ kJ-1] rinsul : Radius of the insulation [m] rpipe : Radius of the pipe [m] T : Period of oscillation [s] T∞ : Environmental temperature [℃] Tpipe : Temperature on the pipe [℃] t : Time [s] V0 : Initial volume of the bubble [m3] v : Volume of the bubble [m3] X : The Martinelli parameter x : Mass quality xT : Vapor quality
z : Distance in the axis direction [m] α : Void fraction γ : Specific heat ratio θ : Angle of inclination with respect to the horizontal
plane [rad] μl : Viscosity of the liquid [N s m-2] μg : Viscosity of the gas [N s m-2] ρ : Density of the liquid surrounding of the bubble [kg m-3] ρl : Density of the liquid [kg m-3] ρg : Density of the gas [kg m-3] σ : Surface tension [N m-1] ω : Angular rotation [rad/s] dp/dz : Total pressure gradient [Pa m-1] (dp/dz)F : Frictional pressure gradient [Pa m-1] (dp/dz)F,g : Frictional pressure gradient assuming that the gas
flows alone in a tube [Pa m-1] (dp/dz)F,l : Frictional pressure gradient assuming that the liquid
flows alone in a tube [Pa m-1]
References
[1] G. F. Hewitt and D. N. Roberts, Studies of two-phase flow patterns by simultaneous flash and X-ray photography, AERE-M2159 (1969).
[2] Y. Taitel and A. E. Dukler, Flow regime transitions for ver-tical upward gas-liquid flow: A preliminary approach through physical modeling, ALChE 70th Annual Meeting, New York, Session on Fundamental Research in Fluid Me-chanics (1997).
[3] T. Oshimowo and M. E. Charles, Vertical two-phase flow part1 flow pattern correlations, Can. J. Chem. Eng, 52 (1974) 25-35.
[4] T. Umeda, Reduction of noise caused by gas-liquid two-phase refrigerant flow through an expansion valve, Journal of Mechanical Science and Technology, 59 (1993) 243-248.
[5] J. H. Park, E. Y. Chang and Y. S. Park, Definition and im-provement of the sound which was generated by bubbles at the accumulator of the evaporator, Transactions of the Ko-rean Society for Noise and Vibration Engineering, 6 (1996) 513-519.
[6] H. S. Han, W. B. Jeong, M. S. Kim, S. Y. Lee and M. Y. Seo, Reduction of the refrigerant-induced noise from the evapora-tor-inlet pipe in a refrigerator, International Journal of Re-frigeration, 33 (2010) 1478-1488.
[7] S. Y. Lee, B. J. Kim and M. H. Kim, Two-phase flow heat transfer, 1st edition, Daeyoung-Sa, Seoul (1993).
[8] P. B. Whalley, Two phase flow and heat transfer, Oxford University Press, Oxford (1999).
[9] H. S. Han, W. B. Jeong and M. S. Kim, Frequency charac-teristics of the noise of R600a refrigerant flowing in a pipe with intermittent flow pattern, International Journal of Re-frigeration, 34 (2011) 1497-1506.
[10] T. G. Leighton, The acoustic bubble, Academic press, London (1994).
[11] W. K. Minnaert, On musical air bubbles and the sound of

3510 M. S. Kim et al. / Journal of Mechanical Science and Technology 28 (9) (2014) 3499~3510
running water, The London, Edinburgh, and Dublin Phi-losophical Magazine and Journal of Science, 16 (1933) 235-248.
[12] R. A. Johnson and G. K. Bhattacharyya, Statistics: princi-ples and methods, John Wiley & Sons, Honboken, New Jer-sey (2006).
Min-Seong Kim received a B.S. degree in Mechanical Engineering from Pusan National University in 2007. He is cur-rently graduated student at Mechanical Engineering at Pusan National Univer-sity in Busan, Korea.
Weui-Bong Jeong received B.S. and M.S degrees from Seoul National Uni-versity in 1978 from KAIST in 1980, respectively. He then received his Ph.D. from Tokyo Institute of Technology in 1990. Dr. Jeong is currently a Professor at the Department of Mechanical Engi-neering at Pusan National University in
Pusan, Korea.
Hyung-Suk Han received a B.S. degree in Production and Mechanical Engineer-ing from Pusan National University in 1996. He then went on to receive his M.S. and Ph.D. degrees from Pusan National University in 1998 and 2007, respectively. Dr. Han is currently a Sen-ior Researcher at Defense Agency of
Technology and Quality, Pusan, Korea.


![Using Sensor Pattern Noise for Camera Model Identificationdde.binghamton.edu/filler/pdf/Fil08icip_slides.pdf · Sensor Noise, IEEE TIFS, 2008] ... Goljan Using Sensor Pattern Noise](https://img.pdfslide.us/doc/110x75/5b239eaf7f8b9a343c8b4d16/using-sensor-pattern-noise-for-camera-model-identi-sensor-noise-ieee-tifs.jpg)