Embed Size (px)
Citation preview
CERP Monitoring and Assessment Plan: Role in Decision Making and
Communicating the Health of the Ecosystem
Task Force BriefingScience Coordination Group
Susan M. Markley, PhD, Interim ChairOctober 27, 2011
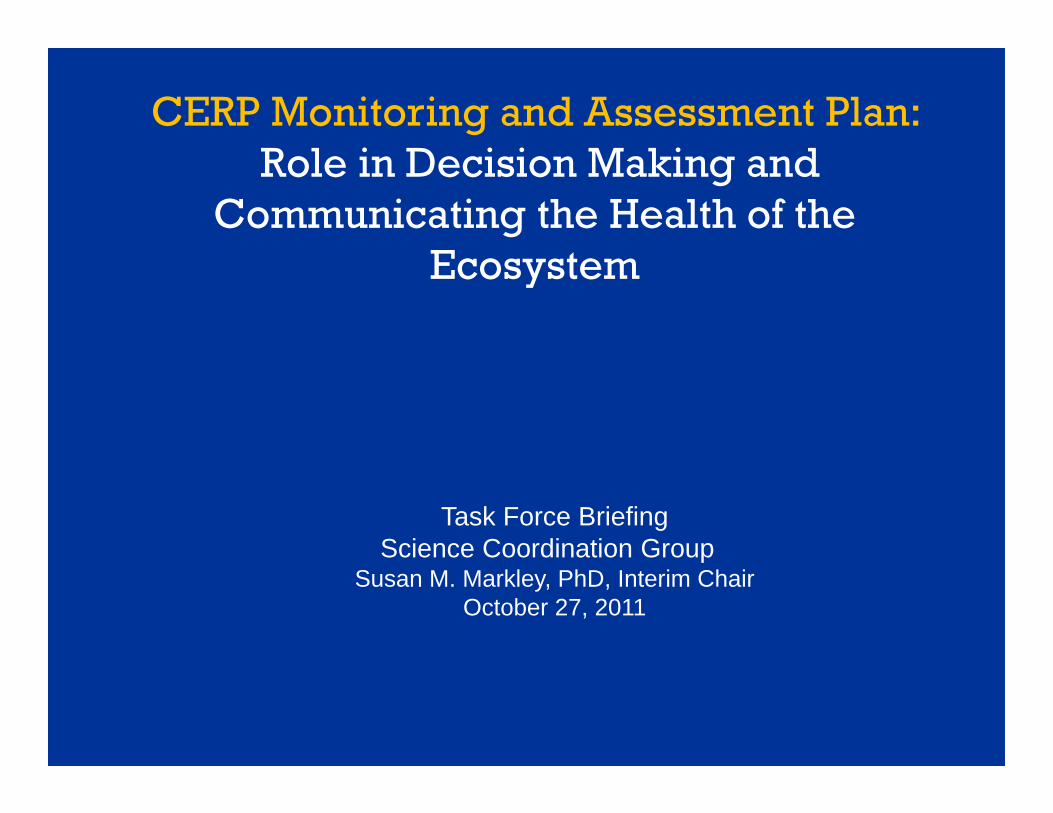
• WHAT is happening (status, trends, SHIFTING BASELINES)• CONNECTIONS between habitats and levels of food web • SELECTED eco-performance measures, keystone species that together help
define ecosystem health (eg. birds, gators)• Elements with SHORT and LONG TERM responses
Based from the outset on OPTIMIZING and PRIORITIZING• Inter-agency collaborative plan • Integrated with non-RECOVER funded efforts to avoid duplication and reduce costs • Leveraged other monitoring to provide information • Repeatedly refined to incorporate learning, emerging issues, and changes in project
sequencing
What is the CERP Monitoring and Assessment Plan?
Primary tool for assessing performance of CERP Systemwide• Measurement of ECOSYSTEM RESPONSES to assess management and how
well restoration goals and objectives are being addressed• Enables ADAPTIVE MANAGEMENT for updating and improving CERP as
required by authorizing legislation and regs
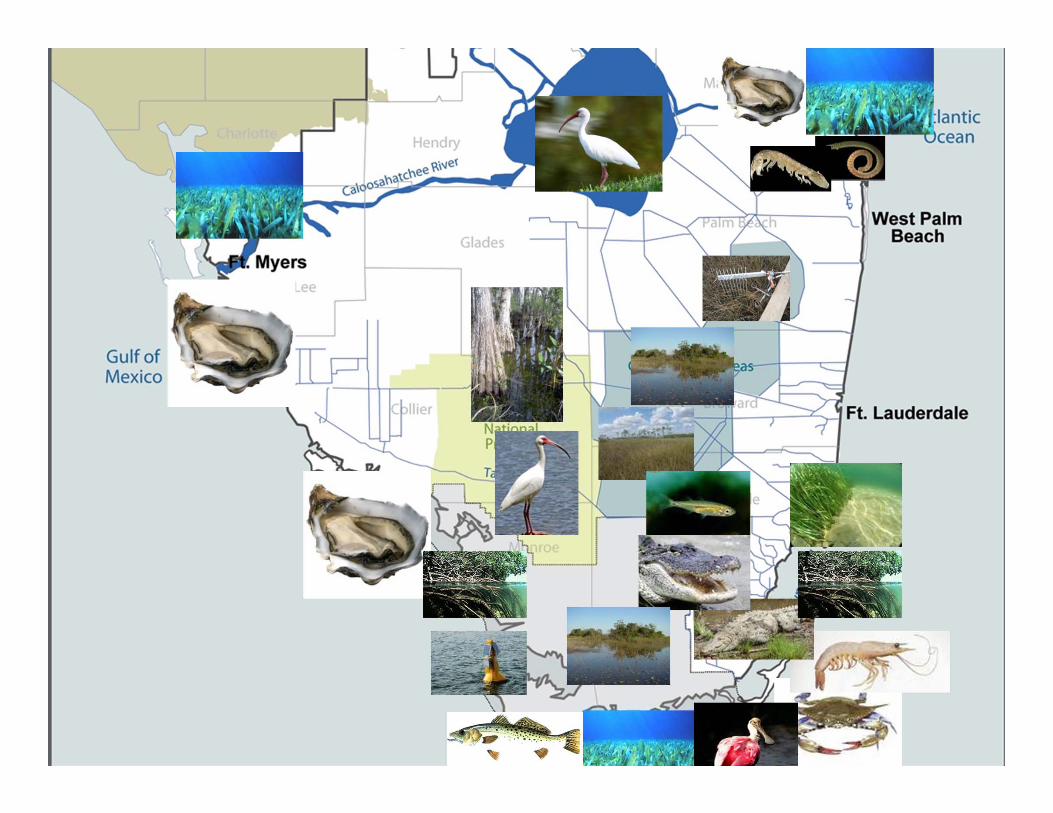
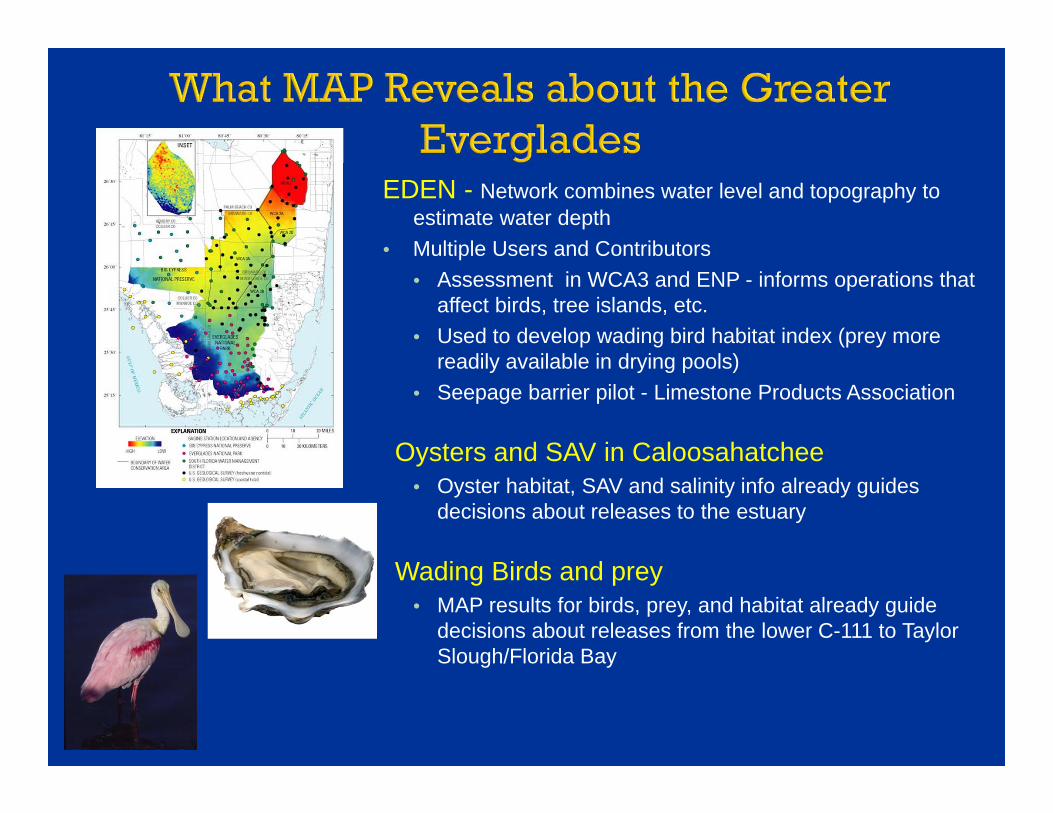
EDEN - Network combines water level and topography to estimate water depth
• Multiple Users and Contributors • Assessment in WCA3 and ENP - informs operations that
affect birds, tree islands, etc.• Used to develop wading bird habitat index (prey more
readily available in drying pools)• Seepage barrier pilot - Limestone Products Association
Oysters and SAV in Caloosahatchee• Oyster habitat, SAV and salinity info already guides
decisions about releases to the estuary
Wading Birds and prey• MAP results for birds, prey, and habitat already guide
decisions about releases from the lower C-111 to Taylor Slough/Florida Bay
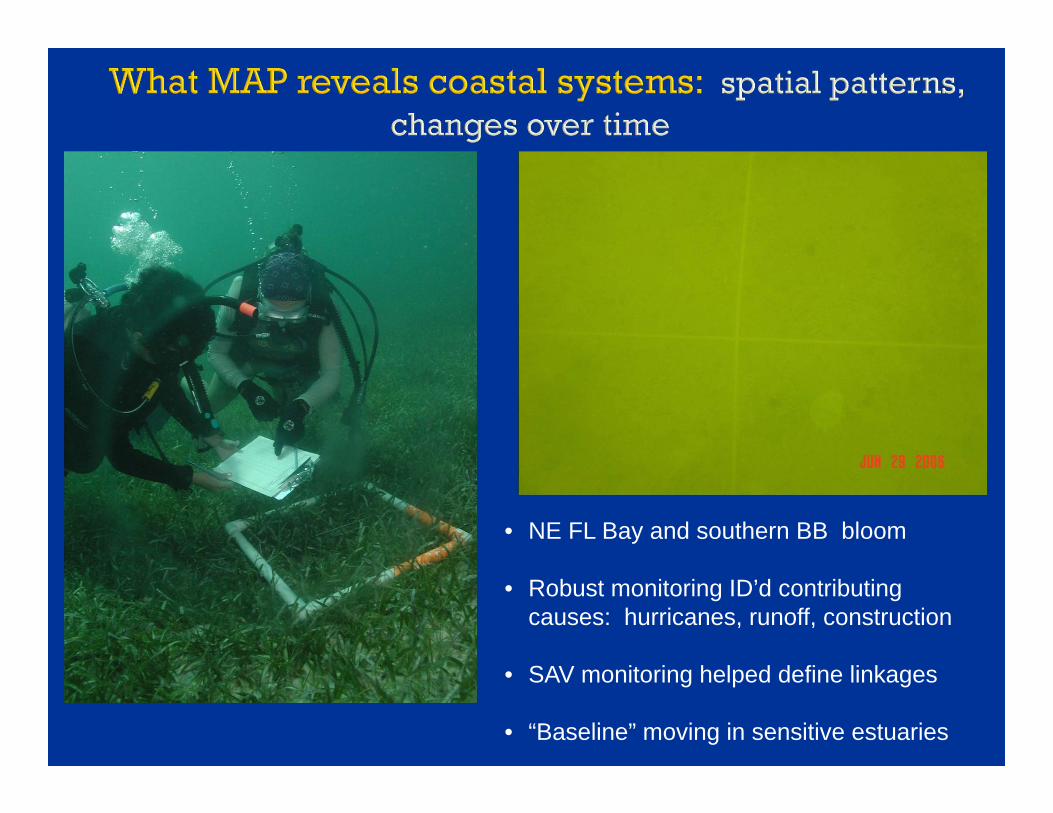
• NE FL Bay and southern BB bloom
• Robust monitoring ID’d contributing causes: hurricanes, runoff, construction
• SAV monitoring helped define linkages
• “Baseline” moving in sensitive estuaries
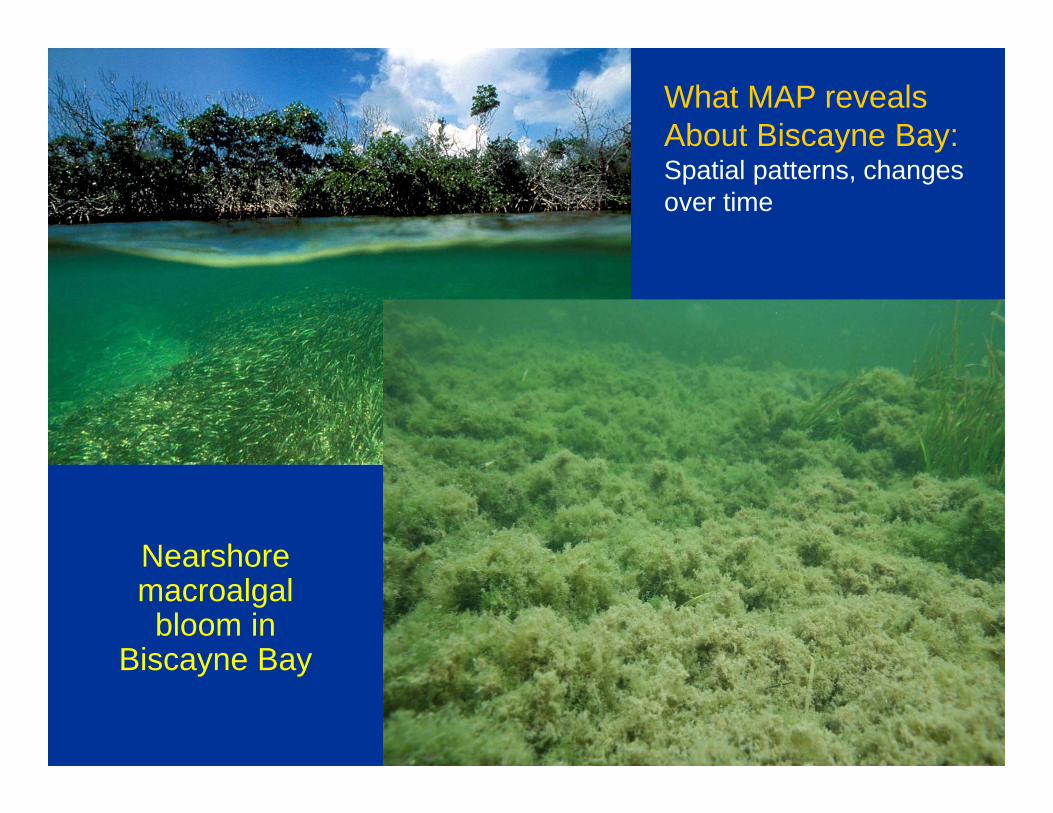
Nearshoremacroalgalbloom in
Biscayne Bay
What MAP revealsAbout Biscayne Bay:Spatial patterns, changes over time
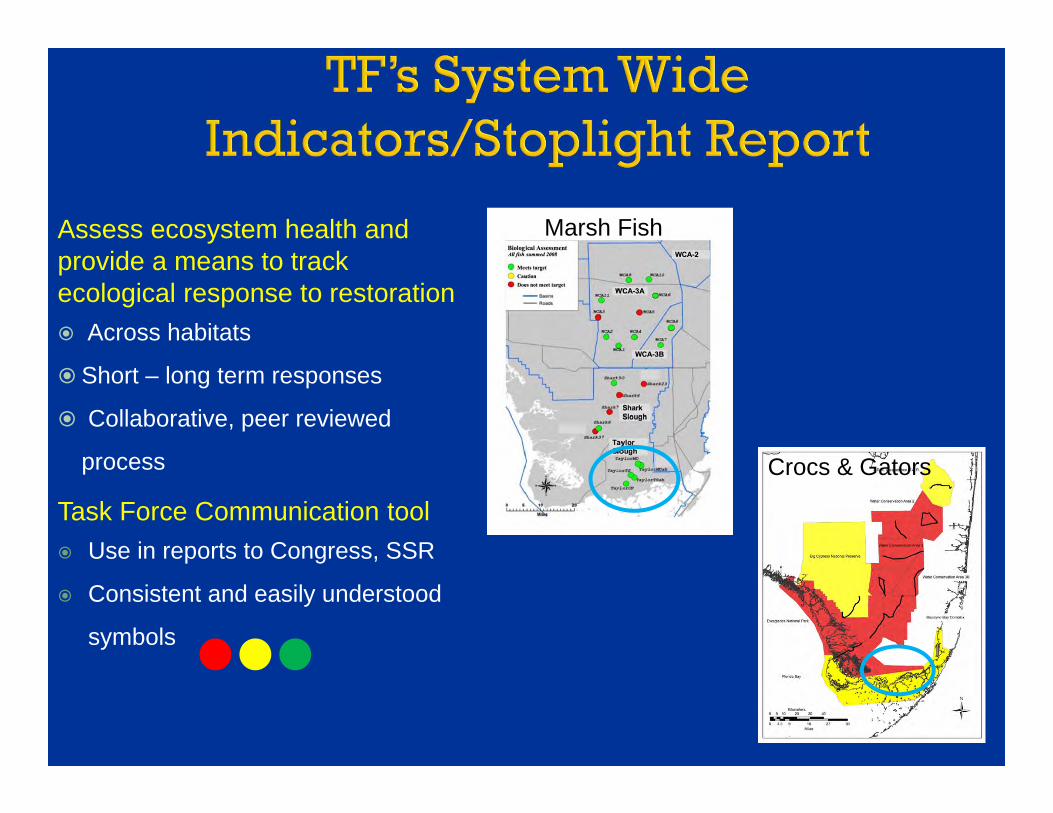
Assess ecosystem health and provide a means to track ecological response to restoration Across habitats
Short – long term responses
Collaborative, peer reviewed
process
Task Force Communication tool Use in reports to Congress, SSR
Consistent and easily understood
symbols
Marsh Fish
Crocs & Gators
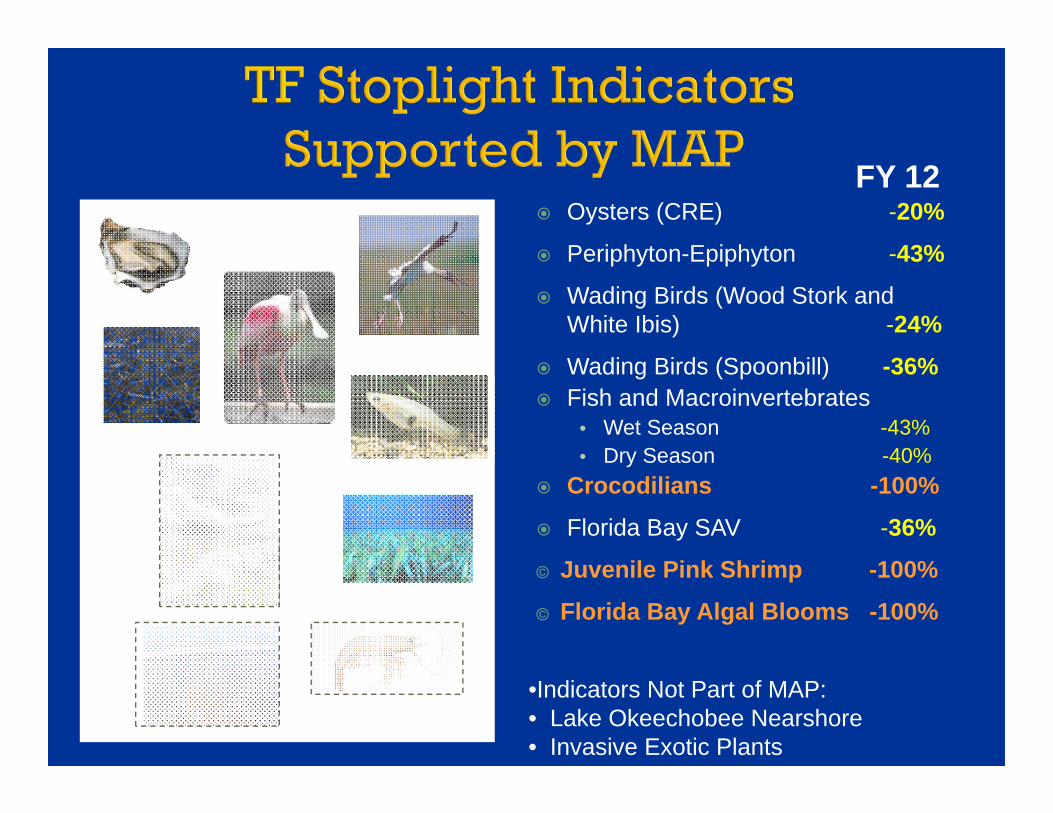
Oysters (CRE) -20%
Periphyton-Epiphyton -43%
Wading Birds (Wood Stork and White Ibis) -24%
Wading Birds (Spoonbill) -36% Fish and Macroinvertebrates
• Wet Season -43%• Dry Season -40%
Crocodilians -100%
Florida Bay SAV -36%
© Juvenile Pink Shrimp -100%
© Florida Bay Algal Blooms -100%
FY 12
•Indicators Not Part of MAP:• Lake Okeechobee Nearshore• Invasive Exotic Plants
Direct the SCG to assess the loss of system-wide ecological indicators and provide recommendations on how to best retain their intended purpose.
Direct the SCG and WG to work with RECOVER to review the MAP to ensure it is positioned to support the Everglades next step planning process, evaluate ongoing projects, and continue an adaptive management approach to restoration.