Embed Size (px)
Citation preview

Community Emission Reduction Plan (CERP)Community Steering Committee Meeting #8
November 15, 2021
September 2021 2
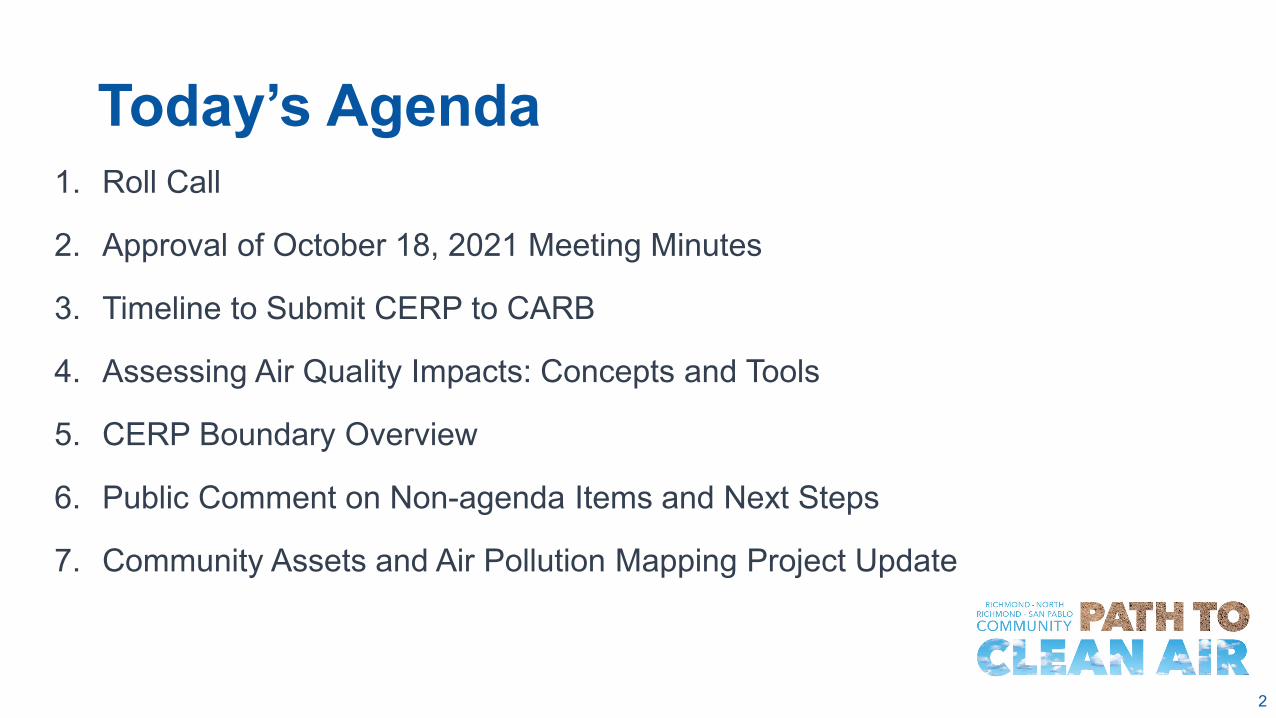
Today’s Agenda1. Roll Call
2. Approval of October 18, 2021 Meeting Minutes
3. Timeline to Submit CERP to CARB
4. Assessing Air Quality Impacts: Concepts and Tools
5. CERP Boundary Overview
6. Public Comment on Non-agenda Items and Next Steps
7. Community Assets and Air Pollution Mapping Project Update
September 2021 3
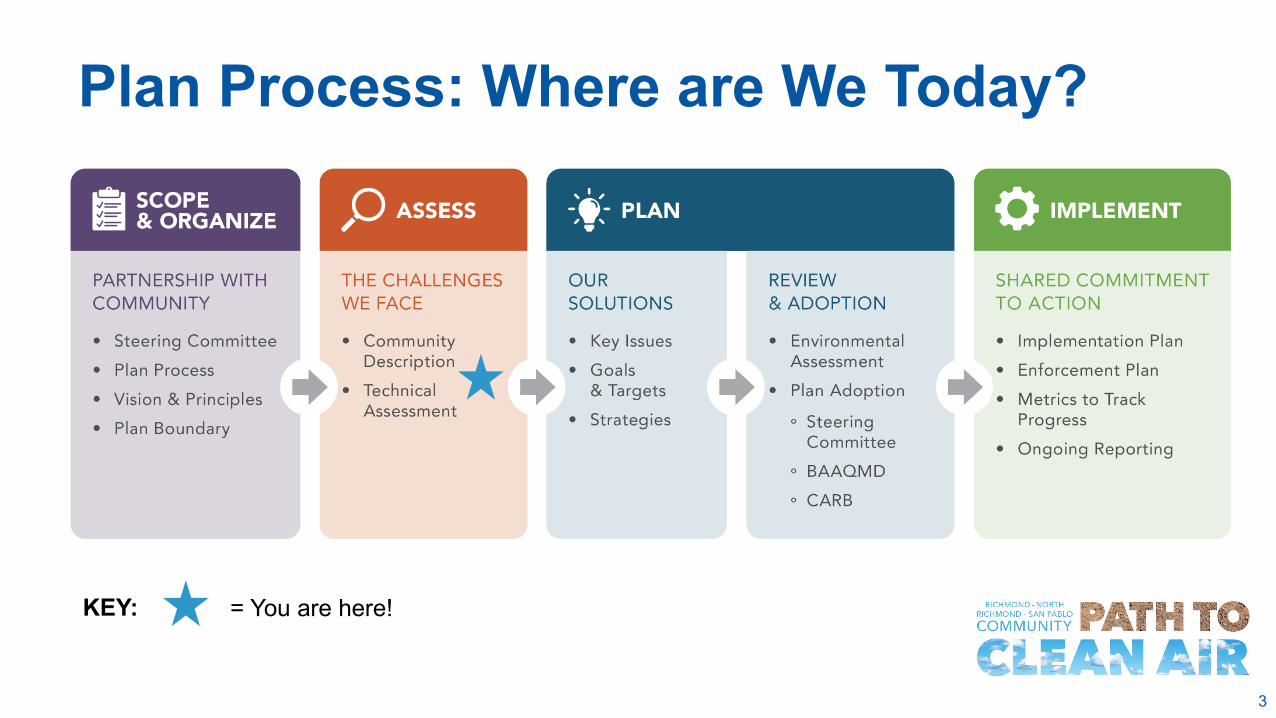
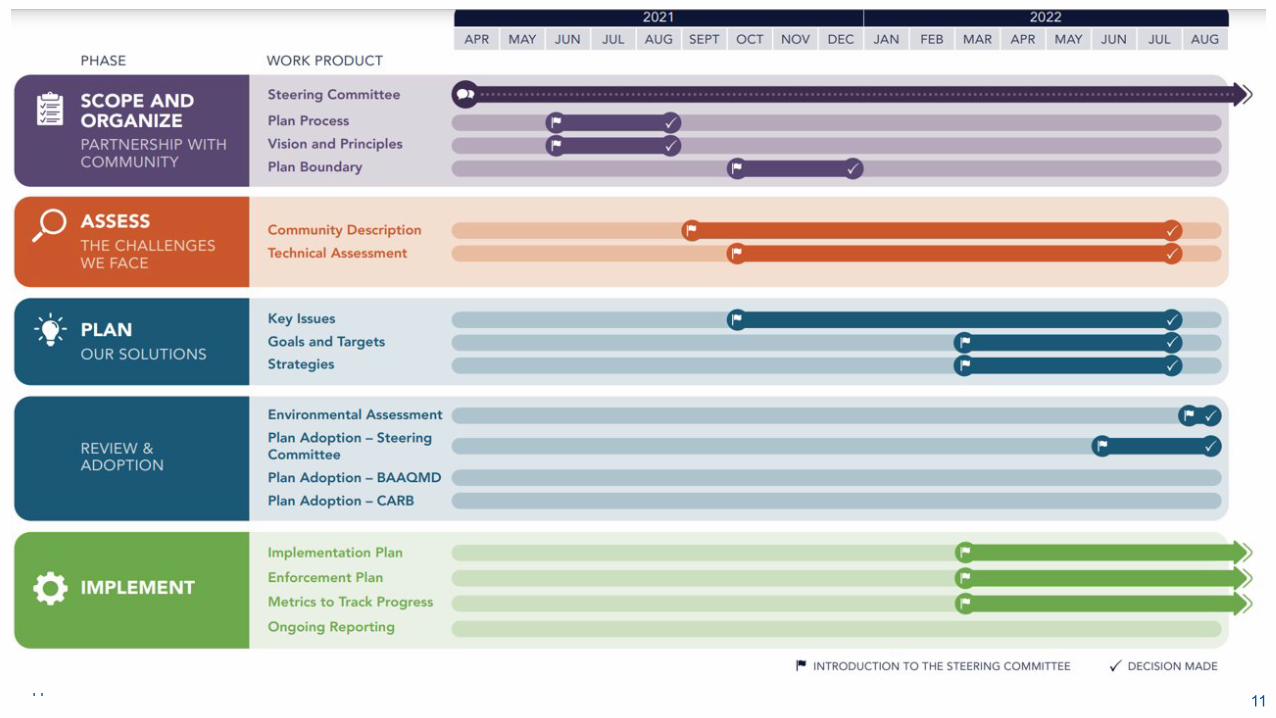
Plan Process: Where are We Today?
KEY: = You are here!
September 2021 4
Welcome!
September 2021 5
Approval of October 18, 2021 Meeting Minutes

September 2021 6
Public Comment

September 2021 7
Timeline to Submit CERP to CARBY’Anad Burrell and Alfredo Angulo-Castro, Steering Committee Co-Chairs
September 2021 8
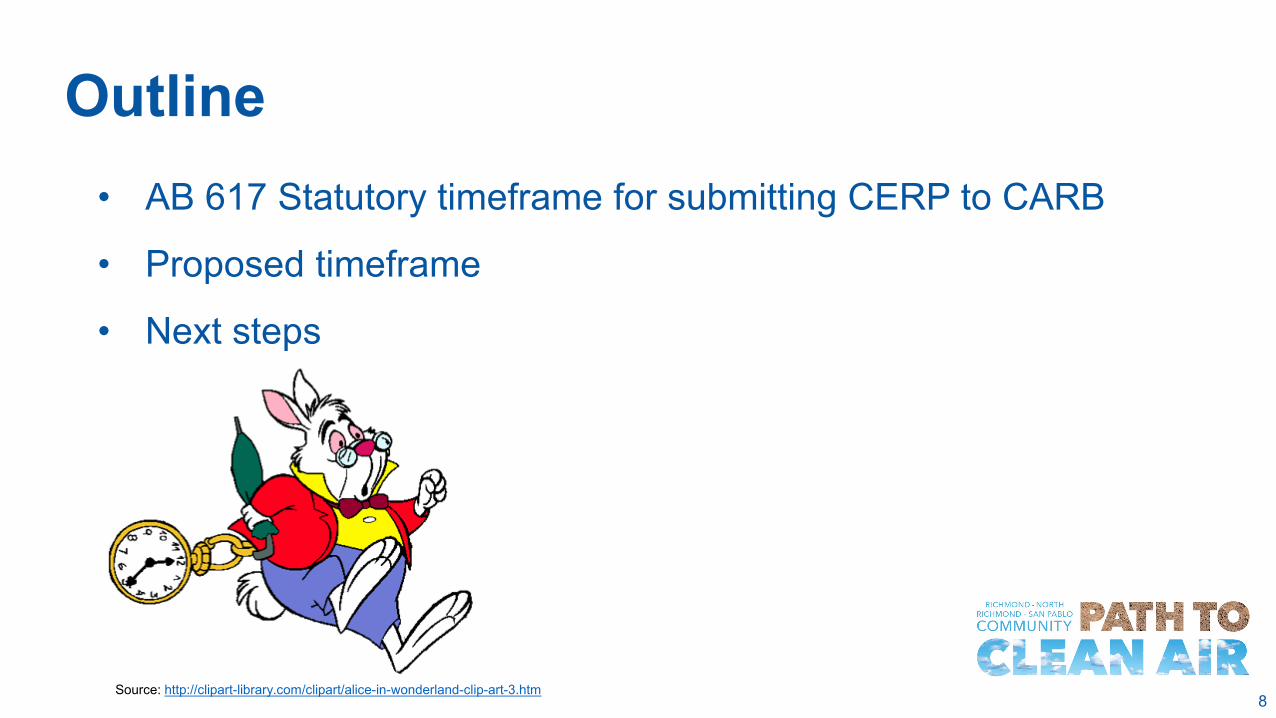
Outline• AB 617 Statutory timeframe for submitting CERP to CARB
• Proposed timeframe
• Next steps
Source: http://clipart-library.com/clipart/alice-in-wonderland-clip-art-3.htm
September 2021 9
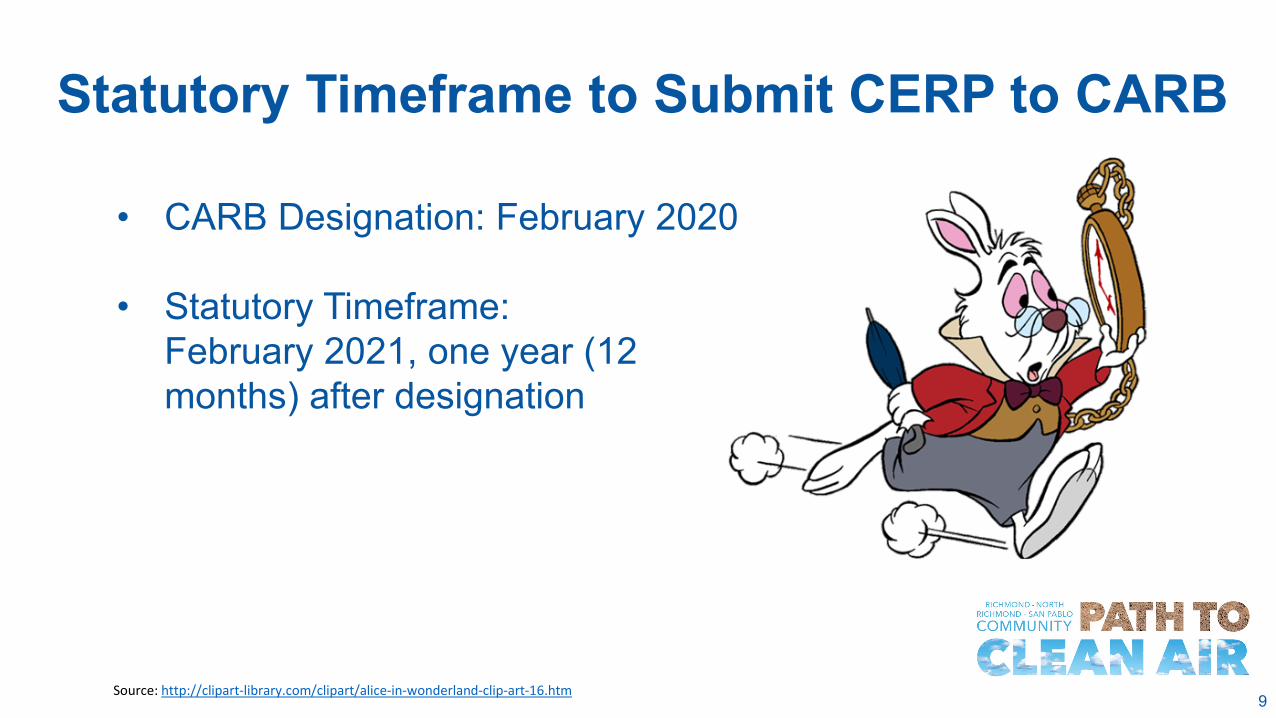
Statutory Timeframe to Submit CERP to CARB
• CARB Designation: February 2020
• Statutory Timeframe:February 2021, one year (12 months) after designation
Source: http://clipart-library.com/clipart/alice-in-wonderland-clip-art-16.htm
September 2021 10
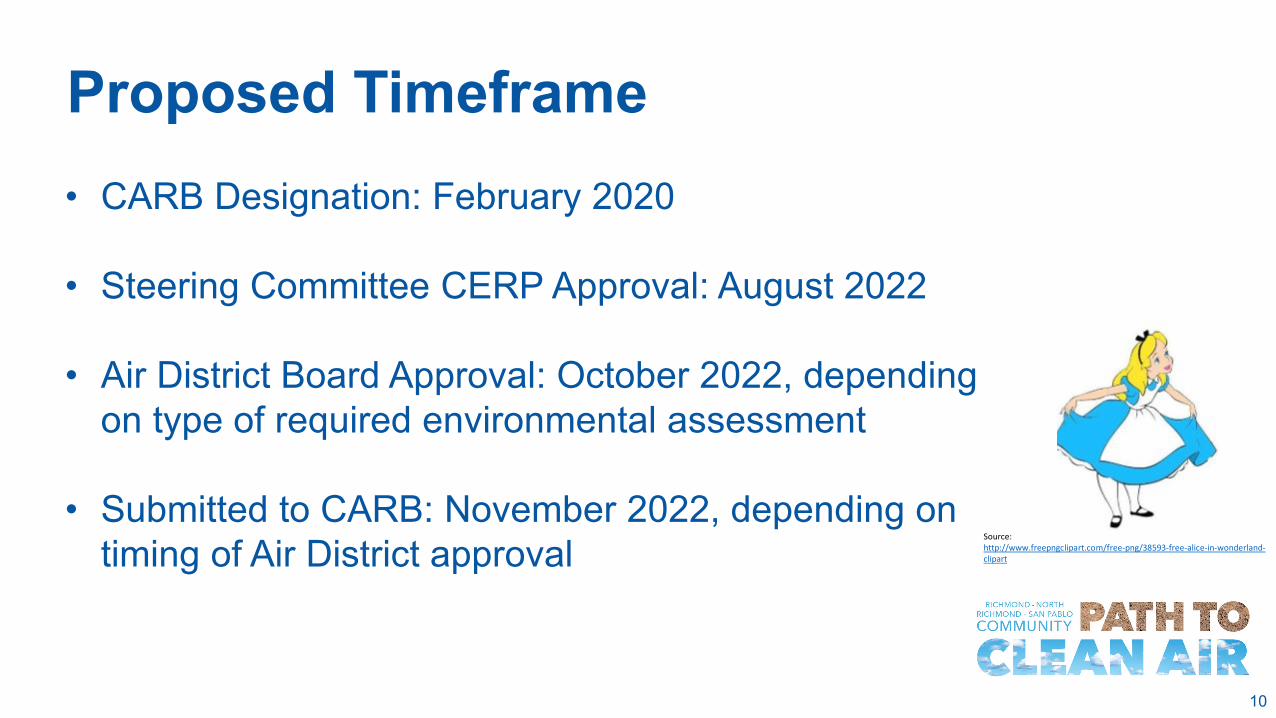
Proposed Timeframe• CARB Designation: February 2020
• Steering Committee CERP Approval: August 2022
• Air District Board Approval: October 2022, depending on type of required environmental assessment
• Submitted to CARB: November 2022, depending on timing of Air District approval
Source:http://www.freepngclipart.com/free-png/38593-free-alice-in-wonderland-clipart
September 2021 1111
September 2021 12
Next Steps
• The Steering Committee sends CARB a letter describing the timeframe
• Volunteers to lead this effort? Source: http://clipart-library.com/clipart/alice-in-wonderland-clip-art-10.htm
September 2021 13
Public Comment
September 2021 14
Steering Committee Questions and Discussions

September 2021 15
Assessing Air Quality Impacts: Concepts and Tools
Daniel Alrick, Principal Air and Meteorological Monitoring [email protected] Holstius, Senior Advanced Projects [email protected]
September 2021 16
Topics for this Presentation
• Air quality concepts and terms
• Pathway from emissions, to concentrations, to exposures
• Tools and methods, with examples
September 2021 17
Air Quality Concepts
September 2021 18
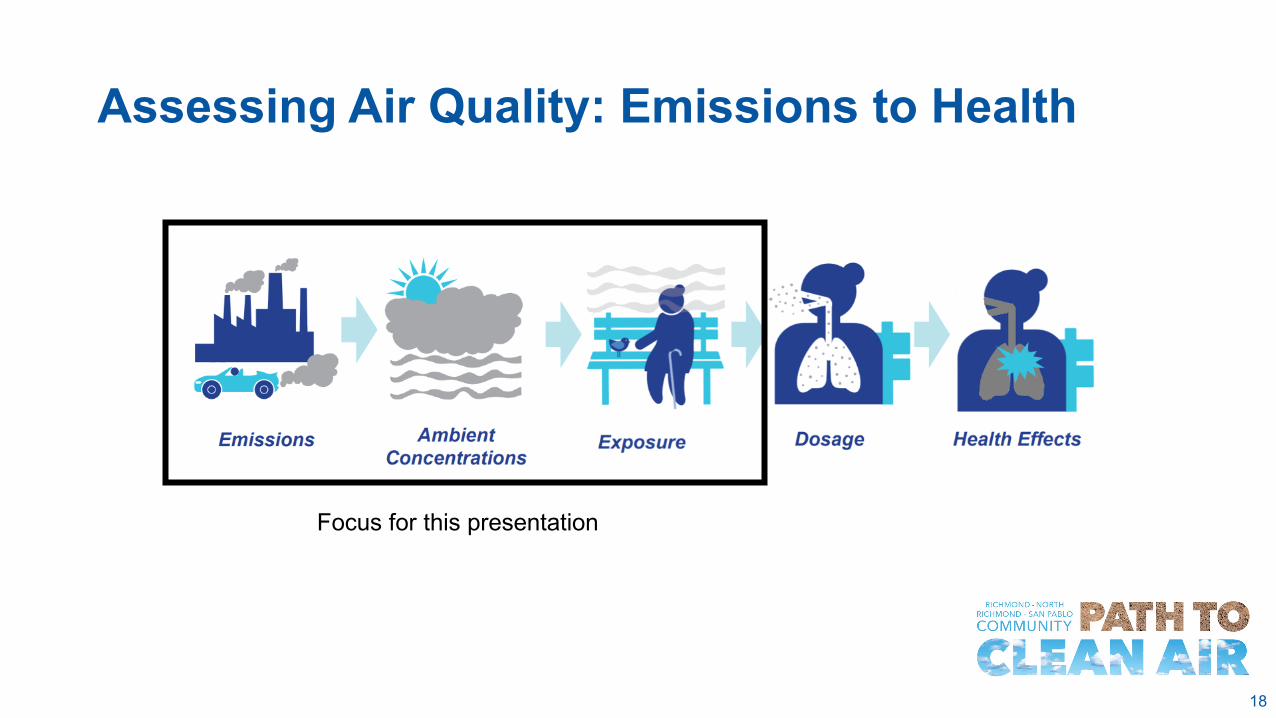
Assessing Air Quality: Emissions to Health
Focus for this presentation
September 2021 19
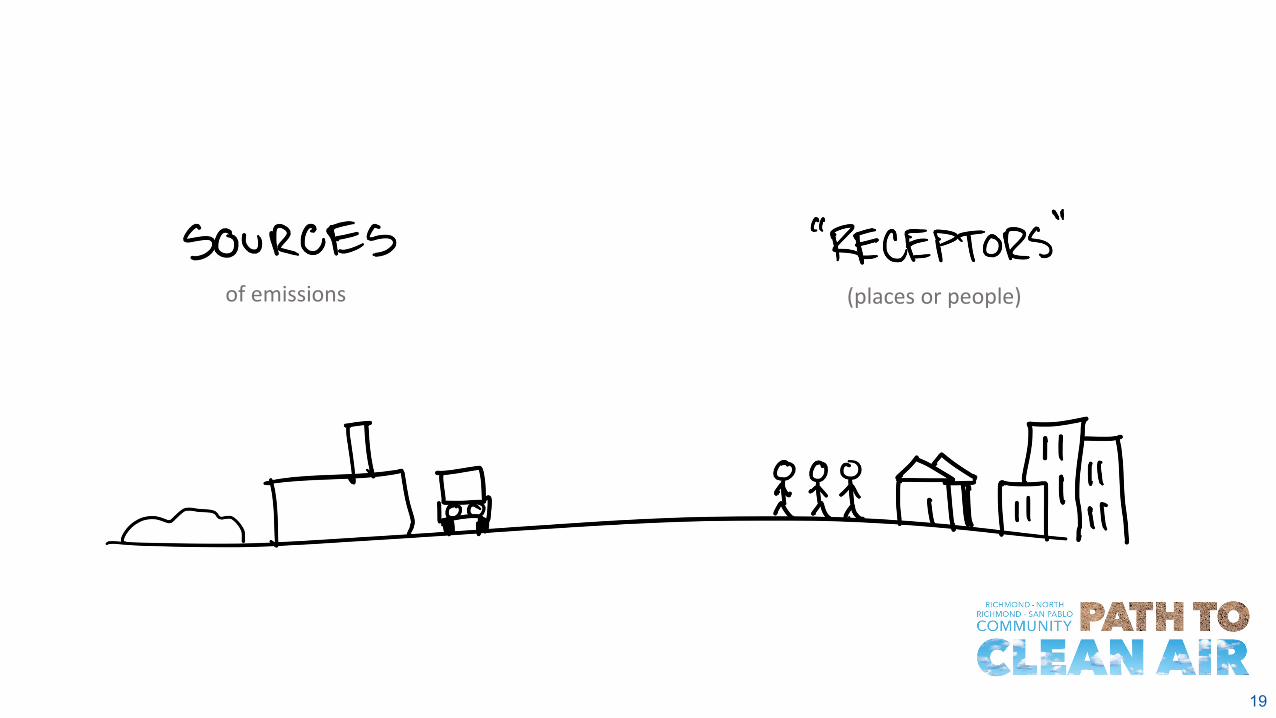
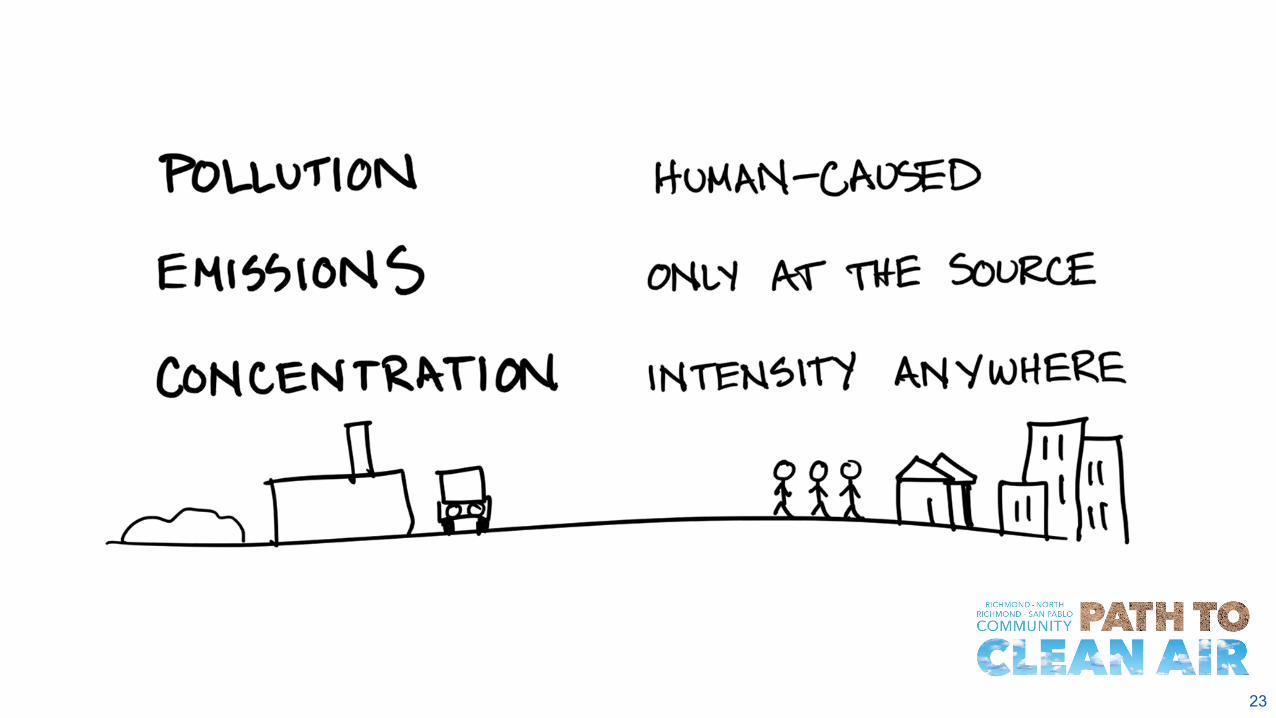
of emissions (places or people)
September 2021 20

September 2021 21
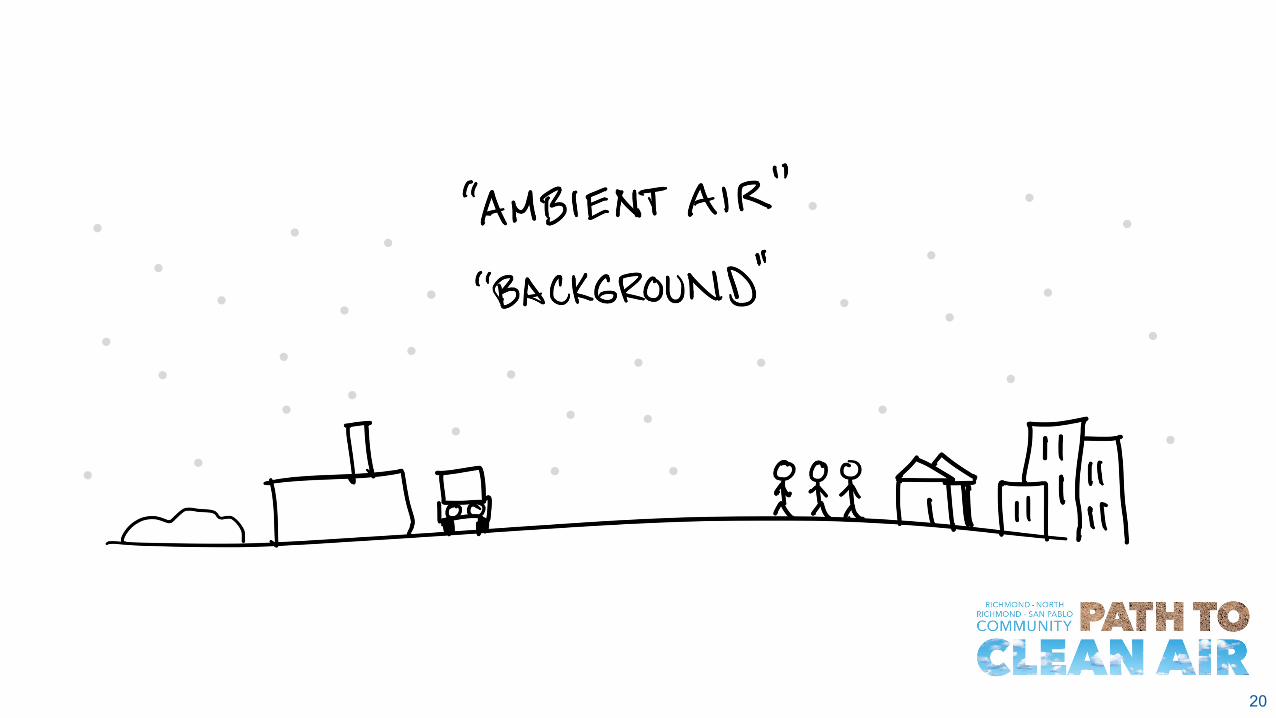
emissions are at the source (only)
1 m3 of air (next slide)
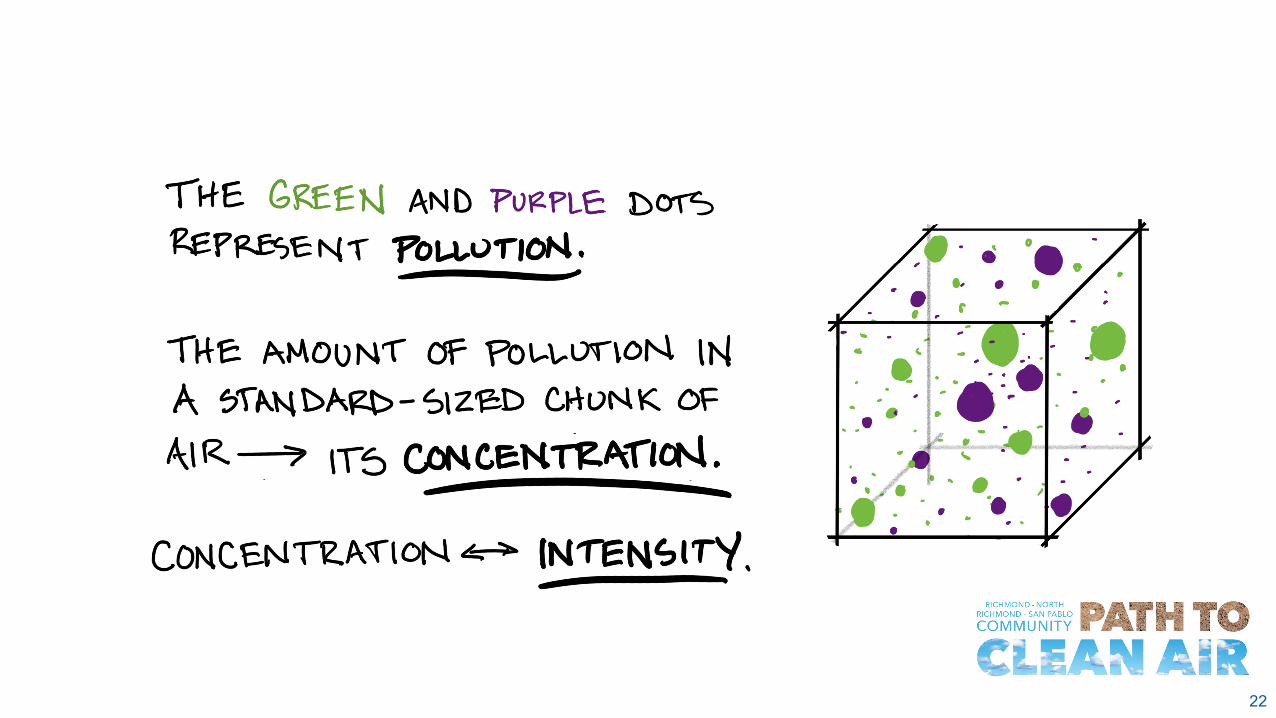
September 2021 22
September 2021 23
24
Tools and Methods
25
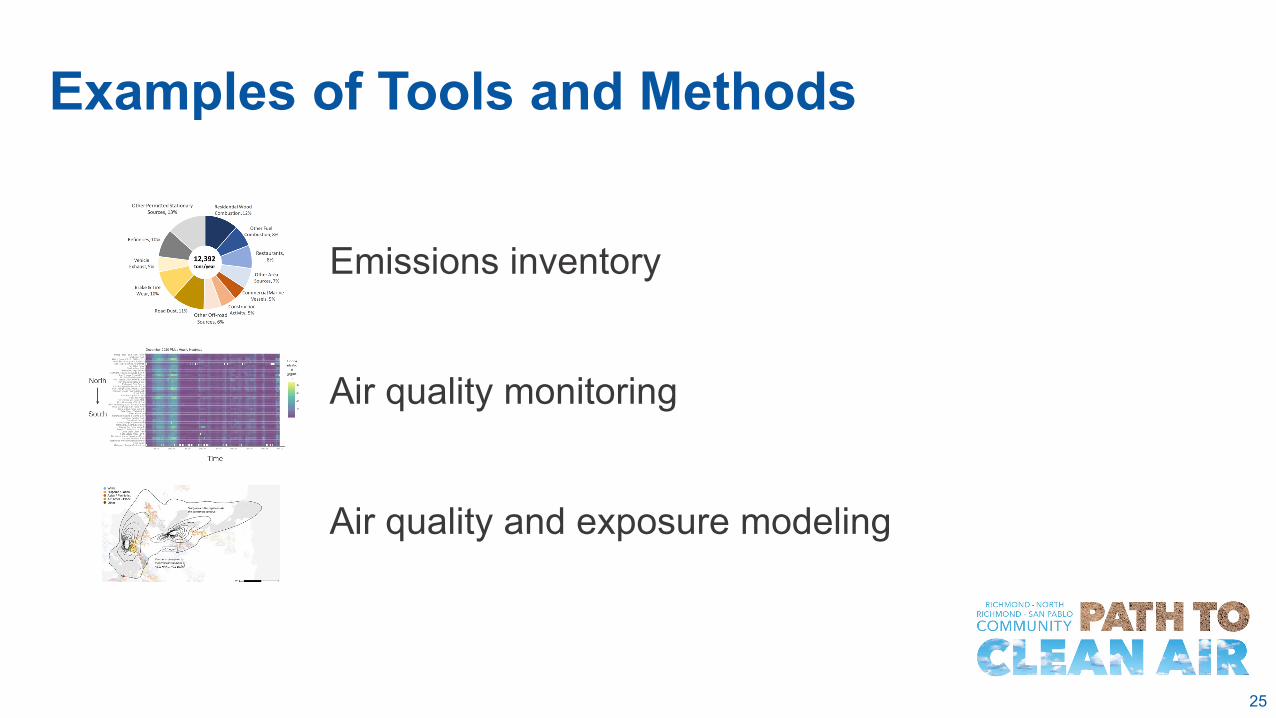
Examples of Tools and Methods
Emissions inventory
Air quality monitoring
Air quality and exposure modeling
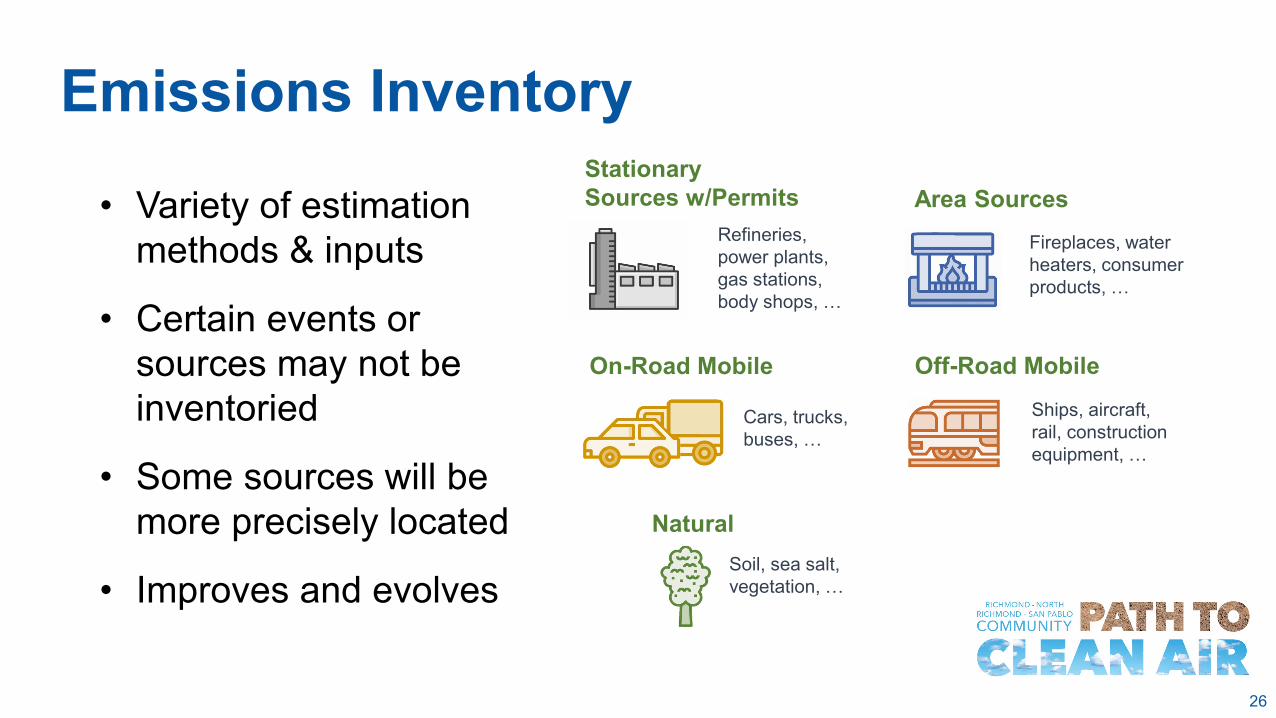
26
Emissions InventoryArea Sources
Fireplaces, water heaters, consumer products, …
On-Road Mobile
Cars, trucks, buses, …
Ships, aircraft, rail, construction equipment, …
Off-Road Mobile
Refineries, power plants, gas stations, body shops, …
Stationary Sources w/Permits
NaturalSoil, sea salt, vegetation, …
• Variety of estimation methods & inputs
• Certain events or sources may not be inventoried
• Some sources will be more precisely located
• Improves and evolves
27
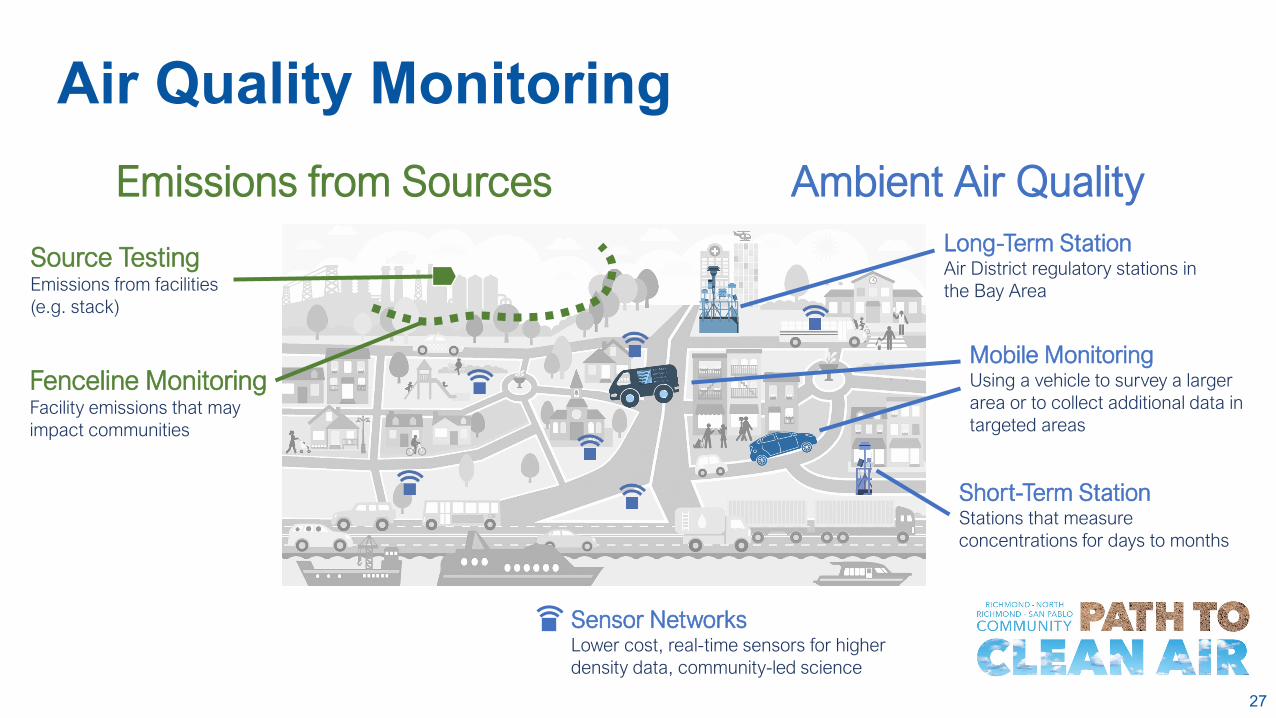
Air Quality Monitoring
Long-Term StationAir District regulatory stations in the Bay Area
Source Testing Emissions from facilities (e.g. stack)
Fenceline MonitoringFacility emissions that may impact communities
Mobile MonitoringUsing a vehicle to survey a larger area or to collect additional data in targeted areas
Sensor NetworksLower cost, real-time sensors for higher density data, community-led science
Emissions from Sources Ambient Air Quality
Short-Term StationStations that measure concentrations for days to months
28
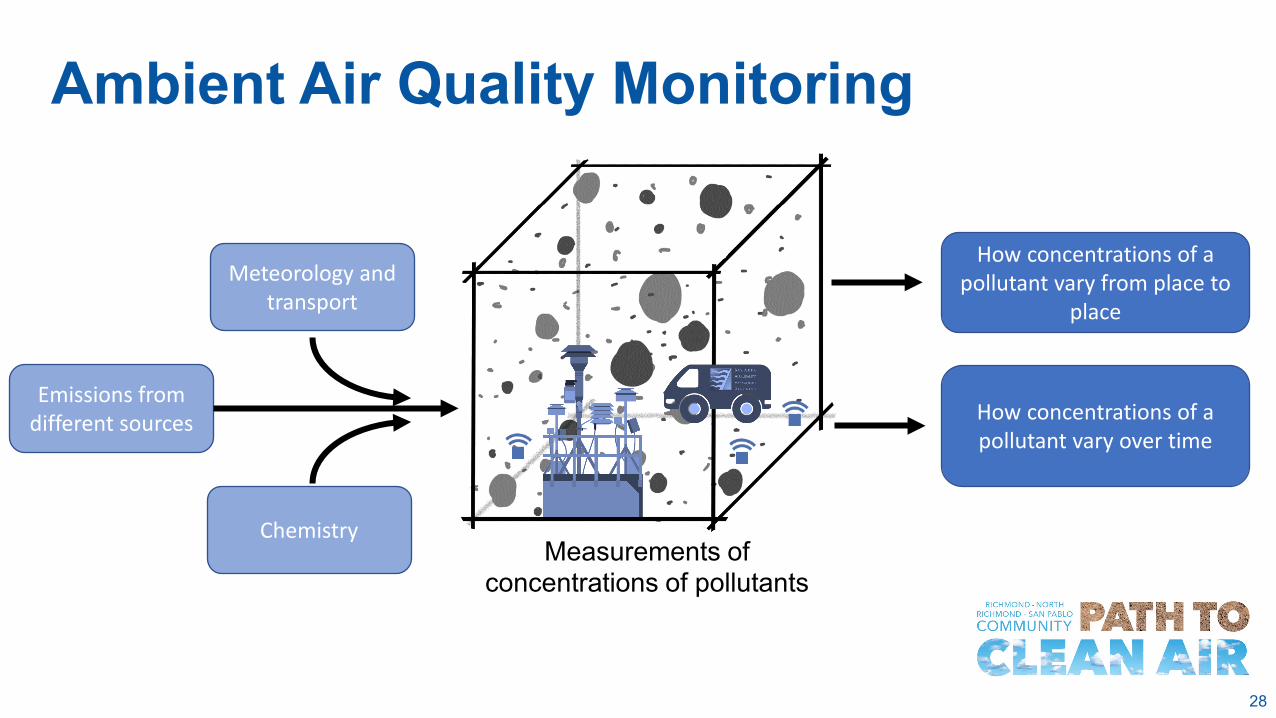
Ambient Air Quality Monitoring
How concentrations of a pollutant vary from place to
place
How concentrations of a pollutant vary over time
Measurements of concentrations of pollutants
Emissions from different sources
Meteorology and transport
Chemistry
29
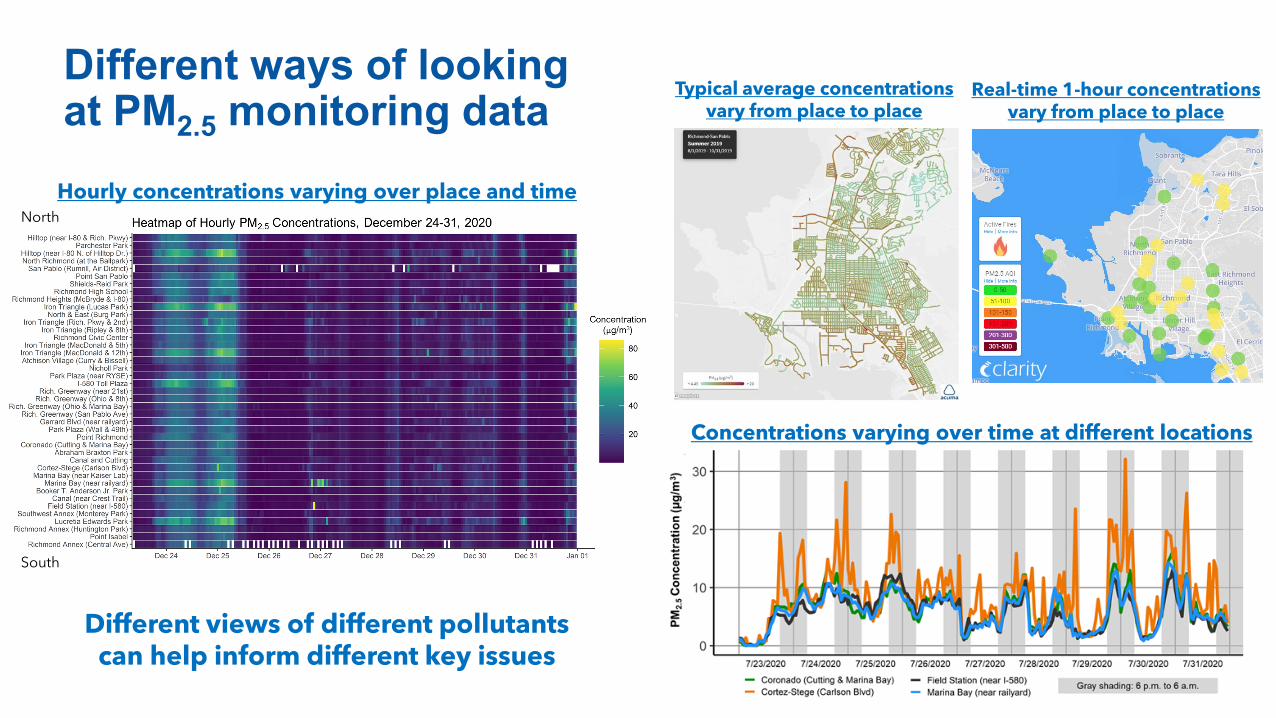
Hourly concentrations varying over place and timeNorth
South
Typical average concentrations vary from place to place
Real-time 1-hour concentrations vary from place to place
Concentrations varying over time at different locations
Different ways of looking at PM2.5 monitoring data
Different views of different pollutants can help inform different key issues
Hourly concentrations varying over place and time
Concentrations varying over time at different locations
Real-time 1-hour concentrations vary from place to place
Typical average concentrations vary from place to place
Different views of different pollutants can help inform different key issues

30
Ambient Air Quality Modeling
Inventoried source locationsand emission rates
Measured and modeled meteorology (wind, …)
Maps of predicted impacts on average ambient AQ
31
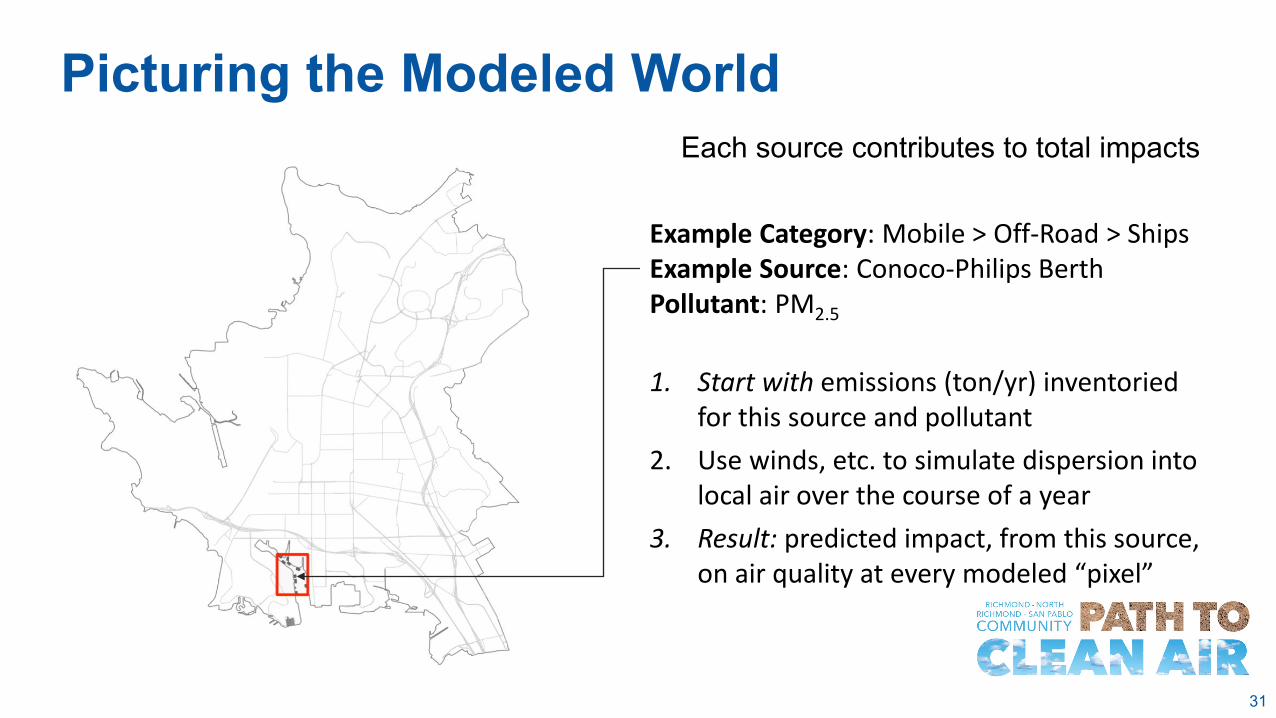
Picturing the Modeled World
Example Category: Mobile > Off-Road > ShipsExample Source: Conoco-Philips Berth Pollutant: PM2.5
1. Start with emissions (ton/yr) inventoried for this source and pollutant
2. Use winds, etc. to simulate dispersion into local air over the course of a year
3. Result: predicted impact, from this source, on air quality at every modeled “pixel”
Each source contributes to total impacts

32
Picturing the Modeled World (cont.)Each source contributes to total impacts
(“Pixels”)As represented in inventory
Berth emissions = 0.33 ton/yr PM2.5
Predicted impact on avg PM2.5 concentrationsdecreases with distance
+0.20+0.15+0.10+0.05+0.00
Placed on 50x50m grid To impacts on air quality (annual average)
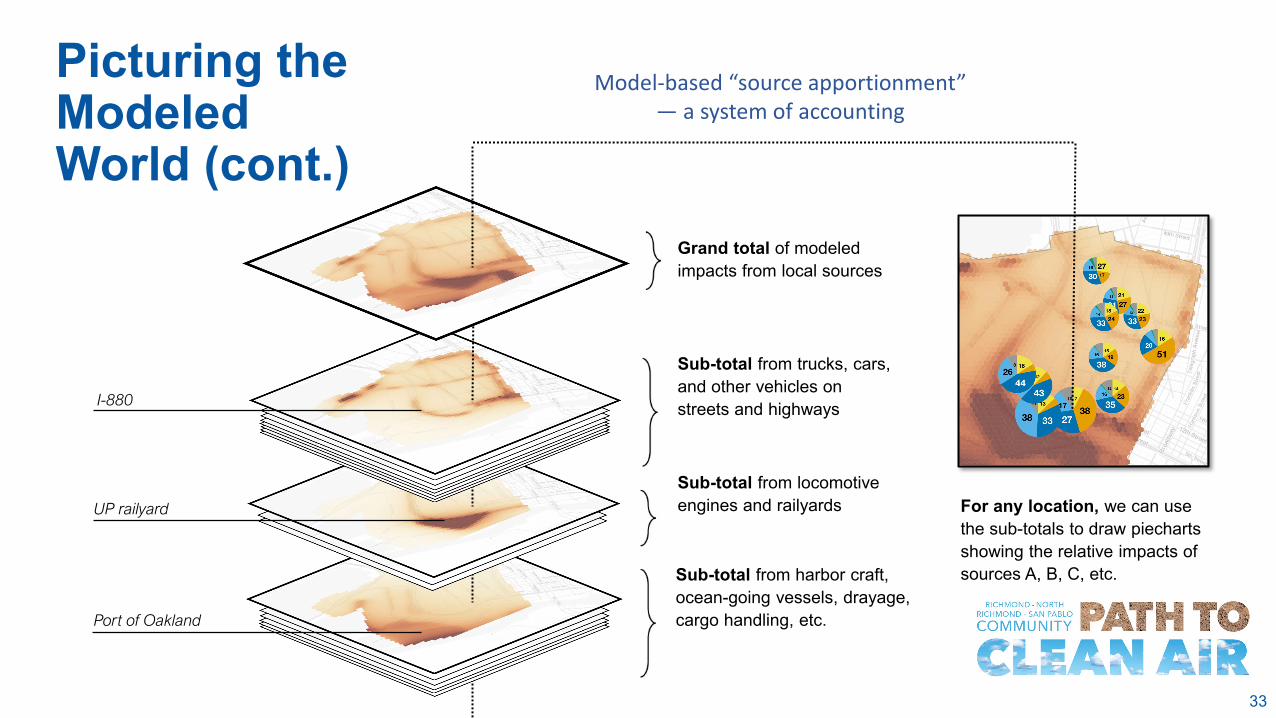
33
Grand total of modeled impacts from local sources
Sub-total from trucks, cars, and other vehicles on streets and highways
Sub-total from locomotive engines and railyards
Sub-total from harbor craft, ocean-going vessels, drayage, cargo handling, etc.
I-880
UP railyard
Port of Oakland
For any location, we can use the sub-totals to draw piechartsshowing the relative impacts of sources A, B, C, etc.
Picturingthe ModeledWorld
Picturing theModeledWorld (cont.)
Model-based “source apportionment”— a system of accounting
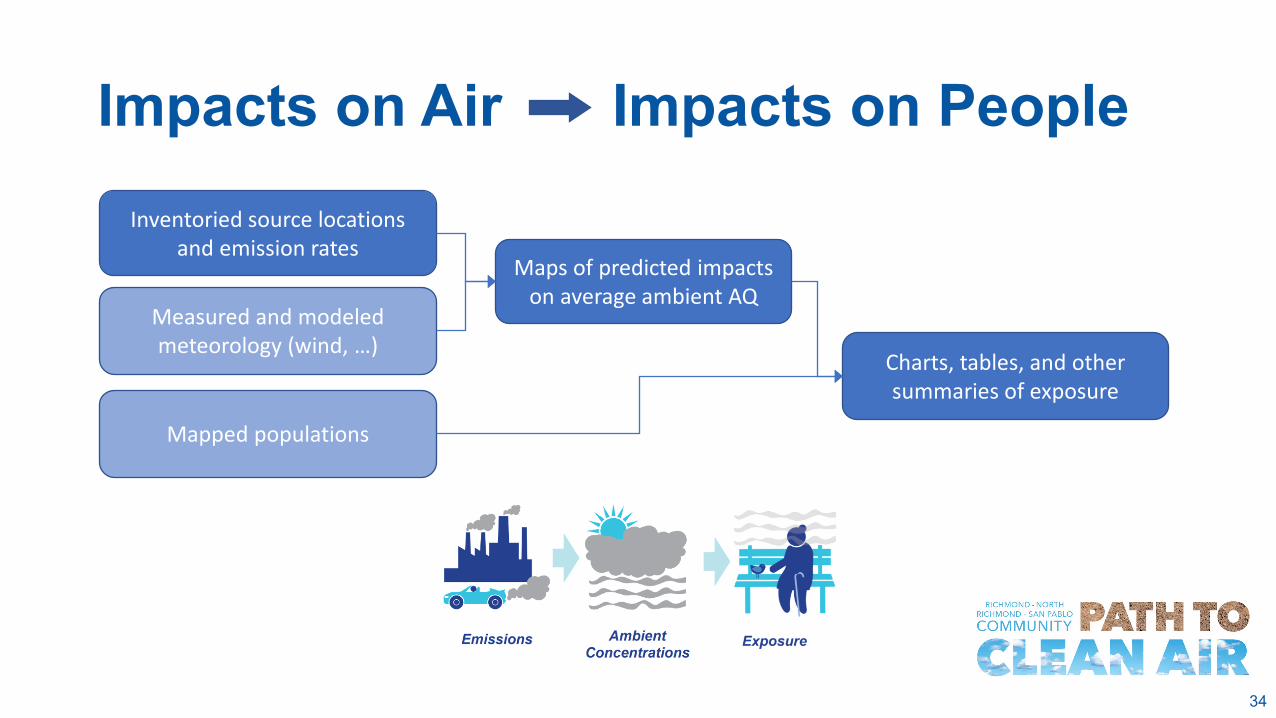
34
Impacts on AirInventoried source locations
and emission rates
Measured and modeled meteorology (wind, …)
Maps of predicted impacts on average ambient AQ
Mapped populations
Charts, tables, and other summaries of exposure
Impacts on People
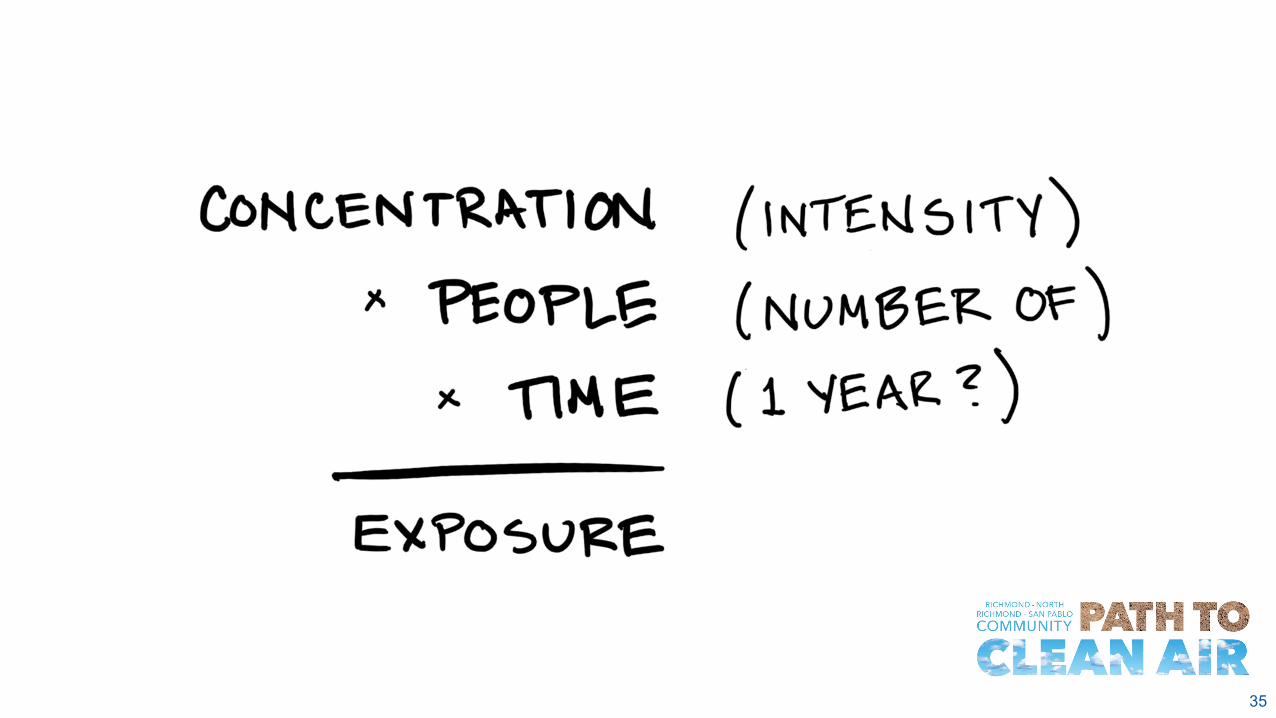
35
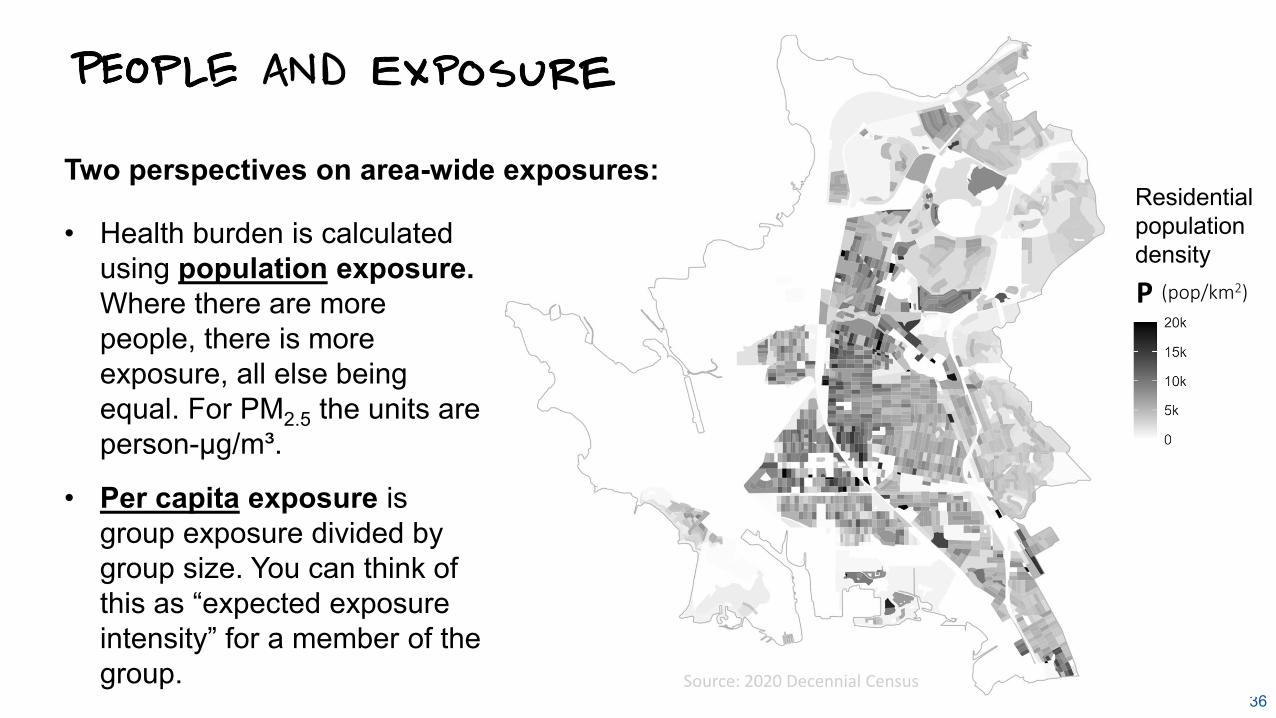
36
P (pop/km2)
Source: 2020 Decennial Census
Residential population density
• Health burden is calculated using population exposure. Where there are more people, there is more exposure, all else being equal. For PM2.5 the units are person-µg/m³.
• Per capita exposure is group exposure divided by group size. You can think of this as “expected exposure intensity” for a member of the group.
Two perspectives on area-wide exposures:
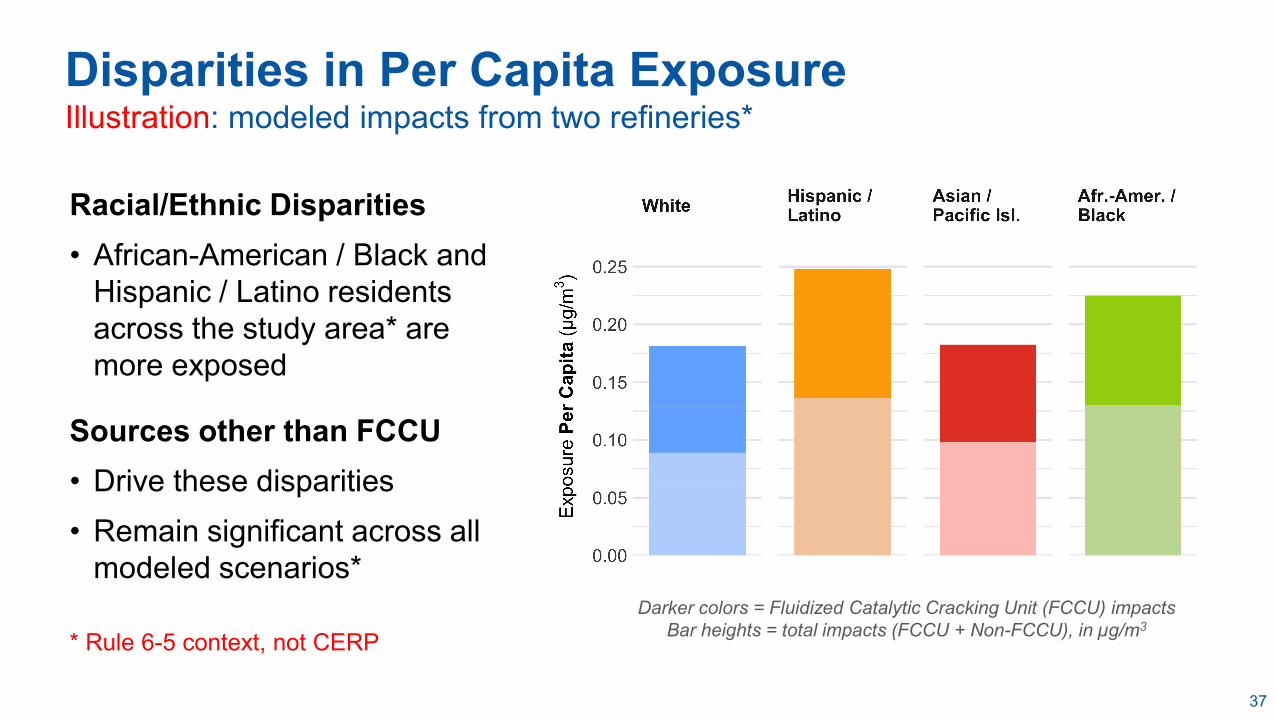
37
Darker colors = Fluidized Catalytic Cracking Unit (FCCU) impactsBar heights = total impacts (FCCU + Non-FCCU), in µg/m3
Racial/Ethnic Disparities• African-American / Black and
Hispanic / Latino residents across the study area* are more exposed
Sources other than FCCU• Drive these disparities• Remain significant across all
modeled scenarios*
* Rule 6-5 context, not CERP
Disparities in Per Capita ExposureIllustration: modeled impacts from two refineries*

38
Next Steps
39
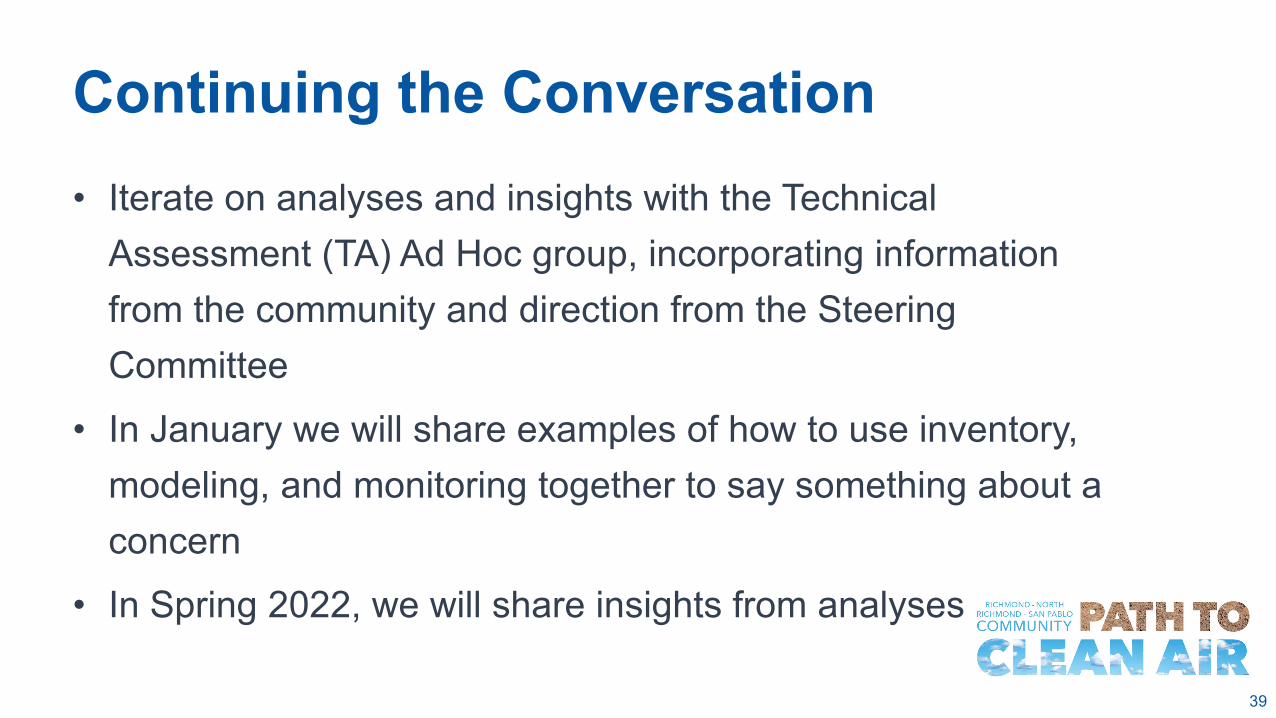
Continuing the Conversation• Iterate on analyses and insights with the Technical
Assessment (TA) Ad Hoc group, incorporating information from the community and direction from the Steering Committee
• In January we will share examples of how to use inventory, modeling, and monitoring together to say something about a concern
• In Spring 2022, we will share insights from analyses

September 2021 40
Public Comment

September 2021 41
Steering Committee Questions and Discussions
43
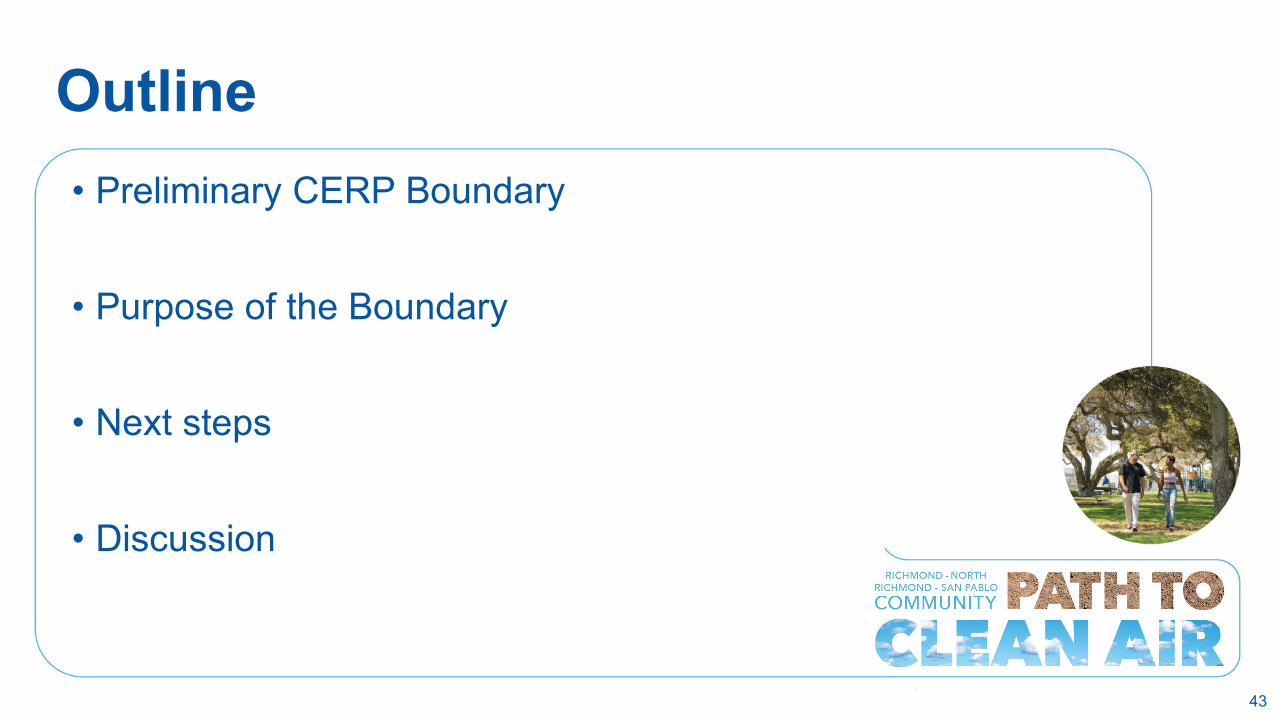
Outline• Preliminary CERP Boundary
• Purpose of the Boundary
• Next steps
• Discussion
44
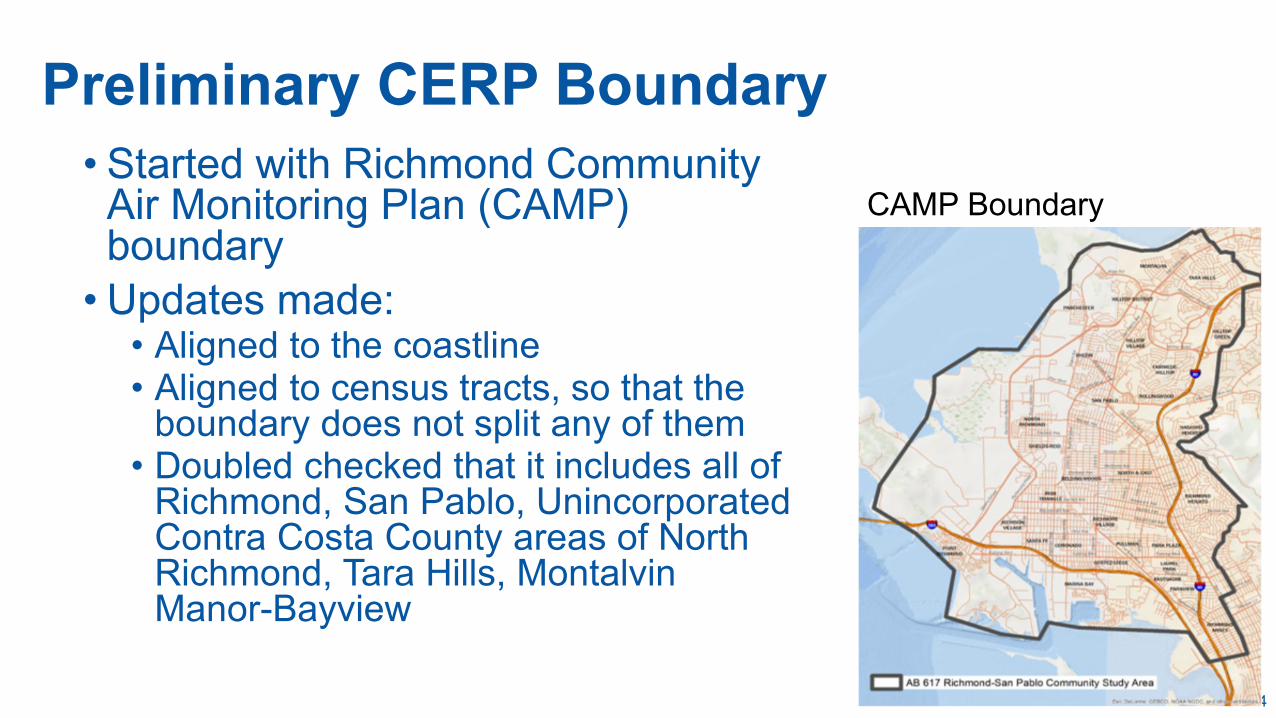
Preliminary CERP Boundary• Started with Richmond Community
Air Monitoring Plan (CAMP) boundary
• Updates made:• Aligned to the coastline• Aligned to census tracts, so that the
boundary does not split any of them• Doubled checked that it includes all of
Richmond, San Pablo, Unincorporated Contra Costa County areas of North Richmond, Tara Hills, MontalvinManor-Bayview
CAMP Boundary
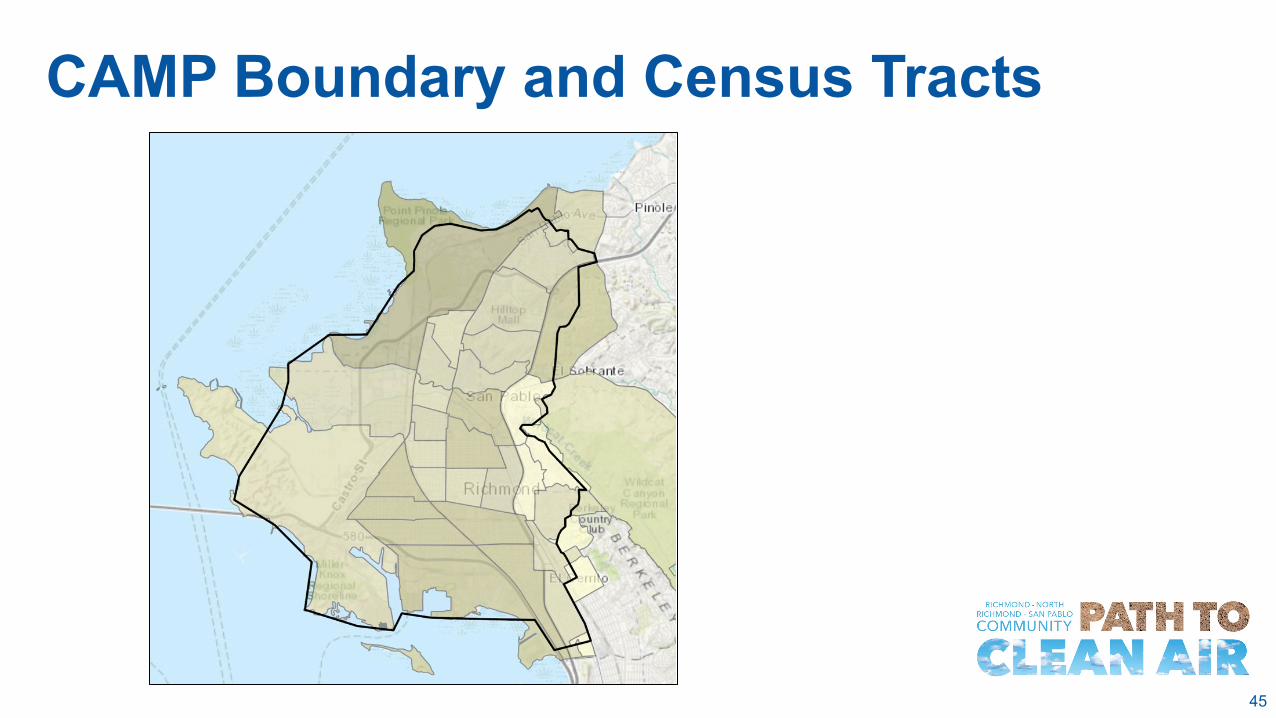
45
CAMP Boundary and Census Tracts

46
Preliminary CERP Boundary and Census Tracts
47
Purpose of the Boundary• Steering Committee: the area from which members who live or
work within the CERP area come from.
• Community Description: the area where the people, perspectives and land uses will be gathered and summarized.
• Technical Assessment: the area where technical information will be focused; however, the current emissions inventory extent goes a bit beyond the preliminary boundary.
48
Purpose of the Boundary (cont.)• Social Pinpoint: the area of focus for input and feedback via the
online mapping platform and community organizer efforts.
• Strategies: serves as an initial starting point for strategies; however, strategies may be at different scales, from hyper-local, to city-wide, to county-wide to Bay Area-wide to state-wide.
• Implementation: serves as a starting point for implementation, which may vary depending on the scale of the strategy.
49
Next Steps• Per CARB’s
Blueprint, the CERP Boundary needs to be approved by the Steering Committee.
• Propose to agendizeapproval of the preliminary CERP Boundary at the December 2021 Steering Committee meeting.

50
Discussion
• What questions do you have about the CERP Boundary?
• Are you ready to approve the preliminary CERP Boundary?
• If not, what more information do you need?

September 2021 51
Public Comment
September 2021 52
Steering Committee Questions and Discussions

September 2021 53
Community Assets and Air Pollution Mapping Project UpdateKevin Olp, Senior Policy [email protected]
54
Community Co-Leading the Process
Steering Committee
31-member group of local leaders to
co-develop the Community Emissions
Reductions Plan
Community Organizing
Grantsfor local
organizations to identify community concerns, record
Community Assets and Air Pollution Mapping Project
Interactive mapping platform to gather community input to prioritize resources

55
Focus on Quality of Outreach
• Reaching out to frontline communities: Communities susceptible to air pollution because of pre-existing health conditions Neighborhoods near sources of pollution
• Groups historically excluded or underrepresented. Examples include: Young people Monolingual non-English speaking households Unincorporated areas Geographically underrepresented areas
• Focus on high quality of outreach
56
Why do we need community input?
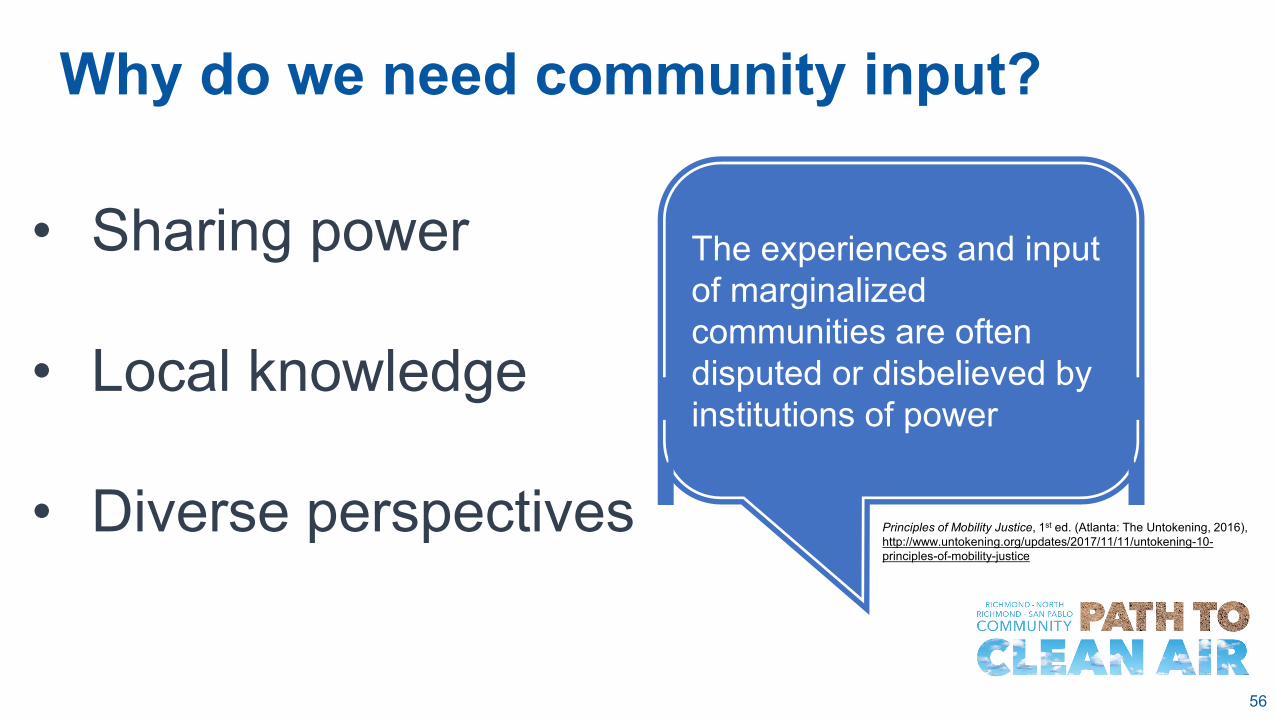
Principles of Mobility Justice, 1st ed. (Atlanta: The Untokening, 2016), http://www.untokening.org/updates/2017/11/11/untokening-10-principles-of-mobility-justice
• Sharing power
• Local knowledge
• Diverse perspectives
The experiences and input of marginalized communities are often disputed or disbelieved by institutions of power
57
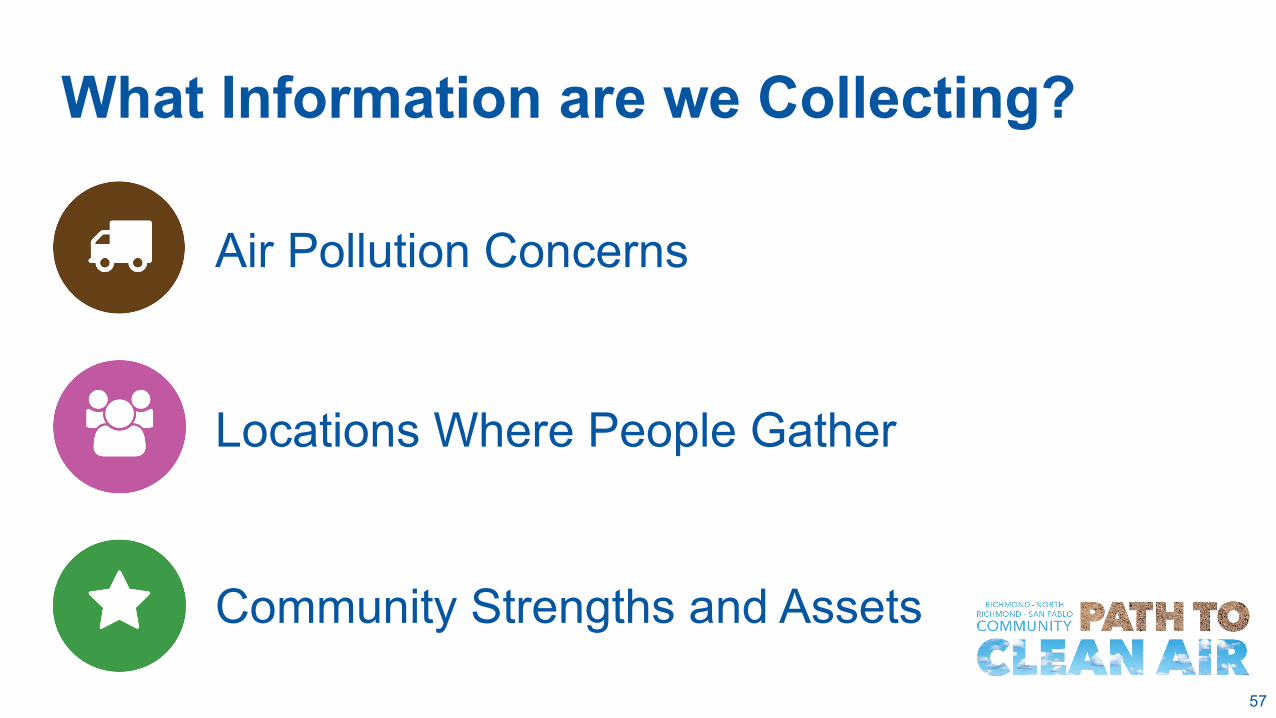
What Information are we Collecting?
Air Pollution Concerns
Locations Where People Gather
Community Strengths and Assets
58
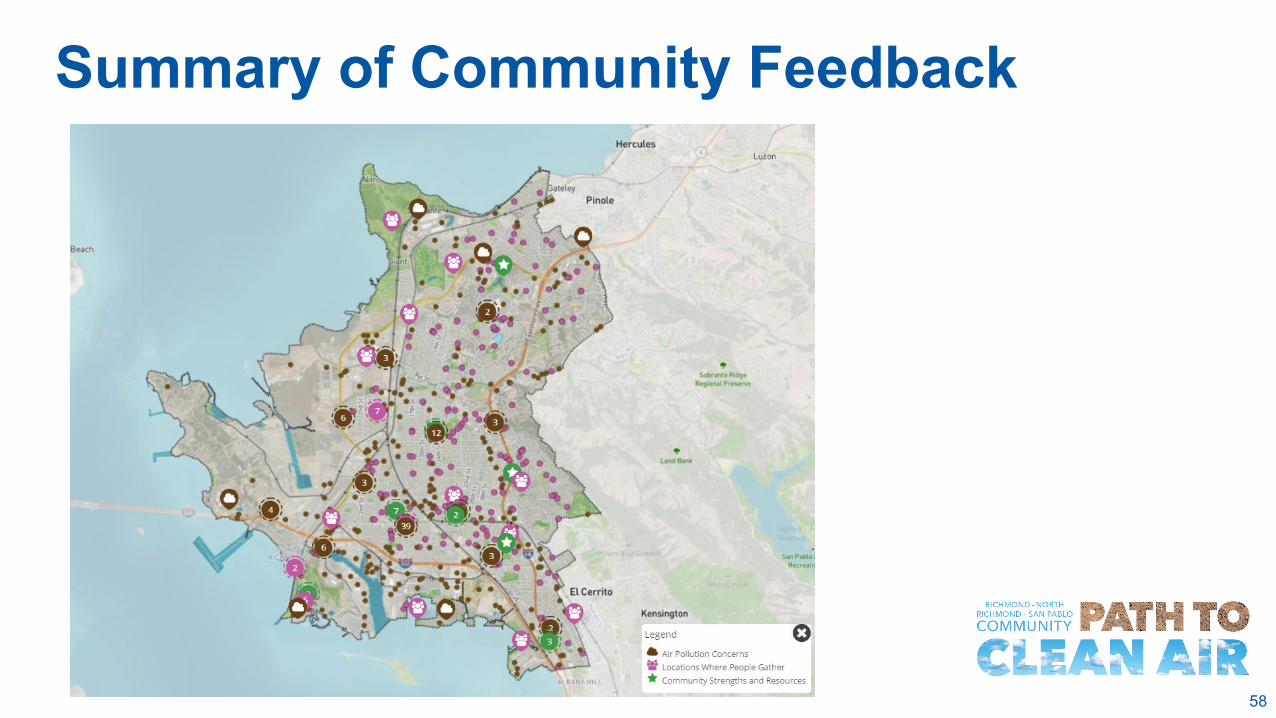
Summary of Community Feedback
59
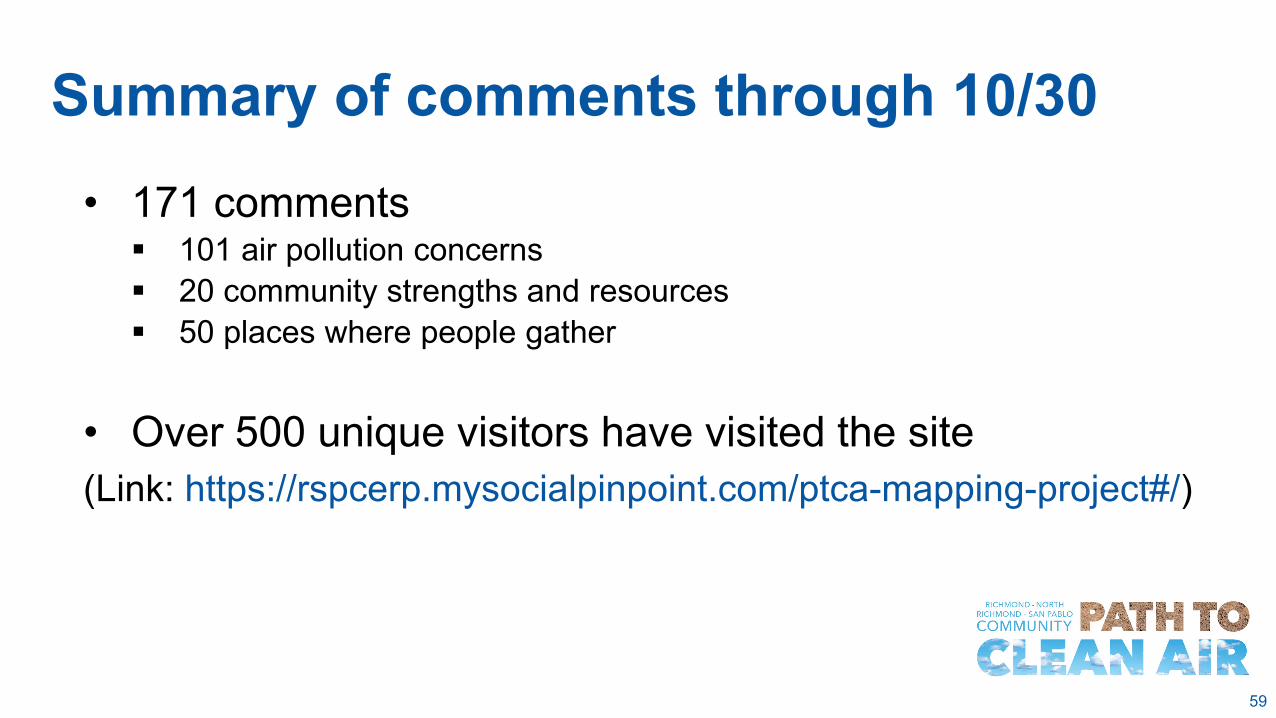
Summary of comments through 10/30• 171 comments 101 air pollution concerns 20 community strengths and resources 50 places where people gather
• Over 500 unique visitors have visited the site(Link: https://rspcerp.mysocialpinpoint.com/ptca-mapping-project#/)
60
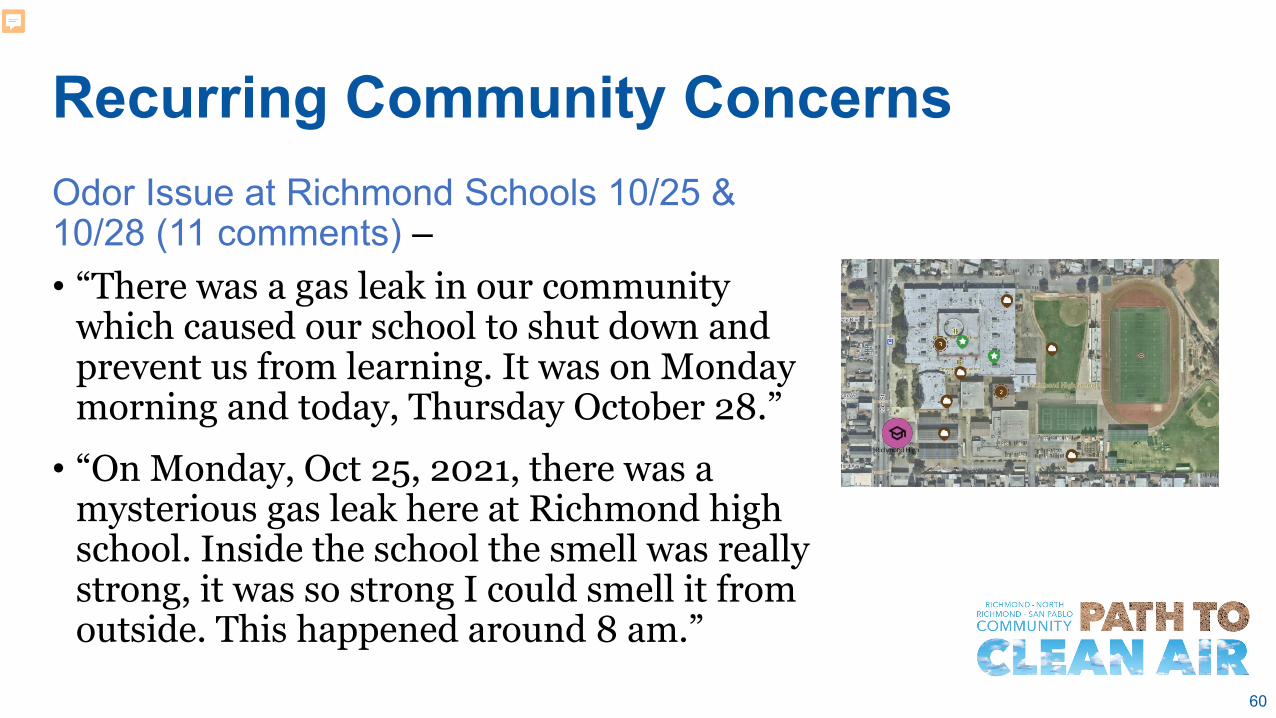
Recurring Community ConcernsOdor Issue at Richmond Schools 10/25 & 10/28 (11 comments) –• “There was a gas leak in our community
which caused our school to shut down and prevent us from learning. It was on Monday morning and today, Thursday October 28.”
• “On Monday, Oct 25, 2021, there was a mysterious gas leak here at Richmond high school. Inside the school the smell was really strong, it was so strong I could smell it from outside. This happened around 8 am.”
61
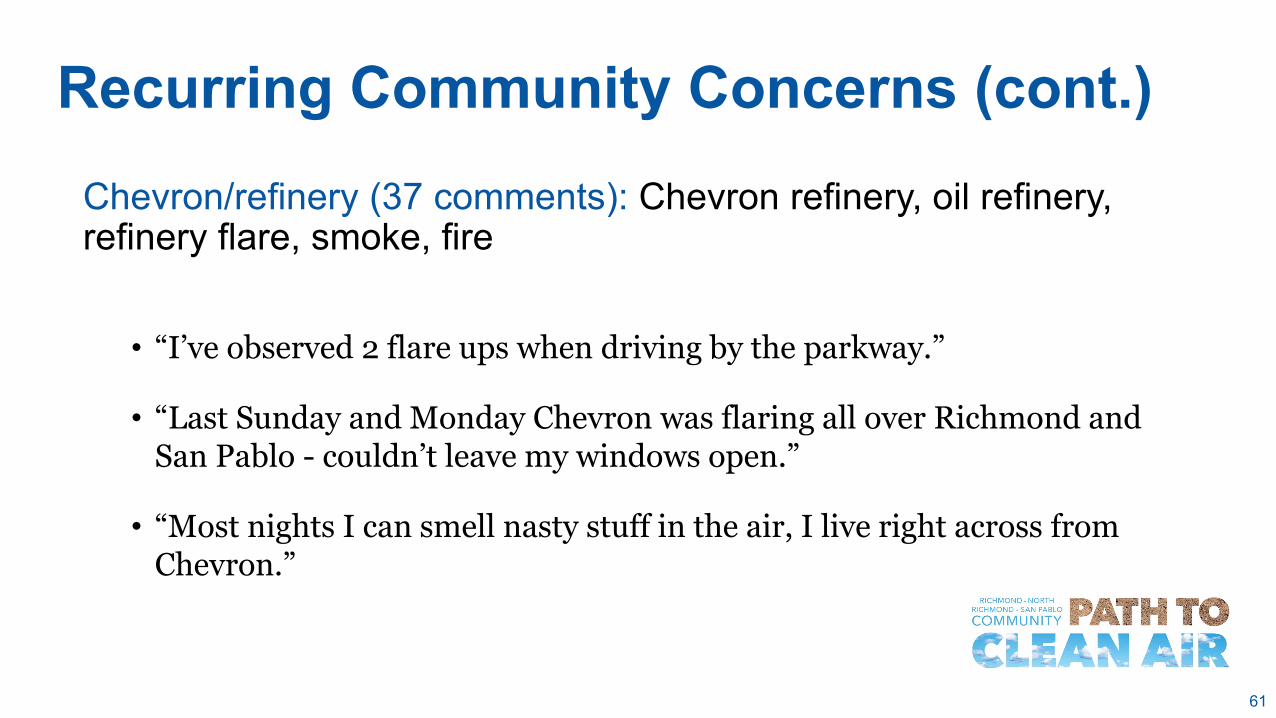
Recurring Community Concerns (cont.)Chevron/refinery (37 comments): Chevron refinery, oil refinery, refinery flare, smoke, fire
• “I’ve observed 2 flare ups when driving by the parkway.”
• “Last Sunday and Monday Chevron was flaring all over Richmond and San Pablo - couldn’t leave my windows open.”
• “Most nights I can smell nasty stuff in the air, I live right across from Chevron.”
62
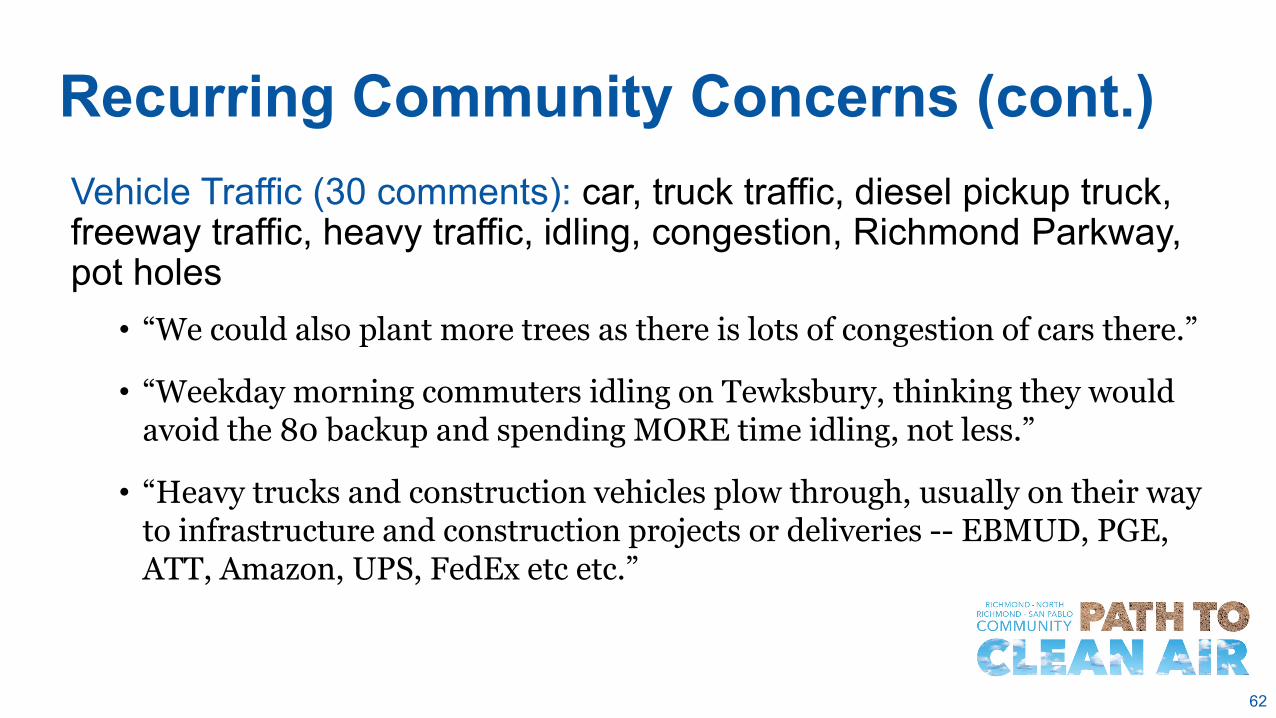
Recurring Community Concerns (cont.)Vehicle Traffic (30 comments): car, truck traffic, diesel pickup truck, freeway traffic, heavy traffic, idling, congestion, Richmond Parkway, pot holes
• “We could also plant more trees as there is lots of congestion of cars there.”
• “Weekday morning commuters idling on Tewksbury, thinking they would avoid the 80 backup and spending MORE time idling, not less.”
• “Heavy trucks and construction vehicles plow through, usually on their way to infrastructure and construction projects or deliveries -- EBMUD, PGE, ATT, Amazon, UPS, FedEx etc etc.”
63
Recurring Community Concerns (cont.)
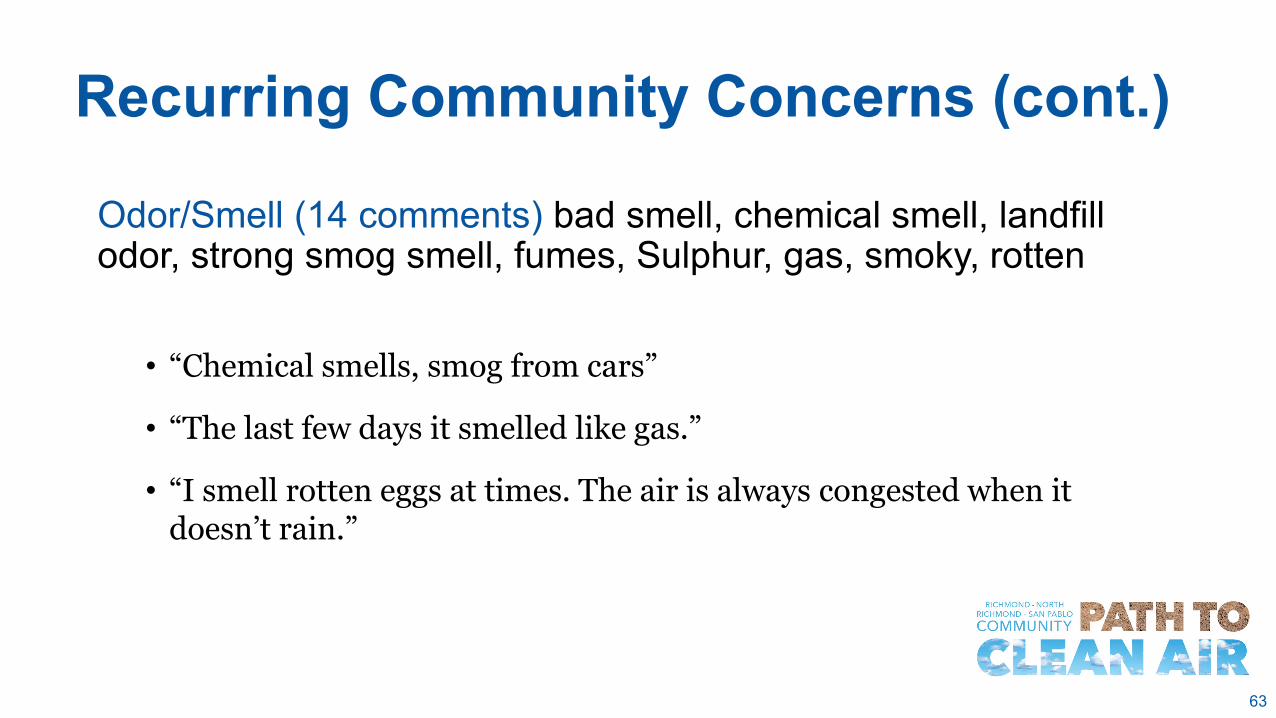
Odor/Smell (14 comments) bad smell, chemical smell, landfill odor, strong smog smell, fumes, Sulphur, gas, smoky, rotten
• “Chemical smells, smog from cars”
• “The last few days it smelled like gas.”
• “I smell rotten eggs at times. The air is always congested when it doesn’t rain.”
64
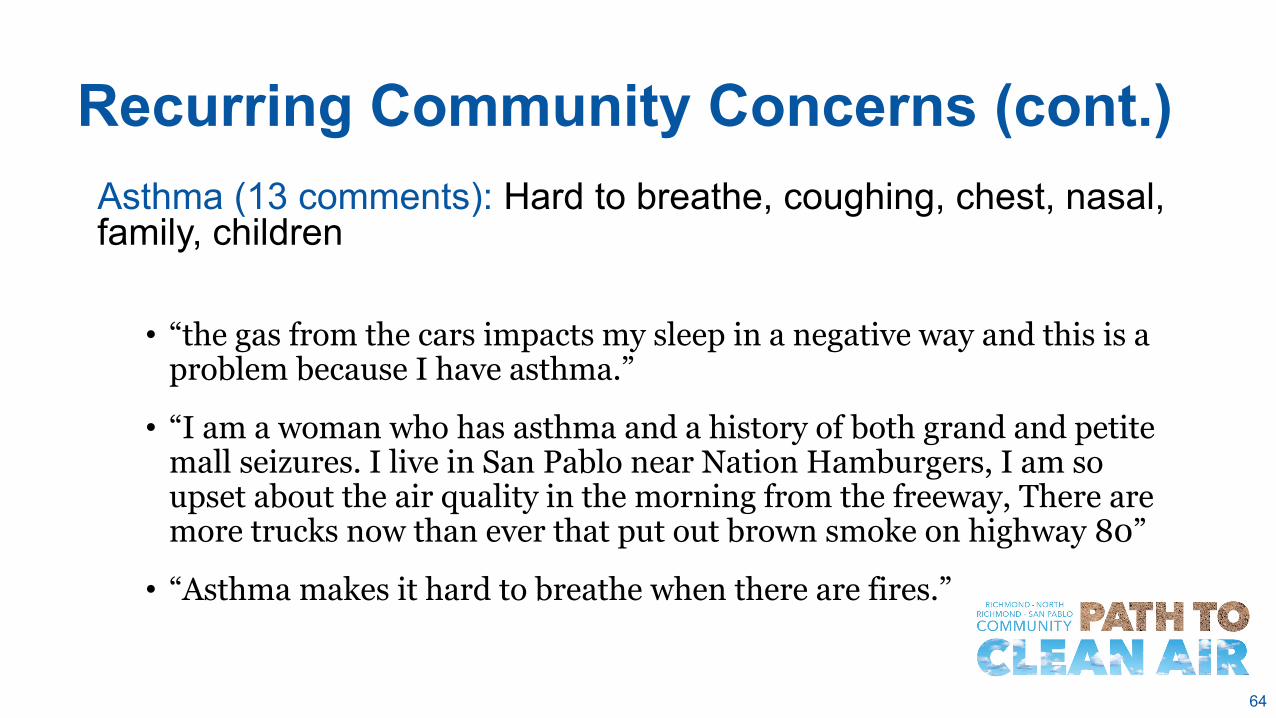
Recurring Community Concerns (cont.)Asthma (13 comments): Hard to breathe, coughing, chest, nasal, family, children
• “the gas from the cars impacts my sleep in a negative way and this is a problem because I have asthma.”
• “I am a woman who has asthma and a history of both grand and petite mall seizures. I live in San Pablo near Nation Hamburgers, I am so upset about the air quality in the morning from the freeway, There are more trucks now than ever that put out brown smoke on highway 80”
• “Asthma makes it hard to breathe when there are fires.”
65
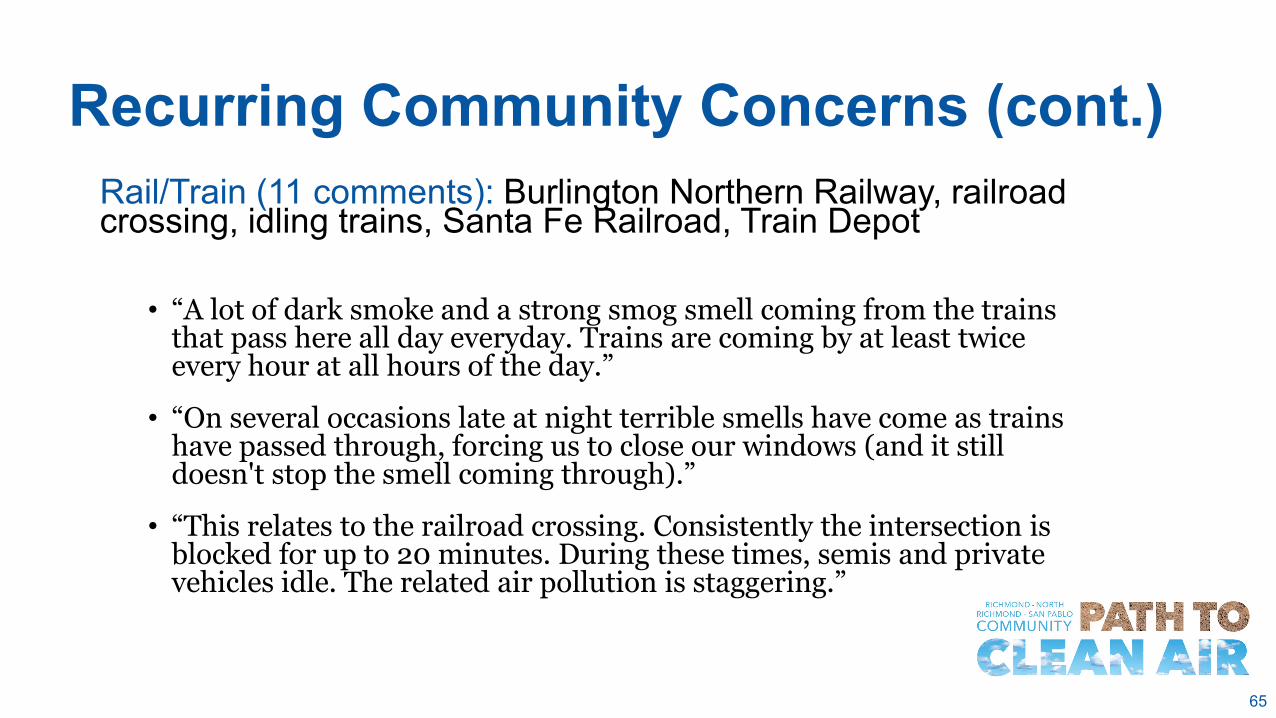
Recurring Community Concerns (cont.)Rail/Train (11 comments): Burlington Northern Railway, railroad crossing, idling trains, Santa Fe Railroad, Train Depot
• “A lot of dark smoke and a strong smog smell coming from the trains that pass here all day everyday. Trains are coming by at least twice every hour at all hours of the day.”
• “On several occasions late at night terrible smells have come as trains have passed through, forcing us to close our windows (and it still doesn't stop the smell coming through).”
• “This relates to the railroad crossing. Consistently the intersection is blocked for up to 20 minutes. During these times, semis and private vehicles idle. The related air pollution is staggering.”
66
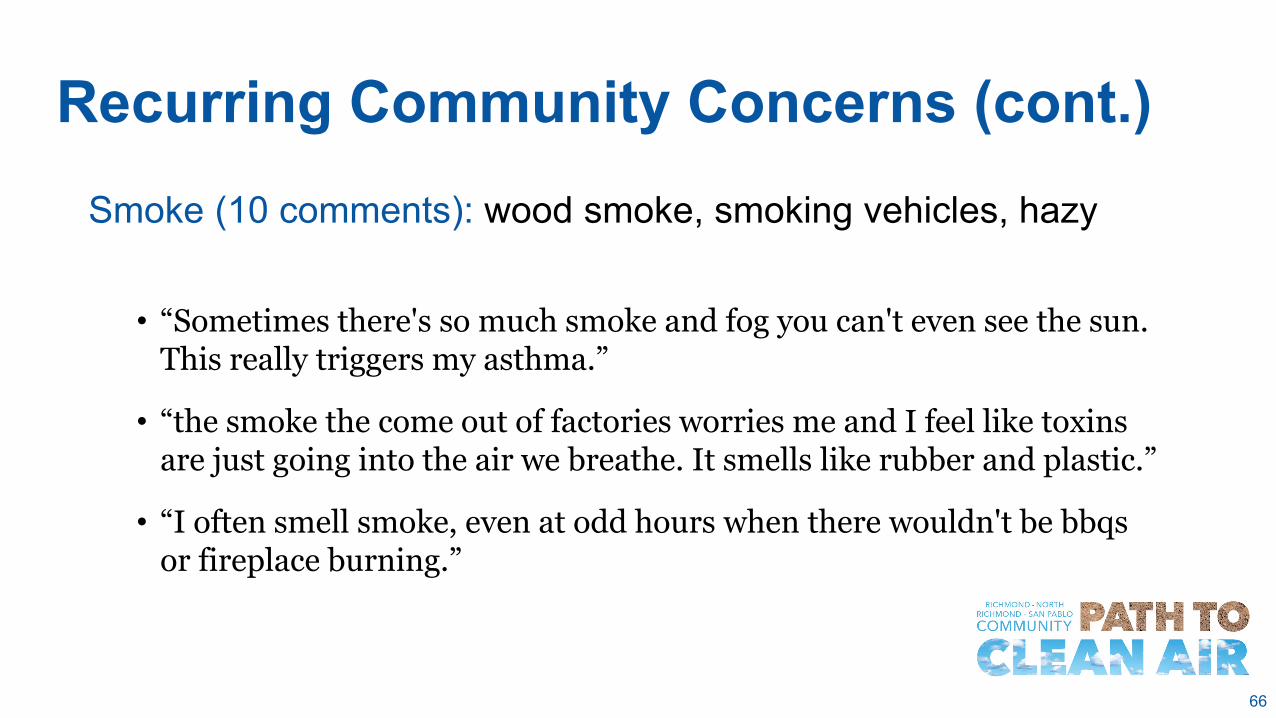
Recurring Community Concerns (cont.)Smoke (10 comments): wood smoke, smoking vehicles, hazy
• “Sometimes there's so much smoke and fog you can't even see the sun. This really triggers my asthma.”
• “the smoke the come out of factories worries me and I feel like toxins are just going into the air we breathe. It smells like rubber and plastic.”
• “I often smell smoke, even at odd hours when there wouldn't be bbqsor fireplace burning.”

67
What will we do with this information?
• Use community concerns to guide where/how we conduct exposure analysis near sources of pollution
• Focus analysis of air pollution impacts on community identified susceptible populations
• Inform key issue priorities, strategies, and implementation
Community mapping platform with comment example.

September 2021 68
Public Comment

September 2021 69
Steering Committee Questions and Discussions

September 2021 70
Next Meeting• Our next meeting will be on Monday, December 13,
2021 from 6:00 p.m. to 8:00 p.m.
• We will be convening a new Ad Hoc group for the
technical assessment work, and continuing the
Community Description Ad Hoc meeting
• The Community Equity, Health, and
Justice Committee of the Air District Board will be
reviewing applicants and making recommendations at
the December 2, 2021 meeting
September 2021 71
Public Comment onNon-Agenda Matters