Embed Size (px)
Citation preview
CENSUS OF INDIA 2011
DATA ON DISABILITY
Office of the Registrar General & Census Commissioner, India
New Delhi, 27‐12‐2013
Background
• So far the data released from Census 2011 pertained to :
• Houselisting and Housing Census
• Primary Census Abstract (PCA) covering final results on:
• Total population, SC, ST population, Literates, Workers,
non‐workers and categories of economic activity by sex
and residence
• PCA on Slums and Houseless Population
• PCA for Scheduled Castes and Scheduled Tribes
• Age Data in five‐years age groups and single‐year age returns
Present Dataset
• The present set of results pertains to data collected in the Census 2011 on disability
• Information on disability of individuals was collected during the Population Enumeration phase of Census 2011 through ‘Household Schedule’ . Similar information was collected during 2001 census also. Information for individuals residing in ‘Normal’, ‘Institutional’and ‘Houseless’ households was collected.
• The table C‐20‐ ‘Disabled by age‐group and type of disability’ has been generated on the basis of processing 100% Census Schedules.
Note: The figures exclude the population of Mao Maram, Paomata and Purul sub‐divisions of Senapati district of Manipur
Historical Perspective
• The question on disability was canvassed in all the Censuses since 1872 to 1931
• The question on disability was not canvassed in the Censuses from 1941 to 1971
• In Census 1981, information on three types of disability was collected
• The question was dropped in Census 1991
• In Census 2001, the question was again included and information on five types of disability was collected
• In Census 2011 information on eight types of disability has beencollected
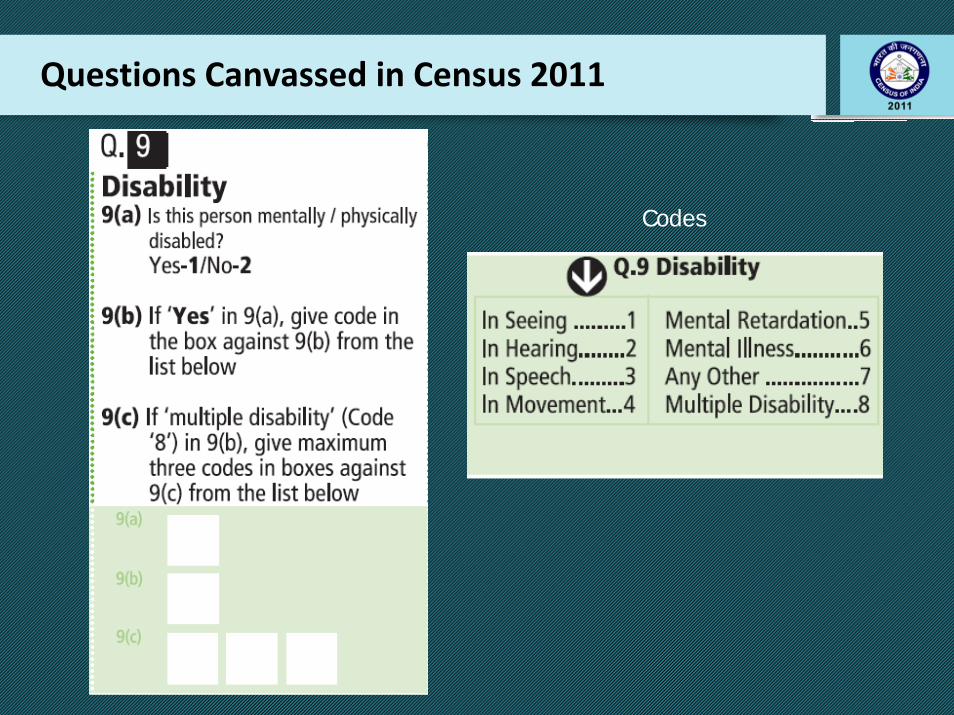
Questions Canvassed in Census 2011
Codes
Features of Disability Question, 2011
• Has a filter question to ascertain disability status
• Attempts to collect information on eight types of disabilities as against five in Census 2001.
• Designed to cover most of the disabilities listed in the “Persons with Disabilities Act, 1995” and “The National Trust Act, 1999”.
• The placement of the question on disability in the Census Schedule was changed. The question was brought forward at Q‐9 at Census 2011. This was the question No. 15 at the Census 2001.
Special Efforts Made to Improve Coverage
Training
Special Efforts Made to Improve Coverage (Contd.)
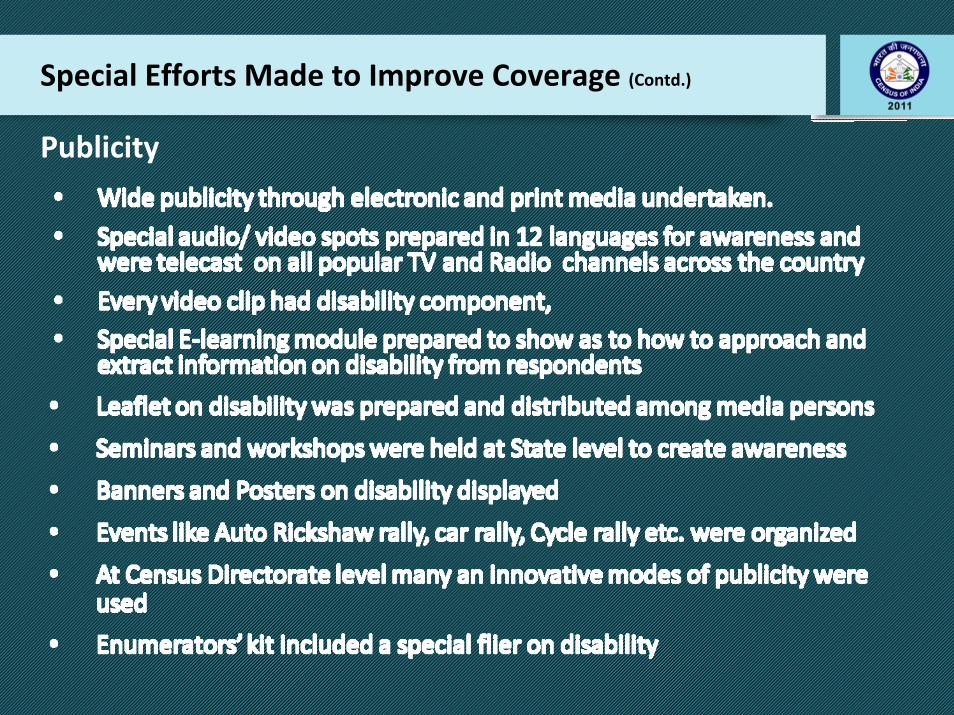
Publicity
Special Efforts Made to Improve Coverage (Contd.)
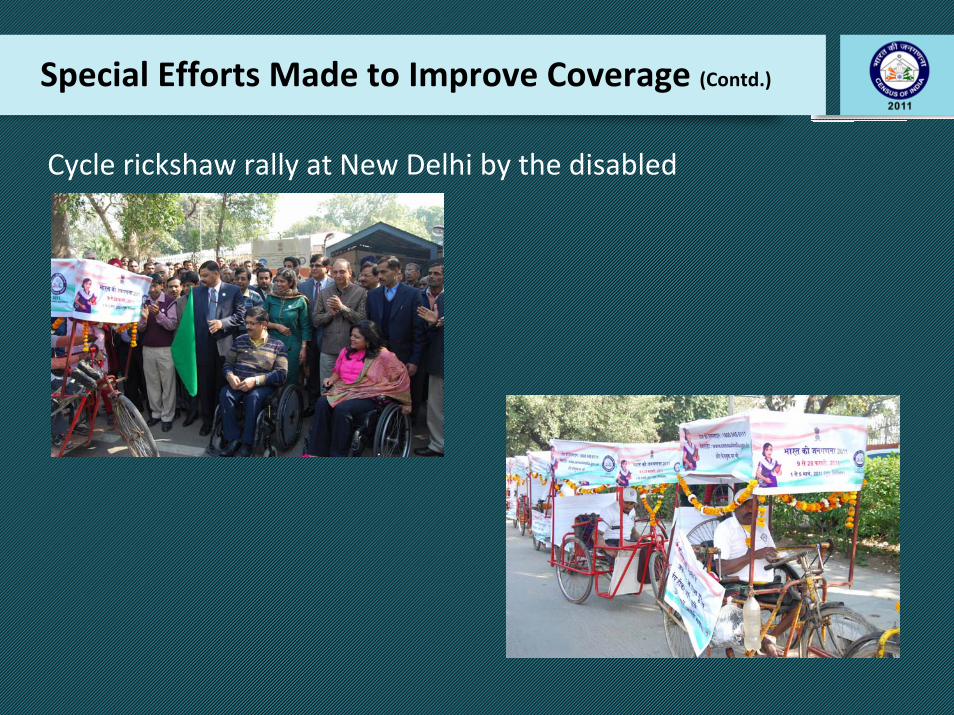
Cycle rickshaw rally at New Delhi by the disabled
Special Efforts Made to Improve Coverage (Contd.)
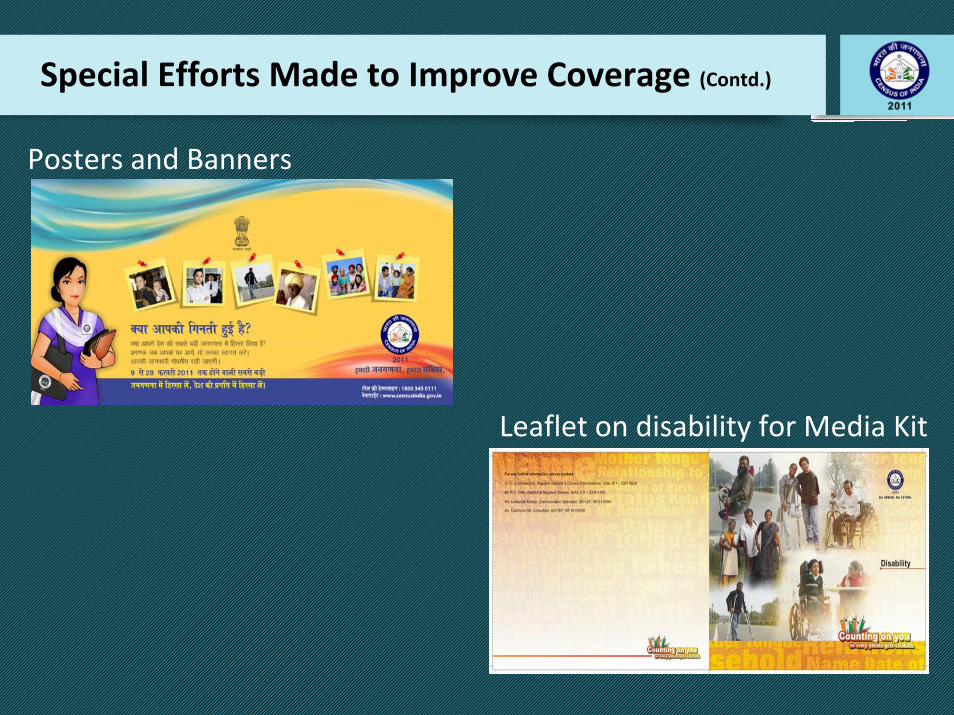
Posters and Banners
Leaflet on disability for Media Kit
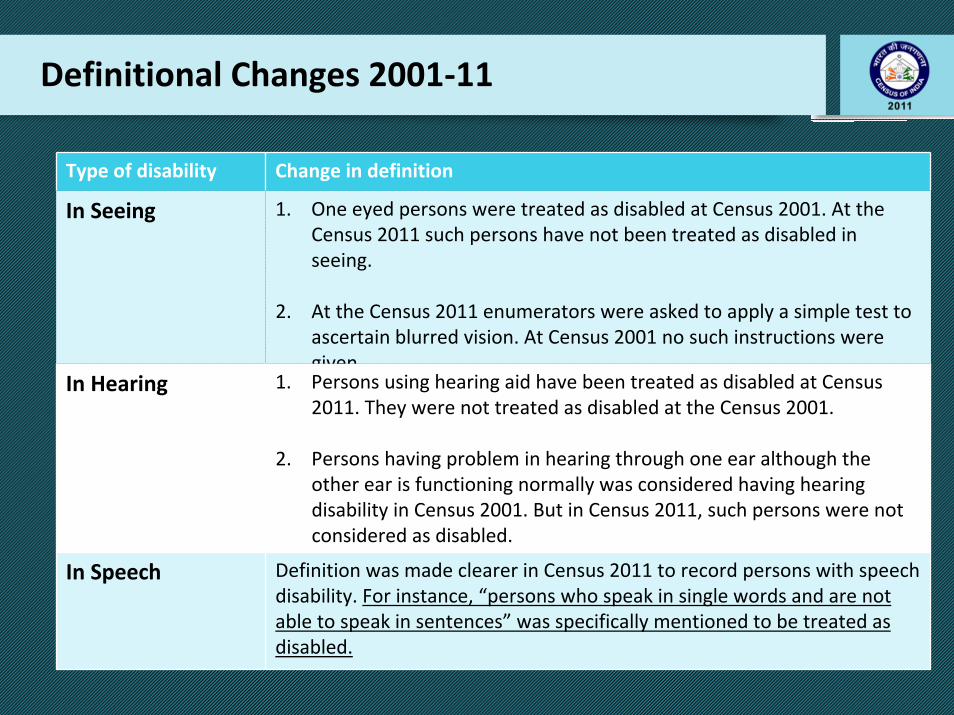
Definitional Changes 2001‐11
Type of disability Change in definition
In Seeing 1. One eyed persons were treated as disabled at Census 2001. At theCensus 2011 such persons have not been treated as disabled in seeing.
2. At the Census 2011 enumerators were asked to apply a simple test to ascertain blurred vision. At Census 2001 no such instructions were given.
In Hearing 1. Persons using hearing aid have been treated as disabled at Census 2011. They were not treated as disabled at the Census 2001.
2. Persons having problem in hearing through one ear although the other ear is functioning normally was considered having hearing disability in Census 2001. But in Census 2011, such persons were not considered as disabled.
In Speech Definition was made clearer in Census 2011 to record persons with speech disability. For instance, “persons who speak in single words and are not able to speak in sentences” was specifically mentioned to be treated as disabled.
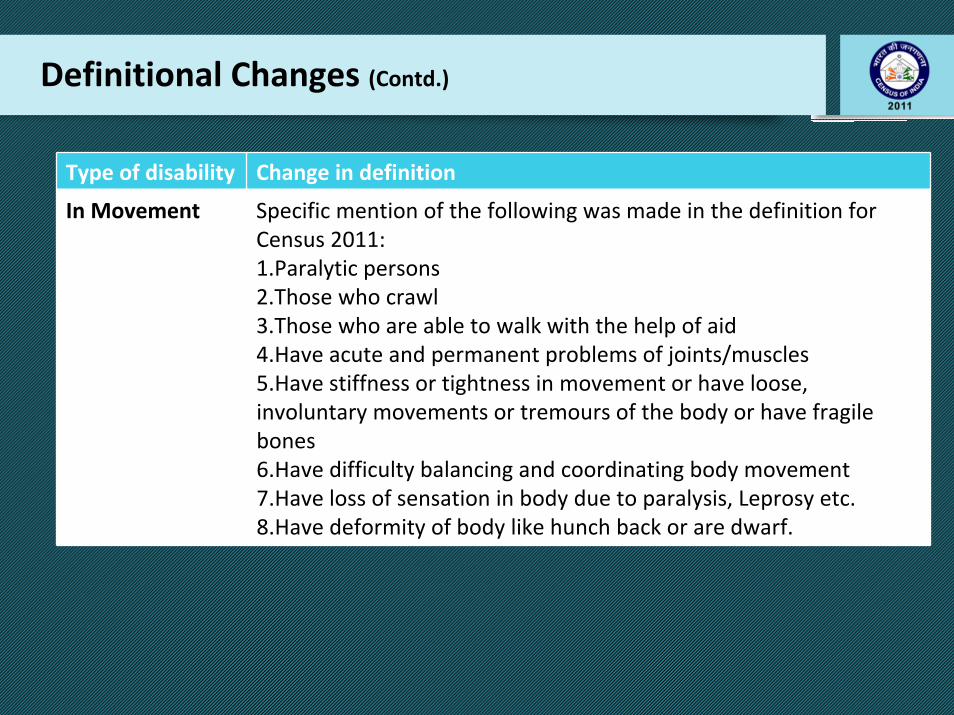
Definitional Changes (Contd.)
Type of disability Change in definition
In Movement Specific mention of the following was made in the definition forCensus 2011:1.Paralytic persons2.Those who crawl3.Those who are able to walk with the help of aid4.Have acute and permanent problems of joints/muscles5.Have stiffness or tightness in movement or have loose, involuntary movements or tremours of the body or have fragile bones6.Have difficulty balancing and coordinating body movement7.Have loss of sensation in body due to paralysis, Leprosy etc.8.Have deformity of body like hunch back or are dwarf.
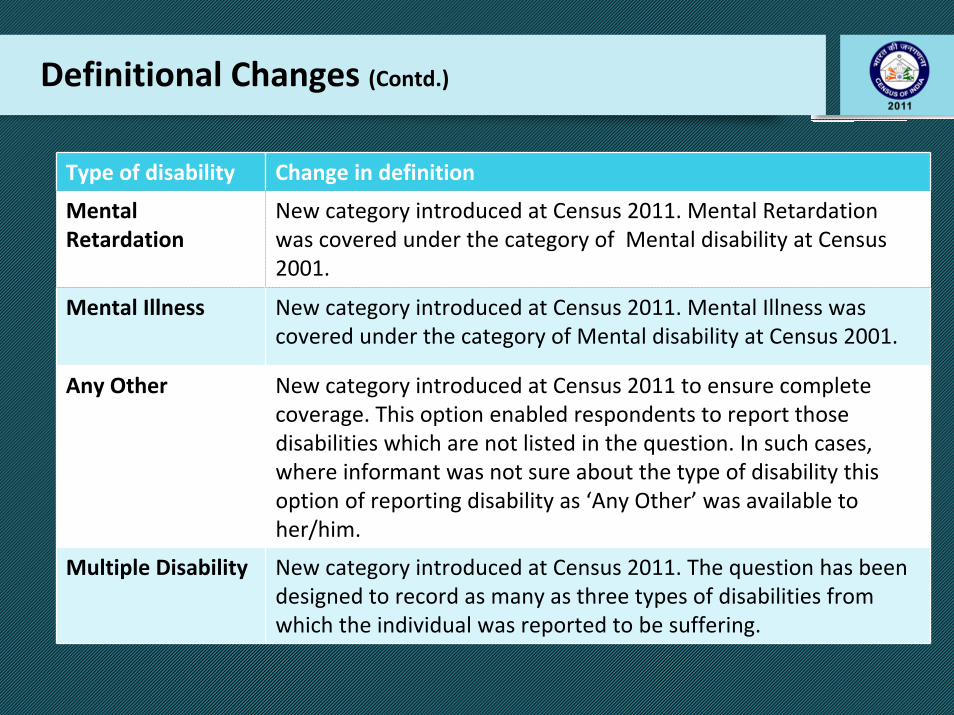
Definitional Changes (Contd.)
Type of disability Change in definition
Mental Retardation
New category introduced at Census 2011. Mental Retardation was covered under the category of Mental disability at Census 2001.
Mental Illness New category introduced at Census 2011. Mental Illness was covered under the category of Mental disability at Census 2001.
Any Other New category introduced at Census 2011 to ensure complete coverage. This option enabled respondents to report those disabilities which are not listed in the question. In such cases, where informant was not sure about the type of disability this option of reporting disability as ‘Any Other’ was available to her/him.
Multiple Disability New category introduced at Census 2011. The question has been designed to record as many as three types of disabilities from which the individual was reported to be suffering.
Data Highlights
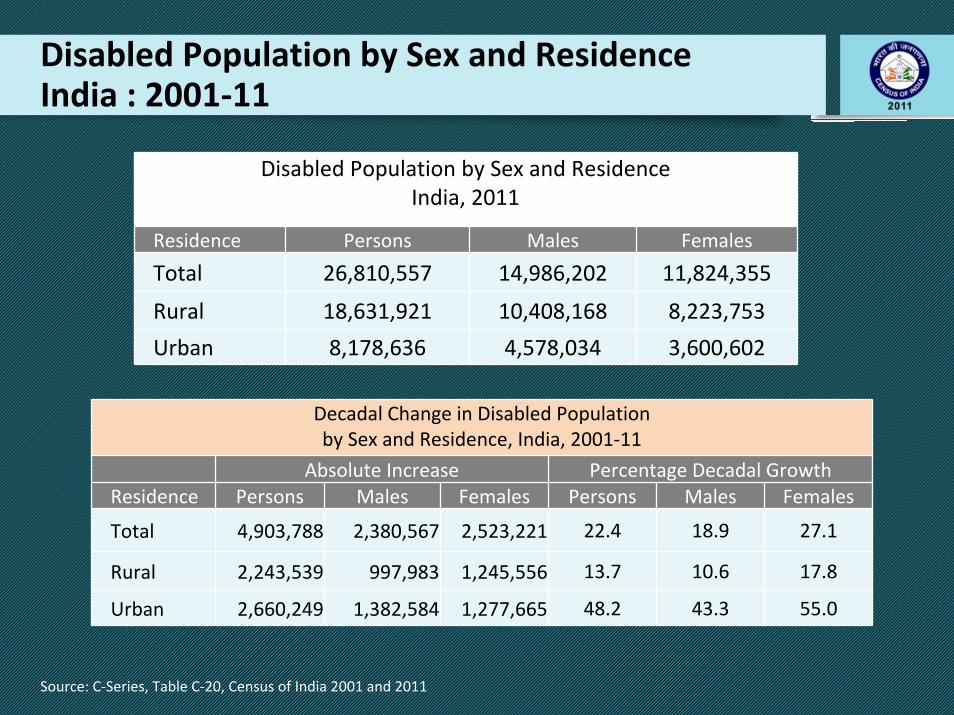
Disabled Population by Sex and ResidenceIndia : 2001‐11
Source: C‐Series, Table C‐20, Census of India 2001 and 2011
Disabled Population by Sex and ResidenceIndia, 2011
Residence Persons Males Females
Total 26,810,557 14,986,202 11,824,355
Rural 18,631,921 10,408,168 8,223,753
Urban 8,178,636 4,578,034 3,600,602
Decadal Change in Disabled Population by Sex and Residence, India, 2001‐11
Absolute Increase Percentage Decadal GrowthResidence Persons Males Females Persons Males Females
Total 4,903,788 2,380,567 2,523,221 22.4 18.9 27.1
Rural 2,243,539 997,983 1,245,556 13.7 10.6 17.8
Urban 2,660,249 1,382,584 1,277,665 48.2 43.3 55.0

Disabled Population by Sex and ResidenceIndia : 2011
Source: C‐Series, Table C‐20, Census of India 2001 and 2011
Percentage of Disabled to total population India, 2011
Residence Persons Males Females
Total 2.21 2.41 2.01
Rural 2.24 2.43 2.03
Urban 2.17 2.34 1.98
Percentage of Disabled to total population India, 2001
Residence Persons Males Females
Total 2.13 2.37 1.87
Rural 2.21 2.47 1.93
Urban 1.93 2.12 1.71
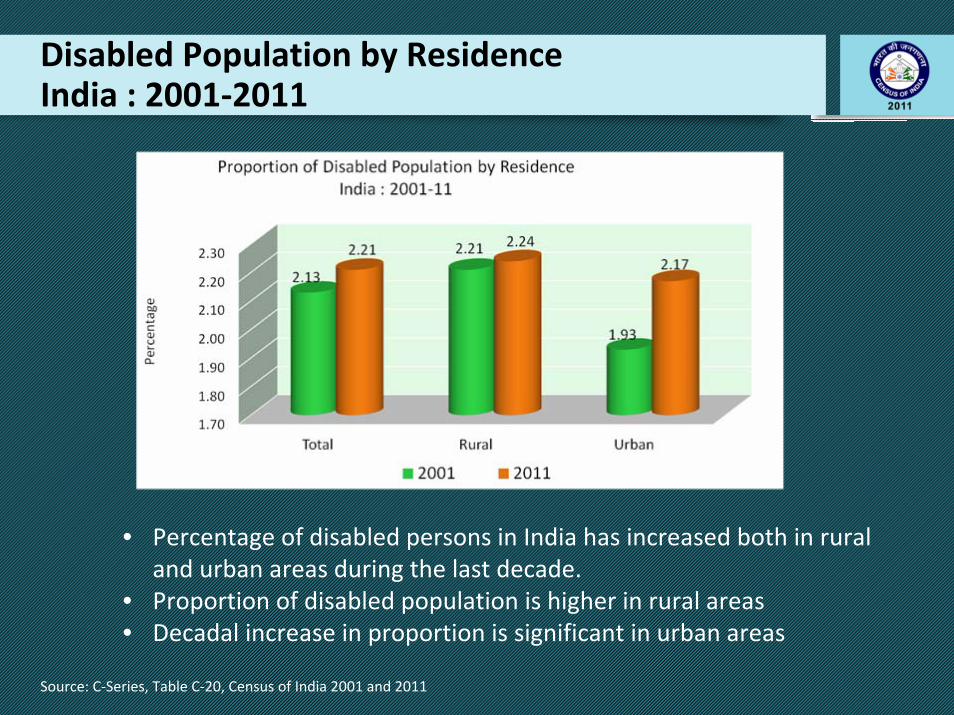
Disabled Population by ResidenceIndia : 2001‐2011
• Percentage of disabled persons in India has increased both in rural and urban areas during the last decade.
• Proportion of disabled population is higher in rural areas• Decadal increase in proportion is significant in urban areas
Source: C‐Series, Table C‐20, Census of India 2001 and 2011
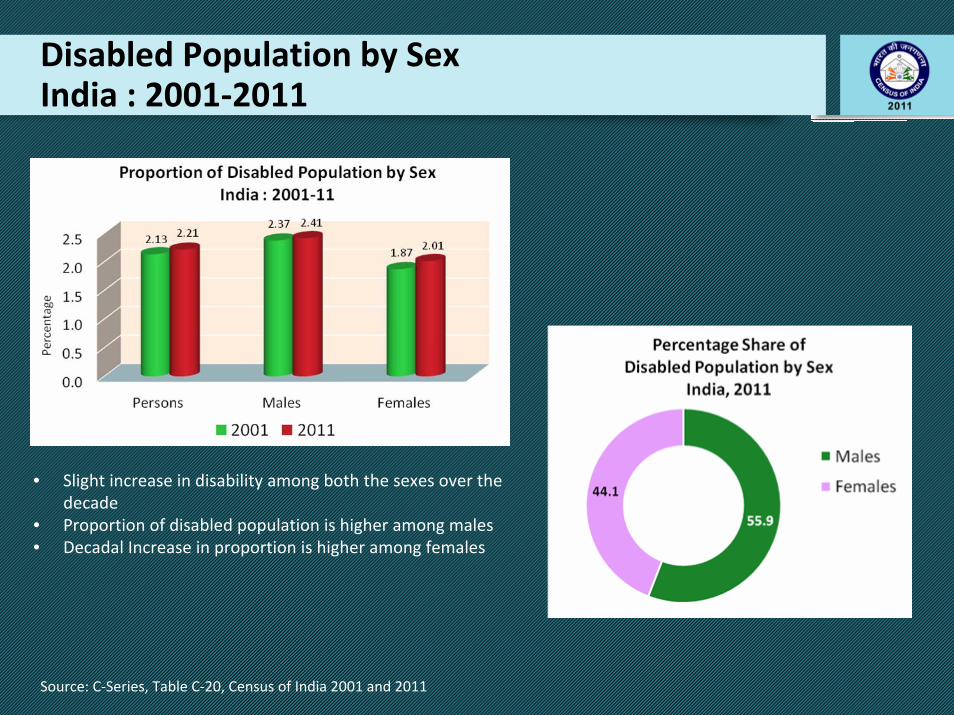
Disabled Population by Sex India : 2001‐2011
• Slight increase in disability among both the sexes over the decade
• Proportion of disabled population is higher among males• Decadal Increase in proportion is higher among females
Source: C‐Series, Table C‐20, Census of India 2001 and 2011
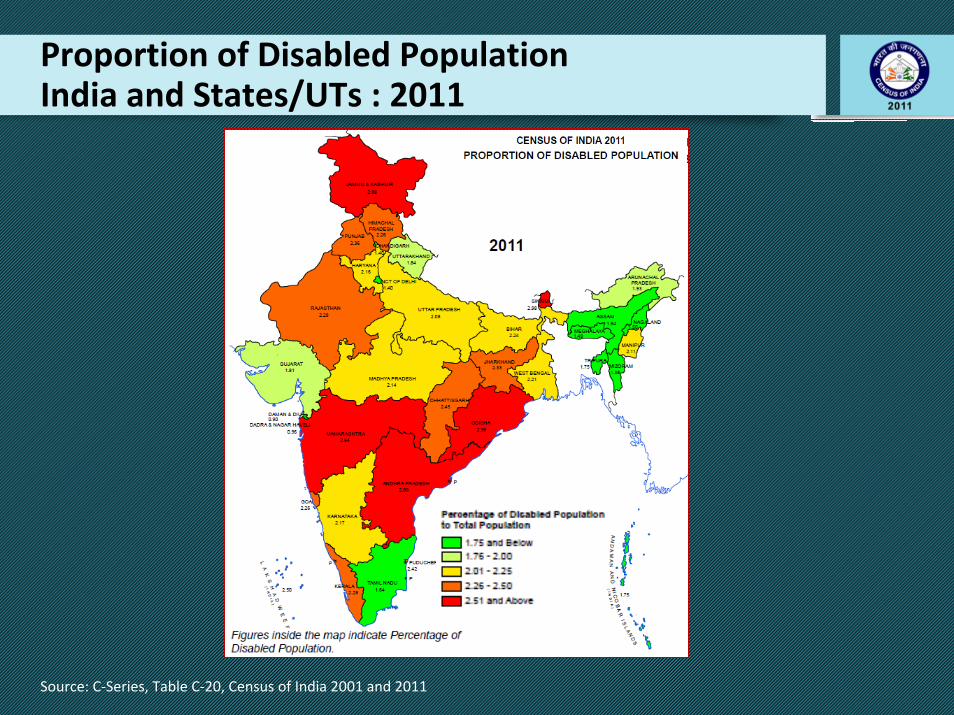
Proportion of Disabled PopulationIndia and States/UTs : 2011
Source: C‐Series, Table C‐20, Census of India 2001 and 2011
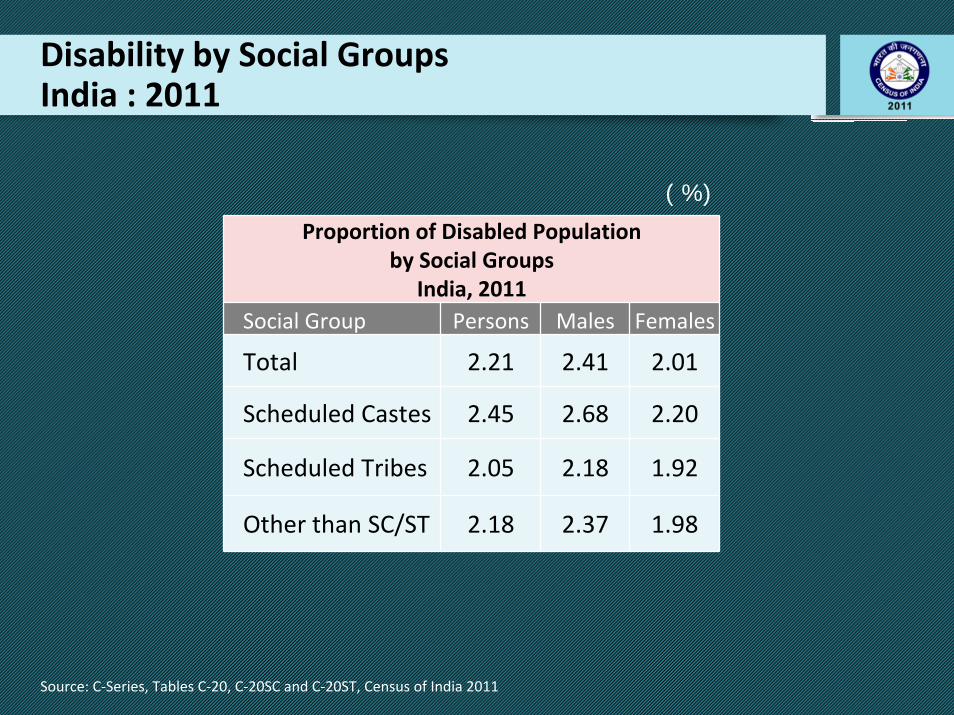
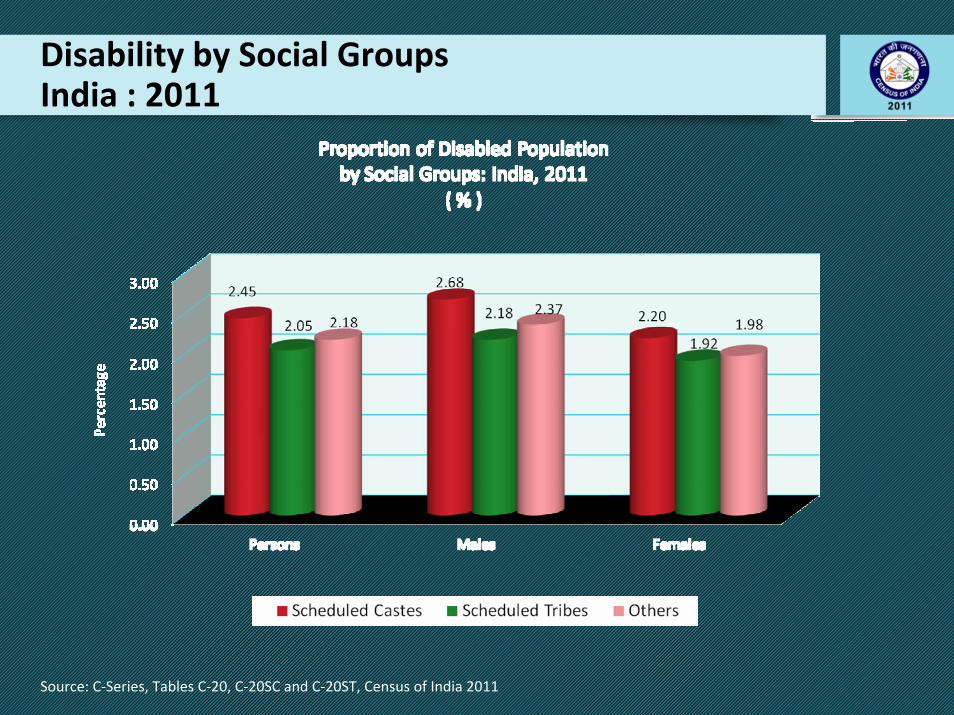
Disability by Social GroupsIndia : 2011
Proportion of Disabled Population by Social Groups
India, 2011Social Group Persons Males Females
Total 2.21 2.41 2.01
Scheduled Castes 2.45 2.68 2.20
Scheduled Tribes 2.05 2.18 1.92
Other than SC/ST 2.18 2.37 1.98
( % )
Source: C‐Series, Tables C‐20, C‐20SC and C‐20ST, Census of India 2011
Disability by Social GroupsIndia : 2011
Source: C‐Series, Tables C‐20, C‐20SC and C‐20ST, Census of India 2011
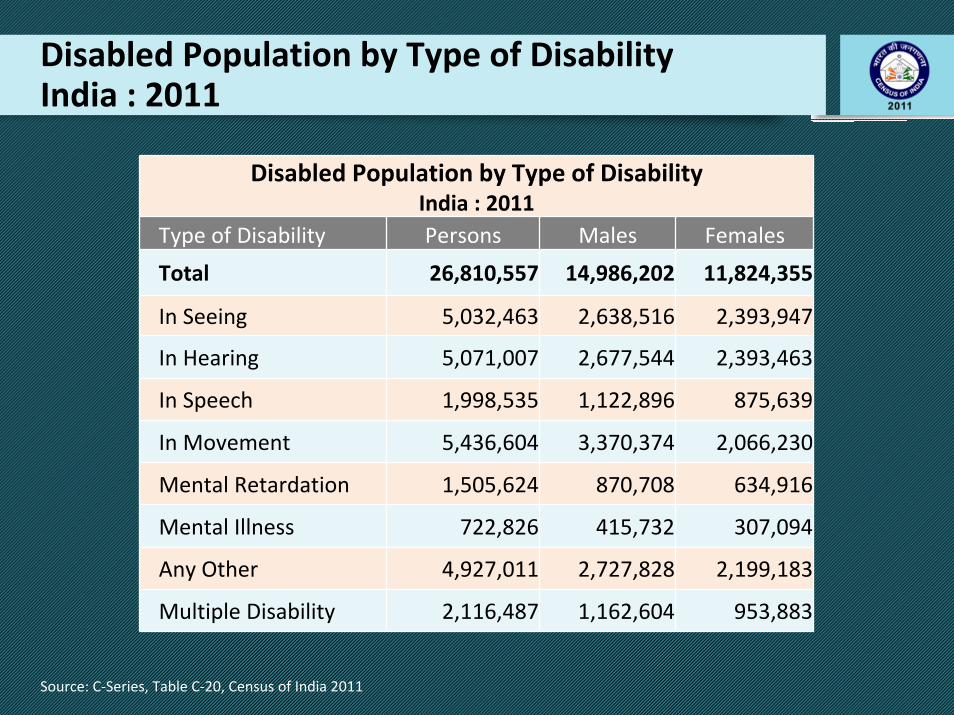
Disabled Population by Type of DisabilityIndia : 2011
Source: C‐Series, Table C‐20, Census of India 2011
Disabled Population by Type of DisabilityIndia : 2011
Type of Disability Persons Males Females
Total 26,810,557 14,986,202 11,824,355
In Seeing 5,032,463 2,638,516 2,393,947
In Hearing 5,071,007 2,677,544 2,393,463
In Speech 1,998,535 1,122,896 875,639
In Movement 5,436,604 3,370,374 2,066,230
Mental Retardation 1,505,624 870,708 634,916
Mental Illness 722,826 415,732 307,094
Any Other 4,927,011 2,727,828 2,199,183
Multiple Disability 2,116,487 1,162,604 953,883
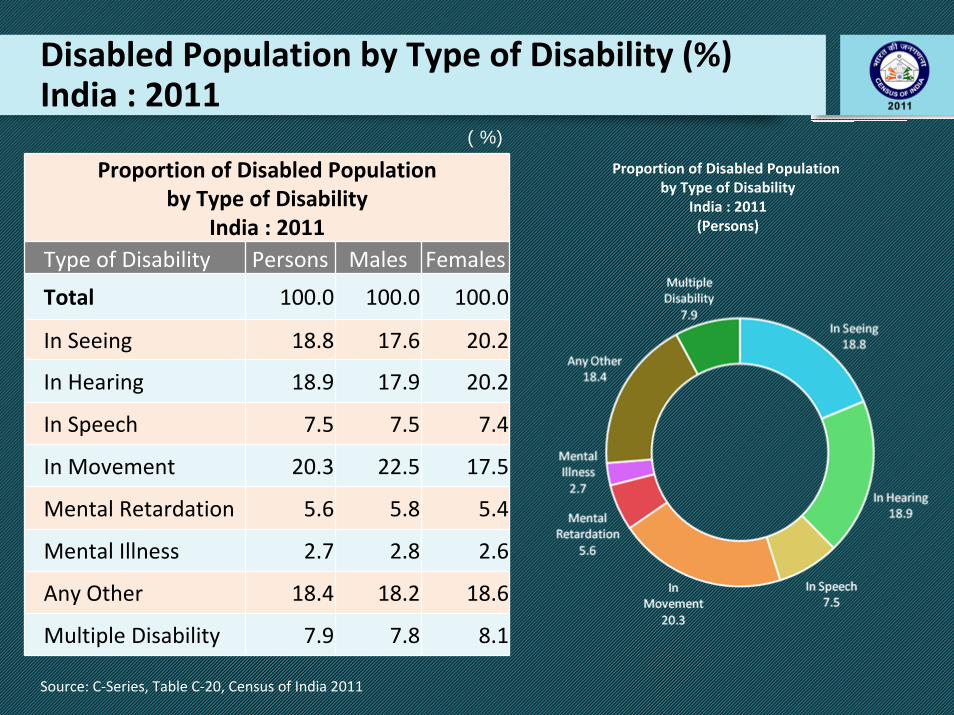
Disabled Population by Type of Disability (%)India : 2011
Source: C‐Series, Table C‐20, Census of India 2011
Proportion of Disabled Population by Type of Disability
India : 2011Type of Disability Persons Males Females
Total 100.0 100.0 100.0
In Seeing 18.8 17.6 20.2
In Hearing 18.9 17.9 20.2
In Speech 7.5 7.5 7.4
In Movement 20.3 22.5 17.5
Mental Retardation 5.6 5.8 5.4
Mental Illness 2.7 2.8 2.6
Any Other 18.4 18.2 18.6
Multiple Disability 7.9 7.8 8.1
( % )
Proportion of Disabled Population by Type of Disability
India : 2011(Persons)
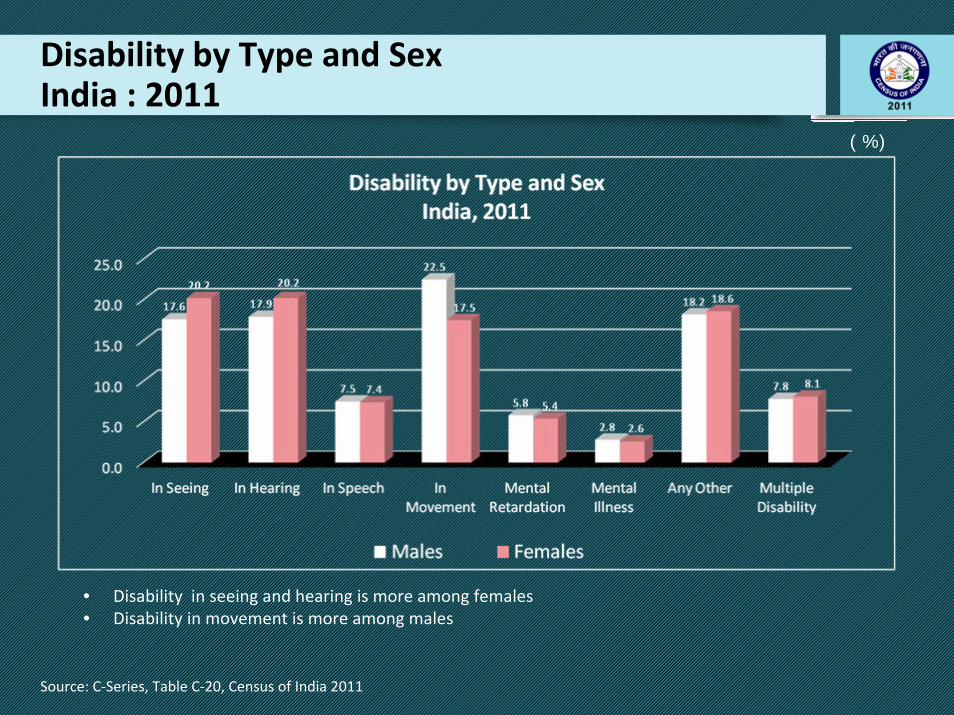
Disability by Type and SexIndia : 2011
Source: C‐Series, Table C‐20, Census of India 2011
( % )
• Disability in seeing and hearing is more among females• Disability in movement is more among males
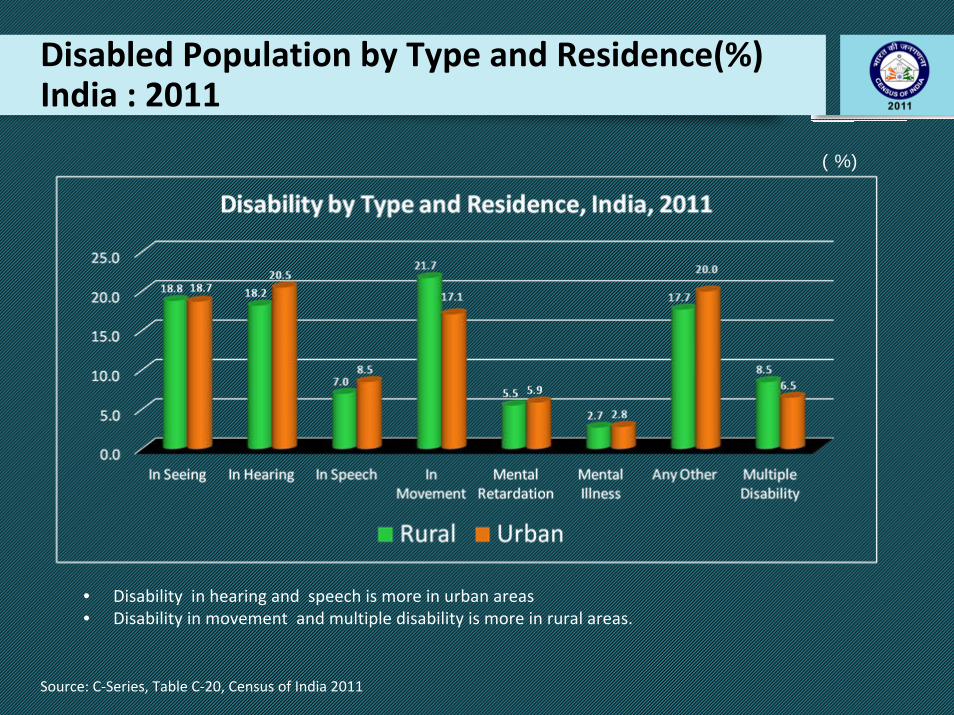
Disabled Population by Type and Residence(%)India : 2011
Source: C‐Series, Table C‐20, Census of India 2011
( % )
• Disability in hearing and speech is more in urban areas• Disability in movement and multiple disability is more in rural areas.
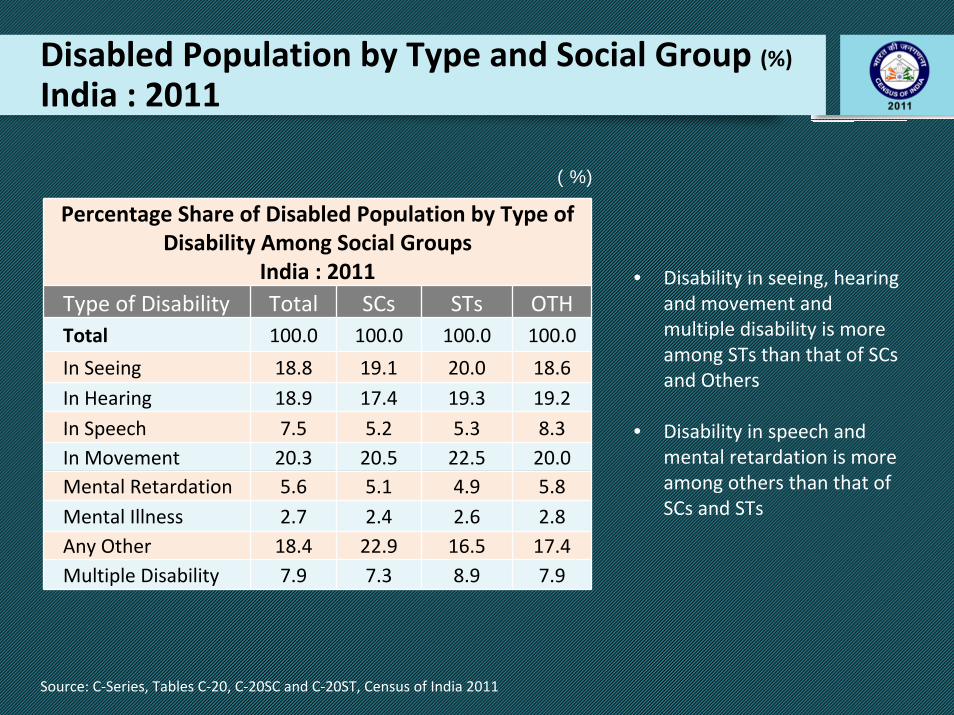
Disabled Population by Type and Social Group (%)India : 2011
( % )
Percentage Share of Disabled Population by Type of Disability Among Social Groups
India : 2011Type of Disability Total SCs STs OTHTotal 100.0 100.0 100.0 100.0
In Seeing 18.8 19.1 20.0 18.6In Hearing 18.9 17.4 19.3 19.2In Speech 7.5 5.2 5.3 8.3In Movement 20.3 20.5 22.5 20.0Mental Retardation 5.6 5.1 4.9 5.8Mental Illness 2.7 2.4 2.6 2.8Any Other 18.4 22.9 16.5 17.4Multiple Disability 7.9 7.3 8.9 7.9
• Disability in seeing, hearing and movement and multiple disability is more among STs than that of SCsand Others
• Disability in speech and mental retardation is more among others than that of SCs and STs
Source: C‐Series, Tables C‐20, C‐20SC and C‐20ST, Census of India 2011
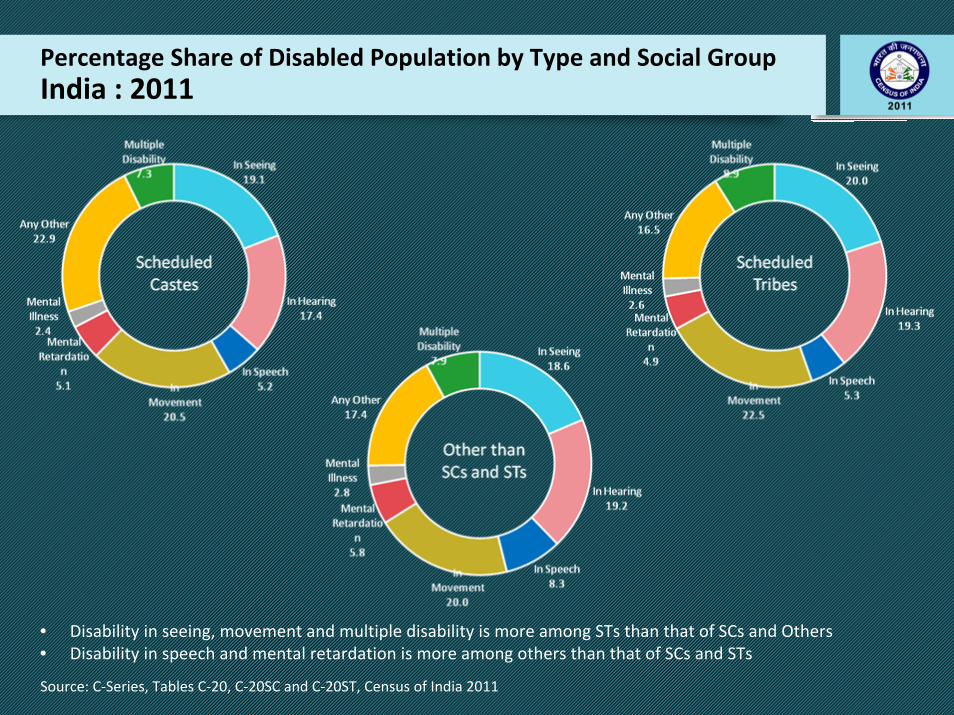
Percentage Share of Disabled Population by Type and Social GroupIndia : 2011
Source: C‐Series, Tables C‐20, C‐20SC and C‐20ST, Census of India 2011
• Disability in seeing, movement and multiple disability is more among STs than that of SCs and Others• Disability in speech and mental retardation is more among others than that of SCs and STs
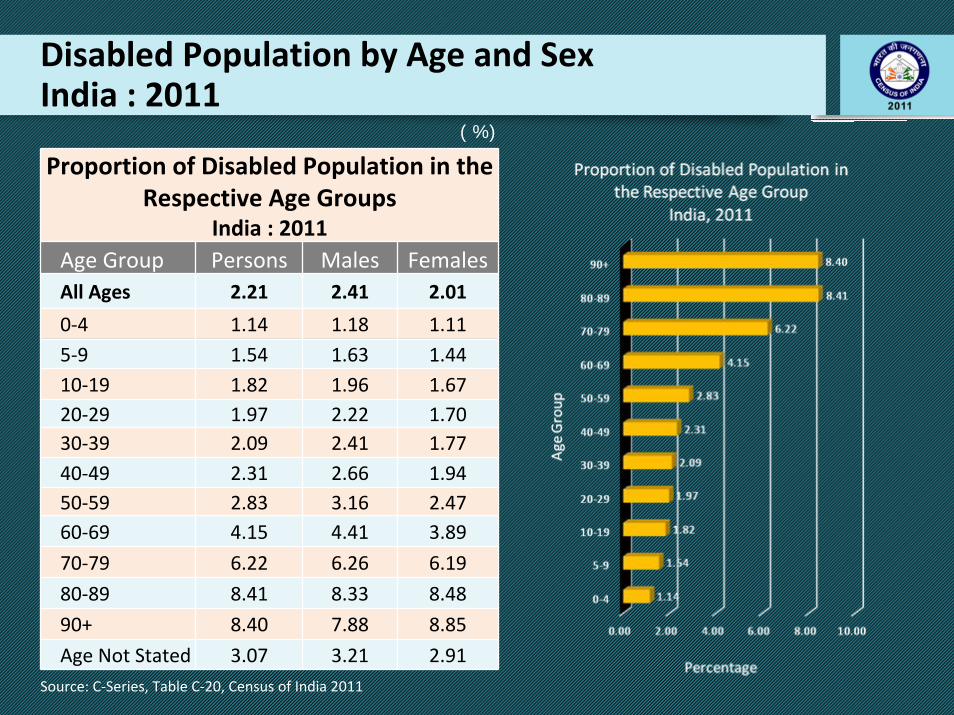
Disabled Population by Age and SexIndia : 2011
Source: C‐Series, Table C‐20, Census of India 2011
Proportion of Disabled Population in the Respective Age Groups
India : 2011Age Group Persons Males FemalesAll Ages 2.21 2.41 2.01
0‐4 1.14 1.18 1.115‐9 1.54 1.63 1.4410‐19 1.82 1.96 1.6720‐29 1.97 2.22 1.7030‐39 2.09 2.41 1.7740‐49 2.31 2.66 1.9450‐59 2.83 3.16 2.4760‐69 4.15 4.41 3.89
70‐79 6.22 6.26 6.19
80‐89 8.41 8.33 8.48
90+ 8.40 7.88 8.85
Age Not Stated 3.07 3.21 2.91
( % )
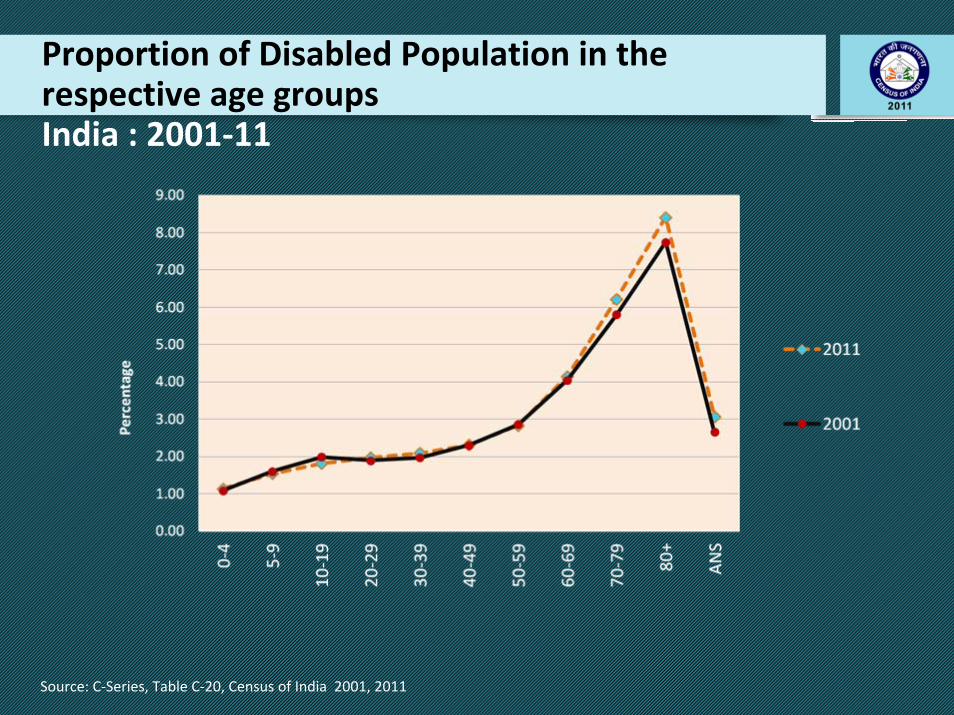
Source: C‐Series, Table C‐20, Census of India 2001, 2011
Proportion of Disabled Population in the respective age groups India : 2001‐11
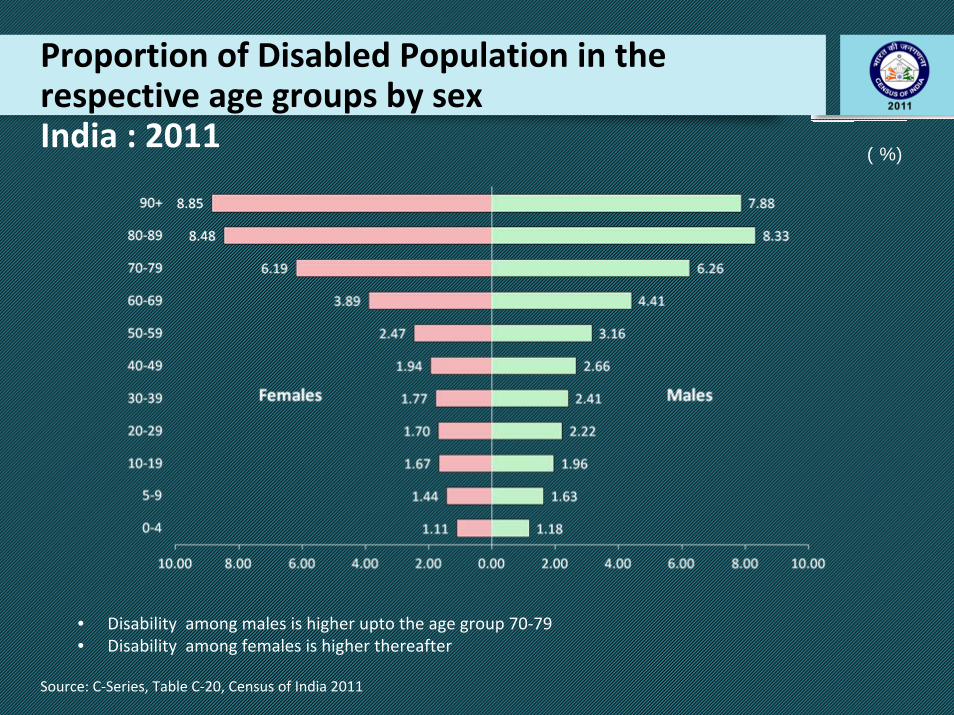
Proportion of Disabled Population in the respective age groups by sexIndia : 2011
Source: C‐Series, Table C‐20, Census of India 2011
( % )
• Disability among males is higher upto the age group 70‐79• Disability among females is higher thereafter
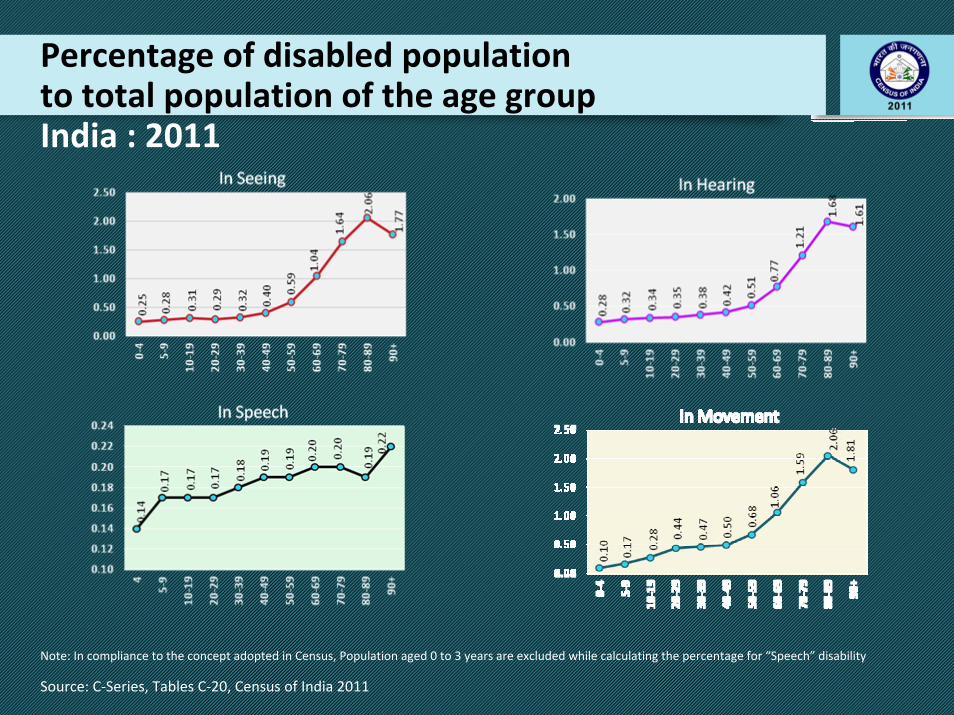
Percentage of disabled population to total population of the age groupIndia : 2011
Source: C‐Series, Tables C‐20, Census of India 2011
Note: In compliance to the concept adopted in Census, Population aged 0 to 3 years are excluded while calculating the percentage for “Speech” disability
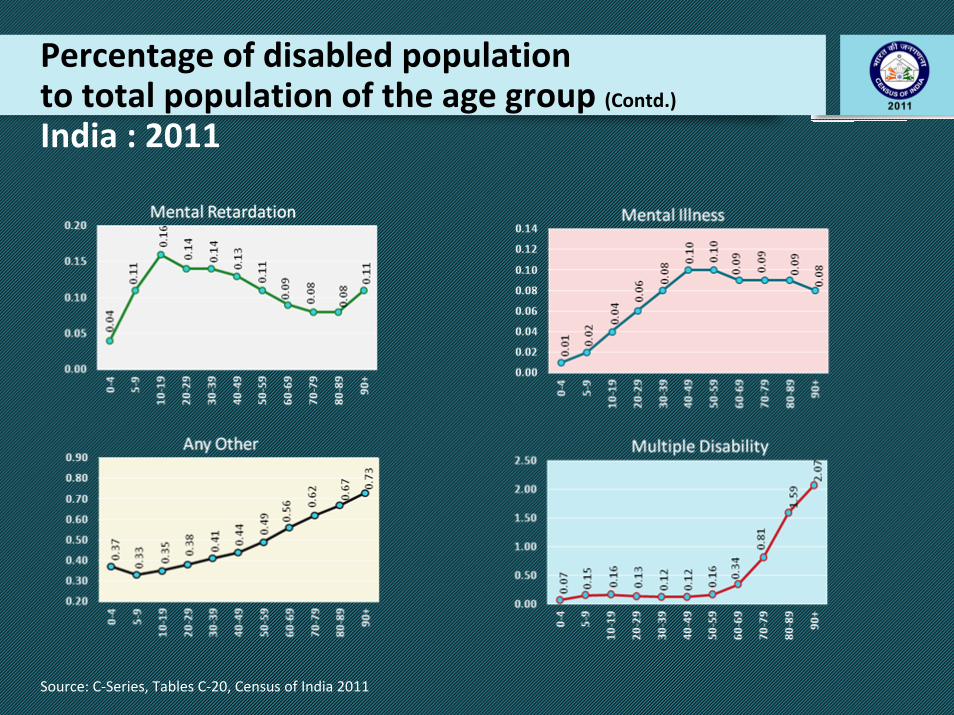
Percentage of disabled population to total population of the age group (Contd.)India : 2011
Source: C‐Series, Tables C‐20, Census of India 2011
Disabled Population by Age and Social GroupsIndia : 2011
( % )
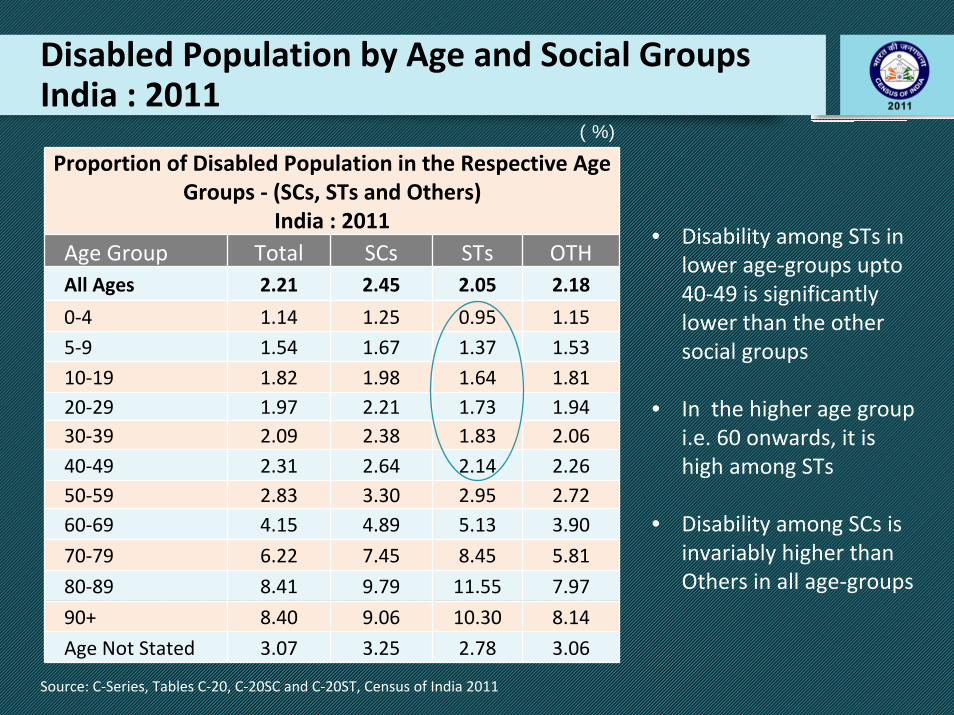
Proportion of Disabled Population in the Respective Age Groups ‐ (SCs, STs and Others)
India : 2011Age Group Total SCs STs OTHAll Ages 2.21 2.45 2.05 2.18
0‐4 1.14 1.25 0.95 1.155‐9 1.54 1.67 1.37 1.5310‐19 1.82 1.98 1.64 1.8120‐29 1.97 2.21 1.73 1.9430‐39 2.09 2.38 1.83 2.0640‐49 2.31 2.64 2.14 2.2650‐59 2.83 3.30 2.95 2.7260‐69 4.15 4.89 5.13 3.90
70‐79 6.22 7.45 8.45 5.81
80‐89 8.41 9.79 11.55 7.97
90+ 8.40 9.06 10.30 8.14
Age Not Stated 3.07 3.25 2.78 3.06
• Disability among STs in lower age‐groups upto40‐49 is significantly lower than the other social groups
• In the higher age group i.e. 60 onwards, it is high among STs
• Disability among SCs is invariably higher than Others in all age‐groups
Source: C‐Series, Tables C‐20, C‐20SC and C‐20ST, Census of India 2011
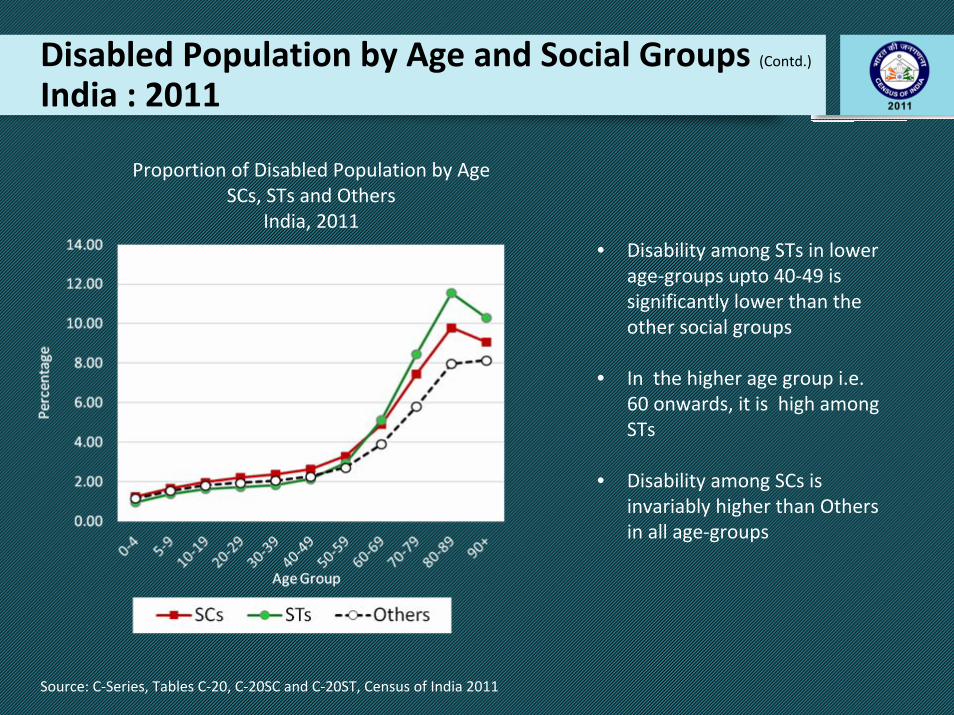
Disabled Population by Age and Social Groups (Contd.)India : 2011
Proportion of Disabled Population by AgeSCs, STs and Others
India, 2011• Disability among STs in lower
age‐groups upto 40‐49 is significantly lower than the other social groups
• In the higher age group i.e. 60 onwards, it is high among STs
• Disability among SCs is invariably higher than Others in all age‐groups
Source: C‐Series, Tables C‐20, C‐20SC and C‐20ST, Census of India 2011
Thank YouWebsite: http://www.censusindia.gov.in
E‐mail: [email protected]
The same is available at http://censusindia.gov.in/ under 'New'. Strangely, there is no literacy data, at least on the surface. One will have to analyse this information in greater detail.