Embed Size (px)
Citation preview
CDD and Social Capital Impact
Designing a Baseline Survey in the Philippines
Copyright © 2005The International Bank for Reconstruction and Development1818 H Street, N.W.Washington, D.C., 20433, USA
All rights reservedManufactured in the United States of AmericaFirst Printing May 2005
This volume is a product of the staff of the International Bank for Reconstruction and Development/ The WorldBank. The findings, interpretations, and conclusions expressed in this paper do not necessarily reflect the views ofthe Executive Directors of The World Bank or the governments they represent. The World Bank does not guarantee the accuracy of the data included in this work. The boundaries, colors, denominations, and other information shown on any map in this work do not imply any judgment on the part of The World Bank concerning the legal status ofany territory or the endorsement or acceptance of such boundaries.
The material in this publication is copyrighted. Copying and/or transmitting portions or all of this work withoutpermission may be a violation of applicable law. The International Bank for Reconstruction and Development/ The World Bank encourages dissemination of its work and will normally grant permission to reproduce portions of thework promptly.
For permission to photocopy or reprint any part of this work, please send a request with complete information to the Copyright Clearance Center, Inc., 222 Rosewood Drive, Danvers, MA 01923, USA, telephone 978-750-8400, fax978-750-4470, http://www.copyright.com/.
All other queries on rights and licenses, including subsidiary rights, should be addressed to the Office of thePublisher, The World Bank, 1818 H Street NW, Washington, DC 20433, USA, fax 202-522-2422, and [email protected].
Table of Contents
Executive Summary ......................................................................................................................................ii
Acknowledgements........................................................................................................................................ i
Acronyms and Abbreviations ....................................................................................................................... v
Background................................................................................................................................................... 1
Evaluating CDD: Managing Real World Constraints................................................................................... 3
Data Collected and Summary of Findings .................................................................................................... 7
Poverty indicators .................................................................................................................................. 7
Social capital, empowerment and governance..................................................................................... 11
Concluding Remarks: Need for flexibility in operations ............................................................................ 16
References................................................................................................................................................... 17
Annex 1: The KALAHI-CIDSS.................................................................................................................. 18Annex 2: Sampling Design ......................................................................................................................... 24Annex 3: Household survey........................................................................................................................ 39Annex 4: Village official survey................................................................................................................. 75Annex 5: Selected summary statistics......................................................................................................... 84Annex 6: TOR for qualitative component................................................................................................. 104
Table 1: Data collection for KALAHI-CIDSS impact evaluationTable 2: Survey MunicipalitiesTable 3: Poverty in KALAHI-CIDSS municipalitiesTable 4: Service provision in KALAHI-CIDSS municipalitiesTable 5: Social capital in KALAHI-CIDSS municipalitiesTable 6: Participation in governance in KALAHI-CIDSS municipalitiesTable 7: Decision-making process – investment planning
Box 1: Lessons learned from survey implementationBox 2: Differences between Intervention and Comparison Groups
ii
Executive Summary
Given the increasing use of CDD approaches in the Bank’s lending portfolio, it is important to developinsights on the impact of CDD programs, and to identify conditions and techniques that work well inorder to improve project performance. The baseline survey of the KALAHI-CIDSS project in thePhilippines is an attempt to generate such insights and strengthen learning about CDD programs throughrigorous evaluations. This evaluation follows the “good practices” prescribed by experts in that it collects quality baseline data in a representative sample of both intervention groups and matched comparisongroups. This baseline survey not only provides valuable information about the KALAHI-CIDSS project,but also offers some guidance on developing technically sound evaluations for CDD programs.
One of the most promising CDD operations in the East Asia region, and in the Bank portfolio, is theKALAHI-CIDSS project in the Philippines, implemented by the Department of Social Welfare andDevelopment (DSWD). In accordance with the imperative to learn what works, the DSWD and the World Bank are committed to a careful impact evaluation of the KALAHI-CIDSS. As the source of ex-anteinformation for the KALAHI-CIDSS, a quantitative baseline survey was implemented in Phase 3municipalities in the fall of 2003. It served as the first round of a panel survey that will track 2,400households and 132 villages before, during, and after project implementation1. The survey capturesinformation on household and village conditions in intervention and comparison communities. In futurerounds, the survey will be complemented by a qualitative component to allow for triangulation ofinformation and a richer and more detailed analysis. This data will primarily provide baseline information for determining the impact of the KALAHI-CIDSS on poverty reduction, social capital, empowermentand governance. In addition, a deeper understanding of the areas in which the KALAHI-CIDSS willoperate has great value of its own. Together with lessons learned from project implementation to date, the baseline survey for the KALAHI-CIDSS impact evaluation provides valuable information for projectmanagement.
The survey finds that poverty is widespread in KALAHI-CIDSS municipalities. In all dimensions ofpoverty, means (income/expenditure, quality of labor supply), outcomes (education, health, housing andamenities) and perception (self-rated poverty), the incidence of poverty is estimated to be very high. Thebaseline survey also gets villagers’ pre-intervention status on access to neighboring villages, localmarkets, schools, and other public facilities; travel time and transport costs; water and sanitation; healthconditions; and education outcomes. In general, access conditions are very limited, indicating the poverty in KALAHI-CIDSS municipalities. Road conditions and access to water are especially poor whencompared to other facilities such as education and health. This may explain the large preference of earlyKALAHI-CIDSS villages to build roads and water systems.
Some of the challenges for the KALAHI-CIDSS include:• understanding how the project can build on existing social dynamics and practices in the villages
to facilitate participation, and
• promoting the emergence of capable leaders, and internalizing transparent communication andmanagement practices. For example, the capability of communities to organize themselves is akey variable relevant to the success of the project.
Community capacity to organize can be measured by social capital conditions, which includes trust,inclusion, groups and networks, collective action, and information and communication. Measuring initial social capital conditions in KALAHI-CIDSS municipalities allows for an assessment of whether
1 Funding for further data collection has been secured through the Japan Social Development Fund.
iii
communities with more social capital are more effective in having their proposals funded and inimplementing their sub-projects. It also provides useful information to project management aboutexisting conditions that facilitate or hinder KALAHI-CIDSS implementation.
Social capital and governance indicators vary across the survey municipalities but seem to be stronger inthe relatively deprived areas in Mindanao. There is, for example, a remarkably strong tradition ofBayanihan2/collective action in KALAHI-CIDSS municipalities in Mindanao. Despite low levels of trustand problems with conflict and violence in all four survey provinces, most respondents perceive theirvillage as relatively peaceful. Interestingly, the two provinces in Mindanao, where peace and orderproblems are widespread, perceive themselves as most peaceful.
A key finding of the survey is that different regions in the country vary quite substantially both in termsof poverty and in the extent of empowerment and inclusive governance. This suggests that certain areasmight require different strategies and focal points than others and underscores the importance ofmaintaining flexibility and adaptability in KALAHI-CIDSS implementation.
As large-scale programs such as the KALAHI-CIDSS institutionalize standard practices across a largenumber of diverse local areas, they can lose one of their main advantages, their demand responsiveness.Balancing scale and flexibility is a challenge to any large CDD program. It is recommended that theDSWD and the Bank continue discussions around whether the project as currently designed, implemented through 16 pre-determined steps, allows for the needed flexibility and adaptability. These discussionsshould focus on how the project can best tackle and adapt to the diversity of local conditions it willinevitably confront.3
This report on the KALAHI-CIDSS baseline survey serves as a resource to several distinct audiences. For those interested in techniques for evaluating CDD, it offers an example of how to develop a technicallyrigorous evaluation working with operational constraints. For those with an interest in social capital andempowerment, it gives an example of how to approach quantitative measurement of these concepts.Finally, for those with a specific interest in CDD and social capital in the Philippines, the reportintroduces a data source that could be used effectively for further research and to improve operations.While this report is not a comprehensive analysis of what the data indicates, it is meant to serve as astepping stone for others to do further research and analysis.
2 Bayanihan is a Filipino tradition wherein neighbors would help a relocating family by gathering under their house, and carrying it to its new location. More generally, the word bayanihan has come to mean a communal spirit that makes seemingly impossible feats possible through the power of unity and cooperation. In this context, we use bayanihan as a proxy for collective action.3 In the Kecamatan Development Project (KDP) in Indonesia, for example, they ended up developing a completely different operations manual for one area (Papua) because regular operational procedures did not fit local conditions there. Other areas also made operational adaptations based on local conditions and needs.
iv
Acknowledgements
This report was written by Robert S. Chase and Camilla R. Holmemo, Social Development Department,World Bank. The authors wish to thank the TFESSD for financing the baseline survey as part of itsallocation to “Build Social Capital through CDD”. We also wish to thank a number of actors who wereinstrumental in developing the evaluation: the Department of Social Welfare and Development of thePhilippines for their commitment to undertaking a rigorous impact evaluation; Bhuvan Bhatnager, former Task Team Leader of the KALAHI-CIDSS for his valuable support and inputs from the beginning of this work; Andrew Parker, current Task Team Leader, for his continuing support; Arsenio Balisacan,Rosemarie Edillon, and Sharon F. Piza of the Asia-Pacific Policy Center, for designing and implementing the baseline survey; all the researchers and enumerators employed in the field for their hard andchallenging work; and the KALAHI-CIDSS task team and colleagues from the CDD and Social Capitalanchor for their review and comments to earlier drafts of the survey instruments and this report. Thispaper greatly benefits from the comments of Dan Biller, John Maluccio, Agnes Quisimbing, and SusanWong (peer reviewers) as well as from the valuable feedback of Ed Araral, Elinor Ostrom, and JulienLabonne. Special thanks to Danielle Christophe and Aditi Sen for their assistance with editing andpublishing this paper. All errors and omissions are the sole responsibility of the authors.
v
Acronyms and Abbreviations
APPC Asia-Pacific Policy Center
BA Barangay (village) Assembly
CARAGA Cordilla Administrative Region
CDD Community-driven development
DSWD Department of Social Welfare and Development
EAP East Asia and the Pacific
GOP Government of the Philippines
KALAHI-CIDSS Kapitbisig Laban sa Kahirapan (Linking Arms against Poverty) -Comprehensiveand Integrated Delivery of Social Services
LGU Local Government Unit
MIAC Municipal Inter Agency Committee
MIBF Municipal Inter Barangay Forum
FY Fiscal Year
TFESSD Trust Fund for Environmentally and Socially Sustainable Development

Background
Widespread poverty continues to be a challenge in the Philippines. Estimates of national povertyincidence4 show that more than one third (34%) of the country’s population, or 26.5 million Filipinos,lived below the poverty line in 20005. Poverty is predominantly a rural phenomenon. While it remainedunchanged at 15% in urban areas, the proportion of poor in rural areas increased from 39.9% in 1997 to41.4% in 2000. The geographic variations in poverty are also substantial. In 2002, for example, povertyincidence in the National Capital Region was 5.7% while it was 49.0% in Region V, 37.8 % in RegionVI, 38.3% in Region IX and 42.9% in Cordilla Administrative Region (CARAGA).6 The AutonomousRepublic in Muslim Mindanao (ARMM) has the highest poverty incidence in the country, at 57%.
Government Strategy:
Worsening poverty has had serious consequences for the economic, political and social fabric of thePhilippines. There is perceived to be a strong link between high levels of absolute poverty and thepersistence of civil unrest and armed conflict in certain parts of the country. Calling for rapid growth and empowerment of the poor, the Philippine Government has declared that success in the fight againstpoverty is the long-term solution to achieving sustained peace.
The poverty reduction strategy of the Philippine Government has five pillars: (a) asset reform; (b) human development; (c) employment generation and livelihood; (d) social protection; and (e) participation ingovernance. While the KALAHI-CIDSS contributes to all five pillars of the strategy, it specificallyaddresses participation in governance. The government has focused on the KALAHI-CIDSS as itsflagship poverty reduction project.
Project Description:
Using CDD approaches, the KALAHI-CIDSS seeks the empowerment of local communities throughincreased participation in local governance and involvement in the design, implementation andmanagement of poverty reduction projects. This objective, which establishes a strong link betweenimproved local governance and poverty reduction, is pursued through three components: (a) provision ofcommunity grants; (b) implementation support to strengthen formal and informal local institutions; and(c) monitoring and evaluation.
The KALAHI-CIDSS will be implemented over six years in 4,270 villages and 177 municipalities in the42 poorest provinces of the Philippines. The provinces are selected based on poverty data from theNational Statistics and Coordination Board (NSCB). Using municipal poverty mapping methodsdeveloped by the Asia-Pacific Policy Center, the poorest one-fourth of all municipalities within a targetprovince are selected to participate in the KALAHI-CIDSS. All villages within selected municipalities are eligible to participate in the project.
Implementation of the KALAHI-CIDSS is divided into four phases. Phase 1 was launched in January2003 and covered 201 villages in 11 municipalities of 11 provinces. Phase 2 was launched in July 2003 in 1,302 villages and 56 municipalities of 11 additional provinces. Phase 3 will be launched in 20057 in 700villages and 28 municipalities in 20 additional provinces and phase 4 will be launched in 2005 to cover
4 National Statistical Coordination Board (NSCB) of the Philippines (www.nscb.gov.ph)5 The 2000 national poverty line was Php 11,605 (www.nscb.gov.ph)6 These are the four regions represented in the impact evaluation.
2
the remaining 53 municipalities. The total project cost of the KALAHI-CIDSS is US$182.4 million – the Bank finances US$100 million, the national Government finances US$31.4 million, and villagers andlocal governments contribute US$51 million.
The Department of Social Welfare and Development (DSWD) is implementing the KALAHI-CIDSS in16 steps for the villagers to follow (see Annex 1). Through these 16 steps, villagers prioritize theirdevelopment needs, design activities, seek technical assistance, manage resources, and implement andoperate development interventions. This organized experience in collective action – repeated three timesin each targeted area – is designed to develop the capacity of poor villagers to help themselves and engage better with local governments and national agencies. As this capacity develops, villagers are also expected to take a more active role in improving the delivery of other pro-poor services and initiate newdevelopment activities8. More evidence is needed to suggest whether the KALAHI-CIDSS enhances notonly community welfare, but also communities’ ability to address and solve their own problems.
The World Bank increasingly supports participatory and “bottom-up” approaches to development. This isevidenced by the growing application of Community Driven Development (CDD) approaches, giving the poorand vulnerable greater voice in development decisions and aiming to empower communities while improvingservices and reducing poverty. The share of Community Driven Development in the Bank’s lending portfolio has increased significantly over the past years. The change is also noteworthy in East Asia9. Given the increasingprevalence of CDD, it is important to identify conditions and techniques that work well and provide insights onhow to improve project performance. In line with this imperative to learn what works, the DSWD and the World Bank are committed to a careful impact evaluation of the KALAHI-CIDSS. The evaluation follows the “goodpractices” prescribed by experts in that it collects quality baseline data in a representative sample of bothintervention groups and matched comparison groups. As the source of ex-ante information for the KALAHI-CIDSS, a quantitative baseline survey was implemented in Phase 3 municipalities in the fall of 2003. It served as the first round of a panel survey that will track 2,400 households and 132 villages before, during, and after project implementation. In future rounds, the survey will be complemented by a qualitative component to allow fortriangulation of information and a richer and more detailed analysis.
Objectives of Impact Evaluation:
The impact evaluation assesses the impact and performance of the KALAHI-CIDSS by examining theextent to which the project’s results concur with its initial objectives. The impact evaluation will informpolicy makers and project implementers of the strengths and weaknesses of the innovative strategies ofthe KALAHI-CIDSS. Its specific objectives are to:
1. evaluate the extent to which current and future poverty is reduced in the targetmunicipalities;
2. determine the impact of the KALAHI-CIDSS on poverty, social capital, empowermentand governance; and
3. examine the processes by which poverty has been reduced and communities have beenempowered.
7 Phase 3 implementation was originally scheduled to start in early 2004, but was delayed due to a reenactment of the 2004 National Budget.8 From “Philippines: Kapitbisig Laban sa Kahirapan (KALAHI-CIDSS) project” prepared by Bhuvan Bhatangar and Clifford Burkley for the Shanghai Conference on Scaling up Poverty Reduction, 2004.9 Over the past year (FY04), the Bank has consolidated its investment in CDD approaches, with overall Bank lending in support of CDD increasing from $1.7 billion in FY03 to $2.1 billion in FY04. US$ yearly investment in CDD in EAP was $204 million in FY04 and several CDD projects are expected to go to the board in FY05 (CDD briefing note for Mr. Shengman Zhang, September 2004).
Evaluating CDD: Managing Real World Constraints
A “gold standard”10 impact evaluation requires substantial resources and evaluation planning concurrentwith project design. While it is costly and time consuming to evaluate any program, the CDD approachoffers some particular evaluation difficulties11. In the context of the KALAHI-CIDSS, an evaluationfollowing all gold standard requirements would have been prohibitively expensive and practicallydifficult. The challenge thus was one of developing a high quality impact evaluation within the givenfinancial, logistical and CDD-specific constraints. There are three fundamental components of impactevaluation: collection of baseline data, inclusion of comparison groups, and careful efforts to keepfindings relevant for operational practitioners. To maintain rigor and relevance, the KALAHI-CIDSSimpact evaluation needed to be designed based on an in-depth understanding of the CDD intervention and context in which it takes place. The experience from the KALAHI-CIDSS evaluation suggests thefollowing for practitioners planning an evaluation of CDD:
Collect baseline data prior to project implementation whenever possible. A careful evaluationrequires a well defined and executed baseline survey that gathers information before the project starts.Evaluation design should ideally take place alongside project design and development. However, givenlogistical and resource constraints, initial thinking about impact evaluation often occurs only after theproject has begun. This was largely the case with the KALAHI-CIDSS. While this presented a challenge to the quality of the design, the phasing of project implementation allowed for the collection of qualitybaseline data in 3rd phase municipalities before the project was launched in these municipalities. 12 Several CDD programs follow a phased approach similar to the one in the KALAHI-CIDSS. Projectimplementers who have missed the baseline boat should take advantage of this and recognize thepossibility of collecting quality baseline data despite lack of early planning.
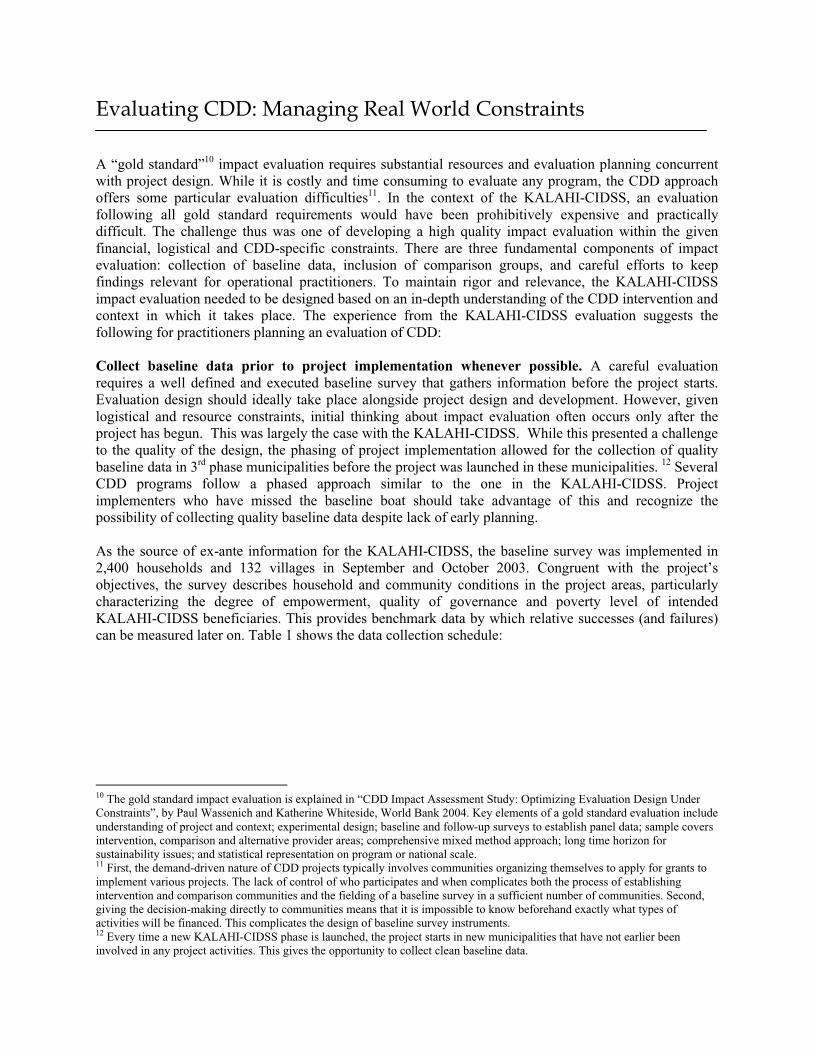
As the source of ex-ante information for the KALAHI-CIDSS, the baseline survey was implemented in2,400 households and 132 villages in September and October 2003. Congruent with the project’sobjectives, the survey describes household and community conditions in the project areas, particularlycharacterizing the degree of empowerment, quality of governance and poverty level of intendedKALAHI-CIDSS beneficiaries. This provides benchmark data by which relative successes (and failures)can be measured later on. Table 1 shows the data collection schedule:
10 The gold standard impact evaluation is explained in “CDD Impact Assessment Study: Optimizing Evaluation Design Under Constraints”, by Paul Wassenich and Katherine Whiteside, World Bank 2004. Key elements of a gold standard evaluation include understanding of project and context; experimental design; baseline and follow-up surveys to establish panel data; sample covers intervention, comparison and alternative provider areas; comprehensive mixed method approach; long time horizon for sustainability issues; and statistical representation on program or national scale.11 First, the demand-driven nature of CDD projects typically involves communities organizing themselves to apply for grants to implement various projects. The lack of control of who participates and when complicates both the process of establishing intervention and comparison communities and the fielding of a baseline survey in a sufficient number of communities. Second, giving the decision-making directly to communities means that it is impossible to know beforehand exactly what types of activities will be financed. This complicates the design of baseline survey instruments.12 Every time a new KALAHI-CIDSS phase is launched, the project starts in new municipalities that have not earlier been involved in any project activities. This gives the opportunity to collect clean baseline data.
4
Table 1: Data collection for KALAHI-CIDSS impact evaluation
1 2 3 4 5 6 7 8 9 10 11 12
2003Quantitativebaseline
2004
2005Qualitativebaseline
2006
Quantitative andqualitative mid-term
2007
2008Quantitative andqualitative final
Cycle 1Cycle 2Cycle 3
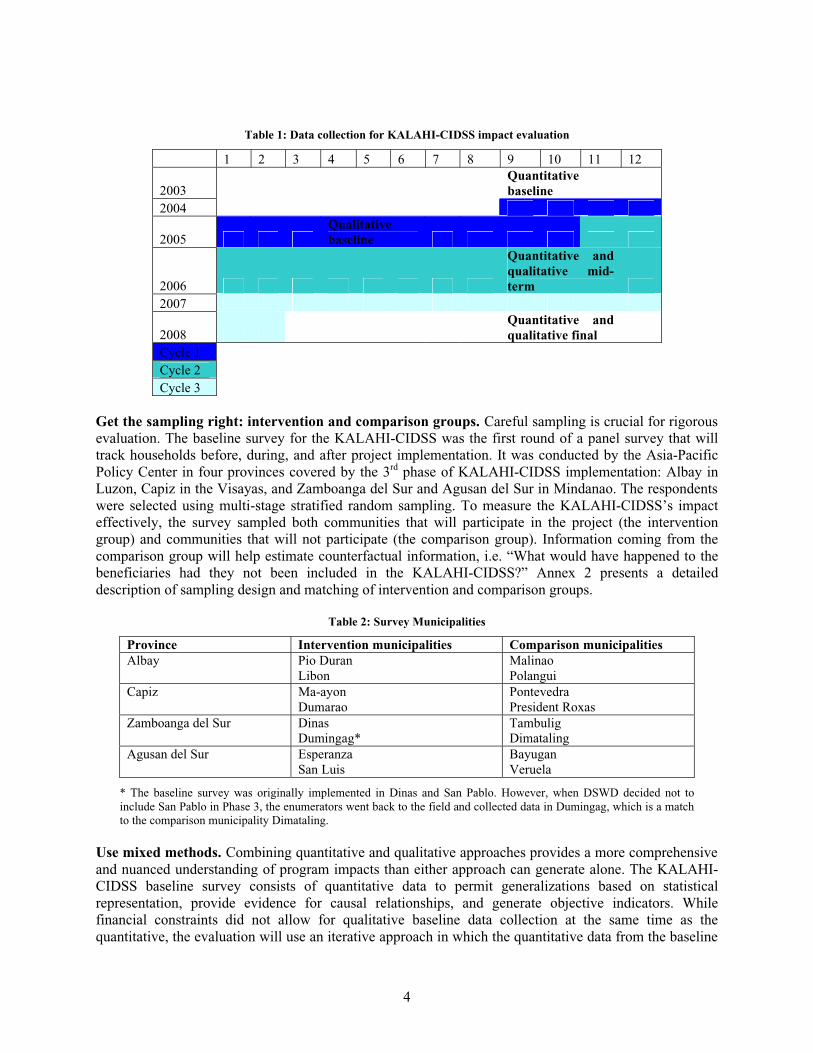
Get the sampling right: intervention and comparison groups. Careful sampling is crucial for rigorous evaluation. The baseline survey for the KALAHI-CIDSS was the first round of a panel survey that willtrack households before, during, and after project implementation. It was conducted by the Asia-PacificPolicy Center in four provinces covered by the 3rd phase of KALAHI-CIDSS implementation: Albay inLuzon, Capiz in the Visayas, and Zamboanga del Sur and Agusan del Sur in Mindanao. The respondents were selected using multi-stage stratified random sampling. To measure the KALAHI-CIDSS’s impacteffectively, the survey sampled both communities that will participate in the project (the interventiongroup) and communities that will not participate (the comparison group). Information coming from thecomparison group will help estimate counterfactual information, i.e. “What would have happened to thebeneficiaries had they not been included in the KALAHI-CIDSS?” Annex 2 presents a detaileddescription of sampling design and matching of intervention and comparison groups.
Table 2: Survey Municipalities
Province Intervention municipalities Comparison municipalitiesAlbay Pio Duran
LibonMalinaoPolangui
Capiz Ma-ayonDumarao
PontevedraPresident Roxas
Zamboanga del Sur DinasDumingag*
TambuligDimataling
Agusan del Sur EsperanzaSan Luis
BayuganVeruela
* The baseline survey was originally implemented in Dinas and San Pablo. However, when DSWD decided not toinclude San Pablo in Phase 3, the enumerators went back to the field and collected data in Dumingag, which is a match to the comparison municipality Dimataling.
Use mixed methods. Combining quantitative and qualitative approaches provides a more comprehensive and nuanced understanding of program impacts than either approach can generate alone. The KALAHI-CIDSS baseline survey consists of quantitative data to permit generalizations based on statisticalrepresentation, provide evidence for causal relationships, and generate objective indicators. Whilefinancial constraints did not allow for qualitative baseline data collection at the same time as thequantitative, the evaluation will use an iterative approach in which the quantitative data from the baseline
5
survey informs the design of a qualitative component to be implemented in the early stages of Phase 3implementation.13 The qualitative data will allow exploration of concepts that are difficult to quantify, adeeper investigation of specific KALAHI-CIDSS processes, and how, if at all, the presence of theKALAHI-CIDSS leads to results on the ground.
Tailor data collection to project and context. The baseline survey instrument consists of quantitativehousehold level and village official surveys. The survey instruments were designed in close cooperationwith the DSWD to respond to the operational needs of KALAHI-CIDSS project management. They were field tested three times before being finalized and translated into the local languages of the survey areas.Reputable research institutions operating in each survey area collected the data. This proved to be anefficient arrangement given the diversity in language, local conditions and political situation in the foursurvey provinces.
Build close relationships between implementers and focal points. The experience from implementingthe baseline survey underscores the value of a close working relationship between project implementers,survey implementers and World Bank focal points. KALAHI-CIDSS project management provided useful inputs throughout and offered valuable insights into the interpretation of the data. This was facilitatedthrough regular exchanges between the World Bank, the DSWD and the APPC. Consultations andsharing of lessons from the survey was also shared regularly with the DSWD and World Bank task teamcolleagues during the KALAHI-CIDSS supervision missions.
Household Survey: The household survey is designed to be administered in one hour. Along withidentification and demographic information, it collects data about three categories of potential effects:
• Poverty indicators (agricultural assets, housing and amenities, consumption andexpenditure, subjective poverty measures);
• Sub-project outputs (access, quality and utilization of infrastructure, particularly thatmost likely to be affected by KALAHI-CIDSS sub-projects, e.g., health, schooling, water and sanitation, roads);
• Social Capital, Empowerment and Governance (voice, participation, inclusion, trust,groups and networks, responsiveness, transparency and information-sharing,accountability).
Village Survey: The village official survey collects complementary information on these three categoriesas well as additional data on governance.
Utilize existing knowledge to design survey instruments. The survey instruments were designedcooperatively between the Asia-Pacific Policy Center, the World Bank Social Development Department,the World Bank Manila Office, and the DSWD. They drew on lessons from existing questionnaires,including the Annual Poverty Indicator Survey and the Family Income and Expenditure Survey of thePhilippines National Statistics Office, the Benchmark survey for the Comprehensive Agrarian ReformProgram, the Social Capital Integrated Questionnaire and the Social Capital Assessment Tool of theWorld Bank, and the Social Weather Station (SWS) Survey on poverty perceptions. Each of the questions from these instruments measure specific indicators that are needed in evaluating the impact of theKALAHI-CIDSS. Appropriate modifications were made on all questions, through consultations and field testing.
13 The qualitative component is being developed at the time of writing and will be implemented in the spring of 2005 by Empowering Citizen Participation in Governance (ECPG). The terms of reference for the qualitative study is included in Annex 6.
6
Select local partners/survey implementers with care.14 The strong capacity of the APPC team thatdesigned the evaluation was crucial to its high quality. It is important to select partners carefully - thequality of the local partners will in the end determine the effectiveness of the overall evaluation. Keytasks the partner should be able to undertake are:
• Sophisticated sampling design. This requires that the team is comprised of highly skilled statisticians.
• Design of survey instruments. The partner should have experience designing andimplementing surveys as well as knowledge of existing instruments that can be utilized.15
• Development of field operations manuals. This manual covers all operations of thesurvey, including sampling, data collection, and field processing.
• Recruitment and training of survey enumerators. APPC recruited reputable researchinstitutions in each of the survey areas to implement the data collection. The enumerators received three days of intensive training, including one day of dry runs on sampling andinterviewing. This careful introduction to the survey and how to ask each of the questions were reported as instrumental to their successful field work.
• Data cleaning and processing.
• Advanced data analysis and reporting.
14 A full description of the implementation of the KALAHI-CIDSS baseline survey, covering pre-survey, survey operations, and data processing, can be found in “Baseline Survey for the Impact Evaluation of the KALAHI-CIDSS: Report on the Data Collection and Progress of the Survey”, by the Asia-Pacific Policy Center.15 The questionnaires were finalized after several field tests (two different locations for the household questionnaire and more than thirty barangays for the barangay questionnaire. The questionnaires were translated to the local languages used in the survey areas. The translation was finalized after doing back-translation with the help of the survey implementers. The instruments were designed to be completed in approximately one hour to avoid interviewee fatigue.
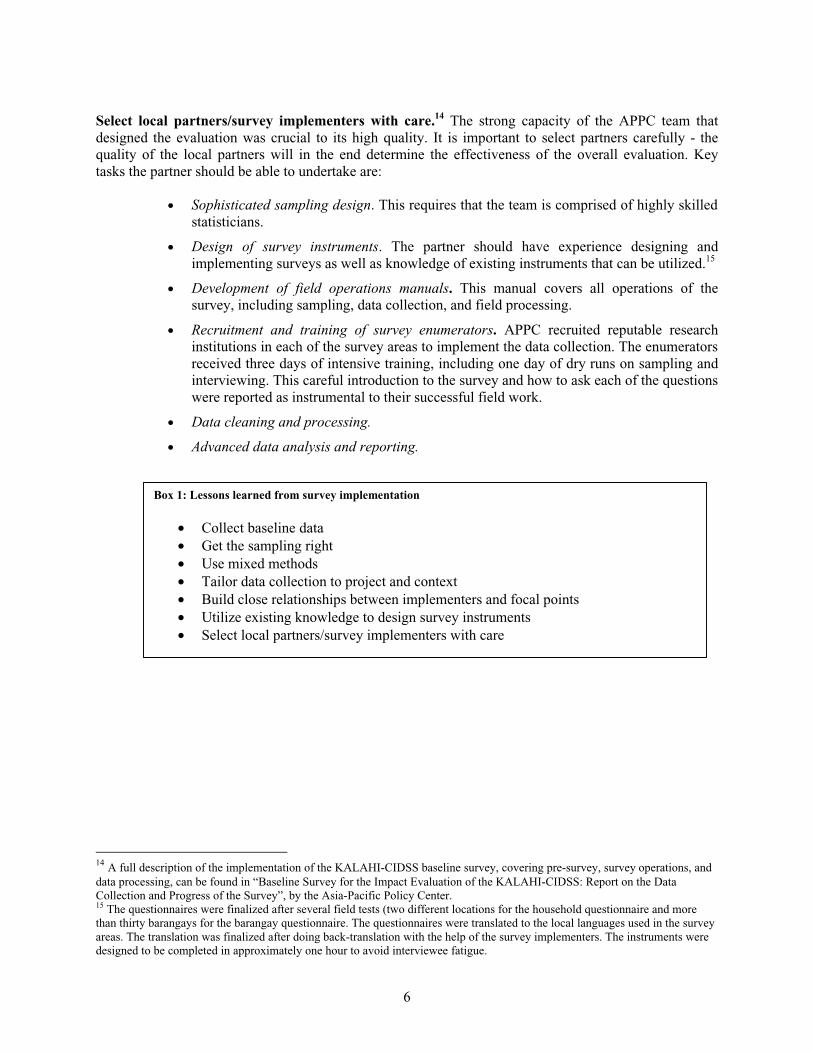
Box 1: Lessons learned from survey implementation
• Collect baseline data• Get the sampling right• Use mixed methods• Tailor data collection to project and context• Build close relationships between implementers and focal points• Utilize existing knowledge to design survey instruments• Select local partners/survey implementers with care
Data Collected and Summary of Findings16
The baseline survey captures household data and village conditions. The main purpose of this data is toprovide baseline information for determining the impact of the KALAHI-CIDSS on poverty reduction,social capital, empowerment, and governance and for examining the processes by which poverty socialcapital, empowerment and governance may have changed. However, a deeper understanding of the areasin which the KALAHI-CIDSS will operate has a great value of its own and can help guide the DSWD in project implementation. The different regions in the country vary quite substantially both in terms ofpoverty and in the extent of empowerment and inclusive governance. This suggests that certain areasmight require different strategies and focal points than others. The main findings of the baseline survey,and their implications, are summarized below.
Poverty Indicators
While poverty is multi-dimensional, it is often measured by consumption, expenditure, or daily calorieintake. The primary such “traditional” measure of poverty in the baseline survey is based on householdexpenditures. Household decisions on consumption govern the allocation of the family budget into foodand non-food (medical care, education, housing, etc.). Since production and consumption decisions oftenare intertwined, especially in rural areas where many families do subsistence farming, the baseline survey collected data on both consumption patterns and production- and marketing practices. Ultimately, thisdata will allow us to assess the success of the KALAHI-CIDSS in reducing these aspects of poverty.Additionally, it will lay the groundwork for evaluating poverty targeting, or the extent to which resources reach poorer segments of the population. The areas identified as most deprived might also requireadditional attention during project implementation.
An alternative measure of poverty that is widely used in the Philippines is self-rated poverty, or povertyfrom the perspective of the poor. This is measured through surveys of households’ own perceptions ofwhether or not they are poor. It is based on where respondents would place their family on a card marked “not poor”, “on the line” and “poor”. Households are also asked how much money they, or a family their size who sees itself as poor, would need in order not to feel poor anymore. This poverty threshold variesfrom household to household based on their own perception of their poverty status relative to otherhouseholds.
16 This section summarizes the main findings from the baseline survey. A full overview of the findings is given in “KALAHI-CIDSS:KKB Beneficiary Profile at Year 0”, by Rosemarie G. Edillon, Sharon Faye A. Piza, and Abundio Matula, Asia-PacificPolicy Center, 2004.
8
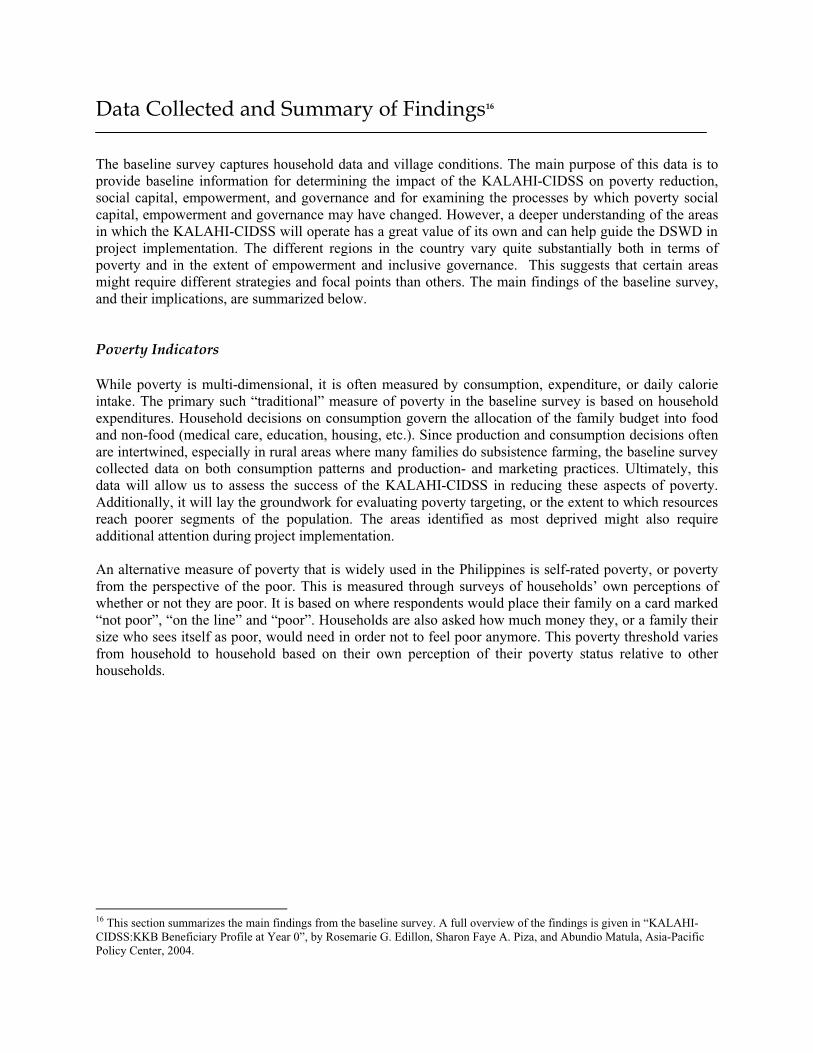
Box 2: Differences between Intervention and Comparison Groups
In an ideal matching of municipalities (i.e. that which should result from randomization ofintervention and comparison areas), we would expect no significant difference betweenintervention and comparison groups. While the KALAHI-CIDSS intervention and comparison municipalities are relatively similar, significant differences do exist. This underscores thedifficulty of finding perfectly matched comparison communities.
Albay Capiz ZamboangaDel Sur
Agusan del Sur
I C I C I C I CPoverty incidence (%)
80.0 76.1 67.8 71.0 89.9 82.2 81.0 74.1
Monthly PCE (Php)
1,004 1,117 1,113 1,187 602 719 860 1,145
Food/totalexpenditure (%)
65.2 61.1 64.7 64.6 69.9 70.9 68.3 60.1
Self-rated poor (%)
71.8 71.2 55.7 56.8 83.4 86.5 71.6 69.0
Villages w. health center (%)
61.9 66.7 80.0 100.0 58.3 75.0 100.0 100.0
Elementary school enrollment (%)
92.7 88.3 97.7 97.7 86.0 91.8 99.5 92.2
HHs w. direct water supply (%)
37.0 35.2 24.2 22.5 4.8 15.4 8.7 18.0
HHs in organizations (%)
16.4 20.9 16.7 22.8 51.0 43.5 45.0 45.3
Participation in bayanihan (%)
45.3 42.3 39.5 34.8 76.1 43.7 81.9 85.4
HHs perceiving village as generally peaceful
79.5 86.1 81.3 72.6 88.6 93.6 86.0 87.9
Awareness of village assembly (%)
92.2 87.9 74.6 84.6 98.9 96.0 93.9 97.0
Participation in barangayassembly (%)
63.4 47.3 26.1 38.9 94.0 80.1 59.5 73.0
Awareness of financial details of projects (%)
11.8 7.7 9.1 9.6 14.6 14.2 8.0 8.1
Participation in developmentplanning (%)
27.9 21.6 21.1 25.7 37.2 36.1 32.0 29.3
Awareness of BDC (%)
15.7 11.7 2.9 2.4 14.9 18.6 2.9 4.8
Generally, the conditions in the intervention groups are worse than in the comparison groups: with the exception of Capiz, poverty incidence is higher in the treatment groups and per capita expenditure is lower. This shows the effective targeting of KALAHI-CIDSS resources topoorer municipalities. Conditions in terms of social capital, empowerment, and governancevary across the sample.
9
Poverty is widespread in KALAHI-CIDSS municipalities. In all dimensions of poverty, means(income/expenditure, quality of labor supply), outcomes (education, health, housing and amenities) andperception (self-rated poverty); the incidence of poverty is estimated to be very high in the samplecommunities. Using regional poverty lines from 2000, inflated to 2003 prices using the Consumer PriceIndex, poverty incidence in the KALAHI-CIDSS municipalities is 80% in Albay, 68% in Capiz, 90% inZamboanga del Sur, and 81% in Agusan del Sur. This is significantly higher than the national average of 34%. The KALAHI-CIDSS municipalities in the sample, with the exception of Capiz, have higherpoverty incidence than the provincial averages, showing effective targeting of KALAHI-CIDSSresources. This is not surprising, given that the KALAHI-CIDSS was explicitly designed to targetmunicipalities with higher poverty incidence. However, it poses some problems for evaluation, becauseintervention communities are systematically measured as poorer on consumption measures thancomparison communities. Because the survey will visit the same households later, it is possible to correctfor initial conditions between intervention and comparison communities measured by the baseline.Further, while matched comparison municipalities do not have identical poverty incidence to intervention communities, they are still significantly poorer than the provincial averages.
Table 3: Poverty in KALAHI-CIDSS municipalities
Albay Capiz Zamboanga Agusan del Sur del Sur
Poverty Incidence17 (%)80.0
(47.8)18 67.8 (57.4) 89.9 (43.0) 81.0 (58.0)
Monthly PCE19 (Php) 1,004 1,113 602 860
Food/total expenditure (%)20 65.2 64.7 69.9 68.3
Self-rated poor (%) 71.8 55.7 83.4 71.6
The high poverty incidence in the sample provinces is supported by very low monthly per capitaexpenditures, ranging from Php 1,113 in the intervention group in Capiz to Php 602 in Zamboanga delSur. The two provinces in Mindanao have significantly lower per capita expenditures than Albay andCapiz. The high food share to total expenditure further shows the widespread poverty in KALAHI-CIDSSmunicipalities and the numbers for Zamboanga del Sur and Agusan del Sur again indicate that these twoprovinces are the most deprived in the sample. They also have very low consumption of income elasticfood items, as recorded during the three days of diet recall. In Zamboanga del Sur, for example, more than 90% did not consume any meat products and 87% did not consume any dairy products.
Most respondents are not only deprived by absolute measures, they also see themselves as poor. Whenasked to rate themselves as poor, non-poor or in between, a majority answered that they were poor. Thelargest number of self-rated poor is found in Zamboanga Del Sur, the province with the highest povertyincidence in absolute numbers. Only 1.1% and 1.5% of respondents in KALAHI-CIDSS municipalities in Zamboanga del Sur and Agusan del Sur, respectively, see themselves as non-poor.
17 Poverty incidence = the proportion of the population with per capita incomes below the poverty line. The poverty line used is the official poverty line for 2000, inflated to 2003 prices using the regional CPIs.18 The number in parenthesis shows the official 2000 National Statistics Coordination Board poverty incidence of the entire province (www.nscb.gov.ph). 19 PCE = per capita expenditure. The average monthly PCE for the overall sample of KALAHI-CIDSS municipalities is Php909.20 Average food share to total expenditure for overall sample of KALAHI-CIDSS municipalities = 66.8%
10
Sub-project outputs/provision of services: The use of CDD approaches and the adoption of an “openmenu” that allows communities to propose almost any type of sub-project can help reduce poverty byefficiently building human and physical assets at the local level. The hypothesis is that the KALAHI-CIDSS will provide services that villagers have often needed for decades, such as access roads, cleandrinking water, schools, health facilities, day care centers, and electricity. It is expected that improvedaccess to rural infrastructure such as roads, electrification and communication networks may result infaster diffusion of technology, enhancement of commercial and monetized transactions, increasedmobility of rural labor, and improved access to health and education services. Ultimately, this should also result in reduced poverty and improved health and education outcomes.
To assess whether the KALAHI-CIDSS is providing assets and services effectively, the baseline surveywas designed to get villagers’ pre-intervention status for access to neighboring villages, local markets,schools, and other public facilities; travel time and transport costs; water and sanitation; health conditions; and education outcomes. This information complements the data on poverty to provide morecomprehensive profiles on the KALAHI-CIDSS municipalities.
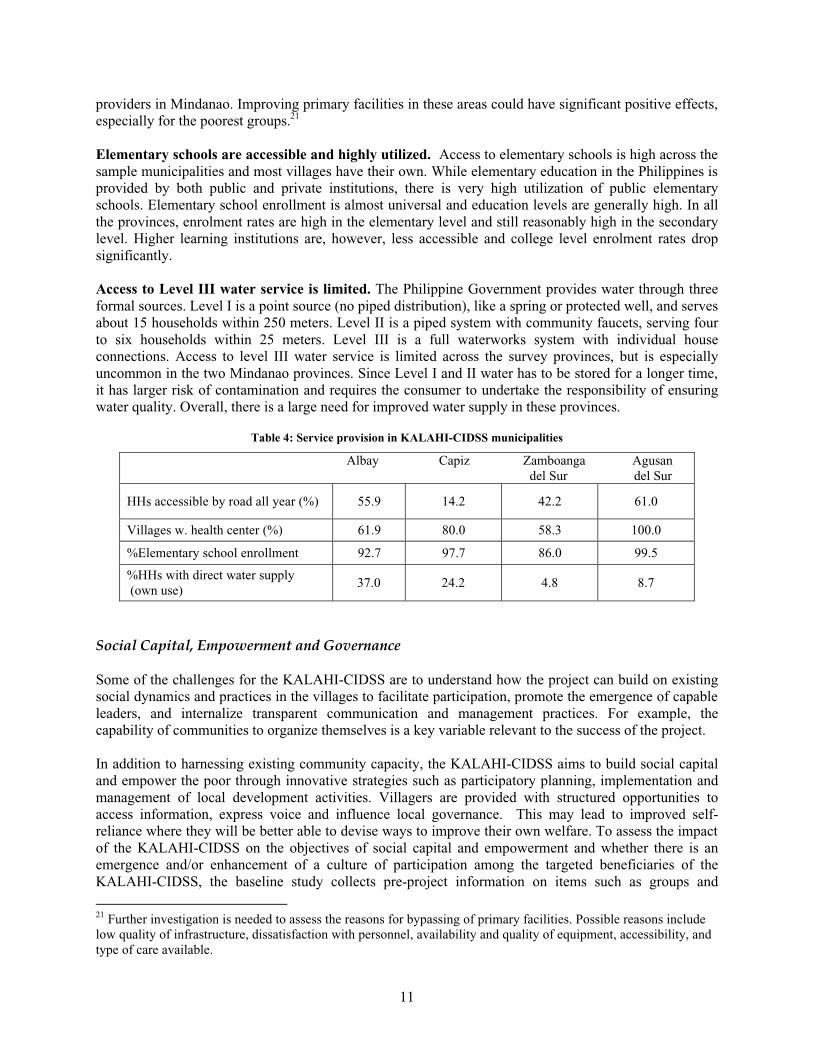
Road conditions are poor. All the KALAHI-CIDSS municipalities in the sample have relatively poorroads. While Albay has the best road conditions, more than 60 % of villages have roads of dirt or graveland only 56% of households are accessible by road all year long. In Zamboanga del Sur, one-third ofhouses are never accessible by road and only 42% of houses are accessible all year round. In Agusan delSur, almost 20% of respondents have houses that are never accessible by road and only 60% enjoy year-round access. In Capiz, less than 15% have year-round access to their houses by road, 50% have accessonly at certain times of the year, and 35% of households are inaccessible by road all year long. Becausethey inhibit communication and access to markets, health and education services, these road conditionsindicate the poor conditions in the KALAHI-CIDSS municipalities.
Primary health care facilities are accessible but frequently by-passed. Primary health care facilitiesare generally accessible and most villages have their own health stations. In Agusan del Sur, all thevillages in the sample have their own health stations while this is the case for 80% of villages inKALAHI-CIDSS municipalities in Capiz, 62% in Albay, and 58% in Zamboanga del Sur. The preferredhealth facilities are within 30 minutes away from the home of 80% of the respondents in Albay andAgusan del Sur and 75% of respondents in Capiz and Zamboanga del Sur.
Despite the easy access to village health centers, they are frequently bypassed and have low utilizationrates. This is especially true in Capiz, where of the individuals who sought health care in KALAHI-CIDSS municipalities, only 5 % went to either the health center or the village health station. In Albay,46% chose the health center or village health station when visiting a health facility. The situation is quite different in the two poorer Mindanao provinces. In Zamboanga del Sur, utilization of public healthfacilities is quite high. The village health station or health center is the most visited facility, preferred byalmost 60% of respondents, while only 12% visited private health care facilities. In Agusan del Sur, about 72% of individuals who sought health care went to the village health station/health center, while about8% prefer private health care facilities.
Interestingly, in Capiz, of the few that visited health care facilities, almost all of them appear to besatisfied with the services they get: 93% always got the needed services. In Albay, about 40% of thosewho visited a health facility always got the services they needed, 52% got the services sometimes, and 8% said they never got the needed services. In Mindanao, where the utilization rates are highest, people areless satisfied with the services they get. In Zamboanga del Sur, only about one fourth of those who sought care always got the services they needed, and in Agusan del Sur, about 30% of respondents say theyalways get the needed services when they visit a health care facility. Higher levels of poverty and limited access to alternative health care providers might explain the continued use of primary health care
11
providers in Mindanao. Improving primary facilities in these areas could have significant positive effects, especially for the poorest groups.21
Elementary schools are accessible and highly utilized. Access to elementary schools is high across the sample municipalities and most villages have their own. While elementary education in the Philippines is provided by both public and private institutions, there is very high utilization of public elementaryschools. Elementary school enrollment is almost universal and education levels are generally high. In allthe provinces, enrolment rates are high in the elementary level and still reasonably high in the secondarylevel. Higher learning institutions are, however, less accessible and college level enrolment rates dropsignificantly.
Access to Level III water service is limited. The Philippine Government provides water through threeformal sources. Level I is a point source (no piped distribution), like a spring or protected well, and serves about 15 households within 250 meters. Level II is a piped system with community faucets, serving fourto six households within 25 meters. Level III is a full waterworks system with individual houseconnections. Access to level III water service is limited across the survey provinces, but is especiallyuncommon in the two Mindanao provinces. Since Level I and II water has to be stored for a longer time, it has larger risk of contamination and requires the consumer to undertake the responsibility of ensuringwater quality. Overall, there is a large need for improved water supply in these provinces.
Table 4: Service provision in KALAHI-CIDSS municipalities
Albay Capiz Zamboanga Agusan del Sur del Sur
HHs accessible by road all year (%) 55.9 14.2 42.2 61.0
Villages w. health center (%) 61.9 80.0 58.3 100.0
%Elementary school enrollment 92.7 97.7 86.0 99.5
%HHs with direct water supply (own use)
37.0 24.2 4.8 8.7
Social Capital, Empowerment and Governance
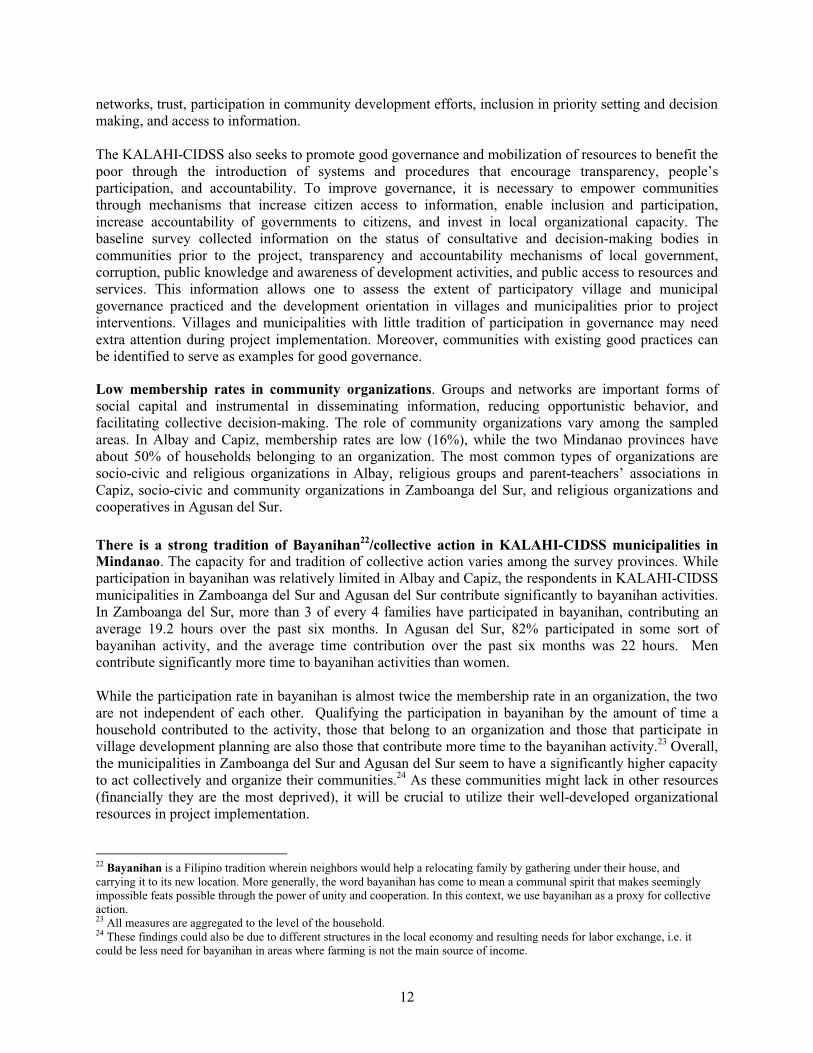
Some of the challenges for the KALAHI-CIDSS are to understand how the project can build on existingsocial dynamics and practices in the villages to facilitate participation, promote the emergence of capable leaders, and internalize transparent communication and management practices. For example, thecapability of communities to organize themselves is a key variable relevant to the success of the project.
In addition to harnessing existing community capacity, the KALAHI-CIDSS aims to build social capitaland empower the poor through innovative strategies such as participatory planning, implementation andmanagement of local development activities. Villagers are provided with structured opportunities toaccess information, express voice and influence local governance. This may lead to improved self-reliance where they will be better able to devise ways to improve their own welfare. To assess the impact of the KALAHI-CIDSS on the objectives of social capital and empowerment and whether there is anemergence and/or enhancement of a culture of participation among the targeted beneficiaries of theKALAHI-CIDSS, the baseline study collects pre-project information on items such as groups and
21 Further investigation is needed to assess the reasons for bypassing of primary facilities. Possible reasons include low quality of infrastructure, dissatisfaction with personnel, availability and quality of equipment, accessibility, and type of care available.
12
networks, trust, participation in community development efforts, inclusion in priority setting and decision making, and access to information.
The KALAHI-CIDSS also seeks to promote good governance and mobilization of resources to benefit the poor through the introduction of systems and procedures that encourage transparency, people’sparticipation, and accountability. To improve governance, it is necessary to empower communitiesthrough mechanisms that increase citizen access to information, enable inclusion and participation,increase accountability of governments to citizens, and invest in local organizational capacity. Thebaseline survey collected information on the status of consultative and decision-making bodies incommunities prior to the project, transparency and accountability mechanisms of local government,corruption, public knowledge and awareness of development activities, and public access to resources and services. This information allows one to assess the extent of participatory village and municipalgovernance practiced and the development orientation in villages and municipalities prior to projectinterventions. Villages and municipalities with little tradition of participation in governance may needextra attention during project implementation. Moreover, communities with existing good practices canbe identified to serve as examples for good governance.
Low membership rates in community organizations. Groups and networks are important forms ofsocial capital and instrumental in disseminating information, reducing opportunistic behavior, andfacilitating collective decision-making. The role of community organizations vary among the sampledareas. In Albay and Capiz, membership rates are low (16%), while the two Mindanao provinces haveabout 50% of households belonging to an organization. The most common types of organizations aresocio-civic and religious organizations in Albay, religious groups and parent-teachers’ associations inCapiz, socio-civic and community organizations in Zamboanga del Sur, and religious organizations andcooperatives in Agusan del Sur.
There is a strong tradition of Bayanihan22/collective action in KALAHI-CIDSS municipalities inMindanao. The capacity for and tradition of collective action varies among the survey provinces. Whileparticipation in bayanihan was relatively limited in Albay and Capiz, the respondents in KALAHI-CIDSSmunicipalities in Zamboanga del Sur and Agusan del Sur contribute significantly to bayanihan activities.In Zamboanga del Sur, more than 3 of every 4 families have participated in bayanihan, contributing anaverage 19.2 hours over the past six months. In Agusan del Sur, 82% participated in some sort ofbayanihan activity, and the average time contribution over the past six months was 22 hours. Mencontribute significantly more time to bayanihan activities than women.
While the participation rate in bayanihan is almost twice the membership rate in an organization, the two are not independent of each other. Qualifying the participation in bayanihan by the amount of time ahousehold contributed to the activity, those that belong to an organization and those that participate invillage development planning are also those that contribute more time to the bayanihan activity.23 Overall, the municipalities in Zamboanga del Sur and Agusan del Sur seem to have a significantly higher capacity to act collectively and organize their communities.24 As these communities might lack in other resources(financially they are the most deprived), it will be crucial to utilize their well-developed organizationalresources in project implementation.
22 Bayanihan is a Filipino tradition wherein neighbors would help a relocating family by gathering under their house, and carrying it to its new location. More generally, the word bayanihan has come to mean a communal spirit that makes seemingly impossible feats possible through the power of unity and cooperation. In this context, we use bayanihan as a proxy for collective action.23 All measures are aggregated to the level of the household.24 These findings could also be due to different structures in the local economy and resulting needs for labor exchange, i.e. it could be less need for bayanihan in areas where farming is not the main source of income.
13
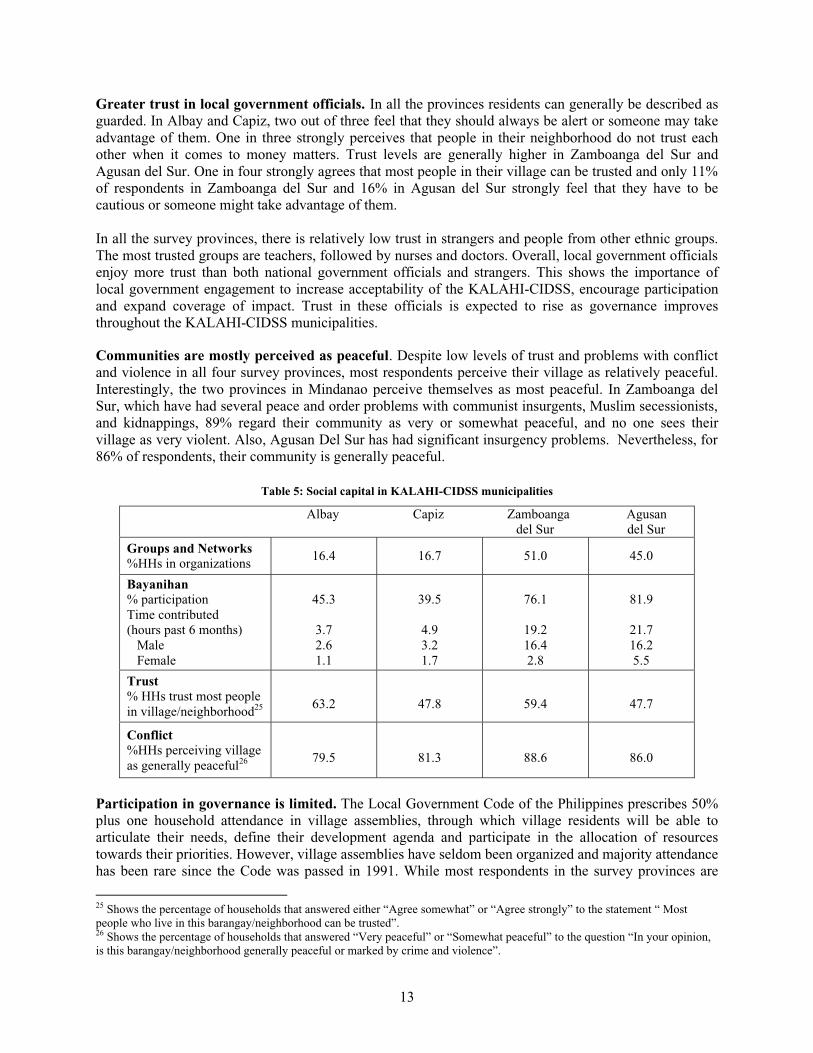
Greater trust in local government officials. In all the provinces residents can generally be described asguarded. In Albay and Capiz, two out of three feel that they should always be alert or someone may takeadvantage of them. One in three strongly perceives that people in their neighborhood do not trust eachother when it comes to money matters. Trust levels are generally higher in Zamboanga del Sur andAgusan del Sur. One in four strongly agrees that most people in their village can be trusted and only 11% of respondents in Zamboanga del Sur and 16% in Agusan del Sur strongly feel that they have to becautious or someone might take advantage of them.
In all the survey provinces, there is relatively low trust in strangers and people from other ethnic groups.The most trusted groups are teachers, followed by nurses and doctors. Overall, local government officials enjoy more trust than both national government officials and strangers. This shows the importance oflocal government engagement to increase acceptability of the KALAHI-CIDSS, encourage participationand expand coverage of impact. Trust in these officials is expected to rise as governance improvesthroughout the KALAHI-CIDSS municipalities.
Communities are mostly perceived as peaceful. Despite low levels of trust and problems with conflictand violence in all four survey provinces, most respondents perceive their village as relatively peaceful.Interestingly, the two provinces in Mindanao perceive themselves as most peaceful. In Zamboanga delSur, which have had several peace and order problems with communist insurgents, Muslim secessionists, and kidnappings, 89% regard their community as very or somewhat peaceful, and no one sees theirvillage as very violent. Also, Agusan Del Sur has had significant insurgency problems. Nevertheless, for 86% of respondents, their community is generally peaceful.
Table 5: Social capital in KALAHI-CIDSS municipalities
Albay Capiz Zamboanga Agusan del Sur del Sur
Groups and Networks%HHs in organizations
16.4 16.7 51.0 45.0
Bayanihan% participationTime contributed(hours past 6 months) Male Female
45.3
3.72.61.1
39.5
4.93.21.7
76.1
19.216.42.8
81.9
21.716.25.5
Trust% HHs trust most people in village/neighborhood25 63.2 47.8 59.4 47.7
Conflict%HHs perceiving village as generally peaceful26 79.5 81.3 88.6 86.0
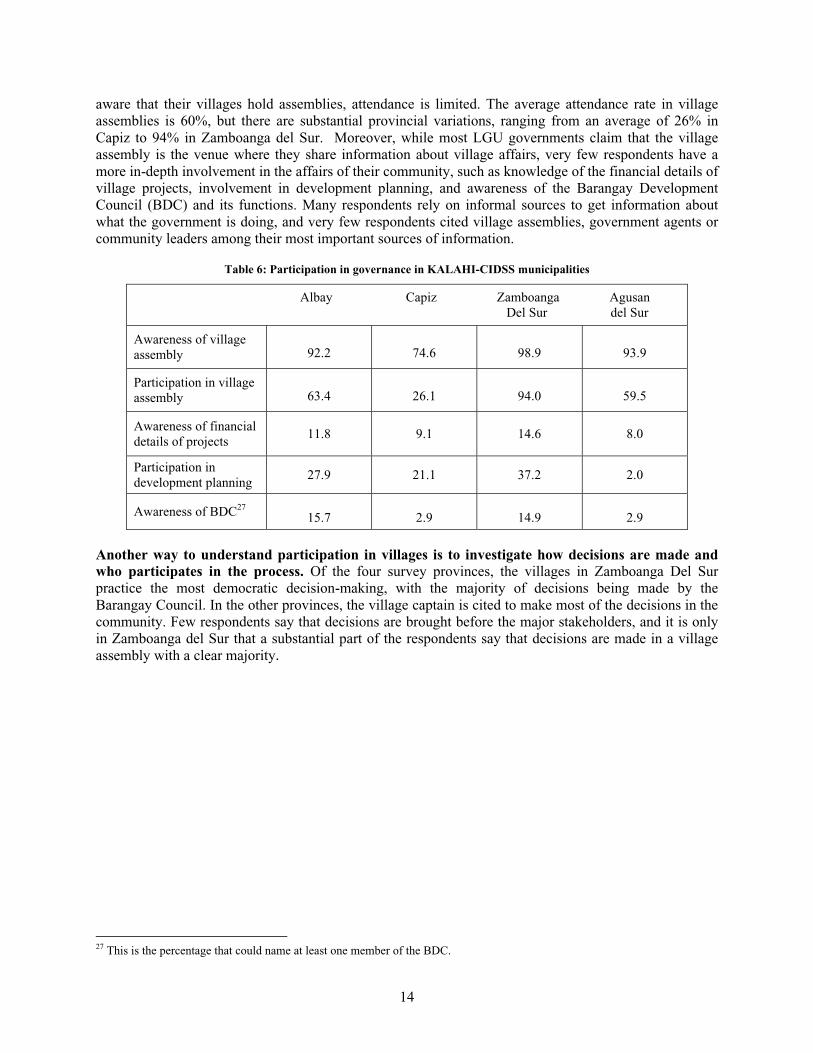
Participation in governance is limited. The Local Government Code of the Philippines prescribes 50%plus one household attendance in village assemblies, through which village residents will be able toarticulate their needs, define their development agenda and participate in the allocation of resourcestowards their priorities. However, village assemblies have seldom been organized and majority attendance has been rare since the Code was passed in 1991. While most respondents in the survey provinces are
25 Shows the percentage of households that answered either “Agree somewhat” or “Agree strongly” to the statement “ Most people who live in this barangay/neighborhood can be trusted”.26 Shows the percentage of households that answered “Very peaceful” or “Somewhat peaceful” to the question “In your opinion, is this barangay/neighborhood generally peaceful or marked by crime and violence”.
14
aware that their villages hold assemblies, attendance is limited. The average attendance rate in villageassemblies is 60%, but there are substantial provincial variations, ranging from an average of 26% inCapiz to 94% in Zamboanga del Sur. Moreover, while most LGU governments claim that the villageassembly is the venue where they share information about village affairs, very few respondents have amore in-depth involvement in the affairs of their community, such as knowledge of the financial details of village projects, involvement in development planning, and awareness of the Barangay DevelopmentCouncil (BDC) and its functions. Many respondents rely on informal sources to get information aboutwhat the government is doing, and very few respondents cited village assemblies, government agents orcommunity leaders among their most important sources of information.
Table 6: Participation in governance in KALAHI-CIDSS municipalities
Albay Capiz Zamboanga Agusan Del Sur del Sur
Awareness of village assembly 92.2 74.6 98.9 93.9
Participation in villageassembly 63.4 26.1 94.0 59.5
Awareness of financial details of projects
11.8 9.1 14.6 8.0
Participation indevelopment planning
27.9 21.1 37.2 2.0
Awareness of BDC2715.7 2.9 14.9 2.9
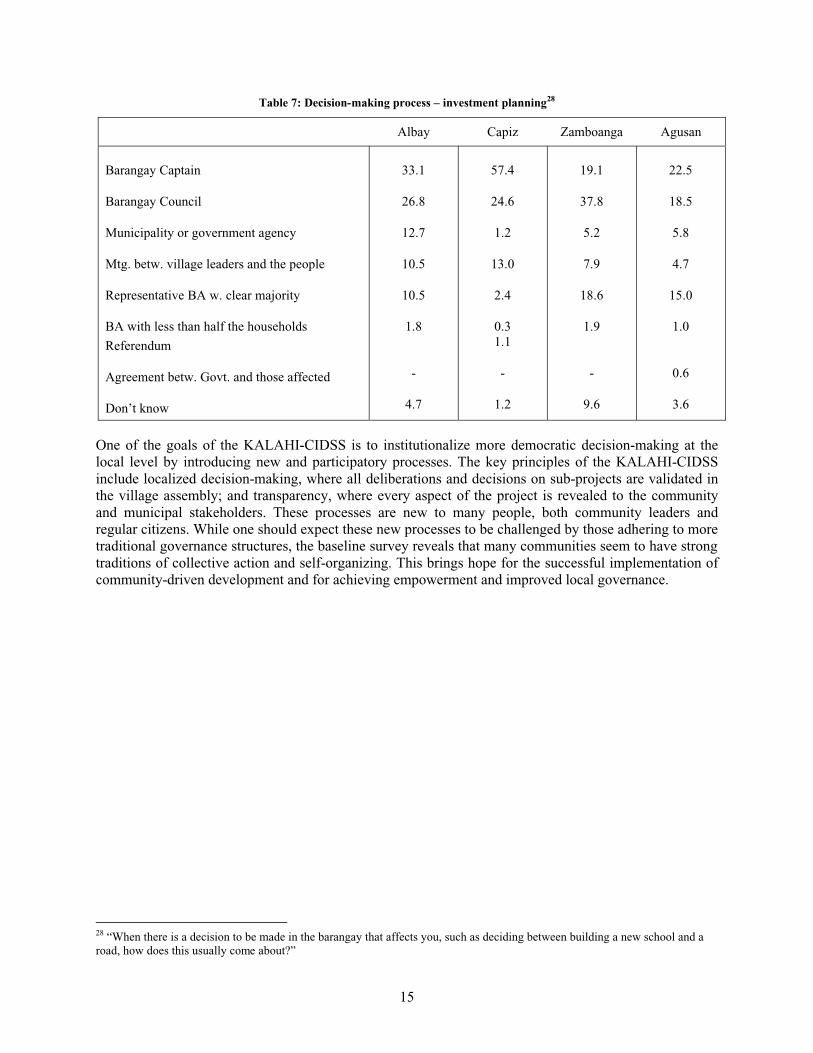
Another way to understand participation in villages is to investigate how decisions are made andwho participates in the process. Of the four survey provinces, the villages in Zamboanga Del Surpractice the most democratic decision-making, with the majority of decisions being made by theBarangay Council. In the other provinces, the village captain is cited to make most of the decisions in the community. Few respondents say that decisions are brought before the major stakeholders, and it is onlyin Zamboanga del Sur that a substantial part of the respondents say that decisions are made in a villageassembly with a clear majority.
27 This is the percentage that could name at least one member of the BDC.
15
Table 7: Decision-making process – investment planning28
Albay Capiz Zamboanga Agusan
Barangay Captain
Barangay Council
Municipality or government agency
Mtg. betw. village leaders and the people
Representative BA w. clear majority
BA with less than half the households
Referendum
Agreement betw. Govt. and those affected
Don’t know
33.1
26.8
12.7
10.5
10.5
1.8
-
4.7
57.4
24.6
1.2
13.0
2.4
0.31.1
-
1.2
19.1
37.8
5.2
7.9
18.6
1.9
-
9.6
22.5
18.5
5.8
4.7
15.0
1.0
0.6
3.6
One of the goals of the KALAHI-CIDSS is to institutionalize more democratic decision-making at thelocal level by introducing new and participatory processes. The key principles of the KALAHI-CIDSSinclude localized decision-making, where all deliberations and decisions on sub-projects are validated inthe village assembly; and transparency, where every aspect of the project is revealed to the communityand municipal stakeholders. These processes are new to many people, both community leaders andregular citizens. While one should expect these new processes to be challenged by those adhering to more traditional governance structures, the baseline survey reveals that many communities seem to have strong traditions of collective action and self-organizing. This brings hope for the successful implementation ofcommunity-driven development and for achieving empowerment and improved local governance.
28 “When there is a decision to be made in the barangay that affects you, such as deciding between building a new school and a road, how does this usually come about?”
16
Concluding Remarks: Need for Flexibility in Operations
Together with lessons learned from project implementation to date, the baseline survey for the KALAHI-CIDSS impact evaluation provides valuable information for project management. Challengingcircumstances in project areas are expected, but the extent and scope of these challenges will vary fromarea to area. The widespread absolute poverty in Zamboanga del Sur and Agusan del Sur can hinderinvolvement in the project because of high costs involved with participation (i.e., the time it takes to getinvolved could be spent on essential income-generating activities). On the other hand, these areas havesignificant social capital, especially in terms of collective action and organizational capacity, whichshould facilitate successful implementation of the project. Albay and Capiz, where poverty is alsowidespread, have communities with less tradition of acting collectively. While this may present achallenge for project implementation, project management and facilitators have a chance to use theinformation from the baseline survey to develop strategies for overcoming this gap.
A main finding of the survey is that different regions in the country vary quite substantially both in terms of poverty and in the extent of empowerment and inclusive governance. This suggests that certain areasmight require different strategies and focal points than others and underscores the importance ofmaintaining flexibility and adaptability in KALAHI-CIDSS implementation.
As large-scale programs such as the KALAHI-CIDSS institutionalize standard practices across a largenumber of diverse local areas, they can lose one of their main advantages: their demand responsiveness.Balancing scale and flexibility is a challenge to any large CDD program. It is recommended that theDSWD and the Bank continue discussions around whether the project as currently designed, implemented through 16 pre-determined steps, allows for such needed flexibility and adaptability and how the projectcan best tackle and adapt to the diversity of local conditions it will inevitably confront.29
29 In the KDP in Indonesia, for example, they ended up developing a completely different operations manual for one area (Papua) because regular operational procedures did not fit local conditions there. Other areas also made operational adaptations based on local conditions and needs.
17
References
Asia-Pacific Policy Center. 2003. Baseline Survey for the Impact Evaluation of the KALAHI-CIDSS –Sampling Design. Asia-Pacific Policy Center.
Balisacan, A. M., Edillon, G. R., and Ducanes G.M.. 2002. Poverty Mapping and Targeting for KALAHI-CIDS. Asia-Pacific Policy Center.
Balisacan, A.M. and Edillon, G. R.. 2003. Second Poverty Mapping and Targeting Study for Phases IIIand IV of KALAHI-CIDSS. Asia-Pacific Policy Center.
Bhatnagar, B. and Burkley, C.. 2004. Philippines: Kapitbisig Laban sa Kahirapan (KALAHI) Project.Shanghai conference on Scaling up Poverty Reduction 2004.
Edillon, R.G., Piza, S.F.A, and Matulo. A.. 2004. KALAHI-CIDSS:KKB Beneficiary Profile at Year 0.Asia-Pacific Policy Center.
Wassenich, P.and Whiteside, K.. 2004. CDD Impact Assessment Study: Optimizing Evaluation Designunder Constraints. World Bank Social Development Paper.
CDD Anchor .2004. CDD Briefing Note for Mr. Shengman Zhang. World Bank.
18
Annex 1: The KALAHI-CIDSS30
The KALAHI-CIDSS, a World Bank-supported community-driven development project, is the flagshippoverty alleviation project of the Government of the Philippines (GOP). The objectives of the KALAHI-CIDSS are to strengthen community participation in local governance and develop local capacity todesign, implement, and manage development activities. These objectives are pursued through threecomponents: (a) provision of community grants; (b) implementation support to strengthen formal andinformal local institutions; and (c) monitoring and evaluation.
The KALAHI-CIDSS will be implemented over six years in 4,270 villages and 177 municipalities in the42 poorest provinces of the Philippines. The provinces are selected based on poverty data from theNational Statistics and Coordination Board (NSCB). Using municipal poverty mapping developed by theAsia-Pacific Policy Center, the poorest one-fourth of all municipalities within a target province areselected to participate in the KALAHI-CIDSS. All villages in a municipality are eligible to participate inthe project.
Implementation of the KALAHI-CIDSS is divided into four phases. Phase 1 was launched in January2003 and covered 201 villages in 11 municipalities of 11 provinces. Phase 2 was launched in July 2003 in 1,302 villages and 56 municipalities of 11 additional provinces. Phase 3 will be launched in 200531 in 700 villages and 28 municipalities in 20 additional provinces and phase 4 will be launched in 2005 to coverthe remaining 53 municipalities. The total project cost of the KALAHI-CIDSS is US$182.4 million – the Bank finances US$100 million, the national Government finances US$31.4 million, and villagers andlocal governments contribute US$51 million.
The KALAHI-CIDSS is implemented through 16 steps of social preparation and capacity building,project identification, project selection, and project implementation. Each KALAHI-CIDSS village goesthrough three project cycles, each consisting of six to eight months of social preparation and four to sixmonths of project development, selection, and implementation. The 16 steps are designed tosystematically mobilize the capacity of local people to prioritize their development needs, designactivities, seek technical assistance, manage resources, and implement and sustain development actions.This organized experience in purposeful collective action—repeated three times in each targeted area—develops the capacity of poor villagers to help themselves and to engage better with local governmentsand national agencies. As this capacity develops, villagers are also expected to take a more active role inimproving the delivery of other pro-poor services.
The 16 Steps of the KALAHI-CIDSS Subproject Cycle
Step 1: Municipal OrientationThe KALAHI-CIDSS is launched in the municipality. A memorandum of understanding (MOU) is signed between the Department of Social Welfare and Development (DSWD) and the municipality. A municipalinteragency committee (MIAC) is created, which serves as a mechanism for interdepartmentalcollaboration. The area coordination team (ACT), which serves as the KALAHI-CIDSS field team in each municipality, is deployed two months prior to the municipal launch.
30 This annex draws heavily on the KALAHI-CIDSS-CIDSS primer produced by the DSWD and the paper “Philippines: KALAHI-CIDSS project” prepared by Bhuvan Bhatnagar and Clifford Burkley for the Shanghai Conference on Scaling up Poverty Reduction, 2004.31 Phase 3 implementation was originally scheduled to start in early 2004, but was delayed due to a reenactment of the 2004 National Budget.
19
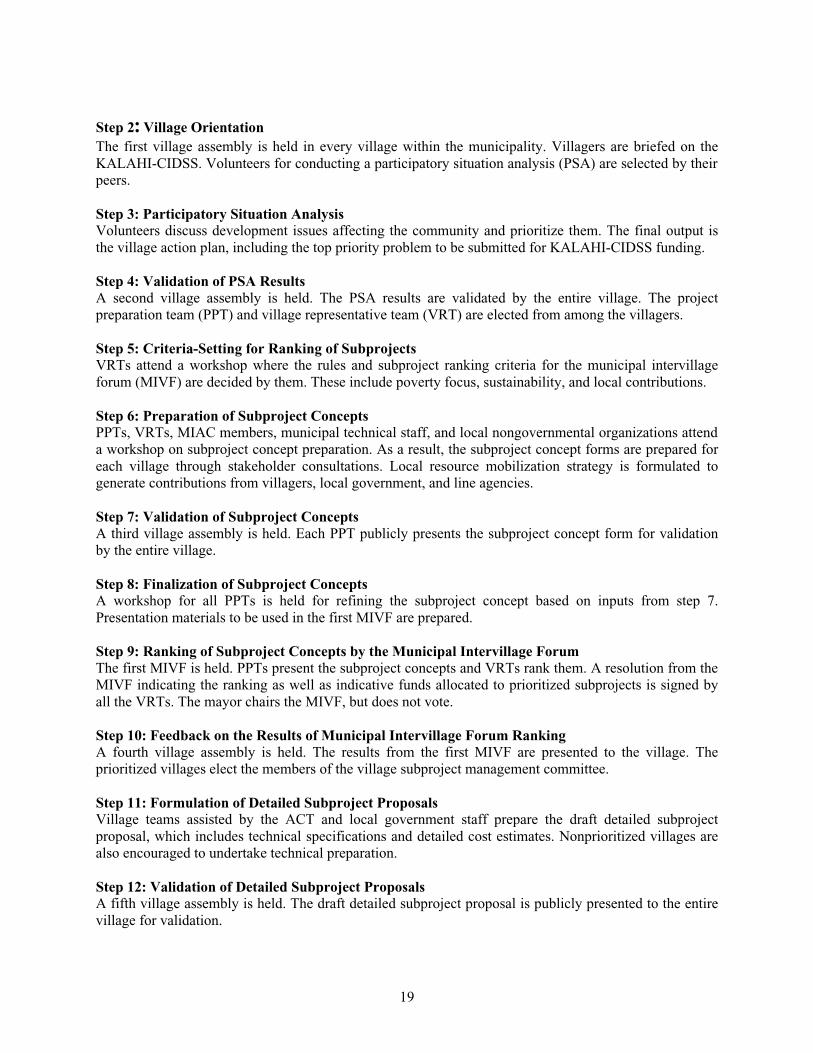
Step 2: Village OrientationThe first village assembly is held in every village within the municipality. Villagers are briefed on theKALAHI-CIDSS. Volunteers for conducting a participatory situation analysis (PSA) are selected by their peers.
Step 3: Participatory Situation AnalysisVolunteers discuss development issues affecting the community and prioritize them. The final output isthe village action plan, including the top priority problem to be submitted for KALAHI-CIDSS funding.
Step 4: Validation of PSA ResultsA second village assembly is held. The PSA results are validated by the entire village. The projectpreparation team (PPT) and village representative team (VRT) are elected from among the villagers.
Step 5: Criteria-Setting for Ranking of SubprojectsVRTs attend a workshop where the rules and subproject ranking criteria for the municipal intervillageforum (MIVF) are decided by them. These include poverty focus, sustainability, and local contributions.
Step 6: Preparation of Subproject ConceptsPPTs, VRTs, MIAC members, municipal technical staff, and local nongovernmental organizations attend a workshop on subproject concept preparation. As a result, the subproject concept forms are prepared foreach village through stakeholder consultations. Local resource mobilization strategy is formulated togenerate contributions from villagers, local government, and line agencies.
Step 7: Validation of Subproject ConceptsA third village assembly is held. Each PPT publicly presents the subproject concept form for validationby the entire village.
Step 8: Finalization of Subproject ConceptsA workshop for all PPTs is held for refining the subproject concept based on inputs from step 7.Presentation materials to be used in the first MIVF are prepared.
Step 9: Ranking of Subproject Concepts by the Municipal Intervillage ForumThe first MIVF is held. PPTs present the subproject concepts and VRTs rank them. A resolution from the MIVF indicating the ranking as well as indicative funds allocated to prioritized subprojects is signed byall the VRTs. The mayor chairs the MIVF, but does not vote.
Step 10: Feedback on the Results of Municipal Intervillage Forum RankingA fourth village assembly is held. The results from the first MIVF are presented to the village. Theprioritized villages elect the members of the village subproject management committee.
Step 11: Formulation of Detailed Subproject ProposalsVillage teams assisted by the ACT and local government staff prepare the draft detailed subprojectproposal, which includes technical specifications and detailed cost estimates. Nonprioritized villages arealso encouraged to undertake technical preparation.
Step 12: Validation of Detailed Subproject ProposalsA fifth village assembly is held. The draft detailed subproject proposal is publicly presented to the entirevillage for validation.
20
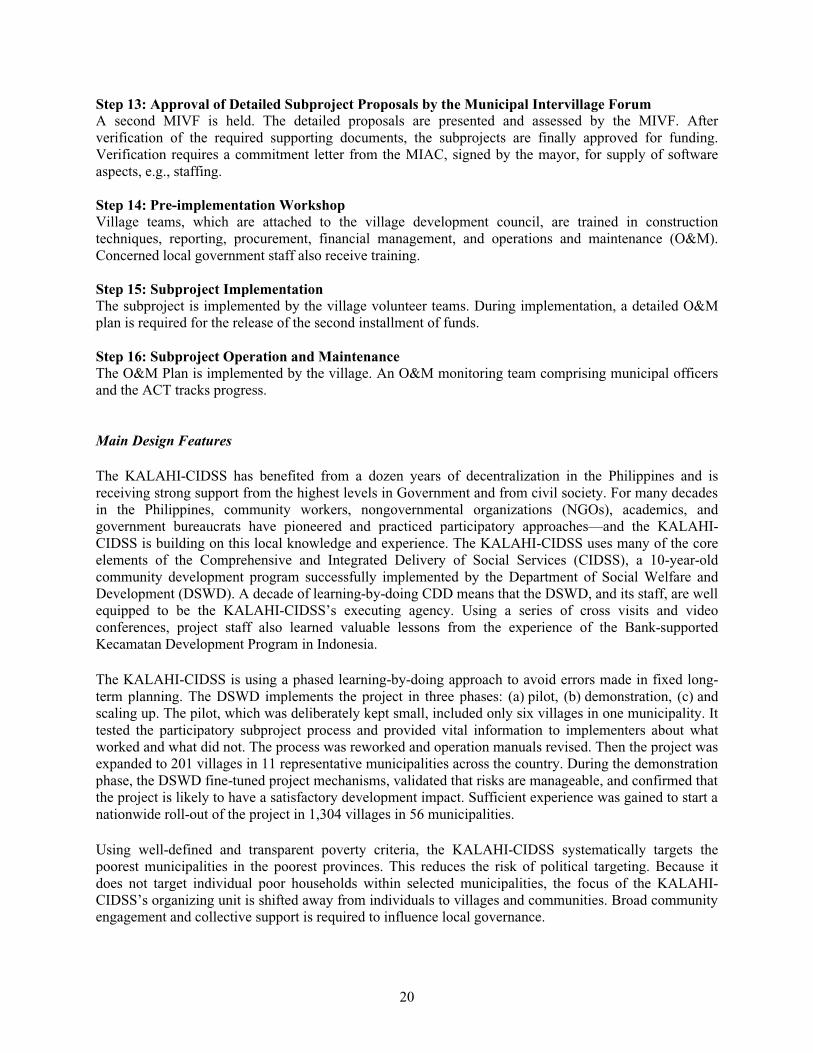
Step 13: Approval of Detailed Subproject Proposals by the Municipal Intervillage ForumA second MIVF is held. The detailed proposals are presented and assessed by the MIVF. Afterverification of the required supporting documents, the subprojects are finally approved for funding.Verification requires a commitment letter from the MIAC, signed by the mayor, for supply of softwareaspects, e.g., staffing.
Step 14: Pre-implementation WorkshopVillage teams, which are attached to the village development council, are trained in constructiontechniques, reporting, procurement, financial management, and operations and maintenance (O&M).Concerned local government staff also receive training.
Step 15: Subproject ImplementationThe subproject is implemented by the village volunteer teams. During implementation, a detailed O&Mplan is required for the release of the second installment of funds.
Step 16: Subproject Operation and MaintenanceThe O&M Plan is implemented by the village. An O&M monitoring team comprising municipal officersand the ACT tracks progress.
Main Design Features
The KALAHI-CIDSS has benefited from a dozen years of decentralization in the Philippines and isreceiving strong support from the highest levels in Government and from civil society. For many decades in the Philippines, community workers, nongovernmental organizations (NGOs), academics, andgovernment bureaucrats have pioneered and practiced participatory approaches—and the KALAHI-CIDSS is building on this local knowledge and experience. The KALAHI-CIDSS uses many of the coreelements of the Comprehensive and Integrated Delivery of Social Services (CIDSS), a 10-year-oldcommunity development program successfully implemented by the Department of Social Welfare andDevelopment (DSWD). A decade of learning-by-doing CDD means that the DSWD, and its staff, are well equipped to be the KALAHI-CIDSS’s executing agency. Using a series of cross visits and videoconferences, project staff also learned valuable lessons from the experience of the Bank-supportedKecamatan Development Program in Indonesia.
The KALAHI-CIDSS is using a phased learning-by-doing approach to avoid errors made in fixed long-term planning. The DSWD implements the project in three phases: (a) pilot, (b) demonstration, (c) andscaling up. The pilot, which was deliberately kept small, included only six villages in one municipality. It tested the participatory subproject process and provided vital information to implementers about whatworked and what did not. The process was reworked and operation manuals revised. Then the project was expanded to 201 villages in 11 representative municipalities across the country. During the demonstration phase, the DSWD fine-tuned project mechanisms, validated that risks are manageable, and confirmed that the project is likely to have a satisfactory development impact. Sufficient experience was gained to start a nationwide roll-out of the project in 1,304 villages in 56 municipalities.
Using well-defined and transparent poverty criteria, the KALAHI-CIDSS systematically targets thepoorest municipalities in the poorest provinces. This reduces the risk of political targeting. Because itdoes not target individual poor households within selected municipalities, the focus of the KALAHI-CIDSS’s organizing unit is shifted away from individuals to villages and communities. Broad community engagement and collective support is required to influence local governance.
21
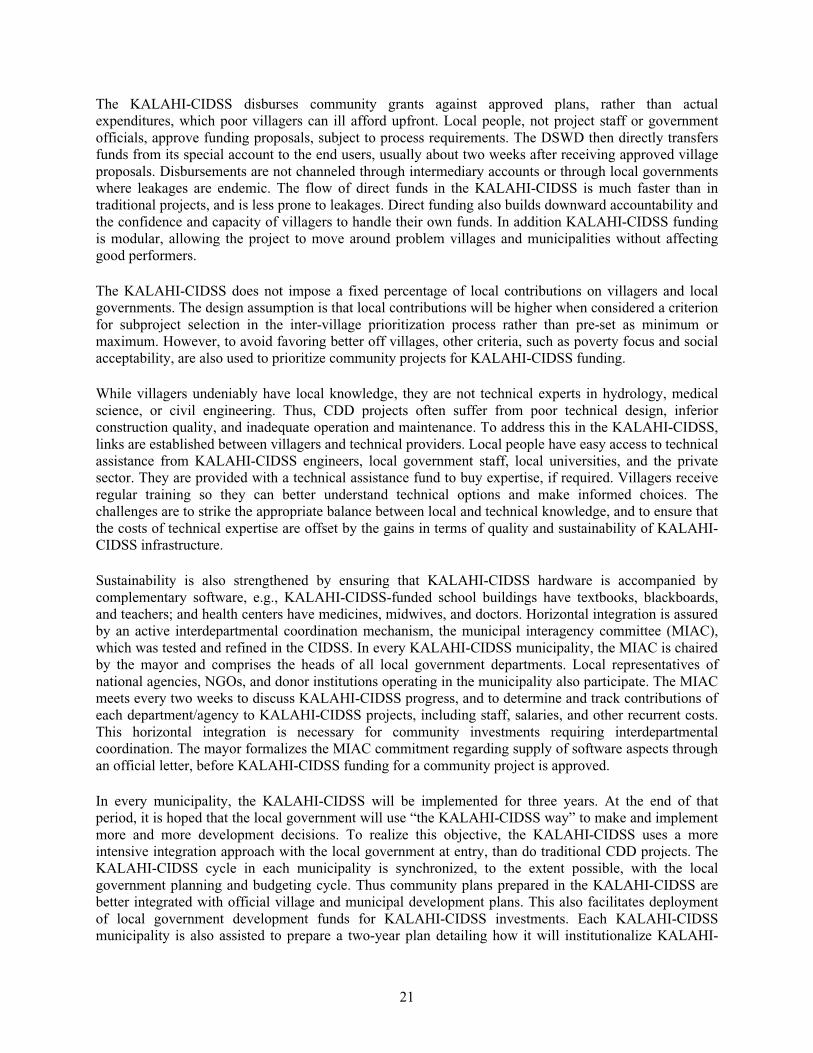
The KALAHI-CIDSS disburses community grants against approved plans, rather than actualexpenditures, which poor villagers can ill afford upfront. Local people, not project staff or governmentofficials, approve funding proposals, subject to process requirements. The DSWD then directly transfersfunds from its special account to the end users, usually about two weeks after receiving approved villageproposals. Disbursements are not channeled through intermediary accounts or through local governmentswhere leakages are endemic. The flow of direct funds in the KALAHI-CIDSS is much faster than intraditional projects, and is less prone to leakages. Direct funding also builds downward accountability and the confidence and capacity of villagers to handle their own funds. In addition KALAHI-CIDSS fundingis modular, allowing the project to move around problem villages and municipalities without affectinggood performers.
The KALAHI-CIDSS does not impose a fixed percentage of local contributions on villagers and localgovernments. The design assumption is that local contributions will be higher when considered a criterionfor subproject selection in the inter-village prioritization process rather than pre-set as minimum ormaximum. However, to avoid favoring better off villages, other criteria, such as poverty focus and socialacceptability, are also used to prioritize community projects for KALAHI-CIDSS funding.
While villagers undeniably have local knowledge, they are not technical experts in hydrology, medicalscience, or civil engineering. Thus, CDD projects often suffer from poor technical design, inferiorconstruction quality, and inadequate operation and maintenance. To address this in the KALAHI-CIDSS,links are established between villagers and technical providers. Local people have easy access to technical assistance from KALAHI-CIDSS engineers, local government staff, local universities, and the privatesector. They are provided with a technical assistance fund to buy expertise, if required. Villagers receiveregular training so they can better understand technical options and make informed choices. Thechallenges are to strike the appropriate balance between local and technical knowledge, and to ensure that the costs of technical expertise are offset by the gains in terms of quality and sustainability of KALAHI-CIDSS infrastructure.
Sustainability is also strengthened by ensuring that KALAHI-CIDSS hardware is accompanied bycomplementary software, e.g., KALAHI-CIDSS-funded school buildings have textbooks, blackboards,and teachers; and health centers have medicines, midwives, and doctors. Horizontal integration is assured by an active interdepartmental coordination mechanism, the municipal interagency committee (MIAC),which was tested and refined in the CIDSS. In every KALAHI-CIDSS municipality, the MIAC is chaired by the mayor and comprises the heads of all local government departments. Local representatives ofnational agencies, NGOs, and donor institutions operating in the municipality also participate. The MIAC meets every two weeks to discuss KALAHI-CIDSS progress, and to determine and track contributions of each department/agency to KALAHI-CIDSS projects, including staff, salaries, and other recurrent costs.This horizontal integration is necessary for community investments requiring interdepartmentalcoordination. The mayor formalizes the MIAC commitment regarding supply of software aspects through an official letter, before KALAHI-CIDSS funding for a community project is approved.
In every municipality, the KALAHI-CIDSS will be implemented for three years. At the end of thatperiod, it is hoped that the local government will use “the KALAHI-CIDSS way” to make and implement more and more development decisions. To realize this objective, the KALAHI-CIDSS uses a moreintensive integration approach with the local government at entry, than do traditional CDD projects. TheKALAHI-CIDSS cycle in each municipality is synchronized, to the extent possible, with the localgovernment planning and budgeting cycle. Thus community plans prepared in the KALAHI-CIDSS arebetter integrated with official village and municipal development plans. This also facilitates deploymentof local government development funds for KALAHI-CIDSS investments. Each KALAHI-CIDSSmunicipality is also assisted to prepare a two-year plan detailing how it will institutionalize KALAHI-
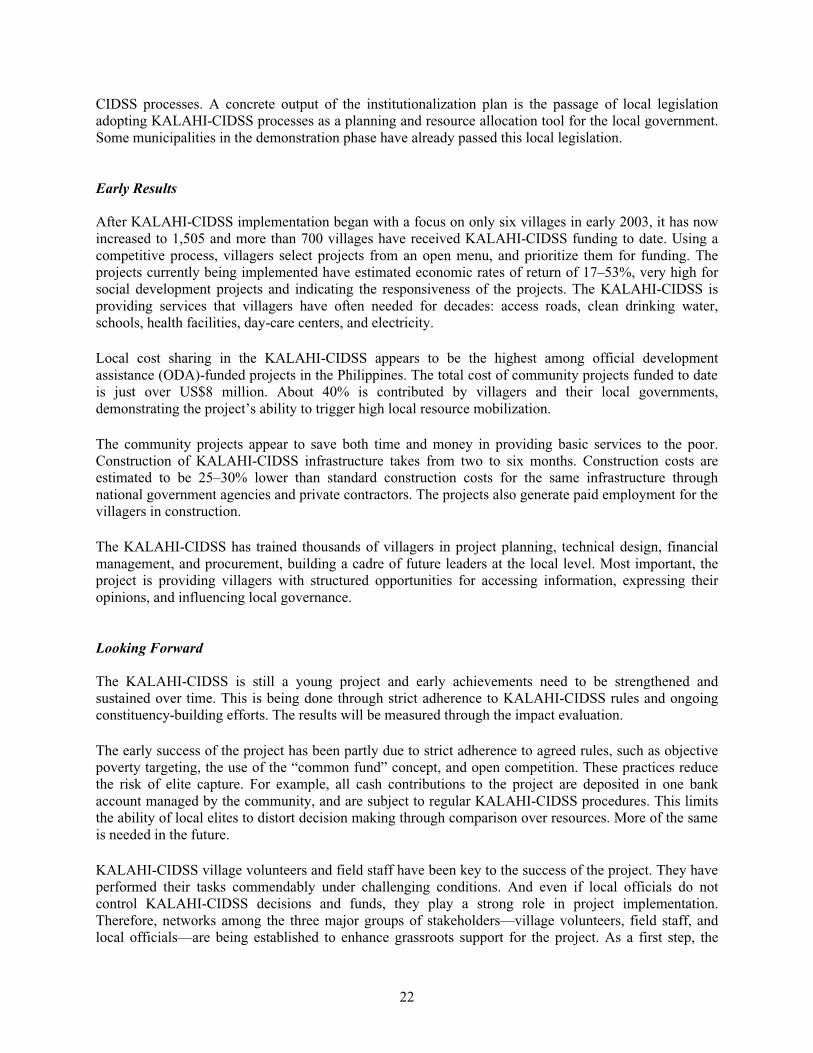
22
CIDSS processes. A concrete output of the institutionalization plan is the passage of local legislationadopting KALAHI-CIDSS processes as a planning and resource allocation tool for the local government.Some municipalities in the demonstration phase have already passed this local legislation.
Early Results
After KALAHI-CIDSS implementation began with a focus on only six villages in early 2003, it has nowincreased to 1,505 and more than 700 villages have received KALAHI-CIDSS funding to date. Using acompetitive process, villagers select projects from an open menu, and prioritize them for funding. Theprojects currently being implemented have estimated economic rates of return of 17–53%, very high forsocial development projects and indicating the responsiveness of the projects. The KALAHI-CIDSS isproviding services that villagers have often needed for decades: access roads, clean drinking water,schools, health facilities, day-care centers, and electricity.
Local cost sharing in the KALAHI-CIDSS appears to be the highest among official developmentassistance (ODA)-funded projects in the Philippines. The total cost of community projects funded to date is just over US$8 million. About 40% is contributed by villagers and their local governments,demonstrating the project’s ability to trigger high local resource mobilization.
The community projects appear to save both time and money in providing basic services to the poor.Construction of KALAHI-CIDSS infrastructure takes from two to six months. Construction costs areestimated to be 25–30% lower than standard construction costs for the same infrastructure throughnational government agencies and private contractors. The projects also generate paid employment for the villagers in construction.
The KALAHI-CIDSS has trained thousands of villagers in project planning, technical design, financialmanagement, and procurement, building a cadre of future leaders at the local level. Most important, theproject is providing villagers with structured opportunities for accessing information, expressing theiropinions, and influencing local governance.
Looking Forward
The KALAHI-CIDSS is still a young project and early achievements need to be strengthened andsustained over time. This is being done through strict adherence to KALAHI-CIDSS rules and ongoingconstituency-building efforts. The results will be measured through the impact evaluation.
The early success of the project has been partly due to strict adherence to agreed rules, such as objectivepoverty targeting, the use of the “common fund” concept, and open competition. These practices reducethe risk of elite capture. For example, all cash contributions to the project are deposited in one bankaccount managed by the community, and are subject to regular KALAHI-CIDSS procedures. This limitsthe ability of local elites to distort decision making through comparison over resources. More of the same is needed in the future.
KALAHI-CIDSS village volunteers and field staff have been key to the success of the project. They have performed their tasks commendably under challenging conditions. And even if local officials do notcontrol KALAHI-CIDSS decisions and funds, they play a strong role in project implementation.Therefore, networks among the three major groups of stakeholders—village volunteers, field staff, andlocal officials—are being established to enhance grassroots support for the project. As a first step, the
23
DSWD has organized a series of regional workshops, followed by a national workshop, which broughtkey stakeholders together to share experience and develop mechanisms for future networking. Thesenetworks are expected to keep the project going even as the local officials themselves change. TheKALAHI-CIDSS management team is also continuing to expand ownership of the project among DSWD staff, as the project is a mainstreamed program, not an adjunct operation. These measures should ensuresustainability of the project within DSWD beyond the current leadership.
The DSWD is committed to a careful evaluation of the KALAHI-CIDSS to determine the impacts of theproject on community empowerment, local governance, and poverty reduction. This impact evaluationcollects “with-without” data in a representative sample of both intervention groups and matchedcomparison groups. As a source of ex-ante information for the KALAHI-CIDSS, a quantitative baselinesurvey was implemented in municipalities in 2003, where the project had not yet started. This served asthe first round of a panel survey that will also track 2,400 households in 132 villages during and afterproject implementation. Over time, the results will confirm whether the KALAHI-CIDSS has lived up toits early promise, or not.
24
Annex 2: Sampling Design
The baseline survey for the impact evaluation of the KALAHI-CIDSS was the first round of a panel survey that will track households before, during, and after project implementation. It was conducted by the Asia-Pacific Policy Center in each of the three geographical areas of the Philippines, covering four provinces included in Phase 3 of KALAHI-CIDSS implementation: Albay in Luzon, Capiz in the Visayas, and Zamboanga del Sur and Agusan del Sur in Mindanao. The respondents for the surveys were selected using multi-stage stratified random sampling. To measure the KALAHI-CIDSS’s impact effectively, the survey sampled both communities that will participate in the project (the intervention group) and communities that will not participate (the comparison group). Information coming from the comparison group will help estimate counterfactual information, i.e., “What would have happened to the beneficiaries had they not been included in the KALAHI-CIDSS?”
Sampling of Municipalities
The sampling design for the impact evaluation mirrored the KALAHI-CIDSS targeting procedures: withdetailed information about the process used to select participant municipalities, the survey could establish representative intervention and comparison groups. Implemented in the 42 poorest provinces in thecountry, the KALAHI-CIDSS covers municipalities belonging to the bottom 25% in each province. Theselection is based on a poverty ranking developed by Balisacan et al.32 For the purpose of the baselinesurvey, intervention municipalities were selected from this bottom quartile. A municipality was excluded from the intervention sample if: 1) it will not participate in Phase 3 of KALAHI-CIDSS implementation;2) it has unique characteristics that would make it impossible to identify appropriately matchedcomparison communities; or 3) it presents implementation difficulties that would make it particularlydangerous for survey teams to work in the area. Sampling from participating, non-excludedmunicipalities in each of the country’s geographic areas, the following intervention municipalities wereidentified: Pio Duran and Libon in Albay; Ma-ayon and Dumarao in Capiz; Dinas and San Pablo inZamboanga del Sur; and Esperanza and San Luis in Agusan del Sur.
Comparison Municipality Selection
Having selected the intervention municipalities, each was matched with a similar municipality that willnot participate in the KALAHI-CIDSS. To identify these comparison municipalities, a cluster analysiswas done of all municipalities per province. A statistical method called cluster analysis was used tocluster municipalities within each province according to their observed characteristics. Many impactevaluations use propensity score matching to identify comparison communities similar to interventioncommunities. KALAHI-CIDSS’s targeting procedures made classic propensity score matchingtechniques impossible. The poverty ranking results from regression analysis that predicts a municipalpoverty score based on indicators on human capital, housing and amenities, and accessibility conditions.Only those municipalities in the bottom quartile of the poverty ranking are eligible to participate in theKALAHI-CIDSS. This targeting procedure creates a very distinct cut-off for the probability that amunicipality will participate in the program. If its poverty indicators lead a municipality to be ranked inthe bottom quartile of a province, then the municipality is almost certain to participate. If those indicators
32 A full description of the poverty mapping for the KALAHI-CIDSS is described in “Poverty Mapping and Targeting for KALAHI-CIDSS-CIDSS” by Arsenio M. Balisacan, Rosemarie G. Edillon, and Geoffrey M. Ducanes and in “Second Poverty Mapping and Targeting Study for Phases III and IV of KALAHI-CIDSS-CIDSS” by Arsenio M. Balisacan and Rosemarie G. Edillon.

25
rank it above the 25 percentile line, it is certain not to participate. This procedure clearly distinguishesparticipants from non-participants, based on observed indicators. Thus, one cannot match intervention and comparison municipalities based on similarities in the probability that they will participate in theKALAHI-CIDSS: when we seek to generate a propensity score based on observed indicators, thetargeting algorithm implies that all participating municipalities have propensity scores of 1 and all non-participating municipalities have propensity scores of 0. Hence, in an extreme example of the “commonsupport problem”, there is no way to match municipalities based on the “nearest propensity scoreneighbor”. Because it is non-parametric, the cluster analysis allows us to identify the econometric modelbased on differences in the functional form of the poverty ranking versus the clustering. Further, thecluster analysis includes two additional variables (population and land area of the municipality) that allow additional identification from exclusion restrictions. The cluster analysis allows us to group similarcommunities without using a propensity score. It is then possible to match each sampled municipality that participates in the KALAHI-CIDSS with a similar one that does not.
The variables used for the cluster analysis are primarily the same as those used in the municipal mappingand targeting developed by Balisacan, Edillon, and Ducanes:
Table A2.1: Component Variables of Poverty Ranking
WeightProportion of households with electricity 4.41
Proportion of households with water-sealed toilets 2.83
Proportion of households with access to level III water systems
4.56
Proportion of houses with roofs made of strong materials
4.27
Proportion of houses with walls made of strong materials
7.47
Proportion of household members aged 0-6 years old 23.70
Proportion of household members aged 7-14 years 18.05
Proportion of household members aged 15-24 years 5.96
Proportion of household members aged 25 and over 0.08
Educational attainment of all members in the family relative to potential (based on age profile)
8.28
Density of good village roads that are passable all year round
10.00
Distance from municipality center to the “center of trade”
10.00
Two additional variables are included in the cluster analysis: the population and land area of themunicipality. These variables are important factors when determining the Internal Revenue Allotment(IRA) of a municipality. The IRA makes up more than 80% of the financial resources available to thelocal government unit.
An “agglomerative hierarchical procedure” was followed to produce the clusters: it begins with as many clusters as observations. Then, clusters are systematically merged with those closest in Pythagoreandistance along the various dimensions specified by relevant indicators. The selected comparison
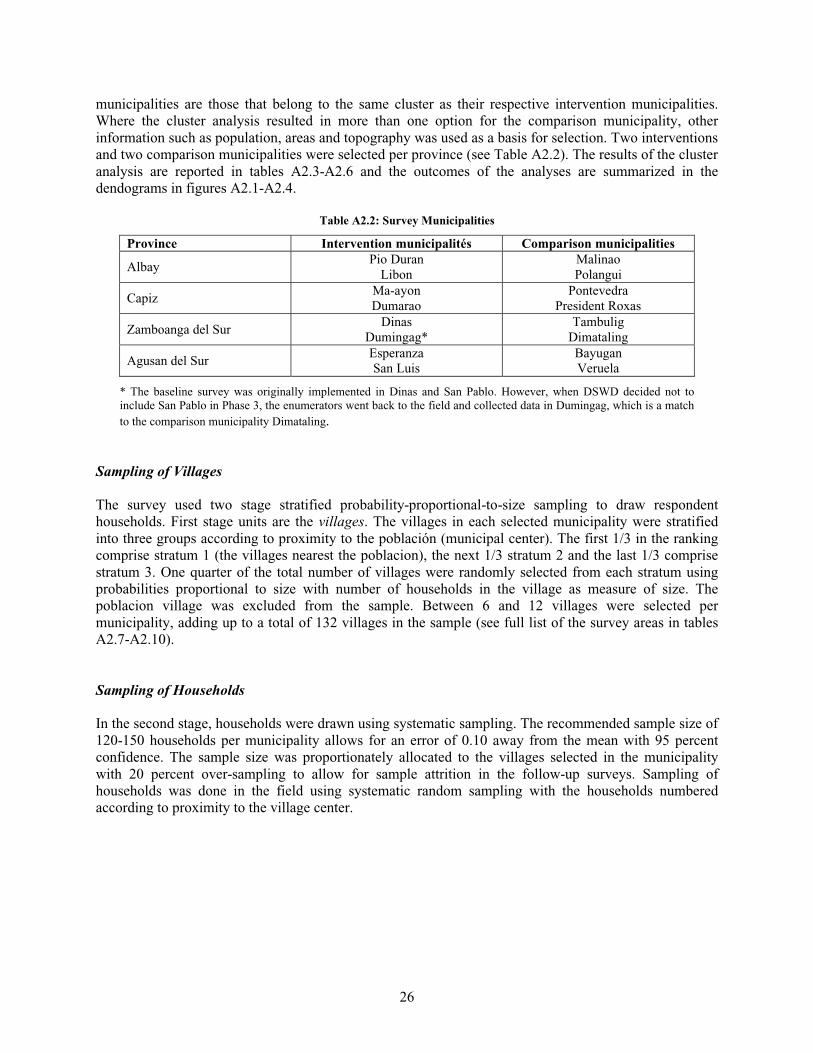
26
municipalities are those that belong to the same cluster as their respective intervention municipalities.Where the cluster analysis resulted in more than one option for the comparison municipality, otherinformation such as population, areas and topography was used as a basis for selection. Two interventions and two comparison municipalities were selected per province (see Table A2.2). The results of the cluster analysis are reported in tables A2.3-A2.6 and the outcomes of the analyses are summarized in thedendograms in figures A2.1-A2.4.
Table A2.2: Survey Municipalities
Province Intervention municipalités Comparison municipalities
AlbayPio Duran
LibonMalinaoPolangui
CapizMa-ayonDumarao
PontevedraPresident Roxas
Zamboanga del SurDinas
Dumingag*Tambulig
Dimataling
Agusan del SurEsperanzaSan Luis
BayuganVeruela
* The baseline survey was originally implemented in Dinas and San Pablo. However, when DSWD decided not toinclude San Pablo in Phase 3, the enumerators went back to the field and collected data in Dumingag, which is a match to the comparison municipality Dimataling.
Sampling of Villages
The survey used two stage stratified probability-proportional-to-size sampling to draw respondenthouseholds. First stage units are the villages. The villages in each selected municipality were stratifiedinto three groups according to proximity to the población (municipal center). The first 1/3 in the rankingcomprise stratum 1 (the villages nearest the poblacion), the next 1/3 stratum 2 and the last 1/3 comprisestratum 3. One quarter of the total number of villages were randomly selected from each stratum usingprobabilities proportional to size with number of households in the village as measure of size. Thepoblacion village was excluded from the sample. Between 6 and 12 villages were selected permunicipality, adding up to a total of 132 villages in the sample (see full list of the survey areas in tablesA2.7-A2.10).
Sampling of Households
In the second stage, households were drawn using systematic sampling. The recommended sample size of 120-150 households per municipality allows for an error of 0.10 away from the mean with 95 percentconfidence. The sample size was proportionately allocated to the villages selected in the municipalitywith 20 percent over-sampling to allow for sample attrition in the follow-up surveys. Sampling ofhouseholds was done in the field using systematic random sampling with the households numberedaccording to proximity to the village center.
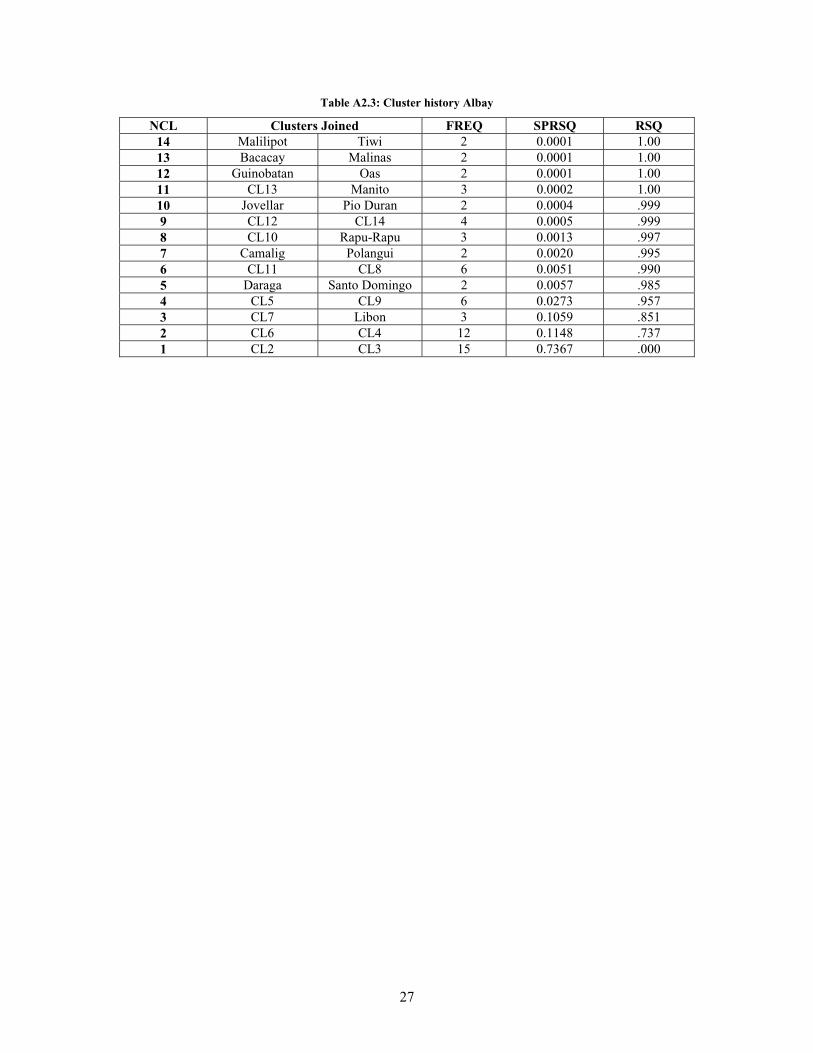
27
Table A2.3: Cluster history Albay
NCL Clusters Joined FREQ SPRSQ RSQ14 Malilipot Tiwi 2 0.0001 1.0013 Bacacay Malinas 2 0.0001 1.0012 Guinobatan Oas 2 0.0001 1.0011 CL13 Manito 3 0.0002 1.0010 Jovellar Pio Duran 2 0.0004 .9999 CL12 CL14 4 0.0005 .9998 CL10 Rapu-Rapu 3 0.0013 .9977 Camalig Polangui 2 0.0020 .9956 CL11 CL8 6 0.0051 .9905 Daraga Santo Domingo 2 0.0057 .9854 CL5 CL9 6 0.0273 .9573 CL7 Libon 3 0.1059 .8512 CL6 CL4 12 0.1148 .7371 CL2 CL3 15 0.7367 .000
28
Figure A2.1 Results of the Cluster Analysis
29
Table A2.4: Cluster history Capiz
NCL Clusters joined FREQ SPRSQ RSQ15 Dumalag Mambusao 2 0.0007 .99914 Ma-ayon Pontevedra 2 0.0012 .99813 Panay Panitan 2 0.0015 .99712 Dao Ivisan 2 0.0016 .99511 CL15 Pilar 3 0.0028 .99210 Cuartero CL13 3 0.0028 .9899 CL12 President
Roxas3 0.0029 .987
8 CL14 Tapaz 3 0.0032 .9837 CL10 CL8 6 0.0067 .9776 CL11 Jamindan 4 0.0080 .9695 CL9 Dumarao 4 0.0088 .9604 Sapian Sigma 2 0.0228 .9373 CL7 CL6 10 0,0315 .9062 CL3 CL5 14 0.1962 .7091 CL2 CL4 16 0.7093 .000
30
Figure A2.2 Results of the Cluster Anlaysis
31
Table A2.5 Cluster History Zamboga del Sur
NCL Clusters Joined FREQ SPRSQ RSQ25 Dimataling SanPablo 2 0.0000 1.0024 Pitogo Tabina 2 0.0000 1.0023 Labangan Mahayag 2 0.0000 1.0022 CL24 Sominot(DonM.Marcos) 3 0.0000 1.0021 CL22 SanMiguel 4 0.0000 1.0020 CL25 Kumalarang 3 0.0000 1.0019 Josefina RamonMagsaysay 2 0.0000 1.0018 Aurora CL23 3 0.0000 1.0017 CL20 CL21 7 0.0000 1.0016 Dinas Tambulig 2 0.0000 1.0015 CL17 VincenzoA.Sagun 8 0.0000 1.0014 Guipos CL19 3 0.0000 1.0013 Lapuyan Midsalip 2 0.0000 1.0012 CL15 CL13 10 0.0001 1.0011 CL18 CL16 5 0.0001 .99910 CL12 CL14 13 0.0001 .9999 Bayog Molave 2 0.0002 .9998 CL10 Tigbao 14 0.0002 .9997 CL11 Dumingag 6 0.0002 .9996 CL7 CL8 20 0.0004 .9985 CL6 CL9 22 0.0020 .9964 Dumalinao Margosatubig 2 0.0032 .9933 CL5 Lakewood 23 0.0076 .9862 CL3 CL4 25 0.0941 .8911 CL2 Tukuran 26 0.8914 .000
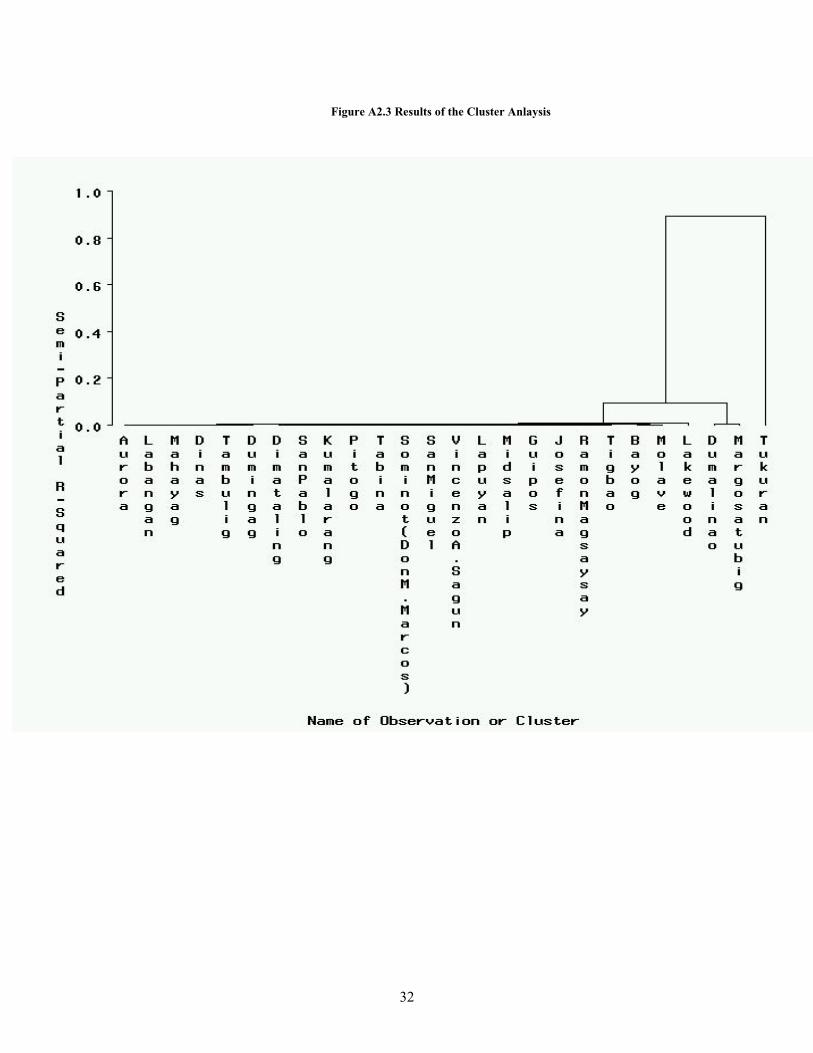
32
Figure A2.3 Results of the Cluster Anlaysis
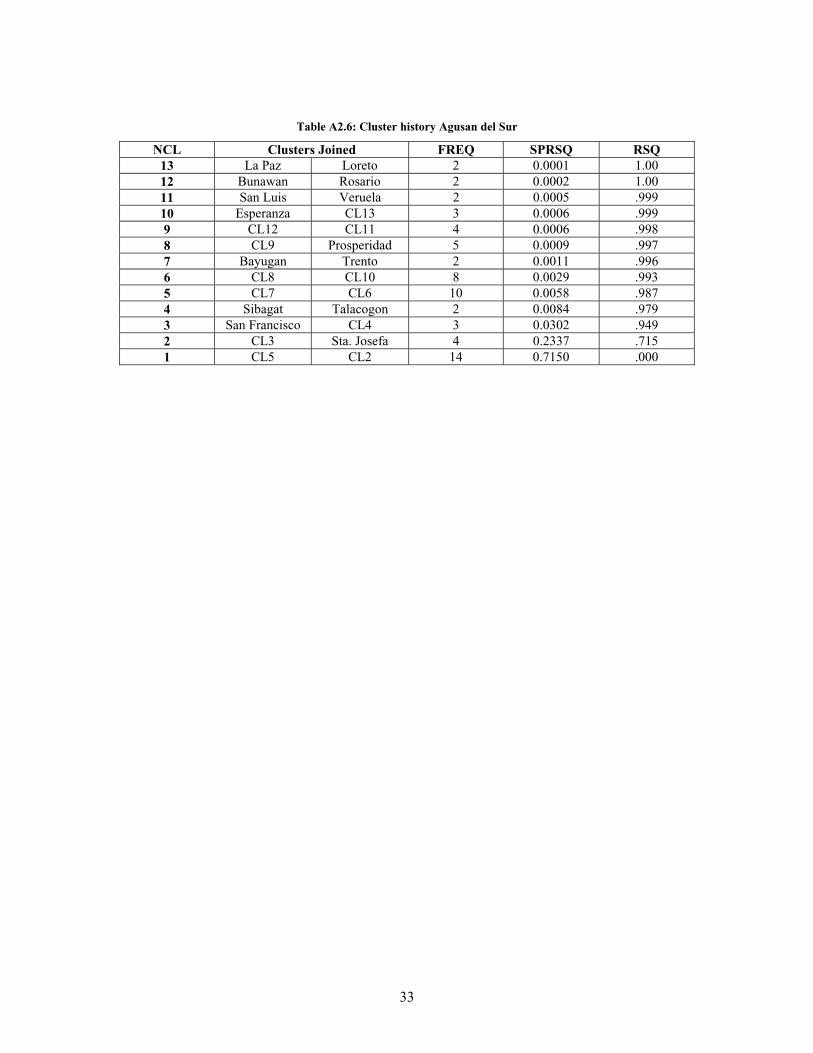
33
Table A2.6: Cluster history Agusan del Sur
NCL Clusters Joined FREQ SPRSQ RSQ13 La Paz Loreto 2 0.0001 1.0012 Bunawan Rosario 2 0.0002 1.0011 San Luis Veruela 2 0.0005 .99910 Esperanza CL13 3 0.0006 .9999 CL12 CL11 4 0.0006 .9988 CL9 Prosperidad 5 0.0009 .9977 Bayugan Trento 2 0.0011 .9966 CL8 CL10 8 0.0029 .9935 CL7 CL6 10 0.0058 .9874 Sibagat Talacogon 2 0.0084 .9793 San Francisco CL4 3 0.0302 .9492 CL3 Sta. Josefa 4 0.2337 .7151 CL5 CL2 14 0.7150 .000
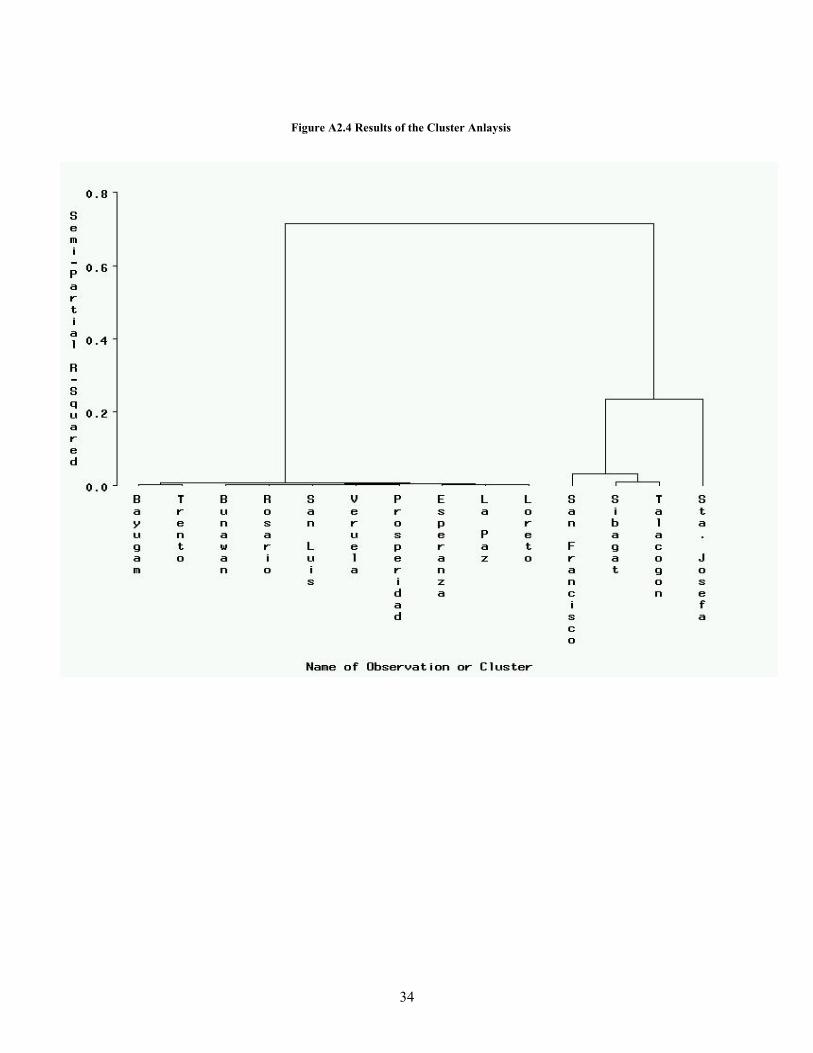
34
Figure A2.4 Results of the Cluster Anlaysis
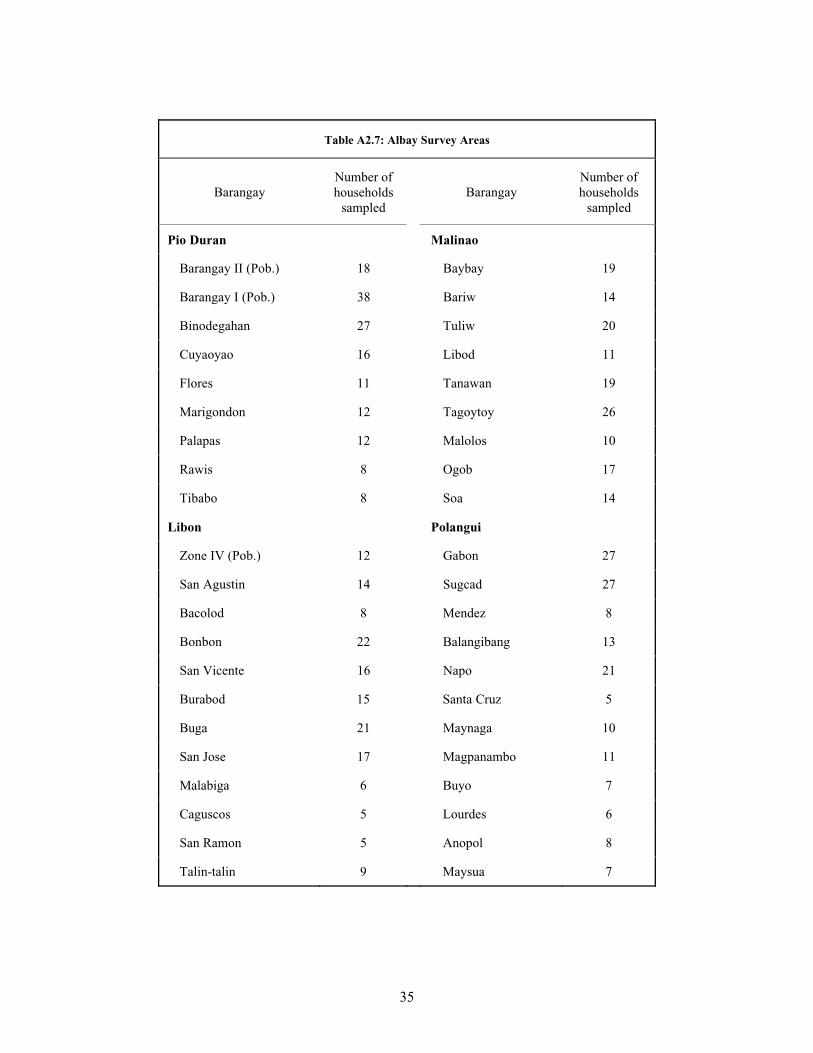
35
Table A2.7: Albay Survey Areas
BarangayNumber of households
sampledBarangay
Number of households
sampled
Pio Duran Malinao
Barangay II (Pob.) 18 Baybay 19
Barangay I (Pob.) 38 Bariw 14
Binodegahan 27 Tuliw 20
Cuyaoyao 16 Libod 11
Flores 11 Tanawan 19
Marigondon 12 Tagoytoy 26
Palapas 12 Malolos 10
Rawis 8 Ogob 17
Tibabo 8 Soa 14
Libon Polangui
Zone IV (Pob.) 12 Gabon 27
San Agustin 14 Sugcad 27
Bacolod 8 Mendez 8
Bonbon 22 Balangibang 13
San Vicente 16 Napo 21
Burabod 15 Santa Cruz 5
Buga 21 Maynaga 10
San Jose 17 Magpanambo 11
Malabiga 6 Buyo 7
Caguscos 5 Lourdes 6
San Ramon 5 Anopol 8
Talin-talin 9 Maysua 7
36
Table A2.8: Capiz Survey Areas
BarangayNumber of households
sampledBarangay
Number of households
sampled
Ma-ayon Pontevedra
Palaguian 24 Ilaya (Pob.) 20
Cabungahan 29 Sublangon 38
New Guia 24 Linampongan 23
Quevedo 24 Jolongajog 39
Maalan 18 Intungcan 22
Canapian 31 Cabugao 7
Dumarao President Roxas
Codingle 16 Aranguel 19
Guinotos 9 Pantalan 20
Ongoli Ilaya 11 Cabugcabug 21
Tinaytayan 16 Ibaca 19
San Juan 11 Culilang 5
Dangula 14 Santo Nino 2
Gibato 26 Vizcaya 28
Astorga 34 Goce 11
Tina 14 Badiangon 25
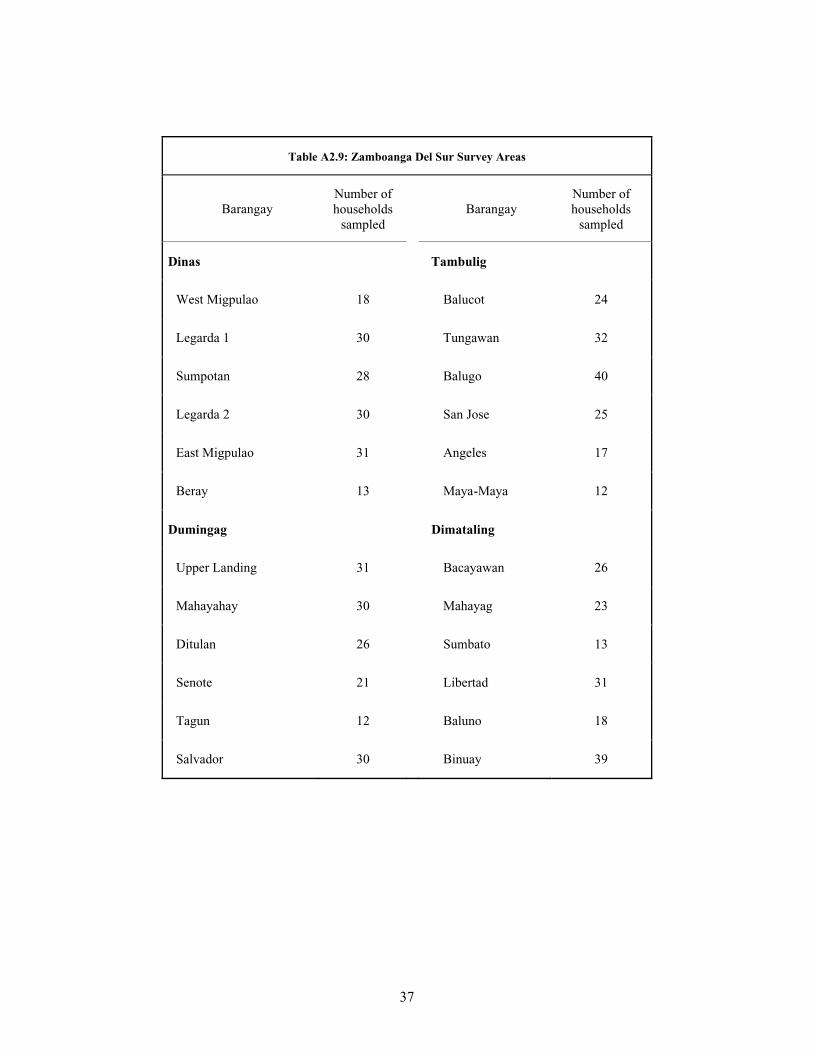
37
Table A2.9: Zamboanga Del Sur Survey Areas
BarangayNumber of households
sampledBarangay
Number of households
sampled
Dinas Tambulig
West Migpulao 18 Balucot 24
Legarda 1 30 Tungawan 32
Sumpotan 28 Balugo 40
Legarda 2 30 San Jose 25
East Migpulao 31 Angeles 17
Beray 13 Maya-Maya 12
Dumingag Dimataling
Upper Landing 31 Bacayawan 26
Mahayahay 30 Mahayag 23
Ditulan 26 Sumbato 13
Senote 21 Libertad 31
Tagun 12 Baluno 18
Salvador 30 Binuay 39
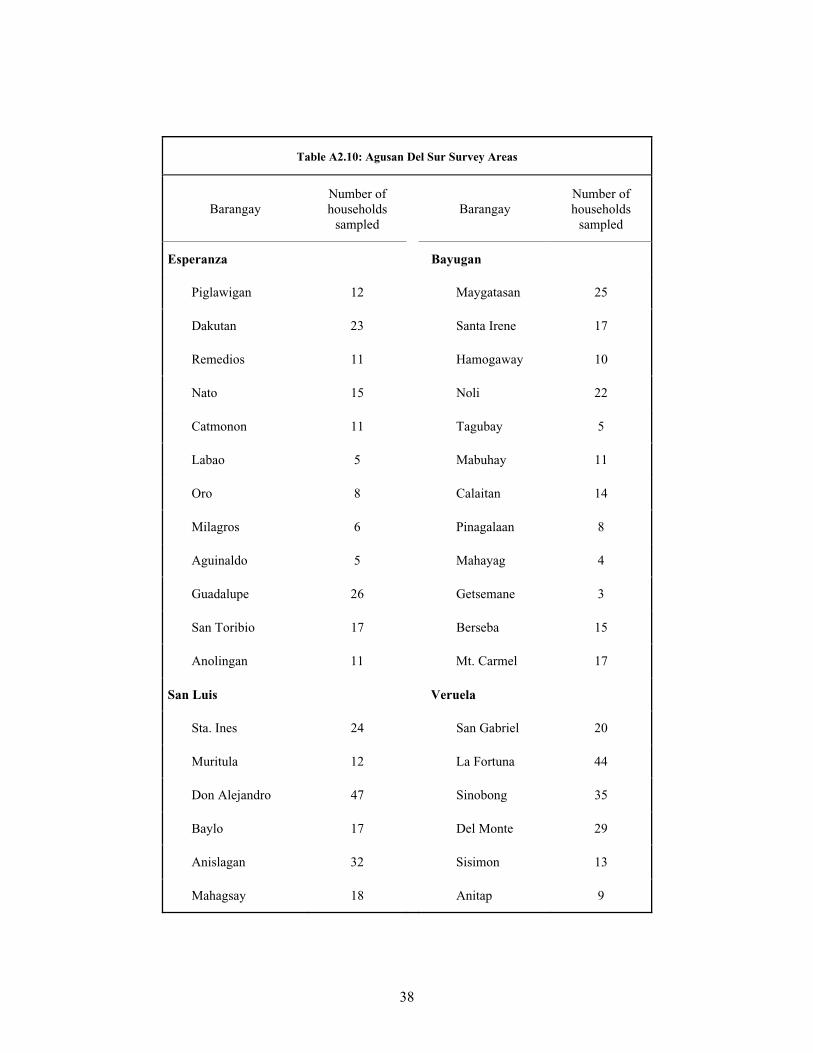
38
Table A2.10: Agusan Del Sur Survey Areas
BarangayNumber of households
sampledBarangay
Number ofhouseholds
sampled
Esperanza Bayugan
Piglawigan 12 Maygatasan 25
Dakutan 23 Santa Irene 17
Remedios 11 Hamogaway 10
Nato 15 Noli 22
Catmonon 11 Tagubay 5
Labao 5 Mabuhay 11
Oro 8 Calaitan 14
Milagros 6 Pinagalaan 8
Aguinaldo 5 Mahayag 4
Guadalupe 26 Getsemane 3
San Toribio 17 Berseba 15
Anolingan 11 Mt. Carmel 17
San Luis Veruela
Sta. Ines 24 San Gabriel 20
Muritula 12 La Fortuna 44
Don Alejandro 47 Sinobong 35
Baylo 17 Del Monte 29
Anislagan 32 Sisimon 13
Mahagsay 18 Anitap 9
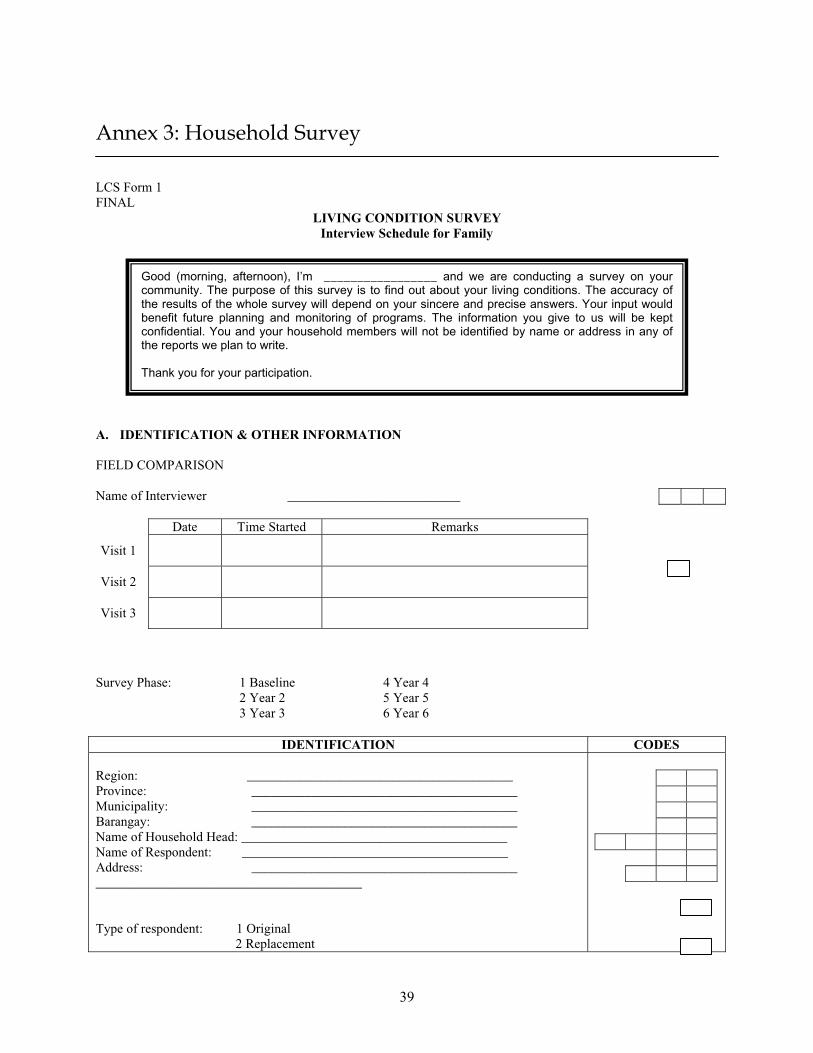
39
Annex 3: Household Survey
LCS Form 1FINAL
LIVING CONDITION SURVEYInterview Schedule for Family
A. IDENTIFICATION & OTHER INFORMATION
FIELD COMPARISON
Name of Interviewer __________________________
Date Time Started Remarks
Visit 1
Visit 2
Visit 3
Survey Phase: 1 Baseline 4 Year 42 Year 2 5 Year 53 Year 3 6 Year 6
IDENTIFICATION CODES
Region: ________________________________________Province: ________________________________________Municipality: ________________________________________Barangay: ________________________________________Name of Household Head: ________________________________________Name of Respondent: ________________________________________Address: ________________________________________________________________________________
Type of respondent: 1 Original 2 Replacement
Good (morning, afternoon), I’m _________________ and we are conducting a survey on yourcommunity. The purpose of this survey is to find out about your living conditions. The accuracy ofthe results of the whole survey will depend on your sincere and precise answers. Your input wouldbenefit future planning and monitoring of programs. The information you give to us will be keptconfidential. You and your household members will not be identified by name or address in any ofthe reports we plan to write.
Thank you for your participation.
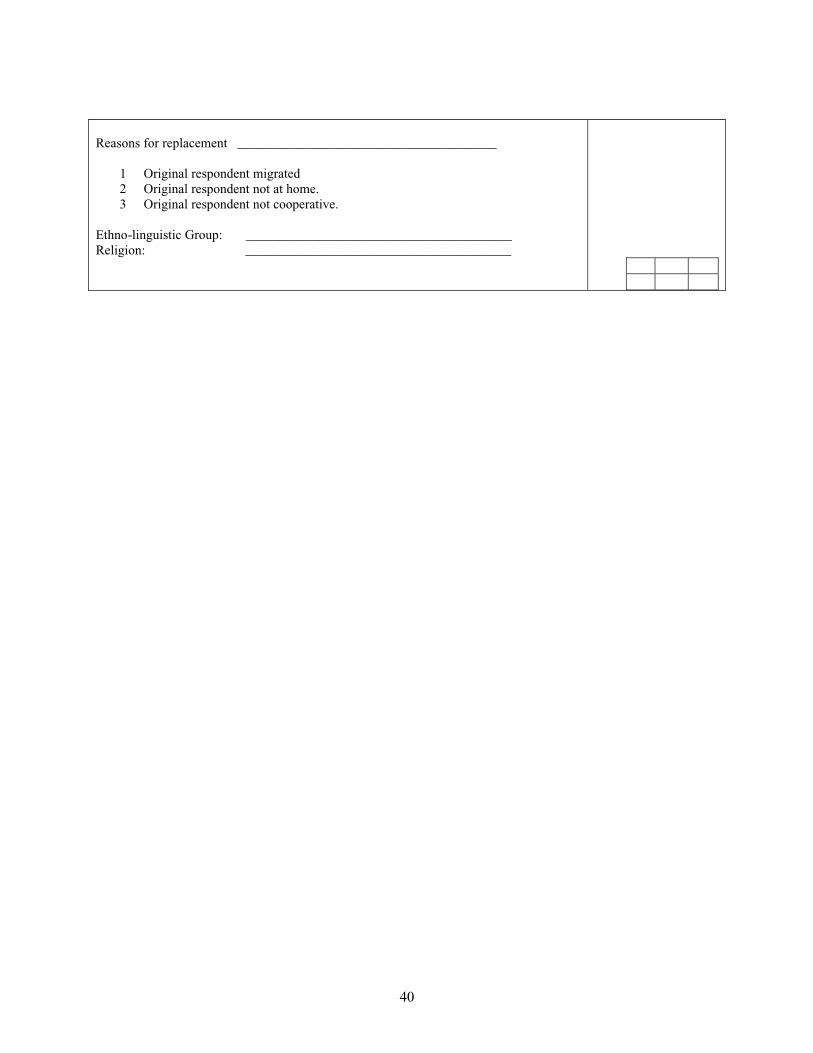
40
Reasons for replacement _______________________________________
1 Original respondent migrated2 Original respondent not at home.3 Original respondent not cooperative.
Ethno-linguistic Group: ________________________________________Religion: ________________________________________
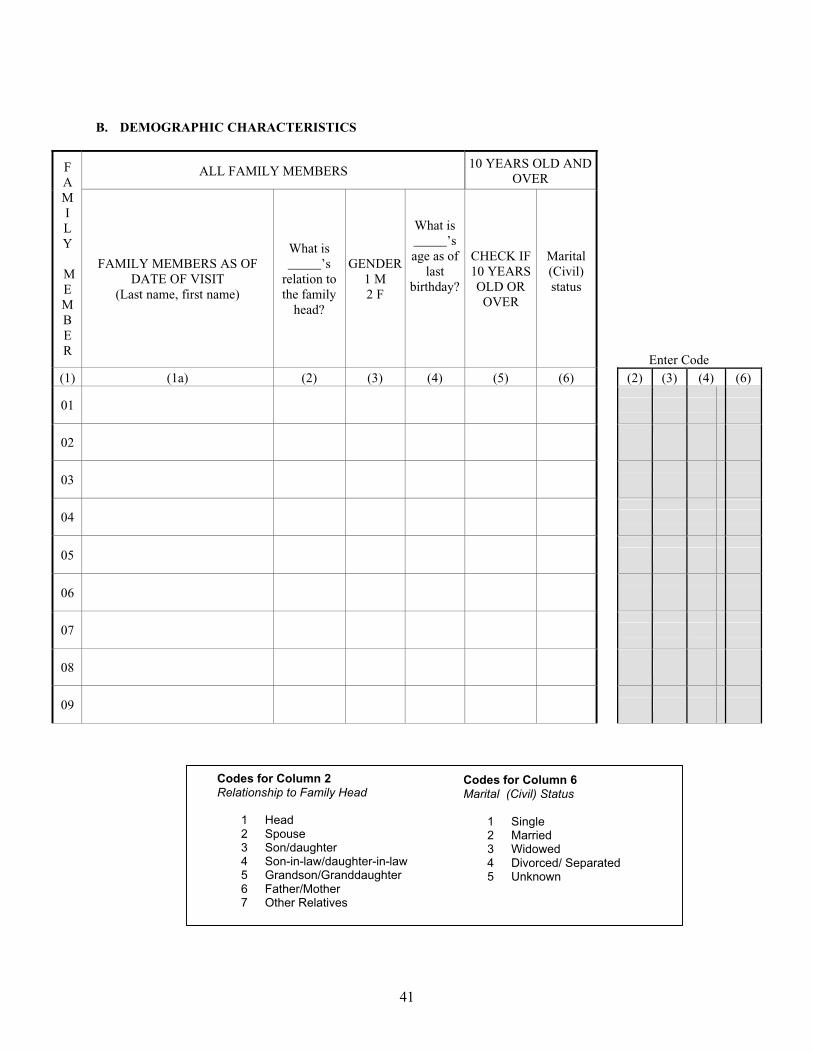
41
B. DEMOGRAPHIC CHARACTERISTICS
ALL FAMILY MEMBERS10 YEARS OLD AND
OVERFAMILY
MEMBER
FAMILY MEMBERS AS OF DATE OF VISIT
(Last name, first name)
What is _____’s
relation to the family
head?
GENDER1 M2 F
What is _____’sage as of
lastbirthday?
CHECK IF 10 YEARS OLD OR OVER
Marital(Civil)status
Enter Code(1) (1a) (2) (3) (4) (5) (6) (2) (3) (4) (6)
01
02
03
04
05
06
07
08
09
Codes for Column 2Relationship to Family Head
1 Head2 Spouse3 Son/daughter4 Son-in-law/daughter-in-law5 Grandson/Granddaughter6 Father/Mother7 Other Relatives
Codes for Column 6 Marital (Civil) Status
1 Single2 Married3 Widowed4 Divorced/ Separated5 Unknown
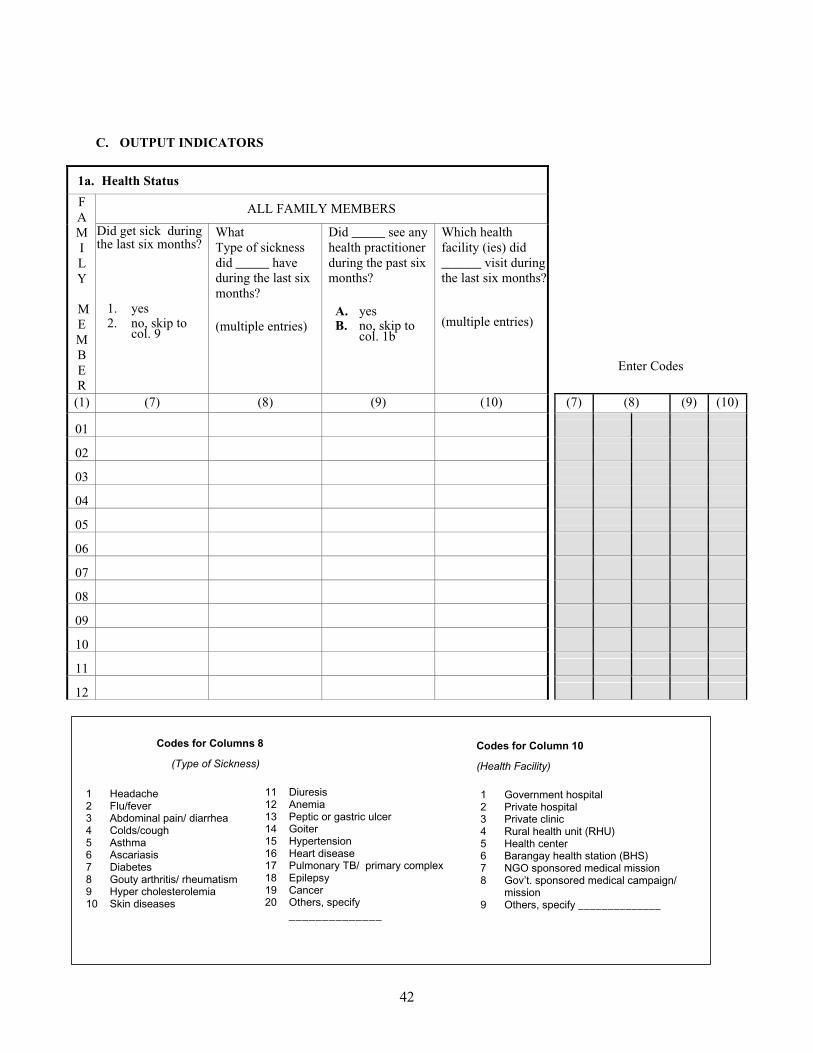
42
C. OUTPUT INDICATORS
1a. Health Status
ALL FAMILY MEMBERSFAMILY
MEMBER
Did get sick during the last six months?
1. yes2. no, skip to
col. 9
WhatType of sicknessdid _____ have during the last six months?
(multiple entries)
Did _____ see anyhealth practitioner during the past six months?
A. yesB. no, skip to
col. 1b
Which health facility (ies) did ______ visit during the last six months?
(multiple entries)
Enter Codes
(1) (7) (8) (9) (10) (7) (8) (9) (10)
01
02
03
04
05
06
07
08
09
10
11
12
Codes for Columns 8
(Type of Sickness)
1 Headache2 Flu/fever3 Abdominal pain/ diarrhea4 Colds/cough5 Asthma6 Ascariasis7 Diabetes8 Gouty arthritis/ rheumatism9 Hyper cholesterolemia10 Skin diseases
11 Diuresis12 Anemia13 Peptic or gastric ulcer14 Goiter15 Hypertension16 Heart disease17 Pulmonary TB/ primary complex18 Epilepsy19 Cancer20 Others, specify
______________
Codes for Column 10
(Health Facility)
1 Government hospital2 Private hospital3 Private clinic4 Rural health unit (RHU)5 Health center6 Barangay health station (BHS)7 NGO sponsored medical mission8 Gov’t. sponsored medical campaign/
mission9 Others, specify ______________
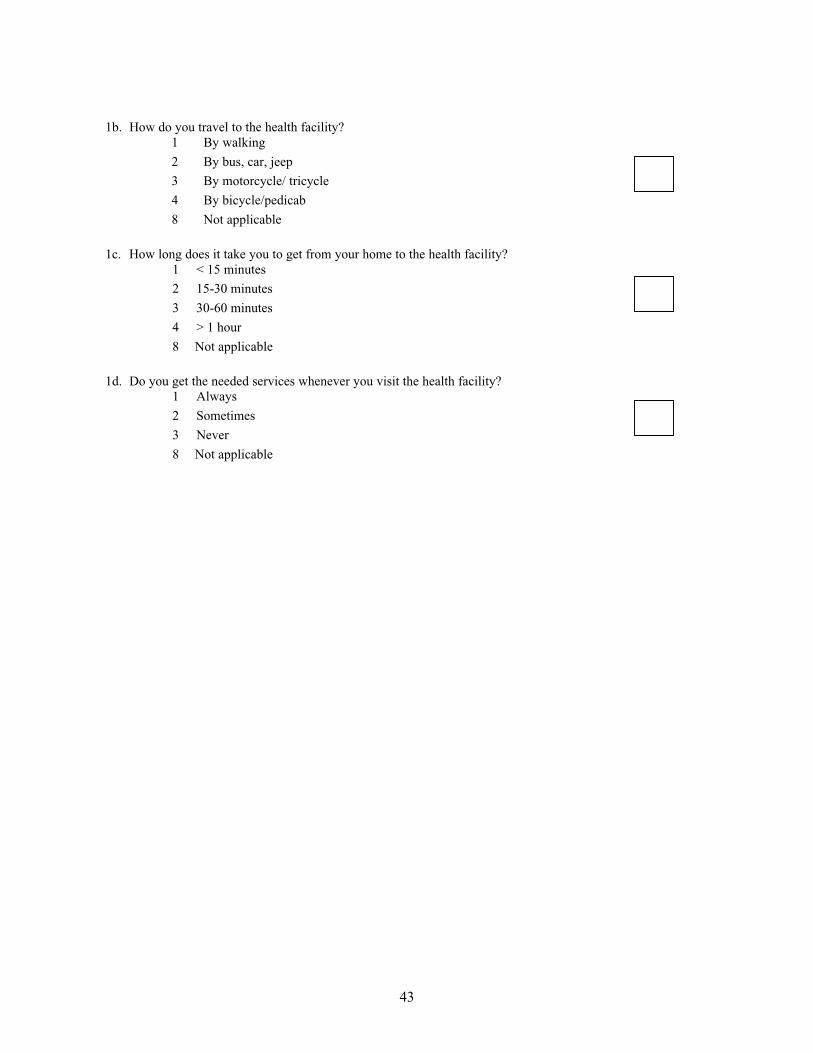
43
1b. How do you travel to the health facility?1 By walking
2 By bus, car, jeep
3 By motorcycle/ tricycle
4 By bicycle/pedicab
8 Not applicable
1c. How long does it take you to get from your home to the health facility?1 < 15 minutes
2 15-30 minutes
3 30-60 minutes
4 > 1 hour
8 Not applicable
1d. Do you get the needed services whenever you visit the health facility?1 Always
2 Sometimes
3 Never
8 Not applicable
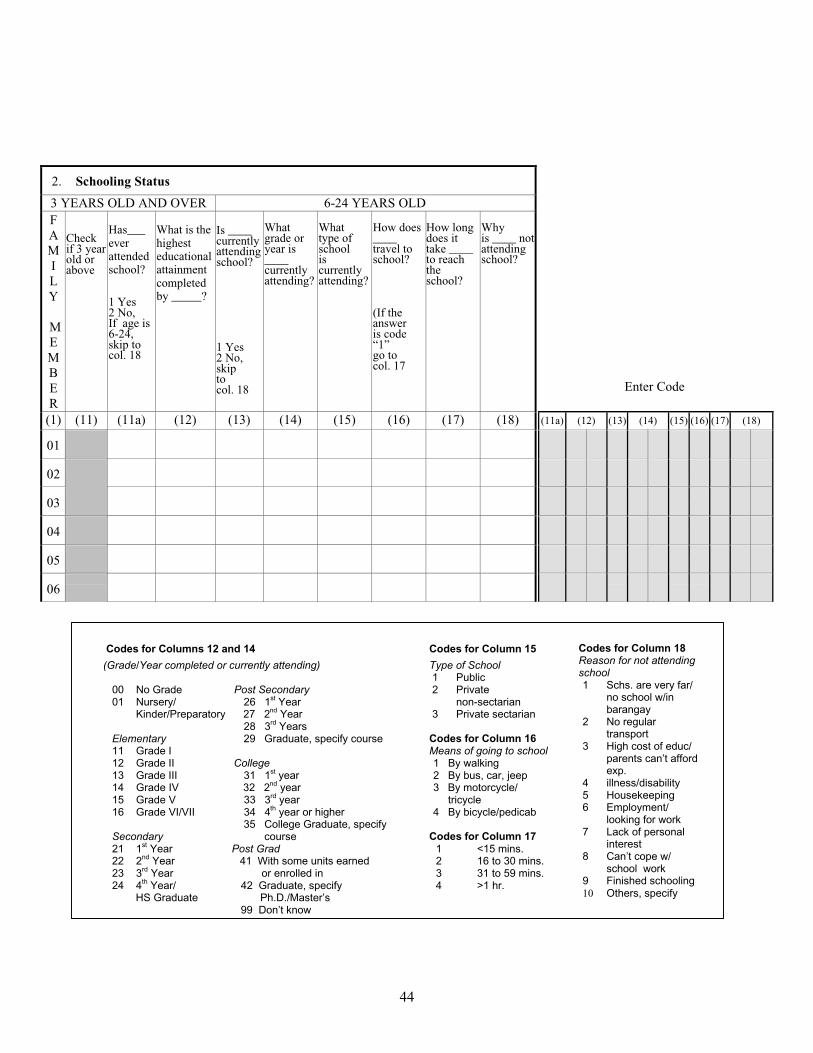
44
2. Schooling Status
3 YEARS OLD AND OVER 6-24 YEARS OLDFAMILY
MEMBER
Checkif 3 year old or above
Has___everattendedschool?
1 Yes2 No,If age is6-24,skip tocol. 18
What is the highesteducationalattainmentcompletedby _____?
Is ____ currentlyattendingschool?
1 Yes2 No,skiptocol. 18
Whatgrade or year is ____currentlyattending?
Whattype ofschooliscurrentlyattending?
How does ____travel to school?
(If the answeris code“1”go tocol. 17
How long does it take ____ to reach theschool?
Whyis ____ notattendingschool?
Enter Code
(1) (11) (11a) (12) (13) (14) (15) (16) (17) (18) (11a) (12) (13) (14) (15) (16) (17) (18)
01
02
03
04
05
06
Codes for Columns 12 and 14
(Grade/Year completed or currently attending)
00 No Grade Post Secondary01 Nursery/ 26 1st Year
Kinder/Preparatory 27 2nd Year 28 3rd Years
Elementary 29 Graduate, specify course11 Grade I12 Grade II College13 Grade III 31 1st year14 Grade IV 32 2nd year15 Grade V 33 3rd year16 Grade VI/VII 34 4th year or higher
35 College Graduate, specify Secondary course21 1st Year Post Grad22 2nd Year 41 With some units earned 23 3rd Year or enrolled in24 4th Year/ 42 Graduate, specify HS Graduate Ph.D./Master’s
99 Don’t know
Codes for Column 15
Type of School1 Public2 Private
non-sectarian3 Private sectarian
Codes for Column 16 Means of going to school1 By walking2 By bus, car, jeep3 By motorcycle/ tricycle4 By bicycle/pedicab
Codes for Column 17 1 <15 mins.2 16 to 30 mins.3 31 to 59 mins.4 >1 hr.
Codes for Column 18Reason for not attending school1 Schs. are very far/
no school w/inbarangay
2 No regular transport
3 High cost of educ/ parents can’t affordexp.
4 illness/disability5 Housekeeping6 Employment/
looking for work7 Lack of personal
interest8 Can’t cope w/
school work9 Finished schooling10 Others, specify
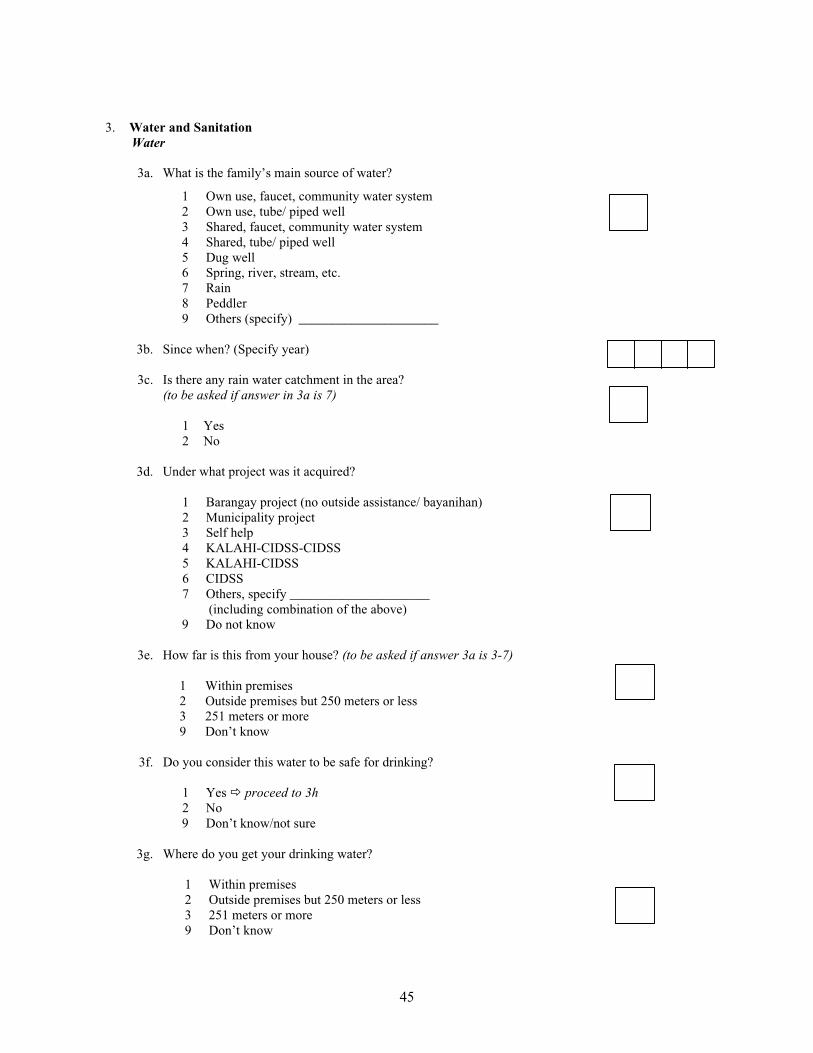
45
3. Water and SanitationWater
3a. What is the family’s main source of water?
1 Own use, faucet, community water system2 Own use, tube/ piped well 3 Shared, faucet, community water system4 Shared, tube/ piped well5 Dug well6 Spring, river, stream, etc.7 Rain8 Peddler9 Others (specify) _____________________
3b. Since when? (Specify year)
3c. Is there any rain water catchment in the area?(to be asked if answer in 3a is 7)
1 Yes2 No
3d. Under what project was it acquired?
1 Barangay project (no outside assistance/ bayanihan)2 Municipality project3 Self help4 KALAHI-CIDSS-CIDSS5 KALAHI-CIDSS6 CIDSS7 Others, specify _____________________
(including combination of the above)9 Do not know
3e. How far is this from your house? (to be asked if answer 3a is 3-7)
1 Within premises2 Outside premises but 250 meters or less3 251 meters or more9 Don’t know
3f. Do you consider this water to be safe for drinking?
1 Yes proceed to 3h2 No9 Don’t know/not sure
3g. Where do you get your drinking water?
1 Within premises2 Outside premises but 250 meters or less3 251 meters or more9 Don’t know
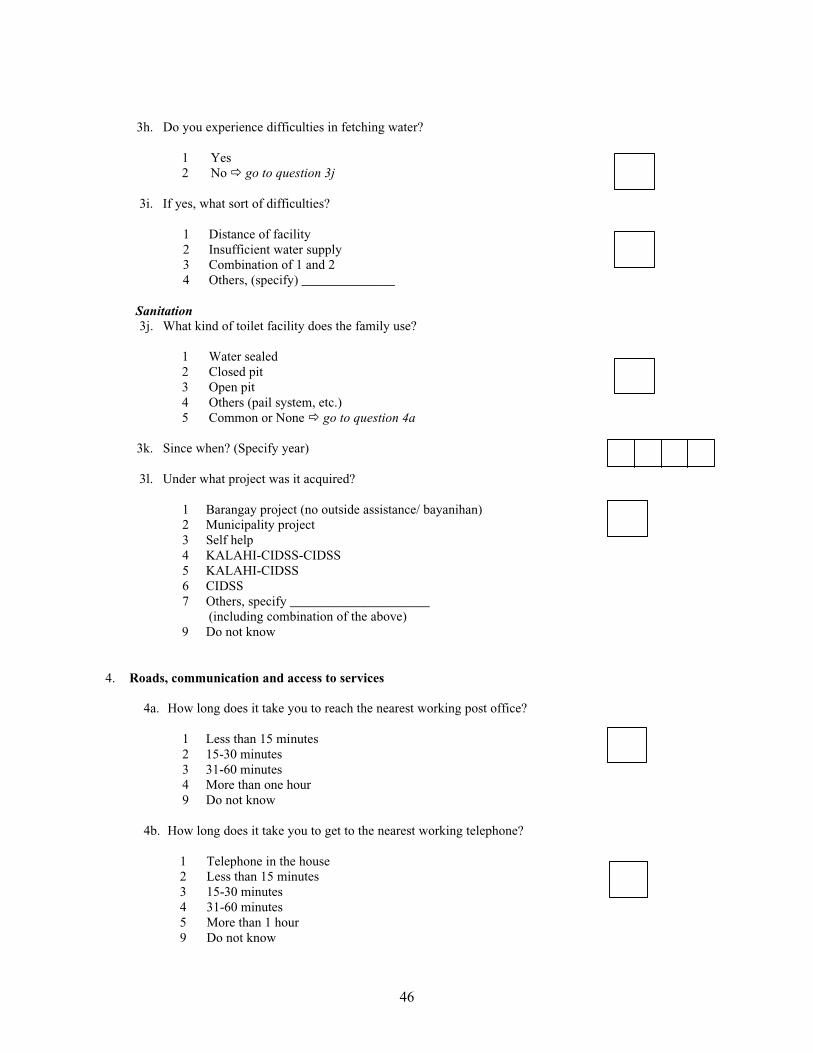
46
3h. Do you experience difficulties in fetching water?
1 Yes2 No go to question 3j
3i. If yes, what sort of difficulties?
1 Distance of facility2 Insufficient water supply3 Combination of 1 and 24 Others, (specify) ______________
Sanitation3j. What kind of toilet facility does the family use?
1 Water sealed2 Closed pit3 Open pit4 Others (pail system, etc.)5 Common or None go to question 4a
3k. Since when? (Specify year)
3l. Under what project was it acquired?
1 Barangay project (no outside assistance/ bayanihan)2 Municipality project3 Self help4 KALAHI-CIDSS-CIDSS5 KALAHI-CIDSS6 CIDSS7 Others, specify _____________________
(including combination of the above)9 Do not know
4. Roads, communication and access to services
4a. How long does it take you to reach the nearest working post office?
1 Less than 15 minutes2 15-30 minutes3 31-60 minutes4 More than one hour9 Do not know
4b. How long does it take you to get to the nearest working telephone?
1 Telephone in the house2 Less than 15 minutes3 15-30 minutes4 31-60 minutes5 More than 1 hour9 Do not know
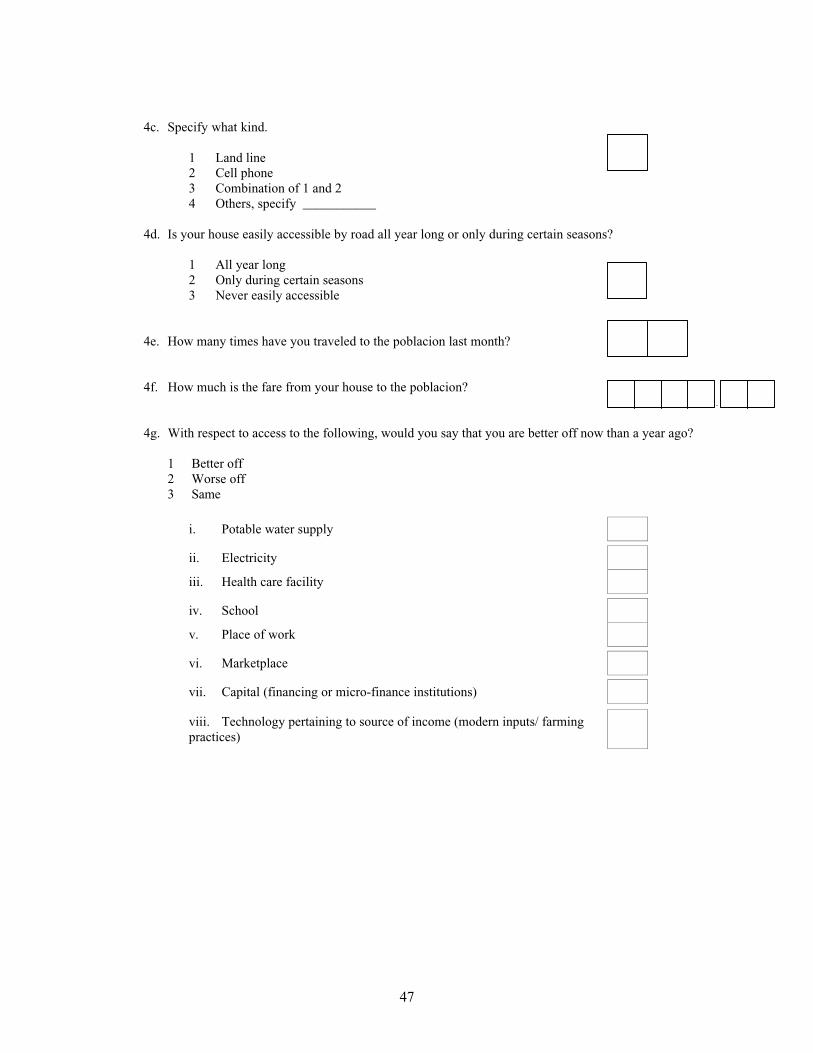
47
4c. Specify what kind.
1 Land line2 Cell phone3 Combination of 1 and 24 Others, specify ___________
4d. Is your house easily accessible by road all year long or only during certain seasons?
1 All year long2 Only during certain seasons3 Never easily accessible
4e. How many times have you traveled to the poblacion last month?
4f. How much is the fare from your house to the poblacion?
4g. With respect to access to the following, would you say that you are better off now than a year ago?
1 Better off 2 Worse off3 Same
i. Potable water supply
ii. Electricity
iii. Health care facility
iv. School
v. Place of work
vi. Marketplace
vii. Capital (financing or micro-finance institutions)
viii. Technology pertaining to source of income (modern inputs/ farming practices)
.
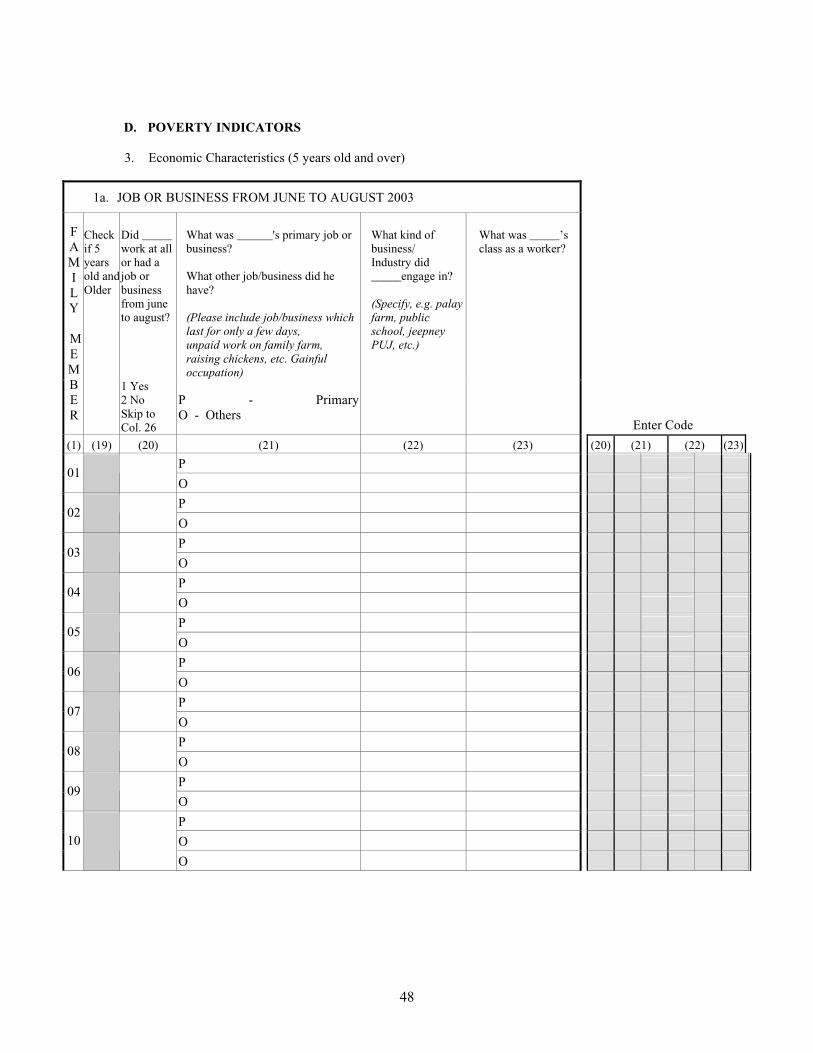
48
D. POVERTY INDICATORS
3. Economic Characteristics (5 years old and over)
1a. JOB OR BUSINESS FROM JUNE TO AUGUST 2003
What was ______'s primary job or business?
What other job/business did he have?
(Please include job/business which last for only a few days,unpaid work on family farm, raising chickens, etc. Gainful occupation)
FAMILY
MEMBER
Checkif 5 yearsold andOlder
Did _____ work at all or had a job or businessfrom june to august?
1 Yes2 NoSkip toCol. 26
P - PrimaryO - Others
What kind of business/Industry did _____engage in?
(Specify, e.g. palay farm, public school, jeepney PUJ, etc.)
What was _____’s class as a worker?
Enter Code
(1) (19) (20) (21) (22) (23) (20) (21) (22) (23)
P01
O
P02
O
P03
O
P04
O
P05
O
P06
O
P07
O
P08
O
P09
O
P
O10
O
49
Codes for Column 27Reason for not looking for work
1 Relieve work not available2 Awaiting results of previous job application3 Temporary illness/disability4 Bad Weather5 Waiting for rehire/job recal6 Too young/old, retireed or permanently disabled7 Housekeeping8 Schooling9 Others, specify ___________________
1a. For columns 24 and 25; additional work for past 3 months
1b. For columns 26 and 27; job/business from Juneto August
Codes for Column 23
Class of Workers
1 Worked for private household2 Worked for private establishment3 Worked for government/GOCC4 Self-employed w/out any employee5 Employer in own-family operated farm or
business6 Worked w/ pay on own family-operated farm or
business7 Worked w/out pay in own family-operated farm
or business8 Worked for somebody else’s farms
Codes for Column 22
Kind of business/industry engaged in
1 Agriculture, Fishing, and Forestry2 Mining and Quarrying3 Manufacturing4 Electricity, Gas and Water5 Construction6 Wholesale and Retail Trade7 Transportation, Storage and Communication8 Financing, Insurance, Real Estate & Business
Services9 Community, Social and Personal Services 10 Not specified elsewhere
50
FOR FAMILY MEMBERS WHOWORKED
FOR FAMILY MEMBERS WHO DID NOTWORKF
AMILY
MEMBER
Did _______ look for additional work the past 3 months?
1. yes2 no, go to
nextsection
How many more hours per day was ______ willing to work?
Did _________ look for work at anytime during the past six months?
1 Yes, skip to next section
2 No
Why did _________ not look for work?
Enter code
(1) (24) (25) (26) (27) (24) (25) (26) (27)
01
02
03
04
05
06
07
08
09
10
11
12
13
51
2. Agricultural profile
If any of the answer to column 22 is 1 then proceed, else go to 3.
2a. Did you or any member of the family engage in crop farming or gardening in the past 12 months?
1 Yes (fill up the table below) 2 no go to 2b
2ai. Farm Profile (Based on the past 12 months)
Crops Planted Type of Land TopographyTotal production
(Specify unit) Enter code(28) (29) (30) (31) (28) (2 (3 (31)
(1)
(2)
(3)
(4)
(5)
(6)
(7)
(8)
(9)
(10)
Codes for Column 29Type of Land
1 Irrigated big systems (i.e., NIS/CIS)2 Irrigated small systems (i.e., SWIP, STW, LLP, SFR)3 Rainfed4 Combination, specify ____________
Codes for Column 30Topography
1 Plain2 Hilly/rolling3 Mountainous
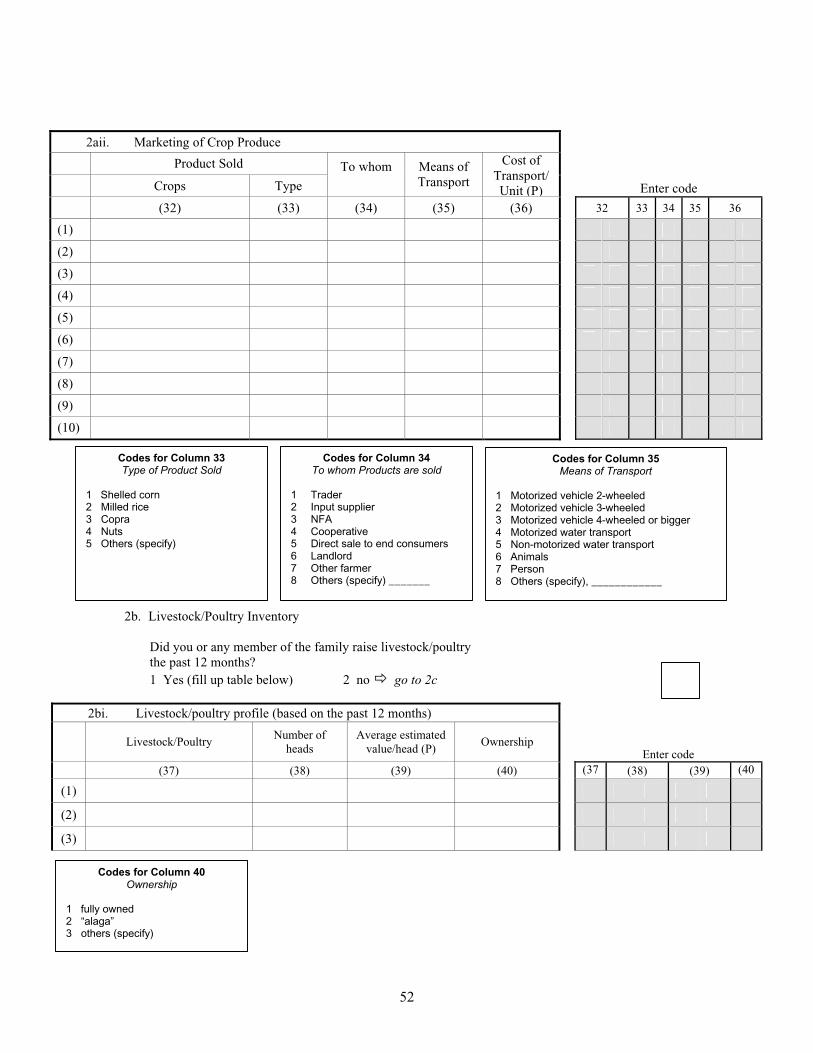
52
2b. Livestock/Poultry Inventory
Did you or any member of the family raise livestock/poultrythe past 12 months?1 Yes (fill up table below) 2 no go to 2c
2bi. Livestock/poultry profile (based on the past 12 months)
Livestock/PoultryNumber of
headsAverage estimated
value/head (P)Ownership
Enter code(37) (38) (39) (40) (37 (38) (39) (40
(1)
(2)
(3)
2aii. Marketing of Crop Produce
Product Sold
Crops Type
To whom Means of Transport
Cost of Transport/Unit (P) Enter code
(32) (33) (34) (35) (36) 32 33 34 35 36
(1)
(2)
(3)
(4)
(5)
(6)
(7)
(8)
(9)
(10)
Codes for Column 33Type of Product Sold
1 Shelled corn2 Milled rice3 Copra4 Nuts5 Others (specify)
Codes for Column 34To whom Products are sold
1 Trader2 Input supplier3 NFA4 Cooperative5 Direct sale to end consumers6 Landlord7 Other farmer8 Others (specify) _______
Codes for Column 35Means of Transport
1 Motorized vehicle 2-wheeled2 Motorized vehicle 3-wheeled3 Motorized vehicle 4-wheeled or bigger4 Motorized water transport5 Non-motorized water transport6 Animals7 Person8 Others (specify), ____________
Codes for Column 40Ownership
1 fully owned2 “alaga”3 others (specify)
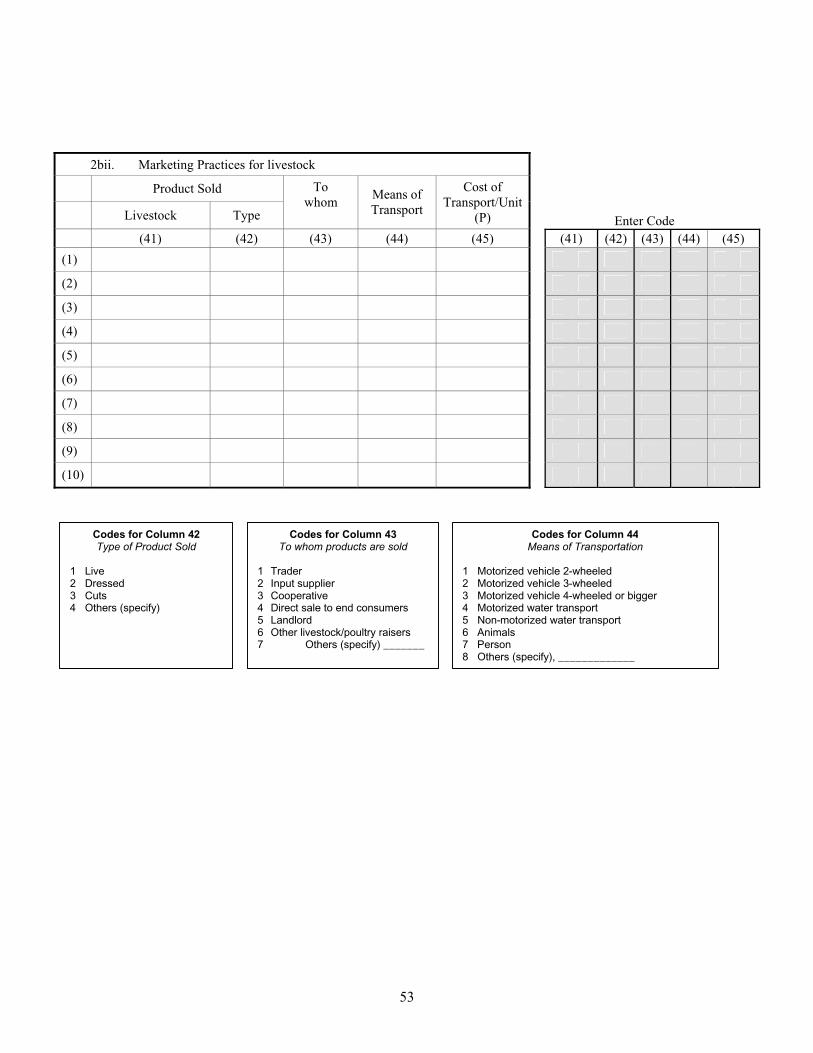
53
2bii. Marketing Practices for livestock
Product Sold
Livestock Type
Towhom
Means of Transport
Cost of Transport/Unit
(P) Enter Code(41) (42) (43) (44) (45) (41) (42) (43) (44) (45)
(1)
(2)
(3)
(4)
(5)
(6)
(7)
(8)
(9)
(10)
Codes for Column 42Type of Product Sold
1 Live2 Dressed3 Cuts4 Others (specify)
Codes for Column 43To whom products are sold
1 Trader2 Input supplier3 Cooperative4 Direct sale to end consumers5 Landlord6 Other livestock/poultry raisers7 Others (specify) _______
Codes for Column 44Means of Transportation
1 Motorized vehicle 2-wheeled2 Motorized vehicle 3-wheeled3 Motorized vehicle 4-wheeled or bigger4 Motorized water transport5 Non-motorized water transport6 Animals7 Person8 Others (specify), _____________
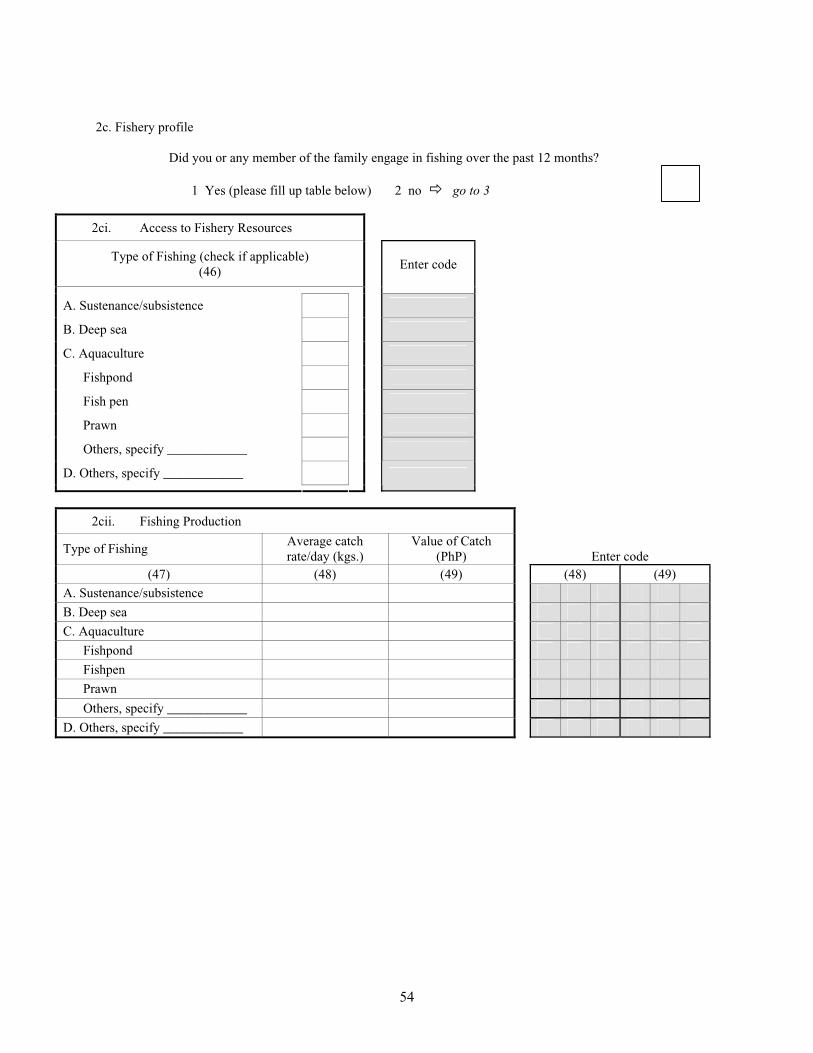
54
2c. Fishery profile
Did you or any member of the family engage in fishing over the past 12 months?
1 Yes (please fill up table below) 2 no go to 3
2ci. Access to Fishery Resources
Type of Fishing (check if applicable)(46) Enter code
A. Sustenance/subsistence
B. Deep sea
C. Aquaculture
Fishpond
Fish pen
Prawn
Others, specify ____________
D. Others, specify ____________
2cii. Fishing Production
Type of FishingAverage catch rate/day (kgs.)
Value of Catch (PhP) Enter code
(47) (48) (49) (48) (49)A. Sustenance/subsistence
B. Deep sea
C. Aquaculture
Fishpond
Fishpen
Prawn
Others, specify ____________
D. Others, specify ____________
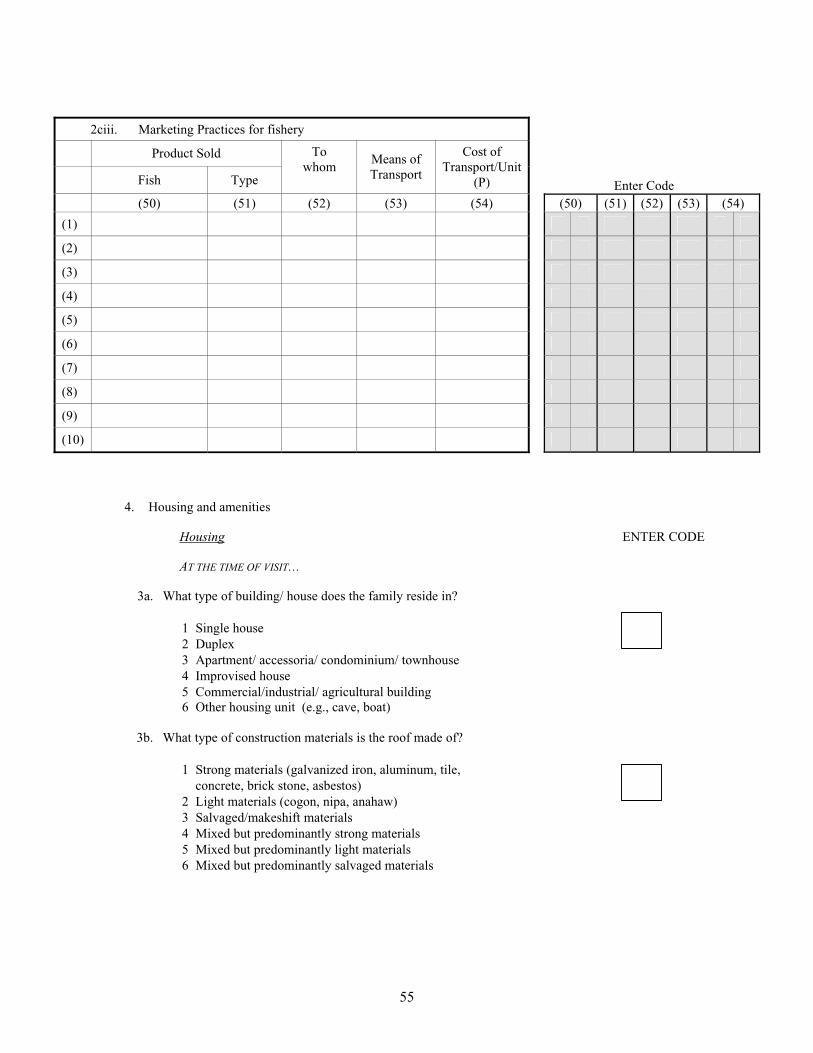
55
4. Housing and amenities
Housing ENTER CODE
AT THE TIME OF VISIT…
3a. What type of building/ house does the family reside in?
1 Single house2 Duplex3 Apartment/ accessoria/ condominium/ townhouse4 Improvised house5 Commercial/industrial/ agricultural building6 Other housing unit (e.g., cave, boat)
3b. What type of construction materials is the roof made of?
1 Strong materials (galvanized iron, aluminum, tile, concrete, brick stone, asbestos)
2 Light materials (cogon, nipa, anahaw)3 Salvaged/makeshift materials4 Mixed but predominantly strong materials5 Mixed but predominantly light materials6 Mixed but predominantly salvaged materials
2ciii. Marketing Practices for fishery
Product Sold
Fish Type
Towhom
Means of Transport
Cost of Transport/Unit
(P) Enter Code(50) (51) (52) (53) (54) (50) (51) (52) (53) (54)
(1)
(2)
(3)
(4)
(5)
(6)
(7)
(8)
(9)
(10)
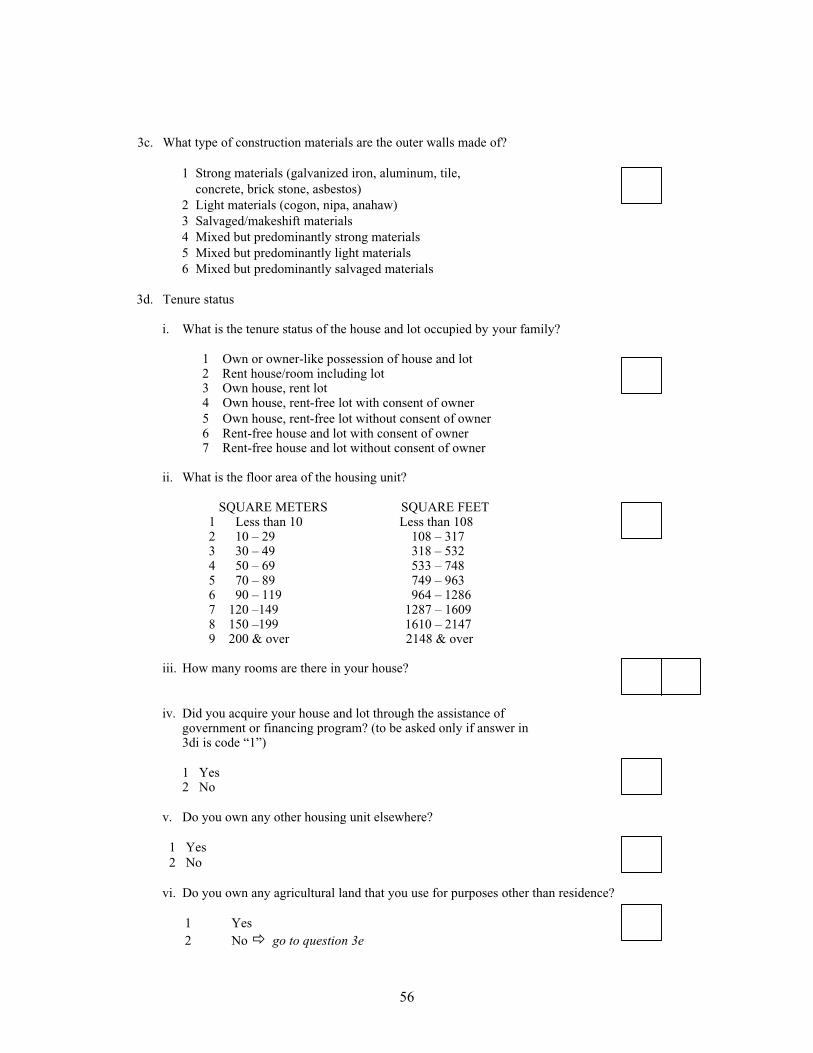
56
3c. What type of construction materials are the outer walls made of?
1 Strong materials (galvanized iron, aluminum, tile, concrete, brick stone, asbestos)
2 Light materials (cogon, nipa, anahaw)3 Salvaged/makeshift materials4 Mixed but predominantly strong materials5 Mixed but predominantly light materials6 Mixed but predominantly salvaged materials
3d. Tenure status
i. What is the tenure status of the house and lot occupied by your family?
1 Own or owner-like possession of house and lot 2 Rent house/room including lot 3 Own house, rent lot 4 Own house, rent-free lot with consent of owner 5 Own house, rent-free lot without consent of owner 6 Rent-free house and lot with consent of owner 7 Rent-free house and lot without consent of owner
ii. What is the floor area of the housing unit?
SQUARE METERS SQUARE FEET1 Less than 10 Less than 1082 10 – 29 108 – 3173 30 – 49 318 – 5324 50 – 69 533 – 7485 70 – 89 749 – 9636 90 – 119 964 – 12867 120 –149 1287 – 16098 150 –199 1610 – 21479 200 & over 2148 & over
iii. How many rooms are there in your house?
iv. Did you acquire your house and lot through the assistance ofgovernment or financing program? (to be asked only if answer in 3di is code “1”)
1 Yes2 No
v. Do you own any other housing unit elsewhere?
1 Yes 2 No
vi. Do you own any agricultural land that you use for purposes other than residence?
1 Yes2 No go to question 3e
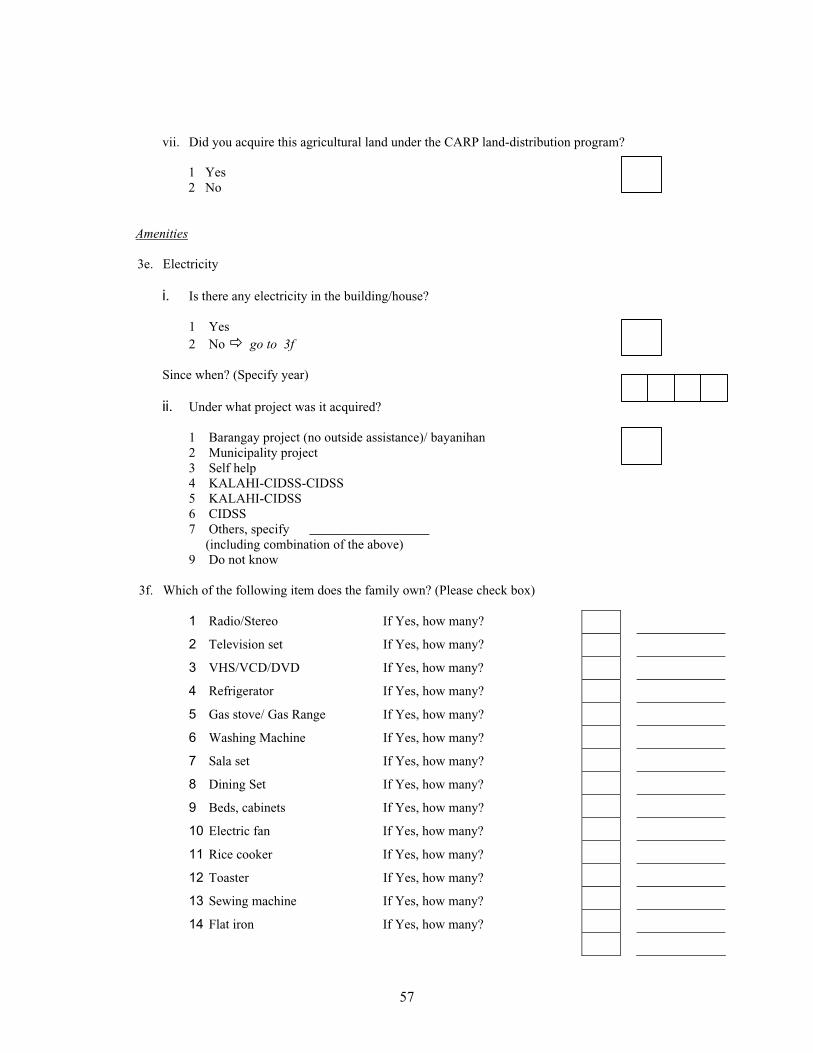
57
vii. Did you acquire this agricultural land under the CARP land-distribution program?
1 Yes2 No
Amenities
3e. Electricity
i. Is there any electricity in the building/house?
1 Yes2 No go to 3f
Since when? (Specify year)
ii. Under what project was it acquired?
1 Barangay project (no outside assistance)/ bayanihan2 Municipality project3 Self help4 KALAHI-CIDSS-CIDSS5 KALAHI-CIDSS6 CIDSS7 Others, specify __________________ (including combination of the above)9 Do not know
3f. Which of the following item does the family own? (Please check box)
1 Radio/Stereo If Yes, how many?
2 Television set If Yes, how many?
3 VHS/VCD/DVD If Yes, how many?
4 Refrigerator If Yes, how many?
5 Gas stove/ Gas Range If Yes, how many?
6 Washing Machine If Yes, how many?
7 Sala set If Yes, how many?
8 Dining Set If Yes, how many?
9 Beds, cabinets If Yes, how many?
10 Electric fan If Yes, how many?
11 Rice cooker If Yes, how many?
12 Toaster If Yes, how many?
13 Sewing machine If Yes, how many?
14 Flat iron If Yes, how many?

58
15 Motorcycle, tricycle If Yes, how many?
16 Car, jeep If Yes, how many?
17 Generator If Yes, how many?
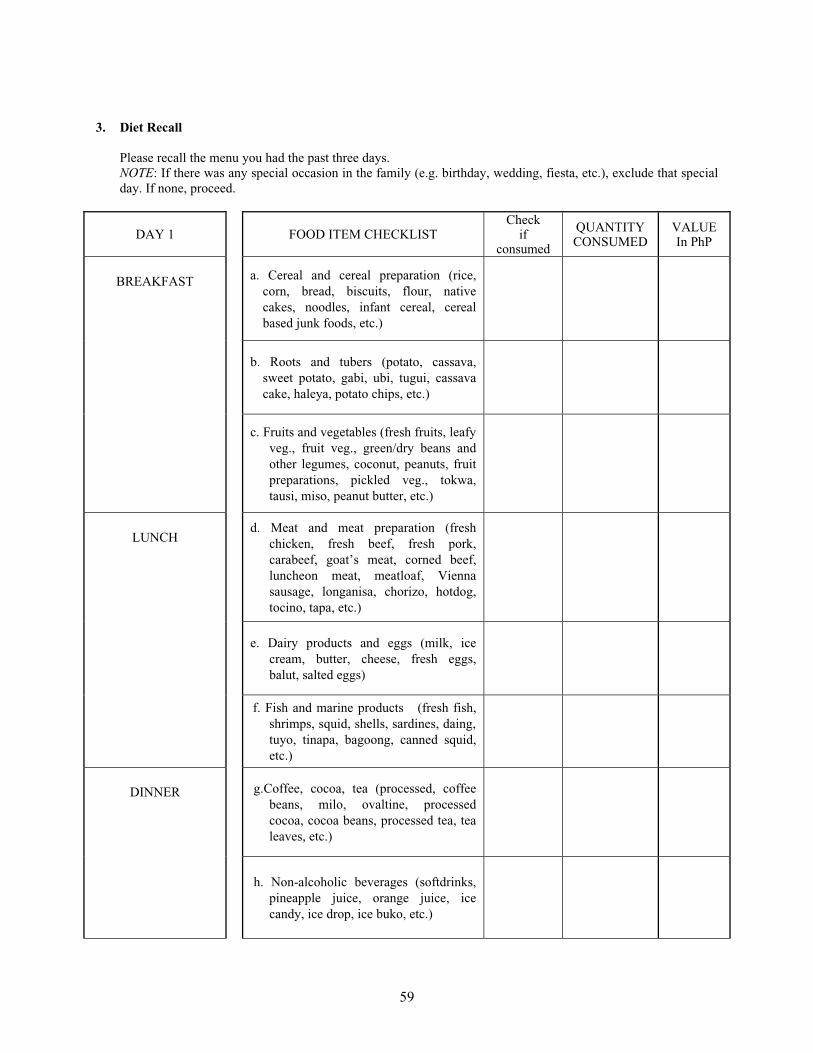
59
3. Diet Recall
Please recall the menu you had the past three days. NOTE: If there was any special occasion in the family (e.g. birthday, wedding, fiesta, etc.), exclude that specialday. If none, proceed.
DAY 1 FOOD ITEM CHECKLISTCheck
ifconsumed
QUANTITYCONSUMED
VALUEIn PhP
a. Cereal and cereal preparation (rice,corn, bread, biscuits, flour, nativecakes, noodles, infant cereal, cerealbased junk foods, etc.)
b. Roots and tubers (potato, cassava,sweet potato, gabi, ubi, tugui, cassavacake, haleya, potato chips, etc.)
BREAKFAST
c. Fruits and vegetables (fresh fruits, leafy veg., fruit veg., green/dry beans andother legumes, coconut, peanuts, fruitpreparations, pickled veg., tokwa,tausi, miso, peanut butter, etc.)
d. Meat and meat preparation (freshchicken, fresh beef, fresh pork,carabeef, goat’s meat, corned beef,luncheon meat, meatloaf, Viennasausage, longanisa, chorizo, hotdog,tocino, tapa, etc.)
e. Dairy products and eggs (milk, icecream, butter, cheese, fresh eggs,balut, salted eggs)
LUNCH
f. Fish and marine products (fresh fish,shrimps, squid, shells, sardines, daing, tuyo, tinapa, bagoong, canned squid,etc.)
g.Coffee, cocoa, tea (processed, coffeebeans, milo, ovaltine, processedcocoa, cocoa beans, processed tea, tealeaves, etc.)
DINNER
h. Non-alcoholic beverages (softdrinks,pineapple juice, orange juice, icecandy, ice drop, ice buko, etc.)
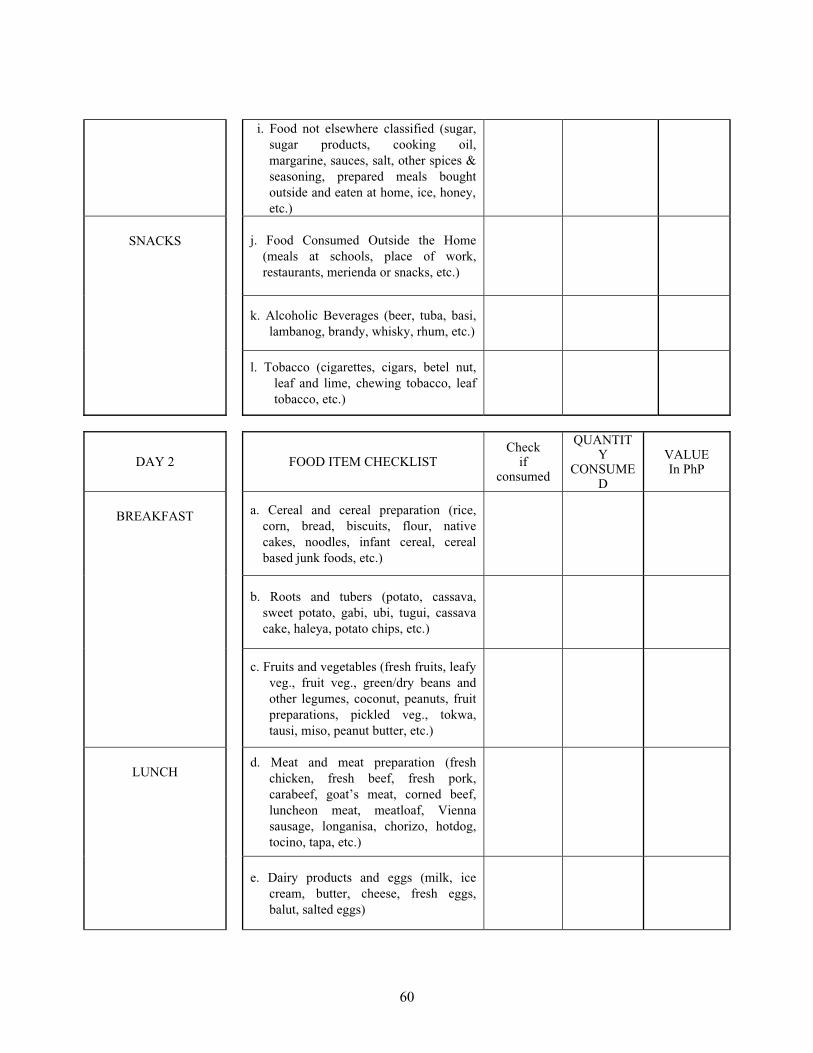
60
i. Food not elsewhere classified (sugar,sugar products, cooking oil,margarine, sauces, salt, other spices &seasoning, prepared meals boughtoutside and eaten at home, ice, honey, etc.)
j. Food Consumed Outside the Home(meals at schools, place of work,restaurants, merienda or snacks, etc.)
k. Alcoholic Beverages (beer, tuba, basi,lambanog, brandy, whisky, rhum, etc.)
SNACKS
l. Tobacco (cigarettes, cigars, betel nut,leaf and lime, chewing tobacco, leaftobacco, etc.)
DAY 2 FOOD ITEM CHECKLISTCheck
ifconsumed
QUANTITY
CONSUMED
VALUEIn PhP
a. Cereal and cereal preparation (rice,corn, bread, biscuits, flour, nativecakes, noodles, infant cereal, cerealbased junk foods, etc.)
b. Roots and tubers (potato, cassava,sweet potato, gabi, ubi, tugui, cassavacake, haleya, potato chips, etc.)
BREAKFAST
c. Fruits and vegetables (fresh fruits, leafy veg., fruit veg., green/dry beans andother legumes, coconut, peanuts, fruitpreparations, pickled veg., tokwa,tausi, miso, peanut butter, etc.)
d. Meat and meat preparation (freshchicken, fresh beef, fresh pork,carabeef, goat’s meat, corned beef,luncheon meat, meatloaf, Viennasausage, longanisa, chorizo, hotdog,tocino, tapa, etc.)
LUNCH
e. Dairy products and eggs (milk, icecream, butter, cheese, fresh eggs,balut, salted eggs)
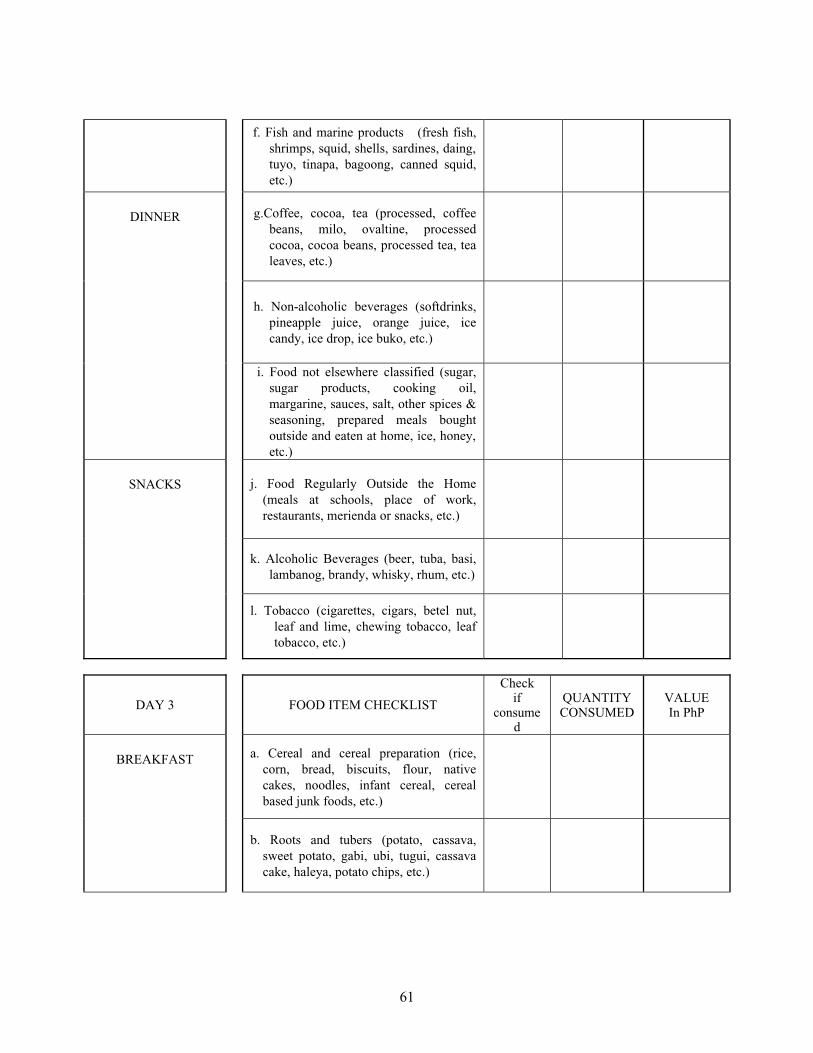
61
f. Fish and marine products (fresh fish,shrimps, squid, shells, sardines, daing, tuyo, tinapa, bagoong, canned squid,etc.)
g.Coffee, cocoa, tea (processed, coffeebeans, milo, ovaltine, processedcocoa, cocoa beans, processed tea, tealeaves, etc.)
h. Non-alcoholic beverages (softdrinks,pineapple juice, orange juice, icecandy, ice drop, ice buko, etc.)
DINNER
i. Food not elsewhere classified (sugar,sugar products, cooking oil,margarine, sauces, salt, other spices &seasoning, prepared meals boughtoutside and eaten at home, ice, honey, etc.)
j. Food Regularly Outside the Home(meals at schools, place of work,restaurants, merienda or snacks, etc.)
k. Alcoholic Beverages (beer, tuba, basi,lambanog, brandy, whisky, rhum, etc.)
SNACKS
l. Tobacco (cigarettes, cigars, betel nut,leaf and lime, chewing tobacco, leaftobacco, etc.)
DAY 3 FOOD ITEM CHECKLIST
Checkif
consumed
QUANTITYCONSUMED
VALUEIn PhP
a. Cereal and cereal preparation (rice,corn, bread, biscuits, flour, nativecakes, noodles, infant cereal, cerealbased junk foods, etc.)
BREAKFAST
b. Roots and tubers (potato, cassava,sweet potato, gabi, ubi, tugui, cassavacake, haleya, potato chips, etc.)
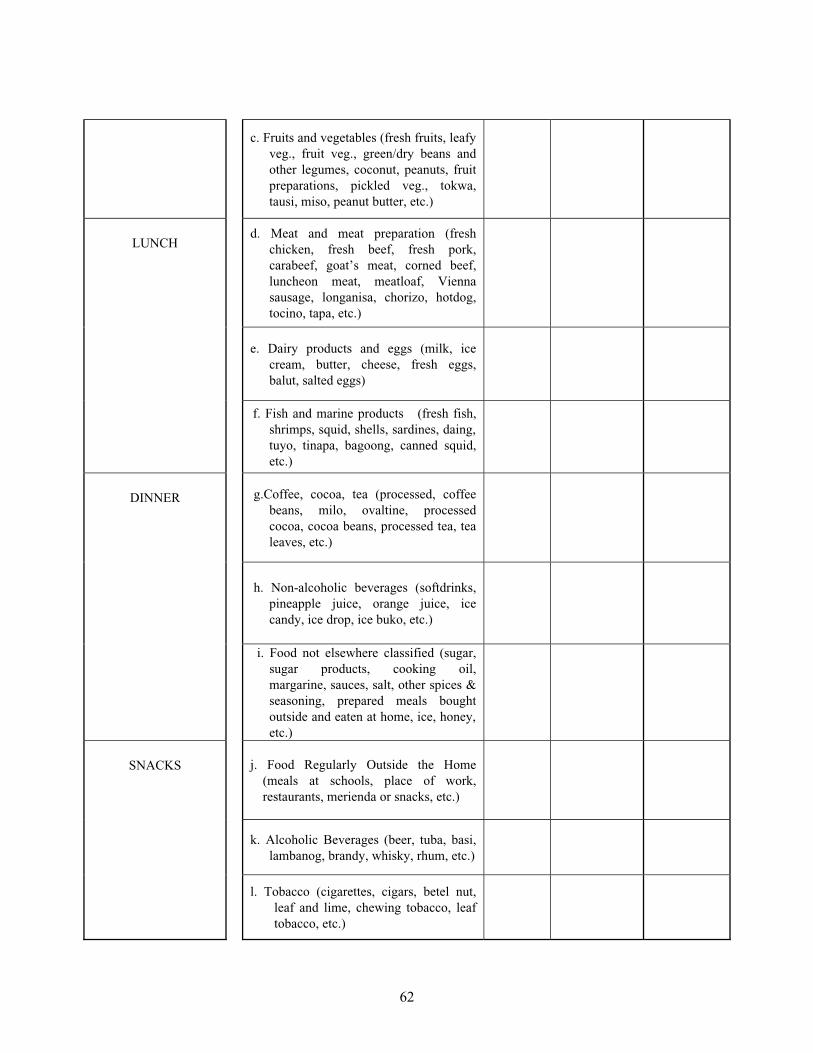
62
c. Fruits and vegetables (fresh fruits, leafy veg., fruit veg., green/dry beans andother legumes, coconut, peanuts, fruitpreparations, pickled veg., tokwa,tausi, miso, peanut butter, etc.)
d. Meat and meat preparation (freshchicken, fresh beef, fresh pork,carabeef, goat’s meat, corned beef,luncheon meat, meatloaf, Viennasausage, longanisa, chorizo, hotdog,tocino, tapa, etc.)
e. Dairy products and eggs (milk, icecream, butter, cheese, fresh eggs,balut, salted eggs)
LUNCH
f. Fish and marine products (fresh fish,shrimps, squid, shells, sardines, daing, tuyo, tinapa, bagoong, canned squid,etc.)
g.Coffee, cocoa, tea (processed, coffeebeans, milo, ovaltine, processedcocoa, cocoa beans, processed tea, tealeaves, etc.)
h. Non-alcoholic beverages (softdrinks,pineapple juice, orange juice, icecandy, ice drop, ice buko, etc.)
DINNER
i. Food not elsewhere classified (sugar,sugar products, cooking oil,margarine, sauces, salt, other spices &seasoning, prepared meals boughtoutside and eaten at home, ice, honey, etc.)
j. Food Regularly Outside the Home(meals at schools, place of work,restaurants, merienda or snacks, etc.)
k. Alcoholic Beverages (beer, tuba, basi,lambanog, brandy, whisky, rhum, etc.)
SNACKS
l. Tobacco (cigarettes, cigars, betel nut,leaf and lime, chewing tobacco, leaftobacco, etc.)
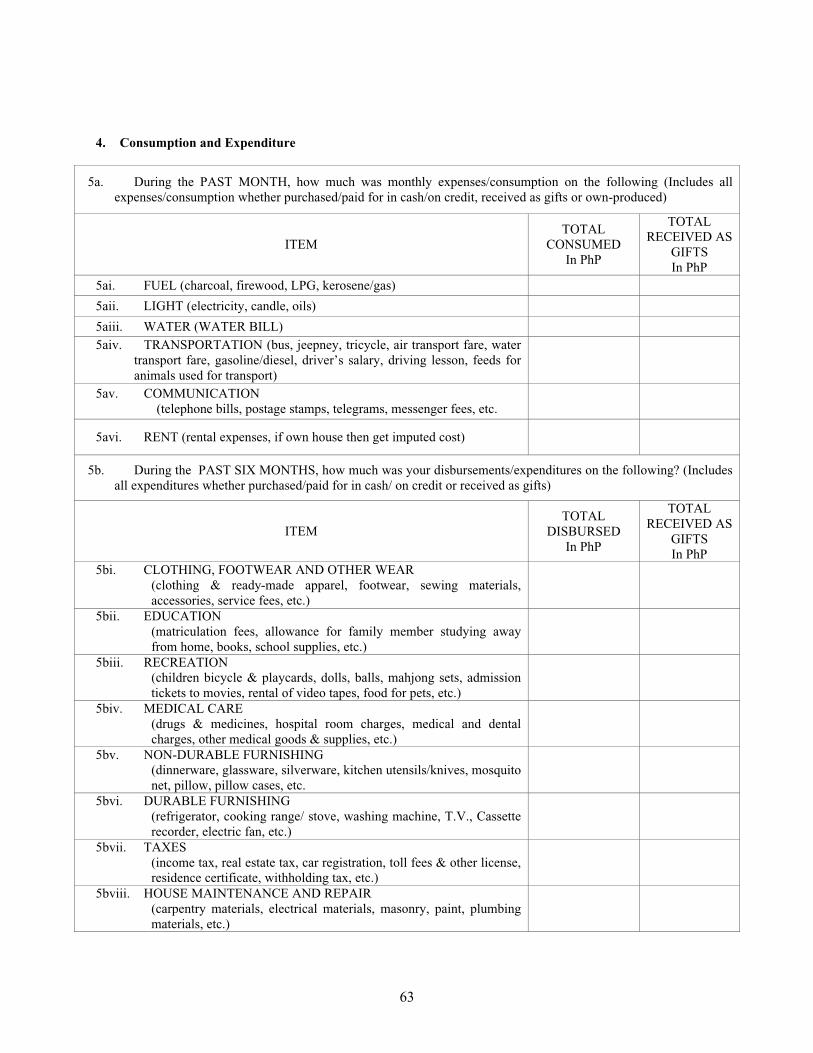
63
4. Consumption and Expenditure
5a. During the PAST MONTH, how much was monthly expenses/consumption on the following (Includes allexpenses/consumption whether purchased/paid for in cash/on credit, received as gifts or own-produced)
ITEMTOTAL
CONSUMEDIn PhP
TOTALRECEIVED AS
GIFTSIn PhP
5ai. FUEL (charcoal, firewood, LPG, kerosene/gas)
5aii. LIGHT (electricity, candle, oils)
5aiii. WATER (WATER BILL)5aiv. TRANSPORTATION (bus, jeepney, tricycle, air transport fare, water
transport fare, gasoline/diesel, driver’s salary, driving lesson, feeds foranimals used for transport)
5av. COMMUNICATION (telephone bills, postage stamps, telegrams, messenger fees, etc.
5avi. RENT (rental expenses, if own house then get imputed cost)
5b. During the PAST SIX MONTHS, how much was your disbursements/expenditures on the following? (Includes all expenditures whether purchased/paid for in cash/ on credit or received as gifts)
ITEMTOTAL
DISBURSEDIn PhP
TOTALRECEIVED AS
GIFTSIn PhP
5bi. CLOTHING, FOOTWEAR AND OTHER WEAR(clothing & ready-made apparel, footwear, sewing materials,accessories, service fees, etc.)
5bii. EDUCATION(matriculation fees, allowance for family member studying awayfrom home, books, school supplies, etc.)
5biii. RECREATION(children bicycle & playcards, dolls, balls, mahjong sets, admissiontickets to movies, rental of video tapes, food for pets, etc.)
5biv. MEDICAL CARE (drugs & medicines, hospital room charges, medical and dentalcharges, other medical goods & supplies, etc.)
5bv. NON-DURABLE FURNISHING(dinnerware, glassware, silverware, kitchen utensils/knives, mosquito net, pillow, pillow cases, etc.
5bvi. DURABLE FURNISHING (refrigerator, cooking range/ stove, washing machine, T.V., Cassetterecorder, electric fan, etc.)
5bvii. TAXES(income tax, real estate tax, car registration, toll fees & other license, residence certificate, withholding tax, etc.)
5bviii. HOUSE MAINTENANCE AND REPAIR(carpentry materials, electrical materials, masonry, paint, plumbingmaterials, etc.)
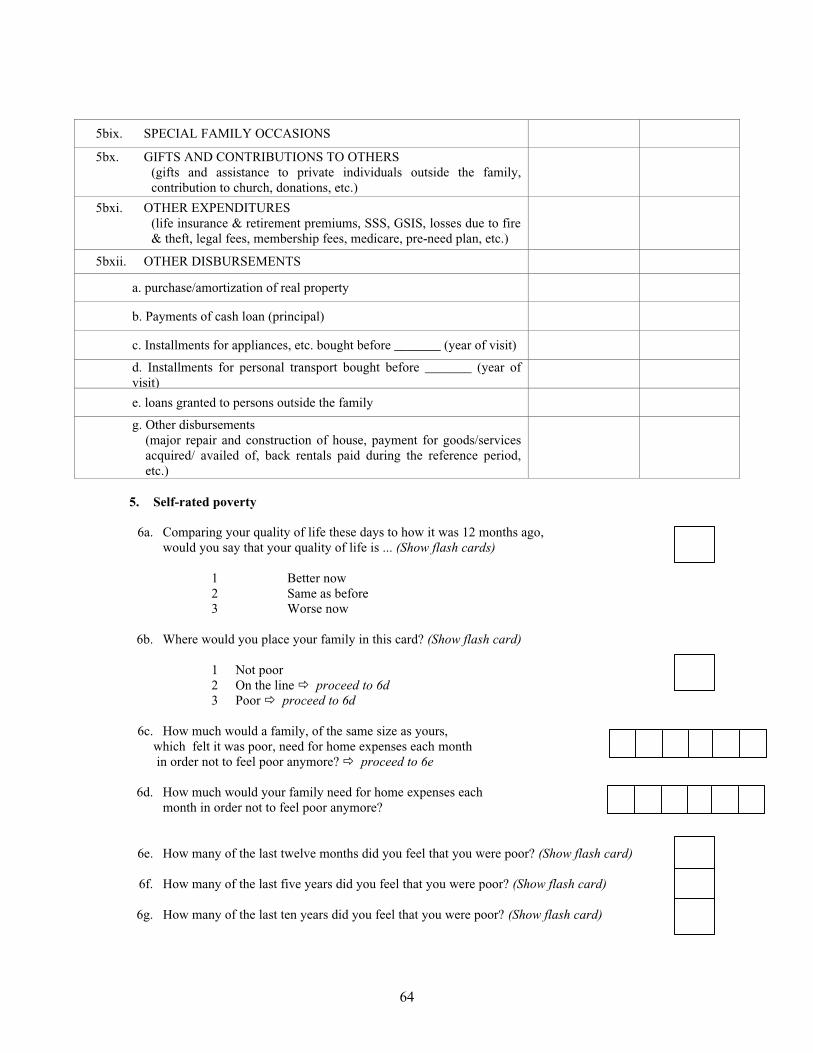
64
5bix. SPECIAL FAMILY OCCASIONS
5bx. GIFTS AND CONTRIBUTIONS TO OTHERS (gifts and assistance to private individuals outside the family,contribution to church, donations, etc.)
5bxi. OTHER EXPENDITURES(life insurance & retirement premiums, SSS, GSIS, losses due to fire & theft, legal fees, membership fees, medicare, pre-need plan, etc.)
5bxii. OTHER DISBURSEMENTS
a. purchase/amortization of real property
b. Payments of cash loan (principal)
c. Installments for appliances, etc. bought before _______ (year of visit)
d. Installments for personal transport bought before _______ (year ofvisit)
e. loans granted to persons outside the family
g. Other disbursements (major repair and construction of house, payment for goods/servicesacquired/ availed of, back rentals paid during the reference period,etc.)
5. Self-rated poverty
6a. Comparing your quality of life these days to how it was 12 months ago,would you say that your quality of life is ... (Show flash cards)
1 Better now2 Same as before3 Worse now
6b. Where would you place your family in this card? (Show flash card)
1 Not poor2 On the line proceed to 6d3 Poor proceed to 6d
6c. How much would a family, of the same size as yours, which felt it was poor, need for home expenses each month in order not to feel poor anymore? proceed to 6e
6d. How much would your family need for home expenses eachmonth in order not to feel poor anymore?
6e. How many of the last twelve months did you feel that you were poor? (Show flash card)
6f. How many of the last five years did you feel that you were poor? (Show flash card)
6g. How many of the last ten years did you feel that you were poor? (Show flash card)
65
6h. 10 years ago, where would you place your family in this card? (Show flash card)
1 Not poor2 On the line 3 Poor8 Not applicable
E. EMPOWERMENT AND GOVERNANCE
1. Bayanihan/collective action
1a. Over the past six months, did you or any member of your family participate in any bayanihan in the barangay ?
1 YES 2 NO proceed to question 1b
1ai. If yes, what were the three main activities?
Activity
1.
2.
3.
1aii. Who usually represented the family in these activities?
1 Male2 Female3 Both
1aiii. All together, how much time did you or anyone else in your family spend on these activities?
Representative in familyTime spent
(hours)
Male
Female
66
1b. Suppose something unfortunate happened to someone in the barangay/neighborhood, such as a serious illness. How likely is it that some people in the barangay would get together to help them? (Show flash cards)
1 Very likely2 Somewhat likely3 Neither likely or unlikely4 Somewhat unlikely5 Very unlikely
1c. If a barangay project, such as day care center, does not directly benefit you, but has benefits for many others in the barangay/neighborhood, would you contribute time to the project? Would you contribute money to the project
i. Time ii. Money
2. Social cohesion and inclusion
2a. Are there people in the barangay/neighborhood who are prevented from or deprived of any of the following?
1 Yes go to col. (56)
2 No go to 2c
9 Don’t know go to2c
How many are excluded?1 Only a few people2 Many people, but less than half of the
barangay/neighborhood3 More than half the barangay/
neighborhood
(55) (56)
A. Education/schools
B. Health services/clinics
C. Water
D. Justice
E. Transportation
F. Agricultural extension
2b. Give at most three reasons why some people are excluded from these services?
1 Income level2 Religion3 Ethnicity/ linguistic background/ race/ tribe
1 Will contribute time 1 Will contribute money2 Will not contribute time 2 Will not contribute money3 Depending on availability 3 Depending on availability
67
4 Occupation5 Gender6 Age7 Others, (specify) ______________
2c. In your opinion, is this barangay/neighborhood generally peaceful or marked by crime and violence? (Show flash cards)
1 Very peaceful2 Somewhat peaceful3 Neither peaceful nor violent4 Somewhat violent5 Very violent
2d. Compared to the past year, has the level of crime and violence in this barangay/neighborhood … (Showflash cards)
1 Increased a lot2 Increased a little3 Stayed about the same4 Decreased a little5 Decreased a lot
68
3. Trust and Solidarity
In every barangay, some people get along with others and trust each other, while other people do not. Now, Iwould like to talk to you about trust and solidarity in your community.
3a. In general, do you agree or disagree with the following statements? (Show flash cards)
1 Disagree strongly2 Disagree somewhat3 Neither agree nor disagree4 Agree somewhat5 Agree strongly9 Don’t know
A. Most people who live in this barangay/neighborhood can be trusted.
B. In this barangay/neighborhood, one has to be alert or someone islikely to take advantage of you.
C. Most people in this barangay/neighborhood are willing to help ifyou need it.
D. In this barangay/neighborhood, people generally do not trust eachother in matters of lending and borrowing money.
3b. Now I want to ask you how much you trust different types of people. On a scale of 1 to 5, where 1 means a very small extent and 5 means a very great extent, how much do you trust the people in that category? (Show flash cards)
1 To a very small extent2 To a small extent3 Neither small nor great extent4 To a great extent5 To a very great extent9 Don’t know
A. People from your (ethnic or linguistic group/race/tribe)
B. People from other (ethnic or linguistic groups/race/tribe)
C. Traders
D. Local government officials
E. National government officials
F. Police
G. Teachers
H. Nurses and doctors
I. Strangers
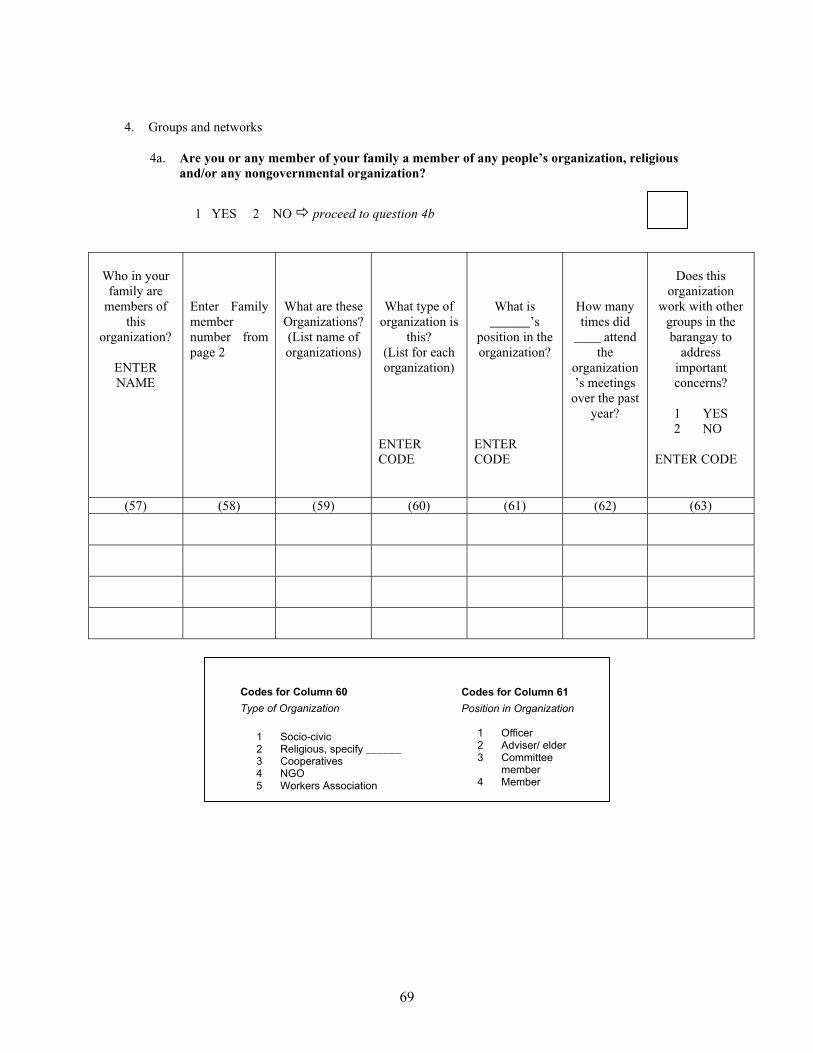
69
4. Groups and networks
4a. Are you or any member of your family a member of any people’s organization, religious and/or any nongovernmental organization?
1 YES 2 NO proceed to question 4b
Who in your family are
members of this
organization?
ENTERNAME
Enter Familymembernumber frompage 2
What are theseOrganizations?(List name of organizations)
What type of organization is
this?(List for each organization)
ENTERCODE
What is ______’s
position in the organization?
ENTERCODE
How many times did
____ attend the
organization’s meetings
over the past year?
Does this organization
work with other groups in the barangay to
addressimportantconcerns?
1 YES2 NO
ENTER CODE
(57) (58) (59) (60) (61) (62) (63)
Codes for Column 60
Type of Organization
1 Socio-civic2 Religious, specify ______3 Cooperatives4 NGO5 Workers Association
Codes for Column 61
Position in Organization
1 Officer2 Adviser/ elder 3 Committee
member4 Member
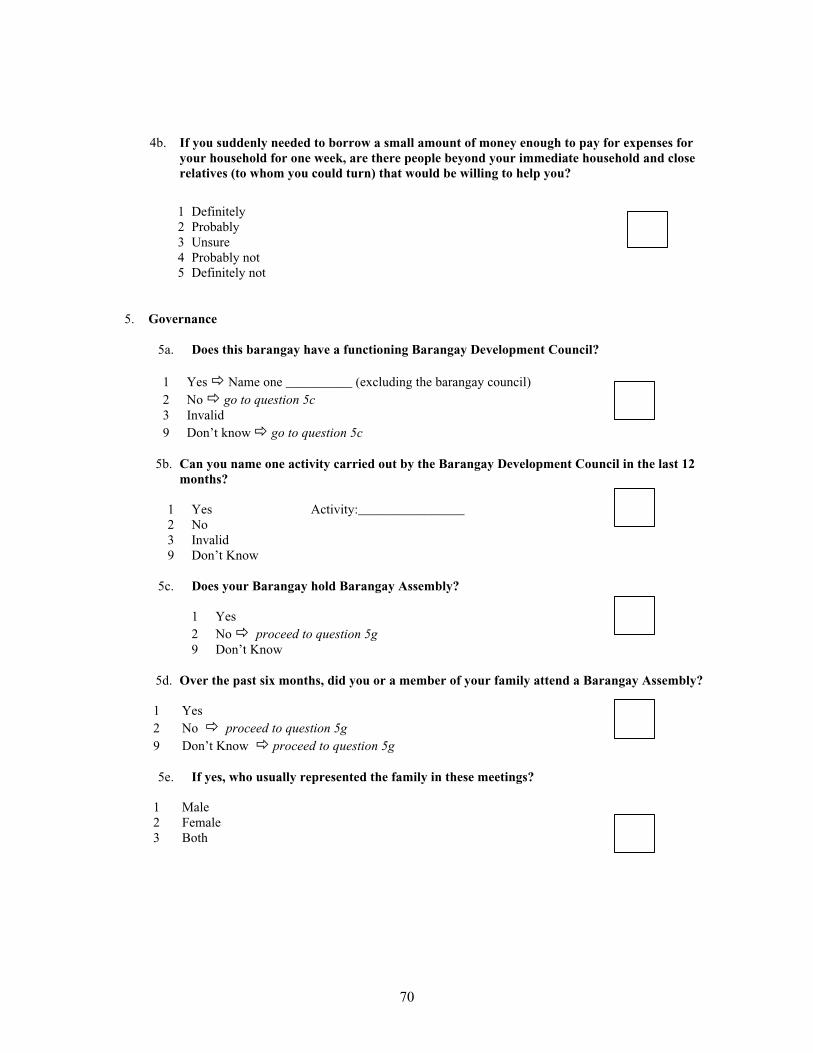
70
4b. If you suddenly needed to borrow a small amount of money enough to pay for expenses for your household for one week, are there people beyond your immediate household and close relatives (to whom you could turn) that would be willing to help you?
1 Definitely2 Probably3 Unsure4 Probably not5 Definitely not
5. Governance
5a. Does this barangay have a functioning Barangay Development Council?
1 Yes Name one __________ (excluding the barangay council) 2 No go to question 5c3 Invalid9 Don’t know go to question 5c
5b. Can you name one activity carried out by the Barangay Development Council in the last 12 months?
1 Yes Activity:________________2 No3 Invalid9 Don’t Know
5c. Does your Barangay hold Barangay Assembly?
1 Yes2 No proceed to question 5g9 Don’t Know
5d. Over the past six months, did you or a member of your family attend a Barangay Assembly?
1 Yes2 No proceed to question 5g9 Don’t Know proceed to question 5g
5e. If yes, who usually represented the family in these meetings?
1 Male2 Female3 Both
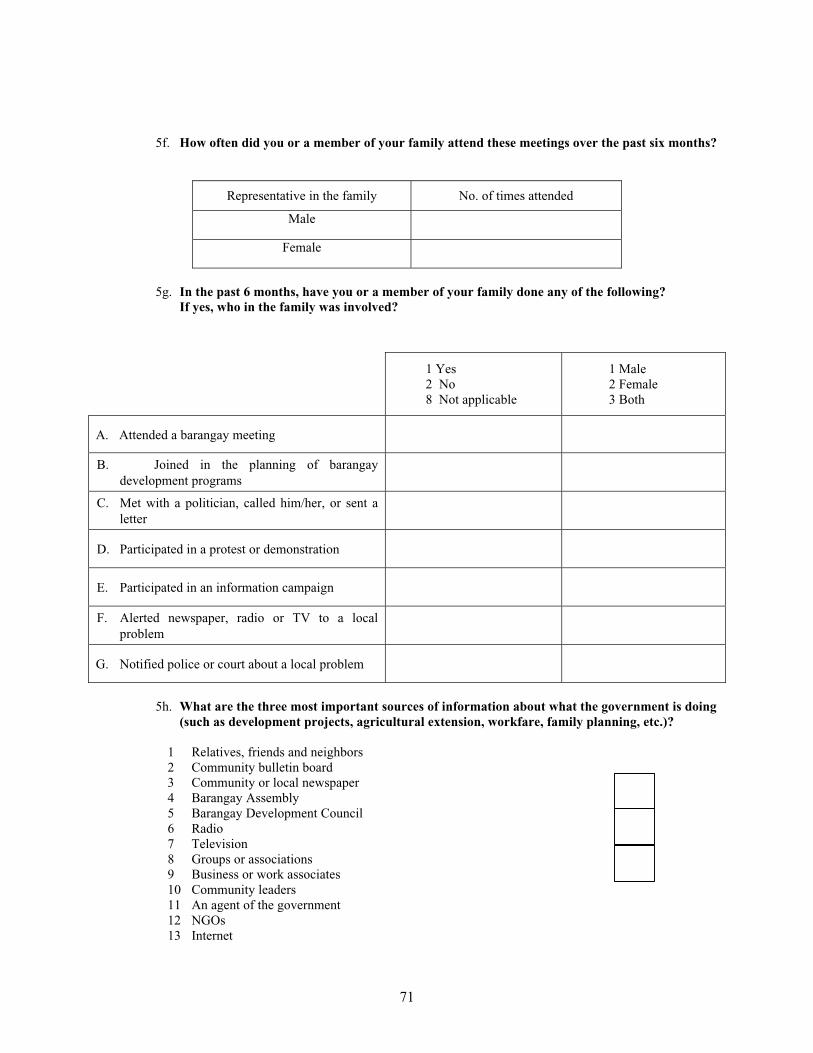
71
5f. How often did you or a member of your family attend these meetings over the past six months?
Representative in the family No. of times attended
Male
Female
5g. In the past 6 months, have you or a member of your family done any of the following? If yes, who in the family was involved?
5h. What are the three most important sources of information about what the government is doing (such as development projects, agricultural extension, workfare, family planning, etc.)?
1 Relatives, friends and neighbors2 Community bulletin board3 Community or local newspaper4 Barangay Assembly5 Barangay Development Council6 Radio7 Television8 Groups or associations9 Business or work associates10 Community leaders11 An agent of the government12 NGOs13 Internet
1 Yes 2 No8 Not applicable
1 Male2 Female3 Both
A. Attended a barangay meeting
B. Joined in the planning of barangaydevelopment programs
C. Met with a politician, called him/her, or sent aletter
D. Participated in a protest or demonstration
E. Participated in an information campaign
F. Alerted newspaper, radio or TV to a localproblem
G. Notified police or court about a local problem
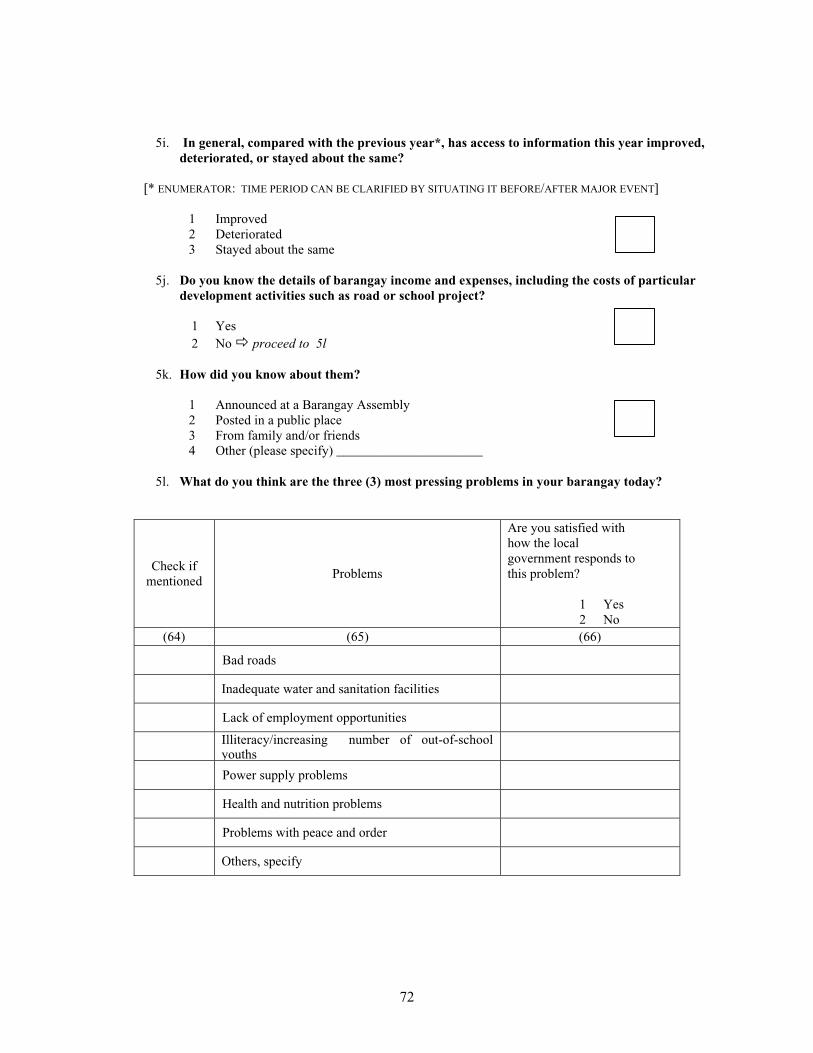
72
5i. In general, compared with the previous year*, has access to information this year improved, deteriorated, or stayed about the same?
[* ENUMERATOR: TIME PERIOD CAN BE CLARIFIED BY SITUATING IT BEFORE/AFTER MAJOR EVENT]
1 Improved2 Deteriorated3 Stayed about the same
5j. Do you know the details of barangay income and expenses, including the costs of particular development activities such as road or school project?
1 Yes2 No proceed to 5l
5k. How did you know about them?
1 Announced at a Barangay Assembly2 Posted in a public place3 From family and/or friends4 Other (please specify) ______________________
5l. What do you think are the three (3) most pressing problems in your barangay today?
Check if mentioned
Problems
Are you satisfied with how the local government responds to this problem?
1 Yes2 No
(64) (65) (66)
Bad roads
Inadequate water and sanitation facilities
Lack of employment opportunities
Illiteracy/increasing number of out-of-schoolyouths
Power supply problems
Health and nutrition problems
Problems with peace and order
Others, specify
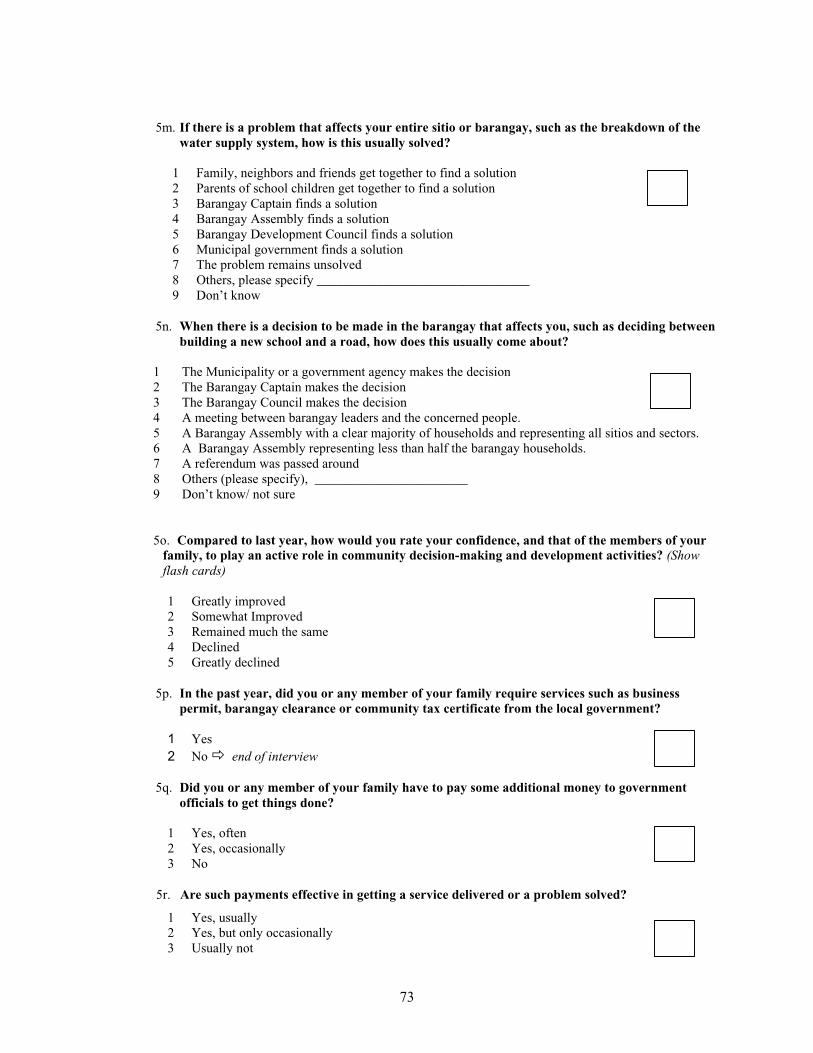
73
5m. If there is a problem that affects your entire sitio or barangay, such as the breakdown of the water supply system, how is this usually solved?
1 Family, neighbors and friends get together to find a solution2 Parents of school children get together to find a solution3 Barangay Captain finds a solution4 Barangay Assembly finds a solution5 Barangay Development Council finds a solution6 Municipal government finds a solution7 The problem remains unsolved8 Others, please specify ________________________________9 Don’t know
5n. When there is a decision to be made in the barangay that affects you, such as deciding between building a new school and a road, how does this usually come about?
1 The Municipality or a government agency makes the decision2 The Barangay Captain makes the decision3 The Barangay Council makes the decision4 A meeting between barangay leaders and the concerned people.5 A Barangay Assembly with a clear majority of households and representing all sitios and sectors.6 A Barangay Assembly representing less than half the barangay households. 7 A referendum was passed around8 Others (please specify), _______________________9 Don’t know/ not sure
5o. Compared to last year, how would you rate your confidence, and that of the members of your family, to play an active role in community decision-making and development activities? (Showflash cards)
1 Greatly improved2 Somewhat Improved3 Remained much the same4 Declined5 Greatly declined
5p. In the past year, did you or any member of your family require services such as business permit, barangay clearance or community tax certificate from the local government?
1 Yes2 No end of interview
5q. Did you or any member of your family have to pay some additional money to government officials to get things done?
1 Yes, often2 Yes, occasionally3 No
5r. Are such payments effective in getting a service delivered or a problem solved?
1 Yes, usually2 Yes, but only occasionally3 Usually not
74
Thank you for your cooperation.
TIME ENDED
Visit 1
Visit 2
Visit 3
References:
Annual Poverty Indicator Survey (APIS)Family, Income and Expenditure Survey (FIES)Benchmark Survey for the Comprehensive Agrarian Reform ProgramSocial Capital Questionnaire (SOCAPIQ) of the World BankSocial Weather Station (SWS) Survey
75
Annex 4: Village Official Survey
LCS Form 2FINAL
LIVING CONDITIONS SURVEY
Interview Schedule for Barangay Official
A. IDENTIFICATION AND OTHER INFORMATION
FIELD COMPARISON
Name of Interviewer __________________________
Date Time Started Remarks
Visit 1
Visit 2
Visit 3
Good (morning, afternoon), I’m _________________ and we are conducting a survey on your community.The purpose of this survey is to find out about your living conditions. The accuracy of the results of the whole survey will depend on your sincere and precise answers. Your input would benefit future planning andmonitoring of programs. The information you give to us will be kept confidential. You and your householdmembers will not be identified by name or address in any of the reports we plan to write.
Thank you for your participation.
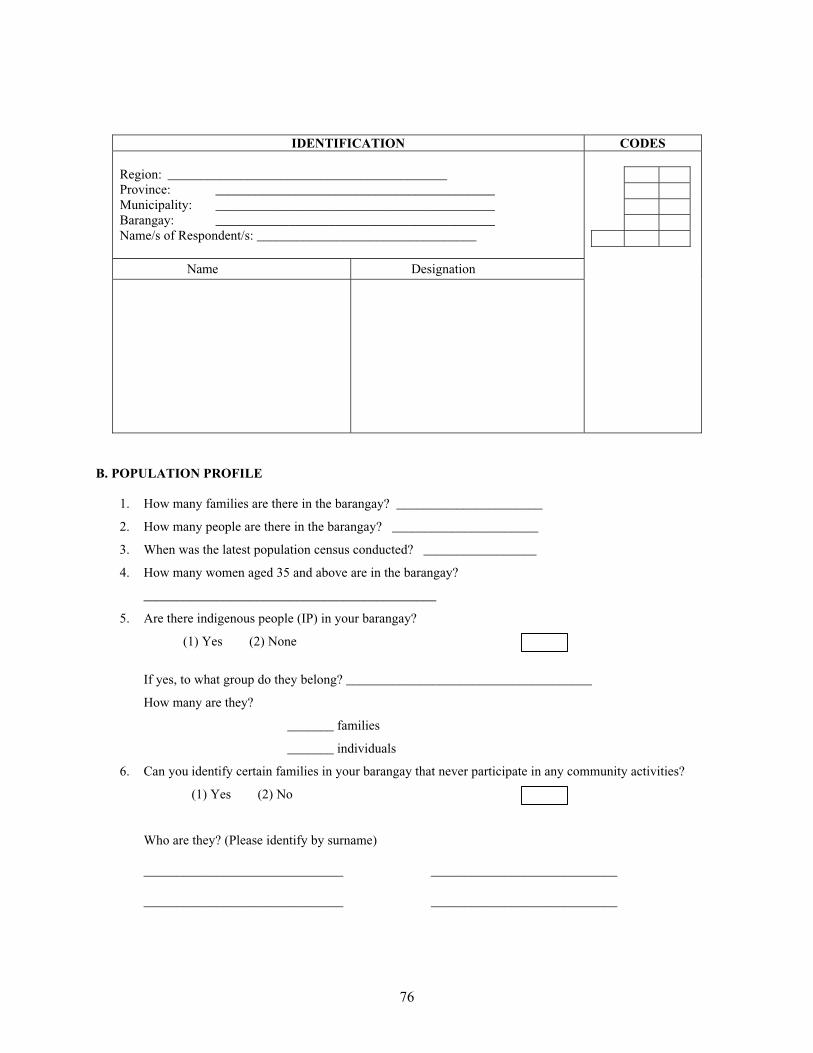
76
IDENTIFICATION CODES
Region: __________________________________________Province: __________________________________________Municipality: __________________________________________Barangay: __________________________________________Name/s of Respondent/s: _________________________________
Name Designation
B. POPULATION PROFILE
1. How many families are there in the barangay? ______________________
2. How many people are there in the barangay? ______________________
3. When was the latest population census conducted? _________________
4. How many women aged 35 and above are in the barangay?
____________________________________________
5. Are there indigenous people (IP) in your barangay?
(1) Yes (2) None
If yes, to what group do they belong? _____________________________________
How many are they?
_______ families
_______ individuals
6. Can you identify certain families in your barangay that never participate in any community activities?
(1) Yes (2) No
Who are they? (Please identify by surname)
______________________________ ____________________________
______________________________ ____________________________
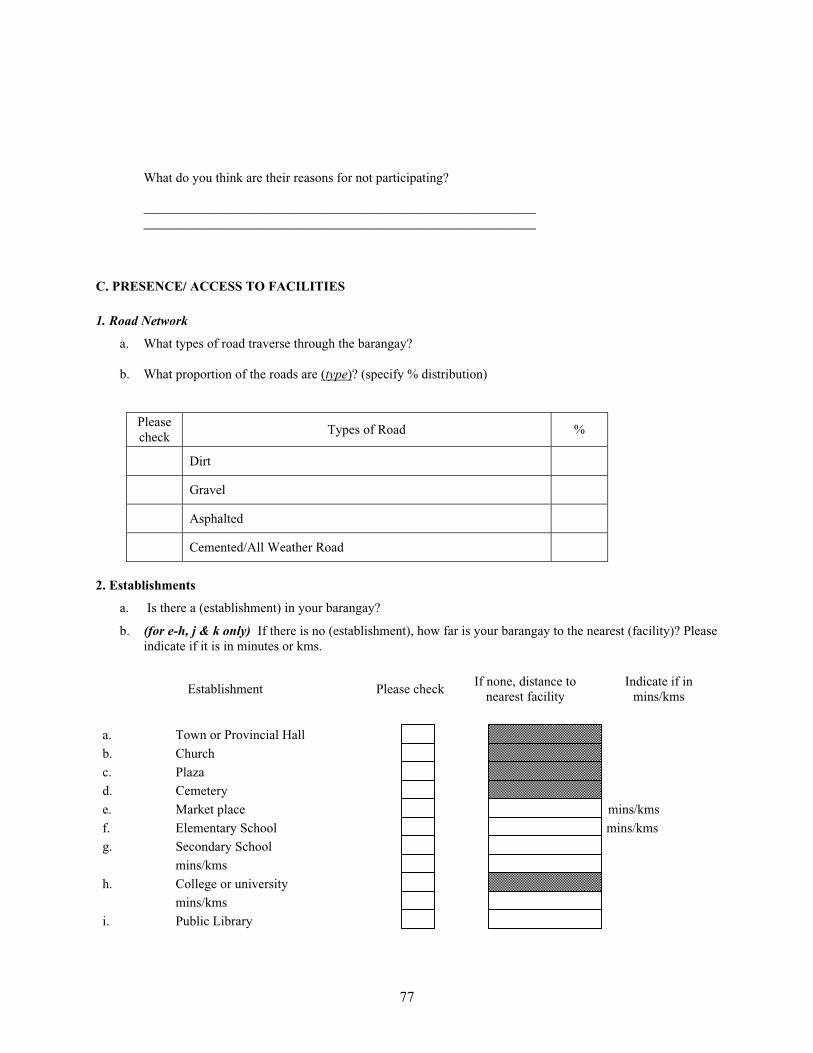
77
What do you think are their reasons for not participating?
______________________________________________________________________________________________________________________
C. PRESENCE/ ACCESS TO FACILITIES
1. Road Network
a. What types of road traverse through the barangay?
b. What proportion of the roads are (type)? (specify % distribution)
Pleasecheck
Types of Road %
Dirt
Gravel
Asphalted
Cemented/All Weather Road
2. Establishments
a. Is there a (establishment) in your barangay?
b. (for e-h, j & k only) If there is no (establishment), how far is your barangay to the nearest (facility)? Please indicate if it is in minutes or kms.
Establishment Please checkIf none, distance to
nearest facilityIndicate if in
mins/kms
a. Town or Provincial Hallb. Churchc. Plazad. Cemeterye. Market place mins/kmsf. Elementary School mins/kmsg. Secondary School
mins/kmsh. College or university
mins/kmsi. Public Library
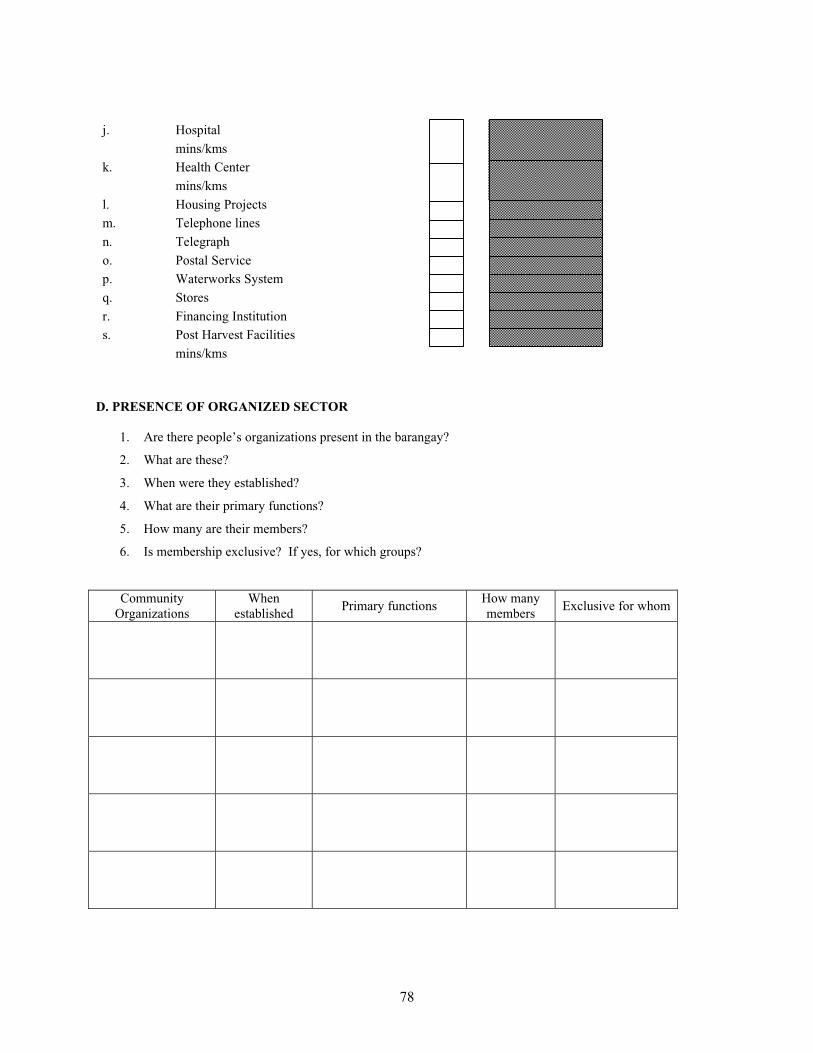
78
j. Hospitalmins/kms
k. Health Centermins/kms
l. Housing Projectsm. Telephone linesn. Telegrapho. Postal Servicep. Waterworks Systemq. Storesr. Financing Institutions. Post Harvest Facilities
mins/kms
D. PRESENCE OF ORGANIZED SECTOR
1. Are there people’s organizations present in the barangay?
2. What are these?
3. When were they established?
4. What are their primary functions?
5. How many are their members?
6. Is membership exclusive? If yes, for which groups?
CommunityOrganizations
Whenestablished
Primary functionsHow many members
Exclusive for whom
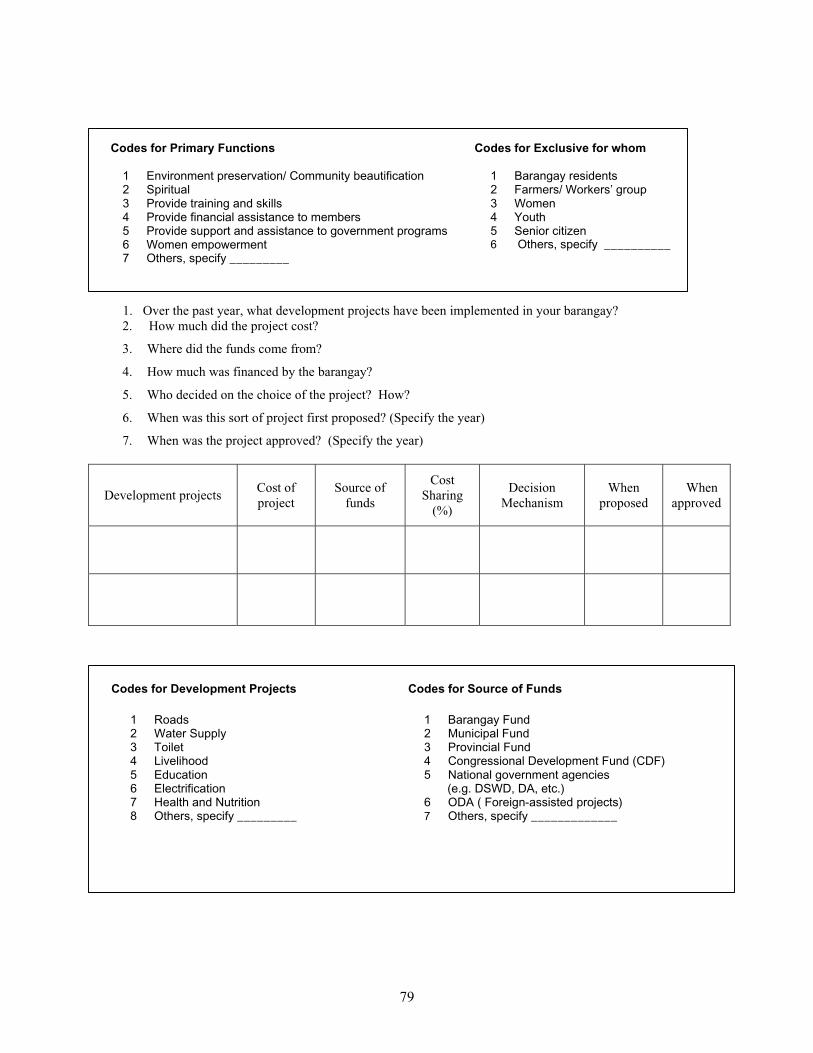
79
E. DEVELOPMENT ACTIVITIES
1. Over the past year, what development projects have been implemented in your barangay?2. How much did the project cost?
3. Where did the funds come from?
4. How much was financed by the barangay?
5. Who decided on the choice of the project? How?
6. When was this sort of project first proposed? (Specify the year)
7. When was the project approved? (Specify the year)
Development projectsCost of project
Source of funds
CostSharing
(%)
DecisionMechanism
Whenproposed
Whenapproved
Codes for Primary Functions
1 Environment preservation/ Community beautification2 Spiritual3 Provide training and skills4 Provide financial assistance to members5 Provide support and assistance to government programs6 Women empowerment7 Others, specify _________
Codes for Exclusive for whom
1 Barangay residents2 Farmers/ Workers’ group3 Women4 Youth5 Senior citizen6 Others, specify __________
Codes for Source of Funds
1 Barangay Fund 2 Municipal Fund3 Provincial Fund4 Congressional Development Fund (CDF)5 National government agencies (e.g. DSWD, DA, etc.) 6 ODA ( Foreign-assisted projects)7 Others, specify _____________
Codes for Development Projects
1 Roads2 Water Supply3 Toilet4 Livelihood5 Education6 Electrification7 Health and Nutrition8 Others, specify _________
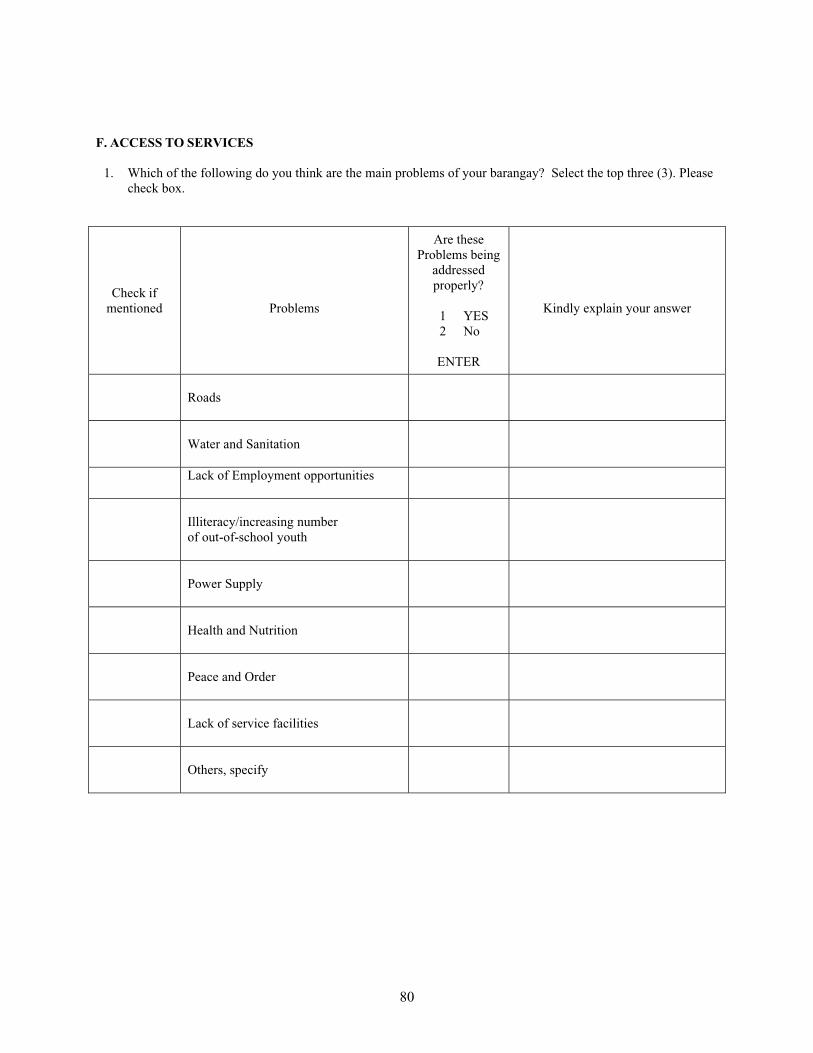
80
F. ACCESS TO SERVICES
1. Which of the following do you think are the main problems of your barangay? Select the top three (3). Please check box.
Check if mentioned Problems
Are theseProblems being
addressedproperly?
1 YES2 No
ENTER
Kindly explain your answer
Roads
Water and Sanitation
Lack of Employment opportunities
Illiteracy/increasing numberof out-of-school youth
Power Supply
Health and Nutrition
Peace and Order
Lack of service facilities
Others, specify
81
2. Over the past six months, how many times did the following personnel visit your barangay either to consult with the community or provide services?
Government OfficialNumberof visits
Mayor/vice mayor/councilor
Municipal planning officer
Municipal agrarian reform officer
Municipal social worker
Agriculture extension worker
Government doctor / Municipal health officer
Government midwife
G. ACCESS TO FINANCIAL RESOURCES
1. How much was your IRA the past year? ________________
2. What other sources of revenue does your barangay have? Please check all that apply.
a. provincial governmentb. municipal governmentc. tax and other fees
i. business tax ii. real property taxiii. clearanceiv. Official Development Assistance
d. Community Development Fund (CDF)e. Others, pls. specify ____________
3. How do you disseminate the information on the financial situation of the barangay to the residents of your barangay? How often is the reporting done?
__________________________________________________________________________________________________________________________________________________________________________________________________________________________________________________________________________________________________________
4. Who are the members of your BDC?
82
5. What is the designation of ______________?
Name of members Designation
1
2
3
4
5
6
7
8
9
10
6. How were the BDC members selected?
_______ identified by the Barangay Captain_______ identified by the Barangay Council_______ approved by entire barangay during a Barangay Assembly_______ approved by entire barangay through a referendum
7. During the past year, how many times did the BDC meet? _________
8. During the past year, what activities did the BDC undertake?
Activity
1
2
3
4
5
6
7
8
9
10
83
9. During the past year, how many times did you meet with the barangay residents?
Others, specify ____________________________________
10. On the average, how many barangay residents are present during the meetings? ______
H. PARTICIPATION IN GOVERNMENT
1. During the past year, how many times did your barangay council meet?
Others, specify____________________________________
2. How many barangay officials do you have in your barangay?
3. On the average, how many of them are present during the meetings?
To the interviewer:Indicate the other sources of information:
__________________________________________________________________
___________________________________________________________________
FIELD COMPARISON
Time Ended: ____________________
No. of MeetingsPer Time
Unit
Month
Quarter
Year
No. of MeetingsPer Time
Unit
Month
Quarter
Year
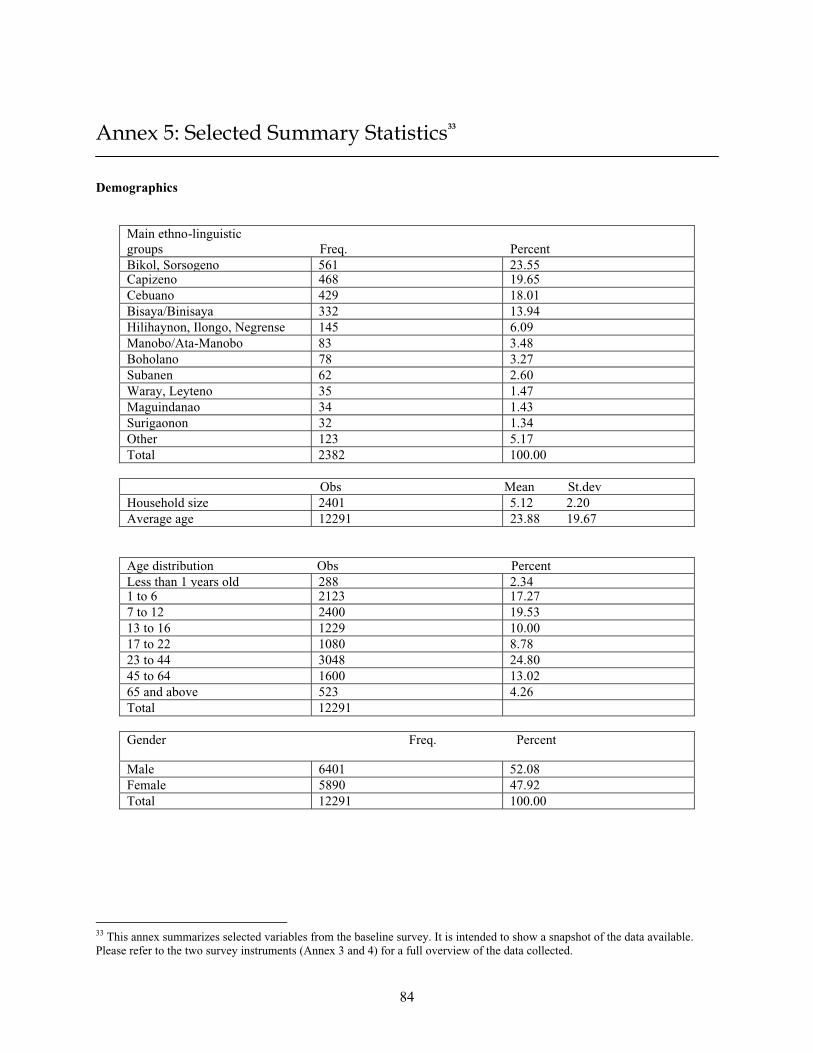
84
Annex 5: Selected Summary Statistics33
Demographics
Main ethno-linguisticgroups Freq. PercentBikol, Sorsogeno 561 23.55Capizeno 468 19.65Cebuano 429 18.01Bisaya/Binisaya 332 13.94Hilihaynon, Ilongo, Negrense 145 6.09Manobo/Ata-Manobo 83 3.48Boholano 78 3.27Subanen 62 2.60Waray, Leyteno 35 1.47Maguindanao 34 1.43Surigaonon 32 1.34Other 123 5.17Total 2382 100.00
Obs Mean St.devHousehold size 2401 5.12 2.20Average age 12291 23.88 19.67
Age distribution Obs PercentLess than 1 years old 288 2.341 to 6 2123 17.277 to 12 2400 19.5313 to 16 1229 10.0017 to 22 1080 8.7823 to 44 3048 24.8045 to 64 1600 13.0265 and above 523 4.26Total 12291
Gender Freq. Percent
Male 6401 52.08Female 5890 47.92Total 12291 100.00
33 This annex summarizes selected variables from the baseline survey. It is intended to show a snapshot of the data available. Please refer to the two survey instruments (Annex 3 and 4) for a full overview of the data collected.
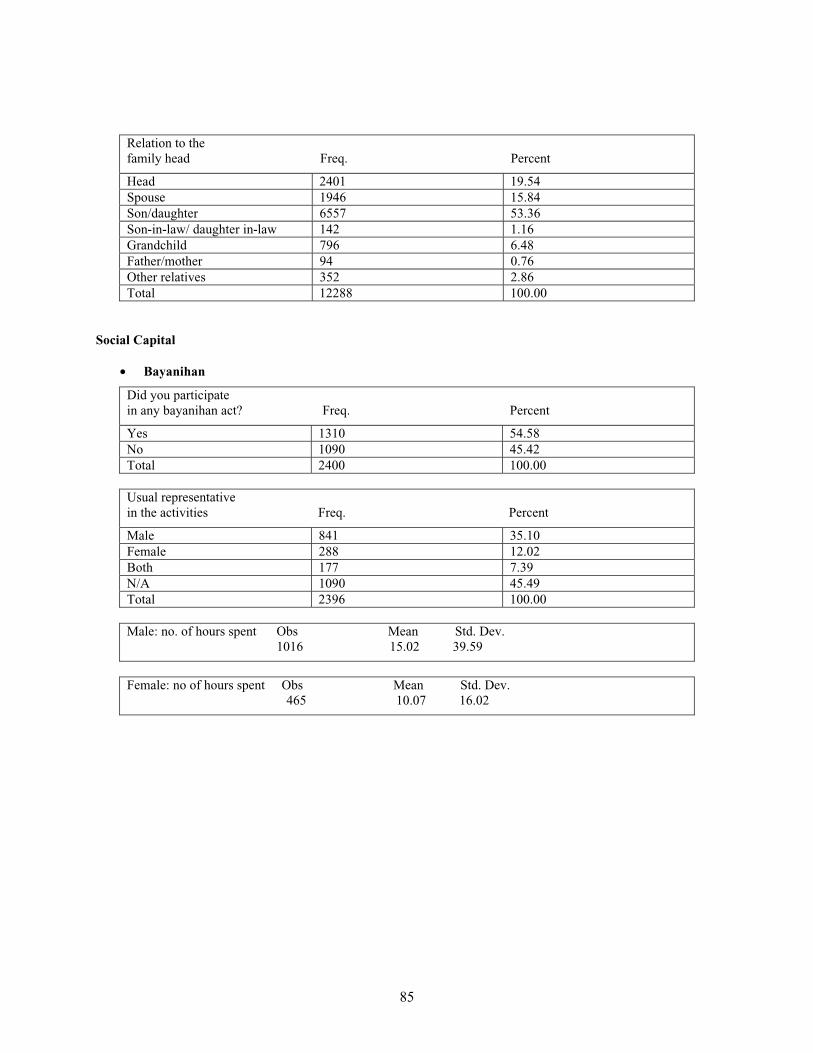
85
Relation to thefamily head Freq. Percent
Head 2401 19.54Spouse 1946 15.84Son/daughter 6557 53.36Son-in-law/ daughter in-law 142 1.16Grandchild 796 6.48Father/mother 94 0.76Other relatives 352 2.86Total 12288 100.00
Social Capital
• Bayanihan
Did you participate in any bayanihan act? Freq. Percent
Yes 1310 54.58No 1090 45.42Total 2400 100.00
Usual representativein the activities Freq. Percent
Male 841 35.10Female 288 12.02Both 177 7.39N/A 1090 45.49Total 2396 100.00
Male: no. of hours spent Obs Mean Std. Dev.1016 15.02 39.59
Female: no of hours spent Obs Mean Std. Dev.465 10.07 16.02
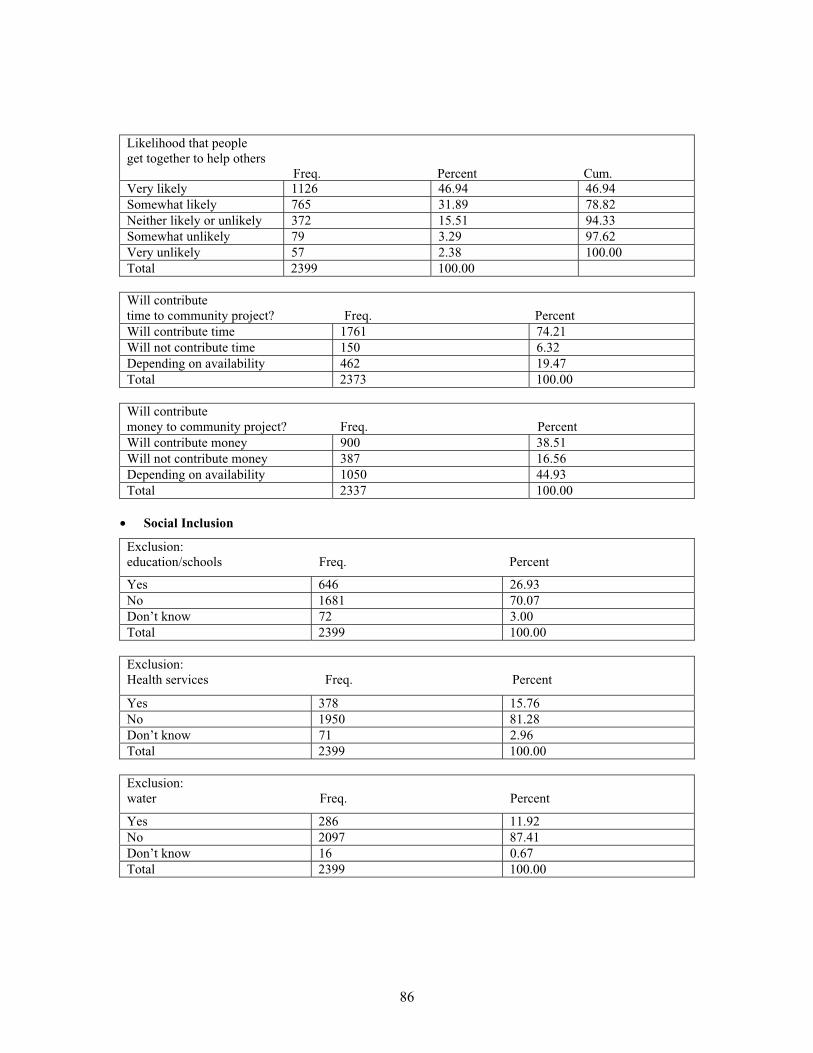
86
Likelihood that peopleget together to help others
Freq. Percent Cum.Very likely 1126 46.94 46.94Somewhat likely 765 31.89 78.82Neither likely or unlikely 372 15.51 94.33Somewhat unlikely 79 3.29 97.62Very unlikely 57 2.38 100.00Total 2399 100.00
Will contributetime to community project? Freq. PercentWill contribute time 1761 74.21Will not contribute time 150 6.32Depending on availability 462 19.47Total 2373 100.00
Will contributemoney to community project? Freq. PercentWill contribute money 900 38.51Will not contribute money 387 16.56Depending on availability 1050 44.93Total 2337 100.00
• Social Inclusion
Exclusion:education/schools Freq. Percent
Yes 646 26.93No 1681 70.07Don’t know 72 3.00Total 2399 100.00
Exclusion:Health services Freq. Percent
Yes 378 15.76No 1950 81.28Don’t know 71 2.96Total 2399 100.00
Exclusion:water Freq. Percent
Yes 286 11.92No 2097 87.41Don’t know 16 0.67Total 2399 100.00
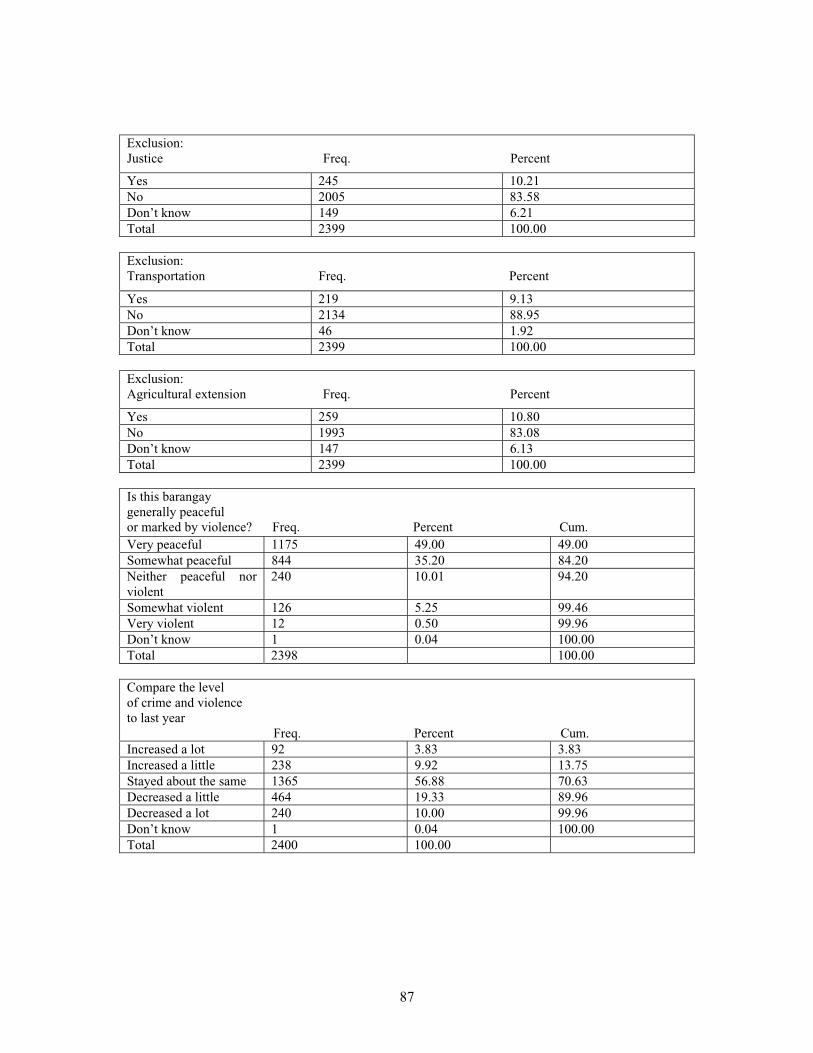
87
Exclusion:Justice Freq. Percent
Yes 245 10.21No 2005 83.58Don’t know 149 6.21Total 2399 100.00
Exclusion:Transportation Freq. Percent
Yes 219 9.13No 2134 88.95Don’t know 46 1.92Total 2399 100.00
Exclusion:Agricultural extension Freq. Percent
Yes 259 10.80No 1993 83.08Don’t know 147 6.13Total 2399 100.00
Is this barangaygenerally peacefulor marked by violence? Freq. Percent Cum.Very peaceful 1175 49.00 49.00Somewhat peaceful 844 35.20 84.20Neither peaceful norviolent
240 10.01 94.20
Somewhat violent 126 5.25 99.46Very violent 12 0.50 99.96Don’t know 1 0.04 100.00Total 2398 100.00
Compare the levelof crime and violenceto last year
Freq. Percent Cum.Increased a lot 92 3.83 3.83Increased a little 238 9.92 13.75Stayed about the same 1365 56.88 70.63Decreased a little 464 19.33 89.96Decreased a lot 240 10.00 99.96Don’t know 1 0.04 100.00Total 2400 100.00
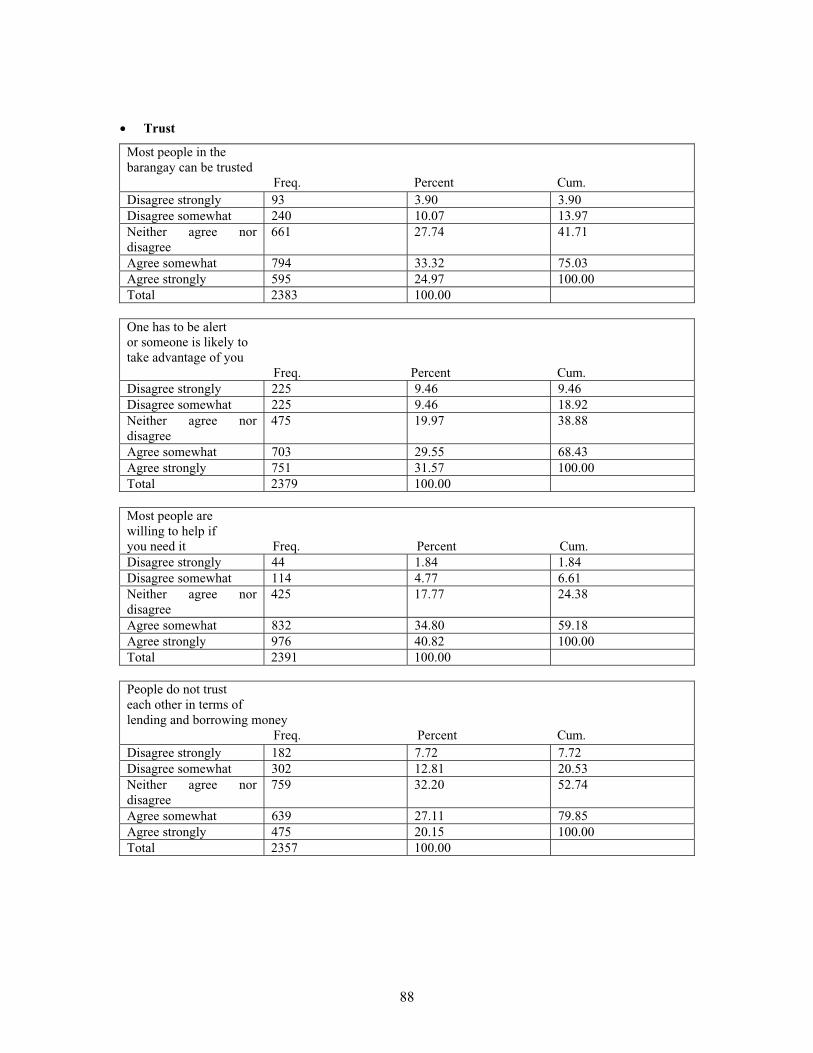
88
• Trust
Most people in thebarangay can be trusted
Freq. Percent Cum.Disagree strongly 93 3.90 3.90Disagree somewhat 240 10.07 13.97Neither agree nordisagree
661 27.74 41.71
Agree somewhat 794 33.32 75.03Agree strongly 595 24.97 100.00Total 2383 100.00
One has to be alertor someone is likely totake advantage of you
Freq. Percent Cum.Disagree strongly 225 9.46 9.46Disagree somewhat 225 9.46 18.92Neither agree nordisagree
475 19.97 38.88
Agree somewhat 703 29.55 68.43Agree strongly 751 31.57 100.00Total 2379 100.00
Most people arewilling to help ifyou need it Freq. Percent Cum.Disagree strongly 44 1.84 1.84Disagree somewhat 114 4.77 6.61Neither agree nordisagree
425 17.77 24.38
Agree somewhat 832 34.80 59.18Agree strongly 976 40.82 100.00Total 2391 100.00
People do not trusteach other in terms of lending and borrowing money
Freq. Percent Cum.Disagree strongly 182 7.72 7.72Disagree somewhat 302 12.81 20.53Neither agree nordisagree
759 32.20 52.74
Agree somewhat 639 27.11 79.85Agree strongly 475 20.15 100.00Total 2357 100.00
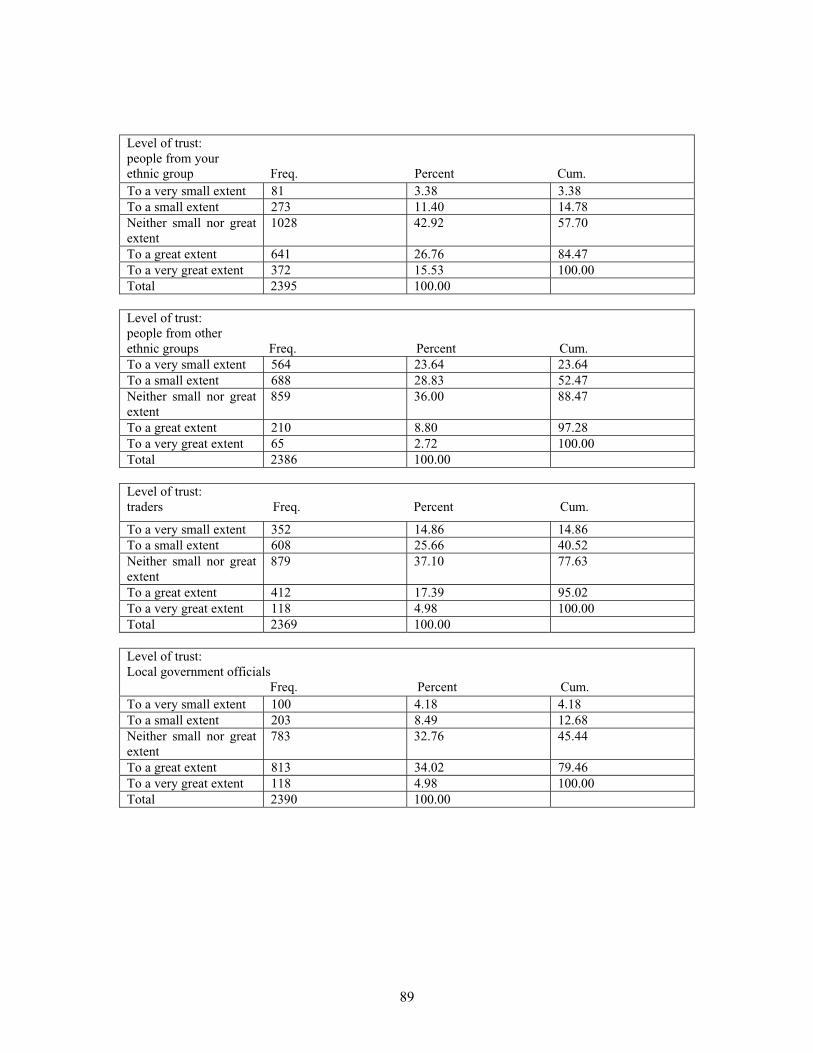
89
Level of trust:people from yourethnic group Freq. Percent Cum.To a very small extent 81 3.38 3.38To a small extent 273 11.40 14.78Neither small nor greatextent
1028 42.92 57.70
To a great extent 641 26.76 84.47To a very great extent 372 15.53 100.00Total 2395 100.00
Level of trust:people from otherethnic groups Freq. Percent Cum.To a very small extent 564 23.64 23.64To a small extent 688 28.83 52.47Neither small nor greatextent
859 36.00 88.47
To a great extent 210 8.80 97.28To a very great extent 65 2.72 100.00Total 2386 100.00
Level of trust:traders Freq. Percent Cum.
To a very small extent 352 14.86 14.86To a small extent 608 25.66 40.52Neither small nor greatextent
879 37.10 77.63
To a great extent 412 17.39 95.02To a very great extent 118 4.98 100.00Total 2369 100.00
Level of trust:Local government officials
Freq. Percent Cum.To a very small extent 100 4.18 4.18To a small extent 203 8.49 12.68Neither small nor greatextent
783 32.76 45.44
To a great extent 813 34.02 79.46To a very great extent 118 4.98 100.00Total 2390 100.00
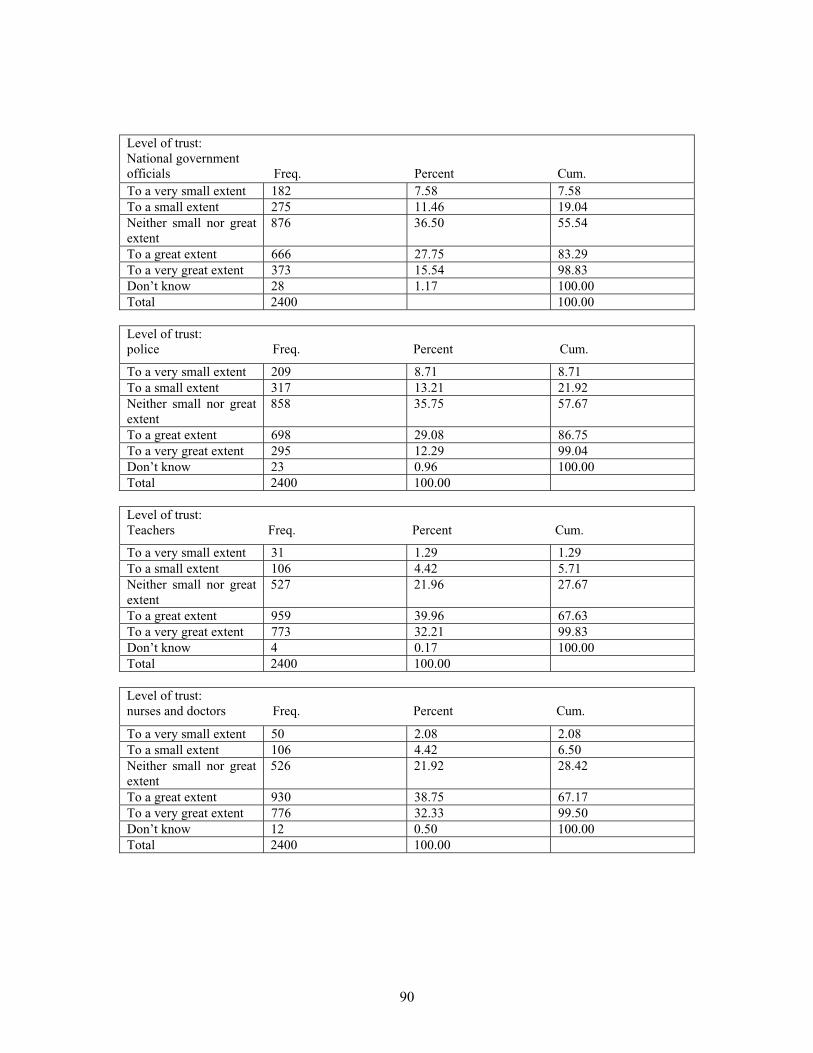
90
Level of trust:National governmentofficials Freq. Percent Cum.To a very small extent 182 7.58 7.58To a small extent 275 11.46 19.04Neither small nor greatextent
876 36.50 55.54
To a great extent 666 27.75 83.29To a very great extent 373 15.54 98.83Don’t know 28 1.17 100.00Total 2400 100.00
Level of trust:police Freq. Percent Cum.
To a very small extent 209 8.71 8.71To a small extent 317 13.21 21.92Neither small nor greatextent
858 35.75 57.67
To a great extent 698 29.08 86.75To a very great extent 295 12.29 99.04Don’t know 23 0.96 100.00Total 2400 100.00
Level of trust:Teachers Freq. Percent Cum.
To a very small extent 31 1.29 1.29To a small extent 106 4.42 5.71Neither small nor greatextent
527 21.96 27.67
To a great extent 959 39.96 67.63To a very great extent 773 32.21 99.83Don’t know 4 0.17 100.00Total 2400 100.00
Level of trust:nurses and doctors Freq. Percent Cum.
To a very small extent 50 2.08 2.08To a small extent 106 4.42 6.50Neither small nor greatextent
526 21.92 28.42
To a great extent 930 38.75 67.17To a very great extent 776 32.33 99.50Don’t know 12 0.50 100.00Total 2400 100.00
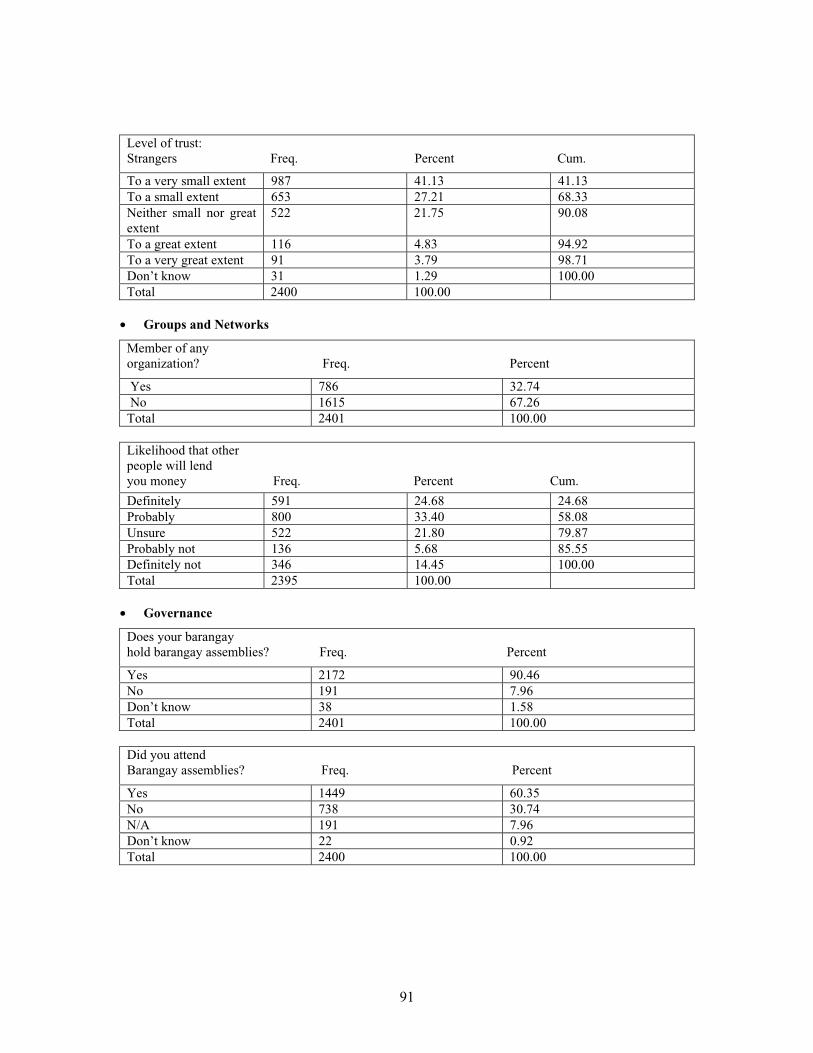
91
Level of trust:Strangers Freq. Percent Cum.
To a very small extent 987 41.13 41.13To a small extent 653 27.21 68.33Neither small nor greatextent
522 21.75 90.08
To a great extent 116 4.83 94.92To a very great extent 91 3.79 98.71Don’t know 31 1.29 100.00Total 2400 100.00
• Groups and Networks
Member of anyorganization? Freq. Percent
Yes 786 32.74 No 1615 67.26Total 2401 100.00
Likelihood that otherpeople will lendyou money Freq. Percent Cum.
Definitely 591 24.68 24.68Probably 800 33.40 58.08Unsure 522 21.80 79.87Probably not 136 5.68 85.55Definitely not 346 14.45 100.00Total 2395 100.00
• Governance
Does your barangayhold barangay assemblies? Freq. Percent
Yes 2172 90.46No 191 7.96Don’t know 38 1.58Total 2401 100.00
Did you attendBarangay assemblies? Freq. Percent
Yes 1449 60.35No 738 30.74N/A 191 7.96Don’t know 22 0.92Total 2400 100.00
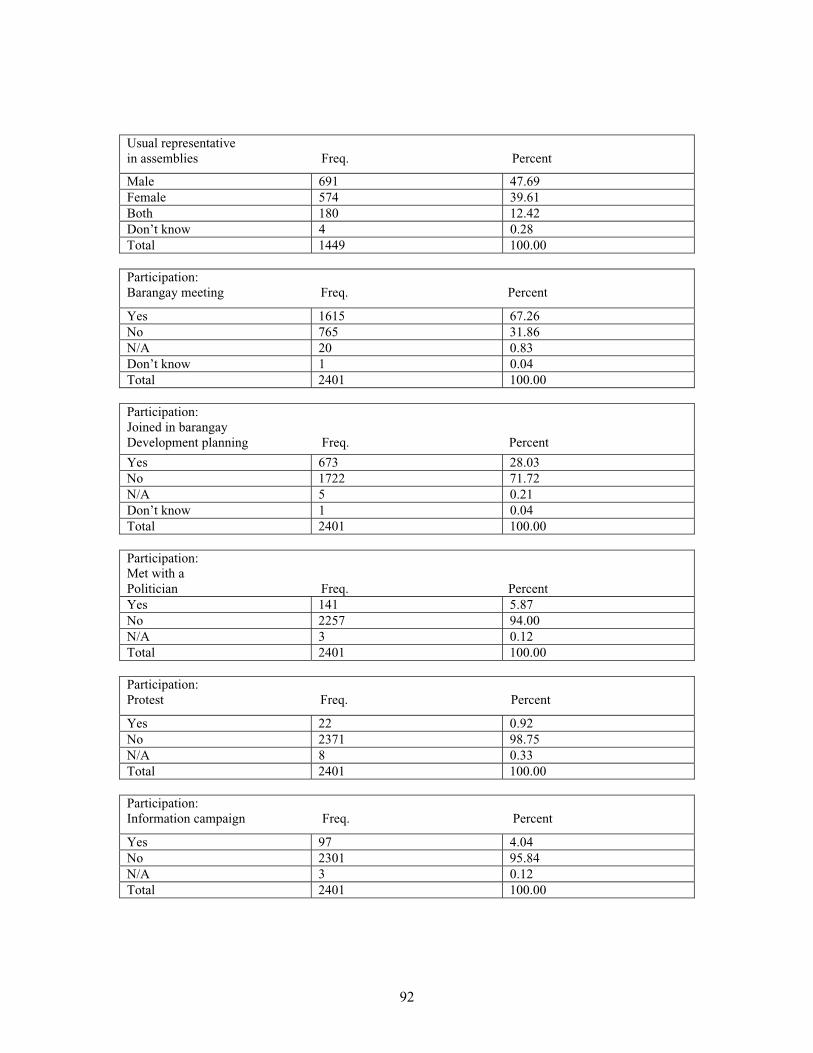
92
Usual representativein assemblies Freq. Percent
Male 691 47.69Female 574 39.61Both 180 12.42Don’t know 4 0.28Total 1449 100.00
Participation:Barangay meeting Freq. Percent
Yes 1615 67.26No 765 31.86N/A 20 0.83Don’t know 1 0.04Total 2401 100.00
Participation:Joined in barangayDevelopment planning Freq. Percent
Yes 673 28.03No 1722 71.72N/A 5 0.21Don’t know 1 0.04Total 2401 100.00
Participation:Met with aPolitician Freq. PercentYes 141 5.87No 2257 94.00N/A 3 0.12Total 2401 100.00
Participation:Protest Freq. Percent
Yes 22 0.92No 2371 98.75N/A 8 0.33Total 2401 100.00
Participation:Information campaign Freq. Percent
Yes 97 4.04No 2301 95.84N/A 3 0.12Total 2401 100.00
93
Participation:Alerted media Freq. Percent
Yes 14 0.58No 2383 99.25N/A 4 0.17Total 2401 100.00
Participation:Notify police or court Freq. Percent
Yes 37 1.54No 2356 98.21N/A 6 0.25Total 2399 100.00
Compare accessibilityof information to past year Freq. Percent
Improved 784 32.71Deteriorated 242 10.10Stayed the same 1368 57.07Don’t know 3 0.13Total 2397 100.00
Do you know the incomeand expense details ofthe barangay? Freq. Percent
Yes 238 9.91No 2163 90.09Total 2401 100.00
How is a barangayproblem usually solved? Freq. Percent
Family, neighbors, friends get together
377 15.71
Parents of school children get together
21 0.88
Barangay captain finds solution 1166 48.60Barangay assembly finds solution
408 17.01
Barangay development councilfinds solution
147 6.13
Municipal government finds Solution
81 3.38
Problem remains unsolved 28 1.17Other 131 5.46Don’t know 40 1.67Total 2399 100.00
94
How does adecision come about? Freq. Percent
Municipality or govt. agency 216 9.01Barangay captain 914 38.12Barangay council 572 23.85Meeting between barangay leaders and the concerned people
238 9.92
Barangay assembly with majority of households and all sitios
272 11.34
Barangay assembly with less than half of households
47 1.96
Referendum passed around 2 0.08Other 14 0.59Don’t know 123 5.13Total 2398 100.00
Confidence to participatein activities and decision-making,compared to last year
Freq. Percent Cum.Greatly improved 362 15.08 15.08Somewhat improved 618 25.75 40.83Same 1261 52.54 93.38Declined 131 5.46 98.83Greatly declined 24 1.00 99.83Don’t know 4 0.17 100.00Total 2400 100.00
Expenditures
Obs. Mean St.dev
Mean per capitamonthly expenditure
2401 995.27 6085
Medical expenditures(past 6 months)
2401 1871 44631
Education expenditures(past 6 months)
2401 1673 27970
Self-rated poverty
Compare quality oflife now to 12 months ago Freq. Percent Cum.Better now 363 15.12 15.12Same as before 855 35.61 50.73Worse now 1181 49.19 99.92N/A 2 0.08 100.00Total 2401 100.00
95
Where would you placeyour family on this card?
Freq. Percent Cum.Not poor 97 4.04 4.04On the line 598 24.91 28.95Poor 1706 71.05 100.00Total 2401 100.00
Non-poor family:How much would a family, of thesame size as yours, which feltit was poor, need for home expenses each month in order notto feel poor anymore? Obs Mean Std. Dev.
97 5359.79 5104.02
Poor or on the line:How much would your family need for home expenses each month in order not to feelpoor anymore? Obs Mean Std. Dev.
2297 7441.76 32511.4
How many of the lasttwelve months did you feel that you werepoor? Obs Mean Std. Dev.
2396 6.39 4.28
Health
Did ____ get sickduring thelast 6 months? Freq. PercentYes 6245 50.81No 6046 49.19Total 12291 100.00
Did ___ see any health practitionerduring the past 6 months? Freq. PercentYes 2825 23.01No 9454 76.99Total 12279 100.00
96
Means of travel tohealth facility Freq. Percent
Walking 886 37.01Bus, car, jeep 351 14.66
Motorcycle/ tricycle 1061 44.32Bicycle/Pedicab 61 2.55Motorized boat 30 1.25Non-motorized boat 2 0.08N/A 3 0.13Total 2394 100.00
Time it takes to travel to health facility Freq. Percent Cum.<15 minutes 1070 44.56 44.5615-30 minutes 659 27.45 72.0130-60 minutes 332 13.83 85.84>1 hour 328 13.66 99.50N/A 12 0.5 100.0Total 2401 100.00
Do you get the needed health services? Freq. Percent
Always 1136 47.31Never 1166 48.56Sometimes 84 3.50N/A 15 0.62Total 2401 100.00
Education
Enrollment ratesObs Mean St.dev
Elementary school 1424 0.93 3.23High school 897 0.70 4.35College 919 0.08 1.76
Currentlyattendingschool? Freq. PercentYes 3757 30.57No 1366 11.11N/A 7167 58.32Total 12290 100.00
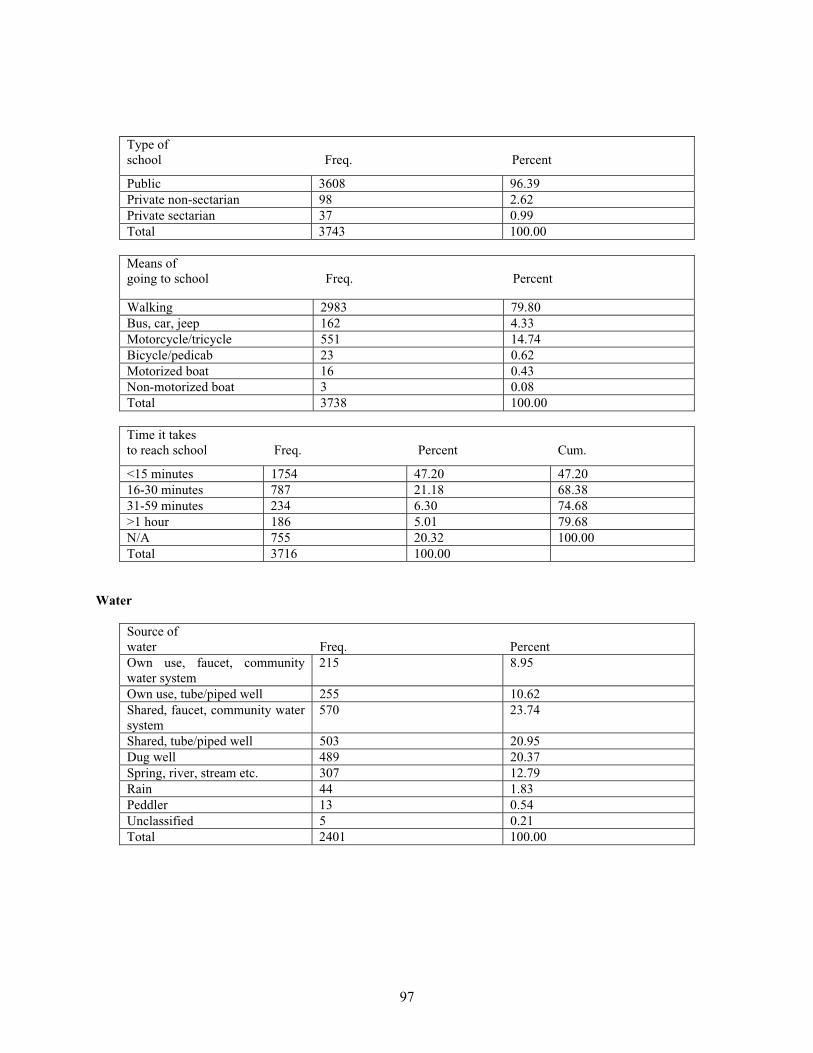
97
Type of school Freq. Percent
Public 3608 96.39Private non-sectarian 98 2.62Private sectarian 37 0.99Total 3743 100.00
Means ofgoing to school Freq. Percent
Walking 2983 79.80Bus, car, jeep 162 4.33Motorcycle/tricycle 551 14.74Bicycle/pedicab 23 0.62Motorized boat 16 0.43Non-motorized boat 3 0.08Total 3738 100.00
Time it takesto reach school Freq. Percent Cum.
<15 minutes 1754 47.20 47.2016-30 minutes 787 21.18 68.3831-59 minutes 234 6.30 74.68>1 hour 186 5.01 79.68N/A 755 20.32 100.00Total 3716 100.00
Water
Source of water Freq. PercentOwn use, faucet, communitywater system
215 8.95
Own use, tube/piped well 255 10.62Shared, faucet, community watersystem
570 23.74
Shared, tube/piped well 503 20.95Dug well 489 20.37Spring, river, stream etc. 307 12.79Rain 44 1.83Peddler 13 0.54Unclassified 5 0.21Total 2401 100.00
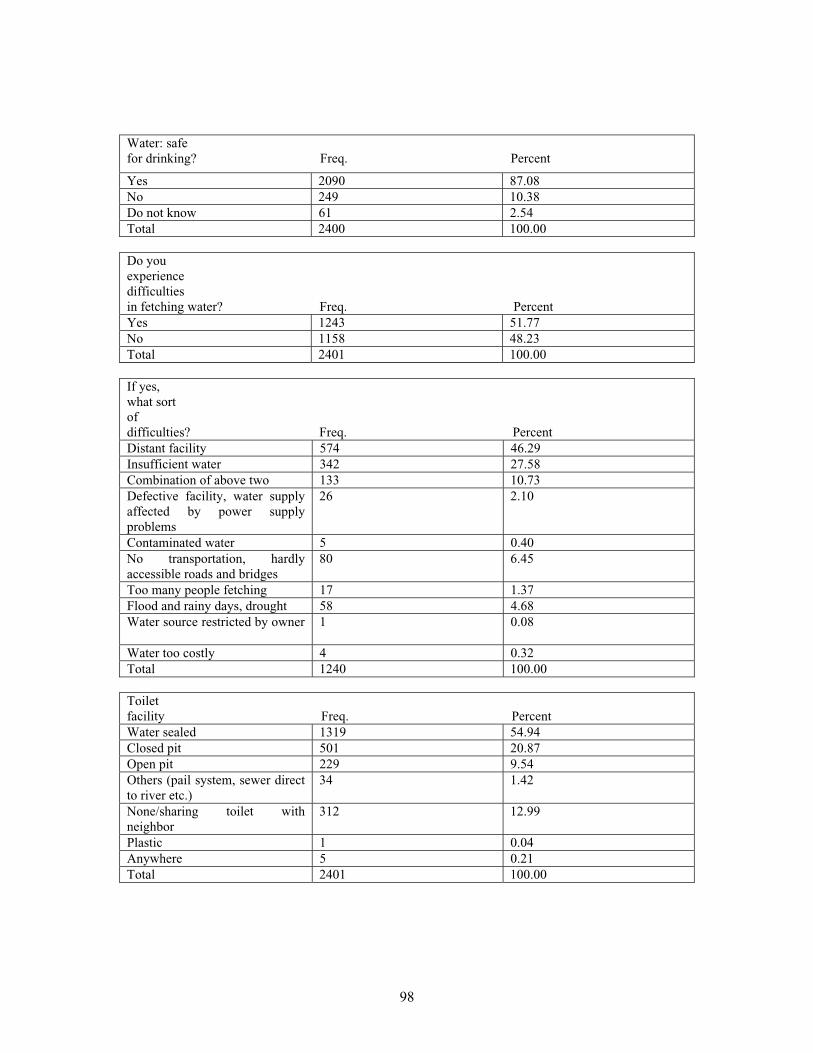
98
Water: safe for drinking? Freq. Percent
Yes 2090 87.08No 249 10.38Do not know 61 2.54Total 2400 100.00
Do you experiencedifficultiesin fetching water? Freq. PercentYes 1243 51.77No 1158 48.23Total 2401 100.00
If yes, what sortofdifficulties? Freq. PercentDistant facility 574 46.29Insufficient water 342 27.58Combination of above two 133 10.73Defective facility, water supplyaffected by power supplyproblems
26 2.10
Contaminated water 5 0.40No transportation, hardlyaccessible roads and bridges
80 6.45
Too many people fetching 17 1.37Flood and rainy days, drought 58 4.68Water source restricted by owner 1 0.08
Water too costly 4 0.32Total 1240 100.00
Toiletfacility Freq. PercentWater sealed 1319 54.94Closed pit 501 20.87Open pit 229 9.54Others (pail system, sewer directto river etc.)
34 1.42
None/sharing toilet withneighbor
312 12.99
Plastic 1 0.04Anywhere 5 0.21Total 2401 100.00
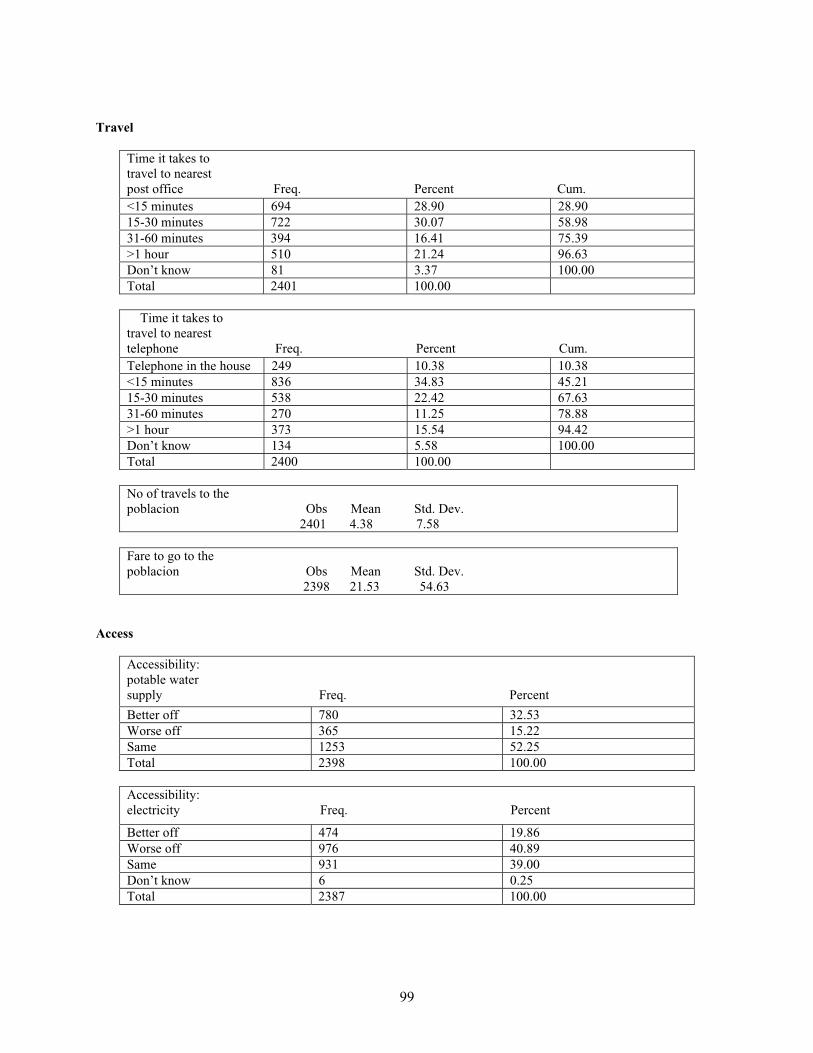
99
Travel
Time it takes totravel to nearestpost office Freq. Percent Cum.<15 minutes 694 28.90 28.9015-30 minutes 722 30.07 58.9831-60 minutes 394 16.41 75.39>1 hour 510 21.24 96.63Don’t know 81 3.37 100.00Total 2401 100.00
Time it takes totravel to nearesttelephone Freq. Percent Cum.Telephone in the house 249 10.38 10.38<15 minutes 836 34.83 45.2115-30 minutes 538 22.42 67.6331-60 minutes 270 11.25 78.88>1 hour 373 15.54 94.42Don’t know 134 5.58 100.00Total 2400 100.00
No of travels to thepoblacion Obs Mean Std. Dev.
2401 4.38 7.58
Fare to go to thepoblacion Obs Mean Std. Dev.
2398 21.53 54.63
Access
Accessibility:potable watersupply Freq. Percent
Better off 780 32.53Worse off 365 15.22Same 1253 52.25Total 2398 100.00
Accessibility:electricity Freq. Percent
Better off 474 19.86Worse off 976 40.89Same 931 39.00Don’t know 6 0.25Total 2387 100.00
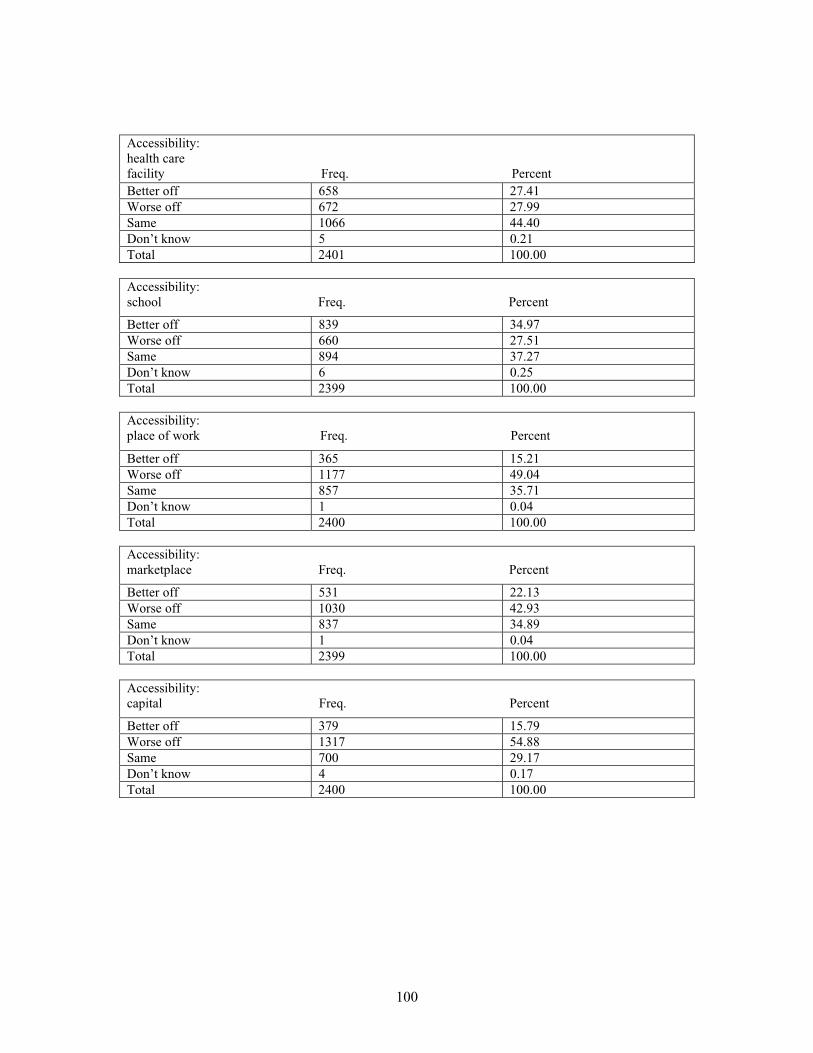
100
Accessibility:health care facility Freq. PercentBetter off 658 27.41Worse off 672 27.99Same 1066 44.40Don’t know 5 0.21Total 2401 100.00
Accessibility:school Freq. Percent
Better off 839 34.97Worse off 660 27.51Same 894 37.27Don’t know 6 0.25Total 2399 100.00
Accessibility:place of work Freq. Percent
Better off 365 15.21Worse off 1177 49.04Same 857 35.71Don’t know 1 0.04Total 2400 100.00
Accessibility:marketplace Freq. Percent
Better off 531 22.13Worse off 1030 42.93Same 837 34.89Don’t know 1 0.04Total 2399 100.00
Accessibility:capital Freq. Percent
Better off 379 15.79Worse off 1317 54.88Same 700 29.17Don’t know 4 0.17Total 2400 100.00
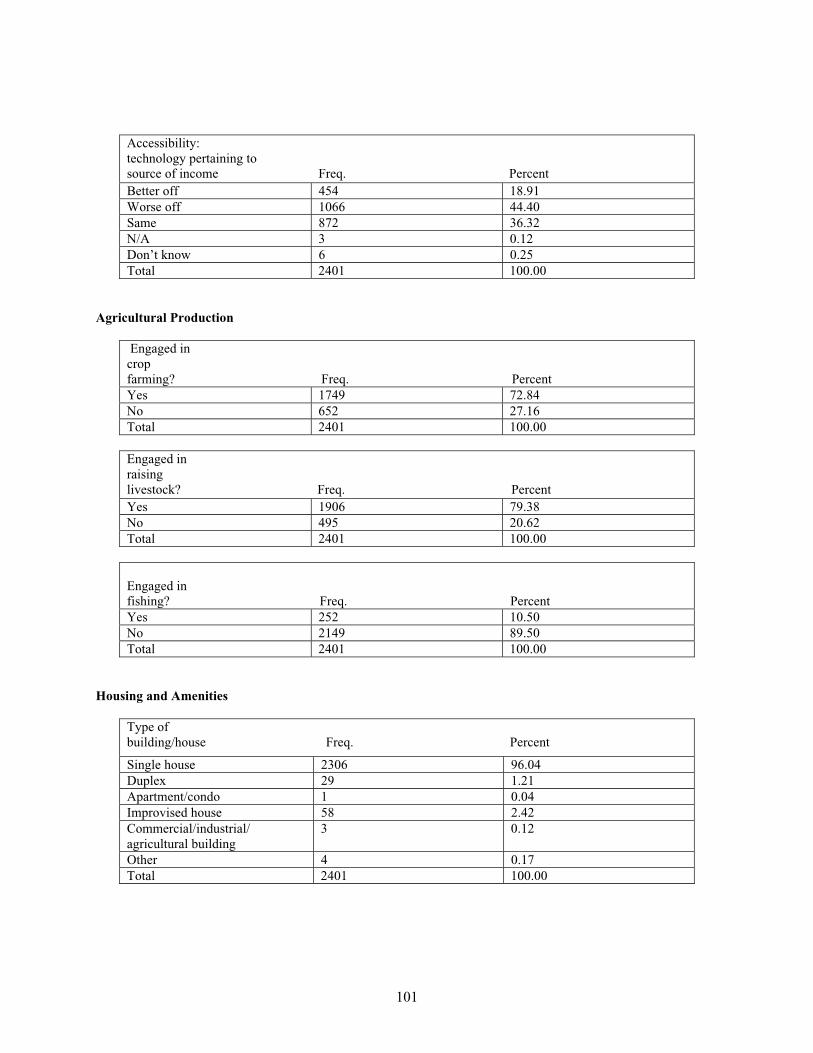
101
Accessibility:technology pertaining tosource of income Freq. PercentBetter off 454 18.91Worse off 1066 44.40Same 872 36.32N/A 3 0.12Don’t know 6 0.25Total 2401 100.00
Agricultural Production
Engaged in cropfarming? Freq. PercentYes 1749 72.84No 652 27.16Total 2401 100.00
Engaged in raisinglivestock? Freq. PercentYes 1906 79.38No 495 20.62Total 2401 100.00
Engaged infishing? Freq. PercentYes 252 10.50No 2149 89.50Total 2401 100.00
Housing and Amenities
Type of building/house Freq. Percent
Single house 2306 96.04Duplex 29 1.21Apartment/condo 1 0.04Improvised house 58 2.42Commercial/industrial/agricultural building
3 0.12
Other 4 0.17Total 2401 100.00
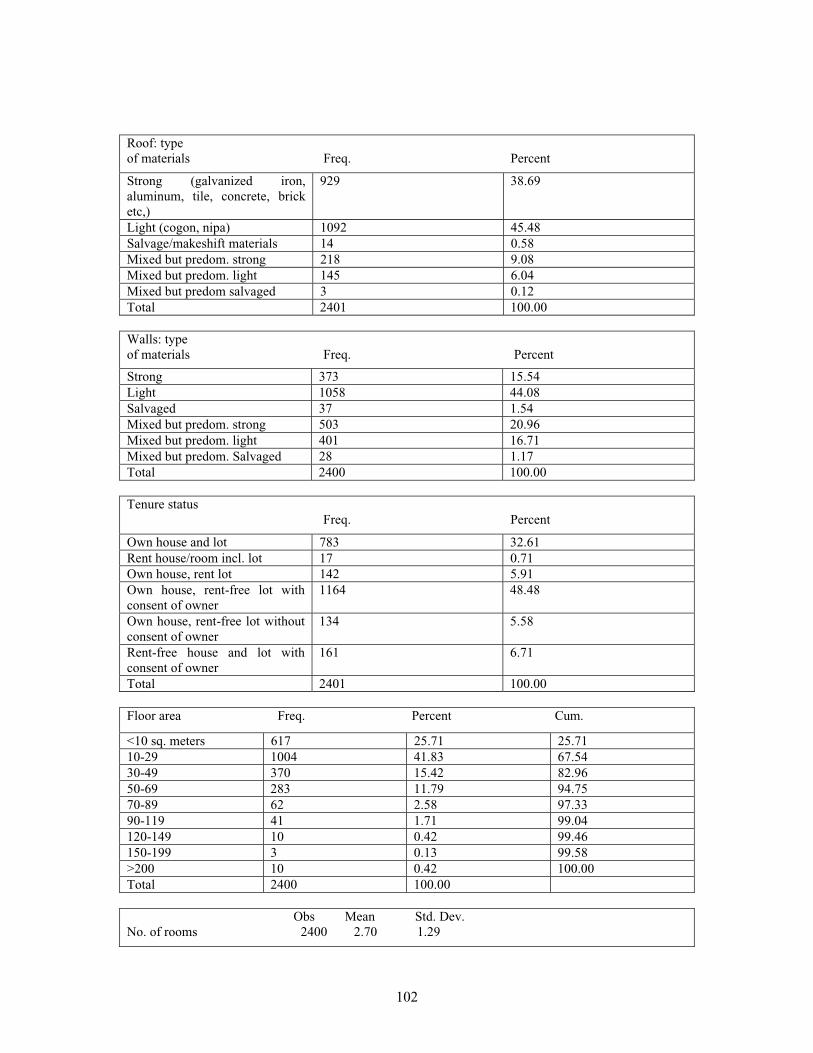
102
Roof: typeof materials Freq. Percent
Strong (galvanized iron,aluminum, tile, concrete, bricketc,)
929 38.69
Light (cogon, nipa) 1092 45.48Salvage/makeshift materials 14 0.58Mixed but predom. strong 218 9.08Mixed but predom. light 145 6.04Mixed but predom salvaged 3 0.12Total 2401 100.00
Walls: typeof materials Freq. Percent
Strong 373 15.54Light 1058 44.08Salvaged 37 1.54Mixed but predom. strong 503 20.96Mixed but predom. light 401 16.71Mixed but predom. Salvaged 28 1.17Total 2400 100.00
Tenure statusFreq. Percent
Own house and lot 783 32.61Rent house/room incl. lot 17 0.71Own house, rent lot 142 5.91Own house, rent-free lot withconsent of owner
1164 48.48
Own house, rent-free lot withoutconsent of owner
134 5.58
Rent-free house and lot withconsent of owner
161 6.71
Total 2401 100.00
Floor area Freq. Percent Cum.
<10 sq. meters 617 25.71 25.7110-29 1004 41.83 67.5430-49 370 15.42 82.9650-69 283 11.79 94.7570-89 62 2.58 97.3390-119 41 1.71 99.04120-149 10 0.42 99.46150-199 3 0.13 99.58>200 10 0.42 100.00Total 2400 100.00
Obs Mean Std. Dev.No. of rooms 2400 2.70 1.29
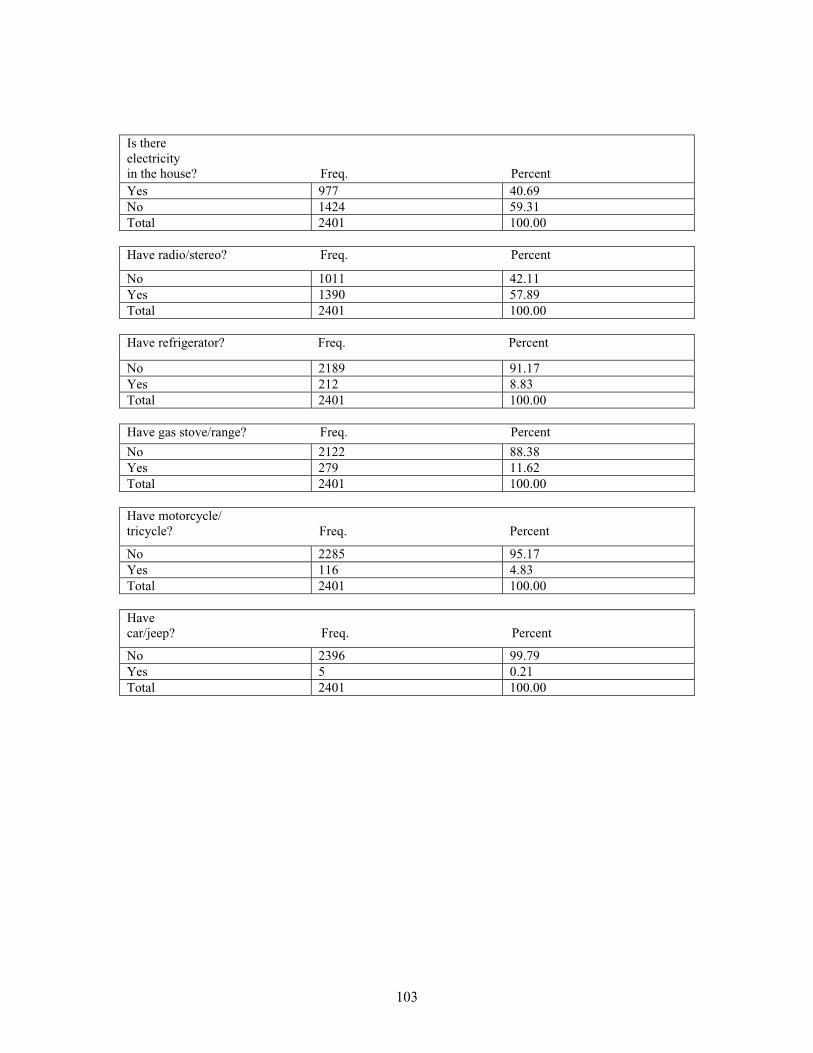
103
Is thereelectricityin the house? Freq. PercentYes 977 40.69No 1424 59.31Total 2401 100.00
Have radio/stereo? Freq. Percent
No 1011 42.11Yes 1390 57.89Total 2401 100.00
Have refrigerator? Freq. Percent
No 2189 91.17Yes 212 8.83Total 2401 100.00
Have gas stove/range? Freq. Percent
No 2122 88.38Yes 279 11.62Total 2401 100.00
Have motorcycle/tricycle? Freq. Percent
No 2285 95.17Yes 116 4.83Total 2401 100.00
Havecar/jeep? Freq. Percent
No 2396 99.79Yes 5 0.21Total 2401 100.00
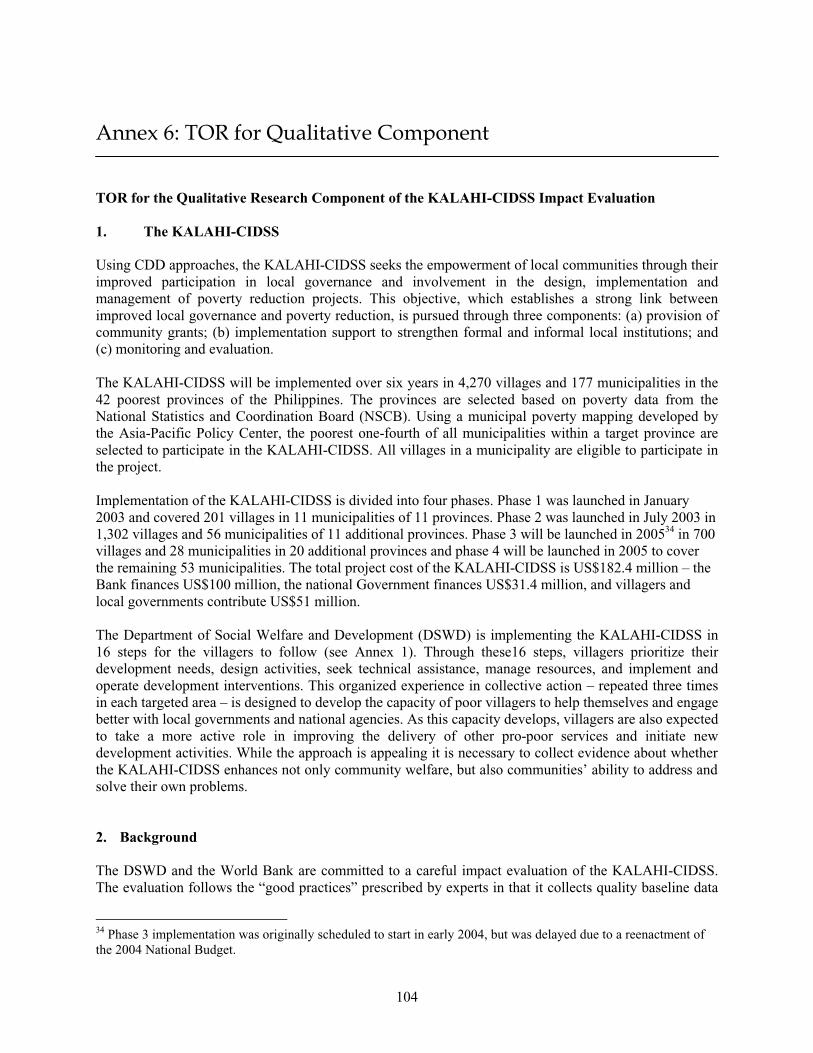
104
Annex 6: TOR for Qualitative Component
TOR for the Qualitative Research Component of the KALAHI-CIDSS Impact Evaluation
1. The KALAHI-CIDSS
Using CDD approaches, the KALAHI-CIDSS seeks the empowerment of local communities through their improved participation in local governance and involvement in the design, implementation andmanagement of poverty reduction projects. This objective, which establishes a strong link betweenimproved local governance and poverty reduction, is pursued through three components: (a) provision ofcommunity grants; (b) implementation support to strengthen formal and informal local institutions; and(c) monitoring and evaluation.
The KALAHI-CIDSS will be implemented over six years in 4,270 villages and 177 municipalities in the42 poorest provinces of the Philippines. The provinces are selected based on poverty data from theNational Statistics and Coordination Board (NSCB). Using a municipal poverty mapping developed bythe Asia-Pacific Policy Center, the poorest one-fourth of all municipalities within a target province areselected to participate in the KALAHI-CIDSS. All villages in a municipality are eligible to participate inthe project.
Implementation of the KALAHI-CIDSS is divided into four phases. Phase 1 was launched in January 2003 and covered 201 villages in 11 municipalities of 11 provinces. Phase 2 was launched in July 2003 in 1,302 villages and 56 municipalities of 11 additional provinces. Phase 3 will be launched in 200534 in 700 villages and 28 municipalities in 20 additional provinces and phase 4 will be launched in 2005 to cover the remaining 53 municipalities. The total project cost of the KALAHI-CIDSS is US$182.4 million – the Bank finances US$100 million, the national Government finances US$31.4 million, and villagers and local governments contribute US$51 million.
The Department of Social Welfare and Development (DSWD) is implementing the KALAHI-CIDSS in16 steps for the villagers to follow (see Annex 1). Through these16 steps, villagers prioritize theirdevelopment needs, design activities, seek technical assistance, manage resources, and implement andoperate development interventions. This organized experience in collective action – repeated three timesin each targeted area – is designed to develop the capacity of poor villagers to help themselves and engage better with local governments and national agencies. As this capacity develops, villagers are also expected to take a more active role in improving the delivery of other pro-poor services and initiate newdevelopment activities. While the approach is appealing it is necessary to collect evidence about whether the KALAHI-CIDSS enhances not only community welfare, but also communities’ ability to address and solve their own problems.
2. Background
The DSWD and the World Bank are committed to a careful impact evaluation of the KALAHI-CIDSS.The evaluation follows the “good practices” prescribed by experts in that it collects quality baseline data
34 Phase 3 implementation was originally scheduled to start in early 2004, but was delayed due to a reenactment of the 2004 National Budget.
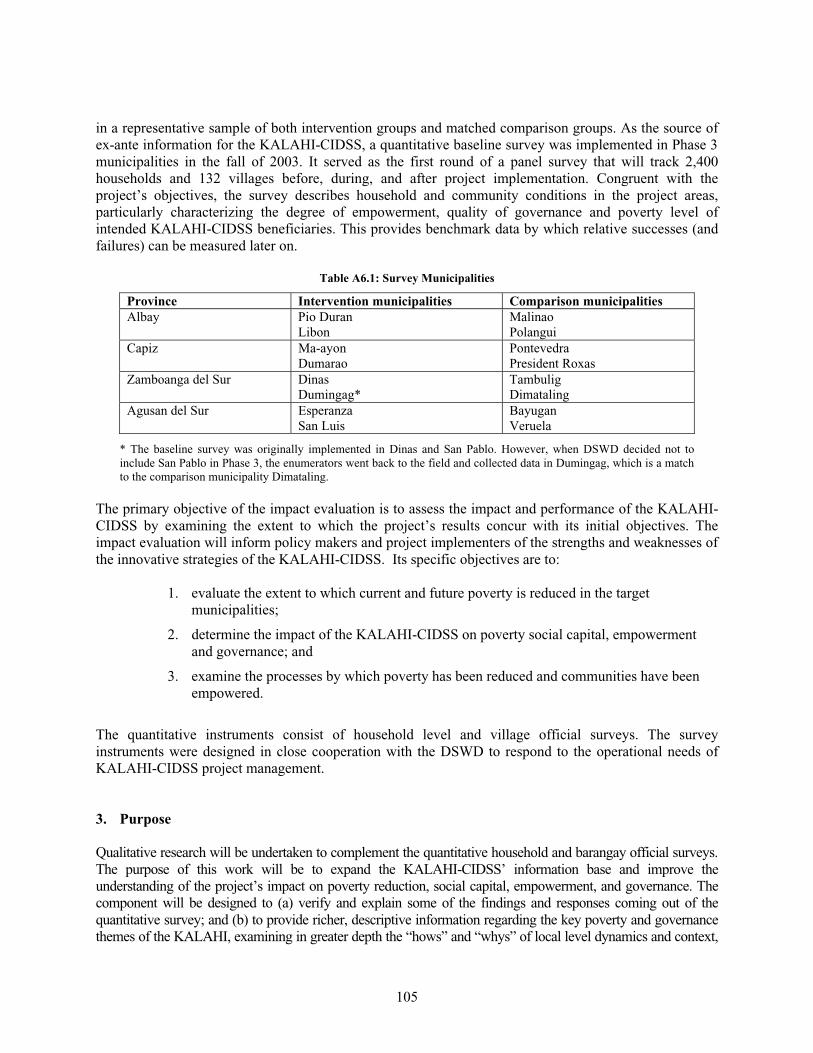
105
in a representative sample of both intervention groups and matched comparison groups. As the source ofex-ante information for the KALAHI-CIDSS, a quantitative baseline survey was implemented in Phase 3 municipalities in the fall of 2003. It served as the first round of a panel survey that will track 2,400households and 132 villages before, during, and after project implementation. Congruent with theproject’s objectives, the survey describes household and community conditions in the project areas,particularly characterizing the degree of empowerment, quality of governance and poverty level ofintended KALAHI-CIDSS beneficiaries. This provides benchmark data by which relative successes (andfailures) can be measured later on.
Table A6.1: Survey Municipalities
Province Intervention municipalities Comparison municipalitiesAlbay Pio Duran
LibonMalinaoPolangui
Capiz Ma-ayonDumarao
PontevedraPresident Roxas
Zamboanga del Sur DinasDumingag*
TambuligDimataling
Agusan del Sur EsperanzaSan Luis
BayuganVeruela
* The baseline survey was originally implemented in Dinas and San Pablo. However, when DSWD decided not toinclude San Pablo in Phase 3, the enumerators went back to the field and collected data in Dumingag, which is a match to the comparison municipality Dimataling.
The primary objective of the impact evaluation is to assess the impact and performance of the KALAHI-CIDSS by examining the extent to which the project’s results concur with its initial objectives. Theimpact evaluation will inform policy makers and project implementers of the strengths and weaknesses of the innovative strategies of the KALAHI-CIDSS. Its specific objectives are to:
1. evaluate the extent to which current and future poverty is reduced in the targetmunicipalities;
2. determine the impact of the KALAHI-CIDSS on poverty social capital, empowerment and governance; and
3. examine the processes by which poverty has been reduced and communities have been empowered.
The quantitative instruments consist of household level and village official surveys. The surveyinstruments were designed in close cooperation with the DSWD to respond to the operational needs ofKALAHI-CIDSS project management.
3. Purpose
Qualitative research will be undertaken to complement the quantitative household and barangay official surveys. The purpose of this work will be to expand the KALAHI-CIDSS’ information base and improve theunderstanding of the project’s impact on poverty reduction, social capital, empowerment, and governance. Thecomponent will be designed to (a) verify and explain some of the findings and responses coming out of thequantitative survey; and (b) to provide richer, descriptive information regarding the key poverty and governancethemes of the KALAHI, examining in greater depth the “hows” and “whys” of local level dynamics and context,
106
as well as what villagers themselves deem important. Such contextual issues are not captured fully using aquantitative survey instrument, especially for process and perception variables reflecting preferences, attitudes,and priorities. Qualitative methods will allow the project staff to understand important poverty and governancecharacteristics that are less readily amenable to quantification and that will be captured more fully throughconversations and open-ended inter-active interview formats, than formulaic questionnaires.
4. Research locations
The qualitative research will take place in the same municipalities and provinces that are covered by thequantitative surveys (see Table 1). The contractor is expected to collect data at both the barangay andmunicipal level. To allow for as much depth as possible, the contractor will conduct this research in oneintervention and one (matched) comparison municipality in each of two provinces. Within each of thesemunicipalities, a selection of five villages (already covered by the quantitative survey) will be researched. A total of four municipalities and twenty villages will thus be covered under the qualitative study.
The specific research locations will be chosen by the contractor together with the DSWD and the WorldBank. The final decision on research locations will be made by the DSWD.
5. Methodology and data collection
The qualitative research assumes that much can be learned about critical KALAHI themes and outcomes through an in-depth study of selected areas. The component will be developed by the contractor in closecooperation with the DSWD and the World Bank. It will be based on the insights learned from thequantitative baseline survey and will focus on selected themes identified, primarily those of social capital, empowerment and governance. The qualitative research will also aim to provide additional informationon the effectiveness of project implementation.
Examples of themes to cover include:
• Participation in implementation of KALAHI and non-KALAHI projects
• Transparency and access to information
• Accountability
• Corruption
• Complaints handling; conflict and dispute resolution mechanisms
• Local government practices, governance, decision-making processes
• Roles of traditional and other informal leaders
• Social capital (groups and networks, trust and solidarity, collective action and cooperation, social inclusion, information and communication).
107
The qualitative component will consist of focus group discussions and key informant interviews at twolevels:
• in the barangays: with community members (including different groups such as women, men, youth, marginalized groups, indigenous peoples, project implementation teams etc.), formal and informal leaders, and KALAHI facilitators
• at the municipal level: local government officials and staff
Field data collection techniques will also include direct observation, personal narratives, and review ofproject documentation such as village social maps and wealth ranking documents, project proposals, andfinancial records. The field teams will spend at least 15 days in each village.
The contractor is expected to sub-contract tasks outlined in this TOR if there are otherindividuals/firms/organizations with comparative advantage in undertaking specific parts of theassignment.
6. Budget
TBD.
7. Deliverables and disbursement
Of the total fee, the World Bank will pay the contractor
• 10 % on acceptance of the contract (estimated date February 15, 2005).
• 40% on acceptance of qualitative design report and data collection instruments (estimated date March 1, 2005).
• 25% on acceptance of progress report on the qualitative component (estimated date April 15, 2005).
• 25% on acceptance of final report on the qualitative component (estimated date July 1, 2005).
8. Documentation and Report Format
All field researchers will keep detailed field notes from their field work. The notes should include theirpersonal observations from the day’s meetings and observations, research notes from the discussions andinterviews, and useful quotations. The contractor will prepare a final qualitative report that includes:
• Executive Summary
• Introduction and background
• Purpose of the research, key evaluation themes
• Methodology
108
• Main thematic issues and findings from the 20 villages. Some preliminary analysis and references should be made to the findings of the quantitative surveys
• Conclusion and recommendation
Annexes:• Summary of each village and municipality – basic data and study findings
• Interview guides