Embed Size (px)
Citation preview
Impact EvaluationKALAHI-CIDSSFinal SurveyThe World Bank Group in the Philippines
Making Growth Work for the Poor
May 2011
© 2011 The World Bank GroupJuly 2011Printed in the United States.All rights reserved.
The World Bank Group World Bank Office Manila 1818 H. Street, N.W. 23rd Floor, The Taipan PlaceWashington DC 20433, USA F. Ortigas Jr. Road, Ortigas CenterTel: (202) 473 1000 Pasig City, PhilippinesFax: (202) 477 6391 Tel: (632) 637 5855 to 64www.worldbank.org Fax: (632) 6375870 www.worldbank.org.ph
Asia-Pacific Policy CenterGF, Philippine Social Science CenterCommonwealth AvenueDiliman, Quezon City 1100, PhilippinesTeleFax: (63-2) 926-4615www.appc-ph.com
Standard Disclaimer:
This evaluation was carried out by the Asia-Pacific Policy Center of the Philippines with the technical support of the World Bank and the financial support of the Millennium Challenge Corporation of the United States of America. This work would not have been possible without the cooperation of the Government of the Philip-pines’ Department of Social Welfare and Development (DSWD) and the excellent field support of Ateneo de Naga Social Science Research Center, Central Philippine University Social Science Research Institute, and the Research Institute for Mindanao Culture of Xavier University. The authors of the study are also grateful for the technical guidance and support of Julien Labonne, the assistance of Alex Glova and the monitoring and evalu-ation team of DSWD, and the helpful comments from peer reviewers Anne Pizer, Cliff Burkley, Radu Ban and Robert Chase. Errors and omissions, however, are the sole responsibility of the authors.
Cover photos taken from: http://kalahi.dswd.gov.ph/index.php?option=com_phocagallery Cover and layout design: Duina Reyes-Bakovic
Copyright Statement:
The material in this publication is copyrighted. Copying and/or transmitting portions or all of this work without permission may be a violation of applicable law. The World Bank encourages dissemination of its work and will normally grant permission to reproduce portions of the work promptly.
For permission to photocopy or reprint any part of this work, please send a request with complete information to the Copyright Clearance Center, Inc., 222 Rosewood Drive, Danvers, MA 01923, USA, telephone 978-750-8400, fax 978-750-4470, http://www.copyright.com/.
All other queries on rights and licenses, including subsidiary rights, should be addressed to the Office of the Publisher, The World Bank, 1818 H Street NW, Washington, DC 20433, USA, fax 202-522-2422, e-mail [email protected].
Final Survey for the KALAHI-CIDSS Impact Evaluation
REVISED FINAL REPORT
Rosemarie EdillonSharon Faye PizaCarlos Abad Santos
with
Regina BaromaFrancis Alan PizaDonna Mae OdraCharisse AgorillaAiza VillamorSharon FangononJose Rowell CorpuzFaith Hyacinth Balisacan
May 6, 2011

Final Survey 3
Table of ContentsAcronyms ..................................................................................................5Executive Summary ..................................................................................71. Introduction ...........................................................................................92. The KALAHI-CIDSSStrategy ..............................................................103. Impact Evaluation ...............................................................................13
3.1 Objectives of the Impact Evaluation ............................................................. 13
3.2 Analytical framework .................................................................................... 13
3.2.1. Household Welfare .............................................................................. 13
3.2.2. Some Determinants of Household Welfare ......................................... 13
3.2.3. Channels through which KALAHI-CIDSS can Affect Welfare .............. 15
3.3 Research Design ........................................................................................... 15
3.4 Survey Instruments ....................................................................................... 17
3.5 Limitations of the Study ................................................................................ 17
4. Analysis of Project Impacts ...............................................................194.1 KALAHI-CIDSS Accomplishment in Survey Areas ....................................... 19
4.1.1. Perceptions on KALAHI-CIDSS ........................................................... 20
4.2 Key Evaluation Results ................................................................................. 21
4.2.1. Key Welfare Impacts ............................................................................ 21
4.2.2. Access to Basic Services .................................................................... 24
4.2.3. Governance and Social Capital ........................................................... 27
4.3 Results from Regression Analysis ................................................................ 30
4.3.1. Key Welfare Impacts ............................................................................ 31
4.3.2. Access to Basic Services .................................................................... 32
4.3.3. Governance and Social Capital ........................................................... 33
5. Conclusions and Recommendations ................................................37References ..............................................................................................39Annexes ...................................................................................................41
Annex 1. Project Coverage Map .......................................................................... 43
Annex 2. Analytical Methodology ......................................................................... 44
Annex 3. Survey Operations ................................................................................. 48
Annex 4. Additional Results ................................................................................. 53
Annex 5. List of Analysis Indicators ...................................................................... 56
4 Impact Evaluation KALAHI-CIDSS
List of Figures Figure 1. KALAHI-CIDSS Project Flow .................................................................. 11
Figure 2. Analytical Framework ............................................................................. 14
Annex Figure 1. Project Coverage......................................................................... 44
Annex Figure 2. Member respondent attrition by province ................................... 51
List of Tables
Table 1. KALAHI-CIDSS Coverage by Phase ........................................................ 10
Table 2. Types of Subprojects Implemented ........................................................ 20
Table 3. Key Welfare Outcome Indicators ............................................................. 22
Table 4. Profile of Employment .............................................................................. 23
Table 5. Household Production Practices ............................................................. 23
Table 6. Barangay Access Conditions ................................................................... 24
Table 7. Household Access Conditions (% of households) .................................. 25
Table 8. Health Care Satisfaction Rating (% of households)................................. 26
Table 9. School Participation Rates (% of school-age children) ........................... 27
Table 10. Number of Visit by Authorities ............................................................... 28
Table 11. Trust and Solidarity (% of households) .................................................. 29
Table 12. Participation in Barangay Activities (% of households) ......................... 29
Table 13. Per Capita Expenditure .......................................................................... 32
Table 14. Other Welfare Measures ........................................................................ 33
Table 15. Access to Amenities .............................................................................. 34
Table 16. Social Capital: Trust ............................................................................... 35
Table 17. Participation in Governance .................................................................. 36
Annex Table 2. Survey Areas ................................................................................. 48
Annex Table 3 Attrition Rates by Province ............................................................ 50
Annex Table 4. Reasons for Attrition ..................................................................... 50
Annex Table 5. Welfare Outcome Indicators ......................................................... 53
Annex Table 6. Additional Results - Profile of Employment .................................. 54
Annex Table 7. Additional Results - Barangay Access Conditions ....................... 54
Annex Table 8. Additional Results - Participation in Barangay Activities ............. 55
Final Survey 5
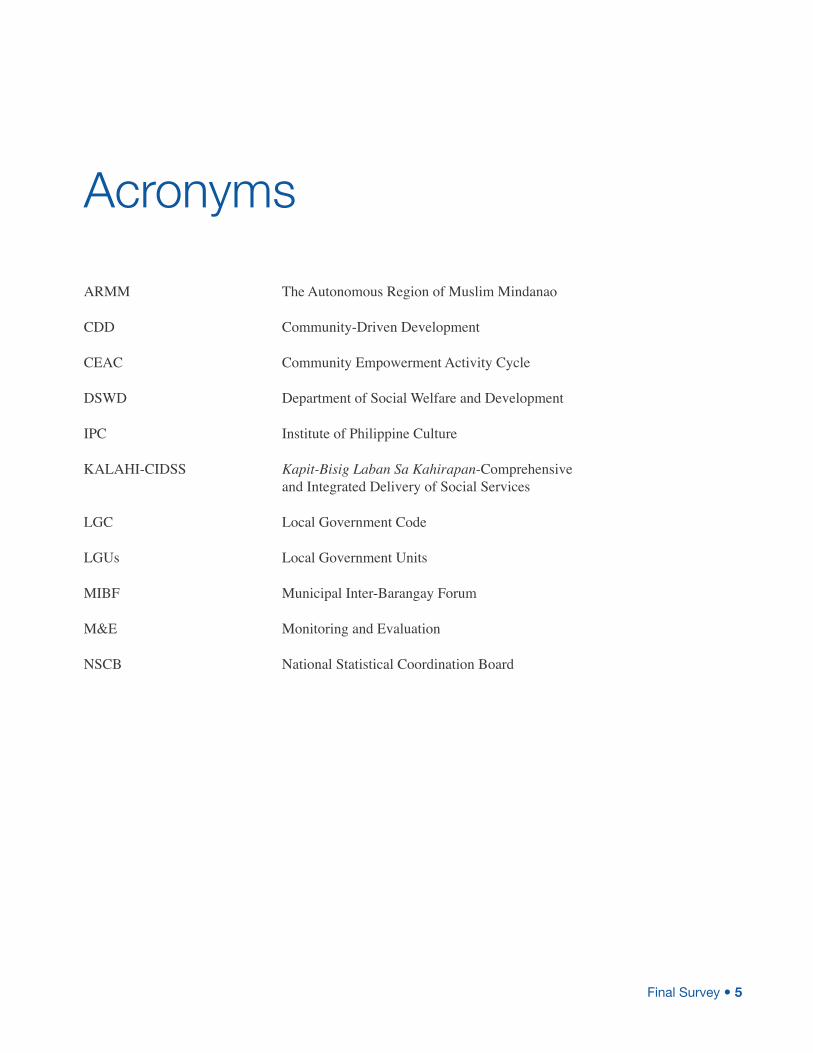
ARMM The Autonomous Region of Muslim Mindanao
CDD Community-Driven Development
CEAC Community Empowerment Activity Cycle
DSWD Department of Social Welfare and Development
IPC Institute of Philippine Culture
KALAHI-CIDSS Kapit-Bisig Laban Sa Kahirapan-Comprehensive and Integrated Delivery of Social Services
LGC Local Government Code
LGUs Local Government Units
MIBF Municipal Inter-Barangay Forum
M&E Monitoring and Evaluation
NSCB National Statistical Coordination Board
Acronyms

6 Impact Evaluation KALAHI-CIDSS
Final Survey 7
The KALAHI-CIDSS project was set up in 2002 to alleviate rural poverty. The project seeks to achieve this by providing
resources to poor rural municipalities for invest-ment in public goods and by reviving local insti-tutions for people’s participation in governance. KALAHI-CIDSS is targeted at the poorest 25 percent of municipalities in 42 of the poorest provinces in the Philippines. As of December 2010, the project had covered 4,583 barangays1 in 200 municipalities and supported 5,645 sub-projects, worth PHP 5.7 billion; and benefiting about 1.26 million households. Participating communities follow very detailed participatory processes, repeated three times in each partici-pating municipality, to secure resources for in-vestments in public goods.
A rigorous impact evaluation was designed in 2003 to evaluate project impacts on poverty reduction, social capital, empowerment, and governance. Quantitative data were collected on about 2,000 households in 135 barangays in 2003, 2006, and 2010. Data were gathered on a broad range of indicators from a sample of KALAHI-CIDSS municipalities and from comparable municipalities that did not receive project support. Similarly, qualitative data were collected in a subsample of 20 barangays in 2005 and 2010. This report presents results from the quantitative component of the evaluation.
Available data indicate that participation rates in project activities are relatively high,
1 A barangay is the lowest administrative unit in the Philippines; corresponding to a village.
suggesting that households and locally elected officials in targeted municipalities see value in the KALAHI-CIDSS approach. About 80 percent of households in treated municipalities indicated being aware of the project. Three in every five expressed their satisfaction with the project. Elected local officials also view the project in a positive light; 75 percent of LGU officials indicated they were satisfied with the project. Respondents identify infrastructure improvement, better access to services, and community empowerment as project benefits. Feedback from barangays that were not priori-tized (i.e., did not receive subproject financing) during the Municipal Inter-Barangay Forum (MIBF) was more negative.
The project had a positive impact on house-hold consumption. Specifically, per capita consumption increased by about 5 percent as a result of the project. Those impacts are stronger for households that were classified as poor in 2003 and for households living in barangays that received one or more subprojects. This is consistent with the view that long-term impacts will require sustained efforts and both social and physical investment.
Additional survey findings on household em-ployment and marketing suggest how these positive impacts came about. First, the project led to a 4-percentage point increase in labor force participation compared to what would have happened otherwise. Second, the survey found that households in KALAHI-CIDSS communi-ties diversified their sources of income: they are now slightly more likely to be working in more
Executive Summary
8 Impact Evaluation KALAHI-CIDSS
than one sector. Third, the positive impacts might come from improved production practices. In addition, while farmers are less likely to engage in multi-cropping as a result of the project, they appear more likely to sell their produce.
The project led to improvements in basic service delivery. First, the proportion of households visiting a health facility when sick increased. This change seems to be driven by an increase in the use of public barangay health stations compared to private hospitals and clinics. Second, the project had a positive impact on accessibility. Specifically, a 6-per-centage point increase in the proportion of households whose house is accessible year-round can be attributed to the project. Third, the project had a small positive impact on access to level 2 and level 3 water systems.2 However, given the relatively large nature of water invest-ment in the sample municipalities, this impact appears limited. The impacts on access to safe water are slightly larger but still limited. Fourth, project implementation appears to have led to
2 In the Philippines, a level 2 water system consists of a piped water system with a communal water point (e.g. stand-pipe). A level 3 water system introduces private water points (e.g. house connection).
an increase in secondary school and college en-rollment, but, surprisingly, to a small decline in elementary school enrollment. However, given the relatively small amount of investments in school buildings in the barangays sampled for the impact evaluation, this correlation might not be a result of the project.
The project also had positive impacts on a number of social capital and barangay gover-nance outcomes, which have been shown to be important determinants of household welfare. Consistent with the project development objec-tive, KALAHI-CIDSS led to an increase in par-ticipation in barangay assemblies, associated with greater knowledge about the barangay’s income and expenses. In addition, the project led to increased organizational membership, as well as improved trust levels. Surprisingly, however, the project had a negative impact on the proxy used for collective action. It is unclear whether this last result is driven by a decrease in households’ willingness to contribute to such activities, or by a decrease in the need for col-lective action. Those impacts are less dependent on the barangay being prioritized, suggesting a greater role for social preparation in determin-ing impacts on local dynamics.
Final Survey 9
1. Introduction
The Kapit-Bisig Laban Sa Kahirapan-Comprehensive and Integrated Delivery of Social Services (KALAHI-CIDSS)
project was set up in 2002 as the flagship an-tipoverty project of the government of the Philippines. The project aims to achieve its poverty-reduction goals by providing resources to poor rural municipalities for investment in public goods. The project also aims to revive local institutions for people’s participation in governance. The project adopts a Community-Driven Development (CDD) strategy and is now one of the three pillars of the convergent social protection programs under the Social Welfare and Development Reform Agenda of the Department of Social Welfare and Development.
As of December 2010, the project had covered 4,583 barangays in 200 municipalities and sup-ported 5,645 subprojects, of which 93 percent had been completed. These subprojects are worth PHP 5.72 billion and benefit about 1.2 million households. Participating communities follow very detailed participatory processes, repeated three times in each participating mu nicipality, to secure resources for public good investments.
A rigorous impact evaluation was designed in 2003 to evaluate project impacts on poverty reduction, social capital, empowerment, and governance. Quantitative data were collected on about 2,000 households in 135 barangays in 2003, 2006, and 2010. Data were gathered on a broad range of indicators from a sample of KALAHI-CIDSS municipalities and of compa-rable municipalities that did not receive project support. Similarly, qualitative data were col-lected in a subsample of 20 barangays in 2005 and 2010. This report presents results from the quantitative component. Results from the quali-tative component of the impact evaluation are available separately (IPC 2010).
The report is organized as follows. Section 2 provides background information on the project strategy and implementation proce-dures. Section 3 discusses the impact evaluation design. Section 4 presents the results, and Section 5 concludes. More detailed information on the evaluation and the analytical methodol-ogy, as well as additional results, are available in Annexes 1–5.
10 Impact Evaluation KALAHI-CIDSS
The goal of KALAHI-CIDSS is to reduce poverty through community empower-ment and improved local governance, as
well as through investments in basic social and economic infrastructure and services.
The beneficiaries of KALAHI-CIDSS are among the poorest of the poor. The project works in 42 of the poorest provinces in the country and, within these provinces, the poorest 25 percent of municipalities.3 The choice of provinces is based on poverty incidence as computed by the National Statistical Coordination Board (NSCB), while the choice of municipalities is based on
3 Concerns about the capacity of regional DSWD offices to cover a large number of municipalities pre-vented the program from targeting the poorest mu-nicipalities regardless of their province of origin. In addition, a decision was made not to implement the project in ARMM. A similar project, the ARMM Social Fund, was implemented instead.
a poverty ranking methodology developed by Balisacan, Edillon, and Ducanes (2002). A map of project coverage is available in Annex 1.
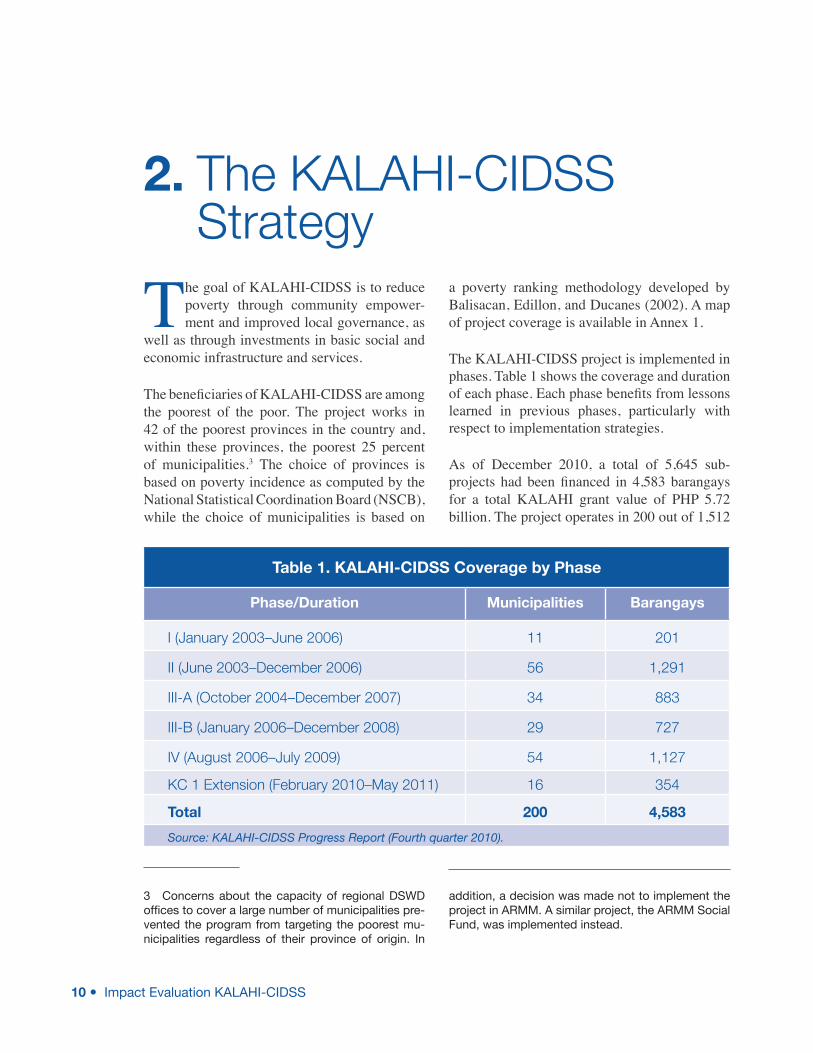
The KALAHI-CIDSS project is implemented in phases. Table 1 shows the coverage and duration of each phase. Each phase benefits from lessons learned in previous phases, particularly with respect to implementation strategies.
As of December 2010, a total of 5,645 sub-projects had been financed in 4,583 barangays for a total KALAHI grant value of PHP 5.72 billion. The project operates in 200 out of 1,512
2. The KALAHI-CIDSS Strategy
Table 1. KALAHI-CIDSS Coverage by Phase
Phase/Duration Municipalities Barangays
I (January 2003–June 2006) 11 201
II (June 2003–December 2006) 56 1,291
III-A (October 2004–December 2007) 34 883
III-B (January 2006–December 2008) 29 727
IV (August 2006–July 2009) 54 1,127
KC 1 Extension (February 2010–May 2011) 16 354
Total 200 4,583
Source: KALAHI-CIDSS Progress Report (Fourth quarter 2010).
3 Concerns about the capacity of regional DSWD offices to cover a large number of municipalities pre-vented the program from targeting the poorest mu-nicipalities regardless of their province of origin. In
addition, a decision was made not to implement the project in ARMM. A similar project, the ARMM Social Fund, was implemented instead.
Final Survey 11
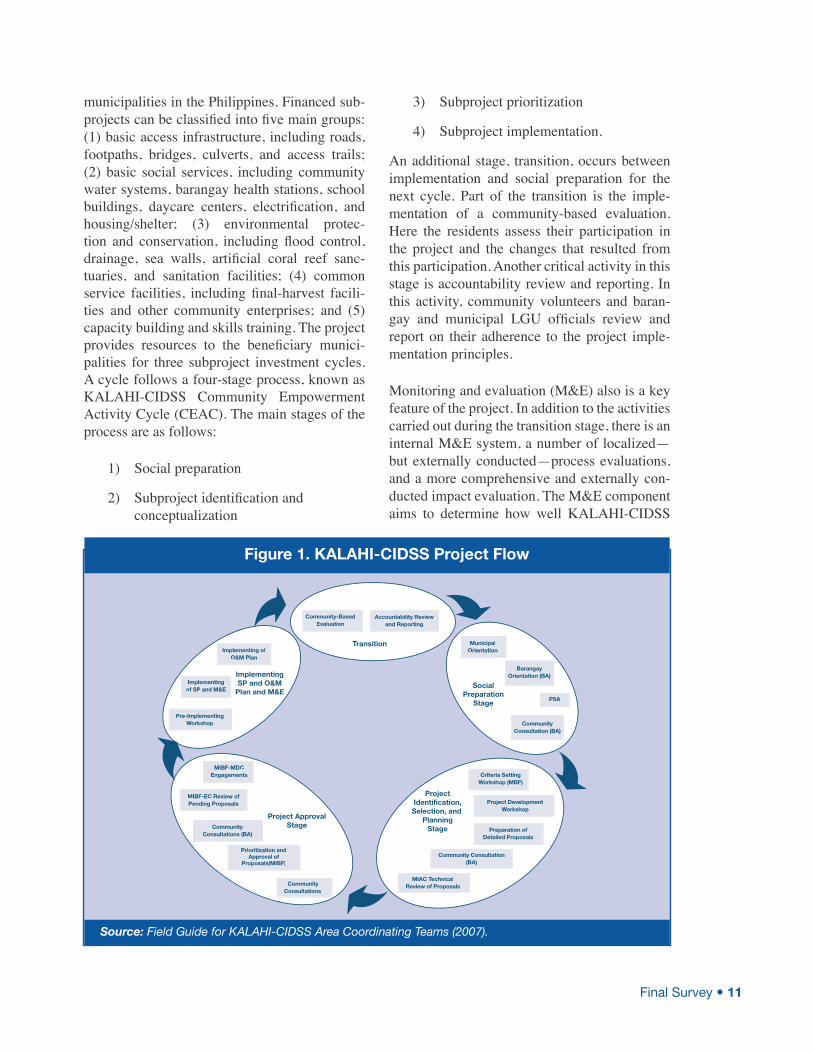
municipalities in the Philippines. Financed sub-projects can be classified into five main groups: (1) basic access infrastructure, including roads, footpaths, bridges, culverts, and access trails; (2) basic social services, including community water systems, barangay health stations, school buildings, daycare centers, electrification, and housing/shelter; (3) environmental protec-tion and conservation, including flood control, drainage, sea walls, artificial coral reef sanc-tuaries, and sanitation facilities; (4) common service facilities, including final-harvest facili-ties and other community enterprises; and (5) capacity building and skills training. The project provides resources to the beneficiary munici-palities for three subproject investment cycles. A cycle follows a four-stage process, known as KALAHI-CIDSS Community Empowerment Activity Cycle (CEAC). The main stages of the process are as follows:
Social preparation1)
Subproject identification and 2) conceptualization
Subproject prioritization3)
Subproject implementation.4)
An additional stage, transition, occurs between implementation and social preparation for the next cycle. Part of the transition is the imple-mentation of a community-based evaluation. Here the residents assess their participation in the project and the changes that resulted from this participation. Another critical activity in this stage is accountability review and reporting. In this activity, community volunteers and baran-gay and municipal LGU officials review and report on their adherence to the project imple-mentation principles.
Monitoring and evaluation (M&E) also is a key feature of the project. In addition to the activities carried out during the transition stage, there is an internal M&E system, a number of localized—but externally conducted—process evaluations, and a more comprehensive and externally con-ducted impact evaluation. The M&E component aims to determine how well KALAHI-CIDSS
Community-Based Evaluation
Community-Based Evaluation
Accountability Review and Reporting
Accountability Review and Reporting
Municipal OrientationMunicipal
Orientation
Barangay Orientation (BA)
Barangay Orientation (BA)
Community Consultation (BA)
Community Consultation (BA)
PSAPSA
Transition
SocialPreparation
Stage
Criteria Setting Workshop (MBF)Criteria Setting
Workshop (MBF)
Project Development Workshop
Project DevelopmentWorkshop
Preparation of Detailed Proposals
MIAC TechnicalReview of Proposals
Preparation of Detailed Proposals
MIAC TechnicalReview of Proposals
Community Consultation (BA)
Community Consultation (BA)
ProjectIdentification,Selection, and
PlanningStage
MIBF-MDCEngagements
MIBF-MDCEngagements
MIBF-EC Review ofPending ProposalsMIBF-EC Review ofPending Proposals
Implementing of O&M Plan
Implementing of O&M Plan
Implementingof SP and M&E Implementing
of SP and M&E
Pre-ImplementingWorkshop
Pre-ImplementingWorkshop
Community Consultations (BA)
Community Consultations (BA)
Community Consultations
Community Consultations
Prioritization and Approval of
Proposals(MIBF)
Prioritization and Approval of
Proposals(MIBF)
Project ApprovalStage
ImplementingSP and O&M
Plan and M&E
Figure 1. KALAHI-CIDSS Project Flow
Source: Field Guide for KALAHI-CIDSS Area Coordinating Teams (2007).
12 Impact Evaluation KALAHI-CIDSS
has achieved its objectives and to generate in-sights and lessons learned to inform the design of poverty reduction projects in the future.
Participating municipalities receive a per-cycle grant equivalent to PHP 300,000 for each baran-gay. The barangay allocations are determined through a competitive process, the Municipal Inter-Barangay Forum (MIBF), step 3 above. As a result, while some barangays do not receive any subproject in the three cycles, some of them might be prioritized more than once. Criteria against which to rank subproject proposals are developed by the communities themselves and tend to emphasize poverty concerns.
Each stage of the CEAC process has a set of rel-evant activities, as shown in Figure 1. In gen-eral, the first cycle can be completed in 12 to 14 months4 for communities new to the KALAHI-CIDSS process. Subsequent cycles tend to take less time.5
4 According to DSWD, before implementation in the Phase 3 area, a project cycle takes 14 months to be completed. Subsequent cycles often take less time—from 8 to 10 months.
5 From interview with Ms. Consuelo Acosta, SOW III of the DSWD.
Final Survey 13
3. Impact Evaluation
3.1 Objectives of the Impact Evaluation
A set of general objectives were established at the start of the impact evaluation. These are the following:
To evaluate the extent to which poverty 1) is reduced in the target municipalities
To evaluate the extent to which com-2) munities have been empowered and governance has been improved
To examine the process by which pov-3) erty has been reduced.
These objectives were maintained in each of the survey rounds of the evaluation, while specific objectives were also set.
3.2 Analytical framework
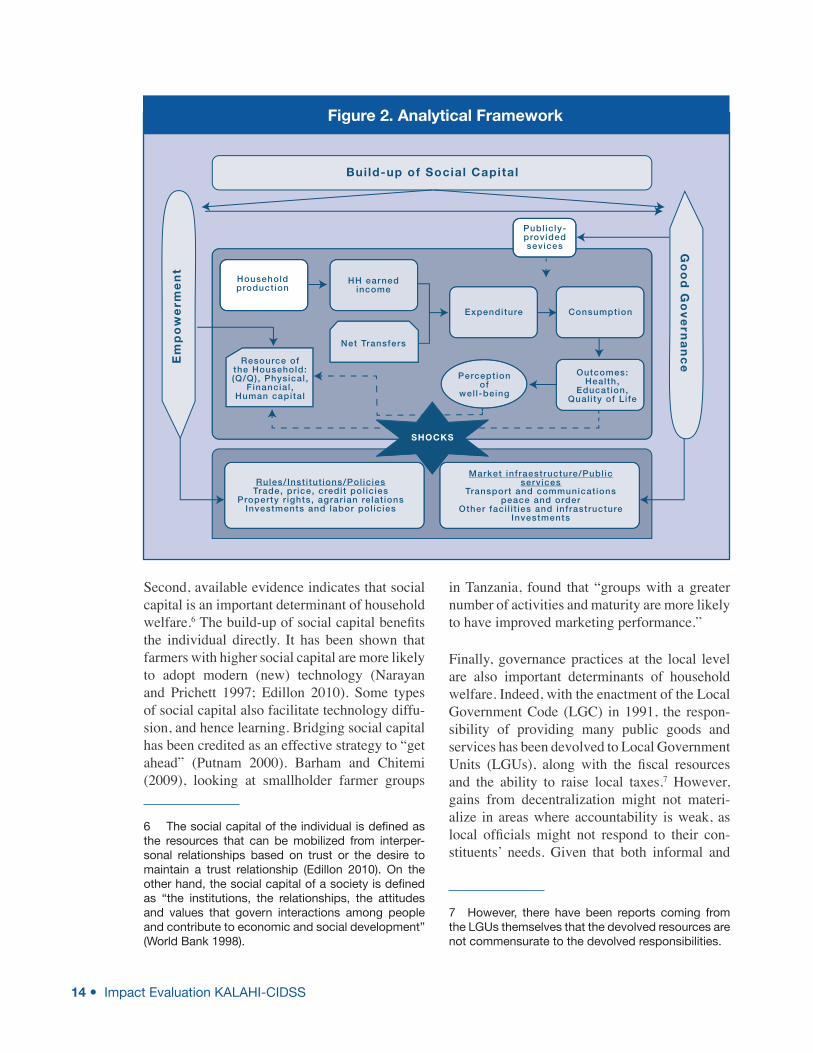
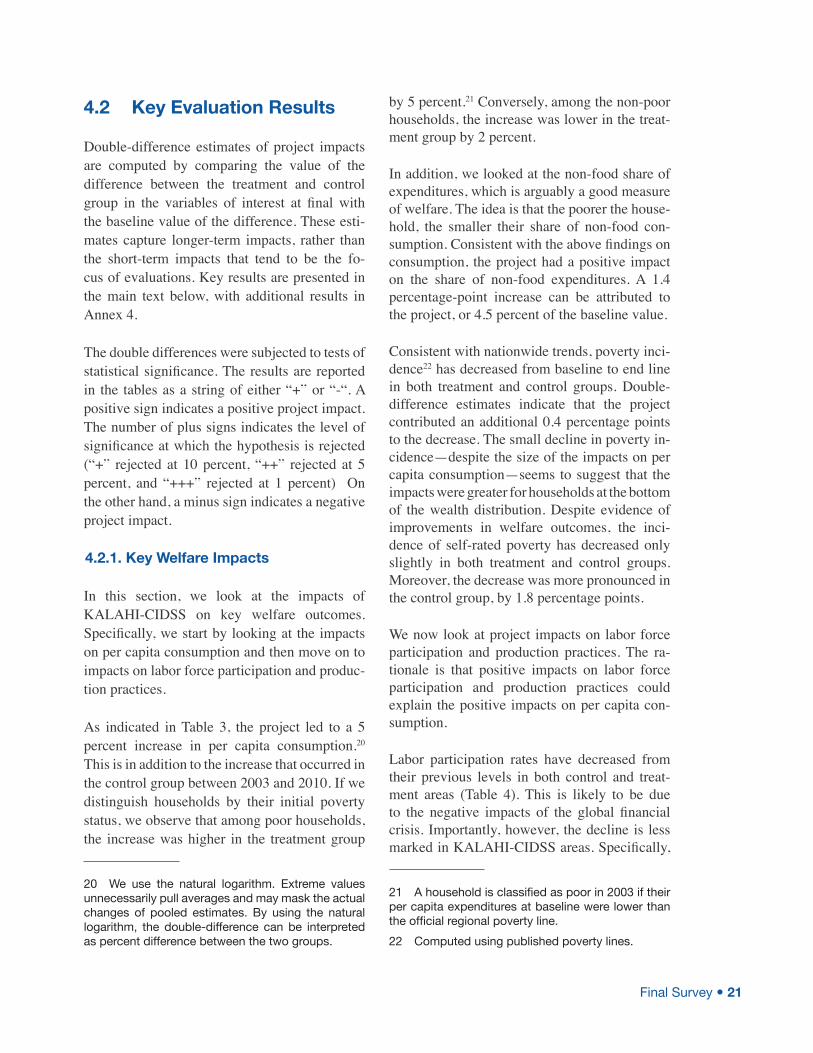
The design of the survey is based on the analyti-cal framework, first discussed in Balisacan et al. (2000) and subsequently modified to consider KALAHI-CIDSS interventions. Figure 2 illus-trates this framework.
3.2.1. Household Welfare
The evaluation adopted a comprehensive defi-nition of household welfare and poverty. It en-compasses several dimensions: deprivation in
means, outcomes, and even perception of one’s state of well-being. There is a strong relation-ship between and among these three dimen-sions. Deprivation in means (income or source of livelihood) will result in poor outcomes (in-cluding poor health and nutrition, poor housing conditions, low educational attainment of family members) unless the family is able to procure publicly provided goods and services. Poor out-comes will result in a perception of being poor.
3.2.2. Some Determinants of Household Welfare
The most direct determinants of household welfare are household decisions regarding pro-duction and consumption. Decisions on produc-tion involve the use of potential labor supply and other household assets, (e.g., land, financial assets, future earnings and credit, if available). Decisions on consumption govern the allocation of the family budget for food and nonfood items, medical care, higher education, and improve-ments in housing, for example. In rural areas, where subsistence farming is prevalent, produc-tion and consumption factors and decisions are often intertwined.
A host of factors influence household decisions on production and consumption. First, the avail-ability of adequate market infrastructure and quality public services such as roads, irrigation facilities, public schools, and health centers should lead to improved household welfare.
14 Impact Evaluation KALAHI-CIDSS
Second, available evidence indicates that social capital is an important determinant of household welfare.6 The build-up of social capital benefits the individual directly. It has been shown that farmers with higher social capital are more likely to adopt modern (new) technology (Narayan and Prichett 1997; Edillon 2010). Some types of social capital also facilitate technology diffu-sion, and hence learning. Bridging social capital has been credited as an effective strategy to “get ahead” (Putnam 2000). Barham and Chitemi (2009), looking at smallholder farmer groups
6 The social capital of the individual is defined as the resources that can be mobilized from interper-sonal relationships based on trust or the desire to maintain a trust relationship (Edillon 2010). On the other hand, the social capital of a society is defined as “the institutions, the relationships, the attitudes and values that govern interactions among people and contribute to economic and social development” (World Bank 1998).
in Tanzania, found that “groups with a greater number of activities and maturity are more likely to have improved marketing performance.”
Finally, governance practices at the local level are also important determinants of household welfare. Indeed, with the enactment of the Local Government Code (LGC) in 1991, the respon-sibility of providing many public goods and services has been devolved to Local Government Units (LGUs), along with the fiscal resources and the ability to raise local taxes.7 However, gains from decentralization might not materi-alize in areas where accountability is weak, as local officials might not respond to their con-stituents’ needs. Given that both informal and
7 However, there have been reports coming from the LGUs themselves that the devolved resources are not commensurate to the devolved responsibilities.
Build-up of Social CapitalE
mp
ow
erm
en
t
Go
od
Go
ve
rna
nc
e
Rules/Inst i tut ions/Pol iciesTrade, pr ice, credit pol icies
Property r ights, agrar ian relat ionsInvestments and labor pol icies
Outcomes:Health,
Education, Qual i ty of Li fe
Resource of the Household: (Q/Q), Physical ,
Financial , Human capital
Expenditure Consumption
Net Transfers
HH earnedincome
Perceptionof
wel l-being
Publ icly-providedsevices
Householdproduction
Market infraestructure/Publ ic services
Transport and communicationspeace and order
Other faci l i t ies and infrastructureInvestments
SHOCKS
Figure 2. Analytical Framework
Final Survey 15
formal institutions matter for local governance and the difficulty in distinguishing between the two empirically, results on social capital and governance will be reported jointly.
3.2.3. Channels through which KALAHI-CIDSS can affect Welfare
There are at least three channels through which the KALAHI-CIDSS project can influence household welfare. First, the project provides resources for investment in public goods. This should lead to improved infrastructure at the local level, which should translate into improved household welfare. The demand-driven nature of subproject selection should ensure that selected subprojects respond to local needs.
Second, KALAHI-CIDSS uses innovative strat-egies of participatory planning, implementation and management of local development activities. These improve the capabilities of beneficiaries to identify subprojects that are catalytic to local development. More importantly, these strategies are expected to build up social capital at both the individual and community levels.
Third, KALAHI-CIDSS promotes good gov-ernance. First, the quality of governance is improved by the introduction of systems and pro-cedures (on subproject proposal and approval, bidding and procurement, and financial manage-ment) that encourage transparency, people’s par-ticipation, accountability, and the like. Second, governance is also improved by having an em-powered constituency that knows what they need and knows how to demand it. This way, governance structures would be encouraged to become more responsive to the needs of their constituencies. The project procedures are con-sistent with the LGC, which includes several provisions that are intended to promote commu-nity participation in local governance through the appointment of civil society representatives to local development councils. This provides the venue through which the needs of marginalized and underserved constituencies can be consid-ered by the political leadership.
3.3 Research Design
The impact evaluation followed a time series control group design, with baseline, midterm, and final endline surveys conducted in treatment and comparison municipalities. The treatment group consisted of beneficiary municipalities, while the comparison group was chosen from municipalities within the same sample prov-inces with similar characteristics to the treat-ment municipalities, but not receiving project support.8 Given that the evaluation was not part of the original project design, alternative evalu-ation designs (such as random assignment) were ruled out. The treatment municipalities were drawn from among the poorest quartile munici-palities in the beneficiary provinces supported under Phase III-A of the project. In this way, it is expected that these areas would have ben-efited from lessons learned from early phases of project implementation.
Project implementation in Phase III-A munici-palities started in October 2004. The sample provinces were chosen to represent the distribu-tion of beneficiaries by island group: Albay in Luzon, Capiz in Visayas, and Zamboanga del Sur and Agusan del Sur in Mindanao. In addition, in two of the provinces (Albay and Agusan del Sur) qualitative data were collected in 2005 and 2010.
Available information indicates that the control group provides credible estimates of what would have happened in the treatment municipalities in the absence of the project. Given the strict poverty targeting procedures used by the project, control municipalities are slightly richer than the treatment municipalities but appear similar along other dimensions (Chase and Holmemo 2006).
The key identifying assumption in the impact evaluation is that, without the project, the two
8 Refer to Chase and Holmemo (2005) for a de-tailed discussion of the methodology used to select the control municipalities.
16 Impact Evaluation KALAHI-CIDSS
groups of municipalities (treatment and com-parison) would have evolved similarly. While it is impossible to test this hypothesis directly, it is possible to test if prior to the project the two groups evolved similarly; this is the so-called “parallel trend” hypothesis. Rejection of the parallel trend hypothesis would cast doubts on the validity of our estimation strategy. As indicated in Annex 2, we attempted to test the parallel trend hypothesis. The results provide convincing evidence that control and treatment municipalities would have evolved similarly over the period covered by our data had the project not been implemented.
The baseline survey was conducted in the fall of 2003.9 The baseline covered a total of 2,400 households in 132 barangays in the four prov-inces. There were two treatment and two control municipalities in each province. The same house-holds were interviewed during the midterm and endline surveys, except for those lost to attri-tion. The midterm survey was conducted from October to December 2006.10 11
9 In 2005, however, the Spanish Agency for In-ternational Cooperation (AEIC) funded one cycle of KALAHI-CIDSS implementation in Malinao, which is originally the control municipality corresponding to Pio Duran. To address the disruption in the evalua-tion study, the municipality of Oas was selected as a replacement and a baseline survey was conducted in this new control municipality in 2005 . The replace-ment of Malinao as one of the control municipalities in Albay increased the number of barangays covered to 135. The methodology for selecting Oas is fully discussed in the final report of the supplementary data collection (APPC 2006).
10 Except in Agusan del Sur, where it was extended to January 2007 because of peace and order condi-tions.
11 As of the completion of the midterm survey, the treatment municipalities had already completed the first cycle and the second cycle was ongoing. In all provinces except Zamboanga del Sur, only one in three sample barangays proceeded to subproject implementation toward the end of 2005. The other barangays were not prioritized, meaning that their proposed subprojects were not funded in the first cycle. In Zamboanga del Sur, two out of three sample barangays were among the prioritized barangays.
The final, endline, project evaluation started three years after the completion of the midterm assessment. Data collection began on the last week of February 2010 in Albay, Capiz, and Zamboanga del Sur. Operations in Agusan del Sur followed a month later due to peace and security conditions. The survey was completed within a month in the first three provinces, and in Agusan del Sur by the third week of April. The differing time periods during the year when the baseline, midterm and endline surveys were conducted created some problems with time-varying indicators and questions.12
By the time the final survey was conducted, all the subprojects had been implemented and most of them had been completed for more than a year and a half.13 As such, the endline evaluation captured longer-term impacts than most evalu-ations which tend to have smaller time frames. As a result, measured impacts are more likely to be sustained. About two-thirds of the treatment barangays received funding for their proposed subprojects.
The evaluation was designed to estimate the impacts of the KALAHI-CIDSS intervention as a whole. However, it is also possible to compare changes in barangays that were and were not prioritized (i.e., received subproject investments funding), but those results are more tentative. Some of the pre-project differences between the two sets of barangays could also affect the outcomes of interest.
Previous impact evaluations suggested that CDD projects might affect poor and non-poor house-holds differently (Voss 2008). In light of those findings and the lack of evidence on the gender
12 Adjustments were made to the questionnaire to maintain the same reference period for time-varying indicators. This entailed asking for the information pertaining to the current quarter, and then for the same information pertaining to the previous quarter.
13 Three-fourths of the projects were completed by 2008, while the rest were completed by June 2009.
Final Survey 17
impacts of development projects in the Philip-pines, the team decided to carry out subgroup analyses. To reduce concerns about data mining, the choice of subgroup analyses to be carried out was made prior to the endline data being available. Further, all disaggregated results (pre-project poverty levels and gender) are reported either in the main text or in Annex 4.
3.4 Survey Instruments
The survey instruments used were extensively field-tested before the baseline survey, and nec-essary adjustments were made before each addi-tional survey. The instruments were designed to capture information on the following indicators (cf. Annex 4):
poverty indicators ■ , including means, outcomes, and the perception of well-being
social capital indicators ■ , including in-dicators on groups and networks, collec-tive action, social inclusion, and infor-mation and communication
governance and empowerment indica- ■tors, iincluding indicators measuring transparency, participation, accountabil-ity, responsiveness and flexibility, conti-nuity and sustainability, and compliance, consistency and rule of law.
In addition to these indicators, questions that capture the extent of participation in KALAHI-CIDSS activities were added to the midterm survey. For the final survey, some additional questions were included, especially those of op-erational relevance to the Department of Social Welfare and Development (DSWD) and the World Bank for implementing similar programs in the future.
Three sets of questionnaires were utilized, each one for a different type of respondent (house-
hold, barangay, and municipality).14 The ques-tionnaires are available in Chase and Holmemo (2005).
3.5 Limitations of the Study
The analysis presented in this report is bound by a number of limitations. These are due to factors beyond the control of the evaluators and could have not been remedied ex ante within the existing budget. Following are the factors that may affect the analysis.
Only about two-thirds of the sixty-six treatment barangays in the survey areas received funding for subproject implementation. This proportion is lower than the figure for the entire group of Phase III-A provinces, where about 80 percent of barangays in KALAHI-CIDSS municipali-ties received at least one subproject. Most of the treatment barangays surveyed that had received subproject funding had undertaken a single cycle of subproject implementation. Eight of these ba-rangays received funding for two subprojects.
Common to all CDD operations, KALAHI-CIDSS finances a number of different subproj-ects that are likely to affect different dimen-sions of household welfare. Indeed, one would not expect similar impacts for a farm-to-mar-ket road and for a school building. As a result, project impacts are diluted over a broad range of outcome indicators. Further, due to limited sample size, no attempts were made to distin-guish impacts by types of subprojects.
The attrition of the panel household may also in-
14 The same questionnaires were used for treat-ment and control municipalities. The only differences were that a small module on KALAHI-CIDSS imple-mentation was included in treatment areas. The re-lated questions were placed at the end of the ques-tionnaire to avoid bias associated with beneficiaries knowing that the data were being used to estimate KALAHI-CIDSS impacts. The questionnaires were finalized after extensive consultations with the De-partment of Social Welfare and Development (DSWD) and the World Bank.
18 Impact Evaluation KALAHI-CIDSS
fluence results. Households dropping out of the sample—mainly due to migration or death—at any point in the duration of the study cannot be avoided.15 If this attrition is not random across the treatment and control groups, failure to account for it could yield biased estimates. As pointed out by Baulch and Quisumbing (2010), attrition
15 See Annex 3 for a full discussion on attrition
cannot be remedied globally by simply adjust-ing the weights. Instead, the correction should be outcome-specific. Addressing this concern, however, is beyond the scope of this report, although the limitation is recognized. Initial results suggest that such attrition is unlikely to significantly bias the results, as the levels and determinants of attrition do not appear to differ between the control and treatment groups.
Final Survey 19
4. Analysis of Project Impacts
This section assesses changes in key in-dicators in our survey areas over time. Only households interviewed in all three
survey rounds (baseline, midterm, and final) residing in the same barangays are included.
The discussion begins with a description of the project accomplishments in the survey areas (Section 4.1). Also included are perceptions of households and local government officials regarding KALAHI-CIDSS. Then the project outcomes are presented according to the frame-work for analyzing household welfare outcomes discussed in the previous section. The differ-ences in project outcomes between treatment and control areas over time are tested, first using tests of comparisons of means (Section 4.2), and then through regression analysis for a selected set of indicators (Section 4.3).
4.1 KALAHI-CIDSS Accomplishment in Survey Areas
The implementation of KALAHI-CIDSS in the evaluation areas started in October 2004, about a year after the baseline survey was conducted. In the initial cycle, eighteen barangays in the treat-ment areas were given funding to implement their respective subprojects. Fourteen barangays were prioritized in the second cycle and another eighteen in the third cycle. Overall, about two-thirds of the sixty-six treatment barangays in the survey areas were recipients of KALAHI-CIDSS
subprojects. Available evidence indicates that poorer barangays and barangays with a higher participation in barangay assemblies prior to subproject implementation were more likely to be prioritized (Labonne and Chase 2009).
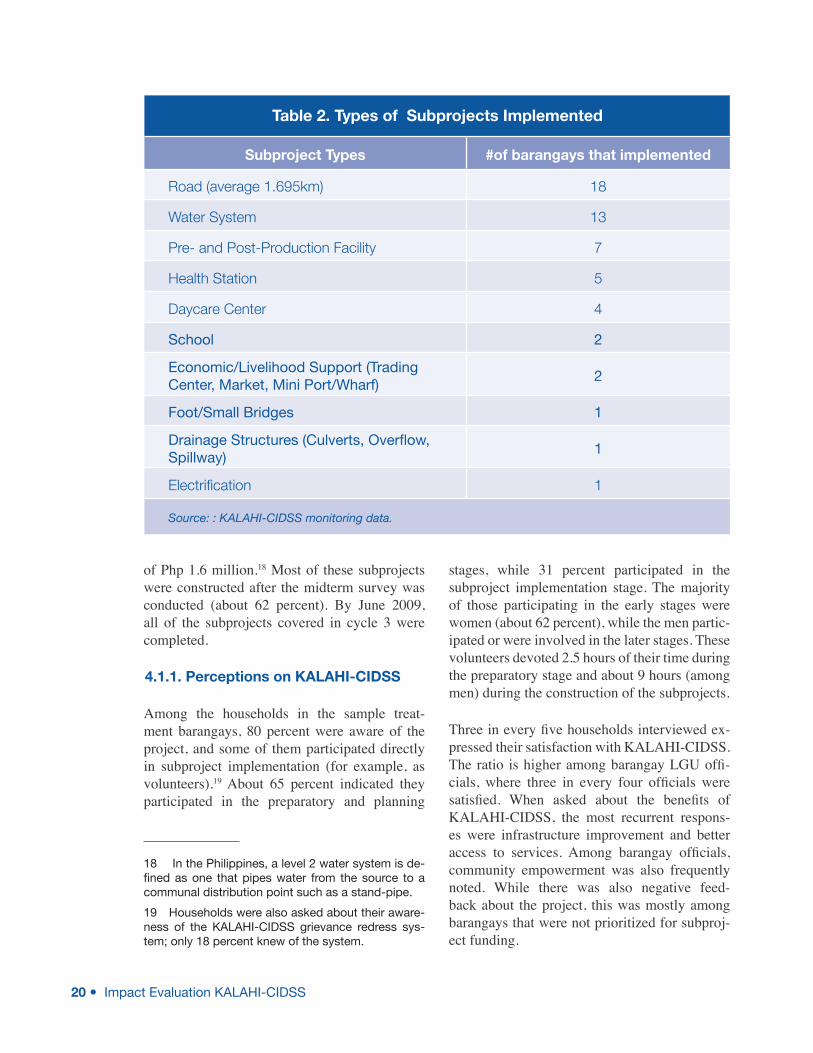
The choice of subprojects implemented in recip-ient barangays corresponds to the most pressing needs, as identified by the community members in the respective localities. The profile of subprojects is summarized in Table 2. About 33 percent of the subprojects funded are roads and 24 percent are community water systems. Other preferred subprojects are pre- and final-production facilities, health stations, daycare centers, and school buildings. This corresponds favorably to the problems identified by respon-dents during the baseline survey (Labonne and Chase 2009).
Individual subproject costs varied from Php 400,000 to Php 3.8 million (about $8,400 to $80,00016). The most costly are road subproj-ects, which average Php 2 million per subproj-ect.17 In the survey areas, most of these road subprojects were for the rehabilitation of farm-to-market roads. The water system subprojects were all level 2 systems, with an average cost
16 All dollar amounts are U.S. dollars unless other-wise indicated.
17 Implementing LGUs share a 30 percent counter-part of the total cost
20 Impact Evaluation KALAHI-CIDSS
of Php 1.6 million.18 Most of these subprojects were constructed after the midterm survey was conducted (about 62 percent). By June 2009, all of the subprojects covered in cycle 3 were completed.
4.1.1. Perceptions on KALAHI-CIDSS
Among the households in the sample treat-ment barangays, 80 percent were aware of the project, and some of them participated directly in subproject implementation (for example, as volunteers).19 About 65 percent indicated they participated in the preparatory and planning
18 In the Philippines, a level 2 water system is de-fined as one that pipes water from the source to a communal distribution point such as a stand-pipe.
19 Households were also asked about their aware-ness of the KALAHI-CIDSS grievance redress sys-tem; only 18 percent knew of the system.
stages, while 31 percent participated in the subproject implementation stage. The majority of those participating in the early stages were women (about 62 percent), while the men partic-ipated or were involved in the later stages. These volunteers devoted 2.5 hours of their time during the preparatory stage and about 9 hours (among men) during the construction of the subprojects.
Three in every five households interviewed ex-pressed their satisfaction with KALAHI-CIDSS. The ratio is higher among barangay LGU offi-cials, where three in every four officials were satisfied. When asked about the benefits of KALAHI-CIDSS, the most recurrent respons-es were infrastructure improvement and better access to services. Among barangay officials, community empowerment was also frequently noted. While there was also negative feed-back about the project, this was mostly among barangays that were not prioritized for subproj-ect funding.
Table 2. Types of Subprojects Implemented
Subproject Types #of barangays that implemented
Road (average 1.695km) 18
Water System 13
Pre- and Post-Production Facility 7
Health Station 5
Daycare Center 4
School 2
Economic/Livelihood Support (Trading Center, Market, Mini Port/Wharf)
2
Foot/Small Bridges 1
Drainage Structures (Culverts, Overflow, Spillway)
1
Electrification 1
Source: : KALAHI-CIDSS monitoring data.
Final Survey 21
4.2 Key Evaluation Results
Double-difference estimates of project impacts are computed by comparing the value of the difference between the treatment and control group in the variables of interest at final with the baseline value of the difference. These esti-mates capture longer-term impacts, rather than the short-term impacts that tend to be the fo-cus of evaluations. Key results are presented in the main text below, with additional results in Annex 4.
The double differences were subjected to tests of statistical significance. The results are reported in the tables as a string of either “+” or “-“. A positive sign indicates a positive project impact. The number of plus signs indicates the level of significance at which the hypothesis is rejected (“+” rejected at 10 percent, “++” rejected at 5 percent, and “+++” rejected at 1 percent) On the other hand, a minus sign indicates a negative project impact.
4.2.1. Key Welfare Impacts
In this section, we look at the impacts of KALAHI-CIDSS on key welfare outcomes. Specifically, we start by looking at the impacts on per capita consumption and then move on to impacts on labor force participation and produc-tion practices.
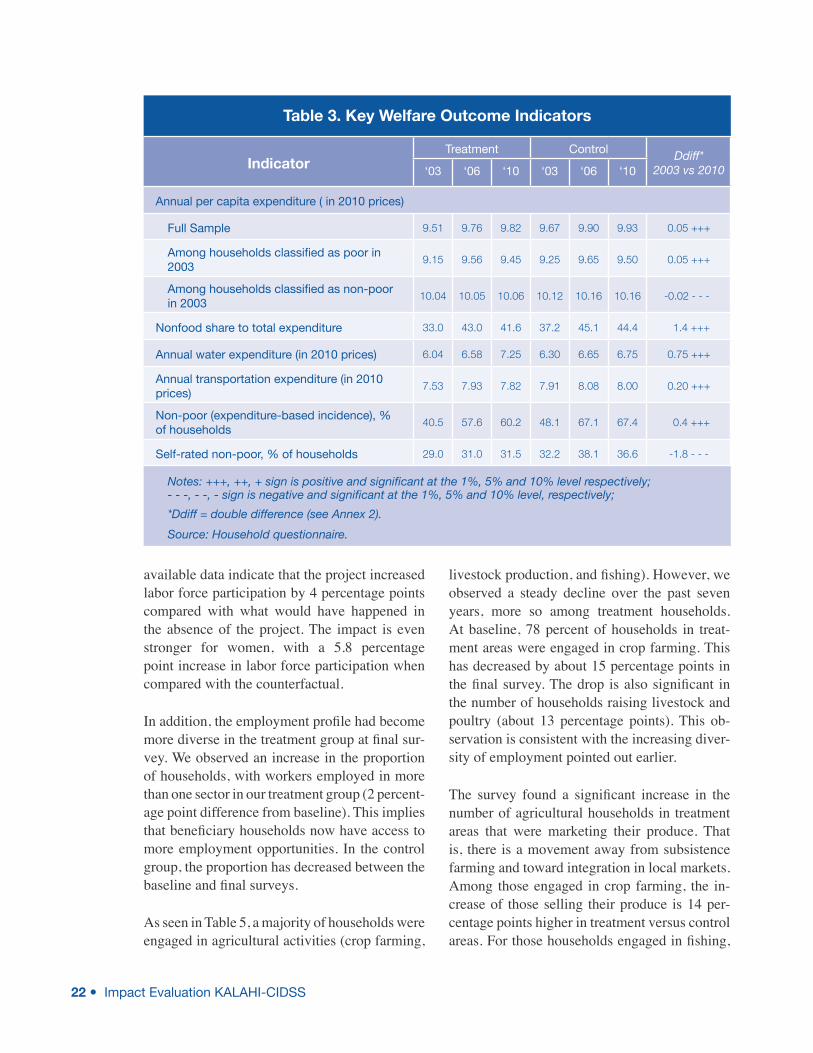
As indicated in Table 3, the project led to a 5 percent increase in per capita consumption.20 This is in addition to the increase that occurred in the control group between 2003 and 2010. If we distinguish households by their initial poverty status, we observe that among poor households, the increase was higher in the treatment group
20 We use the natural logarithm. Extreme values unnecessarily pull averages and may mask the actual changes of pooled estimates. By using the natural logarithm, the double-difference can be interpreted as percent difference between the two groups.
by 5 percent.21 Conversely, among the non-poor households, the increase was lower in the treat-ment group by 2 percent.
In addition, we looked at the non-food share of expenditures, which is arguably a good measure of welfare. The idea is that the poorer the house-hold, the smaller their share of non-food con-sumption. Consistent with the above findings on consumption, the project had a positive impact on the share of non-food expenditures. A 1.4 percentage-point increase can be attributed to the project, or 4.5 percent of the baseline value.
Consistent with nationwide trends, poverty inci-dence22 has decreased from baseline to end line in both treatment and control groups. Double-difference estimates indicate that the project contributed an additional 0.4 percentage points to the decrease. The small decline in poverty in-cidence—despite the size of the impacts on per capita consumption—seems to suggest that the impacts were greater for households at the bottom of the wealth distribution. Despite evidence of improvements in welfare outcomes, the inci-dence of self-rated poverty has decreased only slightly in both treatment and control groups. Moreover, the decrease was more pronounced in the control group, by 1.8 percentage points.
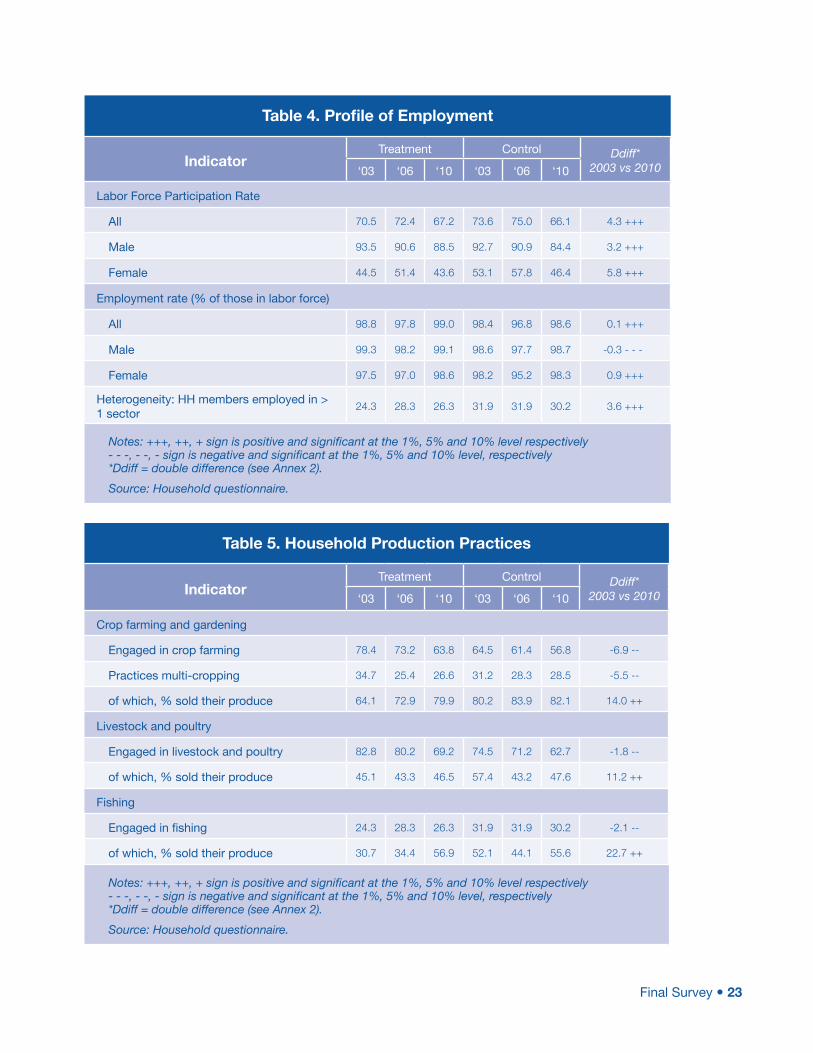
We now look at project impacts on labor force participation and production practices. The ra-tionale is that positive impacts on labor force participation and production practices could explain the positive impacts on per capita con-sumption.
Labor participation rates have decreased from their previous levels in both control and treat-ment areas (Table 4). This is likely to be due to the negative impacts of the global financial crisis. Importantly, however, the decline is less marked in KALAHI-CIDSS areas. Specifically,
21 A household is classified as poor in 2003 if their per capita expenditures at baseline were lower than the official regional poverty line.
22 Computed using published poverty lines.
22 Impact Evaluation KALAHI-CIDSS
available data indicate that the project increased labor force participation by 4 percentage points compared with what would have happened in the absence of the project. The impact is even stronger for women, with a 5.8 percentage point increase in labor force participation when compared with the counterfactual.
In addition, the employment profile had become more diverse in the treatment group at final sur-vey. We observed an increase in the proportion of households, with workers employed in more than one sector in our treatment group (2 percent-age point difference from baseline). This implies that beneficiary households now have access to more employment opportunities. In the control group, the proportion has decreased between the baseline and final surveys.
As seen in Table 5, a majority of households were engaged in agricultural activities (crop farming,
livestock production, and fishing). However, we observed a steady decline over the past seven years, more so among treatment households. At baseline, 78 percent of households in treat-ment areas were engaged in crop farming. This has decreased by about 15 percentage points in the final survey. The drop is also significant in the number of households raising livestock and poultry (about 13 percentage points). This ob-servation is consistent with the increasing diver-sity of employment pointed out earlier.
The survey found a significant increase in the number of agricultural households in treatment areas that were marketing their produce. That is, there is a movement away from subsistence farming and toward integration in local markets. Among those engaged in crop farming, the in-crease of those selling their produce is 14 per-centage points higher in treatment versus control areas. For those households engaged in fishing,
Table 3. Key Welfare Outcome Indicators
IndicatorTreatment Control Ddiff*
2003 vs 2010‘03 ‘06 ‘10 ‘03 ‘06 ‘10
Annual per capita expenditure ( in 2010 prices)
Full Sample 9.51 9.76 9.82 9.67 9.90 9.93 0.05 +++
Among households classified as poor in 2003
9.15 9.56 9.45 9.25 9.65 9.50 0.05 +++
Among households classified as non-poor in 2003
10.04 10.05 10.06 10.12 10.16 10.16 -0.02 - - -
Nonfood share to total expenditure 33.0 43.0 41.6 37.2 45.1 44.4 1.4 +++
Annual water expenditure (in 2010 prices) 6.04 6.58 7.25 6.30 6.65 6.75 0.75 +++
Annual transportation expenditure (in 2010 prices)
7.53 7.93 7.82 7.91 8.08 8.00 0.20 +++
Non-poor (expenditure-based incidence), % of households
40.5 57.6 60.2 48.1 67.1 67.4 0.4 +++
Self-rated non-poor, % of households 29.0 31.0 31.5 32.2 38.1 36.6 -1.8 - - -
Notes: +++, ++, + sign is positive and significant at the 1%, 5% and 10% level respectively; - - -, - -, - sign is negative and significant at the 1%, 5% and 10% level, respectively;
*Ddiff = double difference (see Annex 2).
Source: Household questionnaire.
Final Survey 23
Table 4. Profile of Employment
IndicatorTreatment Control Ddiff*
2003 vs 2010‘03 ‘06 ‘10 ‘03 ‘06 ‘10
Labor Force Participation Rate
All 70.5 72.4 67.2 73.6 75.0 66.1 4.3 +++
Male 93.5 90.6 88.5 92.7 90.9 84.4 3.2 +++
Female 44.5 51.4 43.6 53.1 57.8 46.4 5.8 +++
Employment rate (% of those in labor force)
All 98.8 97.8 99.0 98.4 96.8 98.6 0.1 +++
Male 99.3 98.2 99.1 98.6 97.7 98.7 -0.3 - - -
Female 97.5 97.0 98.6 98.2 95.2 98.3 0.9 +++
Heterogeneity: HH members employed in > 1 sector
24.3 28.3 26.3 31.9 31.9 30.2 3.6 +++
Notes: +++, ++, + sign is positive and significant at the 1%, 5% and 10% level respectively - - -, - -, - sign is negative and significant at the 1%, 5% and 10% level, respectively *Ddiff = double difference (see Annex 2).
Source: Household questionnaire.
Table 5. Household Production Practices
IndicatorTreatment Control Ddiff*
2003 vs 2010‘03 ‘06 ‘10 ‘03 ‘06 ‘10
Crop farming and gardening
Engaged in crop farming 78.4 73.2 63.8 64.5 61.4 56.8 -6.9 --
Practices multi-cropping 34.7 25.4 26.6 31.2 28.3 28.5 -5.5 --
of which, % sold their produce 64.1 72.9 79.9 80.2 83.9 82.1 14.0 ++
Livestock and poultry
Engaged in livestock and poultry 82.8 80.2 69.2 74.5 71.2 62.7 -1.8 --
of which, % sold their produce 45.1 43.3 46.5 57.4 43.2 47.6 11.2 ++
Fishing
Engaged in fishing 24.3 28.3 26.3 31.9 31.9 30.2 -2.1 --
of which, % sold their produce 30.7 34.4 56.9 52.1 44.1 55.6 22.7 ++
Notes: +++, ++, + sign is positive and significant at the 1%, 5% and 10% level respectively - - -, - -, - sign is negative and significant at the 1%, 5% and 10% level, respectively *Ddiff = double difference (see Annex 2).
Source: Household questionnaire.
24 Impact Evaluation KALAHI-CIDSS
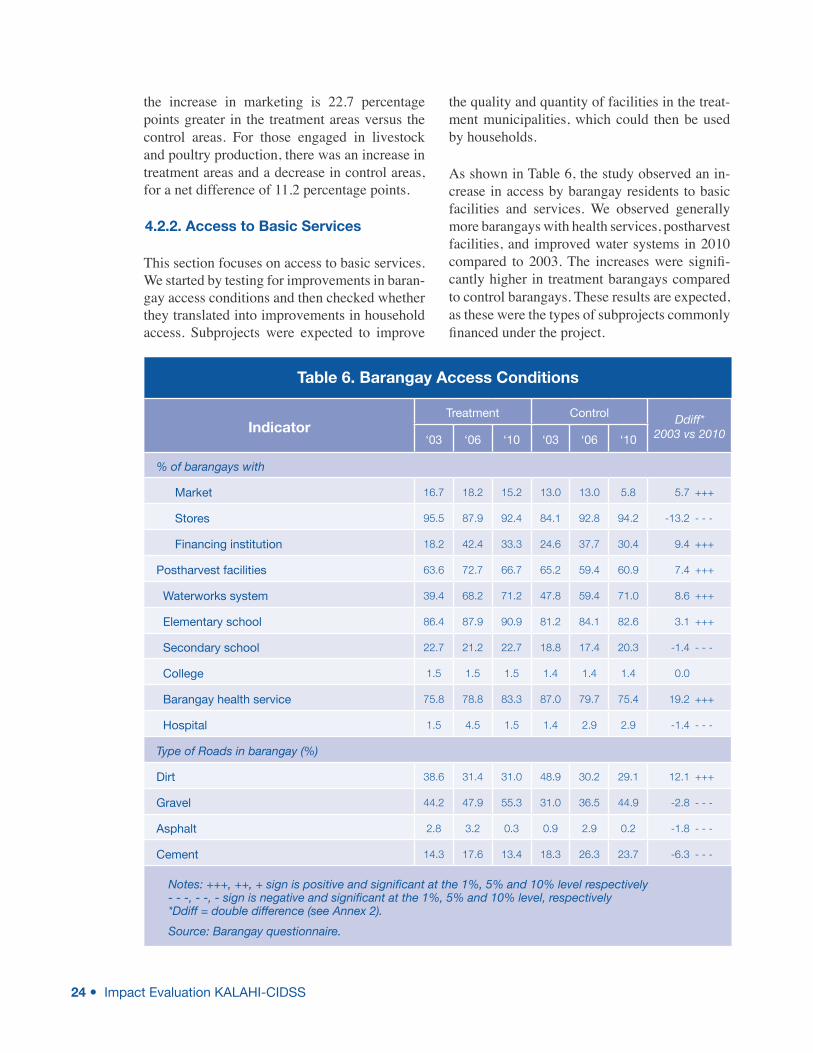
the increase in marketing is 22.7 percentage points greater in the treatment areas versus the control areas. For those engaged in livestock and poultry production, there was an increase in treatment areas and a decrease in control areas, for a net difference of 11.2 percentage points.
4.2.2. Access to Basic Services
This section focuses on access to basic services. We started by testing for improvements in baran-gay access conditions and then checked whether they translated into improvements in household access. Subprojects were expected to improve
the quality and quantity of facilities in the treat-ment municipalities, which could then be used by households.
As shown in Table 6, the study observed an in-crease in access by barangay residents to basic facilities and services. We observed generally more barangays with health services, postharvest facilities, and improved water systems in 2010 compared to 2003. The increases were signifi-cantly higher in treatment barangays compared to control barangays. These results are expected, as these were the types of subprojects commonly financed under the project.
Table 6. Barangay Access Conditions
IndicatorTreatment Control Ddiff*
2003 vs 2010‘03 ‘06 ‘10 ‘03 ‘06 ‘10
% of barangays with
Market 16.7 18.2 15.2 13.0 13.0 5.8 5.7 +++
Stores 95.5 87.9 92.4 84.1 92.8 94.2 -13.2 - - -
Financing institution 18.2 42.4 33.3 24.6 37.7 30.4 9.4 +++
Postharvest facilities 63.6 72.7 66.7 65.2 59.4 60.9 7.4 +++
Waterworks system 39.4 68.2 71.2 47.8 59.4 71.0 8.6 +++
Elementary school 86.4 87.9 90.9 81.2 84.1 82.6 3.1 +++
Secondary school 22.7 21.2 22.7 18.8 17.4 20.3 -1.4 - - -
College 1.5 1.5 1.5 1.4 1.4 1.4 0.0
Barangay health service 75.8 78.8 83.3 87.0 79.7 75.4 19.2 +++
Hospital 1.5 4.5 1.5 1.4 2.9 2.9 -1.4 - - -
Type of Roads in barangay (%)
Dirt 38.6 31.4 31.0 48.9 30.2 29.1 12.1 +++
Gravel 44.2 47.9 55.3 31.0 36.5 44.9 -2.8 - - -
Asphalt 2.8 3.2 0.3 0.9 2.9 0.2 -1.8 - - -
Cement 14.3 17.6 13.4 18.3 26.3 23.7 -6.3 - - -
Notes: +++, ++, + sign is positive and significant at the 1%, 5% and 10% level respectively- - -, - -, - sign is negative and significant at the 1%, 5% and 10% level, respectively*Ddiff = double difference (see Annex 2).
Source: Barangay questionnaire.
Final Survey 25
Increases in the proportion of both treatment and control barangays with financial institu-tions were likewise reported, with treatment ar-eas having higher increments. While the project did not directly provide micro-credit and liveli-hood subprojects, this could be an indication of increased business and agricultural activities in the KALAHI-CIDSS areas. It may also be due to micro-finance institutions similarly target-ing poor municipalities, and/or targeting those areas and populations that are benefiting from KALAHI-CIDSS social mobilization support.
We observed a small increase in the proportion of KALAHI-CIDSS barangays with elementary schools. However, there was little or no change in the proportion of barangays with secondary schools and colleges in both KALAHI-CIDSS and non-KALAHI-CIDSS areas. This is to be expected, as secondary schools and colleges are typically not barangay-level investments that the project tends to finance.
The survey data indicate that there was a dete-rioration in road infrastructure, particularly in the treatment barangays. From 2003 to 2010, the proportion of asphalt and cement roads decreased in the treatment barangays, while it increased in the control barangays. The difference, as shown in Table 6, is 1.8 percentage points for asphalt and 6.3 percentage points for cement roads. On
the other hand, the proportion of dirt roads de-creased for both treatment and control baran-gays. As expected, the decrease is much larger in the control areas (where road improvement has been greater) compared to the treatment areas. These findings on the state of roads are at odds with the results of the analysis of household ac-cess conditions discussed below.
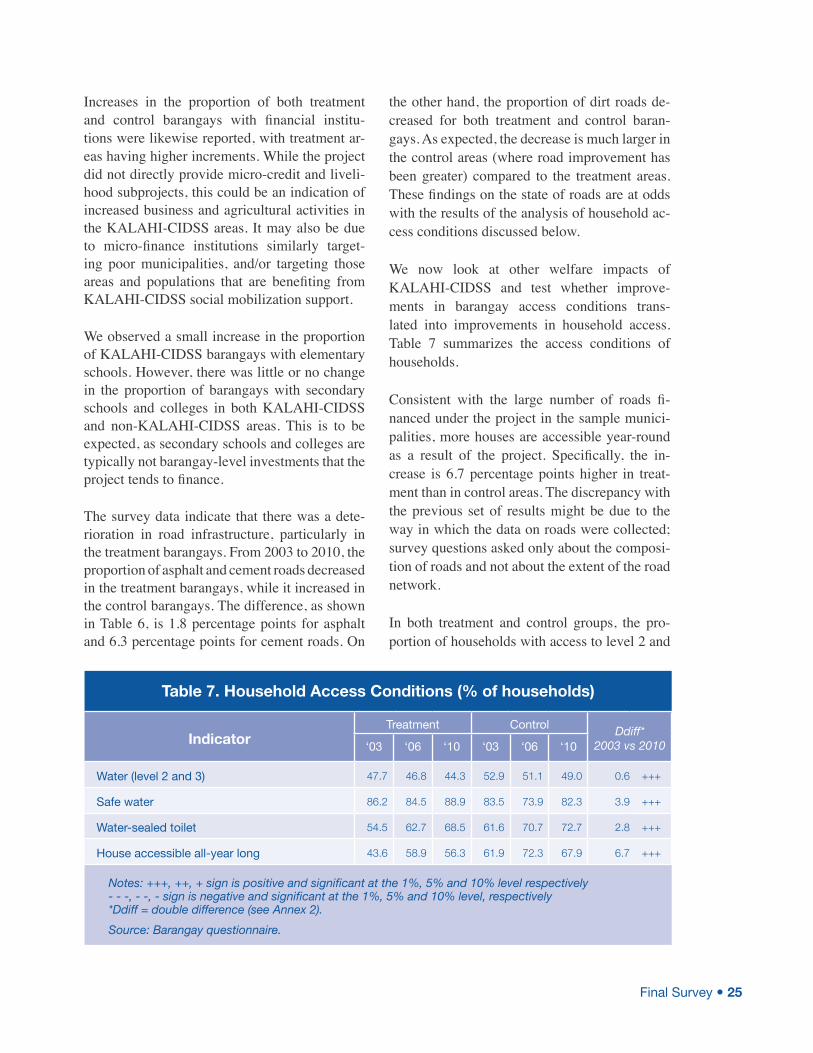
We now look at other welfare impacts of KALAHI-CIDSS and test whether improve-ments in barangay access conditions trans-lated into improvements in household access. Table 7 summarizes the access conditions of households.
Consistent with the large number of roads fi-nanced under the project in the sample munici-palities, more houses are accessible year-round as a result of the project. Specifically, the in-crease is 6.7 percentage points higher in treat-ment than in control areas. The discrepancy with the previous set of results might be due to the way in which the data on roads were collected; survey questions asked only about the composi-tion of roads and not about the extent of the road network.
In both treatment and control groups, the pro-portion of households with access to level 2 and
Table 7. Household Access Conditions (% of households)
IndicatorTreatment Control Ddiff*
2003 vs 2010‘03 ‘06 ‘10 ‘03 ‘06 ‘10
Water (level 2 and 3) 47.7 46.8 44.3 52.9 51.1 49.0 0.6 +++
Safe water 86.2 84.5 88.9 83.5 73.9 82.3 3.9 +++
Water-sealed toilet 54.5 62.7 68.5 61.6 70.7 72.7 2.8 +++
House accessible all-year long 43.6 58.9 56.3 61.9 72.3 67.9 6.7 +++
Notes: +++, ++, + sign is positive and significant at the 1%, 5% and 10% level respectively- - -, - -, - sign is negative and significant at the 1%, 5% and 10% level, respectively*Ddiff = double difference (see Annex 2).
Source: Barangay questionnaire.
26 Impact Evaluation KALAHI-CIDSS
level 3 water systems went down.23 On the positive side, however, more households now have access to safe water, compared to 2003. The increase in access to safe water is 3.9 percentage points higher in treatment areas than in control areas. Given the number of water systems supported by the project in our sample areas, the size of the impact appears limited. The same is true for households with water-sealed toilets. There were increases in both groups; however, the increase
23 In the Philippines, a level 2 water system con-sists of a piped water system with a communal water point (e.g. borewell). A level 3 water system introduc-es private water points (e.g. house connection).
is 2.8 percentage points higher in treatment areas compared to those in control areas.
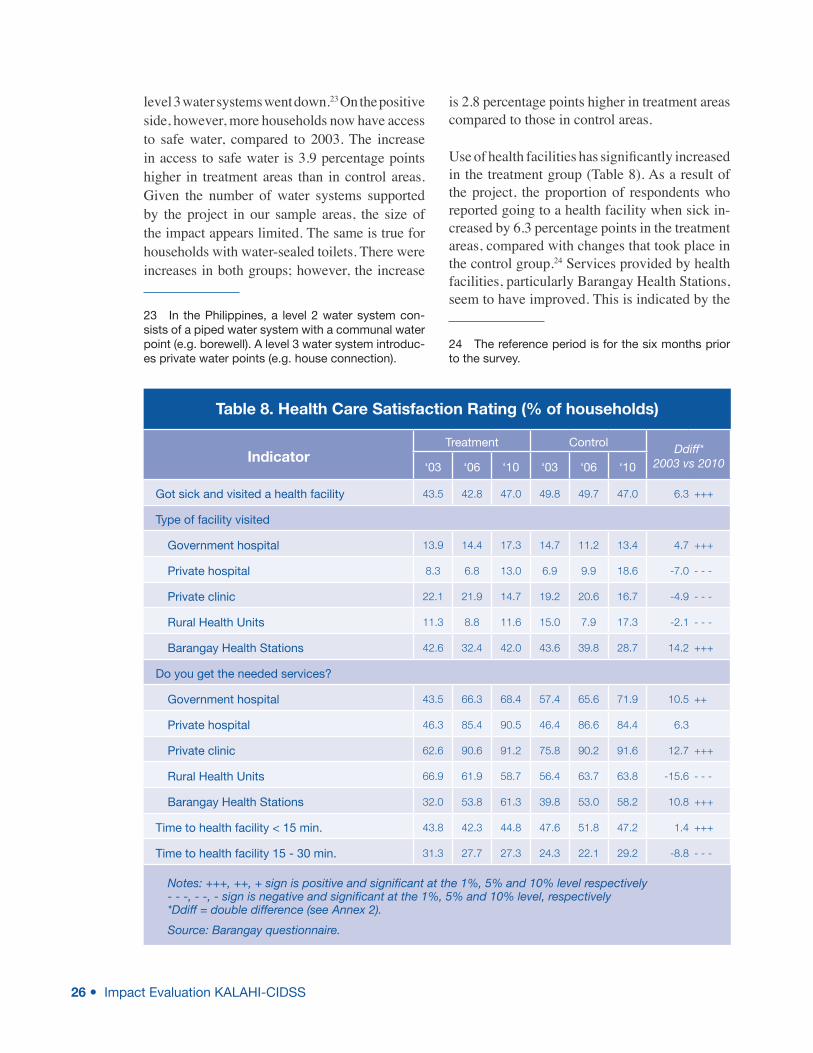
Use of health facilities has significantly increased in the treatment group (Table 8). As a result of the project, the proportion of respondents who reported going to a health facility when sick in-creased by 6.3 percentage points in the treatment areas, compared with changes that took place in the control group.24 Services provided by health facilities, particularly Barangay Health Stations, seem to have improved. This is indicated by the
24 The reference period is for the six months prior to the survey.
Table 8. Health Care Satisfaction Rating (% of households)
IndicatorTreatment Control Ddiff*
2003 vs 2010‘03 ‘06 ‘10 ‘03 ‘06 ‘10
Got sick and visited a health facility 43.5 42.8 47.0 49.8 49.7 47.0 6.3 +++
Type of facility visited
Government hospital 13.9 14.4 17.3 14.7 11.2 13.4 4.7 +++
Private hospital 8.3 6.8 13.0 6.9 9.9 18.6 -7.0 - - -
Private clinic 22.1 21.9 14.7 19.2 20.6 16.7 -4.9 - - -
Rural Health Units 11.3 8.8 11.6 15.0 7.9 17.3 -2.1 - - -
Barangay Health Stations 42.6 32.4 42.0 43.6 39.8 28.7 14.2 +++
Do you get the needed services?
Government hospital 43.5 66.3 68.4 57.4 65.6 71.9 10.5 ++
Private hospital 46.3 85.4 90.5 46.4 86.6 84.4 6.3
Private clinic 62.6 90.6 91.2 75.8 90.2 91.6 12.7 +++
Rural Health Units 66.9 61.9 58.7 56.4 63.7 63.8 -15.6 - - -
Barangay Health Stations 32.0 53.8 61.3 39.8 53.0 58.2 10.8 +++
Time to health facility < 15 min. 43.8 42.3 44.8 47.6 51.8 47.2 1.4 +++
Time to health facility 15 - 30 min. 31.3 27.7 27.3 24.3 22.1 29.2 -8.8 - - -
Notes: +++, ++, + sign is positive and significant at the 1%, 5% and 10% level respectively- - -, - -, - sign is negative and significant at the 1%, 5% and 10% level, respectively*Ddiff = double difference (see Annex 2).
Source: Barangay questionnaire.
Final Survey 27
increase in the number of respondents report-ing they were provided with the service they required. The increase is 10 percentage points higher in treatment than in control barangays.
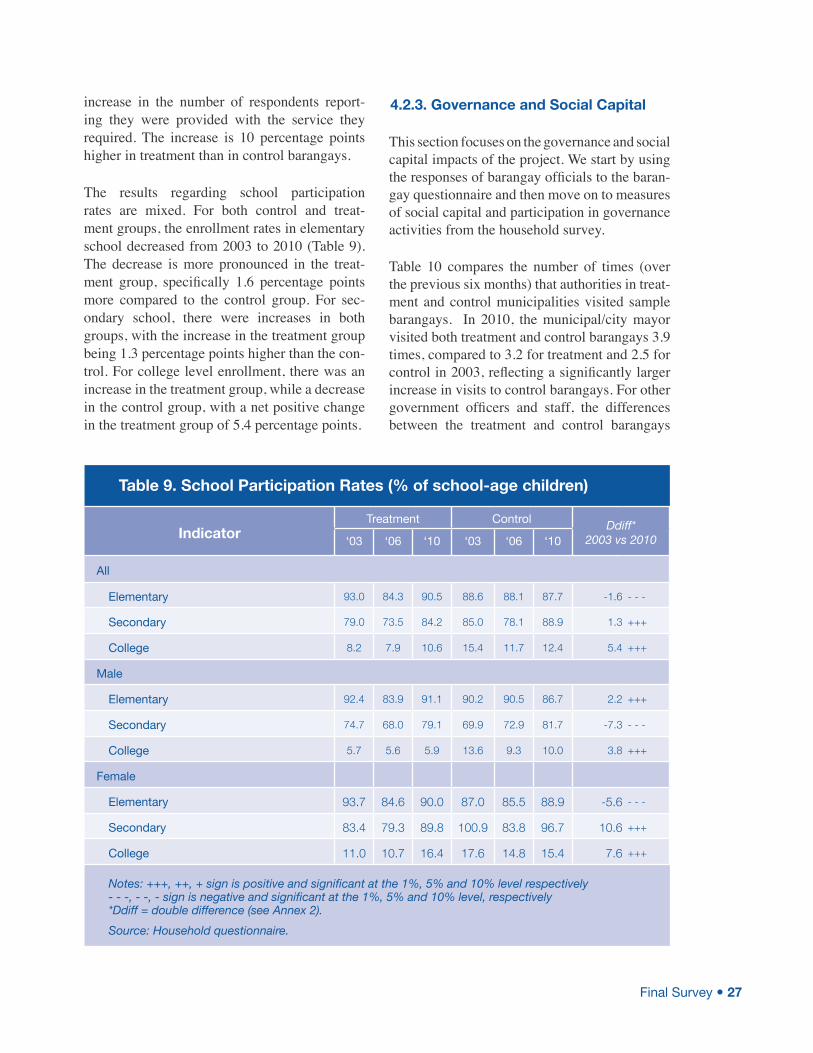
The results regarding school participation rates are mixed. For both control and treat-ment groups, the enrollment rates in elementary school decreased from 2003 to 2010 (Table 9). The decrease is more pronounced in the treat-ment group, specifically 1.6 percentage points more compared to the control group. For sec-ondary school, there were increases in both groups, with the increase in the treatment group being 1.3 percentage points higher than the con-trol. For college level enrollment, there was an increase in the treatment group, while a decrease in the control group, with a net positive change in the treatment group of 5.4 percentage points.
4.2.3. Governance and Social Capital
This section focuses on the governance and social capital impacts of the project. We start by using the responses of barangay officials to the baran-gay questionnaire and then move on to measures of social capital and participation in governance activities from the household survey.
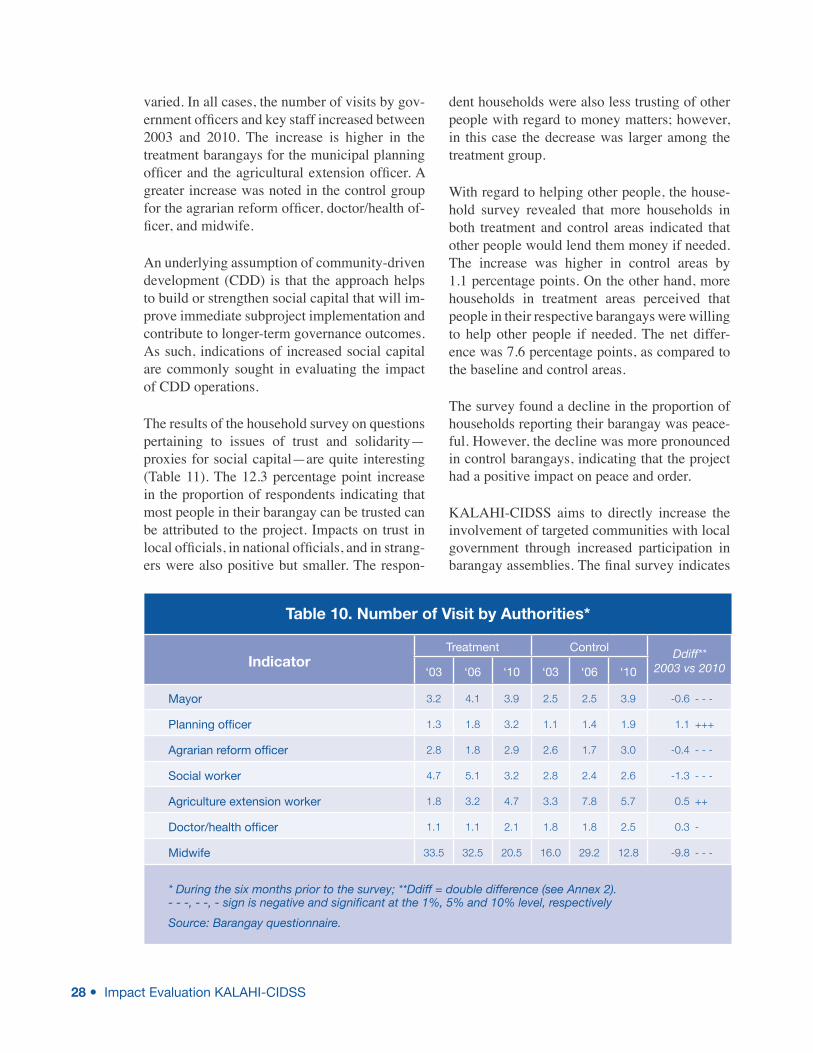
Table 10 compares the number of times (over the previous six months) that authorities in treat-ment and control municipalities visited sample barangays. In 2010, the municipal/city mayor visited both treatment and control barangays 3.9 times, compared to 3.2 for treatment and 2.5 for control in 2003, reflecting a significantly larger increase in visits to control barangays. For other government officers and staff, the differences between the treatment and control barangays
Table 9. School Participation Rates (% of school-age children)
IndicatorTreatment Control Ddiff*
2003 vs 2010‘03 ‘06 ‘10 ‘03 ‘06 ‘10
All
Elementary 93.0 84.3 90.5 88.6 88.1 87.7 -1.6 - - -
Secondary 79.0 73.5 84.2 85.0 78.1 88.9 1.3 +++
College 8.2 7.9 10.6 15.4 11.7 12.4 5.4 +++
Male
Elementary 92.4 83.9 91.1 90.2 90.5 86.7 2.2 +++
Secondary 74.7 68.0 79.1 69.9 72.9 81.7 -7.3 - - -
College 5.7 5.6 5.9 13.6 9.3 10.0 3.8 +++
Female
Elementary 93.7 84.6 90.0 87.0 85.5 88.9 -5.6 - - -
Secondary 83.4 79.3 89.8 100.9 83.8 96.7 10.6 +++
College 11.0 10.7 16.4 17.6 14.8 15.4 7.6 +++
Notes: +++, ++, + sign is positive and significant at the 1%, 5% and 10% level respectively - - -, - -, - sign is negative and significant at the 1%, 5% and 10% level, respectively *Ddiff = double difference (see Annex 2).
Source: Household questionnaire.
28 Impact Evaluation KALAHI-CIDSS
varied. In all cases, the number of visits by gov-ernment officers and key staff increased between 2003 and 2010. The increase is higher in the treatment barangays for the municipal planning officer and the agricultural extension officer. A greater increase was noted in the control group for the agrarian reform officer, doctor/health of-ficer, and midwife.
An underlying assumption of community-driven development (CDD) is that the approach helps to build or strengthen social capital that will im-prove immediate subproject implementation and contribute to longer-term governance outcomes. As such, indications of increased social capital are commonly sought in evaluating the impact of CDD operations.
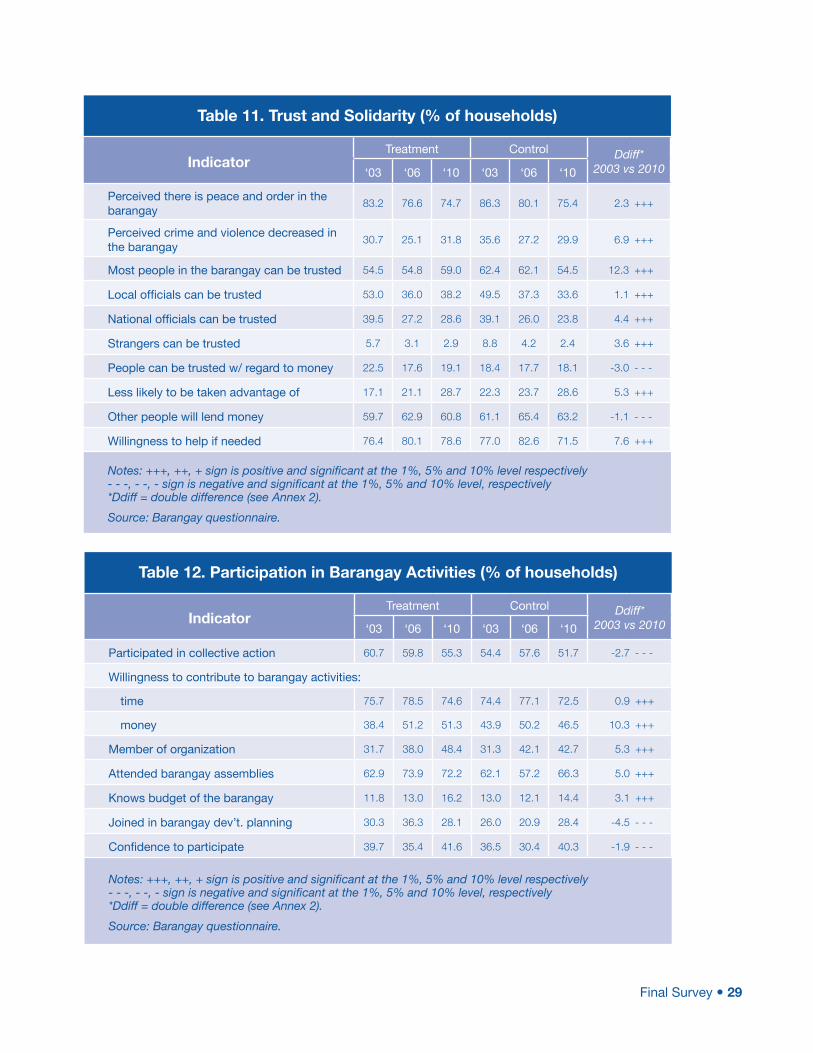
The results of the household survey on questions pertaining to issues of trust and solidarity—proxies for social capital—are quite interesting (Table 11). The 12.3 percentage point increase in the proportion of respondents indicating that most people in their barangay can be trusted can be attributed to the project. Impacts on trust in local officials, in national officials, and in strang-ers were also positive but smaller. The respon-
dent households were also less trusting of other people with regard to money matters; however, in this case the decrease was larger among the treatment group.
With regard to helping other people, the house-hold survey revealed that more households in both treatment and control areas indicated that other people would lend them money if needed. The increase was higher in control areas by 1.1 percentage points. On the other hand, more households in treatment areas perceived that people in their respective barangays were willing to help other people if needed. The net differ-ence was 7.6 percentage points, as compared to the baseline and control areas.
The survey found a decline in the proportion of households reporting their barangay was peace-ful. However, the decline was more pronounced in control barangays, indicating that the project had a positive impact on peace and order.
KALAHI-CIDSS aims to directly increase the involvement of targeted communities with local government through increased participation in barangay assemblies. The final survey indicates
Table 10. Number of Visit by Authorities*
IndicatorTreatment Control Ddiff**
2003 vs 2010‘03 ‘06 ‘10 ‘03 ‘06 ‘10
Mayor 3.2 4.1 3.9 2.5 2.5 3.9 -0.6 - - -
Planning officer 1.3 1.8 3.2 1.1 1.4 1.9 1.1 +++
Agrarian reform officer 2.8 1.8 2.9 2.6 1.7 3.0 -0.4 - - -
Social worker 4.7 5.1 3.2 2.8 2.4 2.6 -1.3 - - -
Agriculture extension worker 1.8 3.2 4.7 3.3 7.8 5.7 0.5 ++
Doctor/health officer 1.1 1.1 2.1 1.8 1.8 2.5 0.3 -
Midwife 33.5 32.5 20.5 16.0 29.2 12.8 -9.8 - - -
* During the six months prior to the survey; **Ddiff = double difference (see Annex 2).- - -, - -, - sign is negative and significant at the 1%, 5% and 10% level, respectively
Source: Barangay questionnaire.
Final Survey 29
Table 11. Trust and Solidarity (% of households)
IndicatorTreatment Control Ddiff*
2003 vs 2010‘03 ‘06 ‘10 ‘03 ‘06 ‘10
Perceived there is peace and order in the barangay
83.2 76.6 74.7 86.3 80.1 75.4 2.3 +++
Perceived crime and violence decreased in the barangay
30.7 25.1 31.8 35.6 27.2 29.9 6.9 +++
Most people in the barangay can be trusted 54.5 54.8 59.0 62.4 62.1 54.5 12.3 +++
Local officials can be trusted 53.0 36.0 38.2 49.5 37.3 33.6 1.1 +++
National officials can be trusted 39.5 27.2 28.6 39.1 26.0 23.8 4.4 +++
Strangers can be trusted 5.7 3.1 2.9 8.8 4.2 2.4 3.6 +++
People can be trusted w/ regard to money 22.5 17.6 19.1 18.4 17.7 18.1 -3.0 - - -
Less likely to be taken advantage of 17.1 21.1 28.7 22.3 23.7 28.6 5.3 +++
Other people will lend money 59.7 62.9 60.8 61.1 65.4 63.2 -1.1 - - -
Willingness to help if needed 76.4 80.1 78.6 77.0 82.6 71.5 7.6 +++
Notes: +++, ++, + sign is positive and significant at the 1%, 5% and 10% level respectively- - -, - -, - sign is negative and significant at the 1%, 5% and 10% level, respectively*Ddiff = double difference (see Annex 2).
Source: Barangay questionnaire.
Table 12. Participation in Barangay Activities (% of households)
IndicatorTreatment Control Ddiff*
2003 vs 2010‘03 ‘06 ‘10 ‘03 ‘06 ‘10
Participated in collective action 60.7 59.8 55.3 54.4 57.6 51.7 -2.7 - - -
Willingness to contribute to barangay activities:
time 75.7 78.5 74.6 74.4 77.1 72.5 0.9 +++
money 38.4 51.2 51.3 43.9 50.2 46.5 10.3 +++
Member of organization 31.7 38.0 48.4 31.3 42.1 42.7 5.3 +++
Attended barangay assemblies 62.9 73.9 72.2 62.1 57.2 66.3 5.0 +++
Knows budget of the barangay 11.8 13.0 16.2 13.0 12.1 14.4 3.1 +++
Joined in barangay dev’t. planning 30.3 36.3 28.1 26.0 20.9 28.4 -4.5 - - -
Confidence to participate 39.7 35.4 41.6 36.5 30.4 40.3 -1.9 - - -
Notes: +++, ++, + sign is positive and significant at the 1%, 5% and 10% level respectively- - -, - -, - sign is negative and significant at the 1%, 5% and 10% level, respectively*Ddiff = double difference (see Annex 2).
Source: Barangay questionnaire.
30 Impact Evaluation KALAHI-CIDSS
that the proportion of households in the treat-ment group who attend barangay assemblies is 5 percentage points higher than it would have been in the absence of the project (Table 12). The proportion of households who were aware of the income and expenditure details of their barangay LGU has also increased. Specifically, a 3 percentage point increase in awareness can be attributed to the project.
We also observed significant increases in orga-nizational membership—a typical measure of social capital—with a 5.3 percentage point dif-ference between treatment and control areas.
However, some unexpected trends were ob-served regarding the participation of households in barangay planning activities. The proportion decreased from 30 percent in the baseline to 28 percent in the final survey. On the other hand, for the control group, we observed an increase from 26 percent in the baseline to 28.4 percent in the final survey.
In addition, we noted a lower proportion of treat-ment and control group households participating in collective action activities. The decrease is 2.7 percentage points greater in the treatment group compared to the control group, and more marked in barangays that implemented subproj-ects. This seems to be counter-intuitive and con-trary to what CDD hopes to achieve. However, a potential explanation is that the project increased returns to economic activity, which is consistent with results on labor force participation and pro-duction practices discussed above, and thus the opportunity cost of contributing time to com-munity subprojects has increased. This is also consistent with the study’s finding of a sizable increase in the proportion of households that were willing to contribute money for a commu-nity subproject (about 10 percentage points, or 26 percent of baseline levels). Households might be moving away from time contributions for collective action activities, and toward monetary contributions for the same purpose.
4.3 Results from regression analysis
We now test whether results discussed in section 4.2 are robust to alternative methodologies. Re-gression analysis is used to clarify the attribution of the changes observed as being due to project interventions or to other control variables.
The basic regression models estimated are the following:
Y(1) ipt
= a+b1 * midterm
ipx+ b
2 * post
ipt + c * KC
ipt
+ d1 * midterm
ipt * KC
ipt + d
2 * post
ipt * KCipt
+ Ii
*Albayipt
+I2 * Capiz
ipt + I
3 * Zambo_sur
ipt
Y(2) ipt
= a+b1 * midterm
ipx+ b
2 * post
ipt + c * SPI
ipt
+ d1 * midterm
ipt * SPI
ipt + d
2 * post
ipt * SPIipt
+ Ii
*Albayipt
+ I2 * Capiz
ipt + I
3 * Zambo_sur
ipt
where
Yipt
is the observation on variable Y on
the individual i residing p in baran-
gay p at time t,
midtermipx
takes on the value 1 if the obser-vation is taken during the midterm survey, 0 otherwise
postipt
takes on the value 1 if the observa-tion is taken during the final sur-vey, 0 otherwise
KCipt
takes on the value 1 if p is in a KALAHI-CIDSS beneficiary mu-nicipality, 0 otherwise
SPIipt
is 1 plus the cumulative number of subprojects implemented in ba-rangay p as of time t. Barangays in KALAHI-CIDSS municipali-ties that have not implemented subprojects at time t will have SPI
ipt
equal to 1; those in non-KALAHI- CIDSS municipalities will have SPI
ipt equal to 0
Final Survey 31
Albayipt
takes on the value 1 if p is in Albay, 0 otherwise
Capizipt
takes on the value 1 if p is in Capiz, 0 otherwise
Zambo_suript
takes on the value 1 if p is in Zam-boanga del Sur, 0 otherwise.
The variable SPI is introduced to further differ-entiate among KALAHI-CIDSS beneficiary ba-rangays. The innovative strategy of KALAHI-CIDSS has resulted in marked differences in project intervention among the beneficiary ba-rangays. A barangay with more subprojects im-plemented has more project inputs, both in terms of the hard infrastructure and soft capability-building components. Outcomes could vary ac-cording to the amount of project inputs, not just by whether or not the barangay is a KALAHI-CIDSS beneficiary. As discussed earlier, results on the impacts of receiving a subproject are more tentative than results on the impacts of residing in a KALAHI-CIDSS municipality. As a result, estimates from model 1 are more credible than estimates from model 2.
The dummy variables Albay, Capiz, and Zambo_sur are included to capture fixed effects that are due to province location. Examples of these are geoclimatic variables, provincial LGUs, or even regional economic performance.
The parameter of interest is in d2.It represents
the improvement in Y at final over the baseline
that could be attributed to project effects, holding constant the effect of the other factors including province effects. Put differently, the parameter captures long-term project impacts. The coef-ficient c captures the differences between the treatment and the control group at baseline and the coefficient d
1 captures short-term project
impacts.
We do not include additional controls for time-varying household characteristics, as they might be affected by project implementation. As a
result, their inclusion might lead to biased esti-mates of project impacts.
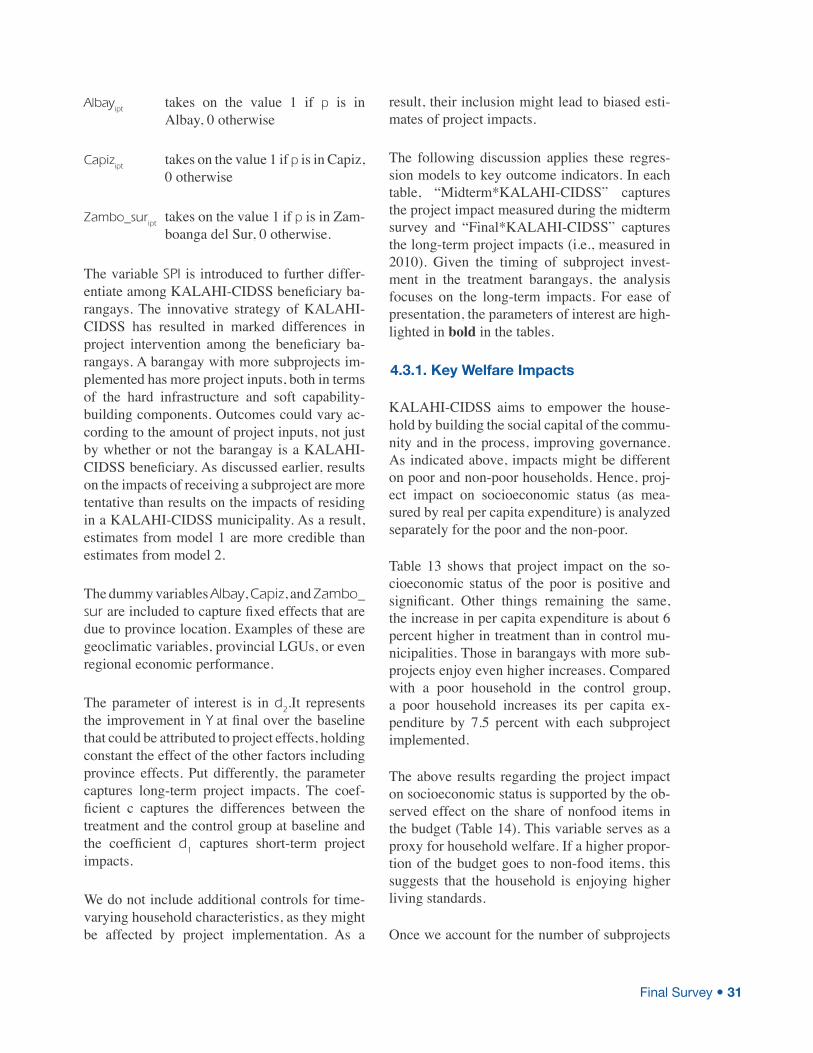
The following discussion applies these regres-sion models to key outcome indicators. In each table, “Midterm*KALAHI-CIDSS” captures the project impact measured during the midterm survey and “Final*KALAHI-CIDSS” captures the long-term project impacts (i.e., measured in 2010). Given the timing of subproject invest-ment in the treatment barangays, the analysis focuses on the long-term impacts. For ease of presentation, the parameters of interest are high-lighted in bold in the tables.
4.3.1. Key Welfare Impacts
KALAHI-CIDSS aims to empower the house-hold by building the social capital of the commu-nity and in the process, improving governance. As indicated above, impacts might be different on poor and non-poor households. Hence, proj-ect impact on socioeconomic status (as mea-sured by real per capita expenditure) is analyzed separately for the poor and the non-poor.
Table 13 shows that project impact on the so-cioeconomic status of the poor is positive and significant. Other things remaining the same, the increase in per capita expenditure is about 6 percent higher in treatment than in control mu-nicipalities. Those in barangays with more sub-projects enjoy even higher increases. Compared with a poor household in the control group, a poor household increases its per capita ex-penditure by 7.5 percent with each subproject implemented.
The above results regarding the project impact on socioeconomic status is supported by the ob-served effect on the share of nonfood items in the budget (Table 14). This variable serves as a proxy for household welfare. If a higher propor-tion of the budget goes to non-food items, this suggests that the household is enjoying higher living standards.
Once we account for the number of subprojects
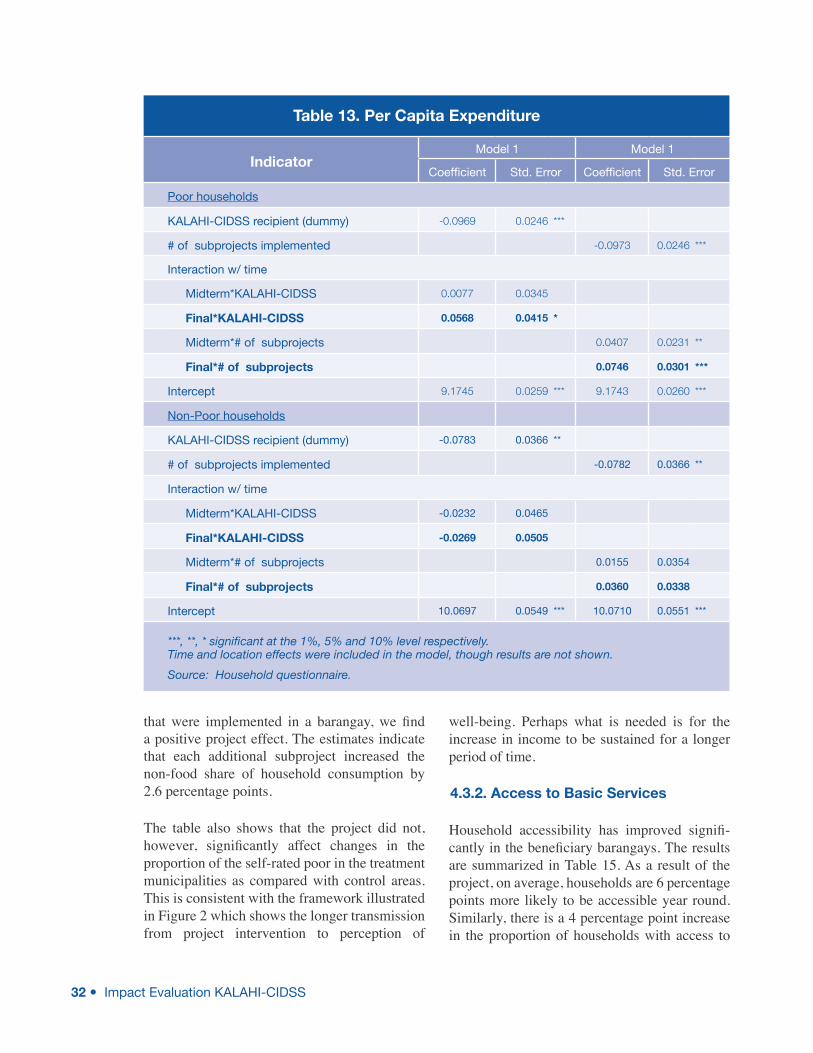
32 Impact Evaluation KALAHI-CIDSS
that were implemented in a barangay, we find a positive project effect. The estimates indicate that each additional subproject increased the non-food share of household consumption by 2.6 percentage points.
The table also shows that the project did not, however, significantly affect changes in the proportion of the self-rated poor in the treatment municipalities as compared with control areas. This is consistent with the framework illustrated in Figure 2 which shows the longer transmission from project intervention to perception of
well-being. Perhaps what is needed is for the increase in income to be sustained for a longer period of time.
4.3.2. Access to Basic Services
Household accessibility has improved signifi-cantly in the beneficiary barangays. The results are summarized in Table 15. As a result of the project, on average, households are 6 percentage points more likely to be accessible year round. Similarly, there is a 4 percentage point increase in the proportion of households with access to
Table 13. Per Capita Expenditure
IndicatorModel 1 Model 1
Coefficient Std. Error Coefficient Std. Error
Poor households
KALAHI-CIDSS recipient (dummy) -0.0969 0.0246 ***
# of subprojects implemented -0.0973 0.0246 ***
Interaction w/ time
Midterm*KALAHI-CIDSS 0.0077 0.0345
Final*KALAHI-CIDSS 0.0568 0.0415 *
Midterm*# of subprojects 0.0407 0.0231 **
Final*# of subprojects 0.0746 0.0301 ***
Intercept 9.1745 0.0259 *** 9.1743 0.0260 ***
Non-Poor households
KALAHI-CIDSS recipient (dummy) -0.0783 0.0366 **
# of subprojects implemented -0.0782 0.0366 **
Interaction w/ time
Midterm*KALAHI-CIDSS -0.0232 0.0465
Final*KALAHI-CIDSS -0.0269 0.0505
Midterm*# of subprojects 0.0155 0.0354
Final*# of subprojects 0.0360 0.0338
Intercept 10.0697 0.0549 *** 10.0710 0.0551 ***
***, **, * significant at the 1%, 5% and 10% level respectively. Time and location effects were included in the model, though results are not shown.
Source: Household questionnaire.
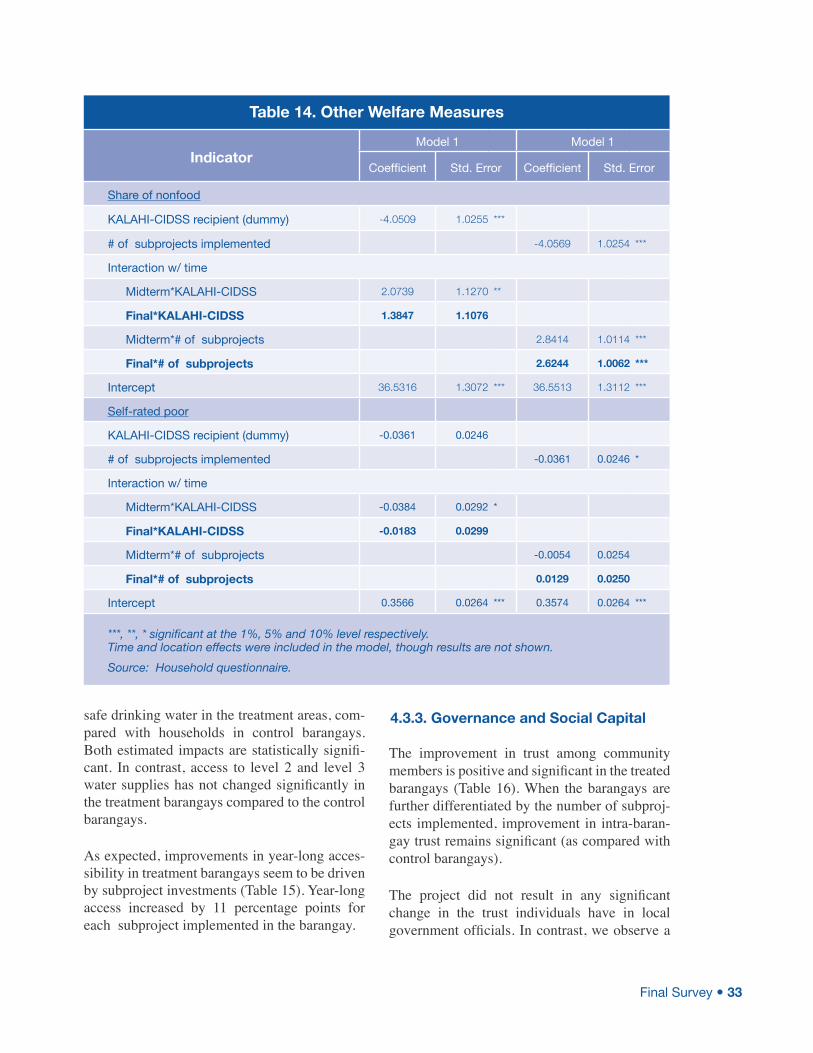
Final Survey 33
safe drinking water in the treatment areas, com-pared with households in control barangays. Both estimated impacts are statistically signifi-cant. In contrast, access to level 2 and level 3 water supplies has not changed significantly in the treatment barangays compared to the control barangays.
As expected, improvements in year-long acces-sibility in treatment barangays seem to be driven by subproject investments (Table 15). Year-long access increased by 11 percentage points for each subproject implemented in the barangay.
4.3.3. Governance and Social Capital
The improvement in trust among community members is positive and significant in the treated barangays (Table 16). When the barangays are further differentiated by the number of subproj-ects implemented, improvement in intra-baran-gay trust remains significant (as compared with control barangays).
The project did not result in any significant change in the trust individuals have in local government officials. In contrast, we observe a
Table 14. Other Welfare Measures
IndicatorModel 1 Model 1
Coefficient Std. Error Coefficient Std. Error
Share of nonfood
KALAHI-CIDSS recipient (dummy) -4.0509 1.0255 ***
# of subprojects implemented -4.0569 1.0254 ***
Interaction w/ time
Midterm*KALAHI-CIDSS 2.0739 1.1270 **
Final*KALAHI-CIDSS 1.3847 1.1076
Midterm*# of subprojects 2.8414 1.0114 ***
Final*# of subprojects 2.6244 1.0062 ***
Intercept 36.5316 1.3072 *** 36.5513 1.3112 ***
Self-rated poor
KALAHI-CIDSS recipient (dummy) -0.0361 0.0246
# of subprojects implemented -0.0361 0.0246 *
Interaction w/ time
Midterm*KALAHI-CIDSS -0.0384 0.0292 *
Final*KALAHI-CIDSS -0.0183 0.0299
Midterm*# of subprojects -0.0054 0.0254
Final*# of subprojects 0.0129 0.0250
Intercept 0.3566 0.0264 *** 0.3574 0.0264 ***
***, **, * significant at the 1%, 5% and 10% level respectively. Time and location effects were included in the model, though results are not shown.
Source: Household questionnaire.
34 Impact Evaluation KALAHI-CIDSS
marked improvement in trust toward national of-ficials. This improvement is significantly higher in treatment barangays than in control baran-gays. This may be because KALAHI-CIDSS is
known as a project of the national government.
The project succeeded in increasing attendance in barangay assemblies at the midterm. The in-
Table 15. Access to Amenities
IndicatorModel 1 Model 1
Coefficient Std. Error Coefficient Std. Error
House accessible all year long
KALAHI-CIDSS recipient (dummy) -0.1426 0.0336 ***
# of subprojects implemented -0.1425 0.0336 ***
Interaction w/ time
Midterm*KALAHI-CIDSS 0.0448 0.0361
Final*KALAHI-CIDSS 0.0595 0.0360 *
Midterm*# of subprojects 0.0960 0.0321 ***
Final*# of subprojects 0.1091 0.0307 ***
Intercept 0.6479 0.0287 *** 0.6495 0.0289 ***
Water system (levels 2 and 3)
KALAHI-CIDSS recipient (dummy) -0.0320 0.0399
# of subprojects implemented -0.0316 0.0399
Interaction w/ time
Midterm*KALAHI-CIDSS 0.0103 0.0422
Final*KALAHI-CIDSS 0.0040 0.0403
Midterm*# of subprojects 0.0278 0.0381
Final*# of subprojects 0.0366 0.0357
Intercept 0.5127 0.0351 *** 0.5141 0.0353 ***
Safe water
KALAHI-CIDSS recipient (dummy) 0.0214 0.0232
# of subprojects implemented 0.0215 0.0231
Interaction w/ time
Midterm*KALAHI-CIDSS 0.0801 0.0292 ***
Final*KALAHI-CIDSS 0.0392 0.0230 **
Midterm*# of subprojects 0.0289 0.0302
Final*# of subprojects 0.0139 0.0214
Intercept 0.9030 0.0170 *** 0.9022 0.0171 ***
***, **, * significant at the 1%, 5% and 10% level respectively. Time and location effects were included in the model, though results are not shown.
Source: Household questionnaire.
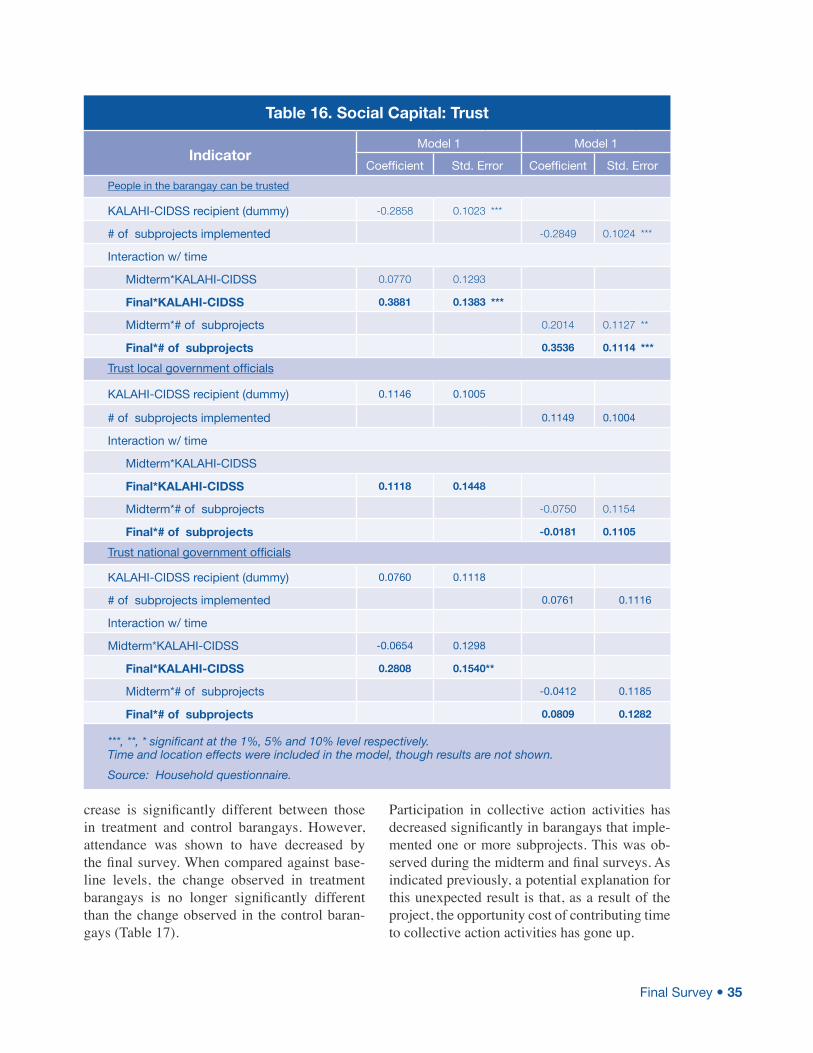
Final Survey 35
crease is significantly different between those in treatment and control barangays. However, attendance was shown to have decreased by the final survey. When compared against base-line levels, the change observed in treatment barangays is no longer significantly different than the change observed in the control baran-gays (Table 17).
Participation in collective action activities has decreased significantly in barangays that imple-mented one or more subprojects. This was ob-served during the midterm and final surveys. As indicated previously, a potential explanation for this unexpected result is that, as a result of the project, the opportunity cost of contributing time to collective action activities has gone up.
Table 16. Social Capital: Trust
IndicatorModel 1 Model 1
Coefficient Std. Error Coefficient Std. Error
People in the barangay can be trusted
KALAHI-CIDSS recipient (dummy) -0.2858 0.1023 ***
# of subprojects implemented -0.2849 0.1024 ***
Interaction w/ time
Midterm*KALAHI-CIDSS 0.0770 0.1293
Final*KALAHI-CIDSS 0.3881 0.1383 ***
Midterm*# of subprojects 0.2014 0.1127 **
Final*# of subprojects 0.3536 0.1114 ***
Trust local government officials
KALAHI-CIDSS recipient (dummy) 0.1146 0.1005
# of subprojects implemented 0.1149 0.1004
Interaction w/ time
Midterm*KALAHI-CIDSS
Final*KALAHI-CIDSS 0.1118 0.1448
Midterm*# of subprojects -0.0750 0.1154
Final*# of subprojects -0.0181 0.1105
Trust national government officials
KALAHI-CIDSS recipient (dummy) 0.0760 0.1118
# of subprojects implemented 0.0761 0.1116
Interaction w/ time
Midterm*KALAHI-CIDSS -0.0654 0.1298
Final*KALAHI-CIDSS 0.2808 0.1540**
Midterm*# of subprojects -0.0412 0.1185
Final*# of subprojects 0.0809 0.1282
***, **, * significant at the 1%, 5% and 10% level respectively. Time and location effects were included in the model, though results are not shown.
Source: Household questionnaire.
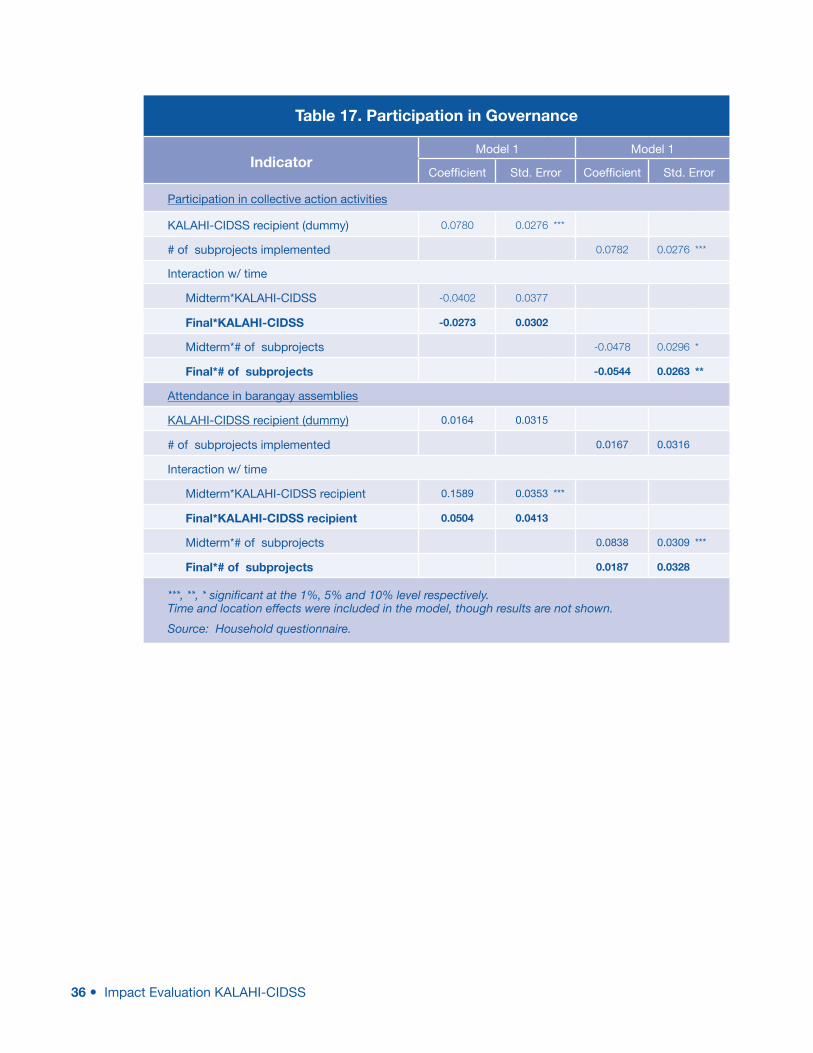
36 Impact Evaluation KALAHI-CIDSS
Table 17. Participation in Governance
IndicatorModel 1 Model 1
Coefficient Std. Error Coefficient Std. Error
Participation in collective action activities
KALAHI-CIDSS recipient (dummy) 0.0780 0.0276 ***
# of subprojects implemented 0.0782 0.0276 ***
Interaction w/ time
Midterm*KALAHI-CIDSS -0.0402 0.0377
Final*KALAHI-CIDSS -0.0273 0.0302
Midterm*# of subprojects -0.0478 0.0296 *
Final*# of subprojects -0.0544 0.0263 **
Attendance in barangay assemblies
KALAHI-CIDSS recipient (dummy) 0.0164 0.0315
# of subprojects implemented 0.0167 0.0316
Interaction w/ time
Midterm*KALAHI-CIDSS recipient 0.1589 0.0353 ***
Final*KALAHI-CIDSS recipient 0.0504 0.0413
Midterm*# of subprojects 0.0838 0.0309 ***
Final*# of subprojects 0.0187 0.0328
***, **, * significant at the 1%, 5% and 10% level respectively. Time and location effects were included in the model, though results are not shown.
Source: Household questionnaire.
Final Survey 37
5. Conclusions and Recommendations
The results of the KALAHI-CIDSS’ impact evaluation indicate that the project led to improvements in household welfare, ac-
cessibility, and social capital. It has, however, shown mixed results with regard to participation in governance.
The project led to a 5 percent increase in per capita expenditures. Those in barangays with more subprojects enjoy even higher increases. The same is true for the share of non-food items in the household budget. This has increased in both groups between the baseline and final surveys, with the increase among beneficiary households being significantly higher than the increase among non-beneficiary households. Households in beneficiary barangays with more subprojects are observed to have experienced even higher increases in the nonfood share of household budgets. However, while expendi-tures have increased, the increase alone attribut-ed to KALAHI-CIDSS is not sufficient to reduce poverty significantly.
In addition, the project led to an increase in the proportion of those engaged in agriculture activi-ties (farming, livestock, and fishing) that market their produce, implying that production levels have increased beyond subsistence. Moreover, households have probably become less vulner-able due to an observed increase in the diver-sification of income sources among beneficiary barangay households.
Household accessibility has also improved
significantly. As a result of the project, on average, there are more households in the treat-ment barangays with year-long accessibility and access to safe water than in the control ba-rangays. As can be expected, year-long acces-sibility has improved even more in beneficiary barangays that received subproject financing.
The survey yields mixed results in the level of institutional trust and participation in gover-nance. Organizational membership has increased significantly among households in treatment barangays compared to those in control ba-rangays. Participation in barangay assemblies was also strongly positive in treatment versus control barangays during the midterm review, but was shown to have declined by the time of the current, end-of-project, evaluation. Trust in national government officials has improved significantly. However, little change or differ-ence in the levels of trust was recorded for local government officials. This may be explained by the fact that KALAHI-CIDSS is known to be a national government project.
The project had a negative impact on the extent of participation in collective action activities. However, it also had a positive impact on the willingness of households to contribute money for activities that would benefit the community. This suggests that households might be choosing to substitute contributions of time with those of money.
The study yielded a number of useful insights,
38 Impact Evaluation KALAHI-CIDSS
as DSWD is currently expanding coverage with the ultimate goal of a nationwide program.
First, consistent with the diverse nature of in-vestments supported by the project, impacts tend to be very diffuse. Impacts are recorded along a broad range of indicators, but they tend to be relatively small. This is to be expected as, for example, a farm-to-market road will not yield similar impacts as a school building, but it needs to be carefully accounted for when designing such evaluations.
Second, impacts on per capita expenditures recorded during the final survey were higher
than those observed after the midterm survey. Further, impacts tended to increase with the number of subprojects received by the communities.
The above observations, combined with the rela-tively small size of per capita allocation (about PHP 300/cycle), suggest that long-term impacts on poverty reduction will require sustained efforts and both social and physical investment. DSWD could explore increasing either the number of subproject cycles and/or the munici-pal allocations. Alternatively, DSWD could in-troduce different poverty criteria for barangays to be eligible to participate in the MIBF.
Final Survey 39
References
Balisacan, A., R. Edillon, L.G. Bersales, and S.F. Piza (2003) Baseline Survey for the Impact Evalu-ation of the KALAHI-CIDSS: Sampling Design. Asia-Pacific Policy Center.
Balisacan, A. M., R. Edillon, and G. Ducanes (2002) Poverty Mapping and Targeting for KALAHI-CIDSS. Asia-Pacific Policy Center.
Balisacan, A.M., R.G. Edillon, A.B. Brillantes, D.B. Canlas (2000). Approaches to Targeting the Poor. Manila: United Nations Development Program and National Economic and Develop-ment Authority.
Barham J. and C. Chitemi (2009). Collective action initiatives to improve marketing performance: Lessons from farmer groups in Tanzania. Food Policy 34:1.pp 53-59.
Baulch, B. and Quisumbing, A. (2010). Testing and adjusting for attrition in household panel data. CPRC Toolkit Note. Manchester, UK: Chronic Poverty Research Centre (CPRC). Available at: http://www.chronicpoverty.org/publications/details/testing-and-adjusting-for-attrition-in-household-panel-data.
Chase, R. and C. Holmemo (2005) “Community Driven Development and Social Capital: Designing a Baseline Survey in the Philippines.” Social Development Department.
Edillon, R. (2010) Institutions and Social Capital Approach to Promote Agricultural Productivity. SEAMEO-SEARCA Policy Brief Series (PGPA Series No. 2). 2010-2.
Edillon, R. and S.F. Piza (2007), Tracking Progress Towards Community Empowerment and Welfare: KALAHI-CIDDS Midterm Evaluation Report, Quezon City. Final report submitted by the Asia-Pacific Policy Center.
Edillon, R., S.F. Piza, and A. Matula (2004) KALAHI-CIDSS:KKB Beneficiary Profile at Year 0. Final report of the Baseline Survey for the Impact Evaluation of the KALAHI-CIDSS. Asia-Pacific Policy Center.
Fukuyama, F. (1995), Trust: The Social Virtues and the Creation of Prosperity, New York: Free Press.
Institute for Philippines Culture. (2010), Qualitative Impact Evaluation of the KALAHI-CIDSS
Labonne, J., and R. Chase (2009) “Who’s at the Wheel when Communities Drive Development? Evidence from the Philippines” World Development Vol. 37(1)
40 Impact Evaluation KALAHI-CIDSS
Narayan, D. and Pritchett, L. (1997) Cents and Sociability ~ Household Income and Social Capital in Rural Tanzania. Policy Research Working Paper No. 1796 Washington DC: World Bank.
Putnam, R. (1993) Making Democracy Work: Civic Traditions in Modern Italy, Princeton.
Putnam, R. (2000). Bowling Alone: The collapse and revival of American community. Simon and Schuster.
Ravallion, M (1999) “The Mystery of the Vanishing Benefits: Ms. Speedy Analyst’s Introduction to Evaluation,” World Bank Policy Research Working Paper No. 2153. Available at SSRN: http://ssrn.com/abstract=620612
Voss, J. (2008). “Impact Evaluation of the Second Phase of the Kecamatan Development Program in Indonesia.” The World Bank, Jakarta Research Paper
Woolcock, M. (2001) The place of social capital in understanding social and economic outcomes. ISUMA Canadian Journal of Policy Research 2 (1) 11-17.
World Bank. (1998) The Initiative on Defining, Monitoring and Measuring Social Capital: Overview and Program Description. Working Paper, no.1. Washington, DC: The World Bank.

Annexes

42 Impact Evaluation KALAHI-CIDSS
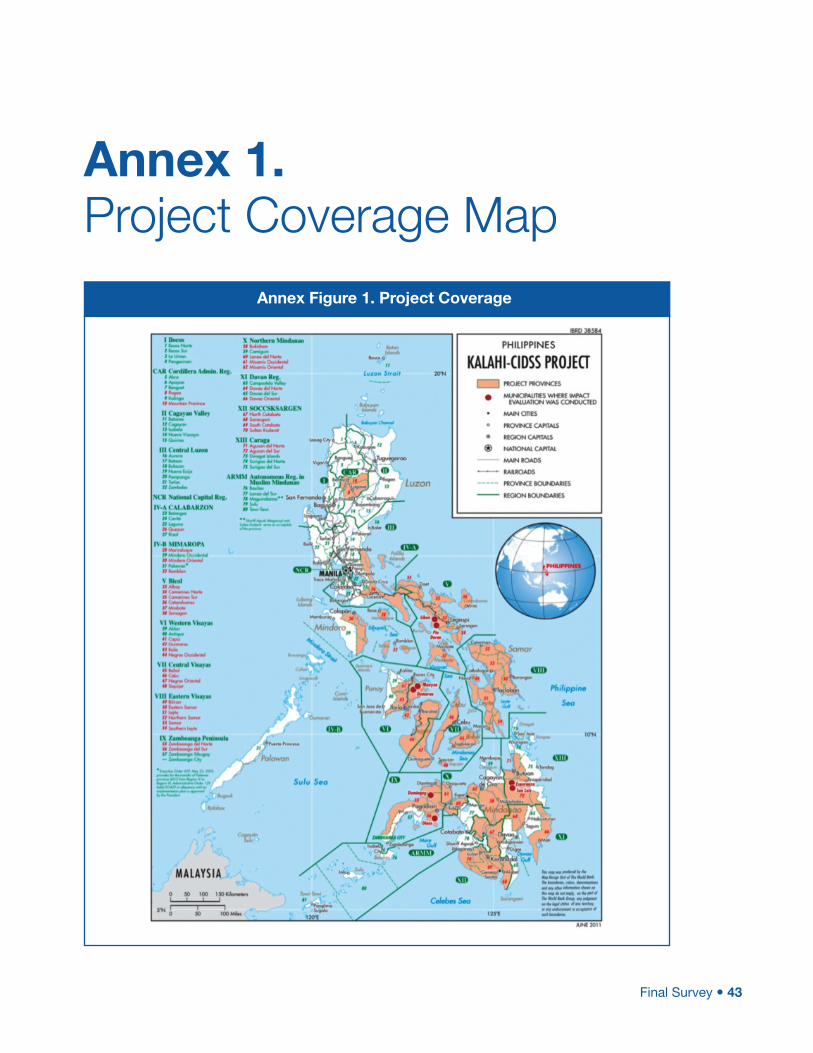
Final Survey 43
Annex 1. Project Coverage Map
Annex Figure 1. Project Coverage
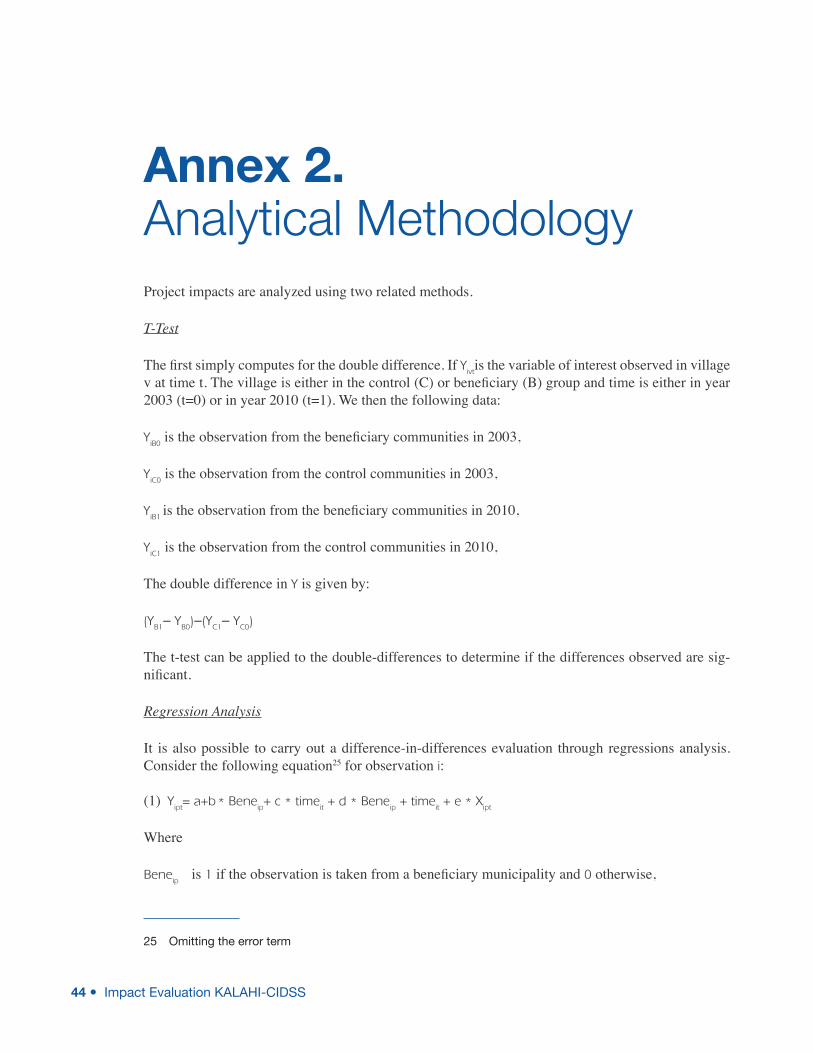
44 Impact Evaluation KALAHI-CIDSS
Annex 2. Analytical MethodologyProject impacts are analyzed using two related methods.
T-Test
The first simply computes for the double difference. If Yivt
is the variable of interest observed in village v at time t. The village is either in the control (C) or beneficiary (B) group and time is either in year 2003 (t=0) or in year 2010 (t=1). We then the following data:
YiB0
is the observation from the beneficiary communities in 2003,
YiC0
is the observation from the control communities in 2003,
YiB1
is the observation from the beneficiary communities in 2010,
YiC1
is the observation from the control communities in 2010,
The double difference in Y is given by:
(YB1
− YB0
)−(YC1
− YC0
)
The t-test can be applied to the double-differences to determine if the differences observed are sig-nificant.
Regression Analysis
It is also possible to carry out a difference-in-differences evaluation through regressions analysis. Consider the following equation25 for observation i:
Y(1) ipt
= a+b * Bene
ip+ c * time
it + d * Bene
ip + time
it + e * X
ipt
Where
Beneip is 1 if the observation is taken from a beneficiary municipality and 0 otherwise,
25 Omitting the error term
Final Survey 45
timeit is 1 if the observation is taken at time 1and 2 otherwise.
Equation (1) implies that the variable Y is affected by the project intervention ( ), passage of time, and by another variable X.
If the observation is taken from a beneficiary municipality at time 0, then we have
Y(2) iB0
= a+b+e * X
iBo ,
and if the observation is taken from a beneficiary municipality at time 1, then we have
Y(3) iB1
= a+b+c+d+e * X
iB1 ,
Concerning an observation from a nonbeneficiary municipality at time 0 we have
Y(4) iC0
= a+e * X
iC0 ,
and an observation from a nonbeneficiary municipality at time 1 is given by
Y(5) iC1
= a+c+e * X
iC1 ,
The double difference is given by:
(YiB1
— YiB0
) — (YiC1
— YiC0
) = d+e[(XB1
— XiB0
) — (XiC1
— XiC0
)]
The project impact is given by d but the double difference we observe involves the impact of the changes in X. Of course, if either e is zero or there are no changes in X, then the observed double difference could be attributed to the project. The more general case is that one or both do not hold. Regression analysis enables us to distinguish the project impact (d) from the impact of the other variables X(e).
This method is applied to a selected set of variables. The list was finalized after consultation with DSWD and the World Bank.
The analyses were carried out using the survey package of R 26 to take account of the complex survey design of the impact evaluation27.
26 The R system for statistical computing software is supported by an international collaboration of computer scientists and statisticians. R provides a wide variety of statistical (linear and nonlinear modeling, classical sta-tistical tests, time-series analysis, classification, clustering) and graphical techniques, and is highly extensible. The S language is often the vehicle of choice for research in statistical methodology, and R provides an “open source” route to participation in that activity. The survey analysis package of R is written by Thomas Lumley of the University of Washington.
27 See APPC (2003) for a full discussion of the sampling design of the impact evaluation.
46 Impact Evaluation KALAHI-CIDSS
Testing the Parallel Trend Hypothesis
The key identifying assumption in the impact evaluation is that, without the program, the two groups of municipalities (treatment and comparison) would have evolved similarly. While it is impossible to test this hypothesis directly, it is possible to test if prior to the project the two groups evolved simi-larly, the so-called parallel trend hypothesis. Rejection of the parallel trend hypothesis would cast doubts on the validity of our estimation strategy.
We use data from the Family Income and Expenditure Survey (FIES). The FIES is a large-scale na-tionally representative survey carried out every three years by the National Statistics Office (NSO). We have access to the 2000 and 2003 data. Out of the 16 municipalities included in the KALAHI-CIDSS impact evaluation sample, 13 were included in both the 2000 and in the 2003 FIES samples. This leaves a repeated cross-section of households in 13 of our sample municipalities. As a result, we are able to test whether the changes between 2000 and 2003 in the treatment and control group were similar.
For each outcome indicator (per capita food consumption, per capita nonfood consumption, log per capita food consumption, and log per capita nonfood consumption), we run four different regressions: with and without municipal dummies, and with and without household controls. We can’t reject the parallel trend hypothesis (Annex Table 1). This provides convincing evidence that control and treat-ment municipalities would have evolved similarly over the period covered by our data had the project not been implemented.
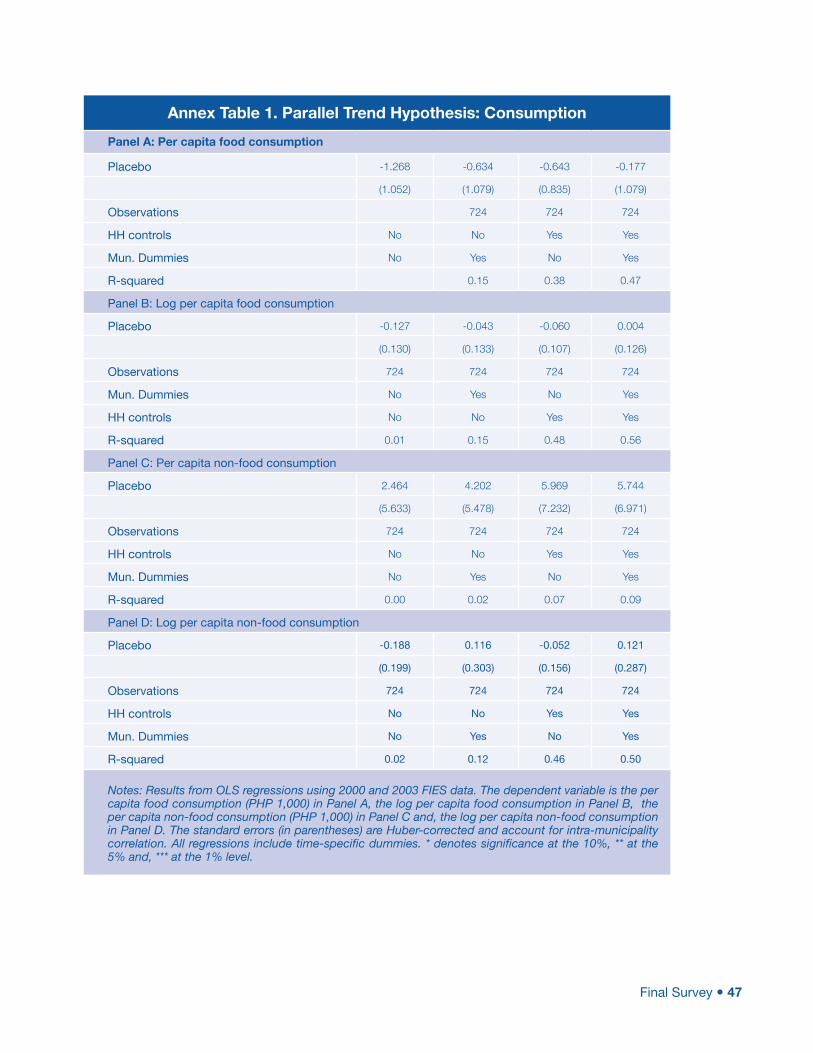
Final Survey 47
Annex Table 1. Parallel Trend Hypothesis: Consumption
Panel A: Per capita food consumption
Placebo -1.268 -0.634 -0.643 -0.177
(1.052) (1.079) (0.835) (1.079)
Observations 724 724 724
HH controls No No Yes Yes
Mun. Dummies No Yes No Yes
R-squared 0.15 0.38 0.47
Panel B: Log per capita food consumption
Placebo -0.127 -0.043 -0.060 0.004
(0.130) (0.133) (0.107) (0.126)
Observations 724 724 724 724
Mun. Dummies No Yes No Yes
HH controls No No Yes Yes
R-squared 0.01 0.15 0.48 0.56
Panel C: Per capita non-food consumption
Placebo 2.464 4.202 5.969 5.744
(5.633) (5.478) (7.232) (6.971)
Observations 724 724 724 724
HH controls No No Yes Yes
Mun. Dummies No Yes No Yes
R-squared 0.00 0.02 0.07 0.09
Panel D: Log per capita non-food consumption
Placebo -0.188 0.116 -0.052 0.121
(0.199) (0.303) (0.156) (0.287)
Observations 724 724 724 724
HH controls No No Yes Yes
Mun. Dummies No Yes No Yes
R-squared 0.02 0.12 0.46 0.50
Notes: Results from OLS regressions using 2000 and 2003 FIES data. The dependent variable is the per capita food consumption (PHP 1,000) in Panel A, the log per capita food consumption in Panel B, the per capita non-food consumption (PHP 1,000) in Panel C and, the log per capita non-food consumption in Panel D. The standard errors (in parentheses) are Huber-corrected and account for intra-municipality correlation. All regressions include time-specific dummies. * denotes significance at the 10%, ** at the 5% and, *** at the 1% level.
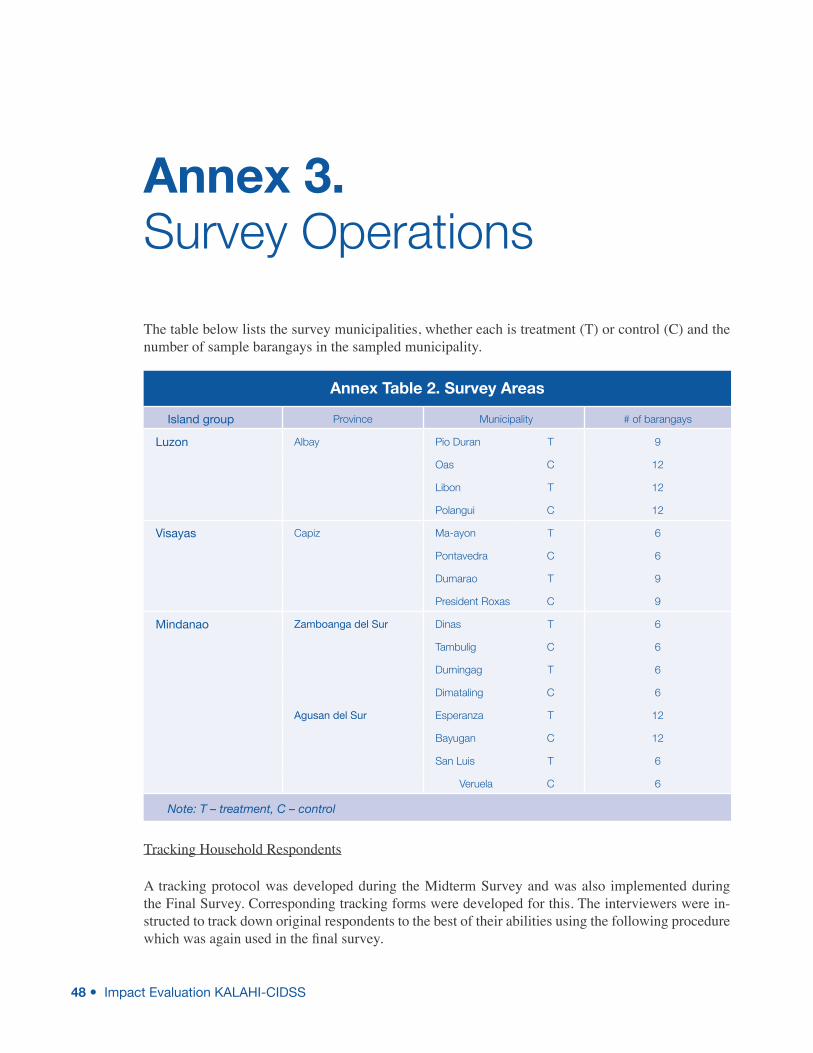
48 Impact Evaluation KALAHI-CIDSS
Annex 3. Survey Operations
The table below lists the survey municipalities, whether each is treatment (T) or control (C) and the number of sample barangays in the sampled municipality.
Tracking Household Respondents
A tracking protocol was developed during the Midterm Survey and was also implemented during the Final Survey. Corresponding tracking forms were developed for this. The interviewers were in-structed to track down original respondents to the best of their abilities using the following procedure which was again used in the final survey.
Annex Table 2. Survey Areas
Island group Province Municipality # of barangays
Luzon Albay Pio Duran T 9
Oas C 12
Libon T 12
Polangui C 12
Visayas Capiz Ma-ayon T 6
Pontavedra C 6
Dumarao T 9
President Roxas C 9
Mindanao Zamboanga del Sur Dinas T 6
Tambulig C 6
Dumingag T 6
Dimataling C 6
Agusan del Sur Esperanza T 12
Bayugan C 12
San Luis T 6
Veruela C 6
Note: T – treatment, C – control
Final Survey 49
Case 1: Original sample household and original household member respondent are tracked.
Interview the original household member respondent and collect data on her/his household. • The interviewer asks the respondent first about the members of the original household s/he is still living with and then about the new members of her/his household, if any.
Case 2: Original sample household tracked but original household member respondent no longer lives in the household (either moved out or died).
Fill up the individual tracking form for the original household member respondent. •
Interview another member of the original sample household who knows about the house-• hold’s economic activities.
In addition, if the original household member respondent moved to a barangay that is in-• cluded in our sample, s/he should be tracked down and interviewed again. He/she will be asked the perception questions.
Case 3: Original sample household member respondent tracked but with a different household com-position.
Interview the original household member respondent and collect data on her/his “new” house-• hold. The interviewer asks the respondent first about the members of the original household s/he is still living with and then about the new members of her/his household, if any.
Case 4: Original sample household and original household member respondent moved within the municipality and in one of our sample barangays.
Fill up the household tracking form. Ask the neighbors where the household moved.•
Locate the original sample household for interview.•
Case 5: Original sample household and original household member respondent moved to another place.
Fill up the household tracking form. Ask the neighbors where the household moved.•
A field edit protocol was also included in the Operations Manual. Monitoring visits were conducted by APPC to ensure the quality of the survey.
Attrition
It was emphasized to the interviewers that the respondent households are those interviewed during the midterm. But even though maximum effort was exerted, attrition in a panel survey is inevitable. The following table shows the attrition rate in each province.
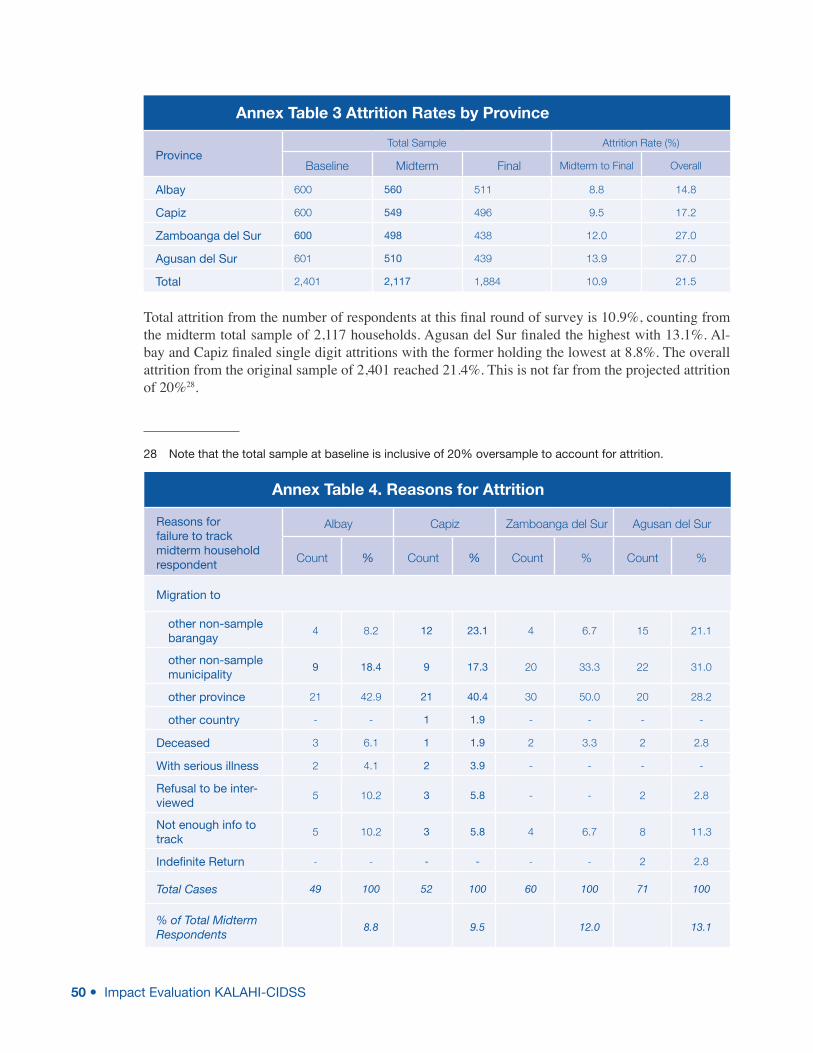
50 Impact Evaluation KALAHI-CIDSS
Total attrition from the number of respondents at this final round of survey is 10.9%, counting from the midterm total sample of 2,117 households. Agusan del Sur finaled the highest with 13.1%. Al-bay and Capiz finaled single digit attritions with the former holding the lowest at 8.8%. The overall attrition from the original sample of 2,401 reached 21.4%. This is not far from the projected attrition of 20%28.
28 Note that the total sample at baseline is inclusive of 20% oversample to account for attrition.
Annex Table 3 Attrition Rates by Province
ProvinceTotal Sample Attrition Rate (%)
Baseline Midterm Final Midterm to Final Overall
Albay 600 560 511 8.8 14.8
Capiz 600 549 496 9.5 17.2
Zamboanga del Sur 600 498 438 12.0 27.0
Agusan del Sur 601 510 439 13.9 27.0
Total 2,401 2,117 1,884 10.9 21.5
Annex Table 4. Reasons for Attrition
Reasons for failure to track midterm household respondent
Albay Capiz Zamboanga del Sur Agusan del Sur
Count % Count % Count % Count %
Migration to
other non-sample barangay
4 8.2 12 23.1 4 6.7 15 21.1
other non-sample municipality
9 18.4 9 17.3 20 33.3 22 31.0
other province 21 42.9 21 40.4 30 50.0 20 28.2
other country - - 1 1.9 - - - -
Deceased 3 6.1 1 1.9 2 3.3 2 2.8
With serious illness 2 4.1 2 3.9 - - - -
Refusal to be inter-viewed
5 10.2 3 5.8 - - 2 2.8
Not enough info to track
5 10.2 3 5.8 4 6.7 8 11.3
Indefinite Return - - - - - - 2 2.8
Total Cases 49 100 52 100 60 100 71 100
% of Total Midterm Respondents
8.8 9.5 12.0 13.1
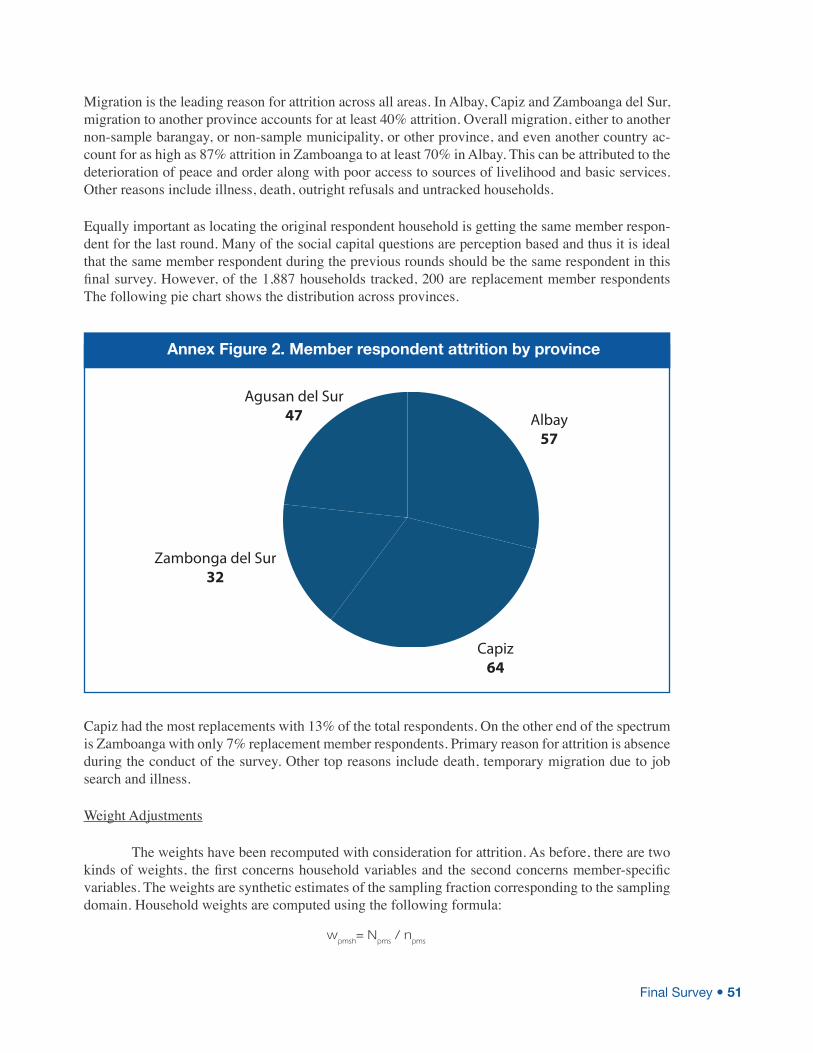
Final Survey 51
Migration is the leading reason for attrition across all areas. In Albay, Capiz and Zamboanga del Sur, migration to another province accounts for at least 40% attrition. Overall migration, either to another non-sample barangay, or non-sample municipality, or other province, and even another country ac-count for as high as 87% attrition in Zamboanga to at least 70% in Albay. This can be attributed to the deterioration of peace and order along with poor access to sources of livelihood and basic services. Other reasons include illness, death, outright refusals and untracked households.
Equally important as locating the original respondent household is getting the same member respon-dent for the last round. Many of the social capital questions are perception based and thus it is ideal that the same member respondent during the previous rounds should be the same respondent in this final survey. However, of the 1,887 households tracked, 200 are replacement member respondents The following pie chart shows the distribution across provinces.
Capiz had the most replacements with 13% of the total respondents. On the other end of the spectrum is Zamboanga with only 7% replacement member respondents. Primary reason for attrition is absence during the conduct of the survey. Other top reasons include death, temporary migration due to job search and illness.
Weight Adjustments
The weights have been recomputed with consideration for attrition. As before, there are two kinds of weights, the first concerns household variables and the second concerns member-specific variables. The weights are synthetic estimates of the sampling fraction corresponding to the sampling domain. Household weights are computed using the following formula:
wpmsh
= Npms
/ npms
Agusan del Sur47
Zambonga del Sur32
Albay57
Capiz64
Annex Figure 2. Member respondent attrition by province
52 Impact Evaluation KALAHI-CIDSS
where wpmsh
is the weight given to each sample household h in province p, municipality m, and ba-rangay stratum S; N
pmsh is the total number of households; and n
pms is the number in the sample of
households in province p, municipality m and barangay stratum s. Barangay stratum is determined after all barangays in municipality m are sorted in order of proximity to the poblacion (municipal center) and grouped into three equal groups.
Member weights are computed using the following formula:
wpmsai
= Npmsa
/ npmsa
where wpmsai
is the weight given to each sample member i belonging to age-group in province p, municipality m and barangay stratum s; N
pmsa is the total number of individuals of age group a, and
npmsa
is the number in the sample of individuals of age group a in province p, municipality m, and barangay stratum s.The age groups are the following:0 to 6 years, 7 to 12 years, 13 to 16 years, 17 to 22 years, 23 years and above.
The N is computed using the 2000 population and forecasted to 2003 using the growth rate observed in the barangay stratum s in municipality m between 1995 and 2000.Meanwhile, the N corresponding to age group a is computed by simply assuming natural “growth” of the age cohort; that is, children below 1 will become 3 years old three years hence, and so on.This is adjusted for the “attrition rate” by age group observed between 1995 and 2000.
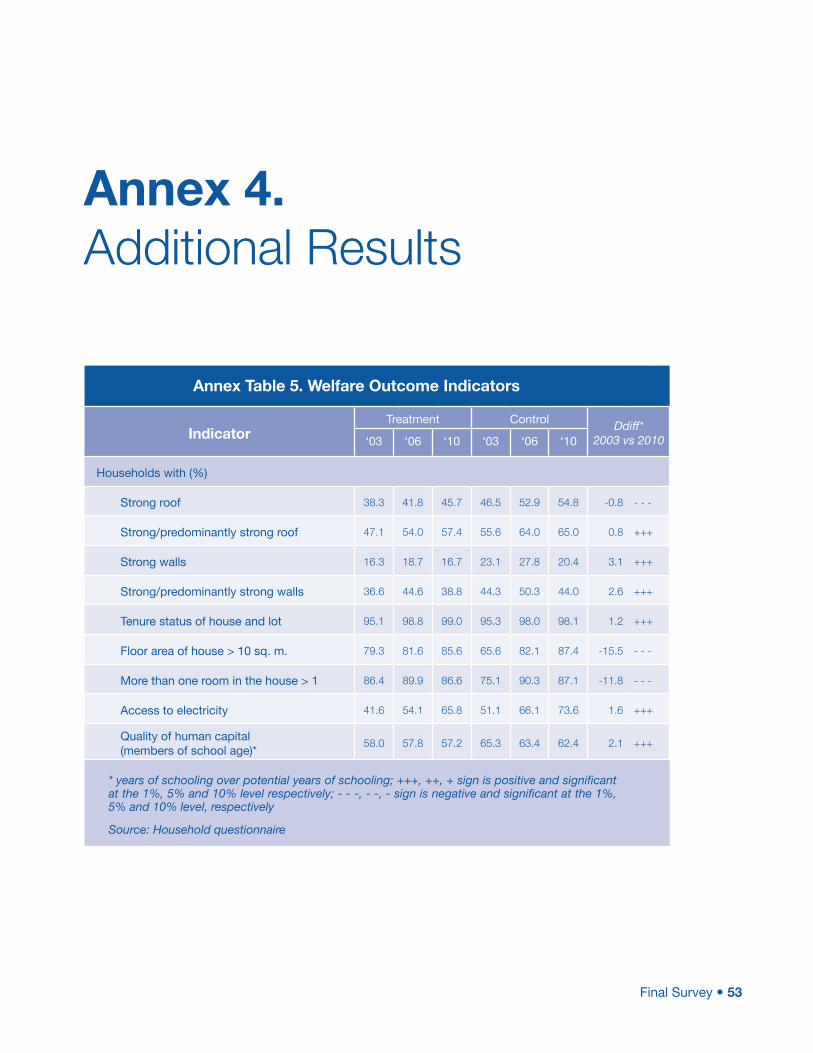
Final Survey 53
Annex 4. Additional Results
Annex Table 5. Welfare Outcome Indicators
IndicatorTreatment Control Ddiff*
2003 vs 2010‘03 ‘06 ‘10 ‘03 ‘06 ‘10
Households with (%)
Strong roof 38.3 41.8 45.7 46.5 52.9 54.8 -0.8 - - -
Strong/predominantly strong roof 47.1 54.0 57.4 55.6 64.0 65.0 0.8 +++
Strong walls 16.3 18.7 16.7 23.1 27.8 20.4 3.1 +++
Strong/predominantly strong walls 36.6 44.6 38.8 44.3 50.3 44.0 2.6 +++
Tenure status of house and lot 95.1 98.8 99.0 95.3 98.0 98.1 1.2 +++
Floor area of house > 10 sq. m. 79.3 81.6 85.6 65.6 82.1 87.4 -15.5 - - -
More than one room in the house > 1 86.4 89.9 86.6 75.1 90.3 87.1 -11.8 - - -
Access to electricity 41.6 54.1 65.8 51.1 66.1 73.6 1.6 +++
Quality of human capital (members of school age)*
58.0 57.8 57.2 65.3 63.4 62.4 2.1 +++
* years of schooling over potential years of schooling; +++, ++, + sign is positive and significant at the 1%, 5% and 10% level respectively; - - -, - -, - sign is negative and significant at the 1%, 5% and 10% level, respectively
Source: Household questionnaire
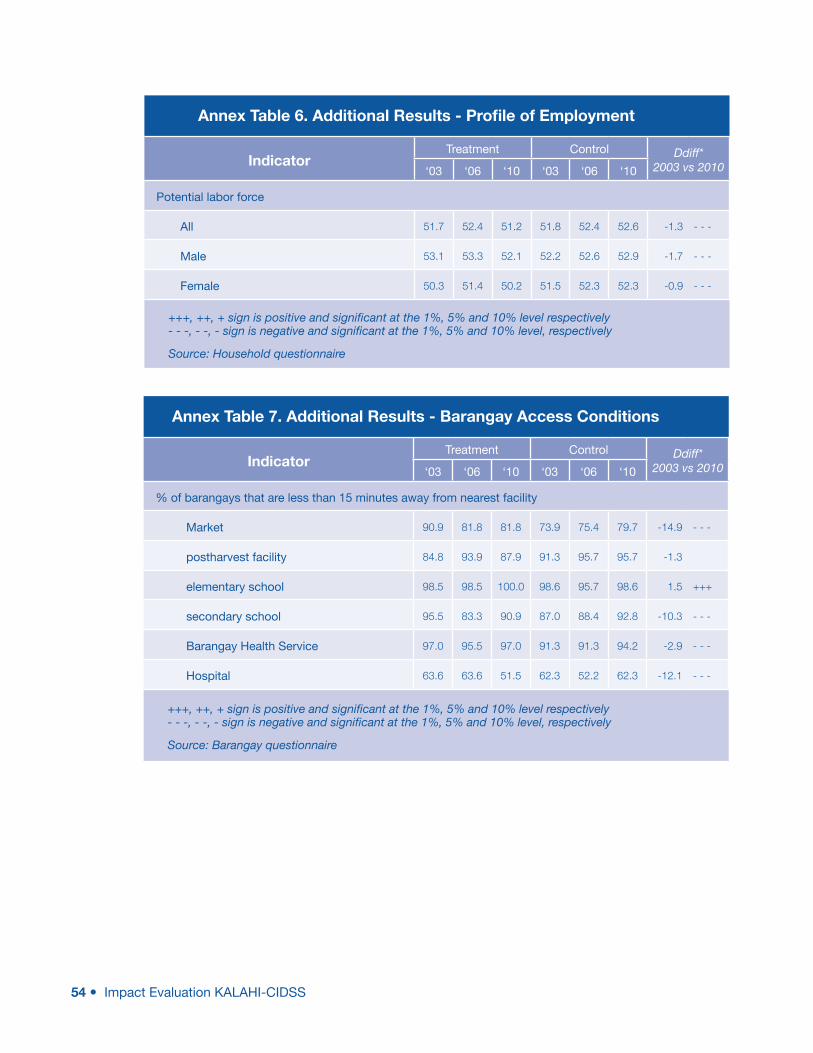
54 Impact Evaluation KALAHI-CIDSS
Annex Table 6. Additional Results - Profile of Employment
IndicatorTreatment Control Ddiff*
2003 vs 2010‘03 ‘06 ‘10 ‘03 ‘06 ‘10
Potential labor force
All 51.7 52.4 51.2 51.8 52.4 52.6 -1.3 - - -
Male 53.1 53.3 52.1 52.2 52.6 52.9 -1.7 - - -
Female 50.3 51.4 50.2 51.5 52.3 52.3 -0.9 - - -
+++, ++, + sign is positive and significant at the 1%, 5% and 10% level respectively- - -, - -, - sign is negative and significant at the 1%, 5% and 10% level, respectively
Source: Household questionnaire
Annex Table 7. Additional Results - Barangay Access Conditions
IndicatorTreatment Control Ddiff*
2003 vs 2010‘03 ‘06 ‘10 ‘03 ‘06 ‘10
% of barangays that are less than 15 minutes away from nearest facility
Market 90.9 81.8 81.8 73.9 75.4 79.7 -14.9 - - -
postharvest facility 84.8 93.9 87.9 91.3 95.7 95.7 -1.3
elementary school 98.5 98.5 100.0 98.6 95.7 98.6 1.5 +++
secondary school 95.5 83.3 90.9 87.0 88.4 92.8 -10.3 - - -
Barangay Health Service 97.0 95.5 97.0 91.3 91.3 94.2 -2.9 - - -
Hospital 63.6 63.6 51.5 62.3 52.2 62.3 -12.1 - - -
+++, ++, + sign is positive and significant at the 1%, 5% and 10% level respectively- - -, - -, - sign is negative and significant at the 1%, 5% and 10% level, respectively
Source: Barangay questionnaire
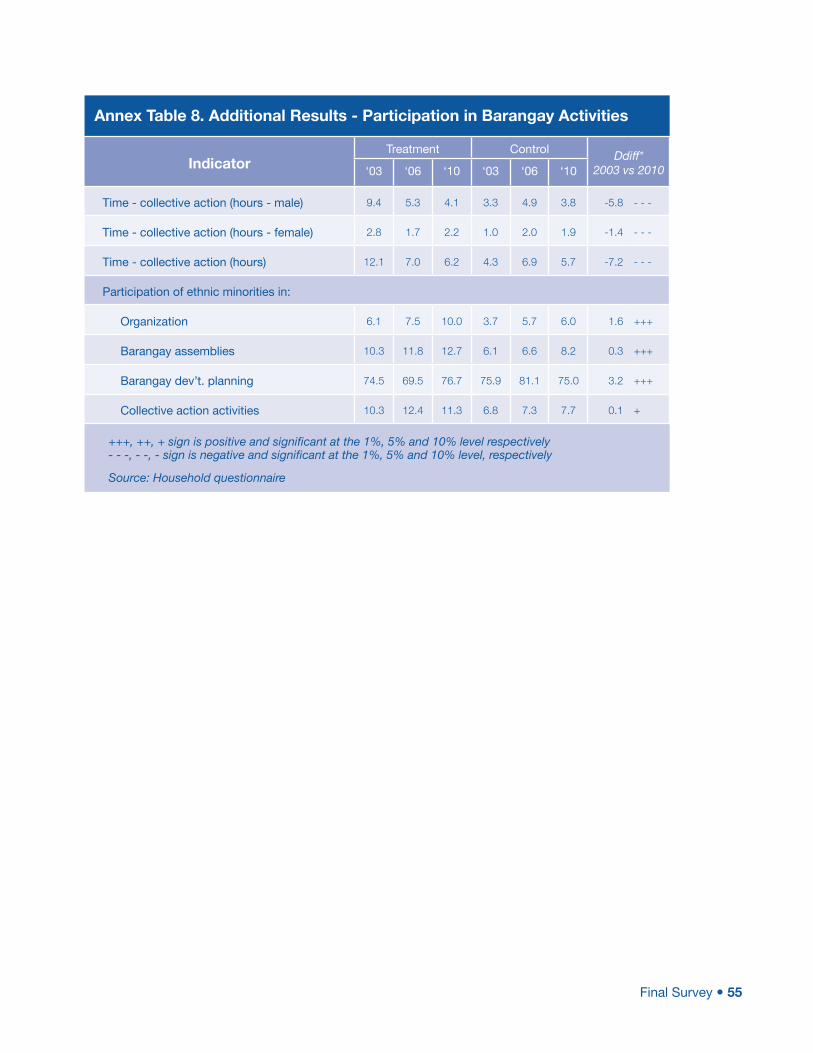
Final Survey 55
Annex Table 8. Additional Results - Participation in Barangay Activities
IndicatorTreatment Control Ddiff*
2003 vs 2010‘03 ‘06 ‘10 ‘03 ‘06 ‘10
Time - collective action (hours - male) 9.4 5.3 4.1 3.3 4.9 3.8 -5.8 - - -
Time - collective action (hours - female) 2.8 1.7 2.2 1.0 2.0 1.9 -1.4 - - -
Time - collective action (hours) 12.1 7.0 6.2 4.3 6.9 5.7 -7.2 - - -
Participation of ethnic minorities in:
Organization 6.1 7.5 10.0 3.7 5.7 6.0 1.6 +++
Barangay assemblies 10.3 11.8 12.7 6.1 6.6 8.2 0.3 +++
Barangay dev’t. planning 74.5 69.5 76.7 75.9 81.1 75.0 3.2 +++
Collective action activities 10.3 12.4 11.3 6.8 7.3 7.7 0.1 +
+++, ++, + sign is positive and significant at the 1%, 5% and 10% level respectively- - -, - -, - sign is negative and significant at the 1%, 5% and 10% level, respectively
Source: Household questionnaire
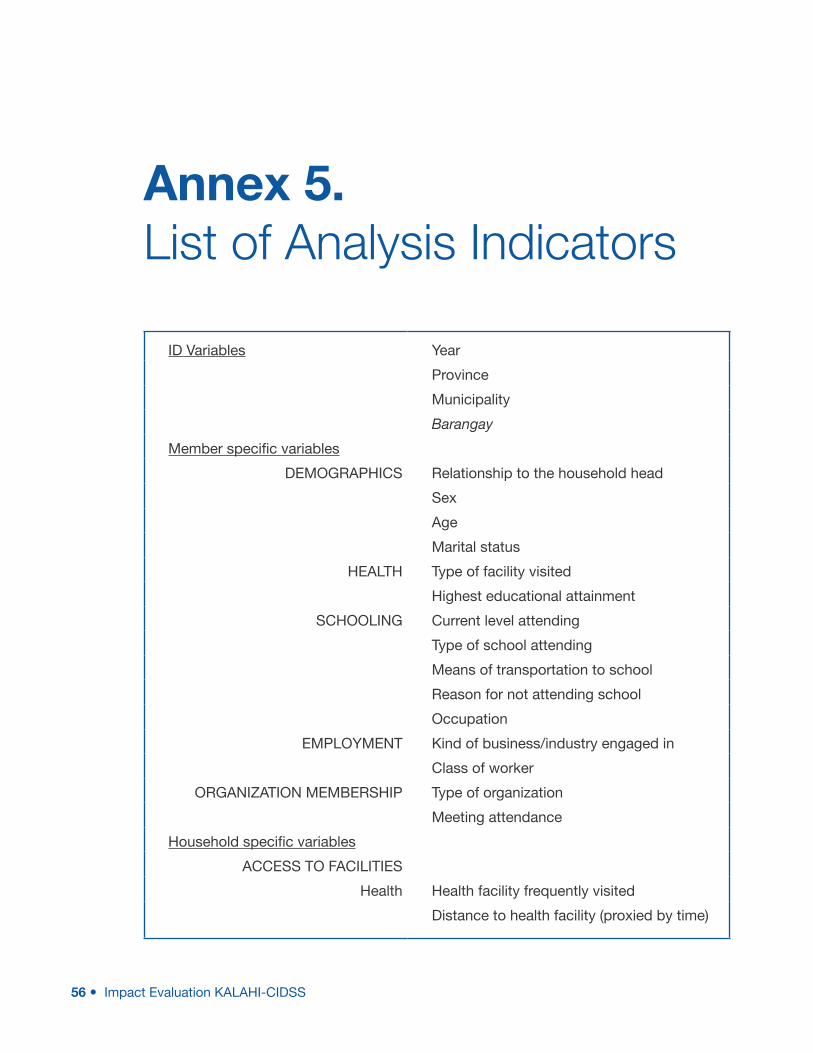
56 Impact Evaluation KALAHI-CIDSS
Annex 5. List of Analysis Indicators
ID Variables Year
Province
Municipality
Barangay
Member specific variables
DEMOGRAPHICS Relationship to the household head
Sex
Age
Marital status
HEALTH Type of facility visited
Highest educational attainment
SCHOOLING Current level attending
Type of school attending
Means of transportation to school
Reason for not attending school
Occupation
EMPLOYMENT Kind of business/industry engaged in
Class of worker
ORGANIZATION MEMBERSHIP Type of organization
Meeting attendance
Household specific variables
ACCESS TO FACILITIES
Health Health facility frequently visited
Distance to health facility (proxied by time)
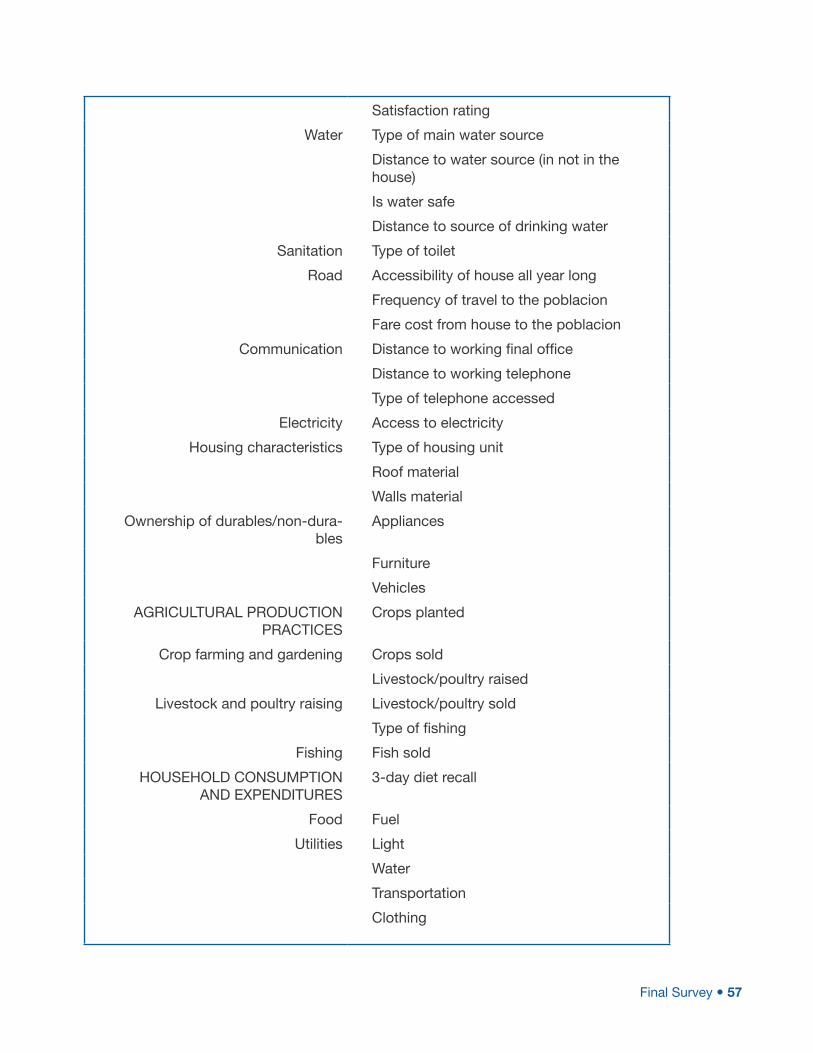
Final Survey 57
Satisfaction rating
Water Type of main water source
Distance to water source (in not in the house)
Is water safe
Distance to source of drinking water
Sanitation Type of toilet
Road Accessibility of house all year long
Frequency of travel to the poblacion
Fare cost from house to the poblacion
Communication Distance to working final office
Distance to working telephone
Type of telephone accessed
Electricity Access to electricity
Housing characteristics Type of housing unit
Roof material
Walls material
Ownership of durables/non-dura-bles
Appliances
Furniture
Vehicles
AGRICULTURAL PRODUCTION PRACTICES
Crops planted
Crop farming and gardening Crops sold
Livestock/poultry raised
Livestock and poultry raising Livestock/poultry sold
Type of fishing
Fishing Fish sold
HOUSEHOLD CONSUMPTION AND EXPENDITURES
3-day diet recall
Food Fuel
Utilities Light
Water
Transportation
Clothing
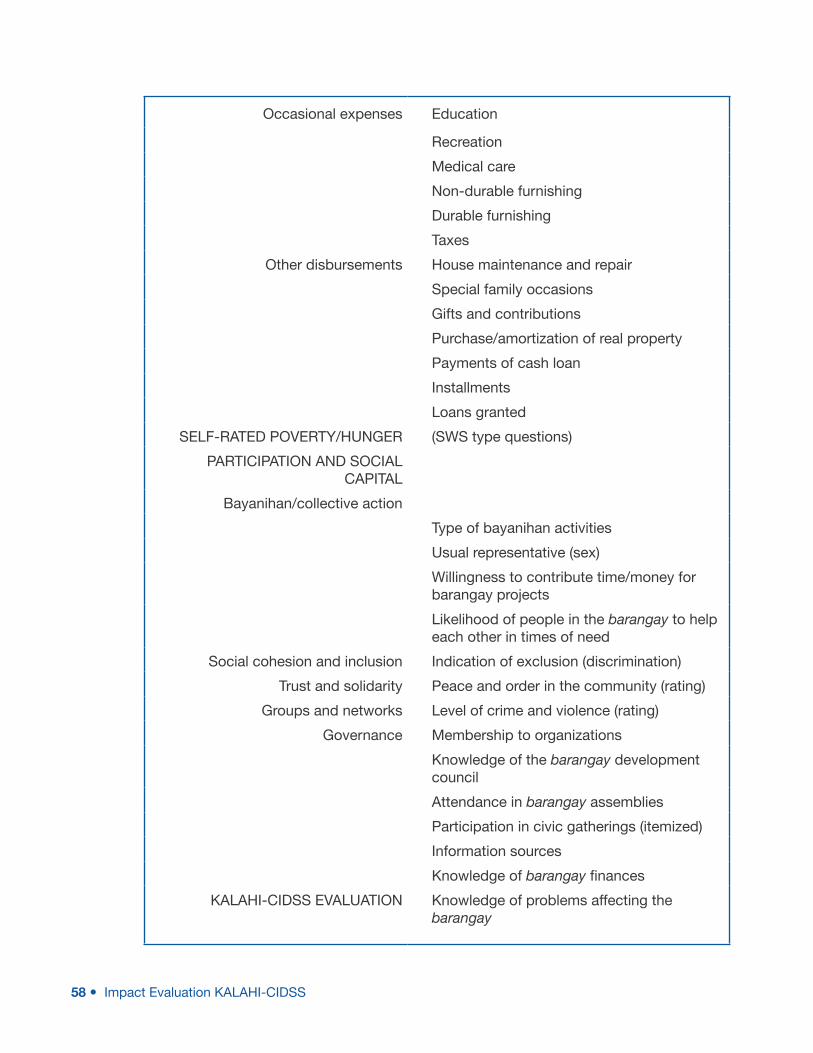
58 Impact Evaluation KALAHI-CIDSS
Occasional expenses Education
Recreation
Medical care
Non-durable furnishing
Durable furnishing
Taxes
Other disbursements House maintenance and repair
Special family occasions
Gifts and contributions
Purchase/amortization of real property
Payments of cash loan
Installments
Loans granted
SELF-RATED POVERTY/HUNGER (SWS type questions)
PARTICIPATION AND SOCIAL CAPITAL
Bayanihan/collective action
Type of bayanihan activities
Usual representative (sex)
Willingness to contribute time/money for barangay projects
Likelihood of people in the barangay to help each other in times of need
Social cohesion and inclusion Indication of exclusion (discrimination)
Trust and solidarity Peace and order in the community (rating)
Groups and networks Level of crime and violence (rating)
Governance Membership to organizations
Knowledge of the barangay development council
Attendance in barangay assemblies
Participation in civic gatherings (itemized)
Information sources
Knowledge of barangay finances
KALAHI-CIDSS EVALUATION Knowledge of problems affecting the barangay
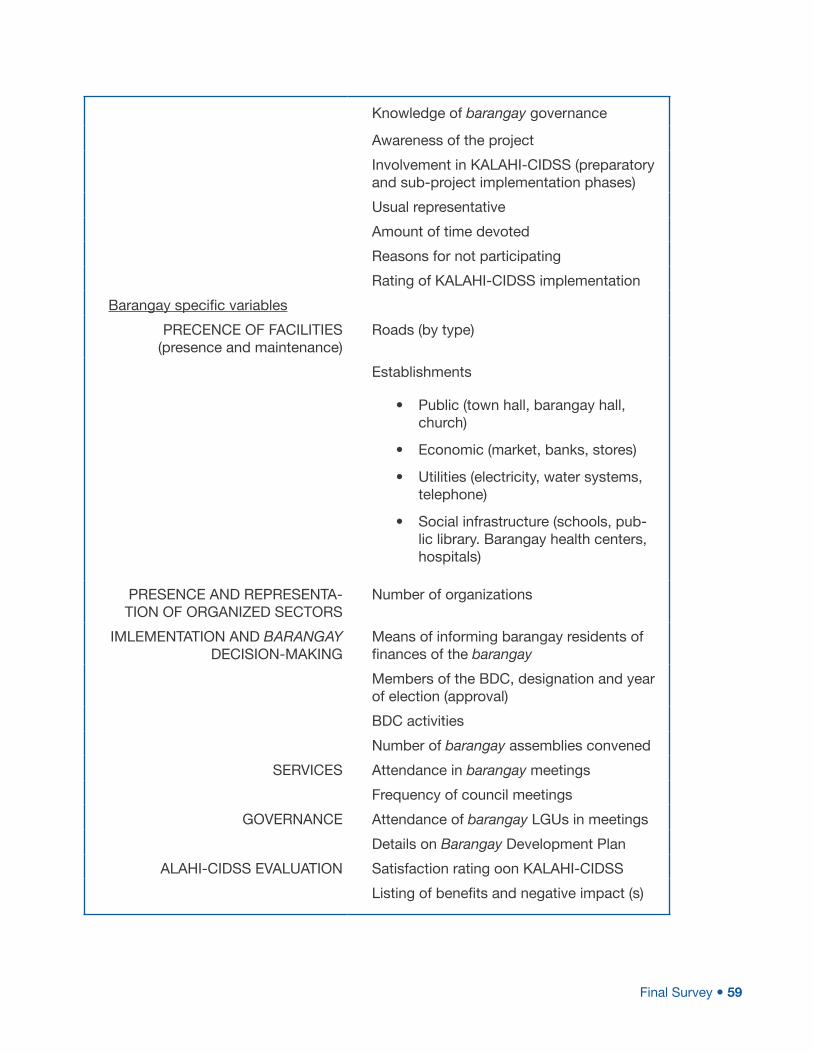
Final Survey 59
Knowledge of barangay governance
Awareness of the project
Involvement in KALAHI-CIDSS (preparatory and sub-project implementation phases)
Usual representative
Amount of time devoted
Reasons for not participating
Rating of KALAHI-CIDSS implementation
Barangay specific variables
PRECENCE OF FACILITIES (presence and maintenance)
Roads (by type)
Establishments
• Public (town hall, barangay hall, church)
• Economic (market, banks, stores)
• Utilities (electricity, water systems, telephone)
• Social infrastructure (schools, pub-lic library. Barangay health centers, hospitals)
PRESENCE AND REPRESENTA-TION OF ORGANIZED SECTORS
Number of organizations
IMLEMENTATION AND BARANGAY DECISION-MAKING
Means of informing barangay residents of finances of the barangay
Members of the BDC, designation and year of election (approval)
BDC activities
Number of barangay assemblies convened
SERVICES Attendance in barangay meetings
Frequency of council meetings
GOVERNANCE Attendance of barangay LGUs in meetings
Details on Barangay Development Plan
ALAHI-CIDSS EVALUATION Satisfaction rating oon KALAHI-CIDSS
Listing of benefits and negative impact (s)


The World Bank Group1818 H. Street, N.W.
Washington DC 20433, USA Tel: (202) 473 1000 Fax: (202) 477 6391www.worldbank.org
World Bank Office Manila23rd Floor, The Taipan Place
F. Ortigas Jr. Road, Ortigas CenterPasig City, Philippines
Tel: (632) 637 5855 to 64Fax: (632) 6375870
www.worldbank.org.ph
Asia-Pacific Policy CenterGF, Philippine Social Science Center
Commonwealth AvenueDiliman, Quezon City 1100, Philippines
TeleFax: (63-2) 926-4615www.appc-ph.com