Embed Size (px)
Citation preview

December 2005
CCQM-K43
As, Hg, Pb, Se and Methylmercury in Salmon
FINAL REPORT
Y. Aregbe and P.D.P. Taylor
With contributions from: J. Vogl and A. Berger from BAM U. Sansone, M. J. Campell, A. Toervenyi from IAEA M. Gallorini and E. Rizzio from IMGC T. de Oliveira Araujo from INMETRO C. Quétel, J. Snell and P. Robouch from IRMM P. Vermaercke from SCK-CEN E. Hwang from KRISS R. Hearn, J. Entwisle, D. Curtis and R. Wahlen from LGC Ltd. G. Labarraque from LNE R. Greenberg, E. Mackey, G. Turk, M. Schantz, S.J. Christopher, W.C. Davis, and S.E. Long from NIST L. Mackay, R. Myors from NMIA K. Inagaki from NMIJ R. Sturgeon, L. Yang from NRC

The Mission of IRMM is to promote a common European measurement system in support of EU policies, especially health and consumer protection, environment, agriculture, internal market and industrial standards. European Commission Directorate-General Joint Research Centre Institute for Reference Materials and Measurements Contact information Yetunde Aregbe European Commission Directorate-General Joint Research Centre Institute for Reference Materials and Measurements Retieseweg 111 B-2440 Geel • Belgium Email: [email protected] Tel.: +32 (0)14 571 673 Fax: +32 (0)14 571 865 http://www.irmm.jrc.be http://www.jrc.cec.eu.int Legal Notice Neither the European Commission nor any person acting on behalf of the Commission is responsible for the use, which might be made of the following information. A great deal of additional information on the European Union is available on the Internet. It can be accessed through the Europa server http://europa.eu.int Luxembourg: Office for Official Publications of the European Communities © European Communities, 2005 Reproduction is authorised provided the source is acknowledged Printed in Belgium


Contents ABSTRACT 1
INTRODUCTION 2
RATIONALE OF THIS COMPARISON 2
PARTICIPATION IN CCQM-K43 3
THE SALMON SAMPLE 4
HOMOGENEITY CHARACTERISATION 4
PARTICIPANT COORDINATION 4
CCQM-K43 INFORMATION DOCUMENTS 5 PROTOCOL FOR DRY-MASS CORRECTION 5 UNCERTAINTY EVALUATION 5 ANALYTICAL METHODS AND TECHNIQUES 7
CCQM-K43 PARTICIPANT’S RESULT 9
THE CCQM-K43 KEY COMPARISON REFERENCE VALUE 10
THE CCQM-K43 GRAPHS 11
DISCUSSION 11
CONCLUSION 12
ACKNOWLEDGEMENTS 12
LIST OF ABBREVIATIONS 13
REFERENCES 14
Annex 1 15 Annex 2 29 Annex 3 41 Annex 4 49

CCQM-K43 Final Report
1
Abstract CCQM-K43 was organised as a follow-up key comparison to the previous pilot study on tuna fish. CCQM-K43 was an activity of the Inorganic Analysis Working Group (IAWG) of CCQM and was coordinated by the Joint Research Centre-Institute for Reference Materials and Measurements (IRMM, Geel, Belgium) of the European Commission (EC). In CCQM-K43 the amount contents of As, Hg, Pb, Se and Methylmercury (CH3Hg) in salmon (muscle and skin) were the measurands under investigation. Results were reported by 12 NMIs. During the CCQM-IAWG autumn meeting in Berlin, October 2005, it was agreed that in CCQM-K43 the KCRV is calculated as the mixture model median (MM-median) of all reported results. The reported results of the NMIs fall within a range of ± 5% for arsenic and of ± 2% for lead and mercury relative to the KCRV. For selenium the spread of all laboratories but one is ± 8%. Also, for methlymercury 4 of the 5 participating NMIs reported results within 4% deviation from the KCRV. The methods applied were isotope dilution mass spectrometry (IDMS) using sector field or quadrupole inductively coupled plasma-mass spectrometry (ICP-MS) or thermal ionisation mass spectrometry (TIMS), external calibration using ICP-MS or atomic absorption spectrometry (AAS). Instrumental neutron activation analysis (INAA) and k0-neutron
activation analysis (k0-NAA) were also used as analytical techniques. This report presents the participants’ results in CCQM-K43 for all analytes under investigation. In Annex 1, the results with the KCRV, the equivalence statements and the results sorted according to analytical technique applied are presented. In Annex 2, the different approaches for methlymercury measurements are presented in more detail. In Annex 3, the questionnaire data are presented. Annex 4 compiles all the CCQM-K43 information documents. The pilot study CCQM-P39.1 was carried out in parallel to this key comparison for the same measurands in the same salmon material Participation was meant for IAWG members, who did not immediately want to report results in a key comparison, and invited expert laboratories.

CCQM-K43 As, Hg, Pb, Se and Methylmercury in Salmon
2
Introduction The previous pilot study CCQM-P39 on tuna fish [1] was proceeded in autumn 2004 to this key comparison, CCQM-K43, and the pilot study, CCQM-P39.1. In alignment with the previous CCQM-P39 on tuna fish the choice of analytes under investigation in CCQM-K43 were exactly the same. The purpose of CCQM-K43&P39.1 was to demonstrate the measurement capability of determining the amount content of metals in a more challenging ‘real-life’ fish sample, with significantly lower mercury content as the preceding tuna fish sample, but with similar arsenic, lead and selenium content, in order to demonstrate ‘how far the light shines’. NMIs participating in CCQM-K43 could demonstrate their measurement capabilities over an order of magnitude concentration range, particularly on total mercury and or-ganomercury. Furthermore the matrix ‘salmon muscle and skin’ was from an analytical sample pretreatment point of view more challenging than the freeze-dried tuna muscle powder used in CCQM P39. CCQM-K43 was further broadening the scope and degree of difficulty of measurements in a key comparison addressed by the CCQM-IAWG. Rationale for this comparison In order to protect public health it is essential to keep contaminants at levels which are toxicologically acceptable. Thus surveillance measures are taken regarding the presence of contaminants in foodstuff, including fish. Mercury is a potential environmental toxin. The main source of human intake of mercury contaminants originates from methylmercury in fish and fish products. Methylmercury is particularly interesting due to its high toxicity compared to inorganic mercury and its high proportion among organomercury species in the environment. Mercury species may induce alterations in the normal development of the brain of infants and may induce neurological changes in adults.
Lead may induce reduced cognitive development in children and increased blood pressure and cardio-vascular diseases in adults. To protect public health, maximum levels of mercury and lead in fish products are laid down in relevant regulations. The EC Directive 2001/22 describes the community methods for the sampling, the sample preparation and the analysis of mercury and lead in fish [2]. The EC Regulation (466/2001) endorses officially the threshold value of 0.5 mg·kg-1 mercury and
0.2 mg·kg-1 lead in salmon [3]. Selenium is an essential trace element for human beings. Seafood is an important source of selenium intake for people in some regions. Certain forms of cancer and cardiovascular diseases have also been associated with selenium deficiency. Selenium is also counted among the most important elements in terms of food-chain contamination. Selenium has the narrowest plateau between concentrations that show deficiency and toxic effects, respectively. Recently, the EC requested the Scientific Committee on Food (SCF) to re-view the upper level of daily intake of individual vitamins and minerals, amongst them selenium, and to pro-vide the basis for the establishment of safety factors [4]. Rules for measurements of arsenic are set in the commission decision on implementing Council Directive 96/23/EC concerning the performance of analytical methods and the interpretation of results [5].

CCQM-K43 Final Report
3
Participation in CCQM-K43
CC CC QQ MM -- KK 44 33 PP AA RR TT II CC II PP AA NN TT CC OO UU NN TT RR YY
IAWG members
BAM Bundesanstalt für Materialforschung und –prüfung
Germany
IAEA International Atomic Energy Agency
United Nations
IMGC Institute of Metrology G. Colonnetti - University of Pavia
Italy
INMETRO Instituto Nacional de Metrologia, Normalização e Qualidade Industrial
Brazil
IRMM Institute for Reference Materials and Measurements
European Commission
KRISS Korea Research Institute of Standards and Science
Republic of Korea
LGC Ltd. Laboratory of the Government Chemist
United Kingdom
LNE Laboratoire National d’ Essais
France
NIST National Institute of Standards and Technology
United States of America
NMIA National Measurement Institute - NARL Primary Methods
Australia
NMIJ National Metrology Institute of Japan
Japan
NRC National Research Council Canada
Canada

CCQM-K43 As, Hg, Pb, Se and Methylmercury in Salmon
4
The salmon sample The CCQM-K43 fish sample is a freeze dried and ground salmon muscle and skin powder bottled in amber glass vials each one containing about 2.2g. Each participant received 4 salmon samples (8-10g) to account for the small unit size. Participants were asked to analyse at least 2 sample aliquots from 2 bottles for each measured analyte. This salmon originates from Norway and is a real-life sample. The range of lead amount content in the salmon was just slightly exceeding the upper limit as stated in the EC Regulation (466/2001), whereas the mercury content was far below the upper legislation limit [3]. Therefore, this salmon material was perfectly appropriate for the purpose of a CCQM key comparison complementary to the previous pilot study on tuna fish, which exceeded the upper limit for mercury [1]. Homogeneity characterisation Within and between bottle homogeneity tests for Pb were carried out on 10 sub-samples of 10 bottles using solid sample Zeemann AAS (SS-ZAAS) and for Hg and MeHg on 3 sub-samples from 6 bottles applying IDMS. For As and Se, the homogeneity was assessed by analysing 2 sub-samples from 10 bottles applying k0-NAA. Results from these measurements were evaluated accordingly and compared to the procedures established in ISO Guide 35:1989 for the certification of reference materials based on analysis of variance ANOVA [6, 7]. The between bottle homogeneity of all 5 analytes was ranging from 0.5% - 2.5%, which was found to be adequate for this key comparison. These results were also confirmed by the observed spread of the participants’ results, where each reported result of the total amount content represents at least measurements of 2 sub-samples from 2 bottles.
Participant Coordination According to the rules for participation in key comparisons only IAWG members who meet the requirements given in paragraph 6 of the MRA could participate in CCQM-K43 [8]. The call for participation was circulated to the NMIs in October 2004. The information package containing the salmon samples was sent to all registered participants in December 2004. The participants were asked to register for participation and to report their results and questionnaire answers online via the IRMM IT system for Interlaboratory Comparisons, called MILC. The first deadline for result reporting was 31st March 2005, which was finally extended to 4th April 2005. The results were presented at the Spring IAWG meeting in April at BIPM. In summer 2005, a summary report was circulated amongst all participants for confirmation of the reported results and applied analytical methods. Final results and proposal for the KCRV were presented at the last CCQM-IAWG meeting in Berlin in October 2005.

CCQM-K43 Final Report
5
CCQM-K43 information documents
o Letter to the participants pointing out the deadlines
o Scope of the CCQM-K43 key comparison
o General instructions o Instructions for online result and
questionnaire reporting in MILC o Instructions for uncertainty evaluation o Instructions for the dry-mass
correction and digestion of the salmon o Information for CCQM-K43
participants measuring methylmercury, including the ERM AE670 certificate and the publication on the preparation and certification of ERM AE670
Protocol for dry-mass correction The determination of the moisture content of the samples is to some extent “operationally defined” [9, 10]. In view of the comparability of the results, the protocol in CCQM-K43 for correction of the moisture was as follows: “For correction of the measured values to dry-mass, water content measurements should be made on a separate portion of the same material with a mass of 0.6 ± 0.1g. The material should be dried before weighing for a minimum of 24 hours in a ventilated oven at 102 ± 2°C. Cycles of drying and weighing should be repeated until a constant mass is attained. Each weighing has to be carried out after the sample has reached thermal equilibrium at room temperature in a dessicator, time about 30 min. Successive weights should not differ more than 0.001 g. The loss of mass corresponds to the “dry-mass correction factor” that should be applied”. The water content was also determined by Karl-Fischer titration. No significant difference was observed. The reported results in CCQM-K43 for the measured water content in the salmon samples are listed in Table 1.
Uncertainty evaluation The participants were asked to report a complete uncertainty budget with their results. The uncertainty statement should be evaluated and presented according to the principles outlined in, e.g. “ISO/GUM” [11] or the EURACHEM/CITAC Guide [12]. The organising laboratory asked all the participants in CCQM-K43 the following:
o state your measurement equation o identify all significant sources of
uncertainty o state your input quantities o quantify uncertainty components and
convert them to standard uncertainties o calculate the combined standard
uncertainty uc o present an expanded uncertainty U
with the coverage factor k=2 o include factors related to sample
treatment in your measurement equations
o describe the applied evaluation process and type of assumed distribution for your uncertainty estimation
The complete uncertainty statement should be forwarded to the organising laboratory as attachment to the result reporting sheets. All participants in CCQM-K43 provided an uncertainty budget with their measurement results.
CCQM-K43 As, Hg, Pb, Se and Methylmercury in Salmon
6
Table 1 Reported values for water content determination and dry-mass correction
CCCCQQMM--KK4433 CC oo rr rr ee cc tt ii oo nn ff oo rr dd rr yy -- mm aa ss ss
PP AA RR TT II CC II PP AA NN TT WW AA TT EE RR CC OO NN TT EE NN TT II NN %% CC OO RR RR EE CC TT II OO NN FF AA CC TT OO RR
BAM 2.1 ± 0.1 0.979 ± 0.001
IAEA 2.2 ± 0.2 0.978 ± 0.002
IMGC 2.07 ± 0.07 0.979 ± 0.035
INMETRO 2.6 ± 0.1 0.9736 ± 0.1
IRMM 2.87 ± 1 0.9713 ± 0.010
KRISS 2.14 ± 0.08 0.9786 ± 0.0008
LGC Ltd. 1.84 ± 0.13 0.9816 ± 0.013
LNE Se: 1.19 ± 0.03; Hg: 2.56 ± 0.18; As: 2.64 ± 0.06
Se: 0.9881 ± 0.0003; Hg: 0.9744 ± 0.0018; As: 0.9736 ± 0.0006
NIST 2.0 ± 0.1 0.98 ± 0.1
NMIA 3.1 1.032 ± 0.008
NMIJ 2.30 ± 0.20 0.9770 ± 0.0020
NRC 2.24 ± 0.225 0.97755 ± 0.00225

CCQM-K43 Final Report
7
Analytical methods and techniques Different methods and instrumental techniques besides IDMS were applied in CCQM-K43. The methods applied were:
o isotope dilution mass spectrometry (IDMS) using sector field or quadrupole inductively coupled plasma-mass spectrometry (ICP-MS)
o external calibration using ICP-MS o atomic absorption spectrometry (AAS)
o Instrumental neutron activation analysis (INAA) and k0-neutron activation analysis (k0-NAA)
The analytical methods and instrumental techniques are listed in Table 2 and Table 3. In Annex 1 of this report, all the results are graphically presented sorted by analytical technique
Table 2 Analytical methods and instrumental techniques in CCQM-K43 for methylmercury
CCCCQQMM--KK4433 aa nn aa ll yy tt ee :: MM ee HH gg
PP AA RR TT II CC II PP AA NN TT AA NN AA LL YY TT II CC AA LL MM EE TT HH OO DD II NN SS TT RR UU MM EE NN TT AA LL TT EE CC HH NN II QQ UU EE
IRMM direct IDMS using ERM-AE670 as spike GC-ICP-MS
LGC Ltd. double IDMS using ERM-AE670 as spike LC-ICP-MS
NIST combined method using ERM AE670 and SRM 3133 as spike
GC-MS + SID-GC-ICPMS
NMIJ double IDMS using ERM-AE670 as spike GC-ICP-MS
NRC IDMS + reverse IDMS, using NRCC EOM-1 as spike GC-SF-ICP- MS

CCQM-K43 As, Hg, Pb, Se and Methylmercury in Salmon
8
Table 3 Analytical methods and instrumental techniques in CCQM-K43 for As, Hg, Pb, Se
CCCCQQMM--KK4433 aa nn aa ll yy tt ee :: AA ss ,, HH gg ,, PP bb ,, SS ee
PP AA RR TT II CC II PP AA NN TT AA NN AA LL YY TT II CC AA LL MM EE TT HH OO DD II NN SS TT RR UU MM EE NN TT AA LL TT EE CC HH NN II QQ UU EE
BAM As, Se: NAA Pb: IDMS
As, Se: INAA Pb: TIMS
IAEA external calibration As, Pb: ICP-MS+GF-AAS Se: ICP-MS
IMGC NAA INAA
INMETRO NAA INAA
IRMM As, Se: NAA Hg: IDMS
As, Se: K0-NAA Hg: ICP-QMS
KRISS Double IDMS Pb: ICP-QMS Hg: ICP- magnetic sector field MS
LGC Ltd. matching double IDMS Hg: ICP- magnetic sector field MS l Se: ICP-MS with collision cell
LNE As: standard addition Hg : IDMS Se: double IDMS
As, Se: ICP-QMS with CCT Hg: ICP- magnetic sector field MS
NIST As, Se: NAA Hg: IDMS
As, Se: INAA Hg: CV-ICP-MS
NMIA As: As: standard addition Pb, Hg, Se: matching double IDMS ICP-MS with collision cell
NMIJ As: internal standardisation Hg, Pb, Se: double IDMS ICP-MS with an octopole reaction cell
NRC IDMS ICP-magnetic sector field MS
CCQM-K43 Final Report
9
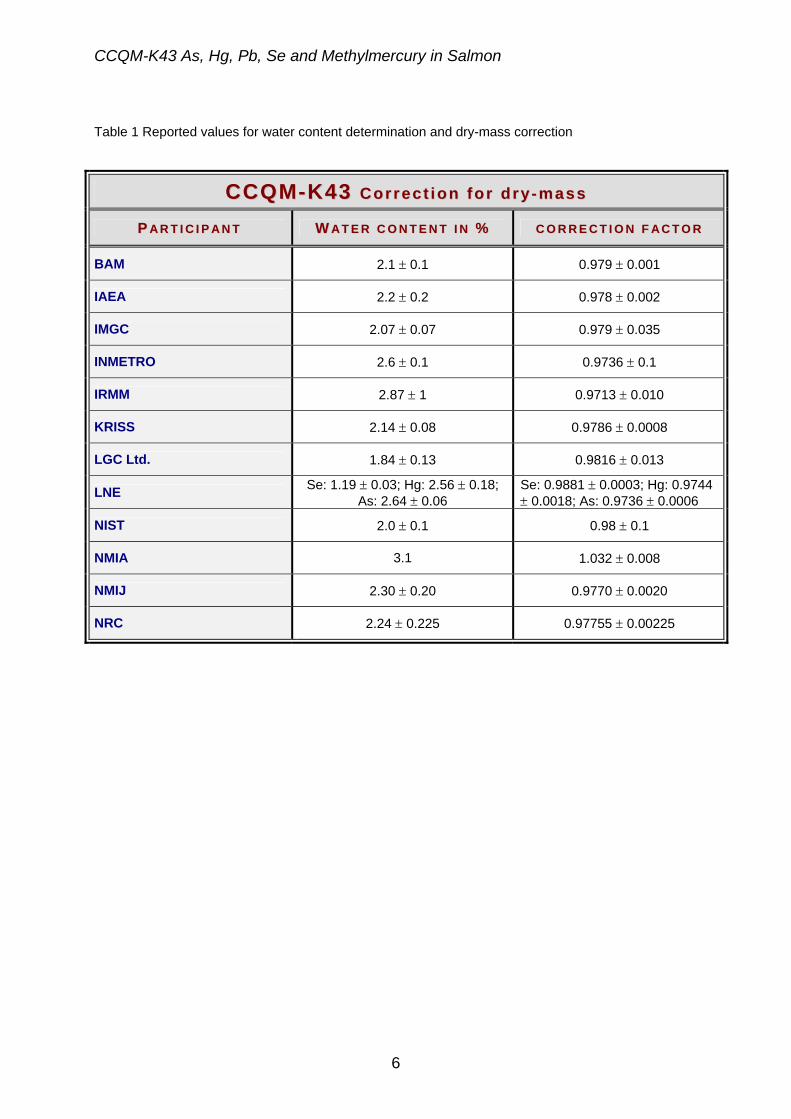
CCQM-K43 participant’s result The CCQM-K43 participants’ results, as reported to the organising institute, are listed in Table 4.
Table 4 CCQM-K43 participants reported results
REPORTED RESULTS AND EXPANDED UNCERTAINTY (k=2) in 10-6 mol·kg-1
Participant As Hg MeHg Pb Se
BAM 58.75 ± 2.64 - - 3.800 ± 0.081 7.43 ± 0.44
IAEA 59.47 ± 0.78 - - 3.79 ± 0.12 9.20 ± 0.85
IMGC 55.86 ± 1.02 - - - 7.18 ± 0.26
INMETRO 58.00± 2.20 - - 7.47 ± 0.46
IRMM 57.80± 2.70 0.3856 ± 0.0083 0.371 ± 0.017 - 7.13 ± 0.38
KRISS - 0.3859 ± 0.0026 - 3.82 ± 0.13 -
LGC - 0.398 ± 0.016 0.372± 0.025 - 7.04 ± 0.43
LNE 56.17 ± 2.54 0.394 ± 0.019 - - 7.97 ± 0.32
NIST 57.59 ± 0.75 0.3859 ± 0.0086 0.324 ± 0.011 - 7.58 ± 0.18
NMIA 59.4 ± 3.4 0.389 ± 0.016 - 3.92 ± 0.17 7.17 ± 0.28
NMIJ 60.86± 3.10 0.3921 ± 0.0069 0.3880 ± 0.0091 3.83 ± 0.24 7.15 ± 0.11
NRC - 0.387 ± 0.015 0.375 ± 0.019 - -

CCQM-K43 As, Hg, Pb, Se and Methylmercury in Salmon
10
The CCQM-K43 KCRV At the CCQM meeting in Paris in April 2004, David L. Duewer from NIST presented a robust approach for the determination of CCQM Key Comparison Values and Uncertainties to the IAWG members [13]. He introduced the mixture model probability density function (MM-PDF) for each measurement population as a means of data analysis for key comparisons and pilot studies. MM-PDF based summary statistics enable estimation of the expected performance of the majority of participants of a key comparison or pilot study [14]. The “true value” of a measurand in a given material can be estimated in a robust way even when some of the results are not in accordance with the majority. During the last autumn IAWG meeting in Berlin, the mixture model median (MM-median) and the MM-
median based Standard Deviation S(MM-Median) was chosen as robust estimation of the KCRV in CCQM-K43. In the table below the KCRV_MM-median, the mean and the median are listed for all the analytes in CCQM-K43 as µ ± σ*ts/ √n which is the 95% confidence interval on µ for n reported results. From Table 5 it can be seen that there is no significant difference of the KCRV com-pared to the mean and the median. The MM-median is closely related to the median. It is robust to outliners, but also accounts for the reported uncertainty of each participant. It can be seen that the MM-median gives a reliable robust estimate of the KCRV even for deviation of one of the results from the majority of reported results.
Table 5 CCQM-K43 summary statistics to establish the KCRV
µ ± σ*ts / √n in 10-6 mol·kg-1
As Hg MeHg Pb Se
KCRV_MM-median 58.1 ± 1.5 0.3884 ± 0.0056 0.373 ± 0.023 3.82 ± 0.10 7.32 ± 0.28
mean 58.2 ± 1.2 0.3897 ± 0.0038 0.366 ± 0.031 3.832 ± 0.064 7.53 ± 0.46
median 58.0 ± 1.6 0.3880 ± 0.0028 0.372 ± 0.0055 3.821 ± 0.039 7.31 ± 0.18

CCQM-K43 Final Report
11
The CCQM-K43 graphs The CCQM-K43 results for As, Hg, Pb and Se are presented graphically in Annex 1 of this report. In the first 4 graphs, all CCQM K43 results are plotted in ascending order, including the KCRV. In the following 8 graphs the equivalence tables and equivalence charts are presented. The degree of equivalence of each laboratory with respect to the KCRV is given by: Di = (xi – xR), xi being the reported measurement results of laboratory i and xR being the KCRV and Ui, its expanded uncertainty (k = 2), Ui
2 = (ki2ui
2 + kR2uR
2), both expressed in µmol•kg-1. The last 4 graphs in Annex 1 plot the results according to applied
analytical technique with the KCRV and the mixture model probability density function. On these MM-PDF graphs also the spread of the population of results is included. To enable the comparison of the spread of data, the scale of all graphs is ± 50 % deviation with respect to the KCRV. In Annex 2 the results and questionnaire data for MeHg are presented and discussed in more detail. Table 6 summarises all the CCQM-K43 graphs of Annex 1 and Annex 2.
Table 6 CCQM-K43 graphs
General Graphs - Annex 1 As, Hg, Pb and Se
All participants with KCRV
Equivalence charts
Analytical techniques
Methylmercury Graphs - Annex 2 MeHg (CH3Hg)
All participants with KCRV
Analytical techniques
Equivalence chart
All participants - Results with amended NIST value
Discussion All NMIs that participated in CCQM-K43 had previously participated in the pilot study on tuna fish, except INMETRO. As can be seen from Table 4 and the graphs in Annex 1 and Annex 2, the agreement of measurement results between NMIs is very good. The reported results of the NMIs fall within a range of ± 5% for arsenic and of ± 2% for lead and mercury relative to the KCRV. For selenium the spread of all laboratories but IAEA is ± 8%.
From previous IAEA experience with Zn measurements by ICP-MS, it was assumed that the Se value is higher due to divergent behaviour between the analyte and the internal standard as a consequence of inadequate matching of nitric acid strength between standards and samples. In spite of clear evidence that this was indeed the reason for the bias of the IAEA result, the IAEA Se result was not discarded when calculating the KCRV.

CCQM-K43 As, Hg, Pb, Se and Methylmercury in Salmon
12
Also, for methlymercury 4 of the 5 participating NMIs reported results within 4% deviation from the KCRV. NIST reported for MeHg a combined result using GC-MS and SID-GC-ICP-MS. This reported NIST result deviates more than 10% from the other participants’ results. NIST could not identify any problems with the reported GC-MS result, but only with the reported SID-GC-ICP-MS result, as explained in Annex 2. Therefore the NIST result was also taken into account when calculating the KCRV for MeHg. Conclusion The ‘light shines very far’ for the determination of metals in fish tissue when drawing the conclusion from CCQM-K43 and CCQM-P39. Due to the fact that this salmon material was a more challenging ‘fatty’ matrix compared to the dry tuna powder used in CCQM-P39 and due to the fact that the mercury amount content was 2 orders of magnitude lower than the one in the tuna fish sample, the salmon was an excellent choice for the proceeding of CCQM-P39 to this key comparison. The analytes under investigation in CCQM-K43 have been measured with different techniques. This confirms what could already be seen in the previous pilot study on tuna fish. For this kind of analysis, reliable measurements of highest metrological quality can be performed with various instrumental techniques (ICP-MS, AAS, NAA and k0 NAA) and analytical methods (IDMS, external calibration, standard addition and non destructive analysis). They are not method dependent. CCQM-K43 is also a good example of a key comparison in parallel to a pilot study involving not only the NMIs, but also expert laboratories of their countries as it is one of the NMIs’ major tasks to disseminate metrological principles and good measurement practice to the laboratories in their countries. After the agreement of all participants, the final report of the pilot study CCQM-P39.1 will also be
published in the metrologia technical supplement. The main purpose of any Interlaboratory Comparison, thus also of CCQM comparisons, is to assess capabilities and to discover problems and correct analytical procedures accordingly. In this sense NMIs with a result significantly deviating from the KCRV immediately benefited from participating in CCQM K43. The organising laboratory appreciates that IAEA and NIST are sharing this experience with all the other participants. All NMIs have proven with their participation in CCQM-K43 (salmon) and the previous CCQM-P39 (tuna fish) not only their measurement capabilities on measurements close to legal limits, but also on low trace level measurements. In addition they have demonstrated their capability on appropriate sample treatment for a wide range of fish samples. This key comparison therefore serves perfectly to support CMCs of those NMIs in Appendix C. Acknowledgements Special thanks to F. Ulberth and A. Held from the RM unit for their support in providing the suitable salmon sample and in the design of the homogeneity study. The authors acknowledge furthermore the input of all the IRMM scientists who contributed to the reprocessing and characterisation of the tuna fish sample : - K. H. Grobecker, M. Bickel, A. Michiels, A. Bernreuther, S. Yazgan, P. Conneely. Furthermore the assistance of our MILC administrator S. Bynens is warmly acknowledged and the support of M. Sargent as chairman of the CCQM IAWG.

CCQM-K43 Final Report
13
List of abbreviations
AAS Atomic Absorption Spectrometry BIPM Bureau International des Poids et Mesures (Paris, France) CCQM Comité Consultatif pour la Quantité de Matière CITAC Co-operation for International Traceability in Analytical Chemistry CRMs Certified Reference Materials EC European Commission EU European Union EURACHEM A focus for Analytical Chemistry in Europe GC-ID-ICP-MS Gas Chromatography Isotope Dilution Inductively Coupled Plasma Mass
Spectrometry GUM Guide for expression for Uncertainty in Measurement IAWG Working Group on Inorganic Analysis ICP-MS Inductively Coupled Plasma-Mass Spectrometry IDMS Isotope Dilution Mass Spectrometry INAA Instrumental Neutron Activation Analysis IRMM Institute for Reference Materials and Measurements (EC, Geel, Belgium) ISO International Organisation for Standardisation JRC Joint Research Centre Ko-NAA Neutron Activation Analysis with k0 standardization MM-median Mixture Model Median MM-PDF Mixture Model Probability Density Function NAA Neutron Activation Analysis NMIs National Metrology Institutes SCF Scientific Committee on Food SS-ZAAS Solid Sample Zeemann Atomic Absorption Spectrometry
CCQM-K43 As, Hg, Pb, Se and Methylmercury in Salmon
14
References
1. Aregbe Y., Quétel C., Taylor P.D.P., CCQM-P39: As, Hg, Pb, Se and methylmercury in tuna fish, Metrologia, 2004, 41, Tech. Suppl., 08004
2. Commission Directive 2001/22/EC laying down the sampling methods of anlysis for the official control of lead, cadmium, nmercury and 3-MCPD in foodstuffs Official Journal of the European Communities L77/14, 08/03/2001
3. Commission Regulation (EC) No 466/2001 of 8 March 2001 setting maximum levels for certain contaminants in foodstuff, Official Journal of the European Communities L077, 16/03/2001, 0001-0013
4. SCF/CS/NUT/UPPLEV/11 FINAL, Nov/2000
5. Commission Decision No 2002/657/EC of 17 August 2002 implementing Coucil Directive 96/23/EC concerning performance of analytical methods and the interpretation of results, Official Journal of the European Communities L221, 17/08/2002
6. T. P. J. Linsinger et al. Accred.Qual.Assur (2001) 6:20-25
7. A.M.H. van der Veen et al. Accred.Qual.Assur (2001) 6:26-30
8. http://www.bipm.org/utils/en/pdf/mra.pdf 9. S. Rückhold et al. Fresenius J. Anal. Chem
(2000) 368: 522-527
10. S. Rückhold et al . Fresenius J. Anal. Chem (2000) 370: 189-193
11. International Organisation for Standardisation, “Guide to the Expression of Uncertainty in Measurement”, ©ISO, ISBN 92-67-10188-9, Geneva, Switzerland, 1993.
12. Eurachem/CITAC Guide Quantifying uncertainty in analytical measurement (2nd ed. 2000), www.eurachem.bam.de
13. David L. Duewer, A robust approach for the determination of CCQM key comparison reference values and uncertainties, Working document CCQM 04-15, BIPM, 2004
14. P. Ciarlini, M. Cox, F. Pavese, G.
Regoliosi. The use of a mixture of probability distributions in temperature interlaboratory comparisons. Metrologia 2004;41:116-121

15
Annex 1 – Graphical presentation Contents CCQM-K43: As, Hg, Pb, Se and Methylmercury in Salmon
Figures 1 - 4 _________________________________________________________ 18-19 All participants with KCRV _________________________________________________
Figures 5 - 12 ________________________________________________________ 22-25 Equivalence charts________________________________________________________
Figures 13 - 16 _______________________________________________________ 27-28 Analytical techniques ______________________________________________________

16

17
CCQM-K43: As, Hg, Pb, Se and Methylmercury in Salmon
Annex 1 – All participants results
Figure General Graphs Page number
Figure 1 All participants - As 18
Figure 2 All participants - Hg 18
Figure 3 All participants - Pb 19
Figure 4 All participants - Se 19

CCQM-K43 As, Hg, Pb, Se and Methylmercury in Salmon - Annex 1
18
NMIJ
IAEANMIABAMINMETROIRMM
NIST
LNEIMGC
46.48
51.48
56.48
61.48
66.48
c
10
-6 m
ol·k
g-1
-20
-15
-10
-5
0
5
10
15
20
Dev
iatio
n fr
om th
e M
M-m
edia
n in
%
CCQM-K43: As in salmonKCRV_Mixture Model-median: 58.1 ± 1.5 ·10-6 mol·kg-1 ; [ µ ± σ*ts/√n]
IRMMKRISS NIST
NRC NMIANMIJ LNE
LGC
0.31
0.33
0.35
0.37
0.39
0.41
0.43
0.45
c
10
-6 m
ol·k
g-1
-20
-15
-10
-5
0
5
10
15
20
Dev
iatio
n fr
om th
e M
M-m
edia
n in
%
CCQM-K43: Hg in salmonMixture Model-median: 0.3884 ± 0.0056 ·10-6 mol·kg-1 ; [ µ ± σ*ts/√n]
Figure 1
Figure 2

CCQM-K43 Final Report - Annex 1
19
IAEA BAM
KRISS NMIJ
NMIA
3.06
3.26
3.46
3.66
3.86
4.06
4.26
4.46
c
10
-6 m
ol·k
g-1
-20
-15
-10
-5
0
5
10
15
20
Dev
iatio
n fr
om th
e M
M-m
edia
n in
%
CCQM-K43: Pb in salmonKCRV_Mixture Model-median: 3.82 ± 0.10 ·10-6 mol·kg-1; [ µ ± σ*ts/√n]
IAEA
LNE
NISTINMETROBAMIMGCNMIANMIJIRMMLGC
3.66
4.66
5.66
6.66
7.66
8.66
9.66
10.66
c
10
-6 m
ol·k
g-1
-50
-40
-30
-20
-10
0
10
20
30
40
50
Dev
iatio
n fr
om th
e M
M-m
edia
n in
%
CCQM-K43: Se in salmonMixture Model-median: 7.32 ± 0.28 ·10-6 mol·kg-1 ; [ µ ± σ*ts/√n]
Figure 3
Figure 4

CCQM-K43 As, Hg, Pb, Se and Methylmercury in Salmon - Annex 1
20
21
CCQM-K43: As, Hg, Pb, Se and Methylmercury in Salmon
Annex 1 – All participants – Degree of equivalence
Figure Degree of equivalence Page number
Figure 5 Equivalence Table - As 22
Figure 6 Equivalence chart- As 22
Figure 7 Equivalence Table - Hg 23
Figure 8 Equivalence chart - Hg 23
Figure 9 Equivalence Table - Pb 24
Figure 10 Equivalence chart - Pb 24
Figure 11 Equivalence Table - Se 25
Figure 12 Equivalence chart - Se 25

CCQM-K43 As, Hg, Pb, Se and Methylmercury in Salmon - Annex 1
22
Figure 5 Degree of equivalence – As
Lab i
D i U i
BAM 0.65 3.04IAEA 1.37 1.69IMGC -2.24 1.81
INMETRO -0.10 2.66IRMM -0.30 3.09LNE -1.93 2.95NIST -0.51 1.68NMIA 1.30 3.72NMIJ 2.76 3.44
µmol·kg-1
Figure 6 Equivalence chart - As
Degree of equivalence CCQM-K43: As in salmon; U iR2 = U i
2 + U R2
BAM
IAEA
IMGC
INMETRO
IRMMLNE
NIST NMIA
NMIJ
-8.0
-6.0
-4.0
-2.0
0.0
2.0
4.0
6.0
8.0
equi
vale
nce
( Di)
µm
ol·k
g-1

CCQM-K43 Final Report - Annex 1
23
Figure 7 Degree of equivalence – Hg
Figure 8 Equivalence chart - Hg
Degree of equivalence CCQM-K43: Hg in salmon; U iR2 = U i
2 + U R2
LNEIRMM
KRISS
LGC
NIST NMIA
NMIJ
NRC
-0.04
-0.03
-0.02
-0.01
0.00
0.01
0.02
0.03
0.04
equi
vale
nce
( Di)
µm
ol·k
g-1
Lab i
D i U i
LNE 0.0056 0.0198IRMM -0.0028 0.0100KRISS -0.0025 0.0062LGC 0.0096 0.0170NIST -0.0025 0.0103NMIA 0.0006 0.0170NMIJ 0.0037 0.0089NRC -0.0014 0.0160
µmol·kg-1

CCQM-K43 As, Hg, Pb, Se and Methylmercury in Salmon - Annex 1
24
Figure 9 Degree of equivalence – Pb Figure 10 Equivalence chart - Pb
Degree of equivalence CCQM-K43: Pb in salmon; U iR2 = U i
2 + U R2
IAEA NMIA
BAM
NMIJ
KRISS
-0.4
-0.3
-0.2
-0.1
0.0
0.1
0.2
0.3
0.4
equi
vale
nce
( Di)
µm
ol·k
g-1
Lab i
D i U i
IAEA -0.03 0.15NMIA 0.10 0.20BAM -0.02 0.13NMIJ 0.01 0.26
KRISS 0.00 0.17
µmol·kg-1

CCQM-K43 Final Report - Annex 1
25
Figure 11 Degree of equivalence – Se Figure 12 Equivalence chart - Se
Degree of equivalence CCQM-K43: Se in salmon; U iR2 = U i
2 + U R2
IAEA
LNENIST
INMETROBAMIMGCNMIANMIJIRMMLGC
-3.0
-2.0
-1.0
0.0
1.0
2.0
3.0
equi
vale
nce
( Di)
µm
ol·k
g-1
Lab i
D i U i
LGC -0.28 0.51IRMM -0.19 0.47NMIJ -0.17 0.30NMIA -0.15 0.40IMGC -0.14 0.38BAM 0.11 0.52
INMETRO 0.15 0.54NIST 0.26 0.33LNE 0.65 0.43IAEA 1.88 0.89
µmol·kg-1

CCQM-K43 As, Hg, Pb, Se and Methylmercury in Salmon - Annex 1
26
CCQM-K43: As, Hg, Pb, Se and Methylmercury in Salmon
Annex 1 – All participants – Analytical techniques
Figure Method graphs Page number
Figure 13 Analytical techniques, All participants - As 27
Figure 14 Analytical techniques, All participants - Hg 27
Figure 15 Analytical techniques, All participants - Pb 28
Figure 16 Analytical techniques, All participants - Se 28

27
Figure 13 Results for As from all CCQM-K43 participants sorted by analytical method
LNE
NM
IA
NM
IJ
IAE
A
IMG
C
NIS
T
IRM
M
INM
ETR
O
BA
M
5040
3020
100
-10
-20
-30
-40
-50
Dev
iatio
n fro
m M
M-m
edia
n in
%
IC P -M S
IC P -M S + G F-A A S
N A A
Figure 14 Results for Hg from all CCQM-K43 participants sorted by analytical method
IRM
M
KR
ISS
NIS
T
NR
C
NM
IA
NM
IJ
LNE
LGC
5040
3020
100
-10
-20
-30
-40
-50
Dev
iatio
n fro
m M
M-m
edia
n in
% ID-ICP-MS

CCQM-PK43 As, Hg, Pb, Se and Methylmercury in Salmon - Annex 1
28
Figure 15 Results for Pb from all CCQM-K43 participants sorted by analytical method
KR
ISS
NM
IJ
NM
IA
IAE
A
BA
M
5040
3020
100
-10
-20
-30
-40
-50
Dev
iatio
n fro
m M
M-m
edia
n in
%
ID-ICP-MS
ICP-MS + GF-AAS
ID-TIMS
Figure 16 Results for Se from all CCQM-K43 participants sorted by analytical method
LGC
NM
IJ
NM
IA
LNE
IRM
M
IMG
C
BA
M
INM
ETR
O
NIS
T
IAE
A
5040
3020
100
-10
-20
-30
-40
-50
Dev
iatio
n fro
m M
M-m
edia
n in
%
ID-ICP-MS
k0-NAA
NAA

29
Annex 2 – Methylmercury (CH3Hg) Contents CCQM-K43: As, Hg, Pb, Se and Methylmercury in Salmon METHYLMERCURY MEASUREMENTS 31
DISCUSSION 32
QUESTIONNAIRE DATA 36-39
REFERENCES 40

30

31
CCQM-K43: As, Hg, Pb, Se and Methylmercury in Salmon
Annex 2 – All participants results Methylmercury (CH3Hg)
Figure/ Table Page
number
Figure 1 All participants - MeHg 33
Figure 2 Analytical techniques, All participants - MeHg 33
Figure 3 Equivalence Table - MeHg 34
Figure 4 Equivalence chart - MeHg 34
Figure 5 All participants - MeHg with NIST amended value 35
Table 1 Measurement strategy 36
Table 2 Timing of the spike addition for ID or SA & ref. isotope used for IDMS 37
Table 3 Measurement process 38
Table 4 Experimental reproducibility from the different sample aliquots 39

CCQM-K43 As, Hg, Pb, Se and Methylmercury in Salmon - Annex 2
32
Methylmercury measurementsAll participants who measured methylmercury in CCQM-K43 had previously participated in CCQM-P39 (tuna fish). A detailed evaluation of the CCQM-P39 results for the MeHg measurements was recently published in the open literature [1]. Therefore they had already received during this previous pilot study the ERM AE670 202Hg enriched spike solution. Participants were not asked to use it, but were entirely free to implement the measurement method of their choice. The ERM AE670 material was offered for use by those applying species specific direct IDMS. In addition the final ERM AE670 certificate and the publication on the preparation and certification of the ERM AE670 [2], were also forwarded to all CCQM-K43 participants who measured methylmercury. ERM AE670 is distributed under the European Reference Materials programme [3]. All CCQM-K43 participants implemented an IDMS approach with GC- or LC-ICP-MS. IRMM, LGC and NMIJ used the ERM AE670 as spike material for the isotope dilution. NIST reported a combined result for MeHg using GC-MS and speciated isotope dilution GC-ICP-MS. NIST used ERM AE670 as internal standard for the GC-MS measurements. NIST also used ERM AE670 for their SID-GC-ICP-MS result, but used a value based upon a spike calibration with SRM 3133 (Mercury Solution) rather than the ERM certified value. NRC used its own reference material as spike. Participants measuring MeHg were asked to fill in a separate questionnaire. This Annex summarises the questionnaire data and presents the results and equivalence statements for methylmercury.
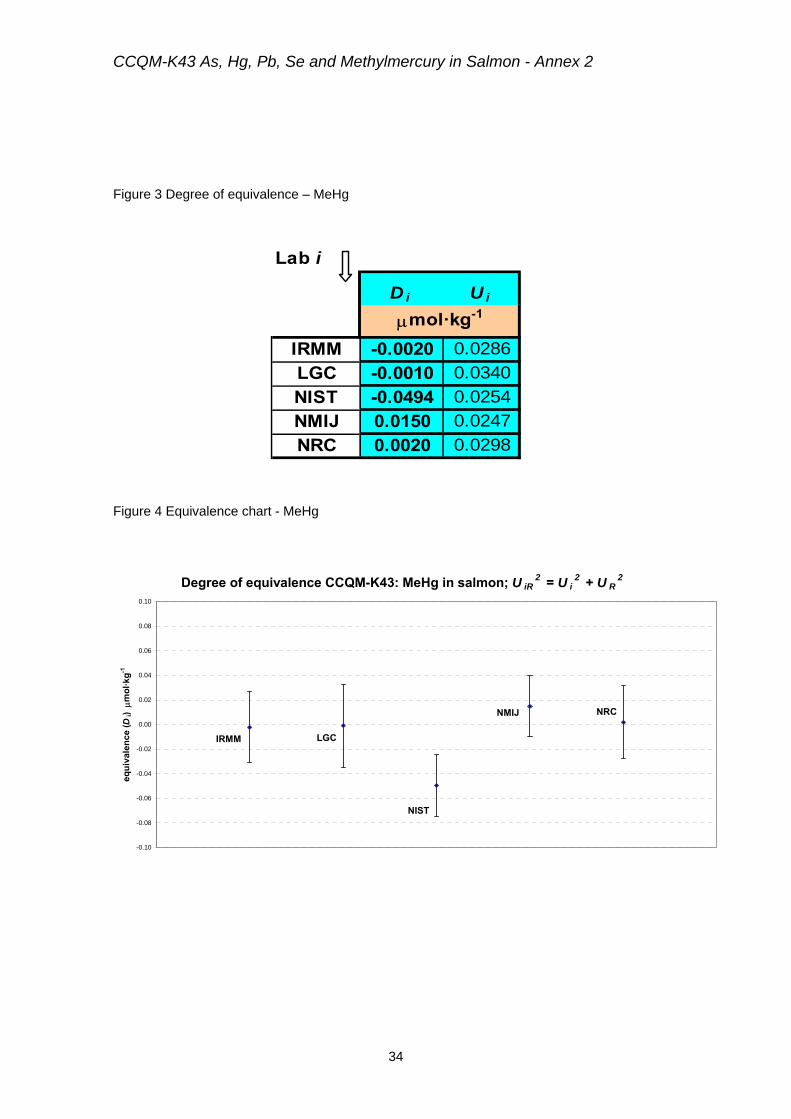
Discussion
As shown in Figure 1 – Figure 4, results for MeHg are within 13% relative to the KCRV taking into account all participants’ results. After the CCQM-K43 summary report was distributed to the participants for comments, NIST reinvestigated their methylmercury measurements. They could not find any explanation for the deviation of their GC-MS measurement results compared to the other participants’ results. Therefore the reported NIST result was also included in the calculation of the KCRV. In the case of their SID-GC-ICP-MS result, NIST discovered a problem with the spike calibration procedure that was used. Methylmercury was not fully decomposed by that procedure and thus not properly equilibrated with SRM 3133. As a corrective action NIST performed the calculation with the original data set using the certified value of ERM-AE670. This approach gave as a result for the methylmercury measurements with SID-GC-ICP-MS 0.349 µmol·kg-1 with and expanded
uncertainty of 0.017 µmol·kg-1. Excluding the initially reported NIST MeHg result and taking into account the amended NIST value for SID-GC-ICP-MS, the spread of results for MeHg by the NMIs would fall within 4% deviation from the KCRV. NIST asked the organising laboratory to also include these values in the CCQM-K43 report (see Figure 5). This is a very good example how participation in a pilot study results in immediate correction measures, which is the main purpose for participation in Interlaboratory Comparisons. Furthermore, this example also proves the robustness of the MM-median as KCRV. In Figure 1 and Figure 5 it can be seen that there is no change in the value for the MM-median. This confirms the approach chosen in CCQM-K43 not to exclude any reported result from the calculation of the KCRV, as long as there is no scientific explanation for the observed bias.

CCQM-K43 final report – Annex 2
33
NMIJNRCLGC
IRMM
NIST
0.30
0.32
0.34
0.36
0.38
0.40
0.42
0.44
c
10
-6 m
ol·k
g-1
-20
-15
-10
-5
0
5
10
15
20
Dev
iatio
n fr
om th
e M
M-m
edia
n in
%
CCQM-K43: MeHg in salmonKCRV_Mixture Model-median: 0.373 ± 0.023 ·10-6 mol·kg-1 ; [ µ ± σ*ts/√n]
Figure 1 Results for MeHg from all CCQM-K43 participants
Figure 2 Results for MeHg from all CCQM-K43 participants sorted by instrumental technique
IRM
M
NM
IJ
NIS
T
NR
C
LGC
5040
3020
100
-10
-20
-30
-40
-50
Dev
iatio
n fro
m M
M-m
edia
n in
%
GC-ID-ICP-MS
GC-MS + SID-GC-ICP-MSLC-ID-ICP-MS
GC-SF-ID-ICP-MS
CCQM-K43 As, Hg, Pb, Se and Methylmercury in Salmon - Annex 2
34
Figure 3 Degree of equivalence – MeHg
Figure 4 Equivalence chart - MeHg
Degree of equivalence CCQM-K43: MeHg in salmon; U iR2 = U i
2 + U R2
IRMM LGC
NIST
NMIJ NRC
-0.10
-0.08
-0.06
-0.04
-0.02
0.00
0.02
0.04
0.06
0.08
0.10
equi
vale
nce
( Di)
µm
ol·k
g-1
Lab i
D i U i
IRMM -0.0020 0.0286LGC -0.0010 0.0340NIST -0.0494 0.0254NMIJ 0.0150 0.0247NRC 0.0020 0.0298
µmol·kg-1

CCQM-K43 final report – Annex 2
35
Figure 5 Results for MeHg from all CCQM-K43 participants-with NIST amended value for SID-GC-ICP-MS not combined with GC-MS value
NMIJNRCLGC
IRMM
NIST
0.30
0.32
0.34
0.36
0.38
0.40
0.42
0.44
c
10
-6 m
ol·k
g-1
-20
-15
-10
-5
0
5
10
15
20
Dev
iatio
n fr
om th
e M
M-m
edia
n in
%
CCQM-K43: MeHg in salmonMixture Model-median with corrected NIST result: 0.373 ± 0.022 ·10-6 mol·kg-1 ; [ µ ± σ*ts/√n]

CCQM-K43 As, Hg, Pb, Se and Methylmercury in Salmon - Annex 2
36
Questionnaire Data Table 1 Measurement strategy
Participant Direct IDMS
with ERM AE670
Double IDMS with
ERM AE670 Other
method
Calibration with
external matrix
matched standards
Without
an internal
standard
Method of standard addition
(SA) calibration
IRMM
LGC Ltd.
NIST
Average of appproach 1 and
2 (used two different
measurement methods)
NMIJ
NRC
Isotope dilution and reverse
isotope dilution using a 198Hg
enriched Me198Hg
(NRCC EOM-1)

CCQM-K43 final report – Annex 2
37
Table 2 Timing of the spike addition for ID or SA & ref. isotope used for IDMS
REPORTED QUESTIONNAIRE DATA FOR METHYLMERCURY
Participant
Some hours
prior to MeHg
extraction
Immediately before MeHg
extraction
After MeHg extraction,
prior to measurement
Reference isotope used for
IDMS
Number of replicate
blend samples
IRMM 202Hg 9
LGC Ltd. 200Hg 4
NIST multiple
6 for each of two
measurement methods
NMIJ 200Hg/202Hg 2 samples x 2 bottles
NRC
Isotope pair of 202Hg/198Hg was used for
the determination of MeHg using
species specific ID and
reverse ID method.
4

CCQM-K43 As, Hg, Pb, Se and Methylmercury in Salmon - Annex 2
38
Table 3 Measurement process
REPORTED QUESTIONNAIRE DATA FOR METHYLMERCURY
Participant Sample mass (g)
Extraction reagents
Extraction apparatus
Derivatisation reagents
Species
separation apparatus
Detector
IRMM ~ 0.2 See ref. [4] See ref. [4] See ref. [4] See ref. [4] See ref. [4]
LGC Ltd. 0.4
Protease type XIV (0.04g), 15ml of 0.1M ammonium phosphate buffer with 0.05% mercaptomethanol
Incubator 37C None LC ICP-MS
NIST 0.25g and 0.5 TMAH, HCl Microwave NaB(C2H5)4
and NaTHBO GC ICP-MS, EIMS
NMIJ ~0.4g 25% KOH/MeOH
ultrasound bath NaBPh4
GC, column: HP-5MS(0.25 um x0.25 mm
x 30 m), carrier: He 1
mL/min
ICP-MS
NRC 0.4 25 % KOH in methanol
Mechanical shaker NaB(C3H7)4 GC ICP-MS
More detailed information on the analytical approaches of the institutes for the determination of methylmercury in fish tissue can be found in [1].

CCQM-K43 Final Report - Annex 2
39
Table 4 Experimental reproducibility from the different sample aliquots
REPORTED QUESTIONNAIRE DATA FOR METHYLMERCURY
Experimental reproducibility
IRMM 1.61%
LGC Ltd. 0.78%
NIST Me-Hg(GCMS)=1.3%, Me-Hg(SID-GC-ICPMS)=2.9%
NMIJ 0.3% (n=4)
NRC 1.7 %

CCQM-K43 As, Hg, Pb, Se and Methylmercury in Salmon - Annex 2
40
References 1. C. R. Quétel et al, Methylmercury in tuna :
demonstrating measurement capabilities and evaluating comparability of results worldwide from the CCQM-P39 comparison, JAAS, 2005, 20, 1058-1066
2. J. P. Snell et al, Preparation and certification
of ERM®-AE670, a 202Hg enriched methylmercury isotopic reference material.., J. Anal. At. Spectrom., 2004, 19, 1315 – 1324
3. http://www.erm-crm.org 4. J. Snell, C. R. Quétel (2005) SI-traceable
certification of methylmercury amount content in a tuna material. Journal of Analytical Atomic Spectrometry, Vol. 20 (4), 447-454

41
Annex 3 – Questionnaire data As, Hg, Pb, Se Contents
CCQM-K43: As, Hg, Pb, Se and Methylmercury in Salmon
Tables 1 - 6 __________________________________________________________ 44-48 Questionnaire data________________________________________________________

42

43
CCQM-K43: As, Hg, Pb, Se and Methylmercury in Salmon
Annex 3 – Questionnaire data
Table Page number
Table 1 Digestion method and acid mixture 44
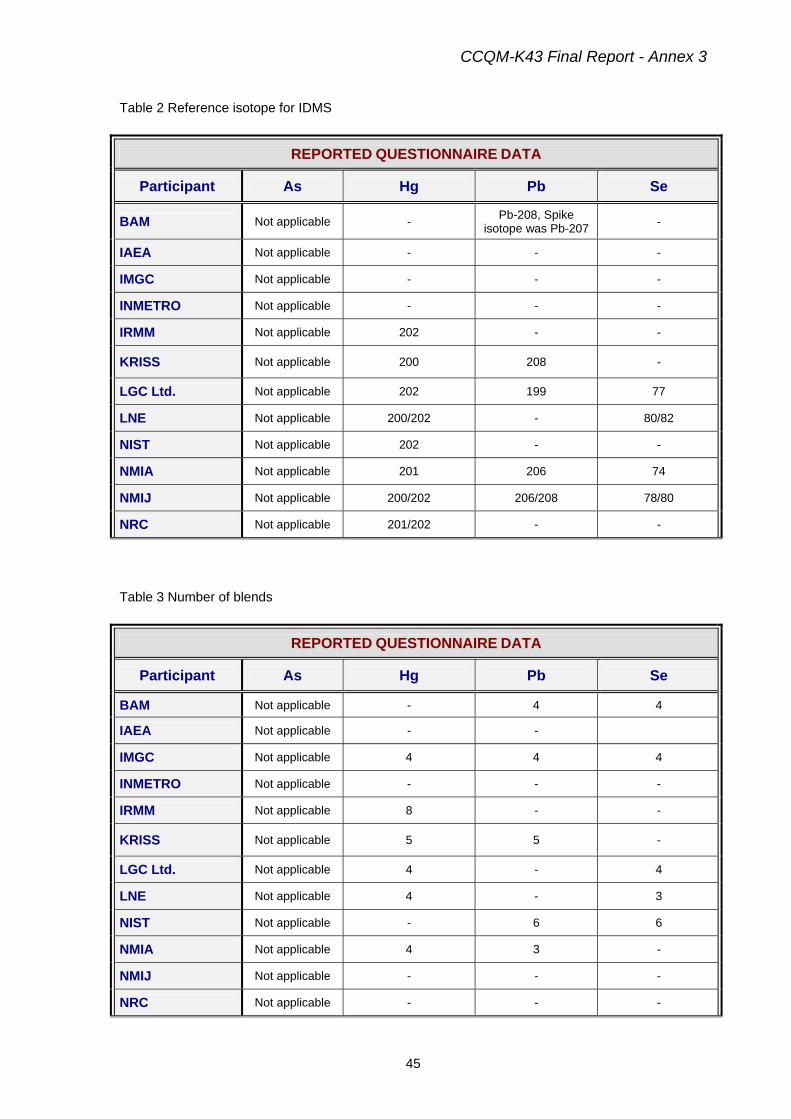
Table 2 Reference isotope for IDMS 45
Table 3 Number of blends 45
Table 4 Experimental reproducibility 46
Table 5 (Isotopic) reference materials used for calibration 47
Table 6 Number of salmon vials used for the analysis and Use of square root of n for type A uncertainty contributions 48

CCQM-K43 As, Hg, Pb, Se and Methylmercury in Salmon - Annex 3
44
Table 1 Digestion method and acid mixture
REPORTED QUESTIONNAIRE DATA
Participant As Hg Pb Se
BAM - - High pressure asher H2O2, HNO3
-
IAEA Microwave digestion HNO3
- Microwave digestion HNO3
Microwave digestion HNO3
IMGC - - - -
INMETRO - - - -
IRMM - Microwave digestion HNO3, HCl - -
KRISS - Microwave digestion H2O2, HNO3
Microwave digestion H2O2, HNO3
-
LGC Ltd. - Microwave digestion H2O2, HNO3
- Microwave digestion H2O2, HNO3
LNE Microwave digestion H2O2, HNO3
Microwave digestion H2O2, HNO3
- Microwave digestion H2O2, HNO3
NIST - High pressure microwave digestion HNO3
- -
NMIA Microwave digestion H2O2, HNO3
Microwave digestion H2O2, HNO3
Microwave digestion H2O2, HNO3
Microwave digestion H2O2, HNO3
NMIJ Microwave digestion HClO4, HNO3
Microwave digestion Aqua regia
Microwave digestion HClO4, HNO3
Microwave digestion HClO4, HNO3
NRC - Microwave digestion H2O2, HNO3
- -
CCQM-K43 Final Report - Annex 3
45
Table 2 Reference isotope for IDMS
REPORTED QUESTIONNAIRE DATA
Participant As Hg Pb Se
BAM Not applicable - Pb-208, Spike isotope was Pb-207 -
IAEA Not applicable - - -
IMGC Not applicable - - -
INMETRO Not applicable - - -
IRMM Not applicable 202 - -
KRISS Not applicable 200 208 -
LGC Ltd. Not applicable 202 199 77
LNE Not applicable 200/202 - 80/82
NIST Not applicable 202 - -
NMIA Not applicable 201 206 74
NMIJ Not applicable 200/202 206/208 78/80
NRC Not applicable 201/202 - -
Table 3 Number of blends
REPORTED QUESTIONNAIRE DATA
Participant As Hg Pb Se
BAM Not applicable - 4 4
IAEA Not applicable - -
IMGC Not applicable 4 4 4
INMETRO Not applicable - - -
IRMM Not applicable 8 - -
KRISS Not applicable 5 5 -
LGC Ltd. Not applicable 4 - 4
LNE Not applicable 4 - 3
NIST Not applicable - 6 6
NMIA Not applicable 4 3 -
NMIJ Not applicable - - -
NRC Not applicable - - -

CCQM-K43 As, Hg, Pb, Se and Methylmercury in Salmon - Annex 3
46
Table 4 Experimental reproducibility
REPORTED QUESTIONNAIRE DATA
Participant As Hg Pb Se
BAM 1.8 % - 1% 3.75 %
IAEA - - - -
IMGC 1.82 % - - 3.63 %
INMETRO - - - -
IRMM - 0.60% - -
KRISS - 0.38 % 2.13 % -
LGC Ltd. - 1.0 % - 3.9 %
LNE 3.7 % 1.8% - 2.7 %
NIST 0.76 % 0.47% - -
NMIA 0.37% 0.77 % 2.3 % 1.4%
NMIJ 1.4 % 1.4 % 3.0 % 0.9 %
NRC - 0.41 % - -

CCQM-K43 Final Report - Annex 3
47
Table 5 (Isotopic) reference materials used for calibration
REPORTED QUESTIONNAIRE DATA
Participant As Hg Pb Se
BAM - - NBS 981 -
IAEA - - - -
IMGC NIST SRM
1566b (Oyster Tissue)
- - NIST SRM 1566b (Oyster Tissue)
INMETRO
IAEA 393, RM 464, P 39
sample, and As and Se 100ppm
solutions traceable to NIST SRMs
- -
IAEA 393, RM 464, P 39 sample, and
As and Se 100ppm solutions traceable
to NIST SRMs
IRMM - ERM-AE640 - -
KRISS - ERM-AE640 NIST SRM991, 981 & 982 -
LGC Ltd. - in-house prepared from ORNL - in-house prepared
from ORNL
LNE As2O5 From JM, 99.9 % ERM-AE639 - AE640 -
high purity se powder JM
99.999% - spike solution
Spectrascan Se 82 ( 96.66%)
NIST - SRM 1641d - -
NMIA NIST 3103a ERM-AE640 NIST 981 NIST 3149
NMIJ residual CCQM-
P39 sample(ca.2 g)
residual CCQM-P39 sample(ca.2 g)
residual CCQM-P39 sample(ca.2 g)
residual CCQM-P39 sample(ca.2 g)
NRC -
198Hg enriched Me198Hg (NRCC
EOM-1) and 201Hg enriched Hg
- -

CCQM-K43 As, Hg, Pb, Se and Methylmercury in Salmon - Annex 3
48
Table 6 Number of salmon vials used for the analysis and Use of square root of n for type A uncertainty
contributions
REPORTED QUESTIONNAIRE DATA
Participant Number of vials Sqrt (n)
BAM 2 Yes
IAEA 4 Yes
IMGC 3 Yes
INMETRO 2 Yes
IRMM 8 Yes
KRISS 5 Yes
LGC Ltd. 2 vials for Hg & Se, 2 vials for MeHg Yes
LNE 2 vials per element Yes
NIST 4 Yes
NMIA 8 Yes
NMIJ 4 Yes
NRC Two for MeHg and two for Hg Yes
49
Annex 4 – Documentation Contents
CCQM-K43: As, Hg, Pb, Se and Methylmercury in Salmon
Documentation
Cover page including participants list__________________________________________
Accompanying letter_______________________________________________________
Scope of the study ________________________________________________________
General instructions _______________________________________________________
Instructions for determination of the dry-mas correction and the digestion of the Salmon _
Certification of MeHg in Salmon______________________________________________
Guidelines for result reporting _______________________________________________
Guidelines for questionnaire reporting _________________________________________
Questionnaire for measurements of Hg, Pb, Se and As ___________________________
Questionnaire for Methylmercury _____________________________________________

EUROPEAN COMMISSION DIRECTORATE GENERAL JRC JOINT RESEARCH CENTRE IRMM Insti tute for Reference Mater ials and Measurements
1st December 2004
CCQM-K43 & CCQM-P39.1 As, Hg, Pb, Se and Methylmercury in Salmon
Information Package
For further information please contact:
Dr. Y. Aregbe CCQM-K43 & CCQM-P39.1 Co-ordinator Isotope Measurement Unit tel.: +32 (0)14 571 673 fax: +32 (0)14 571 865 e-mail: [email protected]
Institute for Reference Materials and Measurements (IRMM)
European Commission – JRC Retieseweg 111, B-2440 GEEL (Belgium)

Distribution list
Registered CCQM_IAWG participants in CCQM-K43 and/or CCQM-P39.1: J. Vogl BAM E. Nadai-Fernandes CENA M. Gallorini IMGC C. Quétel IRMM P. Robouch IRMM E. Hwang KRISS R. Hearn LGC G. Labarraque LNE R. Greenberg NIST K. Inagaki NMIJ R. Sturgeon NRC J. Wang NRCCRM B. Magnusson SP L. Mackay NMIA T. Araujo INMETRO U. Sansone IAEA E. Wyse IAEA-MEL Registered invited participants to CCQM-P39.1: M. Horvat IJS E. Krupp LABEC Univ. Pau J.I. Garcia-Alonso Oviedo Univ. H. Hintelmann Trent Univ. Z. Jokai Corvinus Univ. D. Centioli APAT E. Bjorn Umea Univ. W. Hagan Frontier Geosciences Inc. CCQM and RMO delegates for info: R. Kaarls President CCQM R. Wielgosz CCQM exec. Secretary M. Sargent CCQM IAWG chairperson J. McLaren CCQM KCWG chairperson P. Charlet EUROMET METCHEM

Retieseweg 111, B-2440 Geel, Belgium Tel.: +32-(0)14-571 673 • Fax: +32-(0)14-571 865 • [email protected] • http://www.irmm.jrc.be
EUROPEAN COMMISSION DIRECTORATE GENERAL JRC JOINT RESEARCH CENTRE Institute for Reference Materials and Measurements IRMM
Geel, 1st December 2004 L/IM/94/04
To: CCQM-K43 & CCQM-P39.1 registered participants Subject: CCQM-K43 & CCQM-P39.1 “As, Hg, Pb, Se and Methylmercury in
Salmon” Dear CCQM-K43 & CCQM-P39.1 participant, As proposed, discussed and decided in previous CCQM-IAWG meetings (Paris 2004), IRMM will act as the coordinating laboratory of the CCQM-K43 key comparison and the CCQM-P39.1 pilot study, “As, Hg, Pb, Se and Methylmercury in Salmon”. The salmon material originates from Norway. The sample is a freeze dried and ground salmon muscle and skin powder bottled in amber glass vials each one containing ~ 2.2 g of material. The material is tested for stability and homogeneity. It is appropriate for the needs of this comparison. The deadline for reporting the CCQM-K43 & CCQM-P39.1 results is 31st March 2005. Subsequently the preliminary results can be presented and discussed at the CCQM-IAWG meeting in Spring, Paris. The information package for CCQM-K43 & CCQM-P39.1 includes: • This letter • Scope of the CCQM-K43 & CCQM-P39.1 pilot study • General instructions • Instructions for reporting the detailed measurement procedure including uncertainty evaluation • Instructions for the dry mass correction and digestion of the salmon • Information for CCQM-K43 & CCQM-P39.1 participants measuring methylmercury • Instructions for online result and questionnaire reporting using the IT system of IRMM
Interlaboratory comparisons If any further information is required, please do not hesitate to contact us. Yours sincerely, Dr. Y. Aregbe CCQM-K43 & CCQM-P39.1 co-ordinator IRMM, IM Unit

Retieseweg 111, B-2440 Geel, Belgium Tel.: +32-(0)14-571 673 • Fax: +32-(0)14-571 865 • [email protected] • http://www.irmm.jrc.be
EUROPEAN COMMISSION DIRECTORATE GENERAL JRC JOINT RESEARCH CENTRE IRMM Insti tute for Reference Mater ials and Measurements
Geel, 1st December 2004
CCQM-K43 and CCQM-P39.1 “As, Hg, Pb, Se and Methylmercury in Salmon”
Scope of the key comparison and the pilot study
At the April meeting in Paris, 2004 it was decided to proceed the previous pilot study on tuna fish CCQM-P39, to the key comparison CCQM-K43 and the pilot study CCQM-P39.1 using a salmon material. In order to protect public health it is essential to keep contaminants at levels, which are toxicologically acceptable, thus surveillance measures were taken regarding the presence of contaminants in foodstuff, including fish. Arsenic is a mononuclidic toxic element and cannot be determined by IDMS. Rules for measurements of As are set in the commission decision on implementing council directive 96/23/EC concerning the performance of analytical methods and the interpretation of results. Including also total As measurements in these comparisons can be seen as a contribution to broaden the scope and degree of difficulty of measurements addressed by the CCQM Inorganic Working Group. Mercury is a potential environmental toxicant. The main source of human intake of mercury contaminants originates from methylmercury in fish and fishery products. Methylmercury is particularly interesting due to its high toxicity compared to inorganic mercury and its high proportion among organomercury species in the environment. Mercury species, may induce alterations in the normal development of the brain of infants and may induce neurological changes in adults. To protect public health, maximum levels of mercury in fishery products are laid down in relevant regulations. Lead may induce reduced cognitive development in children and increased blood pressure and cardiovascular diseases in adults. The EC Directive 2001/22 describes the Community methods for the sampling, the sample preparation and the analysis of Hg and Pb in fish. Very recently another EC Regulation (466/2001) was introduced that endorses officially the threshold value of 0.5 mg Hg·Kg-1 and 0.2 mg Hg·Kg-1 in salmon [1]. Selenium is an essential trace element for human beings. Seafood is an important source of Se intake for people in some regions. Certain forms of cancer and cardiovascular diseases have also been associated with Se deficiency. On the other hand Se is counted among the most important elements in terms of food-chain contamination. Se has the narrowest plateau between concentrations that show deficiency and toxic effects, respectively. Recently the European Commission has requested the Scientific Committee on Food (SCF) to review the upper level of daily intake of individual vitamins and minerals, amongst them Se, and provide the basis for the establishment of safety factors [2]. The Hg concentration in the salmon material is lower than in the tuna fish material used in CCQM-P39. The first is a real life sample with a regular Hg content for non-contaminated fish, whereas the latter was a real life sample that has been taken off the market due to its elevated Hg content. Measurements of particularly the total amount content of Hg and MeHg in this salmon material would together with the results of the CCQM-P39 pilot study on tuna fish demonstrate the measurement capabilities of the participating institutes in this important field, not only for high Hg concentrations but also for lower levels of Hg in fish. This is important in view of the fact that the threshold value in the EC Regulation (466/2001) for Hg in salmon is lower than for Hg in tuna fish.

Retieseweg 111, B-2440 Geel, Belgium Tel.: +32-(0)14-571 673 • Fax: +32-(0)14-571 865 • [email protected] • http://www.irmm.jrc.be
From a metrological point of view, the measurement of the amount content of mercury in salmon is representative for many similar measurements in fish and other food matrices. Laboratories who demonstrate their capability of measuring the As, Hg, Pb and Se amount content in the CCQM-K43 and CCQM-P39.1 salmon samples, are likely to have the capability, knowledge and skills to measure the amount content of other elements at similar levels in other food matrices which require similar sample preparation. Dr. Y. Aregbe CCQM-K43 & CCQM-P39.1 co-ordinator IRMM, IM Unit 1 Commission Regulation (EC) No 466/2001 of 8 March 2001 setting maximum levels for certain contaminants in
foodstuff, Official Journal of the European Communities L077, 16/03/2001, 0001-0013
2 Guidelines of the Scientific Committee on Food for the development of tolerable upper intake levels for vitamins, minerals and trace elements SCF/CS/NUT/UPPLEV/11 Final, Nov/2000

Retieseweg 111, B-2440 Geel, Belgium Tel.: +32-(0)14-571 673 • Fax: +32-(0)14-571 865 • [email protected] • http://www.irmm.jrc.be
EUROPEAN COMMISSION DIRECTORATE GENERAL JRC JOINT RESEARCH CENTRE IRMM Inst i tute for Reference Mater ials and Measurements
Geel, 1st December 2004
CCQM-K43 & CCQM-P39.1
As, Hg, Pb, Se and Methylmercury in Salmon
General instructions and guidelines
♦ Each participant will receive 4 salmon samples. On arrival, it is recommended to store the glass vials containing the salmon material refrigerated at 4 oC.
♦ Please can you forward me confirmation the day of delivery, confirming the condition of the vials received to the following email address [email protected]
♦ The amount contents of Hg, Pb and MeHg in the salmon are approximately in the range of 0.1 - 5 µmol · Kg-1 and for As and Se approximately 5 - 50 µmol · Kg-1
♦ To account for the small unit size, each participant will receive 4 bottles (8-10g) of the salmon material where at least 2 sample aliquots from 2 bottles must be analysed for each measured analyte. In view of the limited number of salmon samples and the small unit size available, please plan carefully your measurements as far as the amount of sample needed is concerned.
♦ The participant is free to choose the analytical procedure for measurements in the salmon sample provided it is fit for purpose.
♦ Since the majority of the laboratories participating in CCQM-K43 & CCQM-P39.1 will use IDMS, a few specific points for this analytical method are highlighted although most of the participants have considerable experience in isotope dilution measurements.
• minimise contamination (work in closed systems or class 100 clean bench, check
reagents and lab ware used) • prepare the blends and dilutions gravimetrically. Avoid weighing of too small
aliquots of solids or liquids in order to minimise the weighing uncertainty. • correct sample weighing for dry mass (see specific instructions) • spike the salmon prior to the digestion • make sure that the salmon digestion is complete (see specific instructions) • possible isobaric interferences for the As, Hg, Pb and Se isotopes should be
investigated and treated accordingly • the correction factors for mass discrimination in the ratio measurements should be
measured repeatedly using materials of known isotopic composition and ratios similar to those in the blends or samples
• participants measuring MeHg, please consult the attached information letter “certification of MeHg in salmon”

Retieseweg 111, B-2440 Geel, Belgium Tel.: +32-(0)14-571 673 • Fax: +32-(0)14-571 865 • [email protected] • http://www.irmm.jrc.be
Instructions for result reporting and uncertainty evaluation ♦ For the first time registration and result/questionnaire reporting is done online via the IT
system of IRMM interlaboratory comparisons. Please report your results and questionnaire replies according to the guidelines .
♦ The uncertainty statement should be evaluated and presented according to the principles outlined in, e.g. “ISO/GUM” [1] or the Eurachem/CITAC Guide [2]. This implies that you 1) state your measurement equation 2) identify all significant sources of uncertainty 3) state your input quantities 4) include factors related to sample treatment in your measurement equations 5) describe the applied evaluation process and type of assumed distribution for your uncertainty estimation 6) quantify uncertainty components and convert them to standard uncertainties 7) calculate the combined standard uncertainty uc 8) present an expanded uncertainty U with the coverage factor k=2
♦ As our IT system is still in developing production phase II it is not possible yet to attach documents to your individual result report sites. Therefore the description of the measurement procedure and the sample pre-treatment including the complete uncertainty statement needs to be sent as attachment by email to [email protected]
♦ The whole information package including guidelines for result reporting will also be sent to you via email.
If you require further information or assistance, do not hesitate to contact us. Please address directly Dr. Christophe Quétel ([email protected]) in case you need more specific information related to the MeHg measurements. Dr. Y. Aregbe CCQM-K43 & CCQM-P39.1 co-ordinator IRMM, IM Unit 1. International Organisation for Standardisation, “Guide to the Expression of Uncertainty in Measurement”,
©ISO, ISBN 92-67-10188-9, Geneva, Switzerland, 1993.
2. Eurachem/CITAC Guide Quantifying uncertainty in analytical measurement (2nd ed. 2000), www.eurachem.bam.de.
Retieseweg 111, B-2440 Geel, Belgium Tel.: +32-(0)14-571 673 • Fax: +32-(0)14-571 865 • [email protected] • http://www.irmm.jrc.be
EUROPEAN COMMISSION DIRECTORATE GENERAL JRC JOINT RESEARCH CENTRE IRMM Inst i tute for Reference Mater ials and Measurements
Geel, 1st December 2004
Instructions for determination of the dry-mass correction and the digestion
of the salmon sample in CCQM-K43 & CCQM-P39.1
There are two potential problems in measurements performed on matrices like the salmon material used in these comparisons. Firstly, and most important, the water content of the powdered salmon will affect the salmon mass, and a correction for that is needed. From recent work in that area [1, 2] it seems that this correction is very important because depending on the method used a different result can be obtained. This means that the “measurand” is to some extent “operationally defined”. In order to achieve comparability of results the protocol as given below, must be followed by the CCQM-K43 & CCQM-P39.1 participants. Secondly, the digestion of the salmon material (if needed for the procedure that you are following) is never a trivial exercise. This document intends to give guidance on the above matters. 1. Dry-mass correction The salmon will absorb ambient moisture at typical laboratory temperature and humidity conditions. Therefore the sample bottle should only be opened immediately before weighing aliquots for the IDMS blend preparation. For correction of the measured values to dry mass, water content measurements should be made on a separate portion of the same material with a mass of 0.6 ± 0.1g. The material should be dried before weighing for a minimum of 24 hours in a ventilated oven at 102 ± 2 oC. Cycles of drying and weighing should be repeated until a constant mass is attained. Each weighing has to be carried out after the sample has reached thermal equilibrium at room temperature in a desiccator, recommended time about 30 min. Successive weights should not differ more than 0.001 g. The loss of mass corresponds to the “dry-mass correction factor” that should be applied. 2. Digestion of the salmon (only in case the method used requires digestion) There are a variety of digestion methods, employing various combinations of acids and for which different instruments are used. • use minimum sample mass of 0.4 g. • aim is to digest the salmon material completely. • should this fail, As, Hg, Pb and Se content in the residue should be measured in order to
estimate the correction needed and its uncertainty contribution. If you require any further assistance or information, please do not hesitate to contact us. Dr. Y. Aregbe CCQM-K43 & CCQM-P39.1 co-ordinator IRMM, IM Unit 1. S. Rückold et. al. Water as a source of errors in reference materials,
Fresenius J Anal Chem (2001) 370: 189 - 193

Retieseweg 111, B-2440 Geel, Belgium Tel.: +32-(0)14-571 673 • Fax: +32-(0)14-571 865 • [email protected] • http://www.irmm.jrc.be
2. S. Rückold et. al. Determination of the contents of water and moisture in milk powder, Fresenius J Anal Chem
(2000) 368: 522 - 527

Retieseweg 111, B-2440 Geel, Belgium Tel.: +32-(0)14-571 658 • Fax: +32-(0)14-571 673 • e-mail: [email protected] • http://www.irmm.jrc.be
EUROPEAN COMMISSION DIRECTORATE GENERAL JRC JOINT RESEARCH CENTRE Institute for Reference Materials and Measurements IRMM
Geel, 1st December 2004
CCQM-K43 & CCQM-P39.1 Certification of MeHg in Salmon
Dear colleague,
You have registered for the CCQM-K43 & CCQM-P39.1 interlaboratory comparisons on on the determination of the MeHg amount content in salmon. In total, there will be 16 participants including 9 from CCQM and 7 invited experts measuring MeHg. Since you have participated in the previous pilot study on tuna fish you have already received the IRMM-670 202Hg enriched MeHg isotopic CRM. The use of the IRMM-670 solution is intended to help you applying the isotope dilution mass spectrometry (IDMS) method for the determination of the MeHg content in the salmon sample. However, the use of IRMM-670 is only recommended and is by no means mandatory. It is expected that the participants will provide experimental results according to one of the 5 approaches described below. 1- Apply a direct IDMS (equation 1) approach using the 202Hg enriched MeHg IRMM-670 as a spike solution. 2- Apply a double IDMS (equation 2) approach using the 202Hg enriched MeHg IRMM-670 as a spike solution
(and thus chose to re-characterise it). 3- Apply another method than the two above. Equation 1.
Equation 2.
Considering that the characterisation of the MeHg content in the IDMS spike material is a crucial step, we invite the ‘IDMS participants’ to apply scenario 1, to make maximum use of the of IRMM-670 solution. In this way the number of potential sources of measurement biases among participants’ results can be minimised. At the same time, applying scenario 1 facilitates the final interpretation of possibly occurring significant differences between the participants’ results. Again, it is emphasised that the participants should remain entirely free to apply the scenario they like best and/or judge most appropriate.
Yours sincerely,
Dr. Christophe Quétel Isotope Measurements Unit EC-JRC-IRMM
∑∑⋅
−⋅
⋅−⋅⋅=
Yi
Xi
XBR
BRY
X
YYX R
RRRKRKR
mmcc
B
B
)()(
YB
BZ
XB
BY
Y
Y
X
ZZX RR
RRRRRR
mm
mmCC
−−
⋅−−
⋅⋅⋅= '
'
'

Retieseweg 111, B-2440 Geel, Belgium Page 1 Tel.: +32-(0)14-571 673 • Fax: +32-(0)14-571 865 • [email protected] • http://www.irmm.jrc.be• http://www.imep.ws
GUIDELINES to Participants on Reporting Results for CCQM-K43.
Our result reporting pages will only be open from the end of January 2005, we will notify you by e-mail when these pages are available. These guidelines will explain how you can report your measurement result and uncertainty. Further guidelines on how to complete the questionnaire information will be attached in the above mentioned e-mail. Participant’s name «SURNAME» Your password key: «PARTKEY» Sample 1 code no.: «SAMPLECODE»«Next Record» Sample 2 code no: «SAMPLECODE»«Next Record» Sample 3 code no: «SAMPLECODE»«Next Record» Sample 4 code no: «SAMPLECODE»«Next Record» Amount content code no: «SAMPLECODE» The result reporting is done on the Internet, the login page is located using the following URL http://www.irmm.jrc.be/imepapp/jsp/loginResult.jsp The following information page will appear. To obtain the login page, close down this screen.

Retieseweg 111, B-2440 Geel, Belgium Page 2 Tel.: +32-(0)14-571 673 • Fax: +32-(0)14-571 865 • [email protected] • http://www.irmm.jrc.be• http://www.imep.ws
This is the login page.
Please use your allocated password key
EXAMPLE:- Password Key – AYII1892393 Your Password Key – «PARTKEY» Once you have entered your password key, press the SUBMIT button (Please note that your password key is unique to the comparison you have registered to.) The RESULT REPORT FORM
Completing the RESULT REPORTING Page. 1. Please make sure that the correct result is entered for the correct sample code and for the correct analyte. In case you don’t measure all the samples or all the analytes, please leave the corresponding fields blank. Please be aware that for each analyte at least 2 replicates from 2 bottles have to be measured. 2. Indicated on the top right hand side of the screen, shows how many pages there are.

Retieseweg 111, B-2440 Geel, Belgium Page 3 Tel.: +32-(0)14-571 673 • Fax: +32-(0)14-571 865 • [email protected] • http://www.irmm.jrc.be• http://www.imep.ws
Page 1 to 5. Per page displays the same sample code and the list of analytes. 3. For each analyte by sample code there are 2 replicates measurements: MEASUREMENT #1 and MEASUREMENT #2 Please ONLY enter information in the result field. (Leave the uncertainty and the coverage factor fields blank) Detailed information on the replicates measured needs to be included in the description of the measurement procedure that has to be sent as an attachment by email. (See also “instructions for result reporting and uncertainty evaluation”) 4. The measurement unit field has already been set. 5. In the field marked “Result value” enter your measurement result using the 2nd box to your left. 6. Select the field marked “Technique used” this will activate the drop down menu. Select the technique used. If the technique used is not listed, select the “OTHER” field and then specify When the “Technique used” field has been selected the “OTHER” field is disabled and no input can be entered. Likewise should you select the “OTHER” field then the “Technique used” field is disabled. 7. When completing the AMOUNT CONTENT on page five, in the field with your code no. «SAMPLECODE», you are required to complete ALL fields. RESULT, UNCERTAINTY and COVERAGE FACTOR. This is the overall result per analyte. Below is an example of a completed result screen for one sample and one analyte.
Once you have completed the first screen to proceed to the following screen, FIRST press the SAVE button followed by the NEXT.

Retieseweg 111, B-2440 Geel, Belgium Page 4 Tel.: +32-(0)14-571 673 • Fax: +32-(0)14-571 865 • [email protected] • http://www.irmm.jrc.be• http://www.imep.ws
SAVE – The SAVE button stores the entered data with the possibly to edit them as often as you need. To reconnect to our system use the same URL link http://www.irmm.jrc.be/imepapp/jsp/loginResult.jsp and re-supply your password key. The result form will appear with the data that has already been entered. Make the required changes and select the SAVE button. This pop up page will appear advising you that your results have been saved.
The SUBMIT button is located at the button of each page, ONLY press this button when you have entered all you data. How to SUMBIT your results Once the SUBMIT button has been pressed, the questionnaire will appear ready for your input. Guidelines on how to complete the questionnaire information will follow shortly by e-mail. Remember to submit your results before the deadline date, as ONLY submitted results will be accepted.
Retieseweg 111, B-2440 Geel, Belgium Page 1 Tel.: +32-(0)14-571 673 • Fax: +32-(0)14-571 865 • [email protected] • http://www.irmm.jrc.be• http://www.imep.ws
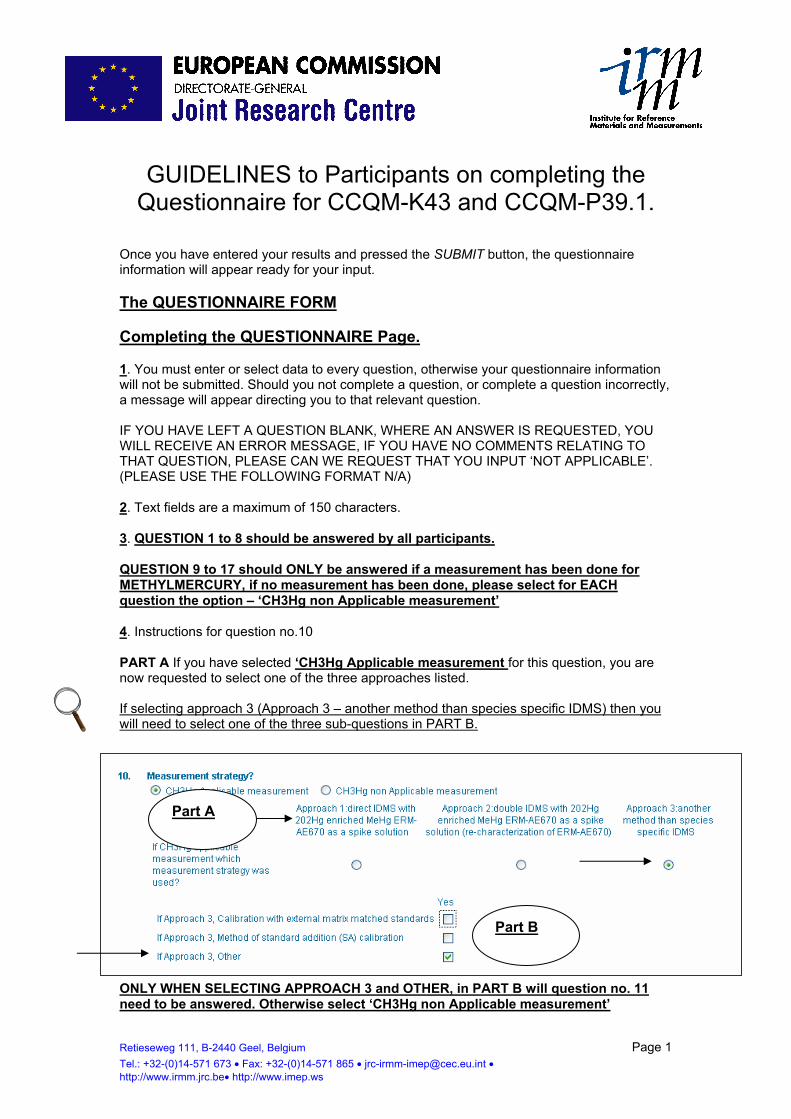
GUIDELINES to Participants on completing the Questionnaire for CCQM-K43 and CCQM-P39.1.
Once you have entered your results and pressed the SUBMIT button, the questionnaire information will appear ready for your input. The QUESTIONNAIRE FORM Completing the QUESTIONNAIRE Page. 1. You must enter or select data to every question, otherwise your questionnaire information will not be submitted. Should you not complete a question, or complete a question incorrectly, a message will appear directing you to that relevant question. IF YOU HAVE LEFT A QUESTION BLANK, WHERE AN ANSWER IS REQUESTED, YOU WILL RECEIVE AN ERROR MESSAGE, IF YOU HAVE NO COMMENTS RELATING TO THAT QUESTION, PLEASE CAN WE REQUEST THAT YOU INPUT ‘NOT APPLICABLE’. (PLEASE USE THE FOLLOWING FORMAT N/A) 2. Text fields are a maximum of 150 characters. 3. QUESTION 1 to 8 should be answered by all participants. QUESTION 9 to 17 should ONLY be answered if a measurement has been done for METHYLMERCURY, if no measurement has been done, please select for EACH question the option – ‘CH3Hg non Applicable measurement’ 4. Instructions for question no.10 PART A If you have selected ‘CH3Hg Applicable measurement for this question, you are now requested to select one of the three approaches listed. If selecting approach 3 (Approach 3 – another method than species specific IDMS) then you will need to select one of the three sub-questions in PART B.
ONLY WHEN SELECTING APPROACH 3 and OTHER, in PART B will question no. 11 need to be answered. Otherwise select ‘CH3Hg non Applicable measurement’
Part A
Part B

Retieseweg 111, B-2440 Geel, Belgium Page 2 Tel.: +32-(0)14-571 673 • Fax: +32-(0)14-571 865 • [email protected] • http://www.irmm.jrc.be• http://www.imep.ws
5. Instructions for question no.11 When PART A = approach 3 and PART B = OTHER, have been chosen. Please select ‘CH3Hg Applicable measurement’ and specify the used calibration strategy.
6. Instructions for question no.12 ONLY WHEN SELECTING APPROACH 3 and CALIBRATION WITH EXTERNAL MATRIX MATCHED STANDARDS, in PART B of question no.10, requires you to answer question no.12. Otherwise select ‘CH3Hg non Applicable measurement’
7. Instructions for question no.13 When PART A = approach 2 has been chosen in question no.10. Please select ‘CH3Hg Applicable measurement’ and specify your results for the determination of the MeHg content. Otherwise select ‘CH3Hg non Applicable measurement’ 8.Instructions for question no.15 When in PART A = approach 1 OR 2 has been chosen in question no.10. Please select ‘CH3Hg Applicable measurement’ and answer the next two questions with your comments. Otherwise select ‘CH3Hg non Applicable measurement’ Once you have completed the questionnaire, press the SUBMIT QUESTIONNAIRE button.

Retieseweg 111, B-2440 Geel, Belgium Page 3 Tel.: +32-(0)14-571 673 • Fax: +32-(0)14-571 865 • [email protected] • http://www.irmm.jrc.be• http://www.imep.ws
If you answered a question in the wrong format, or left a question blank, you will receive an error message, the system will direct you to that relevant question by adding a message in red text. Below is an example of an error message screen.
Before re-submitting your data, please make sure that the following has been applied:-
a) Ensure all questions have been completed. b) Ensure that the comment field has only been completed when asked.
When the requested changes have been made, press the SUMBIT QUESTIONNAIRE button again. If entries are acceptable by the system, the following confirmation screen will appear showing all the data entered.

Retieseweg 111, B-2440 Geel, Belgium Page 4 Tel.: +32-(0)14-571 673 • Fax: +32-(0)14-571 865 • [email protected] • http://www.irmm.jrc.be• http://www.imep.ws
Should any amendments need to be made, press the CHANGE RESULTS AND QUESTIONNAIRE button, this will return you to the previous screen. Make the required changes and submit your data again. Once again, the confirmation screen will appear, check your data again. When all data is correct, press the CONFIRM RESULTS AND QUESTIONNAIRE button. (Located at the bottom of the screen)
It is IMPORTANT that you print off your result report form, from the available print option. Please sign and fax this document to IRMM on Fax No. +32 (0)14 571 865

Retieseweg 111, B-2440 Geel, Belgium Page 5 Tel.: +32-(0)14-571 673 • Fax: +32-(0)14-571 865 • [email protected] • http://www.irmm.jrc.be• http://www.imep.ws
The final screen will conclude that your data has been accepted by IRMM, this message will appear at the top of the screen.
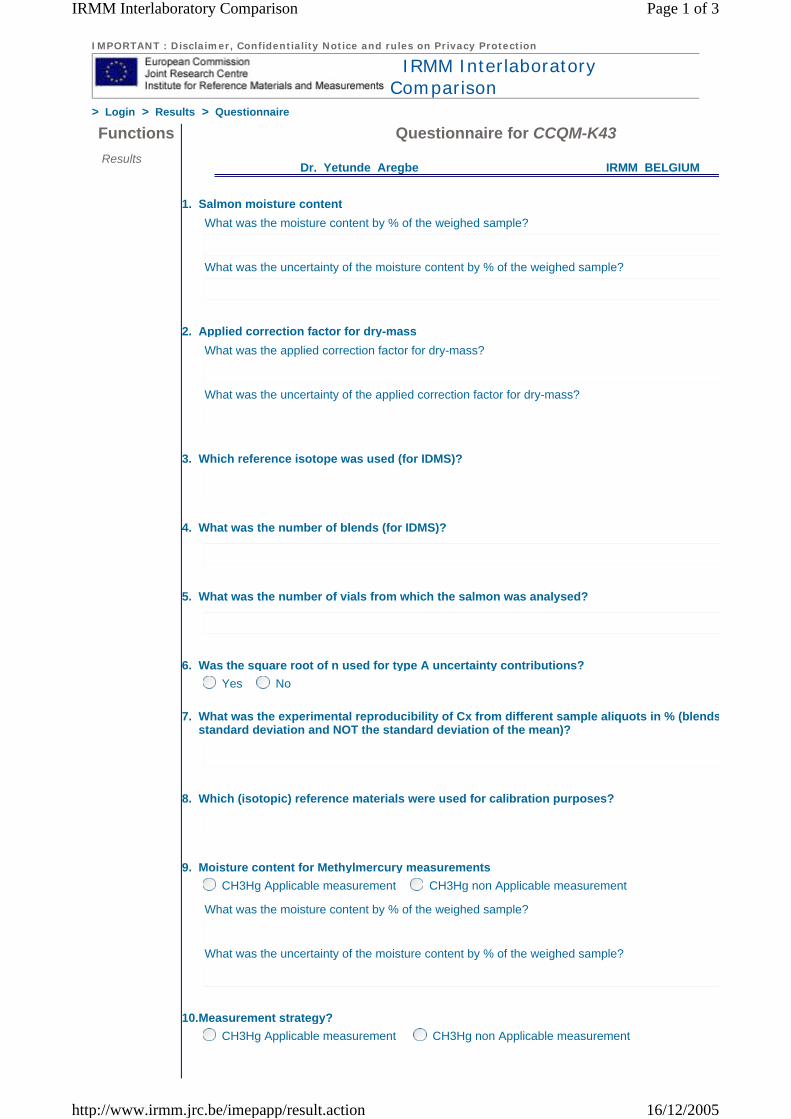
IMPORTANT : Disclaimer, Confidentiality Notice and rules on Privacy Protection IRMM Interlaboratory Comparison
> Login > Results > Questionnaire
Functions Results
Questionnaire for CCQM-K43
Dr. Yetunde Aregbe IRMM BELGIUM
1. Salmon moisture content
What was the moisture content by % of the weighed sample?
What was the uncertainty of the moisture content by % of the weighed sample?
2. Applied correction factor for dry-mass
What was the applied correction factor for dry-mass?
What was the uncertainty of the applied correction factor for dry-mass?
3. Which reference isotope was used (for IDMS)?
4. What was the number of blends (for IDMS)?
5. What was the number of vials from which the salmon was analysed?
6. Was the square root of n used for type A uncertainty contributions? Yes No 7. What was the experimental reproducibility of Cx from different sample aliquots in % (blends
standard deviation and NOT the standard deviation of the mean)?
8. Which (isotopic) reference materials were used for calibration purposes?
9. Moisture content for Methylmercury measurements CH3Hg Applicable measurement CH3Hg non Applicable measurement
What was the moisture content by % of the weighed sample?
What was the uncertainty of the moisture content by % of the weighed sample?
10.Measurement strategy? CH3Hg Applicable measurement CH3Hg non Applicable measurement
Page 1 of 3IRMM Interlaboratory Comparison
16/12/2005http://www.irmm.jrc.be/imepapp/result.action

Approach 1:direct IDMS with 202Hg enriched
MeHg ERM-AE670 as a spike solution
Approach 2:double IDMS with 202Hg enriched MeHg ERM-AE670 as a spike
solution (re-characterization of ERM-AE670)
If CH3Hg applicable measurement which measurement strategy was used?
Yes
If Approach 3, Calibration with external matrix matched standards
If Approach 3, Method of standard addition (SA) calibration
If Approach 3, Other
11.Measurement strategy continued CH3Hg Applicable measurement CH3Hg non Applicable measurement
If Approach 3 and Other is applicable, please specify the used calibration strategy
12.Internal standard? CH3Hg Applicable measurement CH3Hg non Applicable measurement
If Approach 3 and Calibration with external matrix standard was applied with an internal standard,internal standard used
13.MeHg content? CH3Hg Applicable measurement CH3Hg non Applicable measurement
In case Approach 2, was applied, please report your results for the determination of the MeHg conusing your own values for the ERM-AE 670 solution and using the values provided by IRMM for thsolution MeHg amount content (mol(CH3Hg).kg-1) obtained using own values for the ERM-AE670 solution
Uncertainty (k=2) (mol(CH3Hg).kg-1) obtained using own values for the ERM-AE670 solution
MeHg amount content (mol(CH3Hg).kg-1) obtained using the IRMM values for the ERM-AE670 so
Uncertainty (k=2) (mol(CH3Hg).kg-1) obtained using the IRMM values for the ERM-AE670 solutio
14.Measurement strategy based on SA or ID CH3Hg Applicable measurement CH3Hg non Applicable measurement
Some hours prior
to MeHg extraction
Immediately prior to MeHg
extraction
Aftprio
If a measurement strategy based on SA or ID was used which of the following options most closely fits the timing of the spike addition in your method?
15.Measurement strategy involving species specific IDMS Approaches 1 and 2 CH3Hg Applicable measurement CH3Hg non Applicable measurement
If the measurement strategy involved species specific IDMS Approaches 1 and 2, (as described inplease answer the following questions Reference isotope used during the measurements
Number of replicate blend samples prepared
Page 2 of 3IRMM Interlaboratory Comparison
16/12/2005http://www.irmm.jrc.be/imepapp/result.action

16.Measurement process CH3Hg Applicable measurement CH3Hg non Applicable measurement
Please describe briefly your measurement process by listing the types of reagents and apparatus extraction and derivatisation of MeHg in the sample Sample mass (g)
Extraction reagents (e.g. HCl, TMAH etc.)
Extraction apparatus (e.g. microwave, ultrasound bath etc.)
Derivatisation reagents (e.g. NaB(C2H5)4, Grignard etc.)
Species separation apparatus (e.g. GC, LC, column type, carrier)
Detector (e.g. CVAAS, ICP-MS etc.)
17.Experimental reproducibility CH3Hg Applicable measurement CH3Hg non Applicable measurement
What was the reproducibility of Cx from the different sample aliquots measured in % (blends in castandard deviation and NOT the standard deviation of the mean)
Clear
Submit questionnaire
This site is managed by the Informatics Unit, IRMM. Last update : 16/12/2005
Page 3 of 3IRMM Interlaboratory Comparison
16/12/2005http://www.irmm.jrc.be/imepapp/result.action