Embed Size (px)
Citation preview
CCQM-K124
Trace Elements and Chromium Speciation
in Drinking Water
Part A: Trace Elements in Drinking Water
Part B: Chromium Speciation in Drinking Water
Final Report
Coordinated by
National Metrology Institute of Japan (NMIJ)
Government Laboratory, Hong Kong SAR (GLHK)
November 2016

CCQM-K124
Part A: Trace Elements in Drinking Water
Final Report
Authors:
Takayoshi Kuroiwa, Yanbei Zhu, Kazumi Inagaki (NMIJ)1, David Saxby, Ian White, Jeffrey
Merrick (NMIA)2, Thiago Araujo, Marcelo Almeida, Jefferson Rodrigues (INMETRO)3, Lu Yang,
Indu Gedara Pihillagawa, Zoltan Mester (NRCC)4, Soraya Sandoval Riquelme, Leonardo Pérez,
Rodrigo Barriga, Claudia Núñez (ISPCH)5, Jingbo Chao, Jun Wang, Qian Wang, Naijie Shi, Hai
Lu, Panshu Song (NIM)6, Teemu Näykki, Timo Sara-Aho (SYKE)7, Guillaume LABARRAQUE,
Caroline OSTER (LNE)8, Olaf Rienitz, Reinhard Jährling, Carola Pape (PTB)9, Evgenia Lampi,
Elias Kakoulides (EXHM/GCSL-EIM)10, W H Fung, H S Chu (GLHK)11, Rosi Ketrin, Eka
Mardika, Isna Komalasari (RCChem-LIPI)12, TOM ODUOR OKUMU, JACQUELINE NJERI
KANG’IRI (KEBS)13, Yong-Hyeon Yim, Sung Woo Heo, Kyoung-Seok Lee, Jung Ki Suh,
Youngran Lim (KRISS)14, Christian Uribe, Elmer Carrasco (INACAL)15, Emma D. Tayag,
Admer Rey C. Dablio, Elyson Keith P. Encarnacion Ruth L. Damian (STD-ITDI)16, Leonid
Konopelko, Anatoli Krylov, Smirnov Vadim (VNIIM)17, Richard Shin, Sim Lay Peng, Wang Juan,
Xu Chang, Fransiska Dewi (HSA)18, Milena Horvat, Tea Zuliani (JSI)19, Sutthinun Taebunpakul,
Charun Yafa, Nattikarn Kaewkhomdee, Usana Thiengmanee (NIMT)20, Süleyman Z. CAN, Betül
ARI, Oktay CANKUR (TÜBİTAK UME)21, Elizabeth Ferreira, Ramiro Pérez (LATU)22, Stephen
E. Long, Brittany L. Kassim, Karen E. Murphy, John L. Molloy, Therese A. Butler (NIST)23
1 National Metrology Institute of Japan
2 National Measurement Institute Australia 3 National Institute of Metrology, Quality and Technology 4 National Research Council Canada 5 Instituto de Salud Publica de Chile 6 National Institute of Metrology, P.R. China 7 Finnish environment institute, laboratory 8 Laboratoire national de métrologie et d'essais 9 Physikalisch-Technische Bundesanstalt 10 National Laboratory of Chemical Metrology/ General Chemistry State Laboratories - Hellenic Institute of Metrology 11 Government Laboratory, Hong Kong 12 Research Center for Chemistry - LIPI 13 Kenya Bureau of Standards 14 Korea Research Institute of Standards and Science 15 National Institute for Quality (former name: INDECOPI) 16 Standards & Testing Division, Industrial Technology Development Institute 17 D.I. Mendeleyev Institute for Metrology 18 Health Sciences Authority 19 Jožef Stefan Institute 20 National Institute of Metrology (Thailand) 21 TÜBİTAK Ulusal Metroloji Enstitüsü 22 Laboratorio Tecnológico del Uruguay 23 National Institute of Standards and Technology
Coordinated by NMIJ
November 2016
CCQM-K124 Part A
Abstract
CCQM-K124 was an activity of the Inorganic Analysis Working Group (IAWG) and
was jointly coordinated by the National Metrology Institute of Japan (NMIJ) and the
Government Laboratory, Hong Kong SAR (GLHK). The Part A of CCQM-K124
was organized by NMIJ and trace elements in drinking water were the measurands.
The Part A of the key comparison was undertaken for NMIs and DIs to demonstrate
their capabilities in measuring part-per-billion level (in µg/kg) or part-per-million
level (in mg/kg) of trace elements in drinking water. It should also facilitate the
acquisition of claims in Calibration and Measurement Capabilities (CMCs) as
listed in Appendix C of Key Comparison Database (KCDB) under the Mutual
Recognition Arrangement of the International Committee of Weights and Measures
(CIPM MRA).
Results were submitted by 14 NMIs and nine DIs. The participants used different
measurement methods, though most of them used direct measurement using
inductively coupled plasma-optical emission spectrometry (ICP-OES), inductively
coupled plasma-mass spectrometry (ICP-MS) and high resolution ICP-MS and
isotope dilution technique with ICP-MS. Other methods were graphite furnace atomic
absorption spectrophotometry (GFAAS) and flame atomic absorption
spectrophotometry (FAAS).
The results of B, Ca, Cr, As and Cd show good agreement except some outliers.
Concerning Hg, instability was observed when the sample was stored in the light. And
some participants observed instability of Mo. Therefore, it was agreed to abandon the
Hg and Mo analysis as this sample was not satisfactory for KC.
Accounting for relative expanded uncertainty, comparability of measurement results
for each of B, Ca, Cr, As and Cd was successfully demonstrated by the participating
NMIs or DIs. Furthermore, the results of this key comparison can be utilized along
with the IAWG core capability approach.
It is expected that arsenic, boron, cadmium, calcium and chromium at mass fractions
greater than approximately 0.1 g/kg, 1 g/kg, 0.01 g/kg, 1 mg/kg and 0.1 g/kg
respectively in drinking water and similar matrices (groundwater and river water etc.)
can be determined by each participant using the same technique(s) employed for this
key comparison to achieve similar uncertainties mentioned in the present report.
CCQM-K124 Part A Page 1 of 54
Table of Content
Page
1 Introduction 2-3
2 Participating Institutes 3-4
3 Samples and Instructions to Participants 5-8
3.1 Material 5
3.2 Homogeneity and Stability Studies 5-7
3.3 Instructions to Participants 8
4 Methods of Measurement 8-10
5 Results and Discussion 11-31
5.1 General 11-19
5.2 Traceability of Calibrants used by Participants 20
5.3 Calculation of the Reference Mass Fraction Value and Associated
Uncertainties
20-25
5.4 Equivalence Statements 25-31
6 Demonstration of Core Capabilities 31
7 Conclusions 32
Appendix AI
Appendix AII
CCQM-K124 Part A Page 2 of 54
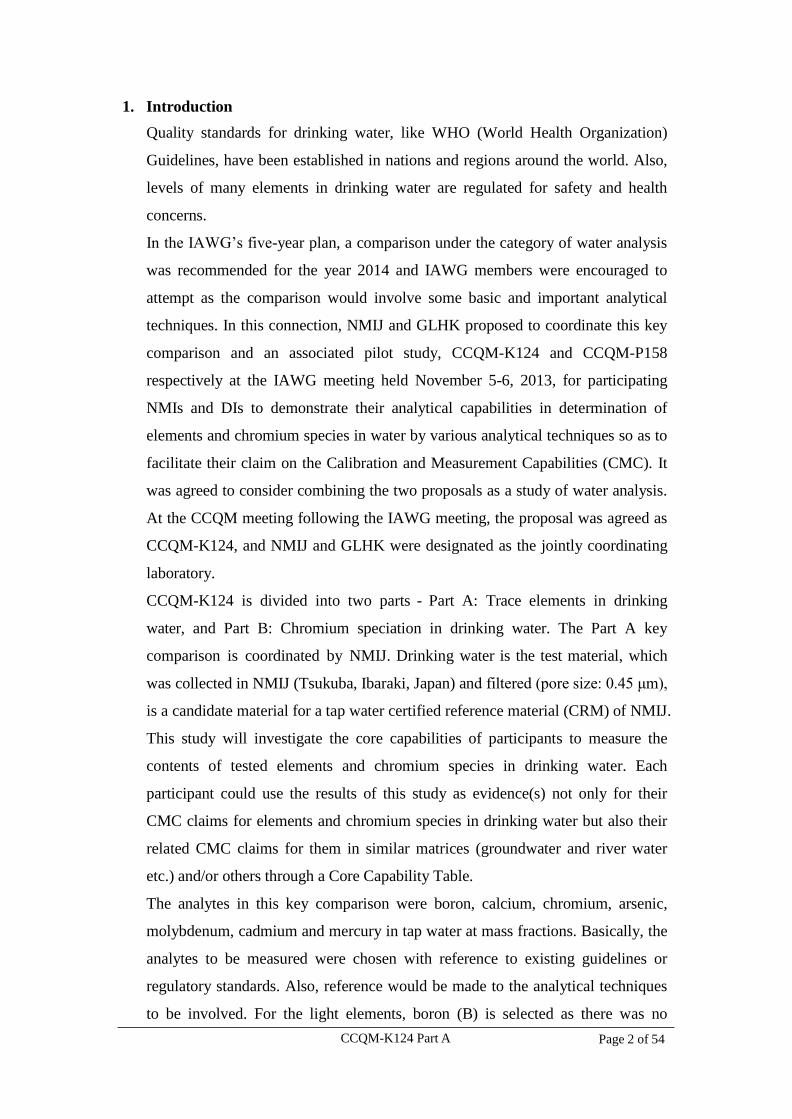
1. Introduction
Quality standards for drinking water, like WHO (World Health Organization)
Guidelines, have been established in nations and regions around the world. Also,
levels of many elements in drinking water are regulated for safety and health
concerns.
In the IAWG’s five-year plan, a comparison under the category of water analysis
was recommended for the year 2014 and IAWG members were encouraged to
attempt as the comparison would involve some basic and important analytical
techniques. In this connection, NMIJ and GLHK proposed to coordinate this key
comparison and an associated pilot study, CCQM-K124 and CCQM-P158
respectively at the IAWG meeting held November 5-6, 2013, for participating
NMIs and DIs to demonstrate their analytical capabilities in determination of
elements and chromium species in water by various analytical techniques so as to
facilitate their claim on the Calibration and Measurement Capabilities (CMC). It
was agreed to consider combining the two proposals as a study of water analysis.
At the CCQM meeting following the IAWG meeting, the proposal was agreed as
CCQM-K124, and NMIJ and GLHK were designated as the jointly coordinating
laboratory.
CCQM-K124 is divided into two parts - Part A: Trace elements in drinking
water, and Part B: Chromium speciation in drinking water. The Part A key
comparison is coordinated by NMIJ. Drinking water is the test material, which
was collected in NMIJ (Tsukuba, Ibaraki, Japan) and filtered (pore size: 0.45 μm),
is a candidate material for a tap water certified reference material (CRM) of NMIJ.
This study will investigate the core capabilities of participants to measure the
contents of tested elements and chromium species in drinking water. Each
participant could use the results of this study as evidence(s) not only for their
CMC claims for elements and chromium species in drinking water but also their
related CMC claims for them in similar matrices (groundwater and river water
etc.) and/or others through a Core Capability Table.
The analytes in this key comparison were boron, calcium, chromium, arsenic,
molybdenum, cadmium and mercury in tap water at mass fractions. Basically, the
analytes to be measured were chosen with reference to existing guidelines or
regulatory standards. Also, reference would be made to the analytical techniques
to be involved. For the light elements, boron (B) is selected as there was no
CCQM-K124 Part A Page 3 of 54
previous comparison on the determination of this element before. For the alkaline
earth metals, calcium (Ca) is selected as the ICP-MS measurement involved
would be challenging for participants. Chromium (Cr) is difficult to be measured
by ICP-MS since the spectral interference of molecular ions resulting from argon
occurs. Arsenic (As) is a mono-isotopic element, so isotope dilution mass
spectrometry (IDMS) is not applicable. Molybdenum (Mo) is one of essential
trace elements but no study for the measurement of molybdenum in water has
been undertaken. Cadmium (Cd) is a representative of elements which can be
measured by applying IDMS. Mercury (Hg) is a highly toxic element and its
property on volatility would cast problem on the determination due to memory
effect.
Each participant could use any suitable method(s) of measurement. Four
measurements of each analyte had to be carried out by each participant. Results
were submitted by 14 NMIs and nine DIs. The comparison results were discussed
at the IAWG meetings held November 17-19, 2015, April 18-19 and October 4-6,
2016.
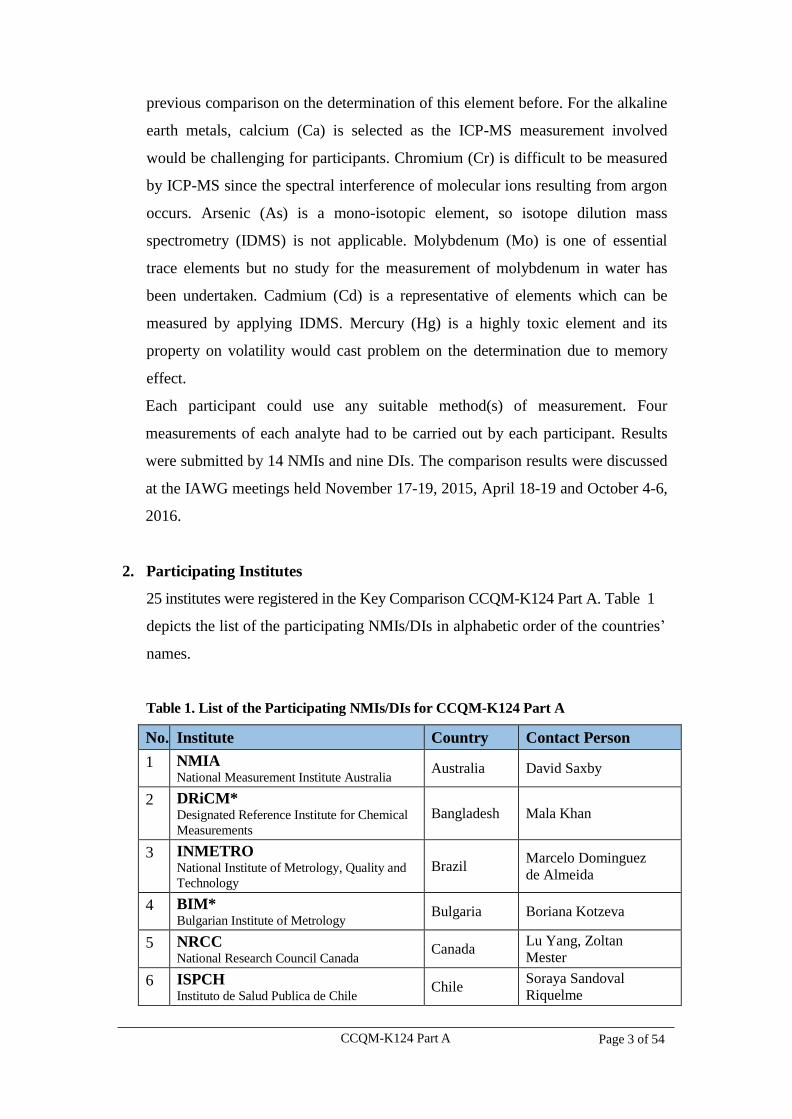
2. Participating Institutes
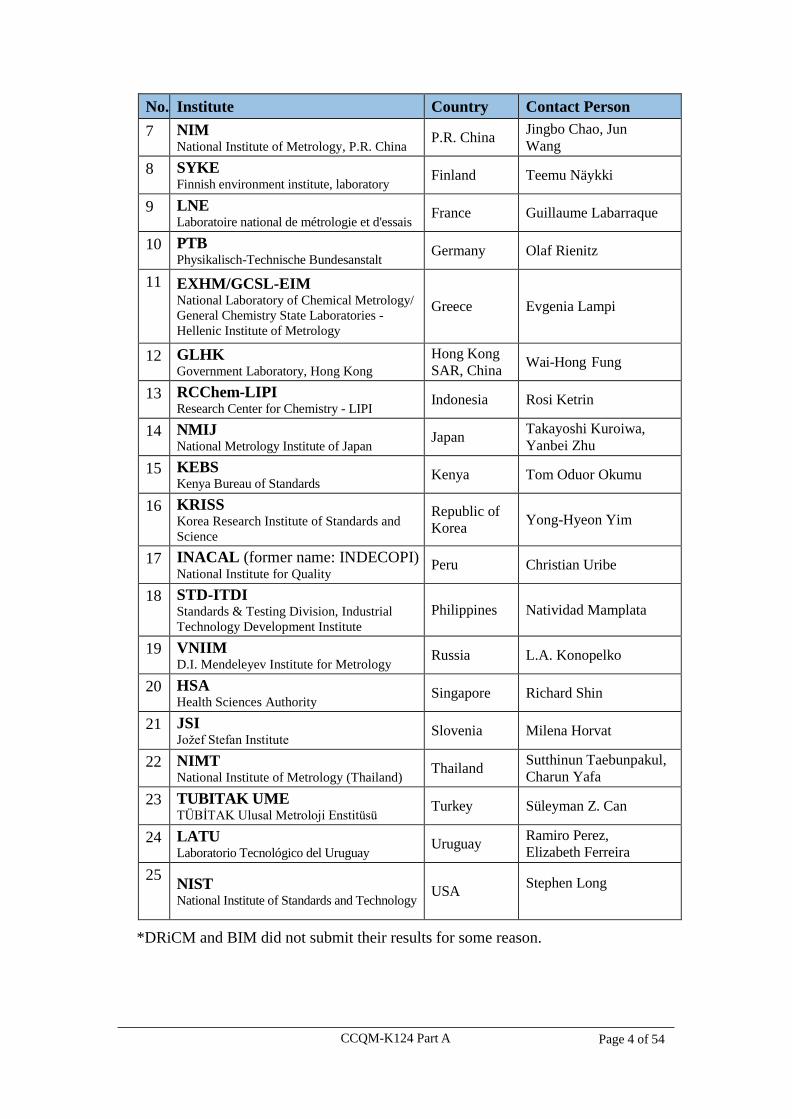
25 institutes were registered in the Key Comparison CCQM-K124 Part A. Table 1
depicts the list of the participating NMIs/DIs in alphabetic order of the countries’
names.
Table 1. List of the Participating NMIs/DIs for CCQM-K124 Part A
No. Institute Country Contact Person
1 NMIA National Measurement Institute Australia
Australia David Saxby
2 DRiCM* Designated Reference Institute for Chemical
Measurements
Bangladesh Mala Khan
3 INMETRO National Institute of Metrology, Quality and
Technology Brazil
Marcelo Dominguez
de Almeida
4 BIM* Bulgarian Institute of Metrology
Bulgaria Boriana Kotzeva
5 NRCC National Research Council Canada
Canada Lu Yang, Zoltan
Mester
6 ISPCH Instituto de Salud Publica de Chile
Chile Soraya Sandoval
Riquelme
CCQM-K124 Part A Page 4 of 54
No. Institute Country Contact Person
7 NIM National Institute of Metrology, P.R. China
P.R. China Jingbo Chao, Jun
Wang
8 SYKE Finnish environment institute, laboratory
Finland Teemu Näykki
9 LNE Laboratoire national de métrologie et d'essais
France Guillaume Labarraque
10 PTB Physikalisch-Technische Bundesanstalt
Germany Olaf Rienitz
11 EXHM/GCSL-EIM National Laboratory of Chemical Metrology/
General Chemistry State Laboratories -
Hellenic Institute of Metrology
Greece Evgenia Lampi
12 GLHK Government Laboratory, Hong Kong
Hong Kong
SAR, China Wai-Hong Fung
13 RCChem-LIPI Research Center for Chemistry - LIPI
Indonesia Rosi Ketrin
14 NMIJ National Metrology Institute of Japan
Japan Takayoshi Kuroiwa,
Yanbei Zhu
15 KEBS Kenya Bureau of Standards
Kenya Tom Oduor Okumu
16 KRISS Korea Research Institute of Standards and
Science
Republic of
Korea Yong-Hyeon Yim
17 INACAL (former name: INDECOPI) National Institute for Quality
Peru Christian Uribe
18 STD-ITDI Standards & Testing Division, Industrial
Technology Development Institute
Philippines Natividad Mamplata
19 VNIIM D.I. Mendeleyev Institute for Metrology
Russia L.A. Konopelko
20 HSA Health Sciences Authority
Singapore Richard Shin
21 JSI Jožef Stefan Institute
Slovenia Milena Horvat
22 NIMT National Institute of Metrology (Thailand)
Thailand Sutthinun Taebunpakul,
Charun Yafa
23 TUBITAK UME TÜBİTAK Ulusal Metroloji Enstitüsü
Turkey Süleyman Z. Can
24 LATU Laboratorio Tecnológico del Uruguay
Uruguay Ramiro Perez,
Elizabeth Ferreira
25 NIST National Institute of Standards and Technology
USA Stephen Long
*DRiCM and BIM did not submit their results for some reason.
CCQM-K124 Part A Page 5 of 54
3. Samples and Instructions to Participants
3.1 Material
The test material is a candidate material for a tap water certified reference
material (CRM). The tap water was collected in NMIJ (Tsukuba, Ibaraki, Japan).
The raw material was stored in a 200-L polyethylene tank after the filtration using
cartridge filter with pore sizes of 0.45 μm and of 0.2 μm, sequentially. Elemental
standards of Cd, Hg, As, Cr, Mn, and Se were added to elevate their
concentrations because the concentrations of these elements were much lower
than the target concentrations. Besides, nitric acid and hydrochloric acid were
respectively added in the raw material to ensure the stability of the elements so
that those final concentrations were adjusted to about 0.1 mol/L and 0.03 mol/L,
respectively.
The 150 L raw material was stirred for one week using a magnetic stirrer for
homogenization in a 200-L polypropylene tank. After that, the raw material was
filtered (pore size: 0.20 μm) and bottled into 125-mL polyethylene bottles by 100
mL each. These bottles were washed with an aliquot of the raw material in
advance. Each bottle of the candidate CRM was vacuum sealed in an individual
transparent plastic bag for preservation and preventing contamination from the
environment. The candidate CRM was stored at room temperature, i.e. 15 ˚C to
25 ˚C, and shielded from light. A part of the candidate CRM was used for this
comparison as the test material.
3.2 Homogeneity and Stability Studies
The homogeneity of the material was investigated by analyzing 10 random
bottles selected from the lot of 700 bottles. The test portions were analyzed using
standard addition ICP-MS. The samples were analyzed without any further
pretreatment except for the addition of standard. Each sample was analyzed at
least five times.
ANOVA technique was applied to evaluate the between bottle homogeneity
standard deviation (sbb) for each element was calculated using the equation (1)
given below in accordance with ISO Guide 35:2006 [1].
The results are shown in Table 2.
CCQM-K124 Part A Page 6 of 54
(1)
where
sbb is the between bottle homogeneity standard deviation;
MSwithin is the mean square of within bottles variance;
MSamong is the mean square of between bottles variance;
n is the number of replicates.
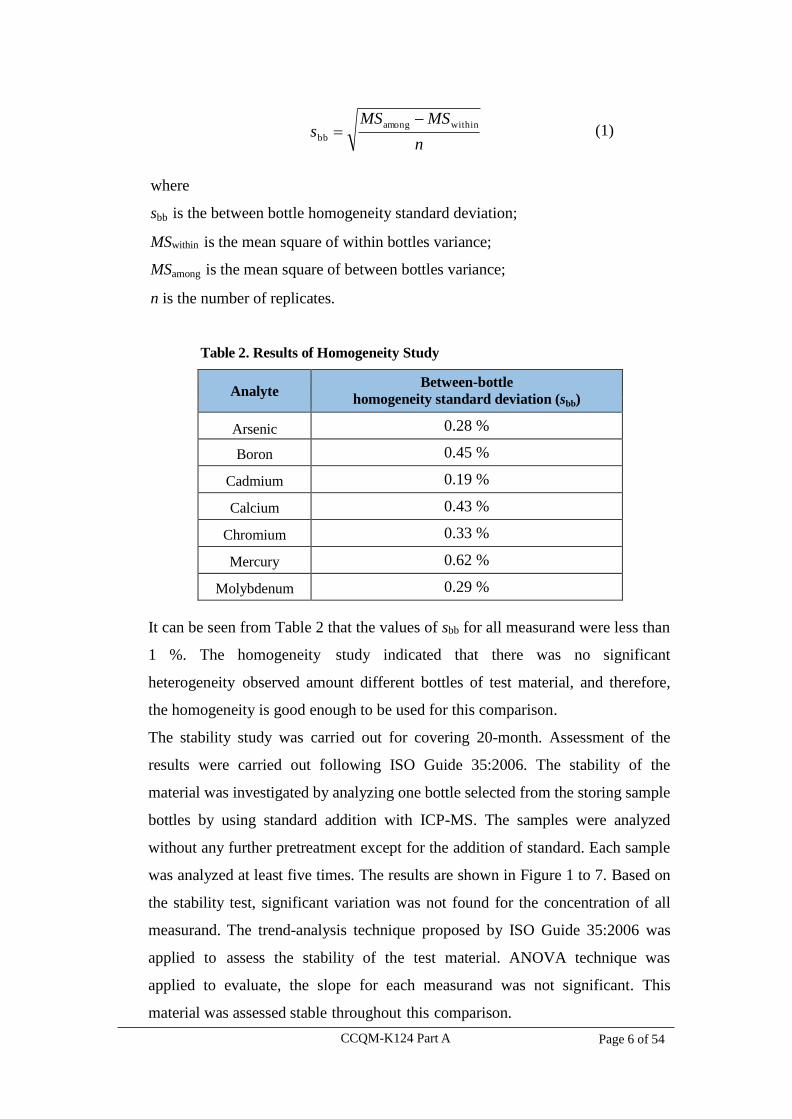
Table 2. Results of Homogeneity Study
Analyte Between-bottle
homogeneity standard deviation (sbb)
Arsenic 0.28 %
Boron 0.45 %
Cadmium 0.19 %
Calcium 0.43 %
Chromium 0.33 %
Mercury 0.62 %
Molybdenum 0.29 %
It can be seen from Table 2 that the values of sbb for all measurand were less than
1 %. The homogeneity study indicated that there was no significant
heterogeneity observed amount different bottles of test material, and therefore,
the homogeneity is good enough to be used for this comparison.
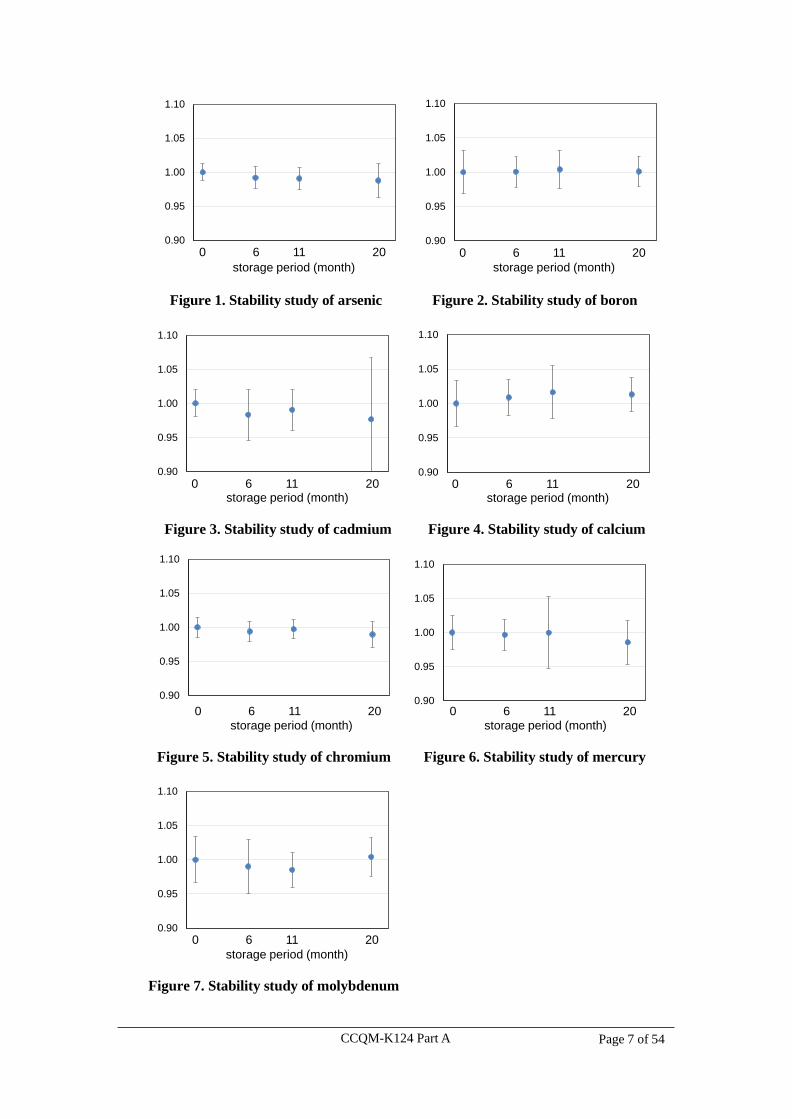
The stability study was carried out for covering 20-month. Assessment of the
results were carried out following ISO Guide 35:2006. The stability of the
material was investigated by analyzing one bottle selected from the storing sample
bottles by using standard addition with ICP-MS. The samples were analyzed
without any further pretreatment except for the addition of standard. Each sample
was analyzed at least five times. The results are shown in Figure 1 to 7. Based on
the stability test, significant variation was not found for the concentration of all
measurand. The trend-analysis technique proposed by ISO Guide 35:2006 was
applied to assess the stability of the test material. ANOVA technique was
applied to evaluate, the slope for each measurand was not significant. This
material was assessed stable throughout this comparison.
withinamong
bbn
MSMSs
CCQM-K124 Part A Page 7 of 54
Figure 1. Stability study of arsenic Figure 2. Stability study of boron
Figure 3. Stability study of cadmium Figure 4. Stability study of calcium
Figure 5. Stability study of chromium Figure 6. Stability study of mercury
Figure 7. Stability study of molybdenum
0.90
0.95
1.00
1.05
1.10
storage period (month)
0 6 11 200.90
0.95
1.00
1.05
1.10
storage period (month)
0 6 11 20
0.90
0.95
1.00
1.05
1.10
0 6 11 20storage period (month)
0 6 11 200.90
0.95
1.00
1.05
1.10
storage period (month)
0.90
0.95
1.00
1.05
1.10
storage period (month)
0 6 11 200.90
0.95
1.00
1.05
1.10
storage period (month)
0 6 11 20
0.90
0.95
1.00
1.05
1.10
storage period (month)
0 6 11 20
CCQM-K124 Part A Page 8 of 54
3.3 Instructions to Participants
Each participant received two bottles of 100 mL water sample. The samples
after receiving had to be kept at the laboratory temperature (15 °C to 25 °C).
Participants could use any analytical methods of measurement deemed
appropriate, and was requested to perform at least four independent
measurements in order to determine the mass fraction of each measurand and to
use standards with metrological traceability for calibrations of analytical
instruments.
To report the measurement results, the participants were requested to submit
the mean value of four or more independent measurement data accompanying
with the corresponding measurement uncertainty. The participants were
requested to submit their results along with information on the sample
preparation, analytical method, calculation of results, uncertainty estimation
with a full measurement uncertainty budget and sources and standards used for
calibration.
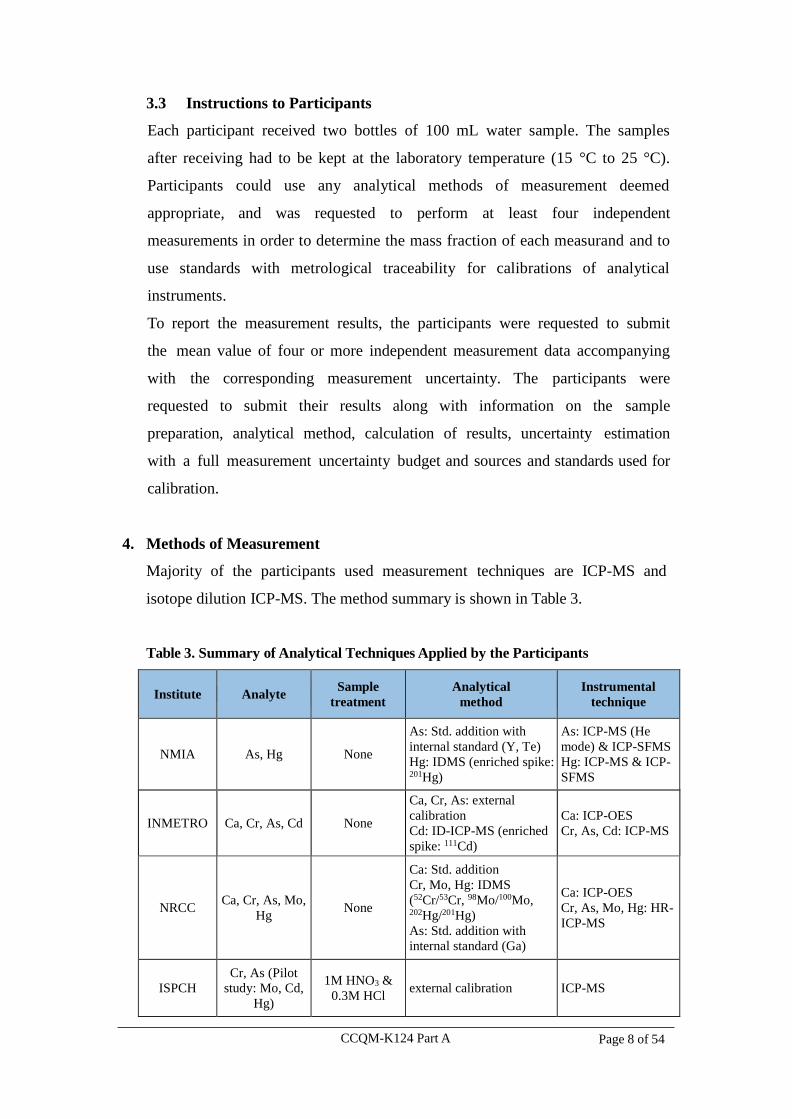
4. Methods of Measurement
Majority of the participants used measurement techniques are ICP-MS and
isotope dilution ICP-MS. The method summary is shown in Table 3.
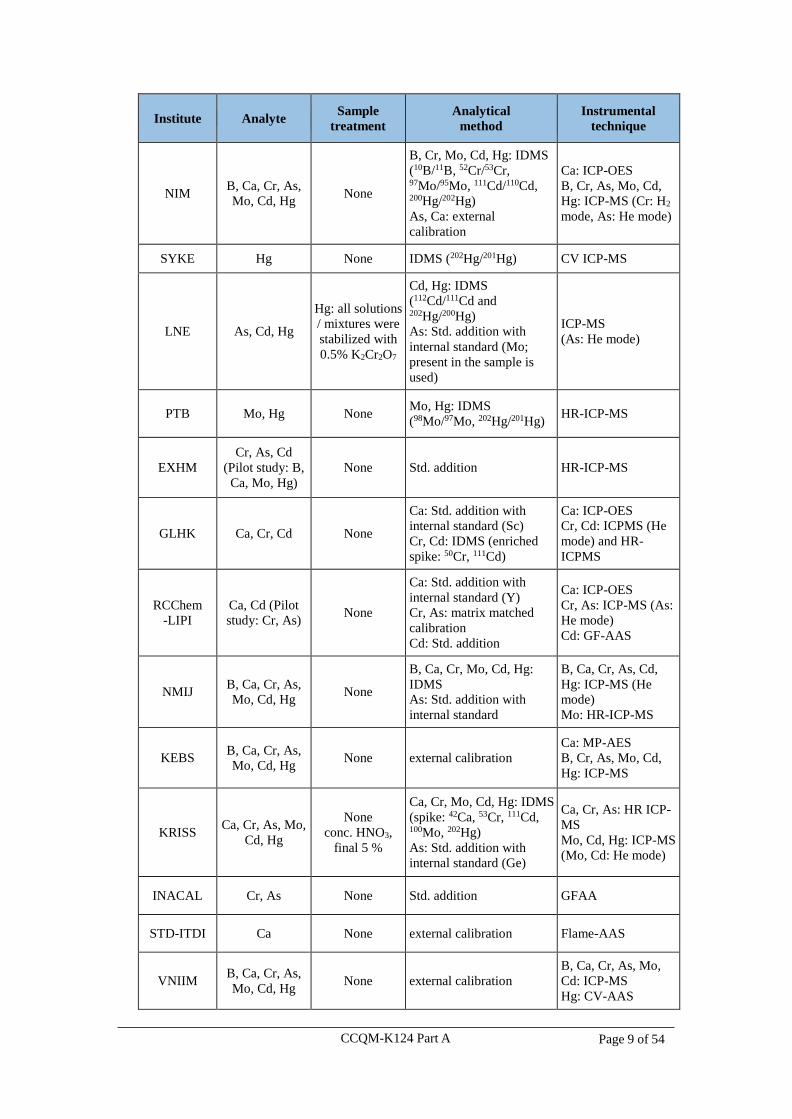
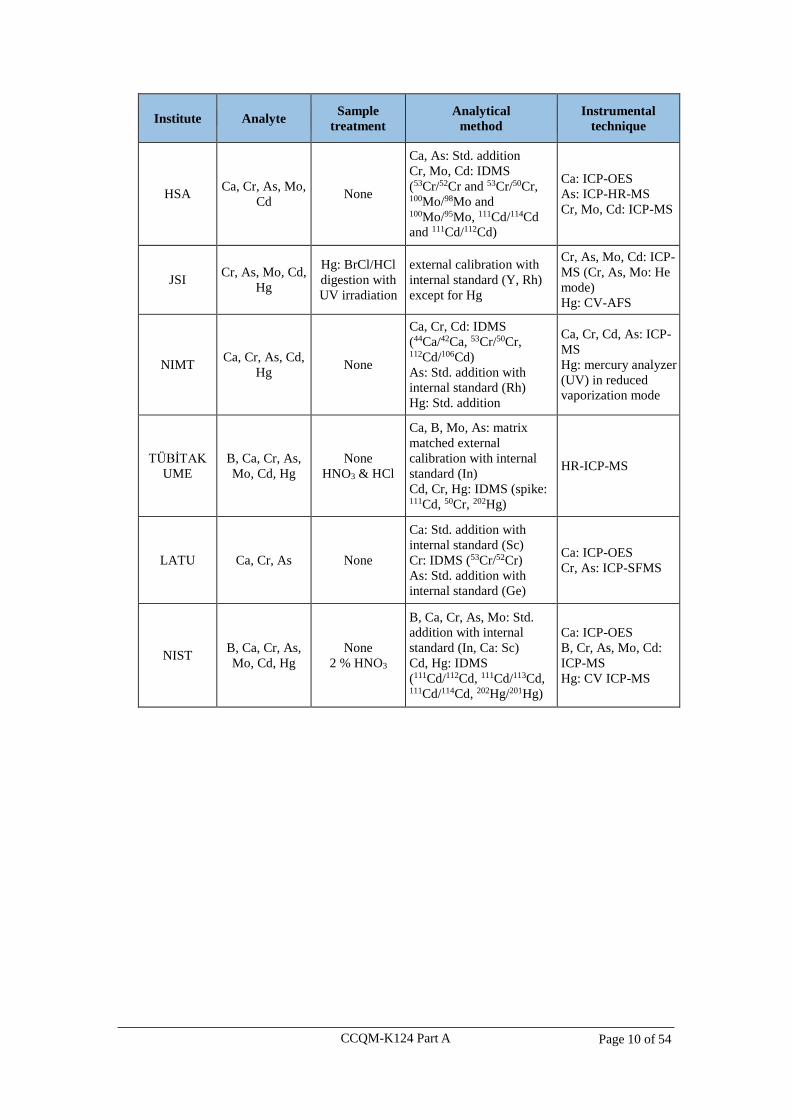
Table 3. Summary of Analytical Techniques Applied by the Participants
Institute Analyte Sample
treatment
Analytical
method
Instrumental
technique
NMIA As, Hg None
As: Std. addition with
internal standard (Y, Te)
Hg: IDMS (enriched spike: 201Hg)
As: ICP-MS (He
mode) & ICP-SFMS
Hg: ICP-MS & ICP-
SFMS
INMETRO Ca, Cr, As, Cd None
Ca, Cr, As: external
calibration
Cd: ID-ICP-MS (enriched
spike: 111Cd)
Ca: ICP-OES
Cr, As, Cd: ICP-MS
NRCC Ca, Cr, As, Mo,
Hg None
Ca: Std. addition
Cr, Mo, Hg: IDMS
(52Cr/53Cr, 98Mo/100Mo, 202Hg/201Hg)
As: Std. addition with
internal standard (Ga)
Ca: ICP-OES
Cr, As, Mo, Hg: HR-
ICP-MS
ISPCH
Cr, As (Pilot
study: Mo, Cd,
Hg)
1M HNO3 &
0.3M HCl external calibration ICP-MS
CCQM-K124 Part A Page 9 of 54
Institute Analyte Sample
treatment
Analytical
method
Instrumental
technique
NIM B, Ca, Cr, As,
Mo, Cd, Hg None
B, Cr, Mo, Cd, Hg: IDMS
(10B/11B, 52Cr/53Cr, 97Mo/95Mo, 111Cd/110Cd, 200Hg/202Hg)
As, Ca: external
calibration
Ca: ICP-OES
B, Cr, As, Mo, Cd,
Hg: ICP-MS (Cr: H2
mode, As: He mode)
SYKE Hg None IDMS (202Hg/201Hg) CV ICP-MS
LNE As, Cd, Hg
Hg: all solutions
/ mixtures were
stabilized with
0.5% K2Cr2O7
Cd, Hg: IDMS
(112Cd/111Cd and 202Hg/200Hg)
As: Std. addition with
internal standard (Mo;
present in the sample is
used)
ICP-MS
(As: He mode)
PTB Mo, Hg None Mo, Hg: IDMS
(98Mo/97Mo, 202Hg/201Hg) HR-ICP-MS
EXHM
Cr, As, Cd
(Pilot study: B,
Ca, Mo, Hg)
None Std. addition HR-ICP-MS
GLHK Ca, Cr, Cd None
Ca: Std. addition with
internal standard (Sc)
Cr, Cd: IDMS (enriched
spike: 50Cr, 111Cd)
Ca: ICP-OES
Cr, Cd: ICPMS (He
mode) and HR-
ICPMS
RCChem
-LIPI
Ca, Cd (Pilot
study: Cr, As) None
Ca: Std. addition with
internal standard (Y)
Cr, As: matrix matched
calibration
Cd: Std. addition
Ca: ICP-OES
Cr, As: ICP-MS (As:
He mode)
Cd: GF-AAS
NMIJ B, Ca, Cr, As,
Mo, Cd, Hg None
B, Ca, Cr, Mo, Cd, Hg:
IDMS
As: Std. addition with
internal standard
B, Ca, Cr, As, Cd,
Hg: ICP-MS (He
mode)
Mo: HR-ICP-MS
KEBS B, Ca, Cr, As,
Mo, Cd, Hg None external calibration
Ca: MP-AES
B, Cr, As, Mo, Cd,
Hg: ICP-MS
KRISS Ca, Cr, As, Mo,
Cd, Hg
None
conc. HNO3,
final 5 %
Ca, Cr, Mo, Cd, Hg: IDMS
(spike: 42Ca, 53Cr, 111Cd, 100Mo, 202Hg)
As: Std. addition with
internal standard (Ge)
Ca, Cr, As: HR ICP-
MS
Mo, Cd, Hg: ICP-MS
(Mo, Cd: He mode)
INACAL Cr, As None Std. addition GFAA
STD-ITDI Ca None external calibration Flame-AAS
VNIIM B, Ca, Cr, As,
Mo, Cd, Hg None external calibration
B, Ca, Cr, As, Mo,
Cd: ICP-MS
Hg: CV-AAS
CCQM-K124 Part A Page 10 of 54
Institute Analyte Sample
treatment
Analytical
method
Instrumental
technique
HSA Ca, Cr, As, Mo,
Cd None
Ca, As: Std. addition
Cr, Mo, Cd: IDMS
(53Cr/52Cr and 53Cr/50Cr, 100Mo/98Mo and 100Mo/95Mo, 111Cd/114Cd
and 111Cd/112Cd)
Ca: ICP-OES
As: ICP-HR-MS
Cr, Mo, Cd: ICP-MS
JSI Cr, As, Mo, Cd,
Hg
Hg: BrCl/HCl
digestion with
UV irradiation
external calibration with
internal standard (Y, Rh)
except for Hg
Cr, As, Mo, Cd: ICP-
MS (Cr, As, Mo: He
mode)
Hg: CV-AFS
NIMT Ca, Cr, As, Cd,
Hg None
Ca, Cr, Cd: IDMS
(44Ca/42Ca, 53Cr/50Cr, 112Cd/106Cd)
As: Std. addition with
internal standard (Rh)
Hg: Std. addition
Ca, Cr, Cd, As: ICP-
MS
Hg: mercury analyzer
(UV) in reduced
vaporization mode
TÜBİTAK
UME
B, Ca, Cr, As,
Mo, Cd, Hg
None
HNO3 & HCl
Ca, B, Mo, As: matrix
matched external
calibration with internal
standard (In)
Cd, Cr, Hg: IDMS (spike: 111Cd, 50Cr, 202Hg)
HR-ICP-MS
LATU Ca, Cr, As None
Ca: Std. addition with
internal standard (Sc)
Cr: IDMS (53Cr/52Cr)
As: Std. addition with
internal standard (Ge)
Ca: ICP-OES
Cr, As: ICP-SFMS
NIST B, Ca, Cr, As,
Mo, Cd, Hg
None
2 % HNO3
B, Ca, Cr, As, Mo: Std.
addition with internal
standard (In, Ca: Sc)
Cd, Hg: IDMS
(111Cd/112Cd, 111Cd/113Cd, 111Cd/114Cd, 202Hg/201Hg)
Ca: ICP-OES
B, Cr, As, Mo, Cd:
ICP-MS
Hg: CV ICP-MS
CCQM-K124 Part A Page 11 of 54
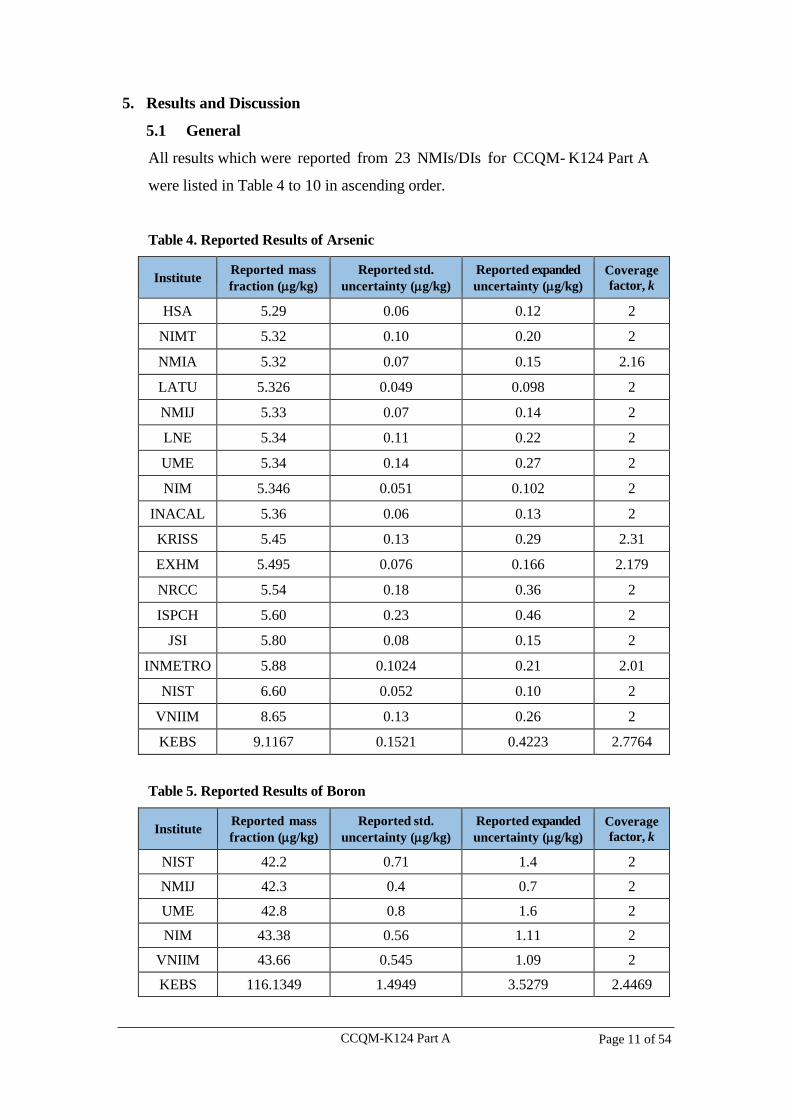
5. Results and Discussion
5.1 General
All results which were reported from 23 NMIs/DIs for CCQM- K124 Part A
were listed in Table 4 to 10 in ascending order.
Table 4. Reported Results of Arsenic
Institute Reported mass
fraction (g/kg)
Reported std.
uncertainty (g/kg)
Reported expanded
uncertainty (g/kg)
Coverage
factor, k
HSA 5.29 0.06 0.12 2
NIMT 5.32 0.10 0.20 2
NMIA 5.32 0.07 0.15 2.16
LATU 5.326 0.049 0.098 2
NMIJ 5.33 0.07 0.14 2
LNE 5.34 0.11 0.22 2
UME 5.34 0.14 0.27 2
NIM 5.346 0.051 0.102 2
INACAL 5.36 0.06 0.13 2
KRISS 5.45 0.13 0.29 2.31
EXHM 5.495 0.076 0.166 2.179
NRCC 5.54 0.18 0.36 2
ISPCH 5.60 0.23 0.46 2
JSI 5.80 0.08 0.15 2
INMETRO 5.88 0.1024 0.21 2.01
NIST 6.60 0.052 0.10 2
VNIIM 8.65 0.13 0.26 2
KEBS 9.1167 0.1521 0.4223 2.7764
Table 5. Reported Results of Boron
Institute Reported mass
fraction (g/kg)
Reported std.
uncertainty (g/kg)
Reported expanded
uncertainty (g/kg)
Coverage
factor, k
NIST 42.2 0.71 1.4 2 NMIJ 42.3 0.4 0.7 2 UME 42.8 0.8 1.6 2 NIM 43.38 0.56 1.11 2
VNIIM 43.66 0.545 1.09 2 KEBS 116.1349 1.4949 3.5279 2.4469
CCQM-K124 Part A Page 12 of 54
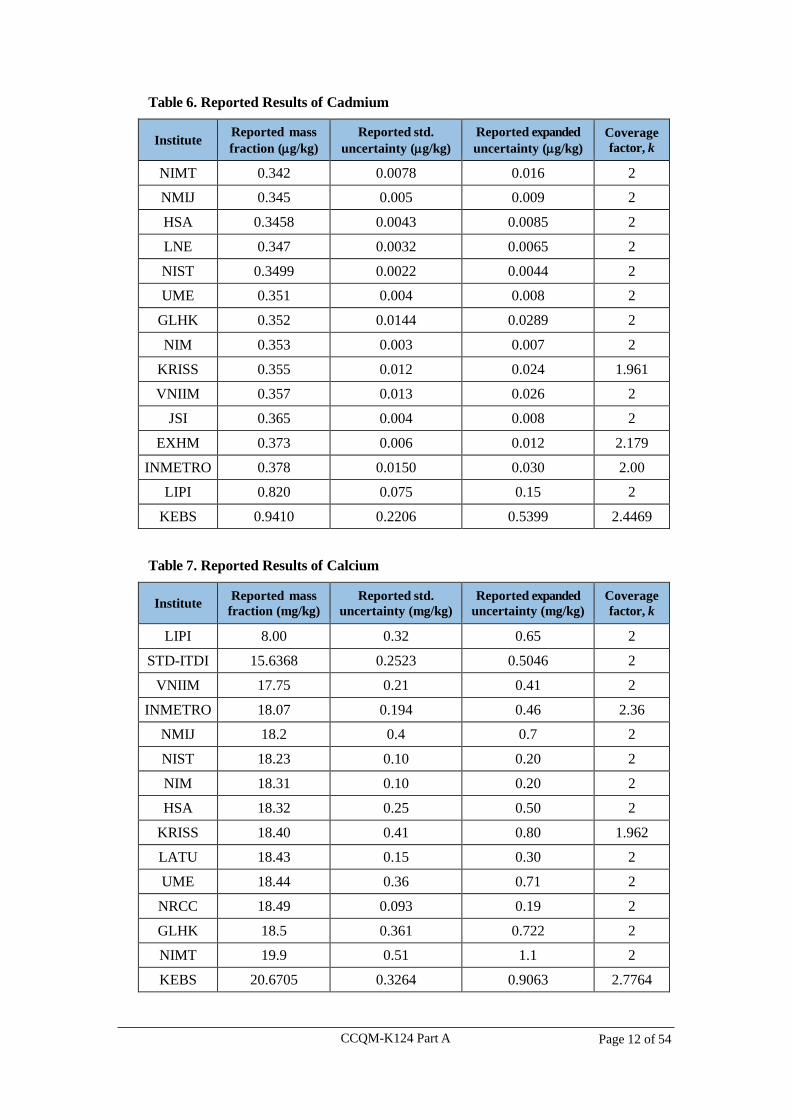
Table 6. Reported Results of Cadmium
Institute Reported mass
fraction (g/kg)
Reported std.
uncertainty (g/kg)
Reported expanded
uncertainty (g/kg)
Coverage
factor, k
NIMT 0.342 0.0078 0.016 2
NMIJ 0.345 0.005 0.009 2
HSA 0.3458 0.0043 0.0085 2
LNE 0.347 0.0032 0.0065 2
NIST 0.3499 0.0022 0.0044 2
UME 0.351 0.004 0.008 2
GLHK 0.352 0.0144 0.0289 2
NIM 0.353 0.003 0.007 2
KRISS 0.355 0.012 0.024 1.961
VNIIM 0.357 0.013 0.026 2
JSI 0.365 0.004 0.008 2
EXHM 0.373 0.006 0.012 2.179
INMETRO 0.378 0.0150 0.030 2.00
LIPI 0.820 0.075 0.15 2
KEBS 0.9410 0.2206 0.5399 2.4469
Table 7. Reported Results of Calcium
Institute Reported mass
fraction (mg/kg)
Reported std.
uncertainty (mg/kg)
Reported expanded
uncertainty (mg/kg)
Coverage
factor, k
LIPI 8.00 0.32 0.65 2 STD-ITDI 15.6368 0.2523 0.5046 2
VNIIM 17.75 0.21 0.41 2 INMETRO 18.07 0.194 0.46 2.36
NMIJ 18.2 0.4 0.7 2 NIST 18.23 0.10 0.20 2 NIM 18.31 0.10 0.20 2 HSA 18.32 0.25 0.50 2
KRISS 18.40 0.41 0.80 1.962 LATU 18.43 0.15 0.30 2 UME 18.44 0.36 0.71 2
NRCC 18.49 0.093 0.19 2 GLHK 18.5 0.361 0.722 2 NIMT 19.9 0.51 1.1 2 KEBS 20.6705 0.3264 0.9063 2.7764
CCQM-K124 Part A Page 13 of 54
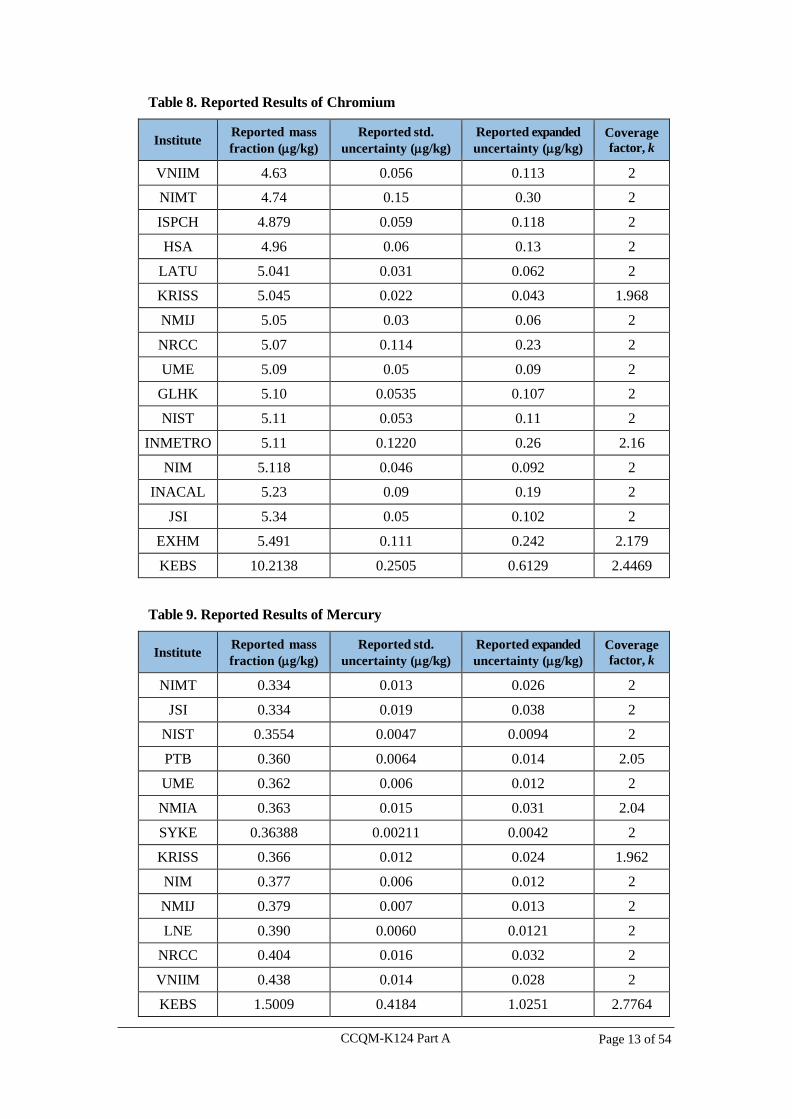
Table 8. Reported Results of Chromium
Institute Reported mass
fraction (g/kg)
Reported std.
uncertainty (g/kg)
Reported expanded
uncertainty (g/kg)
Coverage
factor, k
VNIIM 4.63 0.056 0.113 2
NIMT 4.74 0.15 0.30 2
ISPCH 4.879 0.059 0.118 2
HSA 4.96 0.06 0.13 2
LATU 5.041 0.031 0.062 2
KRISS 5.045 0.022 0.043 1.968
NMIJ 5.05 0.03 0.06 2
NRCC 5.07 0.114 0.23 2
UME 5.09 0.05 0.09 2
GLHK 5.10 0.0535 0.107 2
NIST 5.11 0.053 0.11 2
INMETRO 5.11 0.1220 0.26 2.16
NIM 5.118 0.046 0.092 2
INACAL 5.23 0.09 0.19 2
JSI 5.34 0.05 0.102 2
EXHM 5.491 0.111 0.242 2.179
KEBS 10.2138 0.2505 0.6129 2.4469
Table 9. Reported Results of Mercury
Institute Reported mass
fraction (g/kg)
Reported std.
uncertainty (g/kg)
Reported expanded
uncertainty (g/kg)
Coverage
factor, k
NIMT 0.334 0.013 0.026 2
JSI 0.334 0.019 0.038 2
NIST 0.3554 0.0047 0.0094 2
PTB 0.360 0.0064 0.014 2.05
UME 0.362 0.006 0.012 2
NMIA 0.363 0.015 0.031 2.04
SYKE 0.36388 0.00211 0.0042 2
KRISS 0.366 0.012 0.024 1.962
NIM 0.377 0.006 0.012 2
NMIJ 0.379 0.007 0.013 2
LNE 0.390 0.0060 0.0121 2
NRCC 0.404 0.016 0.032 2
VNIIM 0.438 0.014 0.028 2
KEBS 1.5009 0.4184 1.0251 2.7764
CCQM-K124 Part A Page 14 of 54
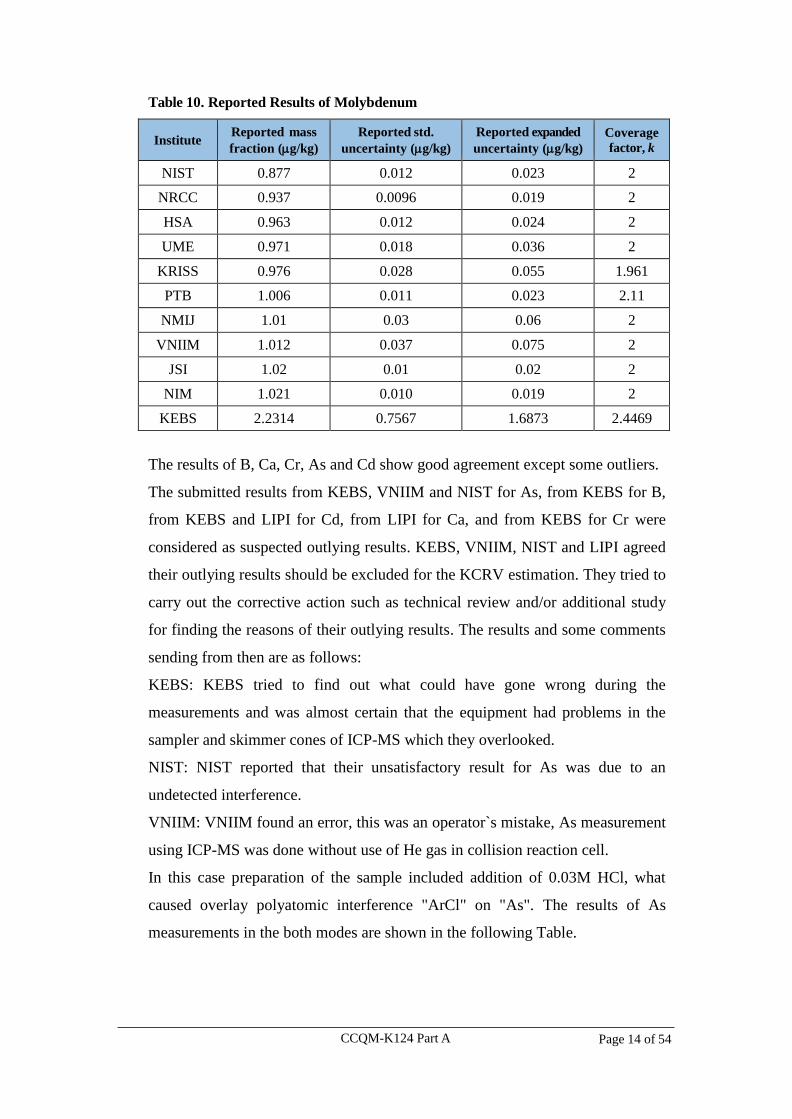
Table 10. Reported Results of Molybdenum
Institute Reported mass
fraction (g/kg)
Reported std.
uncertainty (g/kg)
Reported expanded
uncertainty (g/kg)
Coverage
factor, k
NIST 0.877 0.012 0.023 2
NRCC 0.937 0.0096 0.019 2
HSA 0.963 0.012 0.024 2
UME 0.971 0.018 0.036 2
KRISS 0.976 0.028 0.055 1.961
PTB 1.006 0.011 0.023 2.11
NMIJ 1.01 0.03 0.06 2
VNIIM 1.012 0.037 0.075 2
JSI 1.02 0.01 0.02 2
NIM 1.021 0.010 0.019 2
KEBS 2.2314 0.7567 1.6873 2.4469
The results of B, Ca, Cr, As and Cd show good agreement except some outliers.
The submitted results from KEBS, VNIIM and NIST for As, from KEBS for B,
from KEBS and LIPI for Cd, from LIPI for Ca, and from KEBS for Cr were
considered as suspected outlying results. KEBS, VNIIM, NIST and LIPI agreed
their outlying results should be excluded for the KCRV estimation. They tried to
carry out the corrective action such as technical review and/or additional study
for finding the reasons of their outlying results. The results and some comments
sending from then are as follows:
KEBS: KEBS tried to find out what could have gone wrong during the
measurements and was almost certain that the equipment had problems in the
sampler and skimmer cones of ICP-MS which they overlooked.
NIST: NIST reported that their unsatisfactory result for As was due to an
undetected interference.
VNIIM: VNIIM found an error, this was an operator`s mistake, As measurement
using ICP-MS was done without use of He gas in collision reaction cell.
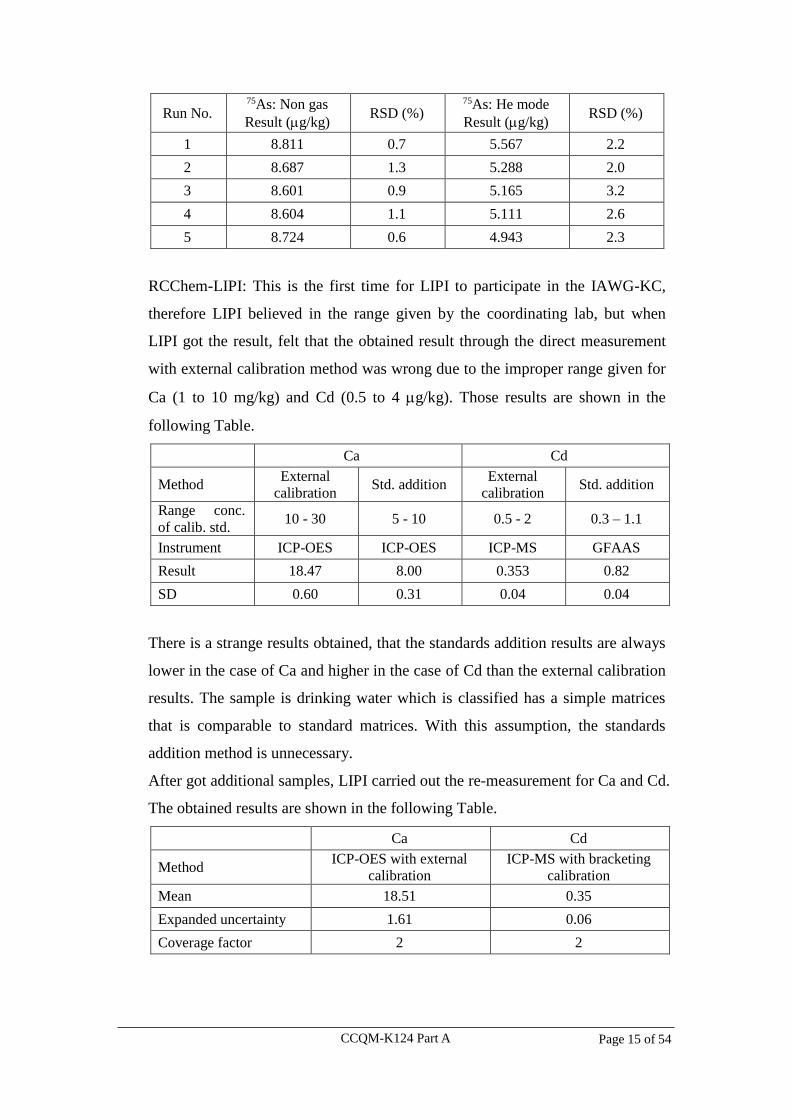
In this case preparation of the sample included addition of 0.03M HCl, what
caused overlay polyatomic interference "ArCl" on "As". The results of As
measurements in the both modes are shown in the following Table.
CCQM-K124 Part A Page 15 of 54
Run No. 75As: Non gas
Result (g/kg) RSD (%)
75As: He mode
Result (g/kg) RSD (%)
1 8.811 0.7 5.567 2.2
2 8.687 1.3 5.288 2.0
3 8.601 0.9 5.165 3.2
4 8.604 1.1 5.111 2.6
5 8.724 0.6 4.943 2.3
RCChem-LIPI: This is the first time for LIPI to participate in the IAWG-KC,
therefore LIPI believed in the range given by the coordinating lab, but when
LIPI got the result, felt that the obtained result through the direct measurement
with external calibration method was wrong due to the improper range given for
Ca (1 to 10 mg/kg) and Cd (0.5 to 4 g/kg). Those results are shown in the
following Table.
Ca Cd
Method External
calibration Std. addition
External
calibration Std. addition
Range conc.
of calib. std. 10 - 30 5 - 10 0.5 - 2 0.3 – 1.1
Instrument ICP-OES ICP-OES ICP-MS GFAAS
Result 18.47 8.00 0.353 0.82
SD 0.60 0.31 0.04 0.04
There is a strange results obtained, that the standards addition results are always
lower in the case of Ca and higher in the case of Cd than the external calibration
results. The sample is drinking water which is classified has a simple matrices
that is comparable to standard matrices. With this assumption, the standards
addition method is unnecessary.
After got additional samples, LIPI carried out the re-measurement for Ca and Cd.
The obtained results are shown in the following Table.
Ca Cd
Method ICP-OES with external
calibration
ICP-MS with bracketing
calibration
Mean 18.51 0.35
Expanded uncertainty 1.61 0.06
Coverage factor 2 2
CCQM-K124 Part A Page 16 of 54
Though the stability testing, NMIJ found that the concentration of Hg decreased
when the sample stored in the light. Hg instability was also reported from NMIA
who had noticed significant differences in Hg concentration between all four of
the bottles analyzed and changes in Hg concentration with time. It may be
occurred that Hg ions became reduced to Hg (0) by a photo-reaction. In NMIJ’s
homogeneity and stability testing, the sample bottles were stored in a dark place
at room temperature, and Hg was measured just after open the bottles. NMIJ did
not noticed regarding a light reaction when the sample was sent, because we
found this phenomena at the last stability testing (October, 2015). It was agreed
to abandon the Hg analysis as it was not satisfactory for a KC.
NRCC suggested instability of Mo in the sample. NRCC reported that the repeat
analysis of Mo concentration of solution remaining in the two sample bottles
showed a significant Mo loss since previous analyses but more importantly,
significantly different losses in Mo between the two bottles.
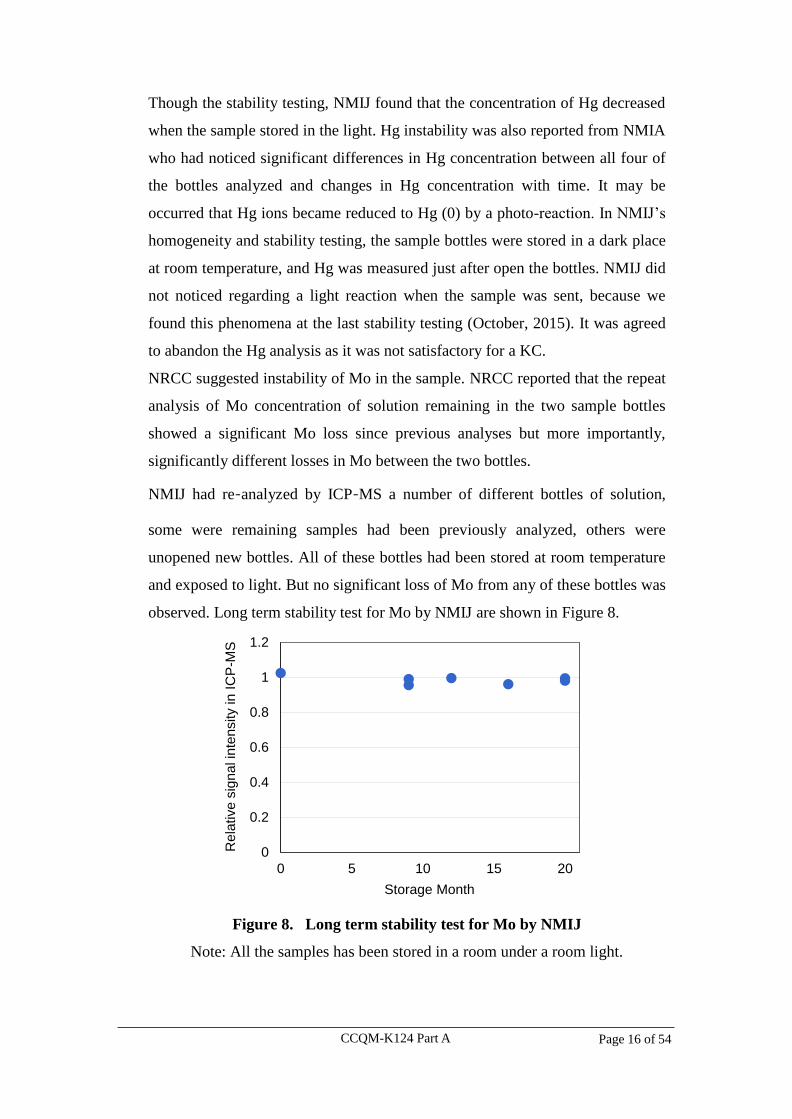
NMIJ had re-analyzed by ICP-MS a number of different bottles of solution,
some were remaining samples had been previously analyzed, others were
unopened new bottles. All of these bottles had been stored at room temperature
and exposed to light. But no significant loss of Mo from any of these bottles was
observed. Long term stability test for Mo by NMIJ are shown in Figure 8.
Figure 8. Long term stability test for Mo by NMIJ
Note: All the samples has been stored in a room under a room light.
Storage Month
Re
lative
sig
na
l in
ten
sity in
IC
P-M
S
0
0.2
0.4
0.6
0.8
1
1.2
0 5 10 15 20
CCQM-K124 Part A Page 17 of 54
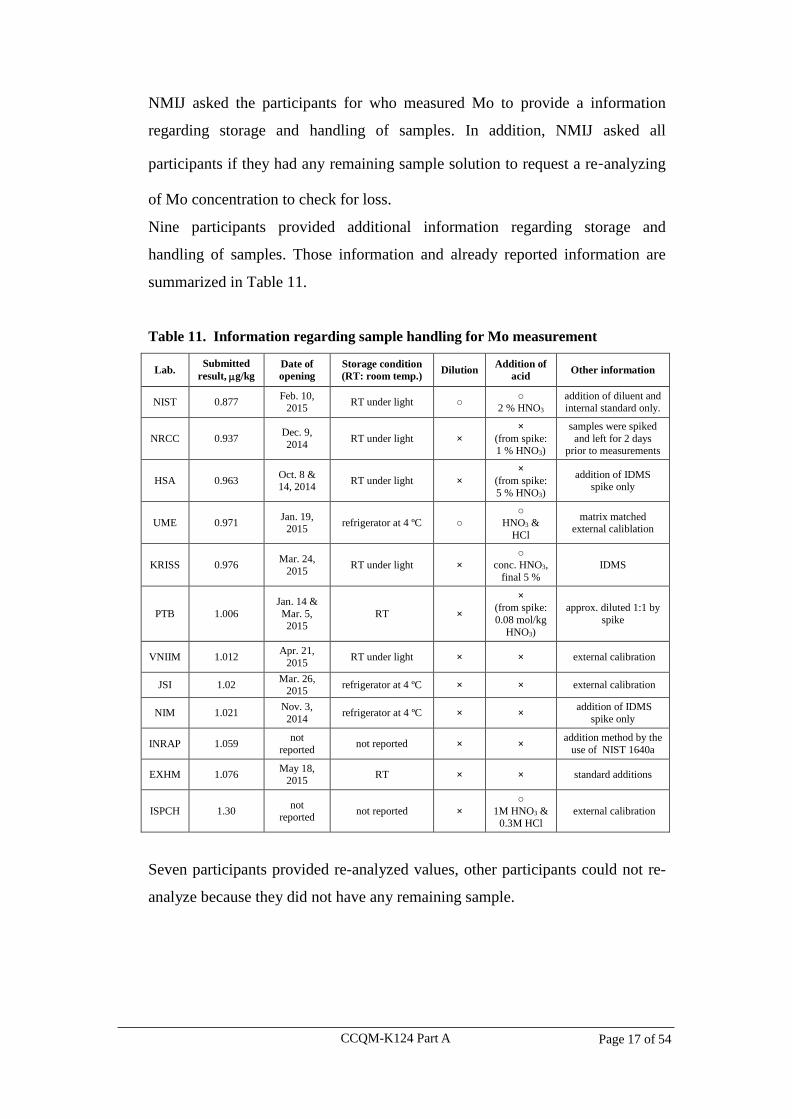
NMIJ asked the participants for who measured Mo to provide a information
regarding storage and handling of samples. In addition, NMIJ asked all
participants if they had any remaining sample solution to request a re-analyzing
of Mo concentration to check for loss.
Nine participants provided additional information regarding storage and
handling of samples. Those information and already reported information are
summarized in Table 11.
Table 11. Information regarding sample handling for Mo measurement
Lab. Submitted
result, g/kg
Date of
opening
Storage condition
(RT: room temp.) Dilution
Addition of
acid Other information
NIST 0.877 Feb. 10,
2015 RT under light ○
○ 2 % HNO3
addition of diluent and internal standard only.
NRCC 0.937 Dec. 9,
2014 RT under light ×
×
(from spike: 1 % HNO3)
samples were spiked
and left for 2 days prior to measurements
HSA 0.963 Oct. 8 & 14, 2014
RT under light × ×
(from spike:
5 % HNO3)
addition of IDMS spike only
UME 0.971 Jan. 19,
2015 refrigerator at 4 ºC ○
○
HNO3 &
HCl
matrix matched external caliblation
KRISS 0.976 Mar. 24,
2015 RT under light ×
○ conc. HNO3,
final 5 %
IDMS
PTB 1.006
Jan. 14 &
Mar. 5, 2015
RT ×
× (from spike:
0.08 mol/kg
HNO3)
approx. diluted 1:1 by
spike
VNIIM 1.012 Apr. 21,
2015 RT under light × × external calibration
JSI 1.02 Mar. 26,
2015 refrigerator at 4 ºC × × external calibration
NIM 1.021 Nov. 3,
2014 refrigerator at 4 ºC × ×
addition of IDMS
spike only
INRAP 1.059 not
reported not reported × ×
addition method by the
use of NIST 1640a
EXHM 1.076 May 18,
2015 RT × × standard additions
ISPCH 1.30 not
reported not reported ×
○
1M HNO3 &
0.3M HCl
external calibration
Seven participants provided re-analyzed values, other participants could not re-
analyze because they did not have any remaining sample.
CCQM-K124 Part A Page 18 of 54
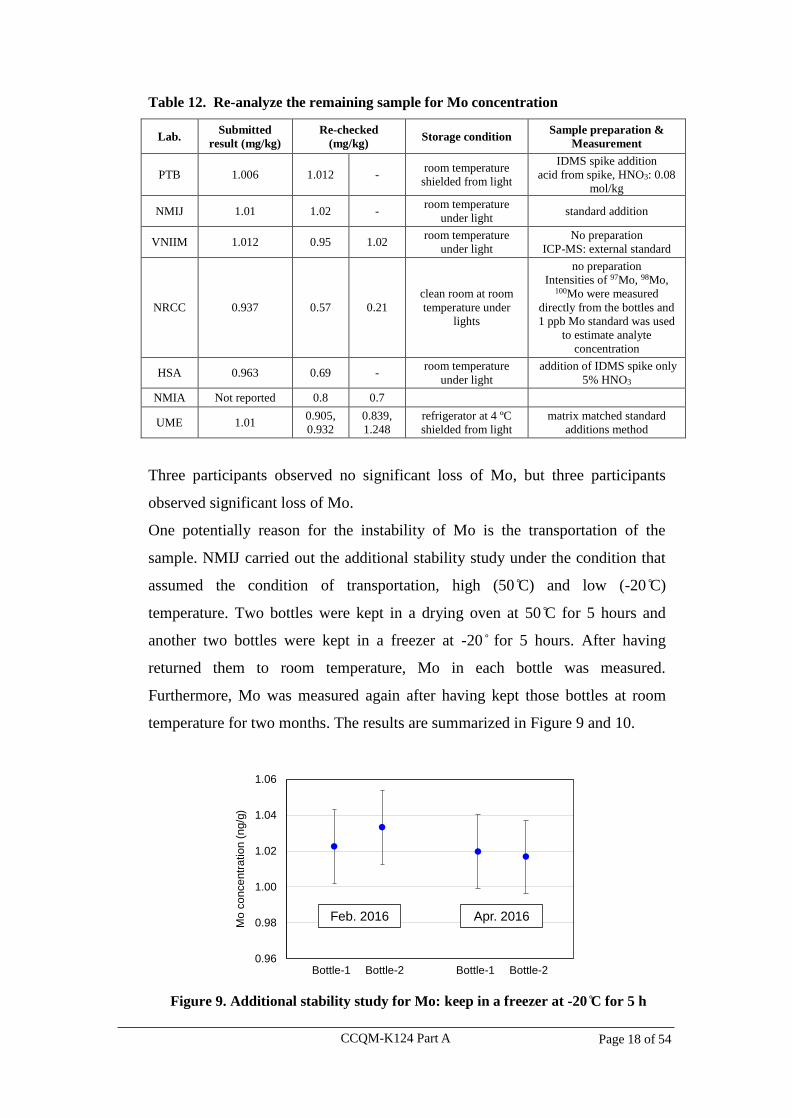
Table 12. Re-analyze the remaining sample for Mo concentration
Lab. Submitted
result (mg/kg)
Re-checked
(mg/kg) Storage condition
Sample preparation &
Measurement
PTB 1.006 1.012 - room temperature
shielded from light
IDMS spike addition
acid from spike, HNO3: 0.08
mol/kg
NMIJ 1.01 1.02 - room temperature
under light standard addition
VNIIM 1.012 0.95 1.02 room temperature
under light
No preparation
ICP-MS: external standard
NRCC 0.937 0.57 0.21
clean room at room
temperature under
lights
no preparation
Intensities of 97Mo, 98Mo, 100Mo were measured
directly from the bottles and
1 ppb Mo standard was used
to estimate analyte
concentration
HSA 0.963 0.69 - room temperature
under light
addition of IDMS spike only
5% HNO3
NMIA Not reported 0.8 0.7
UME 1.01 0.905,
0.932
0.839,
1.248
refrigerator at 4 ºC
shielded from light
matrix matched standard
additions method
Three participants observed no significant loss of Mo, but three participants
observed significant loss of Mo.
One potentially reason for the instability of Mo is the transportation of the
sample. NMIJ carried out the additional stability study under the condition that
assumed the condition of transportation, high (50 ̊C) and low (-20 ̊C)
temperature. Two bottles were kept in a drying oven at 50 ̊C for 5 hours and
another two bottles were kept in a freezer at -20 ̊ for 5 hours. After having
returned them to room temperature, Mo in each bottle was measured.
Furthermore, Mo was measured again after having kept those bottles at room
temperature for two months. The results are summarized in Figure 9 and 10.
Figure 9. Additional stability study for Mo: keep in a freezer at -20 ̊C for 5 h
0.96
0.98
1.00
1.02
1.04
1.06
Mo
co
nce
ntr
ation
(n
g/g
)
Feb. 2016 Apr. 2016
Bottle-1 Bottle-2 Bottle-1 Bottle-2
CCQM-K124 Part A Page 19 of 54
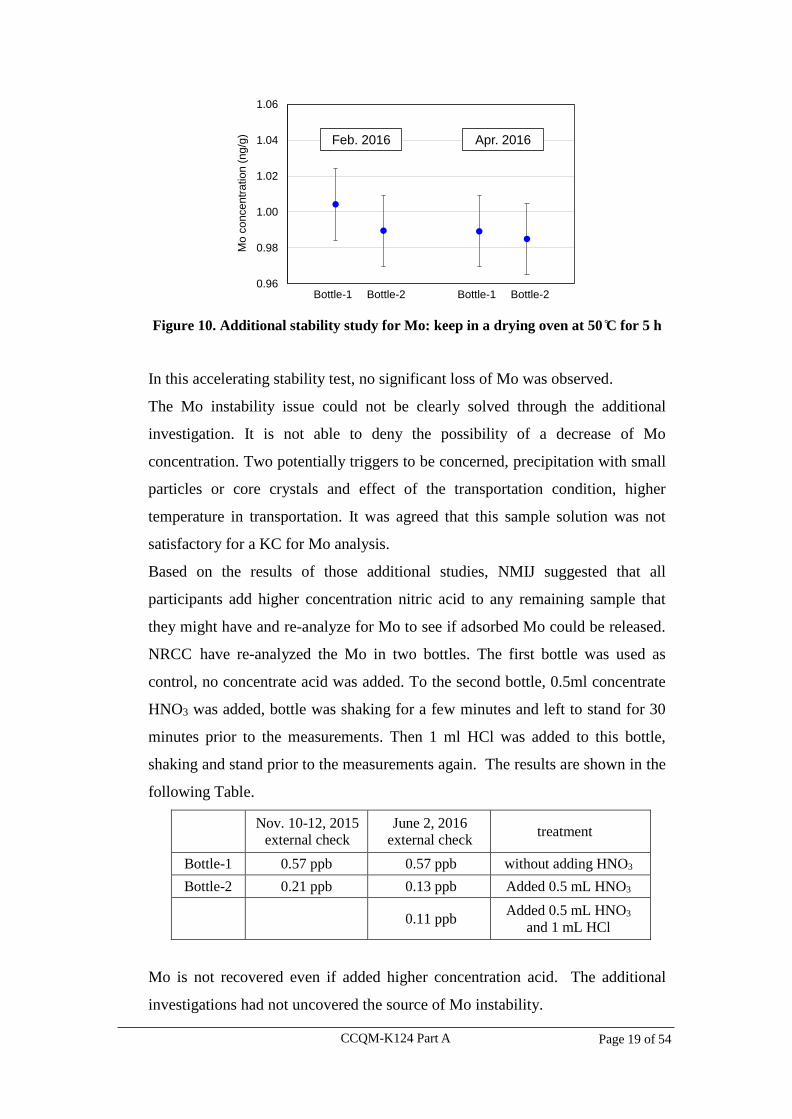
Figure 10. Additional stability study for Mo: keep in a drying oven at 50 C̊ for 5 h
In this accelerating stability test, no significant loss of Mo was observed.
The Mo instability issue could not be clearly solved through the additional
investigation. It is not able to deny the possibility of a decrease of Mo
concentration. Two potentially triggers to be concerned, precipitation with small
particles or core crystals and effect of the transportation condition, higher
temperature in transportation. It was agreed that this sample solution was not
satisfactory for a KC for Mo analysis.
Based on the results of those additional studies, NMIJ suggested that all
participants add higher concentration nitric acid to any remaining sample that
they might have and re-analyze for Mo to see if adsorbed Mo could be released.
NRCC have re-analyzed the Mo in two bottles. The first bottle was used as
control, no concentrate acid was added. To the second bottle, 0.5ml concentrate
HNO3 was added, bottle was shaking for a few minutes and left to stand for 30
minutes prior to the measurements. Then 1 ml HCl was added to this bottle,
shaking and stand prior to the measurements again. The results are shown in the
following Table.
Nov. 10-12, 2015
external check
June 2, 2016
external check treatment
Bottle-1 0.57 ppb 0.57 ppb without adding HNO3
Bottle-2 0.21 ppb 0.13 ppb Added 0.5 mL HNO3
0.11 ppb Added 0.5 mL HNO3
and 1 mL HCl
Mo is not recovered even if added higher concentration acid. The additional
investigations had not uncovered the source of Mo instability.
0.96
0.98
1.00
1.02
1.04
1.06
Mo
co
nce
ntr
ation
(n
g/g
)
Feb. 2016 Apr. 2016
Bottle-1 Bottle-2 Bottle-1 Bottle-2
CCQM-K124 Part A Page 20 of 54
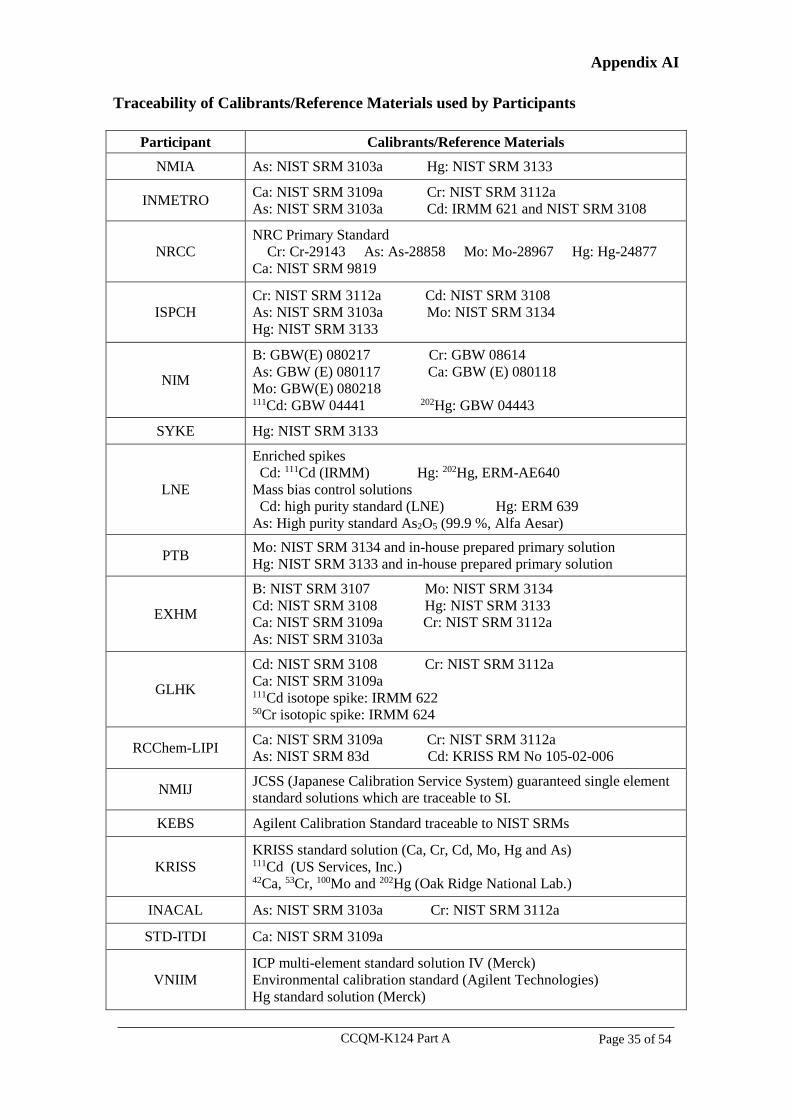
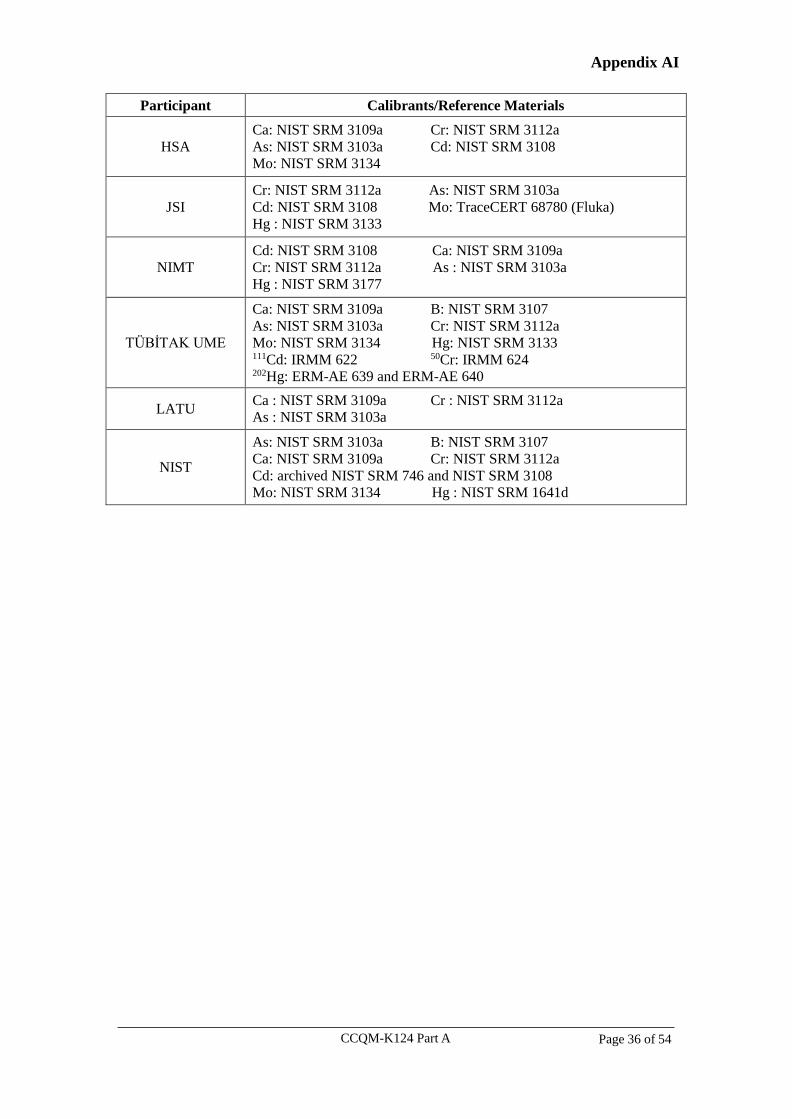
5.2 Traceability of Calibrants used by Participants
Participants were required to provide the information about the traceability of
the reference materials/calibrants they used in this comparison. This
information is summarized in Appendix AI.
5.3 Calculation of the Reference Mass Fraction Value and Associated
Uncertainties
In this report, the calculated consensus values and their respective
dispersions estimate using two different location estimators, arithmetic mean
and median, were summarized in Table 14 to 18.
MADE = median absolute deviation (MAD) ×1.483
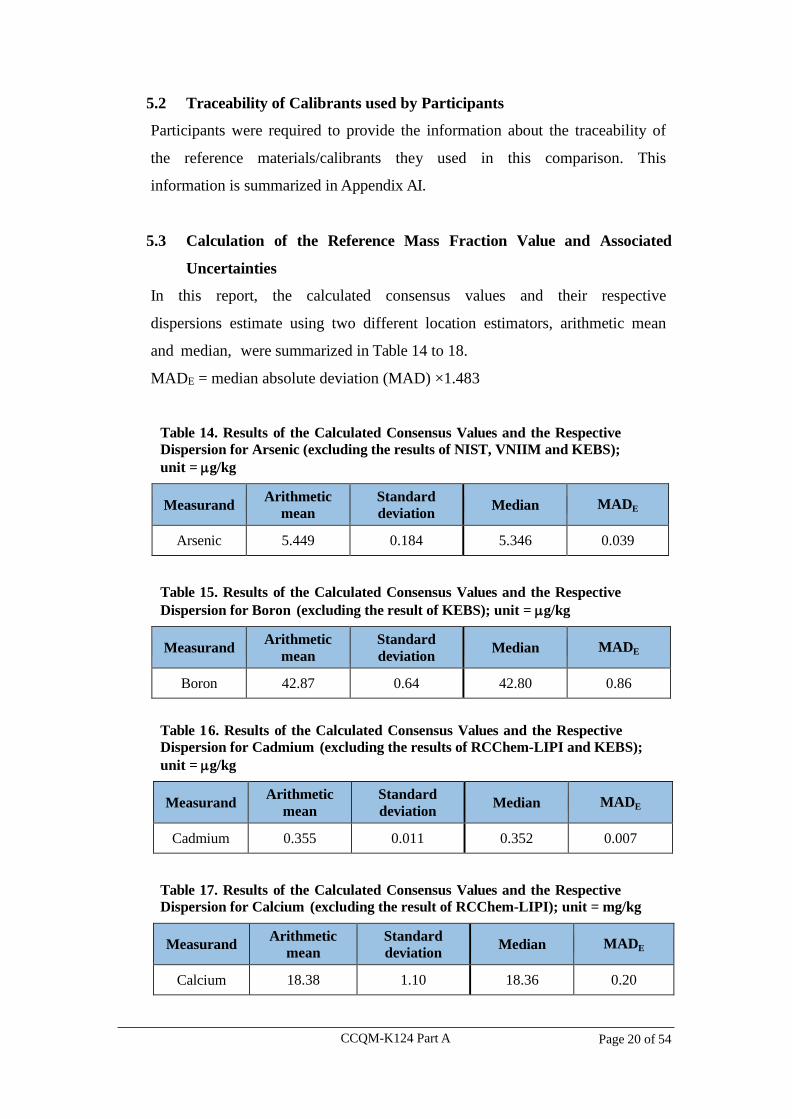
Table 14. Results of the Calculated Consensus Values and the Respective
Dispersion for Arsenic (excluding the results of NIST, VNIIM and KEBS);
unit = g/kg
Measurand Arithmetic
mean
Standard
deviation Median MADE
Arsenic 5.449 0.184 5.346 0.039
Table 15. Results of the Calculated Consensus Values and the Respective
Dispersion for Boron (excluding the result of KEBS); unit = g/kg
Measurand Arithmetic
mean
Standard
deviation Median MADE
Boron 42.87 0.64 42.80 0.86
Table 16. Results of the Calculated Consensus Values and the Respective
Dispersion for Cadmium (excluding the results of RCChem-LIPI and KEBS);
unit = g/kg
Measurand Arithmetic
mean
Standard
deviation Median MADE
Cadmium 0.355 0.011 0.352 0.007
Table 17. Results of the Calculated Consensus Values and the Respective
Dispersion for Calcium (excluding the result of RCChem-LIPI); unit = mg/kg
Measurand Arithmetic
mean
Standard
deviation Median MADE
Calcium 18.38 1.10 18.36 0.20
CCQM-K124 Part A Page 21 of 54
Table 18. Results of the Calculated Consensus Values and the Respective
Dispersion for Chromium (excluding the result of KEBS); unit = g/kg
Measurand Arithmetic
mean
Standard
deviation Median MADE
Chromium 5.063 0.206 5.080 0.057
As shown in Table 14 to 18, the significant difference is not found between
the consensus values of the arithmetic mean and the median was observed.
According to the CCQM Guidance Note [2] and the results of the discussions at
the IAWG meeting, they were decided that the arithmetic mean for B, and the
median for As, Cd, Ca and Cr should be used as the KCRV for CCQM-K124
Part A.
According to the CCQM Guidance Note, the u(KCRV) with the arithmetic
mean and median approach can be calculated using equation (2) and (3)
respectively, and the KCRU can then be calculated by multiplying u(KCRV) by
two. The KCRV and KCRU were shown in Table 19 to 23.
(2)
(3)
where s(x) is standard deviation of qualified results and m is number of qualified
participants.
Table 19. The Calculated KCRV and KCRU using the Median Approach
Measurand KCRV
(g/kg)
u(KCRV)
(g/kg)
KCRU
(g/kg) KCRU (%)
Arsenic 5.346 0.012 0.025 0.5 %
Table 20. The Calculated KCRV and KCRU using the Mean Approach
Measurand KCRV
(g/kg)
u(KCRV)
(g/kg)
KCRU
(g/kg) KCRU (%)
Boron 42.87 0.29 0.58 1.3 %
m
πu
2 MAD(KCRV) E
)(
(KCRV)m
xsu
CCQM-K124 Part A Page 22 of 54
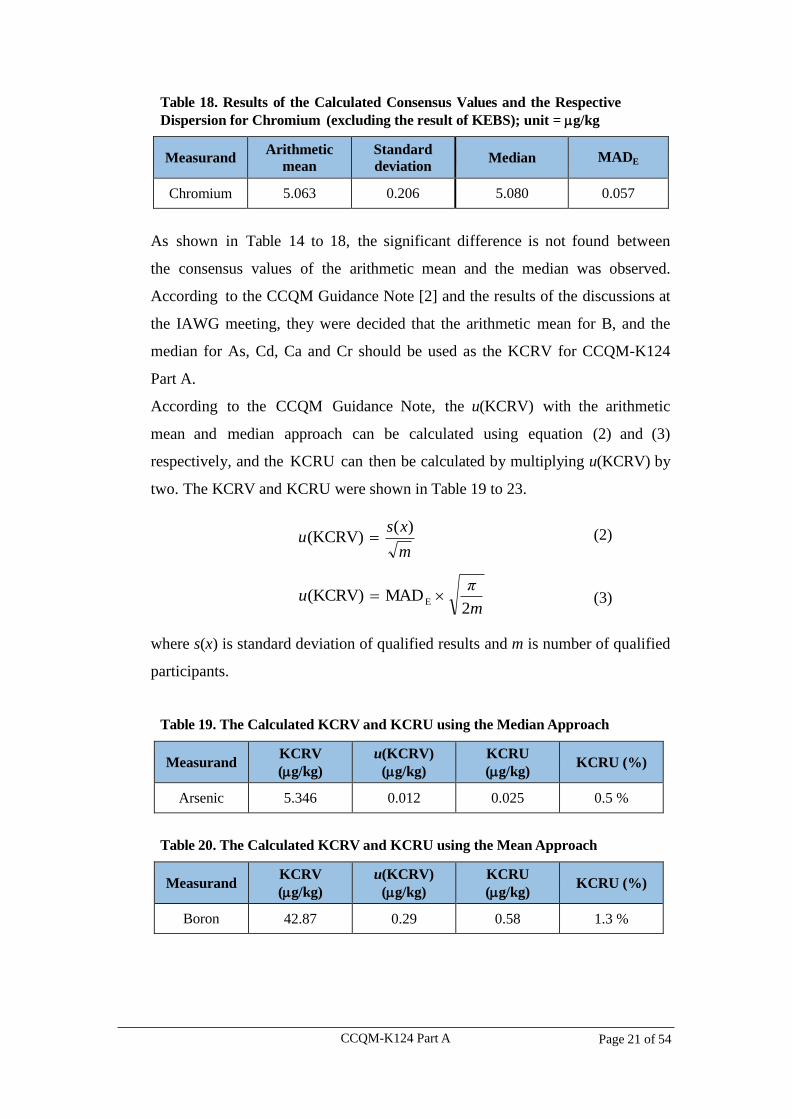
Table 21. The Calculated KCRV and KCRU using the Median Approach
Measurand KCRV
(g/kg)
u(KCRV)
(g/kg)
KCRU
(g/kg) KCRU (%)
Cadmium 0.352 0.003 0.005 1.5 %
Table 22. The Calculated KCRV and KCRU using the Median Approach
Measurand KCRV
(mg/kg)
u(KCRV)
(mg/kg)
KCRU
(mg/kg) KCRU (%)
Calcium 18.36 0.07 0.134 0.7 %
Table 23. The Calculated KCRV and KCRU using the Median Approach
Measurand KCRV
(g/kg)
u(KCRV)
(g/kg)
KCRU
(g/kg) KCRU (%)
Chromium 5.080 0.018 0.036 0.7 %
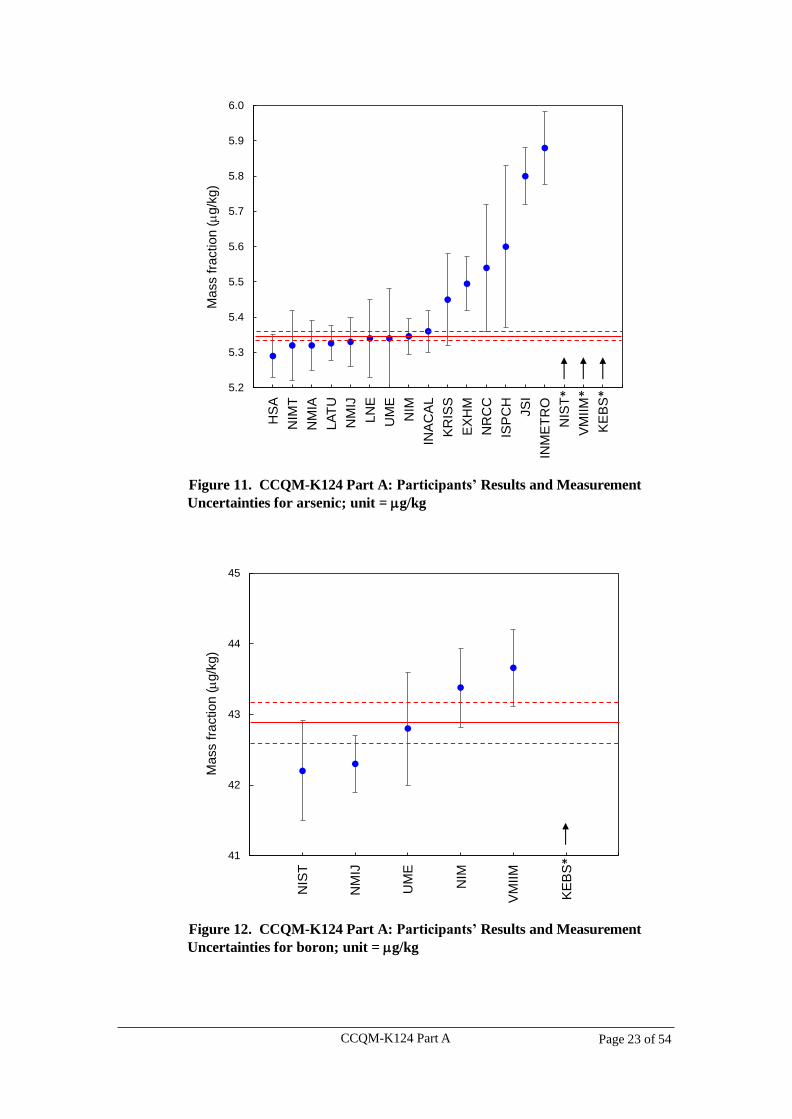
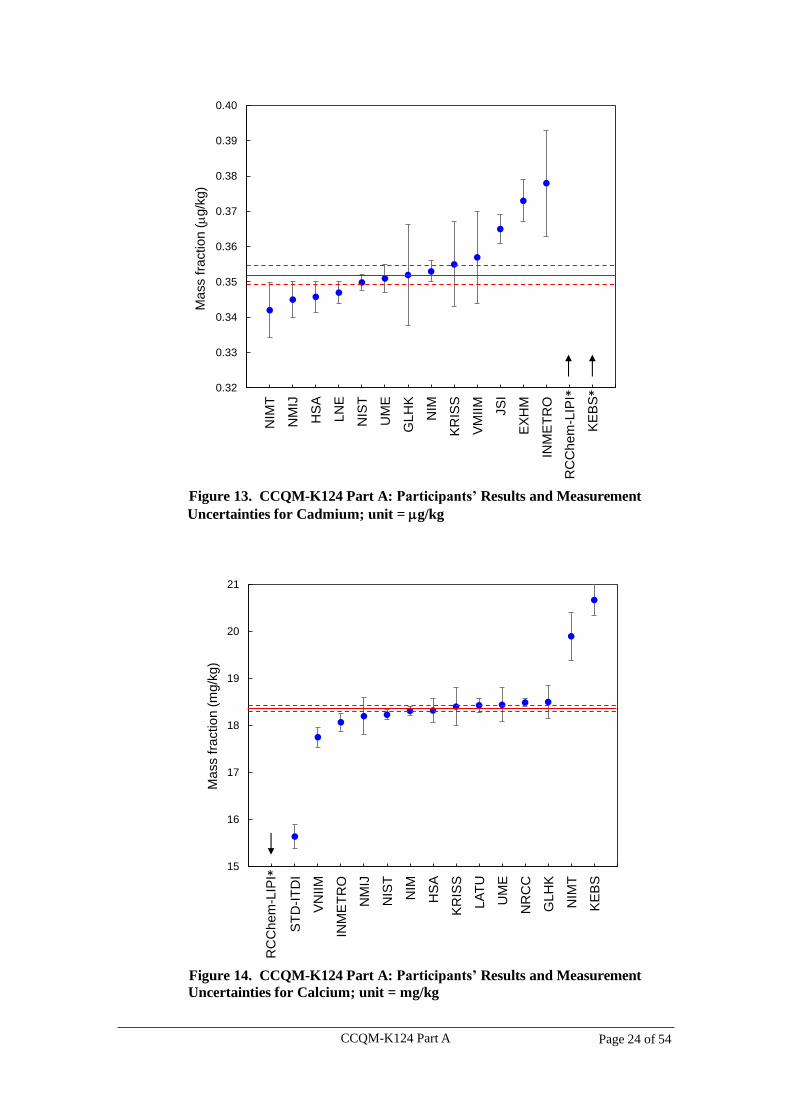
For a more convenient review, a graphical presentation of the KCRV, u(KCRV)
and the participants’ results for CCQM-K124 Part A is given in Figure 11 to 15.
The error bars represent the combined standard uncertainties for the individual
participant’s results. The horizontal solid red line represents the KCRV, and the
red dashed lines represent KCRV ± u(KCRV). (*the results were not included in
the calculation of the KCRVs)
CCQM-K124 Part A Page 23 of 54
Figure 11. CCQM-K124 Part A: Participants’ Results and Measurement
Uncertainties for arsenic; unit = g/kg
Figure 12. CCQM-K124 Part A: Participants’ Results and Measurement
Uncertainties for boron; unit = g/kg
5.2
5.3
5.4
5.5
5.6
5.7
5.8
5.9
6.0
NM
IA
Ma
ss f
raction
(
g/k
g)
ISP
CH
INM
ET
RO
JS
I
UM
E
KE
BS
NIS
T
EX
HM
HS
A
KR
ISS
LA
TU
NIM
T
INA
CA
L
NM
IJ
NR
CC
LN
E
NIM
VM
IIM
41
42
43
44
45
Ma
ss f
ractio
n (
g/k
g)
UM
E
KE
BS
NIS
T
NM
IJ
NIM
VM
IIM
* * *
*
CCQM-K124 Part A Page 24 of 54
Figure 13. CCQM-K124 Part A: Participants’ Results and Measurement
Uncertainties for Cadmium; unit = g/kg
Figure 14. CCQM-K124 Part A: Participants’ Results and Measurement
Uncertainties for Calcium; unit = mg/kg
0.32
0.33
0.34
0.35
0.36
0.37
0.38
0.39
0.40
INM
ET
RO
RC
Che
m-L
IPI
JS
I
UM
E
KE
BS
NIS
T
EX
HM
HS
A
KR
ISS
GL
HK
NIM
T
NM
IJ
LN
E
NIM
VM
IIM
Mass f
raction
(
g/k
g)
15
16
17
18
19
20
21
Ma
ss f
ractio
n (
mg/k
g)
GL
HK
ST
D-I
TD
I
RC
Ch
em
-LIP
I
NM
IJ
UM
E
KE
BS
NIM
NIS
T
VN
IIM
HS
A
KR
ISS
LA
TU
NIM
T
NR
CC
INM
ET
RO
* *
*
CCQM-K124 Part A Page 25 of 54
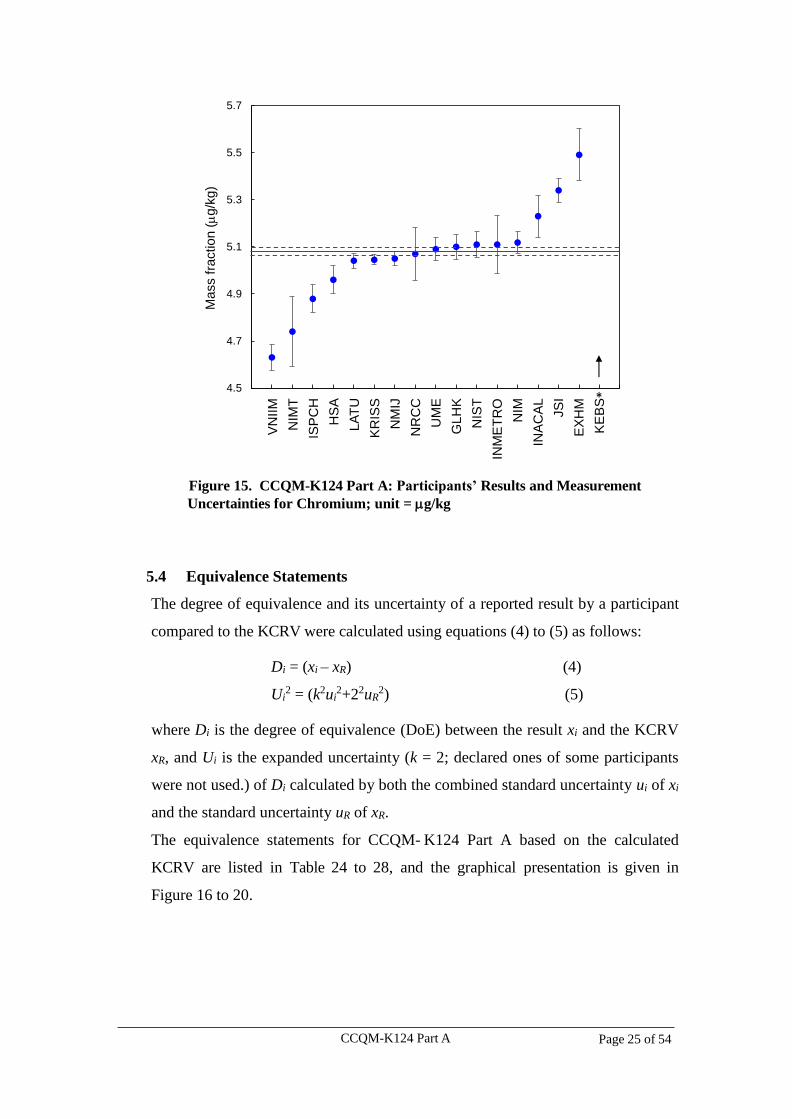
Figure 15. CCQM-K124 Part A: Participants’ Results and Measurement
Uncertainties for Chromium; unit = g/kg
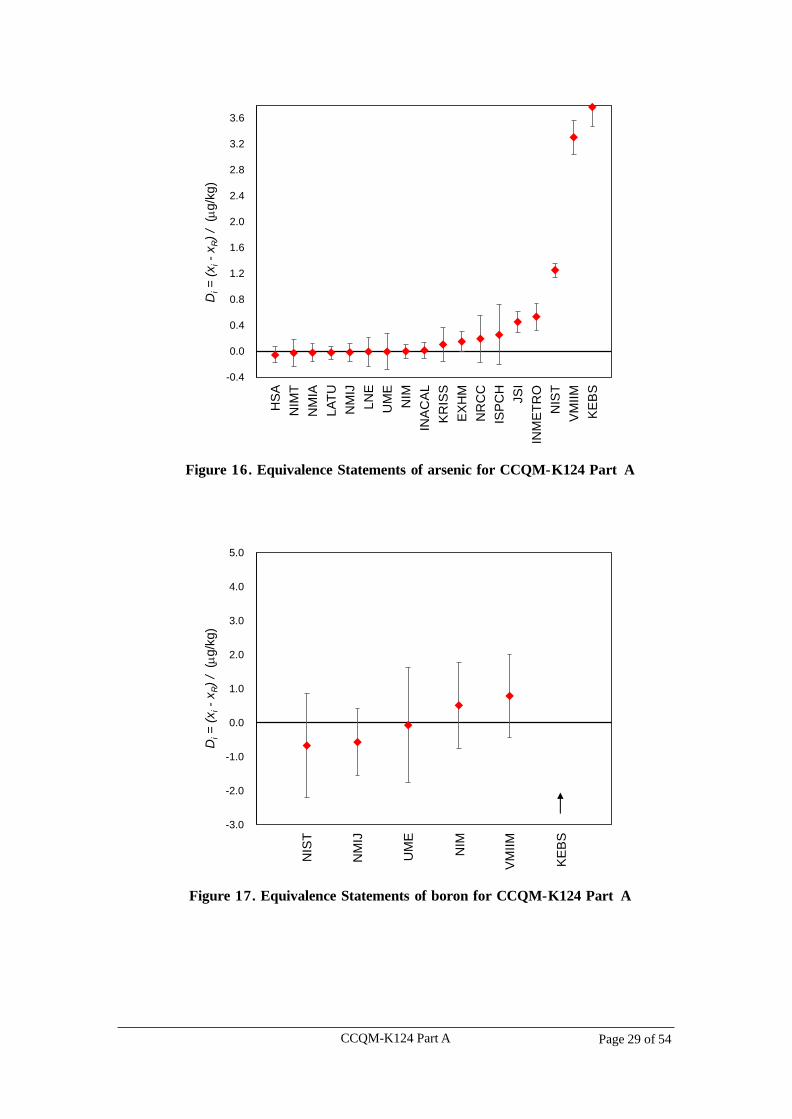
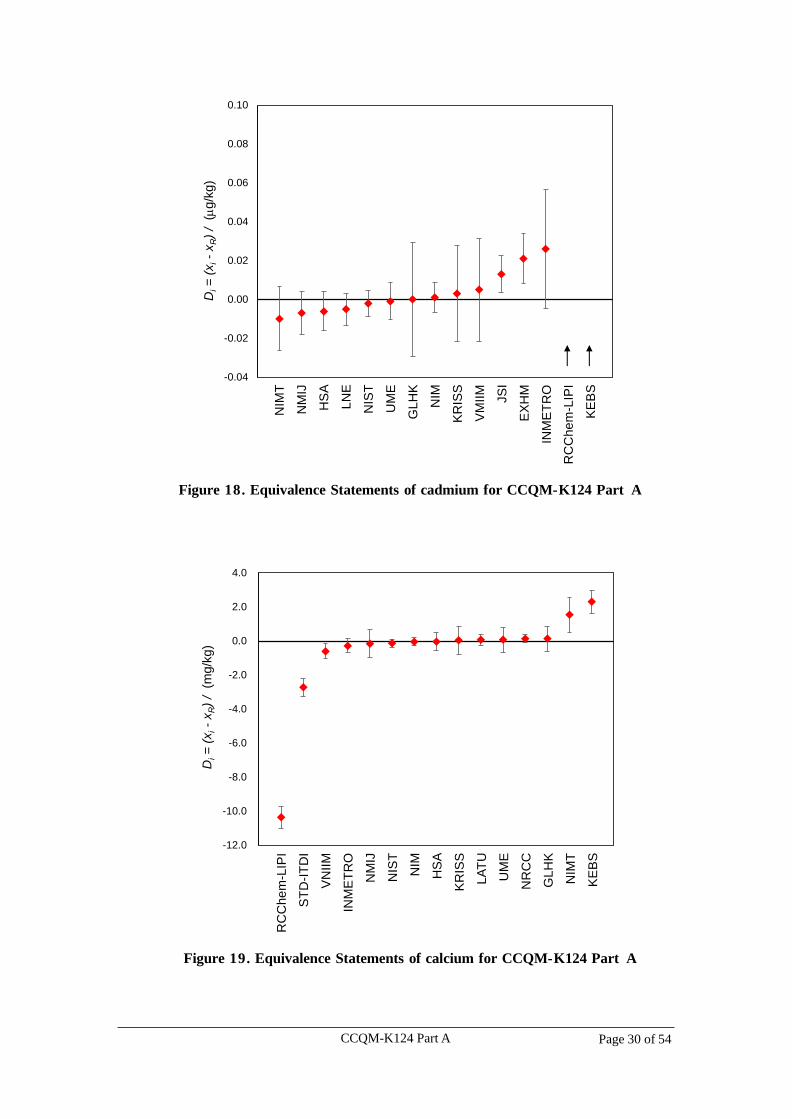
5.4 Equivalence Statements
The degree of equivalence and its uncertainty of a reported result by a participant
compared to the KCRV were calculated using equations (4) to (5) as follows:
Di = (xi – xR) (4)
Ui2 = (k2ui
2+22uR2) (5)
where Di is the degree of equivalence (DoE) between the result xi and the KCRV
xR, and Ui is the expanded uncertainty (k = 2; declared ones of some participants
were not used.) of Di calculated by both the combined standard uncertainty ui of xi
and the standard uncertainty uR of xR.
The equivalence statements for CCQM- K124 Part A based on the calculated
KCRV are listed in Table 24 to 28, and the graphical presentation is given in
Figure 16 to 20.
4.5
4.7
4.9
5.1
5.3
5.5
5.7
Ma
ss f
ractio
n (
g/k
g)
ISP
CH
GL
HK
JS
I
UM
E
KE
BS
NIM
NIS
T
VN
IIM
EX
HM
HS
A
KR
ISS
LA
TU
NIM
T
NM
IJ
NR
CC
INM
ET
RO
INA
CA
L *
CCQM-K124 Part A Page 26 of 54
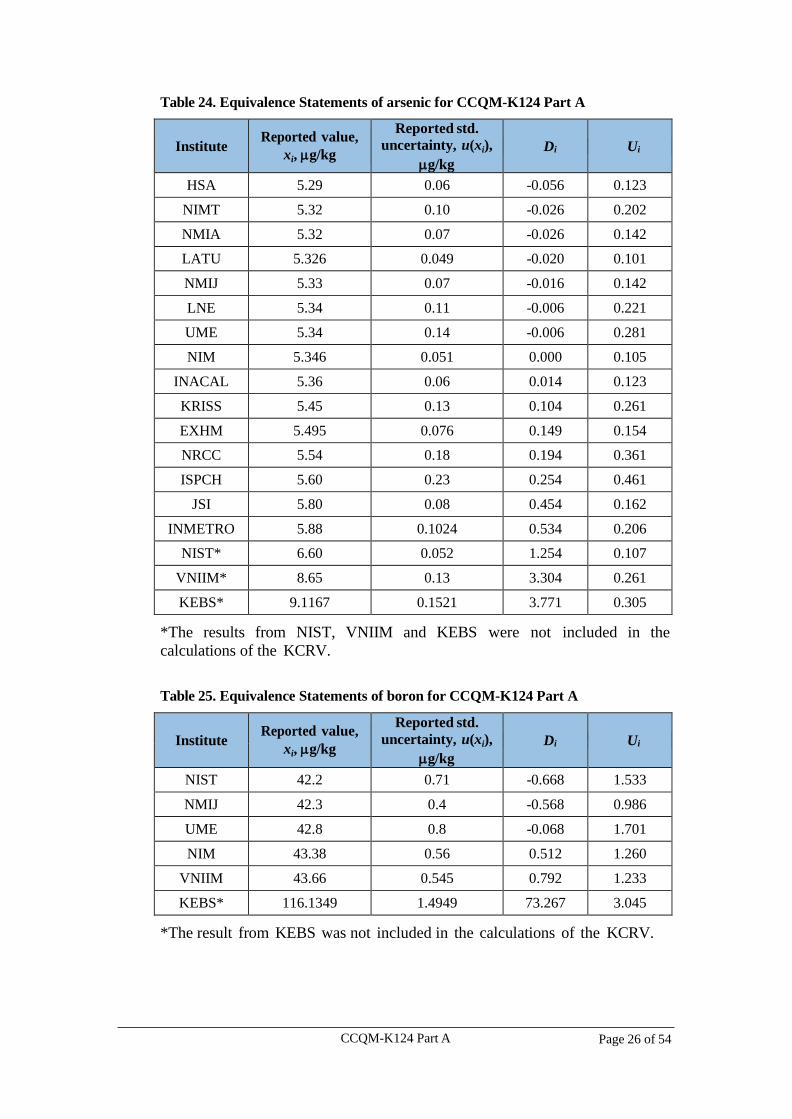
Table 24. Equivalence Statements of arsenic for CCQM-K124 Part A
Institute Reported value,
xi, g/kg
Reported std.
uncertainty, u(xi),
g/kg
Di Ui
HSA 5.29 0.06 -0.056 0.123
NIMT 5.32 0.10 -0.026 0.202
NMIA 5.32 0.07 -0.026 0.142
LATU 5.326 0.049 -0.020 0.101
NMIJ 5.33 0.07 -0.016 0.142
LNE 5.34 0.11 -0.006 0.221
UME 5.34 0.14 -0.006 0.281
NIM 5.346 0.051 0.000 0.105
INACAL 5.36 0.06 0.014 0.123
KRISS 5.45 0.13 0.104 0.261
EXHM 5.495 0.076 0.149 0.154
NRCC 5.54 0.18 0.194 0.361
ISPCH 5.60 0.23 0.254 0.461
JSI 5.80 0.08 0.454 0.162
INMETRO 5.88 0.1024 0.534 0.206
NIST* 6.60 0.052 1.254 0.107
VNIIM* 8.65 0.13 3.304 0.261
KEBS* 9.1167 0.1521 3.771 0.305
*The results from NIST, VNIIM and KEBS were not included in the
calculations of the KCRV.
Table 25. Equivalence Statements of boron for CCQM-K124 Part A
Institute Reported value,
xi, g/kg
Reported std.
uncertainty, u(xi),
g/kg
Di Ui
NIST 42.2 0.71 -0.668 1.533
NMIJ 42.3 0.4 -0.568 0.986
UME 42.8 0.8 -0.068 1.701
NIM 43.38 0.56 0.512 1.260
VNIIM 43.66 0.545 0.792 1.233
KEBS* 116.1349 1.4949 73.267 3.045
*The result from KEBS was not included in the calculations of the KCRV.
CCQM-K124 Part A Page 27 of 54
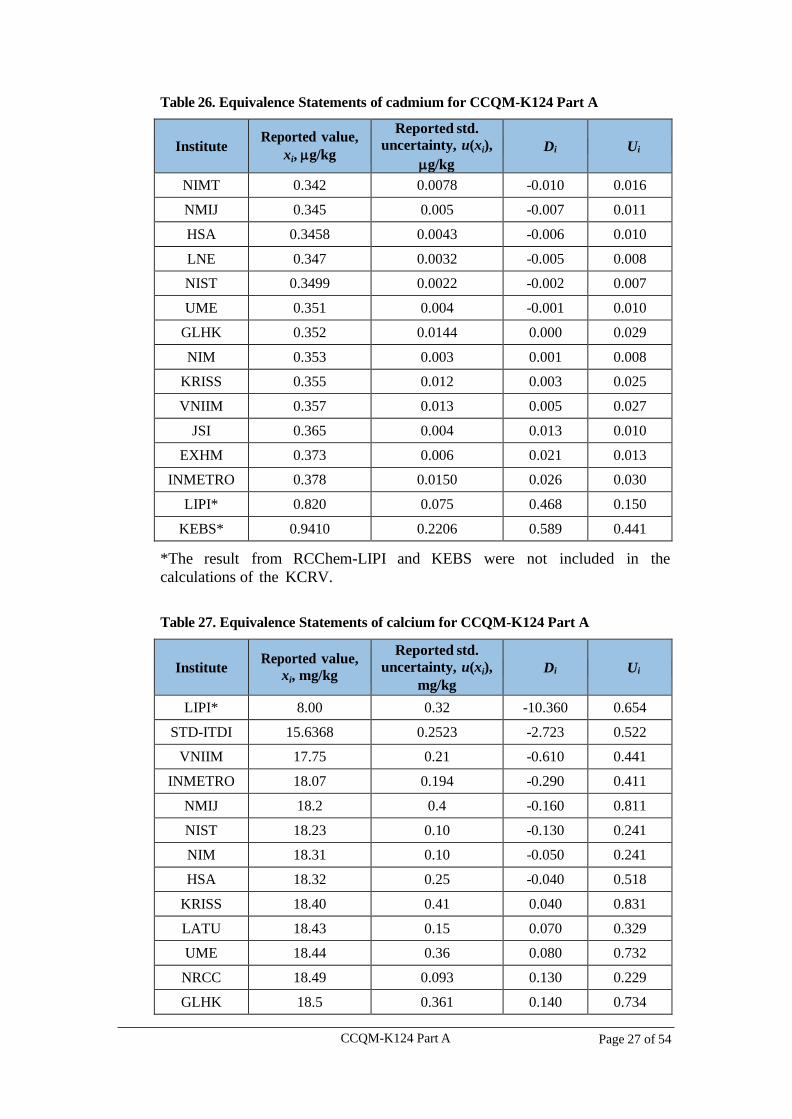
Table 26. Equivalence Statements of cadmium for CCQM-K124 Part A
Institute Reported value,
xi, g/kg
Reported std.
uncertainty, u(xi),
g/kg
Di Ui
NIMT 0.342 0.0078 -0.010 0.016
NMIJ 0.345 0.005 -0.007 0.011
HSA 0.3458 0.0043 -0.006 0.010
LNE 0.347 0.0032 -0.005 0.008
NIST 0.3499 0.0022 -0.002 0.007
UME 0.351 0.004 -0.001 0.010
GLHK 0.352 0.0144 0.000 0.029
NIM 0.353 0.003 0.001 0.008
KRISS 0.355 0.012 0.003 0.025
VNIIM 0.357 0.013 0.005 0.027
JSI 0.365 0.004 0.013 0.010
EXHM 0.373 0.006 0.021 0.013
INMETRO 0.378 0.0150 0.026 0.030
LIPI* 0.820 0.075 0.468 0.150
KEBS* 0.9410 0.2206 0.589 0.441
*The result from RCChem-LIPI and KEBS were not included in the
calculations of the KCRV.
Table 27. Equivalence Statements of calcium for CCQM-K124 Part A
Institute Reported value,
xi, mg/kg
Reported std.
uncertainty, u(xi),
mg/kg
Di Ui
LIPI* 8.00 0.32 -10.360 0.654
STD-ITDI 15.6368 0.2523 -2.723 0.522
VNIIM 17.75 0.21 -0.610 0.441
INMETRO 18.07 0.194 -0.290 0.411
NMIJ 18.2 0.4 -0.160 0.811
NIST 18.23 0.10 -0.130 0.241
NIM 18.31 0.10 -0.050 0.241
HSA 18.32 0.25 -0.040 0.518
KRISS 18.40 0.41 0.040 0.831
LATU 18.43 0.15 0.070 0.329
UME 18.44 0.36 0.080 0.732
NRCC 18.49 0.093 0.130 0.229
GLHK 18.5 0.361 0.140 0.734
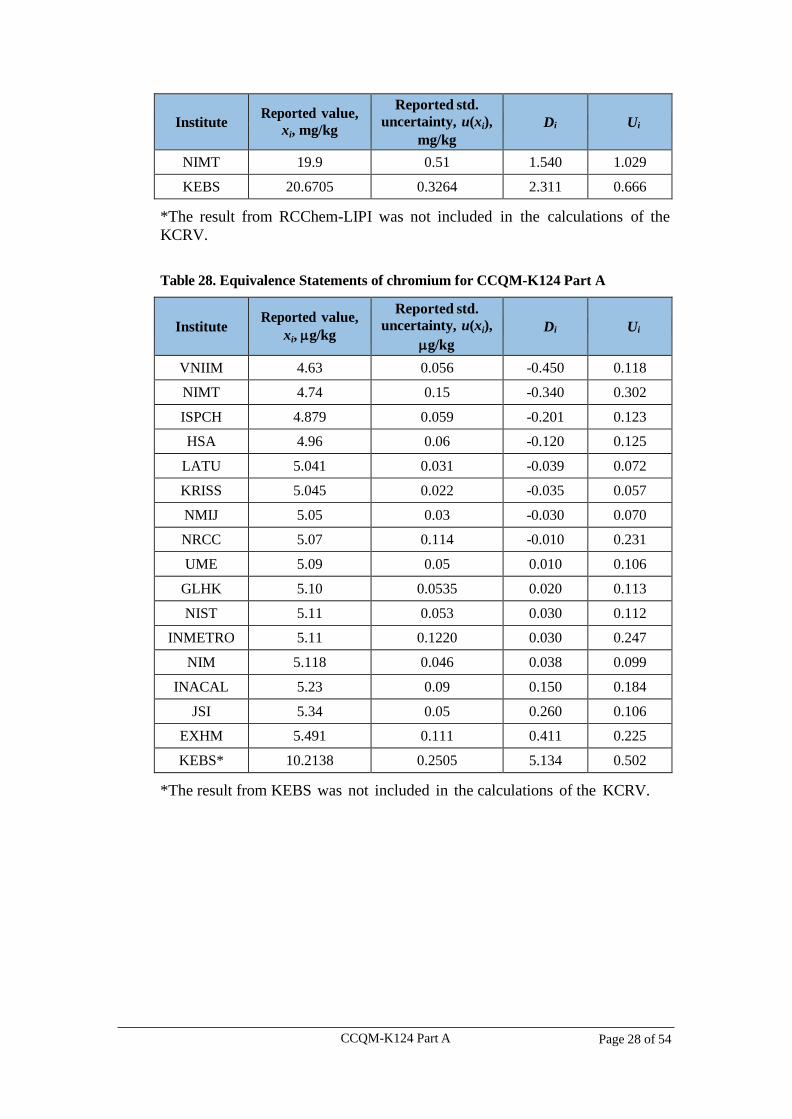
CCQM-K124 Part A Page 28 of 54
Institute Reported value,
xi, mg/kg
Reported std.
uncertainty, u(xi),
mg/kg
Di Ui
NIMT 19.9 0.51 1.540 1.029
KEBS 20.6705 0.3264 2.311 0.666
*The result from RCChem-LIPI was not included in the calculations of the
KCRV.
Table 28. Equivalence Statements of chromium for CCQM-K124 Part A
Institute Reported value,
xi, g/kg
Reported std.
uncertainty, u(xi),
g/kg
Di Ui
VNIIM 4.63 0.056 -0.450 0.118
NIMT 4.74 0.15 -0.340 0.302
ISPCH 4.879 0.059 -0.201 0.123
HSA 4.96 0.06 -0.120 0.125
LATU 5.041 0.031 -0.039 0.072
KRISS 5.045 0.022 -0.035 0.057
NMIJ 5.05 0.03 -0.030 0.070
NRCC 5.07 0.114 -0.010 0.231
UME 5.09 0.05 0.010 0.106
GLHK 5.10 0.0535 0.020 0.113
NIST 5.11 0.053 0.030 0.112
INMETRO 5.11 0.1220 0.030 0.247
NIM 5.118 0.046 0.038 0.099
INACAL 5.23 0.09 0.150 0.184
JSI 5.34 0.05 0.260 0.106
EXHM 5.491 0.111 0.411 0.225
KEBS* 10.2138 0.2505 5.134 0.502
*The result from KEBS was not included in the calculations of the KCRV.
CCQM-K124 Part A Page 29 of 54
Figure 16. Equivalence Statements of arsenic for CCQM-K124 Part A
Figure 17. Equivalence Statements of boron for CCQM-K124 Part A
Di=
(x
i-
xR)
/ (
g/k
g)
-0.4
0.0
0.4
0.8
1.2
1.6
2.0
2.4
2.8
3.2
3.6
NM
IA
ISP
CH
INM
ET
RO
JS
I
UM
E
KE
BS
NIS
T
EX
HM
HS
A
KR
ISS
LA
TU
NIM
T
INA
CA
L
NM
IJ
NR
CC
LN
E
NIM
VM
IIM
Di=
(x
i-
xR)
/ (
g/k
g)
-3.0
-2.0
-1.0
0.0
1.0
2.0
3.0
4.0
5.0
UM
E
KE
BS
NIS
T
NM
IJ
NIM
VM
IIM
CCQM-K124 Part A Page 30 of 54
Figure 18. Equivalence Statements of cadmium for CCQM-K124 Part A
Figure 19. Equivalence Statements of calcium for CCQM-K124 Part A
Di=
(x
i-
xR)
/ (
g/k
g)
-0.04
-0.02
0.00
0.02
0.04
0.06
0.08
0.10
INM
ET
RO
RC
Che
m-L
IPI
JS
I
UM
E
KE
BS
NIS
T
EX
HM
HS
A
KR
ISS
GL
HK
NIM
T
NM
IJ
LN
E
NIM
VM
IIM
Di=
(x
i-
xR)
/ (m
g/k
g)
GL
HK
ST
D-I
TD
I
RC
Che
m-L
IPI
NM
IJ
UM
E
KE
BS
NIM
NIS
T
VN
IIM
HS
A
KR
ISS
LA
TU
NIM
T
NR
CC
INM
ET
RO
-12.0
-10.0
-8.0
-6.0
-4.0
-2.0
0.0
2.0
4.0
CCQM-K124 Part A Page 31 of 54
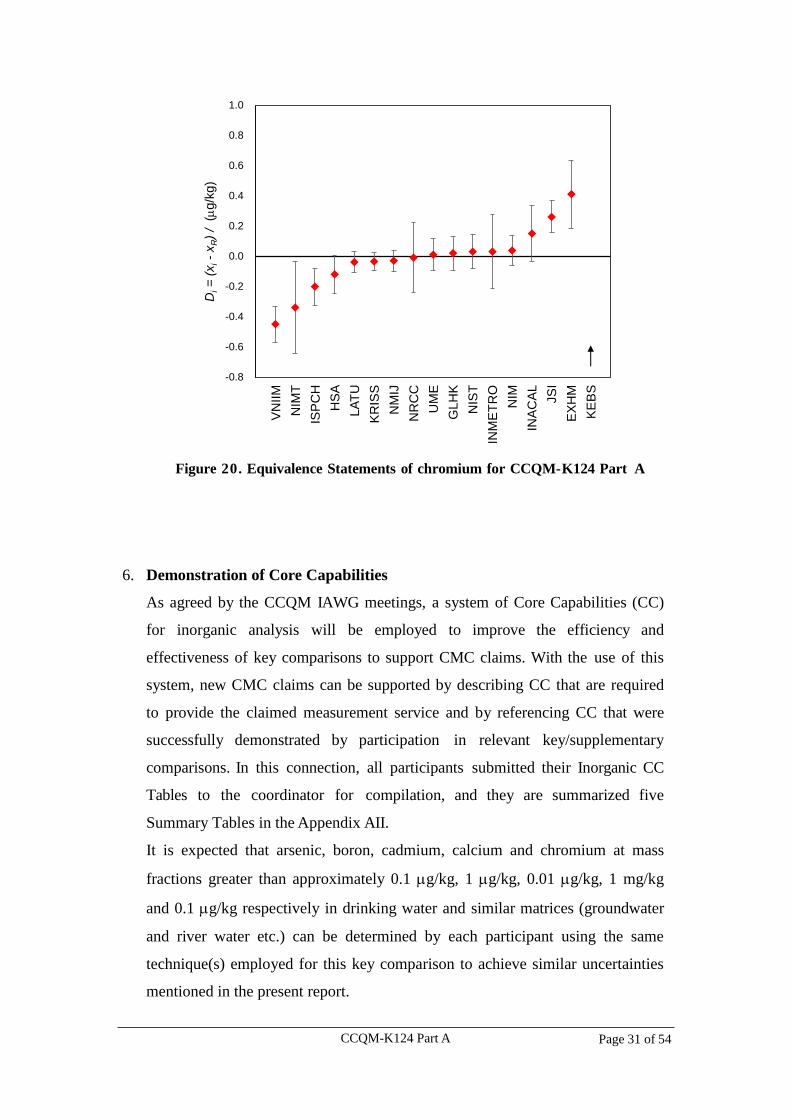
Figure 20. Equivalence Statements of chromium for CCQM-K124 Part A
6. Demonstration of Core Capabilities
As agreed by the CCQM IAWG meetings, a system of Core Capabilities (CC)
for inorganic analysis will be employed to improve the efficiency and
effectiveness of key comparisons to support CMC claims. With the use of this
system, new CMC claims can be supported by describing CC that are required
to provide the claimed measurement service and by referencing CC that were
successfully demonstrated by participation in relevant key/supplementary
comparisons. In this connection, all participants submitted their Inorganic CC
Tables to the coordinator for compilation, and they are summarized five
Summary Tables in the Appendix AII.
It is expected that arsenic, boron, cadmium, calcium and chromium at mass
fractions greater than approximately 0.1 g/kg, 1 g/kg, 0.01 g/kg, 1 mg/kg
and 0.1 g/kg respectively in drinking water and similar matrices (groundwater
and river water etc.) can be determined by each participant using the same
technique(s) employed for this key comparison to achieve similar uncertainties
mentioned in the present report.
Di=
(x
i-
xR)
/ (
g/k
g)
ISP
CH
GL
HK
JS
I
UM
E
KE
BS
NIM
NIS
T
VN
IIM
EX
HM
HS
A
KR
ISS
LA
TU
NIM
T
NM
IJ
NR
CC
INM
ET
RO
INA
CA
L
-0.8
-0.6
-0.4
-0.2
0.0
0.2
0.4
0.6
0.8
1.0
CCQM-K124 Part A Page 32 of 54
7. Conclusions
The KCRVs and DoEs were approved for As, B, Cd, Ca and Cr (except Mo and
Hg) at the IAWG meetings held at Paris and Daejeon (Korea) in 2016.
Results were submitted by 14 NMIs and nine DIs. The participants used different
measurement methods, though most of them used direct measurement using
inductively coupled plasma-optical emission spectrometry (ICP-OES) for Ca,
inductively coupled plasma-mass spectrometry (ICP-MS) and high resolution
ICP-MS and isotope dilution technique with ICP-MS for other elements.
The results of B, Ca, Cr, As and Cd show good agreement except some outliers.
Concerning Hg, instability was observed when the sample stored in the light. And
some participants observed instability of Mo. Therefore, it was agreed to abandon
the Hg and Mo analysis as this sample was not satisfactory for KC.
Accounting for relative expanded uncertainty, comparability of measurement
results for each of B, Ca, Cr, As and Cd was successfully demonstrated by the
participating NMIs or DIs. Furthermore, the results of this key comparison can
be utilized along with the IAWG core capability approach.
CCQM-K124 Part A Page 33 of 54
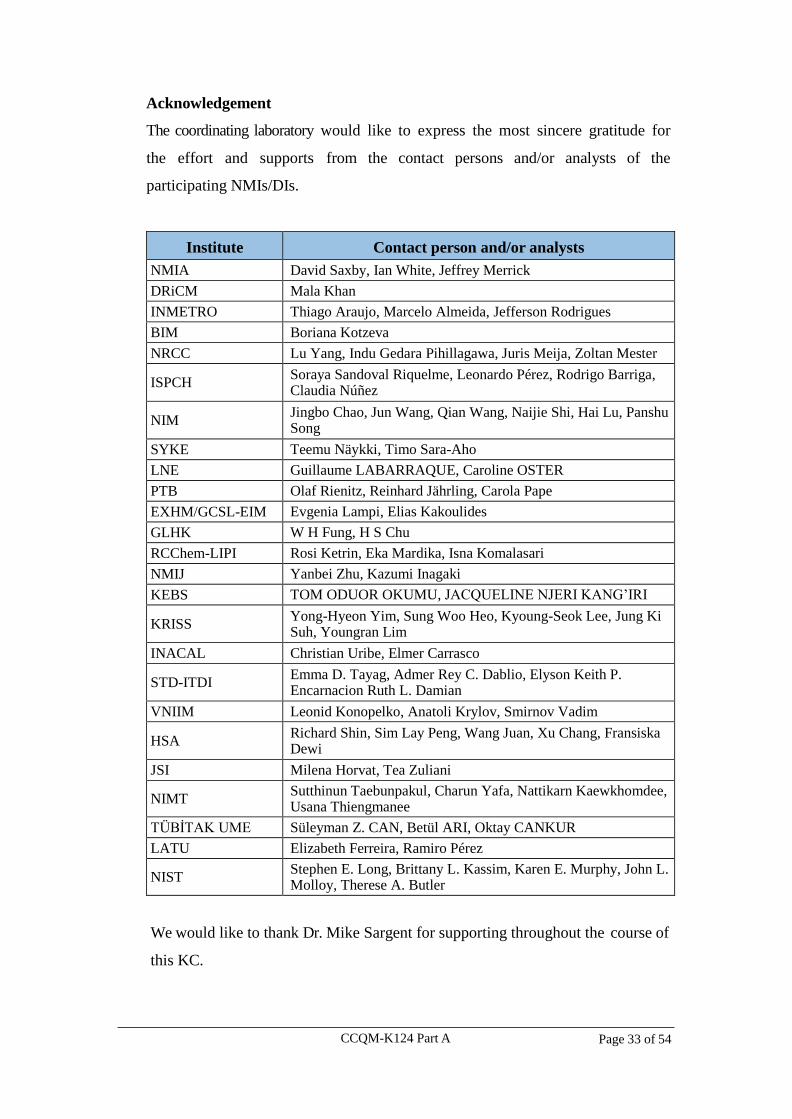
Acknowledgement
The coordinating laboratory would like to express the most sincere gratitude for
the effort and supports from the contact persons and/or analysts of the
participating NMIs/DIs.
Institute Contact person and/or analysts
NMIA David Saxby, Ian White, Jeffrey Merrick
DRiCM Mala Khan
INMETRO Thiago Araujo, Marcelo Almeida, Jefferson Rodrigues
BIM Boriana Kotzeva
NRCC Lu Yang, Indu Gedara Pihillagawa, Juris Meija, Zoltan Mester
ISPCH Soraya Sandoval Riquelme, Leonardo Pérez, Rodrigo Barriga, Claudia Núñez
NIM Jingbo Chao, Jun Wang, Qian Wang, Naijie Shi, Hai Lu, Panshu Song
SYKE Teemu Näykki, Timo Sara-Aho
LNE Guillaume LABARRAQUE, Caroline OSTER
PTB Olaf Rienitz, Reinhard Jährling, Carola Pape
EXHM/GCSL-EIM Evgenia Lampi, Elias Kakoulides
GLHK W H Fung, H S Chu
RCChem-LIPI Rosi Ketrin, Eka Mardika, Isna Komalasari
NMIJ Yanbei Zhu, Kazumi Inagaki
KEBS TOM ODUOR OKUMU, JACQUELINE NJERI KANG’IRI
KRISS Yong-Hyeon Yim, Sung Woo Heo, Kyoung-Seok Lee, Jung Ki Suh, Youngran Lim
INACAL Christian Uribe, Elmer Carrasco
STD-ITDI Emma D. Tayag, Admer Rey C. Dablio, Elyson Keith P. Encarnacion Ruth L. Damian
VNIIM Leonid Konopelko, Anatoli Krylov, Smirnov Vadim
HSA Richard Shin, Sim Lay Peng, Wang Juan, Xu Chang, Fransiska Dewi
JSI Milena Horvat, Tea Zuliani
NIMT Sutthinun Taebunpakul, Charun Yafa, Nattikarn Kaewkhomdee, Usana Thiengmanee
TÜBİTAK UME Süleyman Z. CAN, Betül ARI, Oktay CANKUR
LATU Elizabeth Ferreira, Ramiro Pérez
NIST Stephen E. Long, Brittany L. Kassim, Karen E. Murphy, John L. Molloy, Therese A. Butler
We would like to thank Dr. Mike Sargent for supporting throughout the course of
this KC.
CCQM-K124 Part A Page 34 of 54
References
1. International Standards Organization, ISO Guide 35: Reference materials –
General and statistical principles for certification, Geneva, Switzerland, 2006.
2. CCQM Guidance Note: Estimation of a consensus KCRV and associated
Degrees of Equivalence, Version 10, 2013.
CCQM-K124 Part A Page 35 of 54
Appendix AI
Traceability of Calibrants/Reference Materials used by Participants
Participant Calibrants/Reference Materials
NMIA As: NIST SRM 3103a Hg: NIST SRM 3133
INMETRO Ca: NIST SRM 3109a Cr: NIST SRM 3112a
As: NIST SRM 3103a Cd: IRMM 621 and NIST SRM 3108
NRCC
NRC Primary Standard
Cr: Cr-29143 As: As-28858 Mo: Mo-28967 Hg: Hg-24877
Ca: NIST SRM 9819
ISPCH
Cr: NIST SRM 3112a Cd: NIST SRM 3108
As: NIST SRM 3103a Mo: NIST SRM 3134
Hg: NIST SRM 3133
NIM
B: GBW(E) 080217 Cr: GBW 08614
As: GBW (E) 080117 Ca: GBW (E) 080118
Mo: GBW(E) 080218 111Cd: GBW 04441 202Hg: GBW 04443
SYKE Hg: NIST SRM 3133
LNE
Enriched spikes
Cd: 111Cd (IRMM) Hg: 202Hg, ERM-AE640
Mass bias control solutions
Cd: high purity standard (LNE) Hg: ERM 639
As: High purity standard As2O5 (99.9 %, Alfa Aesar)
PTB Mo: NIST SRM 3134 and in-house prepared primary solution
Hg: NIST SRM 3133 and in-house prepared primary solution
EXHM
B: NIST SRM 3107 Mo: NIST SRM 3134
Cd: NIST SRM 3108 Hg: NIST SRM 3133
Ca: NIST SRM 3109a Cr: NIST SRM 3112a
As: NIST SRM 3103a
GLHK
Cd: NIST SRM 3108 Cr: NIST SRM 3112a
Ca: NIST SRM 3109a 111Cd isotope spike: IRMM 622 50Cr isotopic spike: IRMM 624
RCChem-LIPI Ca: NIST SRM 3109a Cr: NIST SRM 3112a
As: NIST SRM 83d Cd: KRISS RM No 105-02-006
NMIJ JCSS (Japanese Calibration Service System) guaranteed single element
standard solutions which are traceable to SI.
KEBS Agilent Calibration Standard traceable to NIST SRMs
KRISS
KRISS standard solution (Ca, Cr, Cd, Mo, Hg and As) 111Cd (US Services, Inc.) 42Ca, 53Cr, 100Mo and 202Hg (Oak Ridge National Lab.)
INACAL As: NIST SRM 3103a Cr: NIST SRM 3112a
STD-ITDI Ca: NIST SRM 3109a
VNIIM
ICP multi-element standard solution IV (Merck)
Environmental calibration standard (Agilent Technologies)
Hg standard solution (Merck)
CCQM-K124 Part A Page 36 of 54
Appendix AI
Participant Calibrants/Reference Materials
HSA
Ca: NIST SRM 3109a Cr: NIST SRM 3112a
As: NIST SRM 3103a Cd: NIST SRM 3108
Mo: NIST SRM 3134
JSI
Cr: NIST SRM 3112a As: NIST SRM 3103a
Cd: NIST SRM 3108 Mo: TraceCERT 68780 (Fluka)
Hg : NIST SRM 3133
NIMT
Cd: NIST SRM 3108 Ca: NIST SRM 3109a
Cr: NIST SRM 3112a As : NIST SRM 3103a
Hg : NIST SRM 3177
TÜBİTAK UME
Ca: NIST SRM 3109a B: NIST SRM 3107
As: NIST SRM 3103a Cr: NIST SRM 3112a
Mo: NIST SRM 3134 Hg: NIST SRM 3133 111Cd: IRMM 622 50Cr: IRMM 624 202Hg: ERM-AE 639 and ERM-AE 640
LATU Ca : NIST SRM 3109a Cr : NIST SRM 3112a
As : NIST SRM 3103a
NIST
As: NIST SRM 3103a B: NIST SRM 3107
Ca: NIST SRM 3109a Cr: NIST SRM 3112a
Cd: archived NIST SRM 746 and NIST SRM 3108
Mo: NIST SRM 3134 Hg : NIST SRM 1641d
CCQM-K124 Part A Page 37 of 54
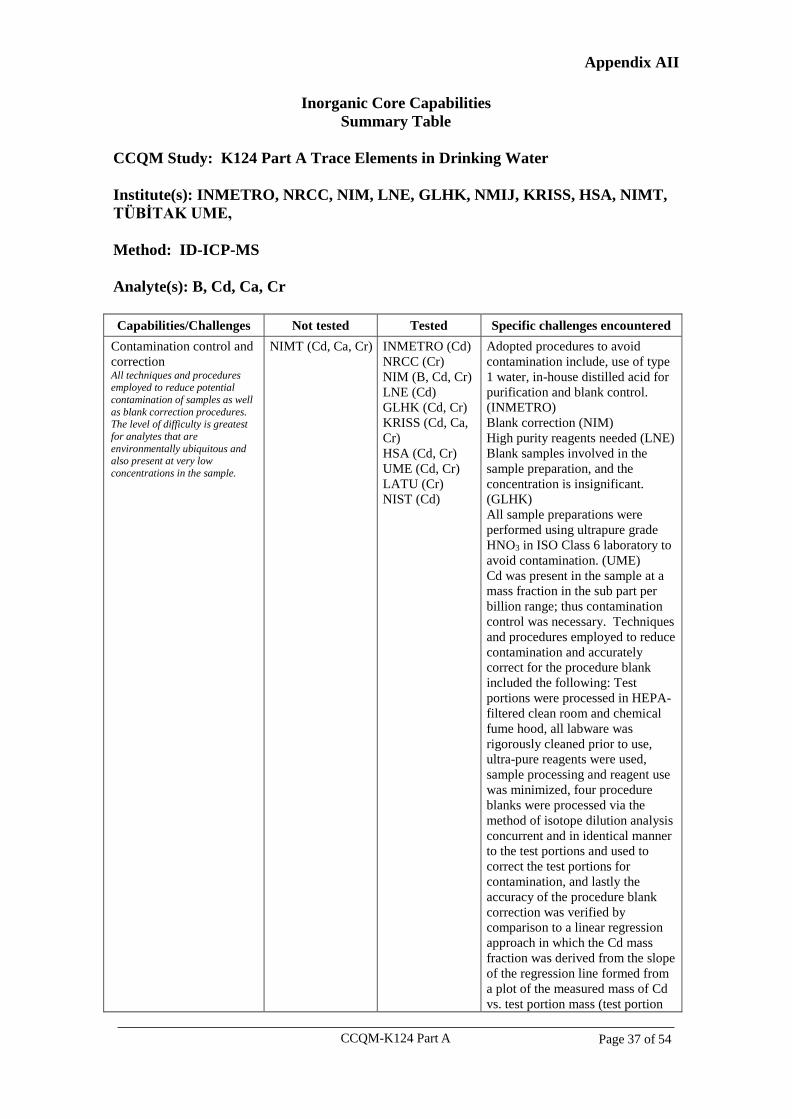
Appendix AII
Inorganic Core Capabilities
Summary Table
CCQM Study: K124 Part A Trace Elements in Drinking Water
Institute(s): INMETRO, NRCC, NIM, LNE, GLHK, NMIJ, KRISS, HSA, NIMT,
TÜBİTAK UME,
Method: ID-ICP-MS
Analyte(s): B, Cd, Ca, Cr
Capabilities/Challenges Not tested Tested Specific challenges encountered
Contamination control and
correction All techniques and procedures employed to reduce potential
contamination of samples as well
as blank correction procedures. The level of difficulty is greatest
for analytes that are
environmentally ubiquitous and also present at very low
concentrations in the sample.
NIMT (Cd, Ca, Cr) INMETRO (Cd)
NRCC (Cr)
NIM (B, Cd, Cr)
LNE (Cd)
GLHK (Cd, Cr)
KRISS (Cd, Ca,
Cr)
HSA (Cd, Cr)
UME (Cd, Cr)
LATU (Cr)
NIST (Cd)
Adopted procedures to avoid
contamination include, use of type
1 water, in-house distilled acid for
purification and blank control.
(INMETRO)
Blank correction (NIM)
High purity reagents needed (LNE)
Blank samples involved in the
sample preparation, and the
concentration is insignificant.
(GLHK)
All sample preparations were
performed using ultrapure grade
HNO3 in ISO Class 6 laboratory to
avoid contamination. (UME)
Cd was present in the sample at a
mass fraction in the sub part per
billion range; thus contamination
control was necessary. Techniques
and procedures employed to reduce
contamination and accurately
correct for the procedure blank
included the following: Test
portions were processed in HEPA-
filtered clean room and chemical
fume hood, all labware was
rigorously cleaned prior to use,
ultra-pure reagents were used,
sample processing and reagent use
was minimized, four procedure
blanks were processed via the
method of isotope dilution analysis
concurrent and in identical manner
to the test portions and used to
correct the test portions for
contamination, and lastly the
accuracy of the procedure blank
correction was verified by
comparison to a linear regression
approach in which the Cd mass
fraction was derived from the slope
of the regression line formed from
a plot of the measured mass of Cd
vs. test portion mass (test portion
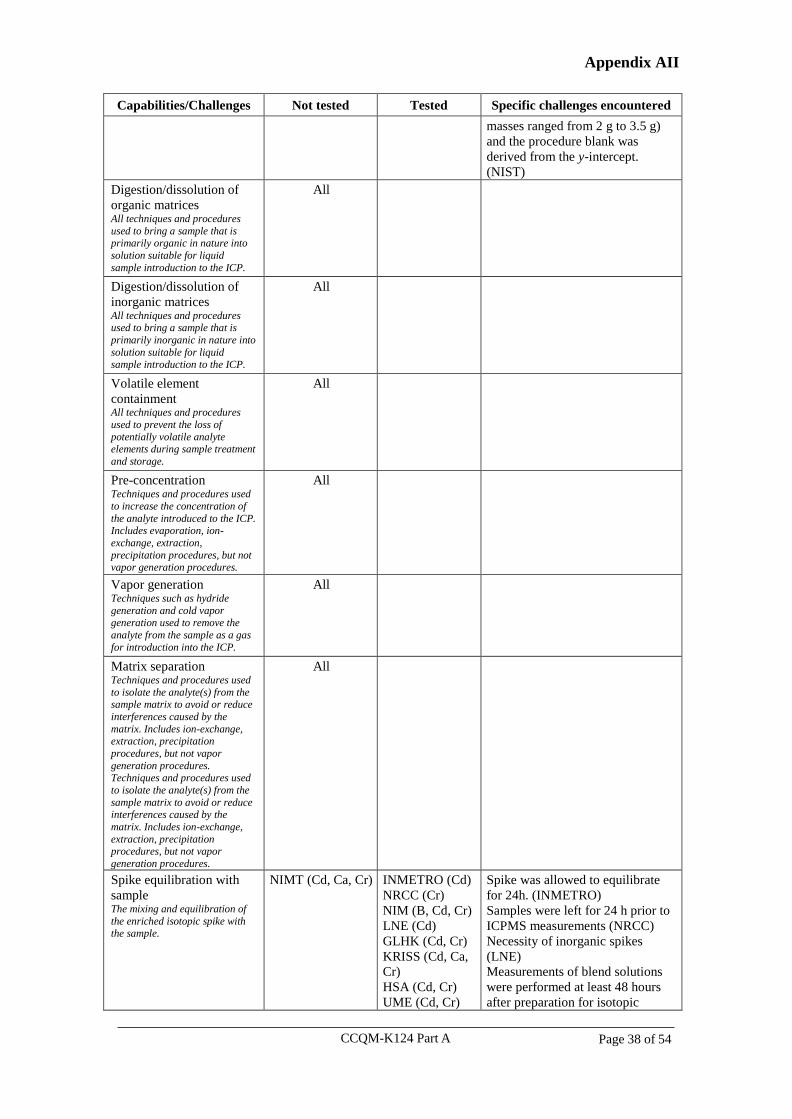
CCQM-K124 Part A Page 38 of 54
Appendix AII
Capabilities/Challenges Not tested Tested Specific challenges encountered
masses ranged from 2 g to 3.5 g)
and the procedure blank was
derived from the y-intercept.
(NIST)
Digestion/dissolution of
organic matrices All techniques and procedures
used to bring a sample that is primarily organic in nature into
solution suitable for liquid
sample introduction to the ICP.
All
Digestion/dissolution of
inorganic matrices All techniques and procedures used to bring a sample that is
primarily inorganic in nature into
solution suitable for liquid sample introduction to the ICP.
All
Volatile element
containment All techniques and procedures
used to prevent the loss of
potentially volatile analyte elements during sample treatment
and storage.
All
Pre-concentration Techniques and procedures used
to increase the concentration of
the analyte introduced to the ICP. Includes evaporation, ion-
exchange, extraction,
precipitation procedures, but not vapor generation procedures.
All
Vapor generation Techniques such as hydride
generation and cold vapor generation used to remove the
analyte from the sample as a gas
for introduction into the ICP.
All
Matrix separation Techniques and procedures used
to isolate the analyte(s) from the sample matrix to avoid or reduce
interferences caused by the
matrix. Includes ion-exchange, extraction, precipitation
procedures, but not vapor
generation procedures. Techniques and procedures used
to isolate the analyte(s) from the
sample matrix to avoid or reduce interferences caused by the
matrix. Includes ion-exchange,
extraction, precipitation procedures, but not vapor
generation procedures.
All
Spike equilibration with
sample The mixing and equilibration of
the enriched isotopic spike with the sample.
NIMT (Cd, Ca, Cr) INMETRO (Cd)
NRCC (Cr)
NIM (B, Cd, Cr)
LNE (Cd)
GLHK (Cd, Cr)
KRISS (Cd, Ca,
Cr)
HSA (Cd, Cr)
UME (Cd, Cr)
Spike was allowed to equilibrate
for 24h. (INMETRO)
Samples were left for 24 h prior to
ICPMS measurements (NRCC)
Necessity of inorganic spikes
(LNE)
Measurements of blend solutions
were performed at least 48 hours
after preparation for isotopic
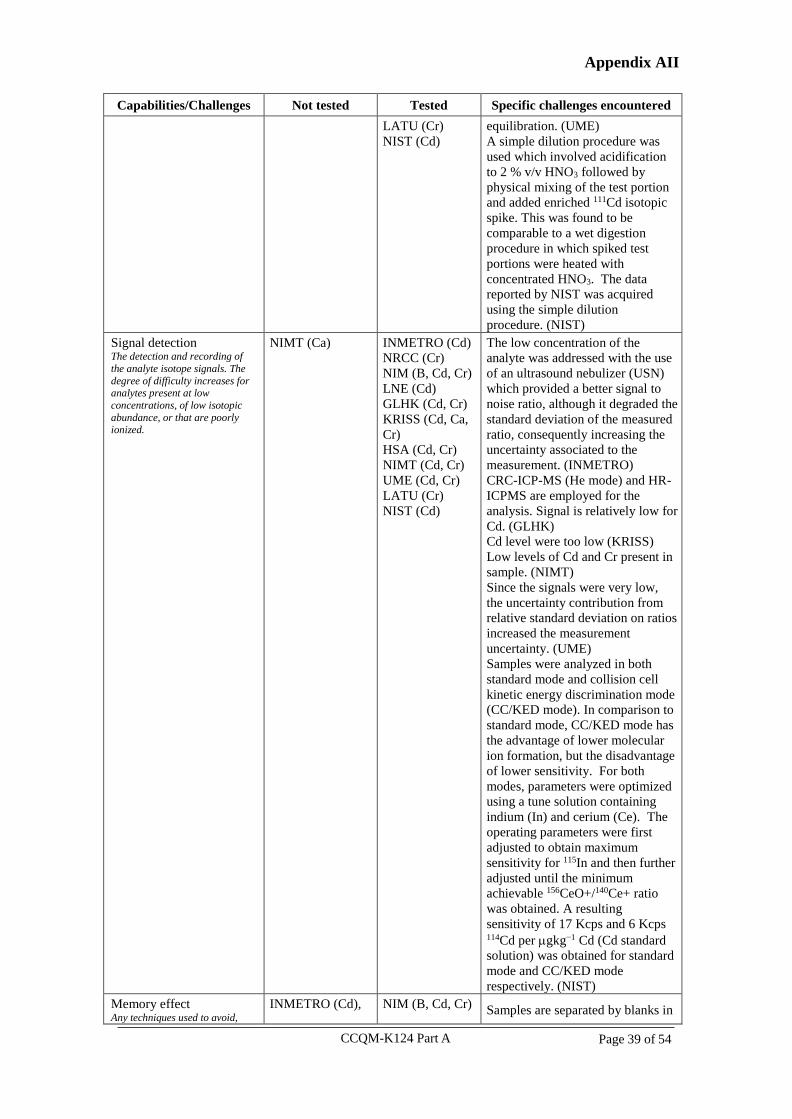
CCQM-K124 Part A Page 39 of 54
Appendix AII
Capabilities/Challenges Not tested Tested Specific challenges encountered
LATU (Cr)
NIST (Cd)
equilibration. (UME)
A simple dilution procedure was
used which involved acidification
to 2 % v/v HNO3 followed by
physical mixing of the test portion
and added enriched 111Cd isotopic
spike. This was found to be
comparable to a wet digestion
procedure in which spiked test
portions were heated with
concentrated HNO3. The data
reported by NIST was acquired
using the simple dilution
procedure. (NIST)
Signal detection The detection and recording of
the analyte isotope signals. The
degree of difficulty increases for analytes present at low
concentrations, of low isotopic
abundance, or that are poorly ionized.
NIMT (Ca) INMETRO (Cd)
NRCC (Cr)
NIM (B, Cd, Cr)
LNE (Cd)
GLHK (Cd, Cr)
KRISS (Cd, Ca,
Cr)
HSA (Cd, Cr)
NIMT (Cd, Cr)
UME (Cd, Cr)
LATU (Cr)
NIST (Cd)
The low concentration of the
analyte was addressed with the use
of an ultrasound nebulizer (USN)
which provided a better signal to
noise ratio, although it degraded the
standard deviation of the measured
ratio, consequently increasing the
uncertainty associated to the
measurement. (INMETRO)
CRC-ICP-MS (He mode) and HR-
ICPMS are employed for the
analysis. Signal is relatively low for
Cd. (GLHK)
Cd level were too low (KRISS)
Low levels of Cd and Cr present in
sample. (NIMT)
Since the signals were very low,
the uncertainty contribution from
relative standard deviation on ratios
increased the measurement
uncertainty. (UME)
Samples were analyzed in both
standard mode and collision cell
kinetic energy discrimination mode
(CC/KED mode). In comparison to
standard mode, CC/KED mode has
the advantage of lower molecular
ion formation, but the disadvantage
of lower sensitivity. For both
modes, parameters were optimized
using a tune solution containing
indium (In) and cerium (Ce). The
operating parameters were first
adjusted to obtain maximum
sensitivity for 115In and then further
adjusted until the minimum
achievable 156CeO+/140Ce+ ratio
was obtained. A resulting
sensitivity of 17 Kcps and 6 Kcps 114Cd per gkg−1 Cd (Cd standard
solution) was obtained for standard
mode and CC/KED mode
respectively. (NIST)
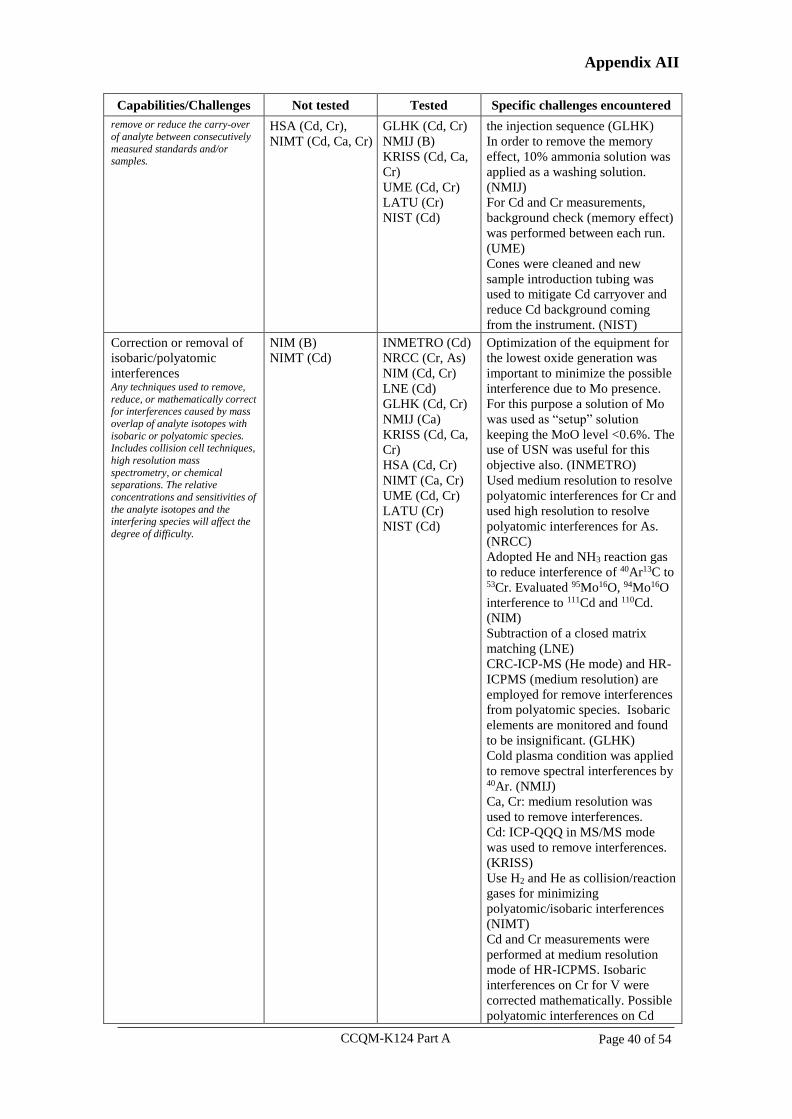
Memory effect Any techniques used to avoid,
INMETRO (Cd), NIM (B, Cd, Cr) Samples are separated by blanks in
CCQM-K124 Part A Page 40 of 54
Appendix AII
Capabilities/Challenges Not tested Tested Specific challenges encountered
remove or reduce the carry-over
of analyte between consecutively
measured standards and/or samples.
HSA (Cd, Cr),
NIMT (Cd, Ca, Cr)
GLHK (Cd, Cr)
NMIJ (B)
KRISS (Cd, Ca,
Cr)
UME (Cd, Cr)
LATU (Cr)
NIST (Cd)
the injection sequence (GLHK)
In order to remove the memory
effect, 10% ammonia solution was
applied as a washing solution.
(NMIJ)
For Cd and Cr measurements,
background check (memory effect)
was performed between each run.
(UME)
Cones were cleaned and new
sample introduction tubing was
used to mitigate Cd carryover and
reduce Cd background coming
from the instrument. (NIST)
Correction or removal of
isobaric/polyatomic
interferences Any techniques used to remove,
reduce, or mathematically correct for interferences caused by mass
overlap of analyte isotopes with
isobaric or polyatomic species. Includes collision cell techniques,
high resolution mass
spectrometry, or chemical separations. The relative
concentrations and sensitivities of
the analyte isotopes and the interfering species will affect the
degree of difficulty.
NIM (B)
NIMT (Cd)
INMETRO (Cd)
NRCC (Cr, As)
NIM (Cd, Cr)
LNE (Cd)
GLHK (Cd, Cr)
NMIJ (Ca)
KRISS (Cd, Ca,
Cr)
HSA (Cd, Cr)
NIMT (Ca, Cr)
UME (Cd, Cr)
LATU (Cr)
NIST (Cd)
Optimization of the equipment for
the lowest oxide generation was
important to minimize the possible
interference due to Mo presence.
For this purpose a solution of Mo
was used as “setup” solution
keeping the MoO level <0.6%. The
use of USN was useful for this
objective also. (INMETRO)
Used medium resolution to resolve
polyatomic interferences for Cr and
used high resolution to resolve
polyatomic interferences for As.
(NRCC)
Adopted He and NH3 reaction gas
to reduce interference of 40Ar13C to 53Cr. Evaluated 95Mo16O, 94Mo16O
interference to 111Cd and 110Cd.
(NIM)
Subtraction of a closed matrix
matching (LNE)
CRC-ICP-MS (He mode) and HR-
ICPMS (medium resolution) are
employed for remove interferences
from polyatomic species. Isobaric
elements are monitored and found
to be insignificant. (GLHK)
Cold plasma condition was applied
to remove spectral interferences by 40Ar. (NMIJ)
Ca, Cr: medium resolution was
used to remove interferences.
Cd: ICP-QQQ in MS/MS mode
was used to remove interferences.
(KRISS)
Use H2 and He as collision/reaction
gases for minimizing
polyatomic/isobaric interferences
(NIMT)
Cd and Cr measurements were
performed at medium resolution
mode of HR-ICPMS. Isobaric
interferences on Cr for V were
corrected mathematically. Possible
polyatomic interferences on Cd
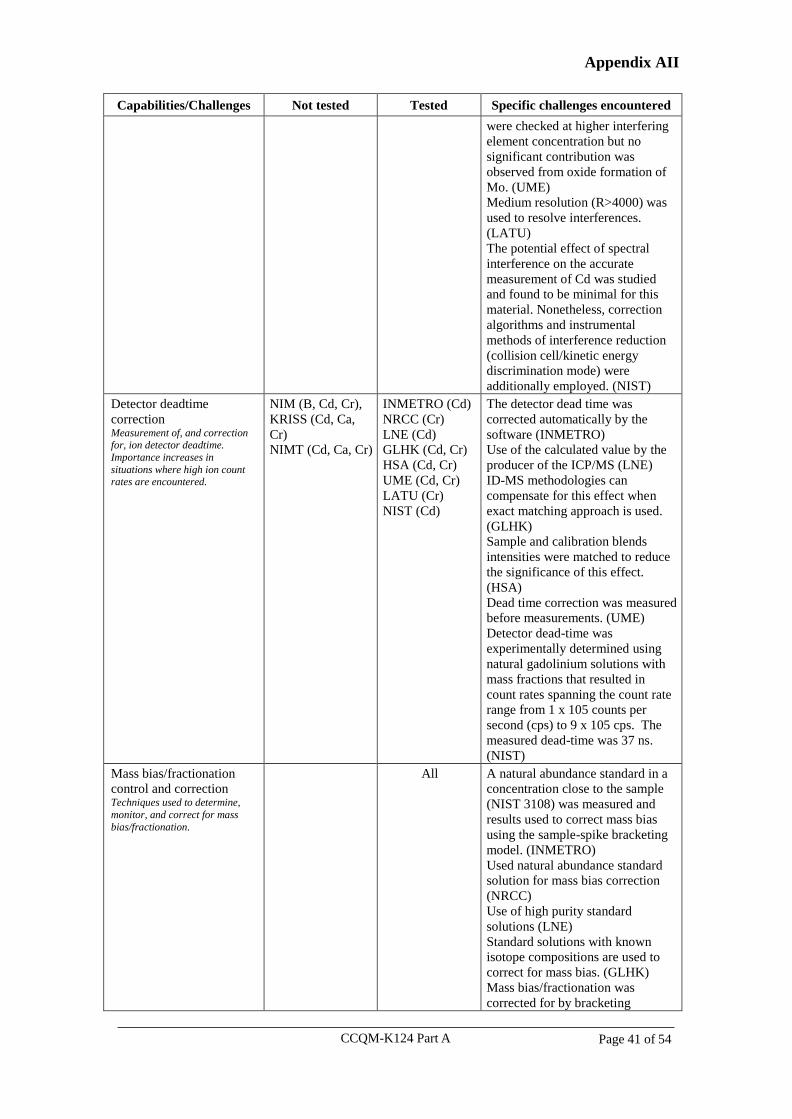
CCQM-K124 Part A Page 41 of 54
Appendix AII
Capabilities/Challenges Not tested Tested Specific challenges encountered
were checked at higher interfering
element concentration but no
significant contribution was
observed from oxide formation of
Mo. (UME)
Medium resolution (R>4000) was
used to resolve interferences.
(LATU)
The potential effect of spectral
interference on the accurate
measurement of Cd was studied
and found to be minimal for this
material. Nonetheless, correction
algorithms and instrumental
methods of interference reduction
(collision cell/kinetic energy
discrimination mode) were
additionally employed. (NIST)
Detector deadtime
correction Measurement of, and correction for, ion detector deadtime.
Importance increases in
situations where high ion count rates are encountered.
NIM (B, Cd, Cr),
KRISS (Cd, Ca,
Cr)
NIMT (Cd, Ca, Cr)
INMETRO (Cd)
NRCC (Cr)
LNE (Cd)
GLHK (Cd, Cr)
HSA (Cd, Cr)
UME (Cd, Cr)
LATU (Cr)
NIST (Cd)
The detector dead time was
corrected automatically by the
software (INMETRO)
Use of the calculated value by the
producer of the ICP/MS (LNE)
ID-MS methodologies can
compensate for this effect when
exact matching approach is used.
(GLHK)
Sample and calibration blends
intensities were matched to reduce
the significance of this effect.
(HSA)
Dead time correction was measured
before measurements. (UME)
Detector dead-time was
experimentally determined using
natural gadolinium solutions with
mass fractions that resulted in
count rates spanning the count rate
range from 1 x 10⁵ counts per
second (cps) to 9 x 10⁵ cps. The
measured dead-time was 37 ns.
(NIST)
Mass bias/fractionation
control and correction Techniques used to determine,
monitor, and correct for mass
bias/fractionation.
All A natural abundance standard in a
concentration close to the sample
(NIST 3108) was measured and
results used to correct mass bias
using the sample-spike bracketing
model. (INMETRO)
Used natural abundance standard
solution for mass bias correction
(NRCC)
Use of high purity standard
solutions (LNE)
Standard solutions with known
isotope compositions are used to
correct for mass bias. (GLHK)
Mass bias/fractionation was
corrected for by bracketing
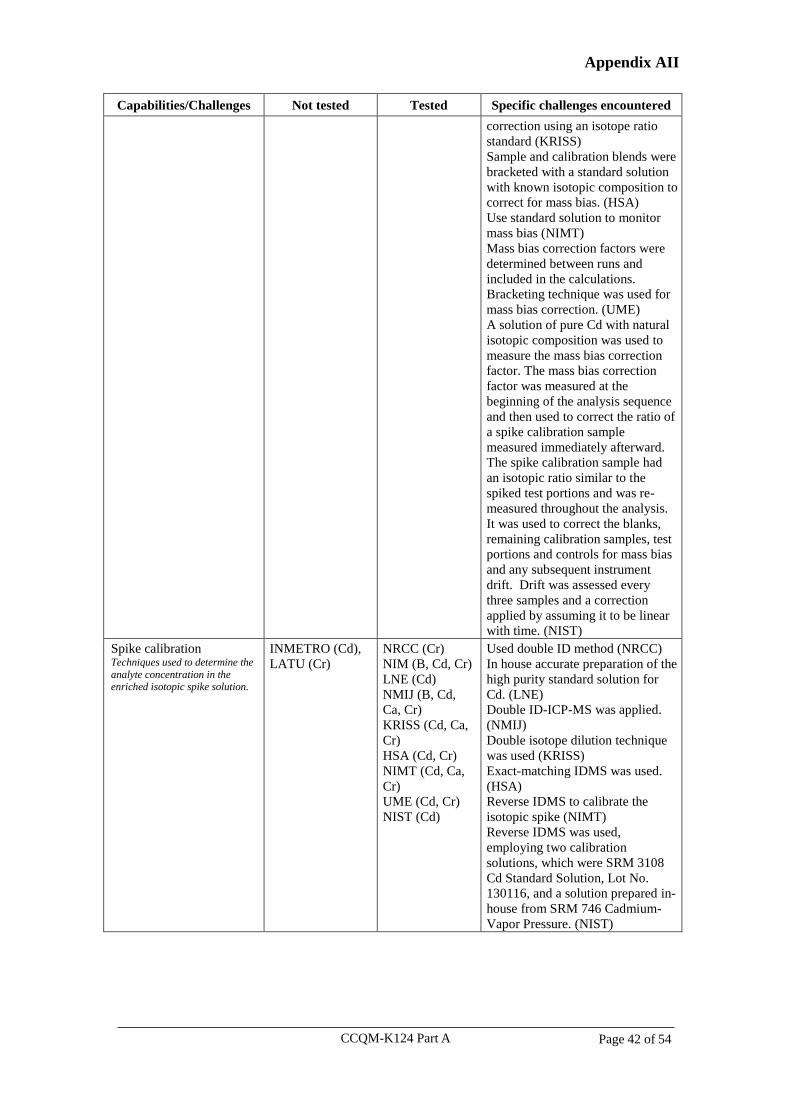
CCQM-K124 Part A Page 42 of 54
Appendix AII
Capabilities/Challenges Not tested Tested Specific challenges encountered
correction using an isotope ratio
standard (KRISS)
Sample and calibration blends were
bracketed with a standard solution
with known isotopic composition to
correct for mass bias. (HSA)
Use standard solution to monitor
mass bias (NIMT)
Mass bias correction factors were
determined between runs and
included in the calculations.
Bracketing technique was used for
mass bias correction. (UME)
A solution of pure Cd with natural
isotopic composition was used to
measure the mass bias correction
factor. The mass bias correction
factor was measured at the
beginning of the analysis sequence
and then used to correct the ratio of
a spike calibration sample
measured immediately afterward.
The spike calibration sample had
an isotopic ratio similar to the
spiked test portions and was re-
measured throughout the analysis.
It was used to correct the blanks,
remaining calibration samples, test
portions and controls for mass bias
and any subsequent instrument
drift. Drift was assessed every
three samples and a correction
applied by assuming it to be linear
with time. (NIST)
Spike calibration Techniques used to determine the
analyte concentration in the enriched isotopic spike solution.
INMETRO (Cd),
LATU (Cr)
NRCC (Cr)
NIM (B, Cd, Cr)
LNE (Cd)
NMIJ (B, Cd,
Ca, Cr)
KRISS (Cd, Ca,
Cr)
HSA (Cd, Cr)
NIMT (Cd, Ca,
Cr)
UME (Cd, Cr)
NIST (Cd)
Used double ID method (NRCC)
In house accurate preparation of the
high purity standard solution for
Cd. (LNE)
Double ID-ICP-MS was applied.
(NMIJ)
Double isotope dilution technique
was used (KRISS)
Exact-matching IDMS was used.
(HSA)
Reverse IDMS to calibrate the
isotopic spike (NIMT)
Reverse IDMS was used,
employing two calibration
solutions, which were SRM 3108
Cd Standard Solution, Lot No.
130116, and a solution prepared in-
house from SRM 746 Cadmium-
Vapor Pressure. (NIST)
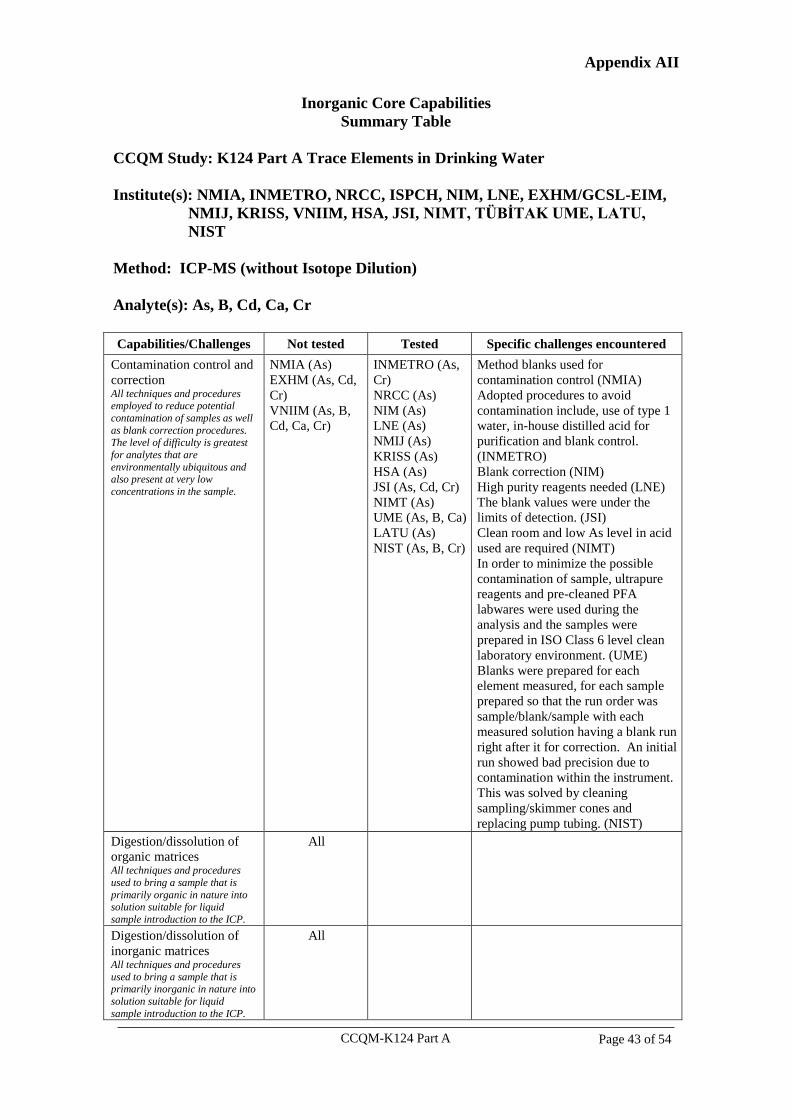
CCQM-K124 Part A Page 43 of 54
Appendix AII
Inorganic Core Capabilities
Summary Table
CCQM Study: K124 Part A Trace Elements in Drinking Water
Institute(s): NMIA, INMETRO, NRCC, ISPCH, NIM, LNE, EXHM/GCSL-EIM,
NMIJ, KRISS, VNIIM, HSA, JSI, NIMT, TÜBİTAK UME, LATU,
NIST
Method: ICP-MS (without Isotope Dilution)
Analyte(s): As, B, Cd, Ca, Cr
Capabilities/Challenges Not tested Tested Specific challenges encountered
Contamination control and
correction All techniques and procedures employed to reduce potential
contamination of samples as well
as blank correction procedures. The level of difficulty is greatest
for analytes that are
environmentally ubiquitous and also present at very low
concentrations in the sample.
NMIA (As)
EXHM (As, Cd,
Cr)
VNIIM (As, B,
Cd, Ca, Cr)
INMETRO (As,
Cr)
NRCC (As)
NIM (As)
LNE (As)
NMIJ (As)
KRISS (As)
HSA (As)
JSI (As, Cd, Cr)
NIMT (As)
UME (As, B, Ca)
LATU (As)
NIST (As, B, Cr)
Method blanks used for
contamination control (NMIA)
Adopted procedures to avoid
contamination include, use of type 1
water, in-house distilled acid for
purification and blank control.
(INMETRO)
Blank correction (NIM)
High purity reagents needed (LNE)
The blank values were under the
limits of detection. (JSI)
Clean room and low As level in acid
used are required (NIMT)
In order to minimize the possible
contamination of sample, ultrapure
reagents and pre-cleaned PFA
labwares were used during the
analysis and the samples were
prepared in ISO Class 6 level clean
laboratory environment. (UME)
Blanks were prepared for each
element measured, for each sample
prepared so that the run order was
sample/blank/sample with each
measured solution having a blank run
right after it for correction. An initial
run showed bad precision due to
contamination within the instrument.
This was solved by cleaning
sampling/skimmer cones and
replacing pump tubing. (NIST)
Digestion/dissolution of
organic matrices All techniques and procedures
used to bring a sample that is
primarily organic in nature into solution suitable for liquid
sample introduction to the ICP.
All
Digestion/dissolution of
inorganic matrices All techniques and procedures
used to bring a sample that is primarily inorganic in nature into
solution suitable for liquid
sample introduction to the ICP.
All
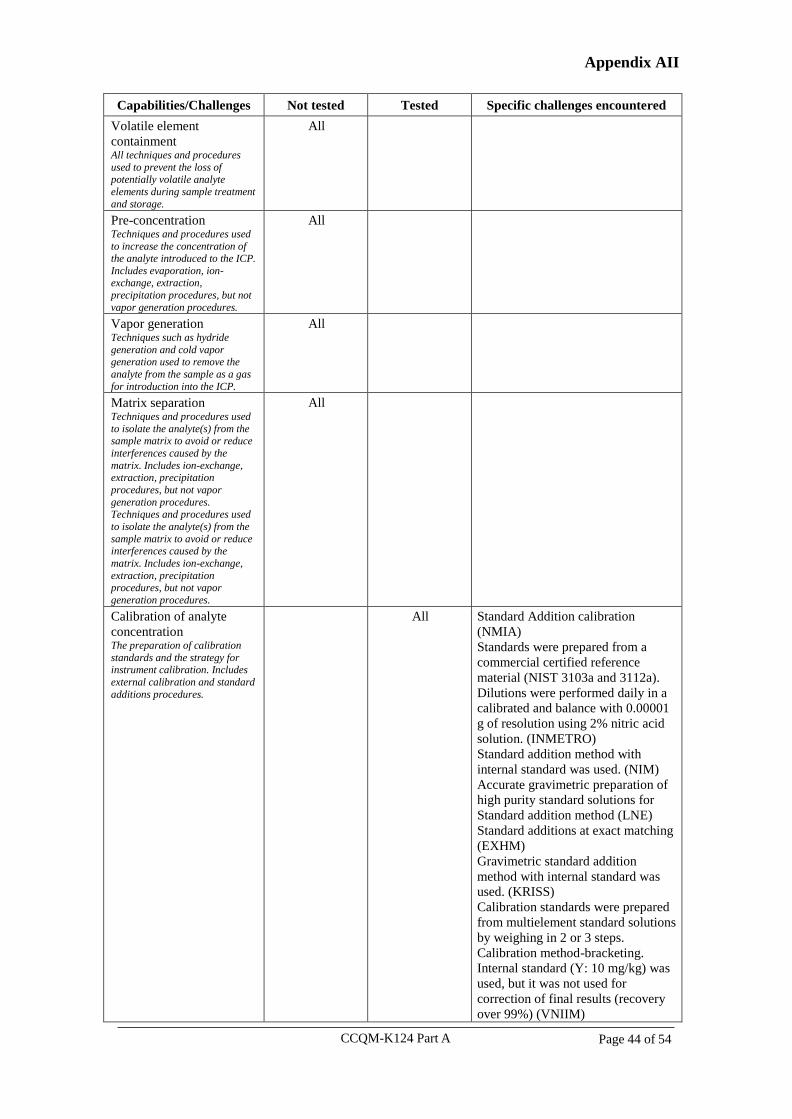
CCQM-K124 Part A Page 44 of 54
Appendix AII
Capabilities/Challenges Not tested Tested Specific challenges encountered
Volatile element
containment All techniques and procedures
used to prevent the loss of potentially volatile analyte
elements during sample treatment
and storage.
All
Pre-concentration Techniques and procedures used
to increase the concentration of the analyte introduced to the ICP.
Includes evaporation, ion-exchange, extraction,
precipitation procedures, but not
vapor generation procedures.
All
Vapor generation Techniques such as hydride
generation and cold vapor generation used to remove the
analyte from the sample as a gas
for introduction into the ICP.
All
Matrix separation Techniques and procedures used
to isolate the analyte(s) from the sample matrix to avoid or reduce
interferences caused by the
matrix. Includes ion-exchange, extraction, precipitation
procedures, but not vapor
generation procedures. Techniques and procedures used
to isolate the analyte(s) from the
sample matrix to avoid or reduce interferences caused by the
matrix. Includes ion-exchange,
extraction, precipitation procedures, but not vapor
generation procedures.
All
Calibration of analyte
concentration The preparation of calibration
standards and the strategy for instrument calibration. Includes
external calibration and standard
additions procedures.
All
Standard Addition calibration
(NMIA)
Standards were prepared from a
commercial certified reference
material (NIST 3103a and 3112a).
Dilutions were performed daily in a
calibrated and balance with 0.00001
g of resolution using 2% nitric acid
solution. (INMETRO)
Standard addition method with
internal standard was used. (NIM)
Accurate gravimetric preparation of
high purity standard solutions for
Standard addition method (LNE)
Standard additions at exact matching
(EXHM)
Gravimetric standard addition
method with internal standard was
used. (KRISS)
Calibration standards were prepared
from multielement standard solutions
by weighing in 2 or 3 steps.
Calibration method-bracketing.
Internal standard (Y: 10 mg/kg) was
used, but it was not used for
correction of final results (recovery
over 99%) (VNIIM)
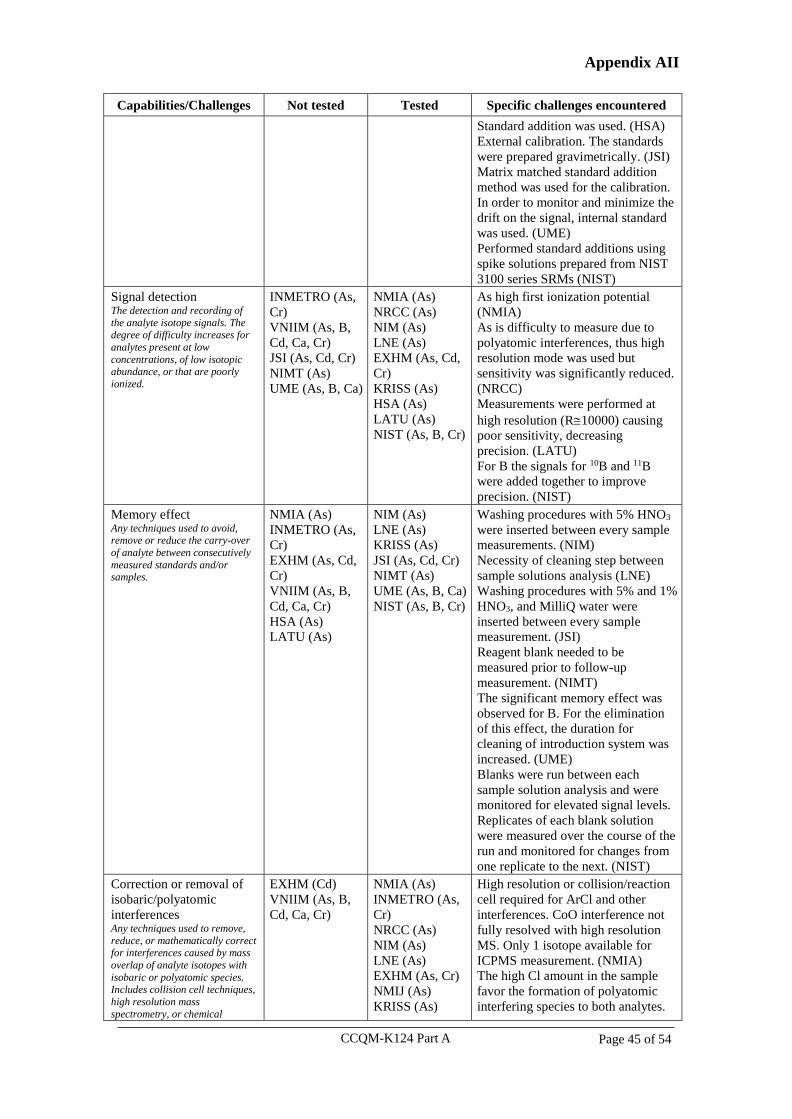
CCQM-K124 Part A Page 45 of 54
Appendix AII
Capabilities/Challenges Not tested Tested Specific challenges encountered
Standard addition was used. (HSA)
External calibration. The standards
were prepared gravimetrically. (JSI)
Matrix matched standard addition
method was used for the calibration.
In order to monitor and minimize the
drift on the signal, internal standard
was used. (UME)
Performed standard additions using
spike solutions prepared from NIST
3100 series SRMs (NIST)
Signal detection The detection and recording of
the analyte isotope signals. The degree of difficulty increases for
analytes present at low
concentrations, of low isotopic abundance, or that are poorly
ionized.
INMETRO (As,
Cr)
VNIIM (As, B,
Cd, Ca, Cr)
JSI (As, Cd, Cr)
NIMT (As)
UME (As, B, Ca)
NMIA (As)
NRCC (As)
NIM (As)
LNE (As)
EXHM (As, Cd,
Cr)
KRISS (As)
HSA (As)
LATU (As)
NIST (As, B, Cr)
As high first ionization potential
(NMIA)
As is difficulty to measure due to
polyatomic interferences, thus high
resolution mode was used but
sensitivity was significantly reduced.
(NRCC)
Measurements were performed at
high resolution (R10000) causing
poor sensitivity, decreasing
precision. (LATU)
For B the signals for 10B and 11B
were added together to improve
precision. (NIST)
Memory effect Any techniques used to avoid, remove or reduce the carry-over
of analyte between consecutively
measured standards and/or samples.
NMIA (As)
INMETRO (As,
Cr)
EXHM (As, Cd,
Cr)
VNIIM (As, B,
Cd, Ca, Cr)
HSA (As)
LATU (As)
NIM (As)
LNE (As)
KRISS (As)
JSI (As, Cd, Cr)
NIMT (As)
UME (As, B, Ca)
NIST (As, B, Cr)
Washing procedures with 5% HNO3
were inserted between every sample
measurements. (NIM)
Necessity of cleaning step between
sample solutions analysis (LNE)
Washing procedures with 5% and 1%
HNO3, and MilliQ water were
inserted between every sample
measurement. (JSI)
Reagent blank needed to be
measured prior to follow-up
measurement. (NIMT)
The significant memory effect was
observed for B. For the elimination
of this effect, the duration for
cleaning of introduction system was
increased. (UME)
Blanks were run between each
sample solution analysis and were
monitored for elevated signal levels.
Replicates of each blank solution
were measured over the course of the
run and monitored for changes from
one replicate to the next. (NIST)
Correction or removal of
isobaric/polyatomic
interferences Any techniques used to remove,
reduce, or mathematically correct for interferences caused by mass
overlap of analyte isotopes with
isobaric or polyatomic species. Includes collision cell techniques,
high resolution mass
spectrometry, or chemical
EXHM (Cd)
VNIIM (As, B,
Cd, Ca, Cr)
NMIA (As)
INMETRO (As,
Cr)
NRCC (As)
NIM (As)
LNE (As)
EXHM (As, Cr)
NMIJ (As)
KRISS (As)
High resolution or collision/reaction
cell required for ArCl and other
interferences. CoO interference not
fully resolved with high resolution
MS. Only 1 isotope available for
ICPMS measurement. (NMIA)
The high Cl amount in the sample
favor the formation of polyatomic
interfering species to both analytes.
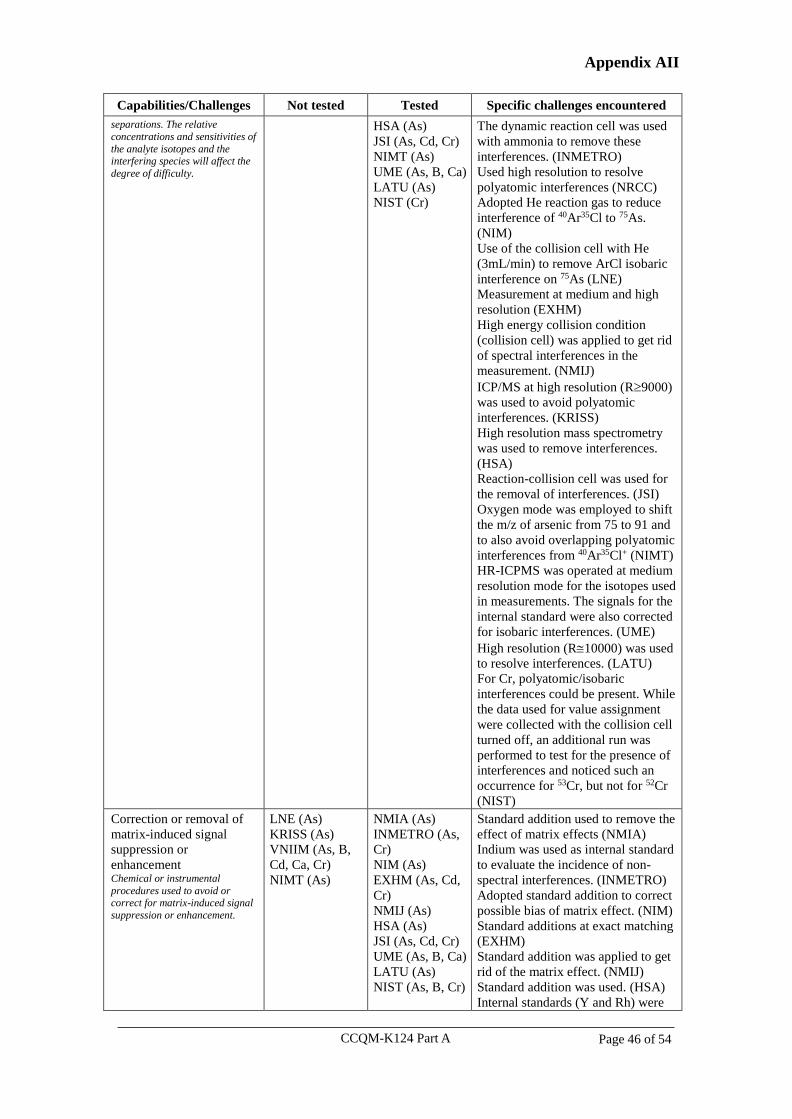
CCQM-K124 Part A Page 46 of 54
Appendix AII
Capabilities/Challenges Not tested Tested Specific challenges encountered
separations. The relative
concentrations and sensitivities of
the analyte isotopes and the interfering species will affect the
degree of difficulty.
HSA (As)
JSI (As, Cd, Cr)
NIMT (As)
UME (As, B, Ca)
LATU (As)
NIST (Cr)
The dynamic reaction cell was used
with ammonia to remove these
interferences. (INMETRO)
Used high resolution to resolve
polyatomic interferences (NRCC)
Adopted He reaction gas to reduce
interference of 40Ar35Cl to 75As.
(NIM)
Use of the collision cell with He
(3mL/min) to remove ArCl isobaric
interference on 75As (LNE)
Measurement at medium and high
resolution (EXHM)
High energy collision condition
(collision cell) was applied to get rid
of spectral interferences in the
measurement. (NMIJ)
ICP/MS at high resolution (R9000)
was used to avoid polyatomic
interferences. (KRISS)
High resolution mass spectrometry
was used to remove interferences.
(HSA)
Reaction-collision cell was used for
the removal of interferences. (JSI)
Oxygen mode was employed to shift
the m/z of arsenic from 75 to 91 and
to also avoid overlapping polyatomic
interferences from 40Ar35Cl+ (NIMT)
HR-ICPMS was operated at medium
resolution mode for the isotopes used
in measurements. The signals for the
internal standard were also corrected
for isobaric interferences. (UME)
High resolution (R10000) was used
to resolve interferences. (LATU)
For Cr, polyatomic/isobaric
interferences could be present. While
the data used for value assignment
were collected with the collision cell
turned off, an additional run was
performed to test for the presence of
interferences and noticed such an
occurrence for 53Cr, but not for 52Cr
(NIST)
Correction or removal of
matrix-induced signal
suppression or
enhancement Chemical or instrumental
procedures used to avoid or correct for matrix-induced signal
suppression or enhancement.
LNE (As)
KRISS (As)
VNIIM (As, B,
Cd, Ca, Cr)
NIMT (As)
NMIA (As)
INMETRO (As,
Cr)
NIM (As)
EXHM (As, Cd,
Cr)
NMIJ (As)
HSA (As)
JSI (As, Cd, Cr)
UME (As, B, Ca)
LATU (As)
NIST (As, B, Cr)
Standard addition used to remove the
effect of matrix effects (NMIA)
Indium was used as internal standard
to evaluate the incidence of non-
spectral interferences. (INMETRO)
Adopted standard addition to correct
possible bias of matrix effect. (NIM)
Standard additions at exact matching
(EXHM)
Standard addition was applied to get
rid of the matrix effect. (NMIJ)
Standard addition was used. (HSA)
Internal standards (Y and Rh) were
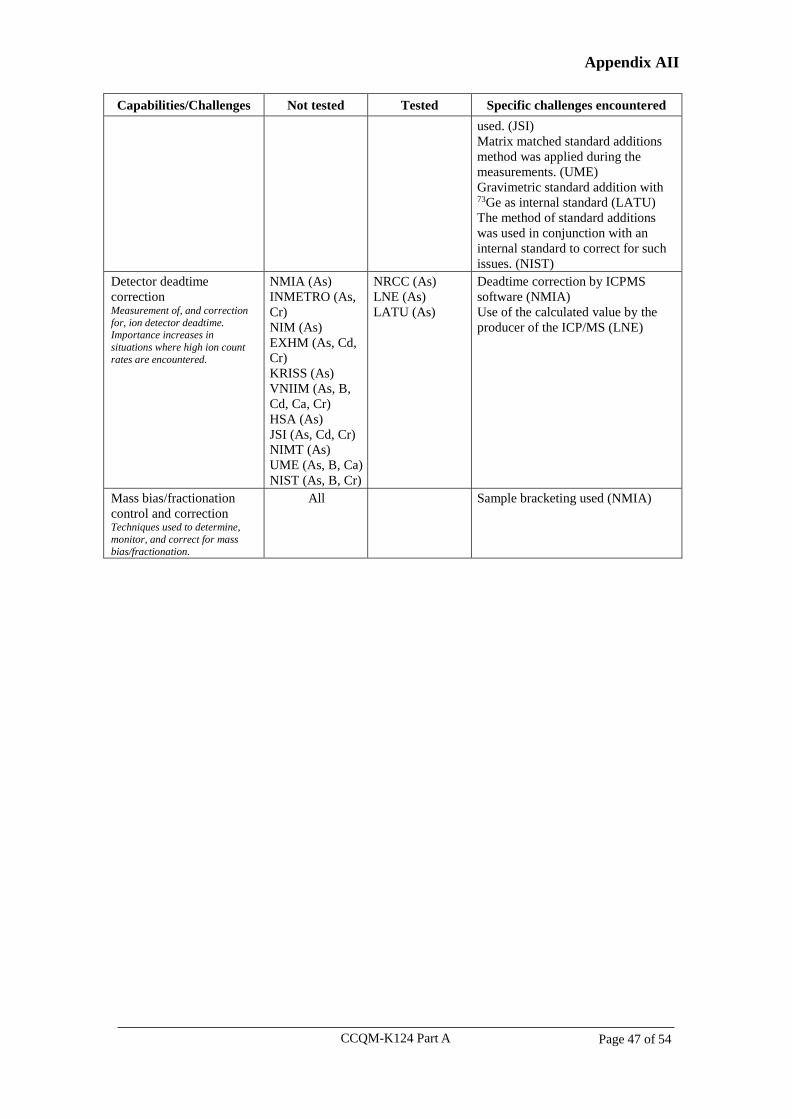
CCQM-K124 Part A Page 47 of 54
Appendix AII
Capabilities/Challenges Not tested Tested Specific challenges encountered
used. (JSI)
Matrix matched standard additions
method was applied during the
measurements. (UME)
Gravimetric standard addition with 73Ge as internal standard (LATU)
The method of standard additions
was used in conjunction with an
internal standard to correct for such
issues. (NIST)
Detector deadtime
correction Measurement of, and correction
for, ion detector deadtime. Importance increases in
situations where high ion count
rates are encountered.
NMIA (As)
INMETRO (As,
Cr)
NIM (As)
EXHM (As, Cd,
Cr)
KRISS (As)
VNIIM (As, B,
Cd, Ca, Cr)
HSA (As)
JSI (As, Cd, Cr)
NIMT (As)
UME (As, B, Ca)
NIST (As, B, Cr)
NRCC (As)
LNE (As)
LATU (As)
Deadtime correction by ICPMS
software (NMIA)
Use of the calculated value by the
producer of the ICP/MS (LNE)
Mass bias/fractionation
control and correction Techniques used to determine,
monitor, and correct for mass
bias/fractionation.
All Sample bracketing used (NMIA)
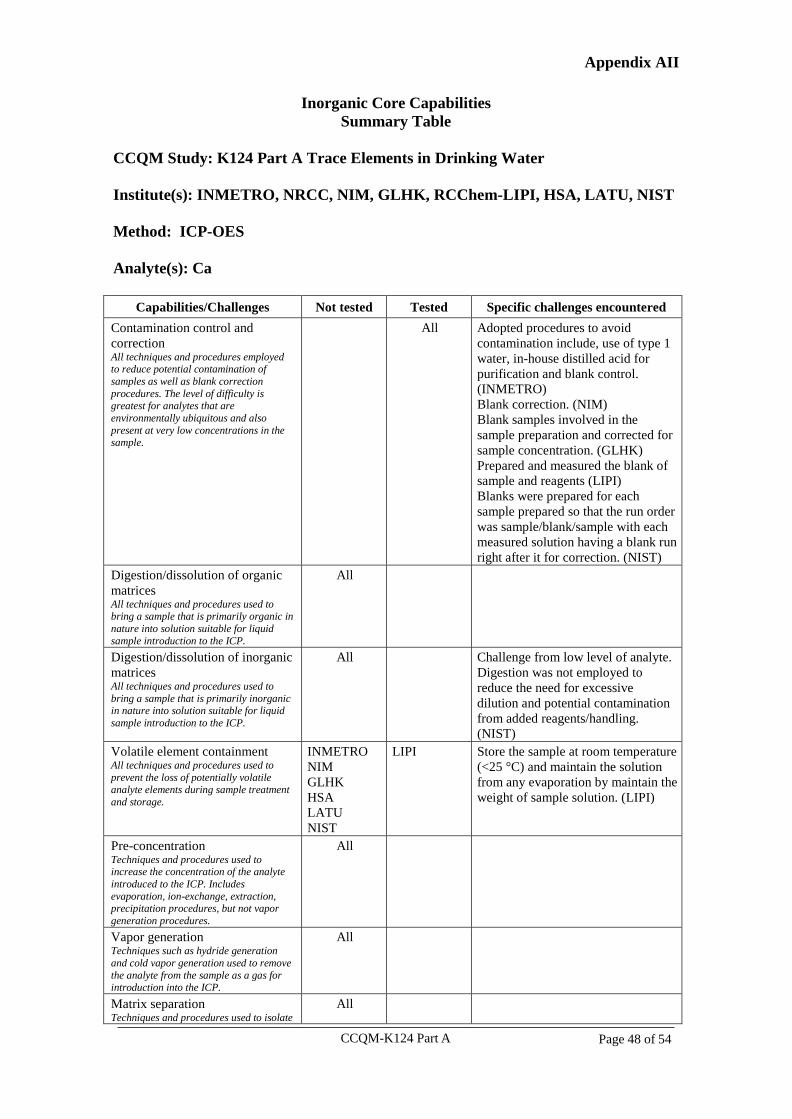
CCQM-K124 Part A Page 48 of 54
Appendix AII
Inorganic Core Capabilities
Summary Table
CCQM Study: K124 Part A Trace Elements in Drinking Water
Institute(s): INMETRO, NRCC, NIM, GLHK, RCChem-LIPI, HSA, LATU, NIST
Method: ICP-OES
Analyte(s): Ca
Capabilities/Challenges Not tested Tested Specific challenges encountered
Contamination control and
correction All techniques and procedures employed to reduce potential contamination of
samples as well as blank correction
procedures. The level of difficulty is greatest for analytes that are
environmentally ubiquitous and also
present at very low concentrations in the sample.
All Adopted procedures to avoid
contamination include, use of type 1
water, in-house distilled acid for
purification and blank control.
(INMETRO)
Blank correction. (NIM)
Blank samples involved in the
sample preparation and corrected for
sample concentration. (GLHK)
Prepared and measured the blank of
sample and reagents (LIPI)
Blanks were prepared for each
sample prepared so that the run order
was sample/blank/sample with each
measured solution having a blank run
right after it for correction. (NIST)
Digestion/dissolution of organic
matrices All techniques and procedures used to bring a sample that is primarily organic in
nature into solution suitable for liquid
sample introduction to the ICP.
All
Digestion/dissolution of inorganic
matrices All techniques and procedures used to
bring a sample that is primarily inorganic in nature into solution suitable for liquid
sample introduction to the ICP.
All Challenge from low level of analyte.
Digestion was not employed to
reduce the need for excessive
dilution and potential contamination
from added reagents/handling.
(NIST)
Volatile element containment All techniques and procedures used to
prevent the loss of potentially volatile analyte elements during sample treatment
and storage.
INMETRO
NIM
GLHK
HSA
LATU
NIST
LIPI Store the sample at room temperature
(<25 °C) and maintain the solution
from any evaporation by maintain the
weight of sample solution. (LIPI)
Pre-concentration Techniques and procedures used to increase the concentration of the analyte
introduced to the ICP. Includes
evaporation, ion-exchange, extraction, precipitation procedures, but not vapor
generation procedures.
All
Vapor generation Techniques such as hydride generation
and cold vapor generation used to remove
the analyte from the sample as a gas for introduction into the ICP.
All
Matrix separation Techniques and procedures used to isolate
All
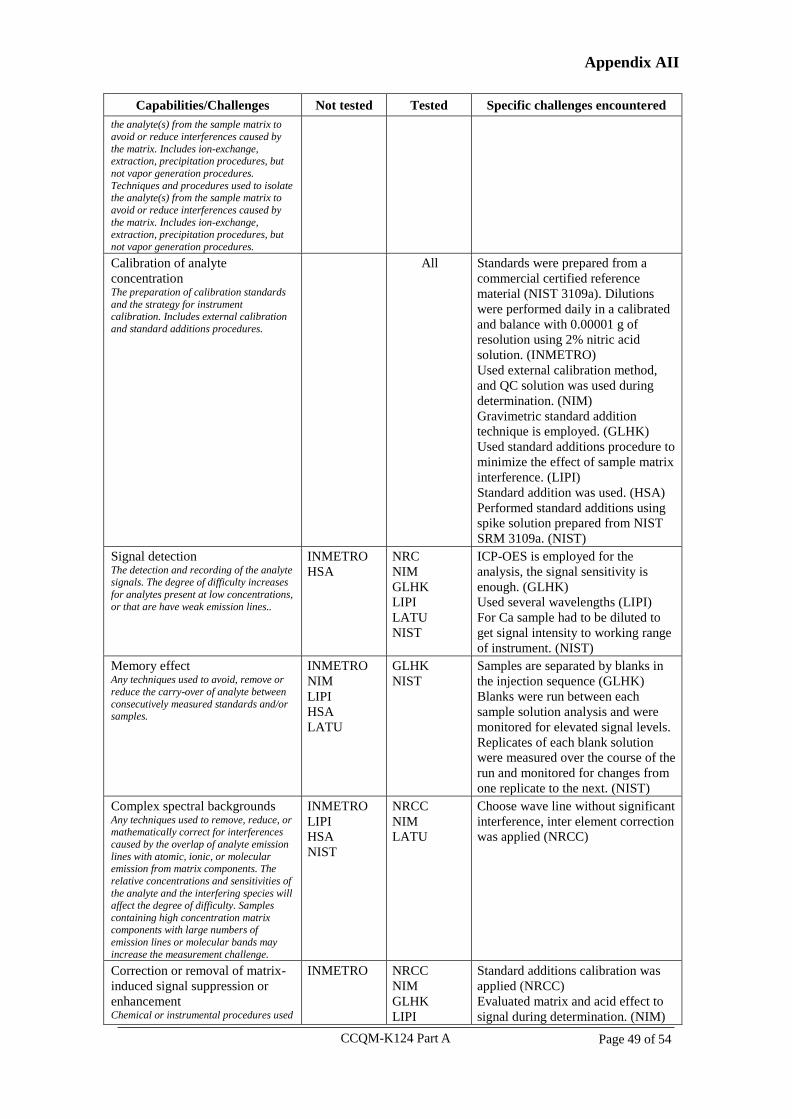
CCQM-K124 Part A Page 49 of 54
Appendix AII
Capabilities/Challenges Not tested Tested Specific challenges encountered
the analyte(s) from the sample matrix to
avoid or reduce interferences caused by
the matrix. Includes ion-exchange, extraction, precipitation procedures, but
not vapor generation procedures.
Techniques and procedures used to isolate the analyte(s) from the sample matrix to
avoid or reduce interferences caused by
the matrix. Includes ion-exchange, extraction, precipitation procedures, but
not vapor generation procedures. Calibration of analyte
concentration The preparation of calibration standards
and the strategy for instrument calibration. Includes external calibration
and standard additions procedures.
All Standards were prepared from a
commercial certified reference
material (NIST 3109a). Dilutions
were performed daily in a calibrated
and balance with 0.00001 g of
resolution using 2% nitric acid
solution. (INMETRO)
Used external calibration method,
and QC solution was used during
determination. (NIM)
Gravimetric standard addition
technique is employed. (GLHK)
Used standard additions procedure to
minimize the effect of sample matrix
interference. (LIPI)
Standard addition was used. (HSA)
Performed standard additions using
spike solution prepared from NIST
SRM 3109a. (NIST)
Signal detection The detection and recording of the analyte signals. The degree of difficulty increases
for analytes present at low concentrations,
or that are have weak emission lines..
INMETRO
HSA
NRC
NIM
GLHK
LIPI
LATU
NIST
ICP-OES is employed for the
analysis, the signal sensitivity is
enough. (GLHK)
Used several wavelengths (LIPI)
For Ca sample had to be diluted to
get signal intensity to working range
of instrument. (NIST)
Memory effect Any techniques used to avoid, remove or
reduce the carry-over of analyte between
consecutively measured standards and/or samples.
INMETRO
NIM
LIPI
HSA
LATU
GLHK
NIST
Samples are separated by blanks in
the injection sequence (GLHK)
Blanks were run between each
sample solution analysis and were
monitored for elevated signal levels.
Replicates of each blank solution
were measured over the course of the
run and monitored for changes from
one replicate to the next. (NIST)
Complex spectral backgrounds Any techniques used to remove, reduce, or mathematically correct for interferences
caused by the overlap of analyte emission
lines with atomic, ionic, or molecular emission from matrix components. The
relative concentrations and sensitivities of
the analyte and the interfering species will affect the degree of difficulty. Samples
containing high concentration matrix components with large numbers of
emission lines or molecular bands may
increase the measurement challenge.
INMETRO
LIPI
HSA
NIST
NRCC
NIM
LATU
Choose wave line without significant
interference, inter element correction
was applied (NRCC)
Correction or removal of matrix-
induced signal suppression or
enhancement Chemical or instrumental procedures used
INMETRO NRCC
NIM
GLHK
LIPI
Standard additions calibration was
applied (NRCC)
Evaluated matrix and acid effect to
signal during determination. (NIM)
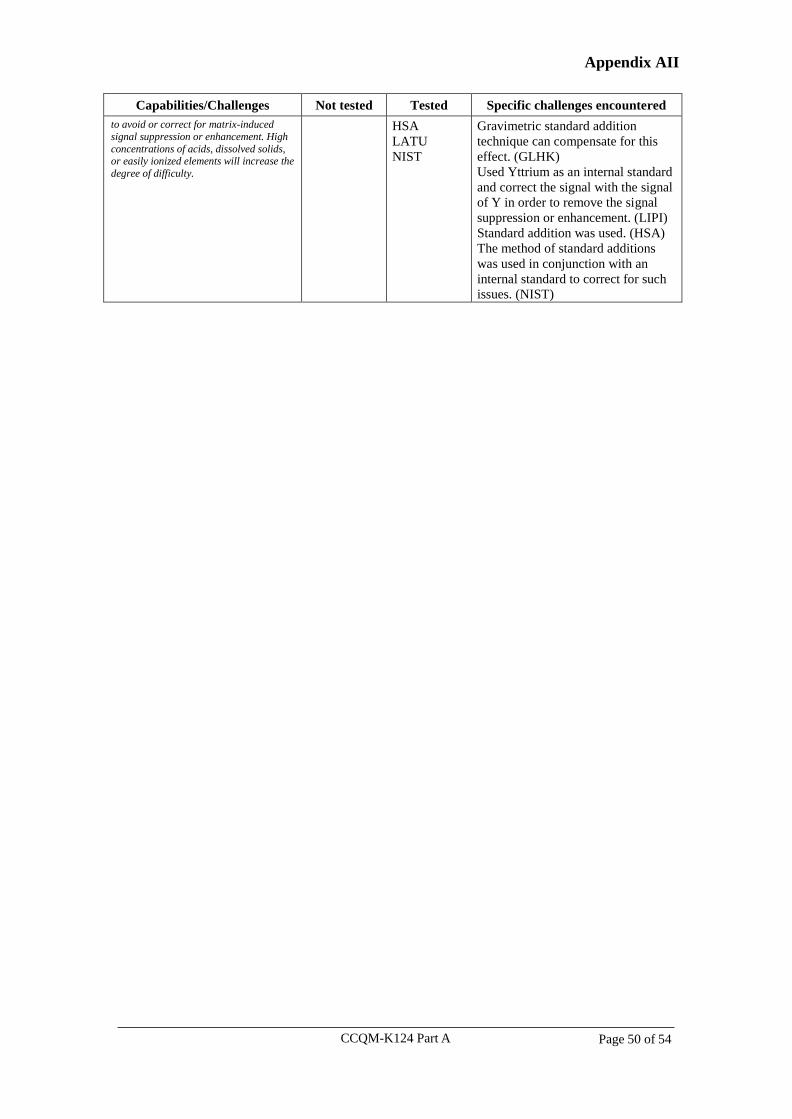
CCQM-K124 Part A Page 50 of 54
Appendix AII
Capabilities/Challenges Not tested Tested Specific challenges encountered
to avoid or correct for matrix-induced
signal suppression or enhancement. High
concentrations of acids, dissolved solids, or easily ionized elements will increase the
degree of difficulty.
HSA
LATU
NIST
Gravimetric standard addition
technique can compensate for this
effect. (GLHK)
Used Yttrium as an internal standard
and correct the signal with the signal
of Y in order to remove the signal
suppression or enhancement. (LIPI)
Standard addition was used. (HSA)
The method of standard additions
was used in conjunction with an
internal standard to correct for such
issues. (NIST)
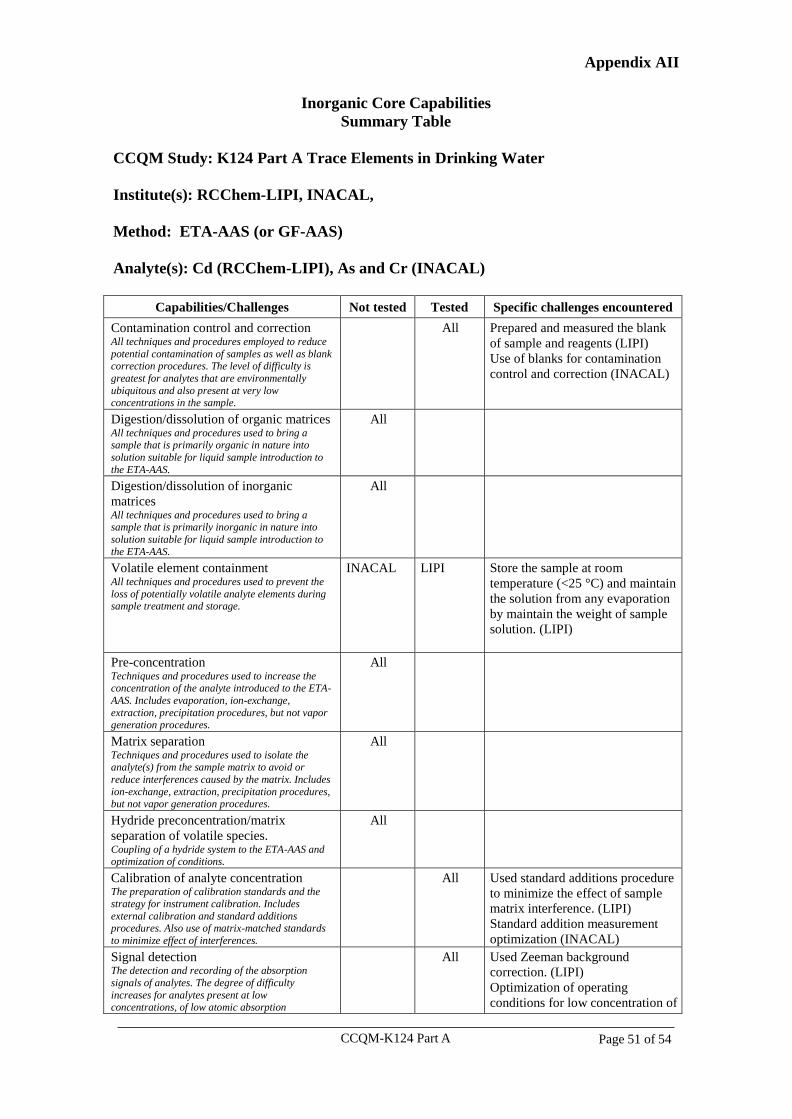
CCQM-K124 Part A Page 51 of 54
Appendix AII
Inorganic Core Capabilities
Summary Table
CCQM Study: K124 Part A Trace Elements in Drinking Water
Institute(s): RCChem-LIPI, INACAL,
Method: ETA-AAS (or GF-AAS)
Analyte(s): Cd (RCChem-LIPI), As and Cr (INACAL)
Capabilities/Challenges Not tested Tested Specific challenges encountered
Contamination control and correction All techniques and procedures employed to reduce
potential contamination of samples as well as blank correction procedures. The level of difficulty is
greatest for analytes that are environmentally
ubiquitous and also present at very low concentrations in the sample.
All Prepared and measured the blank
of sample and reagents (LIPI)
Use of blanks for contamination
control and correction (INACAL)
Digestion/dissolution of organic matrices All techniques and procedures used to bring a sample that is primarily organic in nature into
solution suitable for liquid sample introduction to
the ETA-AAS.
All
Digestion/dissolution of inorganic
matrices All techniques and procedures used to bring a sample that is primarily inorganic in nature into
solution suitable for liquid sample introduction to
the ETA-AAS.
All
Volatile element containment All techniques and procedures used to prevent the
loss of potentially volatile analyte elements during sample treatment and storage.
INACAL LIPI Store the sample at room
temperature (<25 °C) and maintain
the solution from any evaporation
by maintain the weight of sample
solution. (LIPI)
Pre-concentration Techniques and procedures used to increase the concentration of the analyte introduced to the ETA-
AAS. Includes evaporation, ion-exchange,
extraction, precipitation procedures, but not vapor generation procedures.
All
Matrix separation Techniques and procedures used to isolate the analyte(s) from the sample matrix to avoid or
reduce interferences caused by the matrix. Includes
ion-exchange, extraction, precipitation procedures, but not vapor generation procedures.
All
Hydride preconcentration/matrix
separation of volatile species. Coupling of a hydride system to the ETA-AAS and optimization of conditions.
All
Calibration of analyte concentration The preparation of calibration standards and the strategy for instrument calibration. Includes
external calibration and standard additions procedures. Also use of matrix-matched standards
to minimize effect of interferences.
All Used standard additions procedure
to minimize the effect of sample
matrix interference. (LIPI)
Standard addition measurement
optimization (INACAL)
Signal detection The detection and recording of the absorption
signals of analytes. The degree of difficulty
increases for analytes present at low concentrations, of low atomic absorption
All Used Zeeman background
correction. (LIPI)
Optimization of operating
conditions for low concentration of
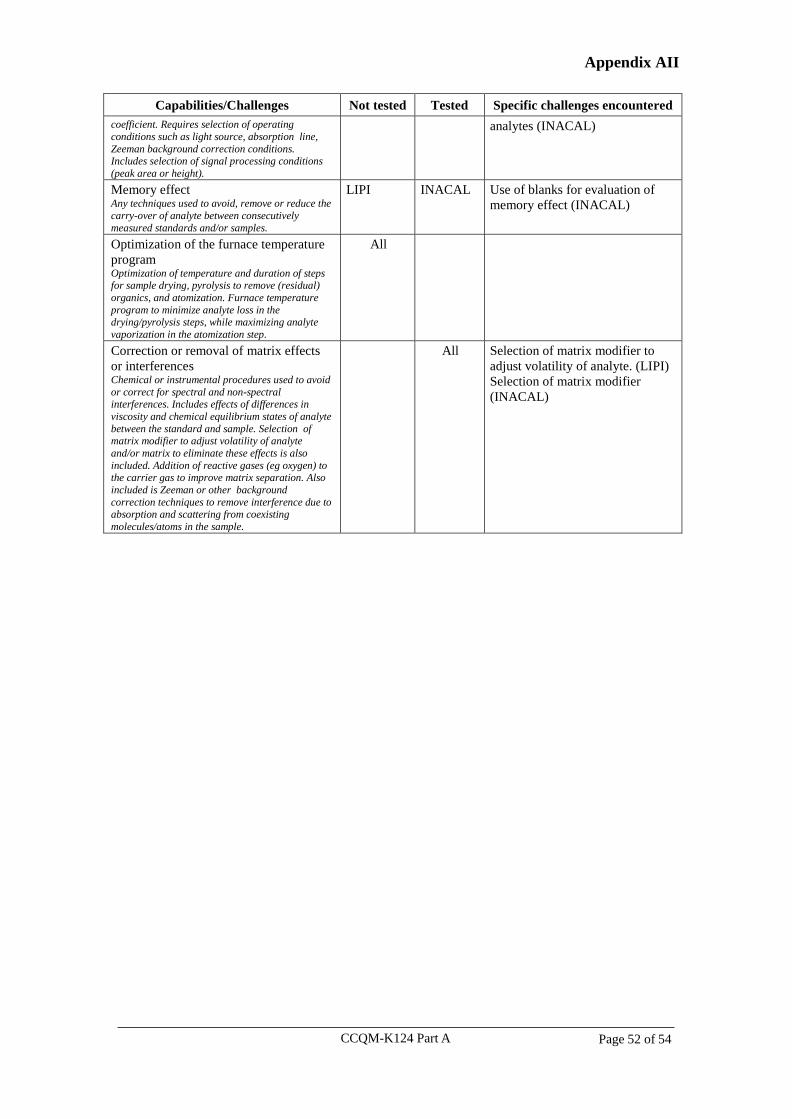
CCQM-K124 Part A Page 52 of 54
Appendix AII
Capabilities/Challenges Not tested Tested Specific challenges encountered
coefficient. Requires selection of operating
conditions such as light source, absorption line,
Zeeman background correction conditions. Includes selection of signal processing conditions
(peak area or height).
analytes (INACAL)
Memory effect Any techniques used to avoid, remove or reduce the
carry-over of analyte between consecutively
measured standards and/or samples.
LIPI
INACAL Use of blanks for evaluation of
memory effect (INACAL)
Optimization of the furnace temperature
program Optimization of temperature and duration of steps for sample drying, pyrolysis to remove (residual)
organics, and atomization. Furnace temperature
program to minimize analyte loss in the drying/pyrolysis steps, while maximizing analyte
vaporization in the atomization step.
All
Correction or removal of matrix effects
or interferences Chemical or instrumental procedures used to avoid
or correct for spectral and non-spectral interferences. Includes effects of differences in
viscosity and chemical equilibrium states of analyte
between the standard and sample. Selection of matrix modifier to adjust volatility of analyte
and/or matrix to eliminate these effects is also
included. Addition of reactive gases (eg oxygen) to the carrier gas to improve matrix separation. Also
included is Zeeman or other background
correction techniques to remove interference due to absorption and scattering from coexisting
molecules/atoms in the sample.
All Selection of matrix modifier to
adjust volatility of analyte. (LIPI)
Selection of matrix modifier
(INACAL)
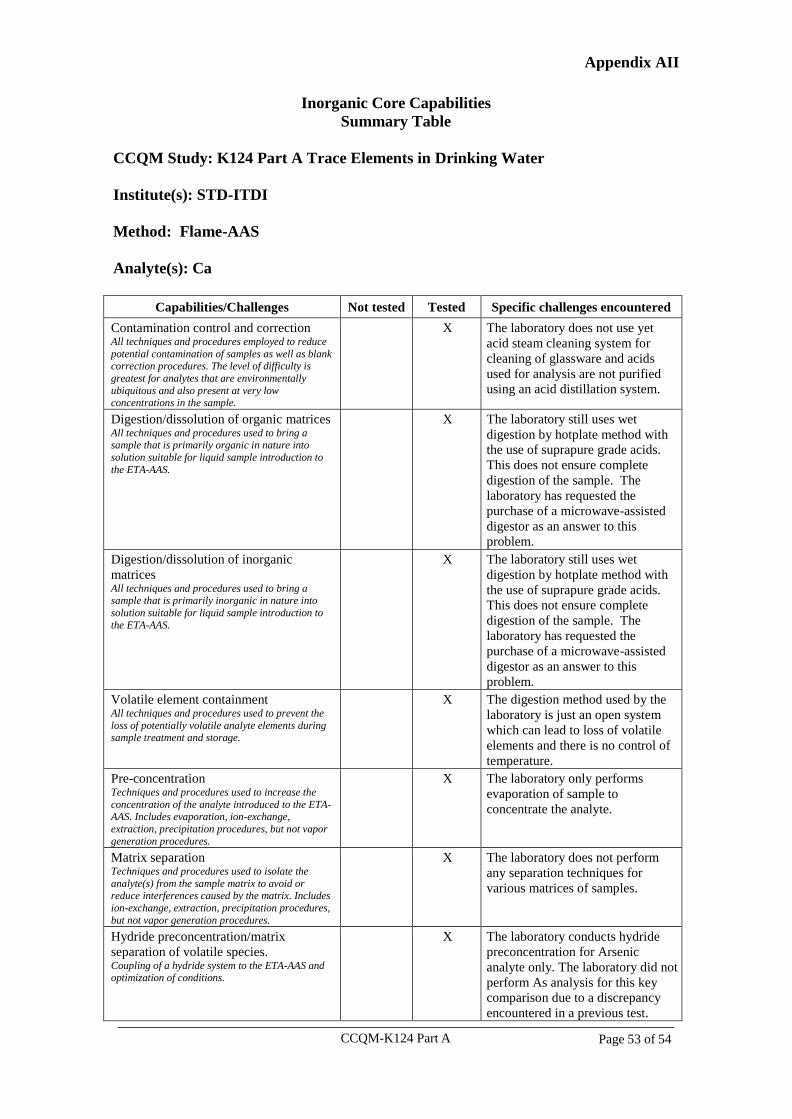
CCQM-K124 Part A Page 53 of 54
Appendix AII
Inorganic Core Capabilities
Summary Table
CCQM Study: K124 Part A Trace Elements in Drinking Water
Institute(s): STD-ITDI
Method: Flame-AAS
Analyte(s): Ca
Capabilities/Challenges Not tested Tested Specific challenges encountered
Contamination control and correction All techniques and procedures employed to reduce
potential contamination of samples as well as blank correction procedures. The level of difficulty is
greatest for analytes that are environmentally
ubiquitous and also present at very low concentrations in the sample.
X The laboratory does not use yet
acid steam cleaning system for
cleaning of glassware and acids
used for analysis are not purified
using an acid distillation system.
Digestion/dissolution of organic matrices All techniques and procedures used to bring a sample that is primarily organic in nature into
solution suitable for liquid sample introduction to
the ETA-AAS.
X The laboratory still uses wet
digestion by hotplate method with
the use of suprapure grade acids.
This does not ensure complete
digestion of the sample. The
laboratory has requested the
purchase of a microwave-assisted
digestor as an answer to this
problem.
Digestion/dissolution of inorganic
matrices All techniques and procedures used to bring a sample that is primarily inorganic in nature into
solution suitable for liquid sample introduction to
the ETA-AAS.
X The laboratory still uses wet
digestion by hotplate method with
the use of suprapure grade acids.
This does not ensure complete
digestion of the sample. The
laboratory has requested the
purchase of a microwave-assisted
digestor as an answer to this
problem.
Volatile element containment All techniques and procedures used to prevent the
loss of potentially volatile analyte elements during sample treatment and storage.
X The digestion method used by the
laboratory is just an open system
which can lead to loss of volatile
elements and there is no control of
temperature.
Pre-concentration Techniques and procedures used to increase the
concentration of the analyte introduced to the ETA-
AAS. Includes evaporation, ion-exchange,
extraction, precipitation procedures, but not vapor
generation procedures.
X The laboratory only performs
evaporation of sample to
concentrate the analyte.
Matrix separation Techniques and procedures used to isolate the
analyte(s) from the sample matrix to avoid or reduce interferences caused by the matrix. Includes
ion-exchange, extraction, precipitation procedures,
but not vapor generation procedures.
X The laboratory does not perform
any separation techniques for
various matrices of samples.
Hydride preconcentration/matrix
separation of volatile species. Coupling of a hydride system to the ETA-AAS and optimization of conditions.
X The laboratory conducts hydride
preconcentration for Arsenic
analyte only. The laboratory did not
perform As analysis for this key
comparison due to a discrepancy
encountered in a previous test.
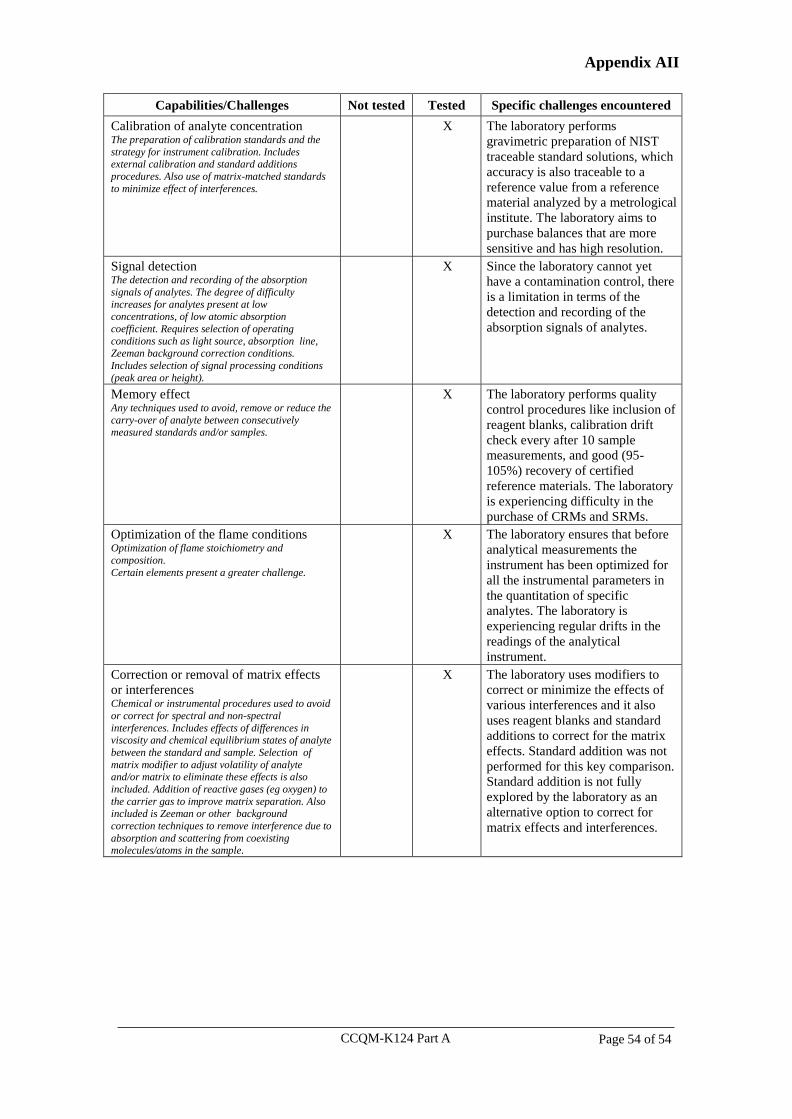
CCQM-K124 Part A Page 54 of 54
Appendix AII
Capabilities/Challenges Not tested Tested Specific challenges encountered
Calibration of analyte concentration The preparation of calibration standards and the
strategy for instrument calibration. Includes external calibration and standard additions
procedures. Also use of matrix-matched standards
to minimize effect of interferences.
X The laboratory performs
gravimetric preparation of NIST
traceable standard solutions, which
accuracy is also traceable to a
reference value from a reference
material analyzed by a metrological
institute. The laboratory aims to
purchase balances that are more
sensitive and has high resolution.
Signal detection The detection and recording of the absorption
signals of analytes. The degree of difficulty
increases for analytes present at low concentrations, of low atomic absorption
coefficient. Requires selection of operating
conditions such as light source, absorption line,
Zeeman background correction conditions.
Includes selection of signal processing conditions
(peak area or height).
X Since the laboratory cannot yet
have a contamination control, there
is a limitation in terms of the
detection and recording of the
absorption signals of analytes.
Memory effect Any techniques used to avoid, remove or reduce the
carry-over of analyte between consecutively measured standards and/or samples.
X The laboratory performs quality
control procedures like inclusion of
reagent blanks, calibration drift
check every after 10 sample
measurements, and good (95-
105%) recovery of certified
reference materials. The laboratory
is experiencing difficulty in the
purchase of CRMs and SRMs.
Optimization of the flame conditions Optimization of flame stoichiometry and
composition.
Certain elements present a greater challenge.
X The laboratory ensures that before
analytical measurements the
instrument has been optimized for
all the instrumental parameters in
the quantitation of specific
analytes. The laboratory is
experiencing regular drifts in the
readings of the analytical
instrument.
Correction or removal of matrix effects
or interferences Chemical or instrumental procedures used to avoid
or correct for spectral and non-spectral
interferences. Includes effects of differences in viscosity and chemical equilibrium states of analyte
between the standard and sample. Selection of
matrix modifier to adjust volatility of analyte and/or matrix to eliminate these effects is also
included. Addition of reactive gases (eg oxygen) to
the carrier gas to improve matrix separation. Also included is Zeeman or other background
correction techniques to remove interference due to
absorption and scattering from coexisting molecules/atoms in the sample.
X The laboratory uses modifiers to
correct or minimize the effects of
various interferences and it also
uses reagent blanks and standard
additions to correct for the matrix
effects. Standard addition was not
performed for this key comparison.
Standard addition is not fully
explored by the laboratory as an
alternative option to correct for
matrix effects and interferences.
CCQM-K124
Part B: Chromium Speciation in Drinking Water
Final Report
Authors:
Jingbo Chao, Jun Wang (NIM)1, Elias Kakoulides (EXHM/GCSL-EIM)2, Della Wai-
Mei Sin, Alvin Wai-Hong Fung (GLHK)3, Judith Velina Lara Manzano (CENAM)4,
Hanen Klich (INRAP)5, Oktay Cankur, Betül Ari, Süleyman Z. Can
(TÜBİTAK_UME)6, Heidi Goenaga Infante (LGC)7
1National Institute of Metrology, P. R. China 2General Chemical State Laboratory, Greece 3Government Laboratory, Hong Kong SAR, P. R. China 4Centro Nacional De Metrología, Mexico 5National Institute of Research and Physical Chemical Analysis, Tunisia 6TUBITAK Ulusal Metroloji Enstitüsü, Turkey 7LGC, United Kingdom
Coordinated by GLHK
November 2016
CCQM-K124 Part B
Abstract
CCQM-K124 was an activity of the Inorganic Analysis Working Group (IAWG) and
was jointly coordinated by the National Metrology Institute of Japan (NMIJ) and the
Government Laboratory, Hong Kong SAR (GLHK). The Part B of CCQM-K124 was
organised by GLHK and hexavalent chromium (Cr(VI)) in drinking water was the
measurand.
The Part B of the key comparison was undertaken for NMIs and DIs to demonstrate
their capabilities in measuring part-per-billion level (in µg/kg) of hexavalent
chromium in drinking water. It should also facilitate the acquisition of claims in
Calibration and Measurement Capabilities (CMCs) as listed in Appendix C of Key
Comparison Database (KCDB) under the Mutual Recognition Arrangement of the
International Committee of Weights and Measures (CIPM MRA).
Results were summited by six NMIs and one DI. The methods applied were direct
measurement using 1,5-diphenylcarbazide (DPC) derivatisation UV-visible
spectrophotometry, standard addition using ion chromatography—UV-visible
spectrophotometry or HPLC—inductively coupled plasma-mass spectrometry (ICP-
MS) and isotope dilution technique with ion chromatography—ICP-MS.
CCQM-K124 Part B Page 1 of 26
Table of Content
Page
1 Introduction 2-3
2 Participating Institutes 4
3 Samples and Instructions to Participants 4-8
3.1 Material 4-5
3.2 Homogeneity and Stability Studies 5-7
3.3 Instructions to Participants 7-8
4 Methods of Measurement 8
5 Results and Discussion 9-13
5.1 General 9
5.2 Traceability of Calibrants used by Participants 10
5.3 Calculation of the Reference Mass Fraction Value and Associated
Uncertainties
10-11
5.4 Equivalence Statements 12-13
6 Demonstration of Core Capabilities 14
7 Conclusions 14
CCQM-K124 Part B Page 2 of 25
1. Introduction
CCQM-K124 is divided into two parts — Part A: Trace elements in drinking water,
and Part B: Chromium speciation in drinking water. The Part B key comparison is
coordinated by the Government Laboratory of Hong Kong SAR (GLHK). Drinking
water, which was purchased from local markets in Hong Kong, fortified with various
chromium species was prepared as the test material.
Chromium exhibits a wide range of possible oxidation states. Elemental metal,
trivalent chromium [Cr(III)] and hexavalent chromium [Cr(VI)] are the most
commonly observed chromium species in environment. Chromium in water supplies
can be either from naturally occurring sources or as the result of industrial activities.
Because of the widespread use of Cr in many industrial activities, industrial wastes
and effluents become the dominant source of Cr releasing to surface water and
groundwater.
WHO has established a guideline value of 0.05 mg/L for total Cr in drinking water.
Many governments and safety regulatory agencies have also set maximum allowable
limit for total Cr in drinking water to ensure safe consumption. However, toxicity,
mobility and bioavailability are largely different for different Cr species. Trivalent
chromium is an essential micronutrient which plays a vital role in releasing energy
from fats and sugars. Hexavalent chromium, in contrast, is highly toxic and is known
to be carcinogenic. Therefore, a thorough study on Cr species in drinking water is
crucial for evaluating potential hazards and safeguarding the public health.
Key comparison exercises involving speciation such as methylmercury in fish
(CCQM-K43 & CCQM-K43.1), selenium speciation in wheat flour (CCQM-K60),
arsenobetaine in tuna fish (CCQM-K97) and arsenic speciation in brown rice flour
(CCQM-K108 & CCQM-K108.2014) have been conducted. Although total chromium
content in various matrices had been studied in previous key comparisons, hexavalent
chromium in the presence of other chromium species in drinking water remained a
challenging project as comparison exercise.
The aim of this study is to demonstrate the capability of participating NMIs and DIs in
CCQM-K124 Part B Page 3 of 25
measuring the content of hexavalent chromium in drinking water in the presence of
other chromium species in a g/kg level. The exercise could also facilitate the
participating laboratories to acquire claims on Calibration and Measurement
Capabilities (CMC) as listed in Appendix C of the Key Comparison Database
(KCDB) under the Mutual Recognition Arrangement of the International Committee
for Weights and Measures (CIPM MRA). “Core Capabilities” tables were also
distributed so that participants could provide evidence for the CMC claims on their
selected technique.
In the IAWG meeting held in Teddington (UK), November 2015, it was agreed that
the median approach is suitable for the calculation of KCRV for CCQM-K124 Part B.
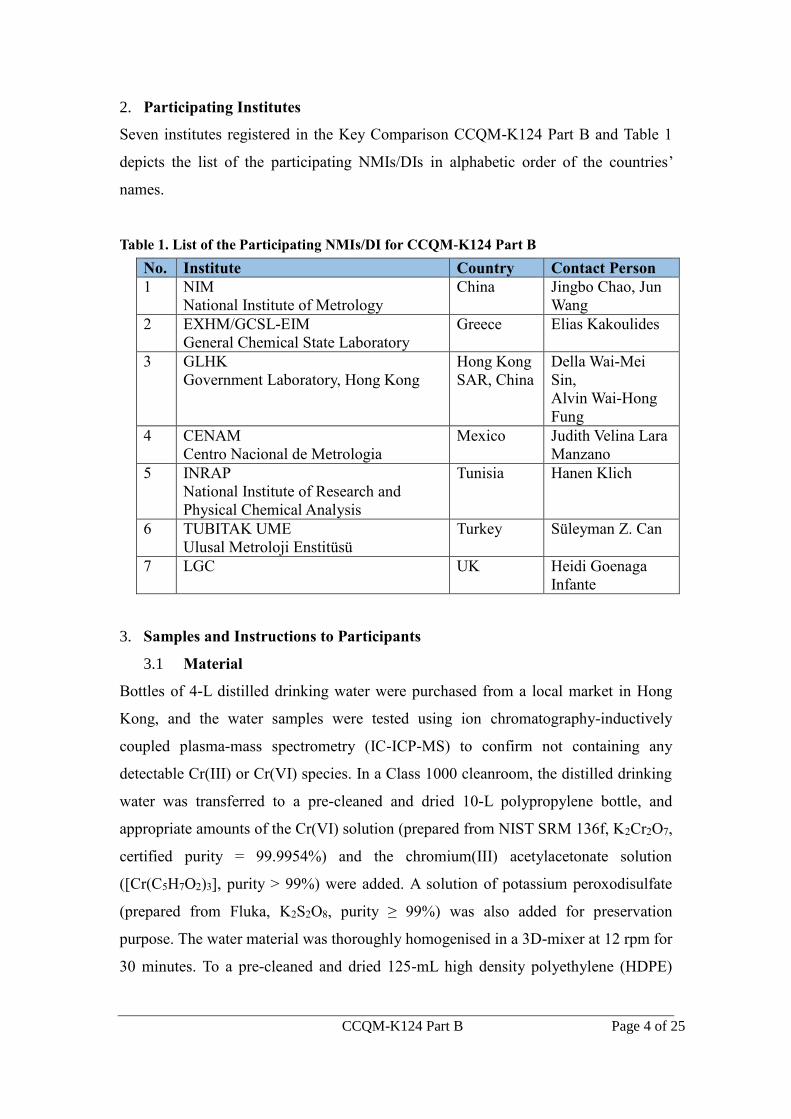
CCQM-K124 Part B Page 4 of 25
2. Participating Institutes
Seven institutes registered in the Key Comparison CCQM-K124 Part B and Table 1
depicts the list of the participating NMIs/DIs in alphabetic order of the countries’
names.
Table 1. List of the Participating NMIs/DI for CCQM-K124 Part B
No. Institute Country Contact Person
1 NIM
National Institute of Metrology
China Jingbo Chao, Jun
Wang
2 EXHM/GCSL-EIM
General Chemical State Laboratory
Greece Elias Kakoulides
3 GLHK
Government Laboratory, Hong Kong
Hong Kong
SAR, China
Della Wai-Mei
Sin,
Alvin Wai-Hong
Fung
4 CENAM
Centro Nacional de Metrologia
Mexico Judith Velina Lara
Manzano
5 INRAP
National Institute of Research and
Physical Chemical Analysis
Tunisia Hanen Klich
6 TUBITAK UME
Ulusal Metroloji Enstitüsü
Turkey Süleyman Z. Can
7 LGC UK Heidi Goenaga
Infante
3. Samples and Instructions to Participants
3.1 Material
Bottles of 4-L distilled drinking water were purchased from a local market in Hong
Kong, and the water samples were tested using ion chromatography-inductively
coupled plasma-mass spectrometry (IC-ICP-MS) to confirm not containing any
detectable Cr(III) or Cr(VI) species. In a Class 1000 cleanroom, the distilled drinking
water was transferred to a pre-cleaned and dried 10-L polypropylene bottle, and
appropriate amounts of the Cr(VI) solution (prepared from NIST SRM 136f, K2Cr2O7,
certified purity = 99.9954%) and the chromium(III) acetylacetonate solution
([Cr(C5H7O2)3], purity > 99%) were added. A solution of potassium peroxodisulfate
(prepared from Fluka, K2S2O8, purity ≥ 99%) was also added for preservation
purpose. The water material was thoroughly homogenised in a 3D-mixer at 12 rpm for
30 minutes. To a pre-cleaned and dried 125-mL high density polyethylene (HDPE)
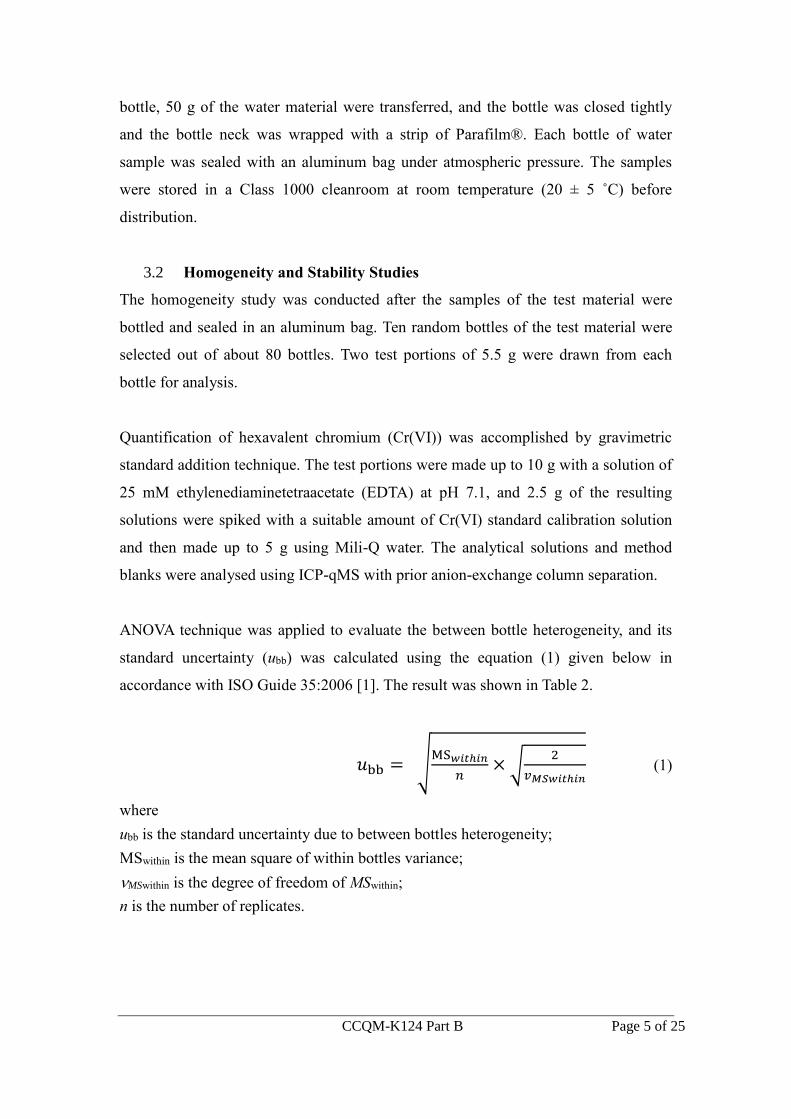
CCQM-K124 Part B Page 5 of 25
bottle, 50 g of the water material were transferred, and the bottle was closed tightly
and the bottle neck was wrapped with a strip of Parafilm®. Each bottle of water
sample was sealed with an aluminum bag under atmospheric pressure. The samples
were stored in a Class 1000 cleanroom at room temperature (20 ± 5 ˚C) before
distribution.
3.2 Homogeneity and Stability Studies
The homogeneity study was conducted after the samples of the test material were
bottled and sealed in an aluminum bag. Ten random bottles of the test material were
selected out of about 80 bottles. Two test portions of 5.5 g were drawn from each
bottle for analysis.
Quantification of hexavalent chromium (Cr(VI)) was accomplished by gravimetric
standard addition technique. The test portions were made up to 10 g with a solution of
25 mM ethylenediaminetetraacetate (EDTA) at pH 7.1, and 2.5 g of the resulting
solutions were spiked with a suitable amount of Cr(VI) standard calibration solution
and then made up to 5 g using Mili-Q water. The analytical solutions and method
blanks were analysed using ICP-qMS with prior anion-exchange column separation.
ANOVA technique was applied to evaluate the between bottle heterogeneity, and its
standard uncertainty (ubb) was calculated using the equation (1) given below in
accordance with ISO Guide 35:2006 [1]. The result was shown in Table 2.
𝑢bb = √MS𝑤𝑖𝑡ℎ𝑖𝑛
𝑛× √
2
𝑣𝑀𝑆𝑤𝑖𝑡ℎ𝑖𝑛 (1)
where
ubb is the standard uncertainty due to between bottles heterogeneity;
MSwithin is the mean square of within bottles variance;
MSwithin is the degree of freedom of MSwithin;
n is the number of replicates.
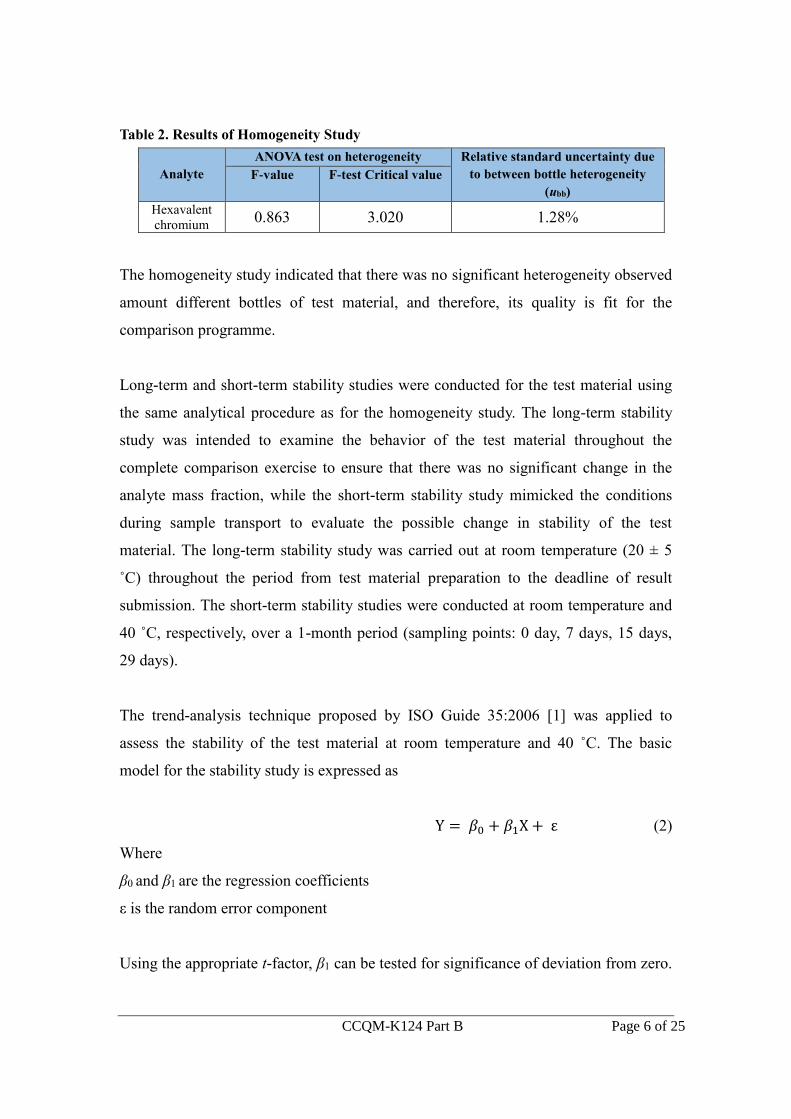
CCQM-K124 Part B Page 6 of 25
Table 2. Results of Homogeneity Study
Analyte
ANOVA test on heterogeneity Relative standard uncertainty due
to between bottle heterogeneity
(ubb)
F-value F-test Critical value
Hexavalent
chromium 0.863 3.020 1.28%
The homogeneity study indicated that there was no significant heterogeneity observed
amount different bottles of test material, and therefore, its quality is fit for the
comparison programme.
Long-term and short-term stability studies were conducted for the test material using
the same analytical procedure as for the homogeneity study. The long-term stability
study was intended to examine the behavior of the test material throughout the
complete comparison exercise to ensure that there was no significant change in the
analyte mass fraction, while the short-term stability study mimicked the conditions
during sample transport to evaluate the possible change in stability of the test
material. The long-term stability study was carried out at room temperature (20 ± 5
˚C) throughout the period from test material preparation to the deadline of result
submission. The short-term stability studies were conducted at room temperature and
40 ˚C, respectively, over a 1-month period (sampling points: 0 day, 7 days, 15 days,
29 days).
The trend-analysis technique proposed by ISO Guide 35:2006 [1] was applied to
assess the stability of the test material at room temperature and 40 ˚C. The basic
model for the stability study is expressed as
Y = 𝛽0 + 𝛽1X + ε (2)
Where
β0 and β1 are the regression coefficients
ε is the random error component
Using the appropriate t-factor, β1 can be tested for significance of deviation from zero.
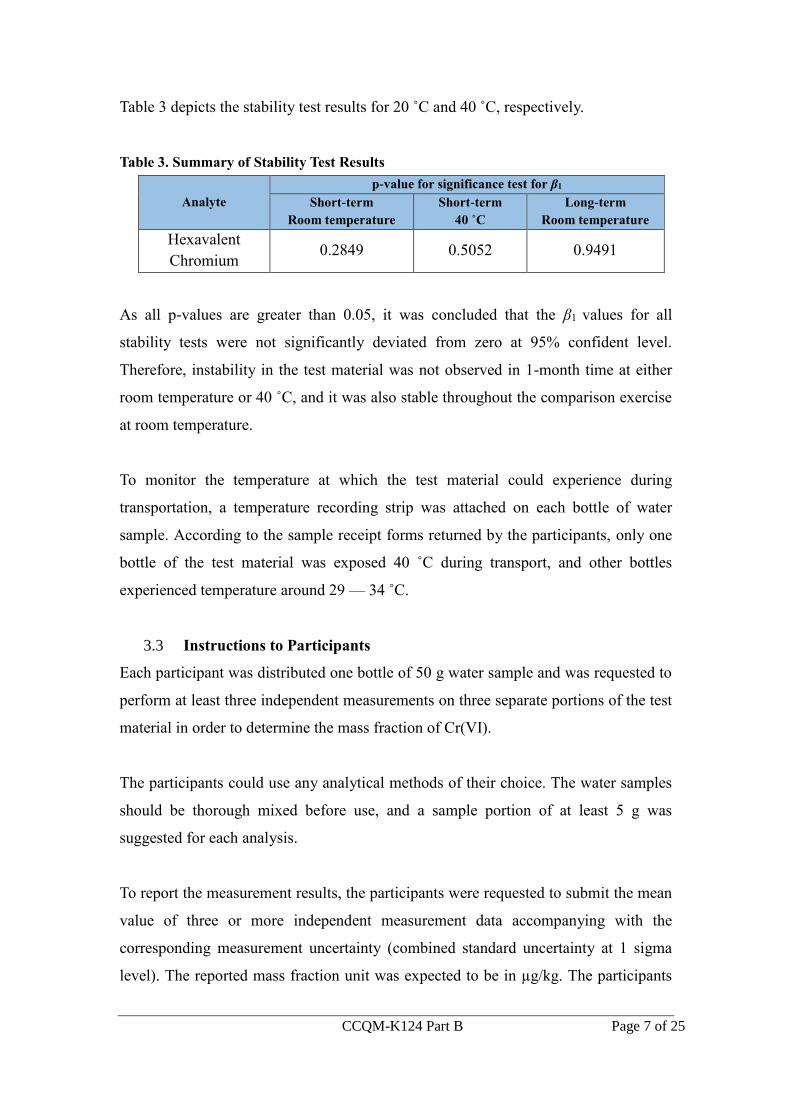
CCQM-K124 Part B Page 7 of 25
Table 3 depicts the stability test results for 20 ˚C and 40 ˚C, respectively.
Table 3. Summary of Stability Test Results
Analyte
p-value for significance test for β1
Short-term
Room temperature
Short-term
40 ˚C
Long-term
Room temperature
Hexavalent
Chromium 0.2849 0.5052 0.9491
As all p-values are greater than 0.05, it was concluded that the β1 values for all
stability tests were not significantly deviated from zero at 95% confident level.
Therefore, instability in the test material was not observed in 1-month time at either
room temperature or 40 ˚C, and it was also stable throughout the comparison exercise
at room temperature.
To monitor the temperature at which the test material could experience during
transportation, a temperature recording strip was attached on each bottle of water
sample. According to the sample receipt forms returned by the participants, only one
bottle of the test material was exposed 40 ˚C during transport, and other bottles
experienced temperature around 29 — 34 ˚C.
3.3 Instructions to Participants
Each participant was distributed one bottle of 50 g water sample and was requested to
perform at least three independent measurements on three separate portions of the test
material in order to determine the mass fraction of Cr(VI).
The participants could use any analytical methods of their choice. The water samples
should be thorough mixed before use, and a sample portion of at least 5 g was
suggested for each analysis.
To report the measurement results, the participants were requested to submit the mean
value of three or more independent measurement data accompanying with the
corresponding measurement uncertainty (combined standard uncertainty at 1 sigma
level). The reported mass fraction unit was expected to be in µg/kg. The participants
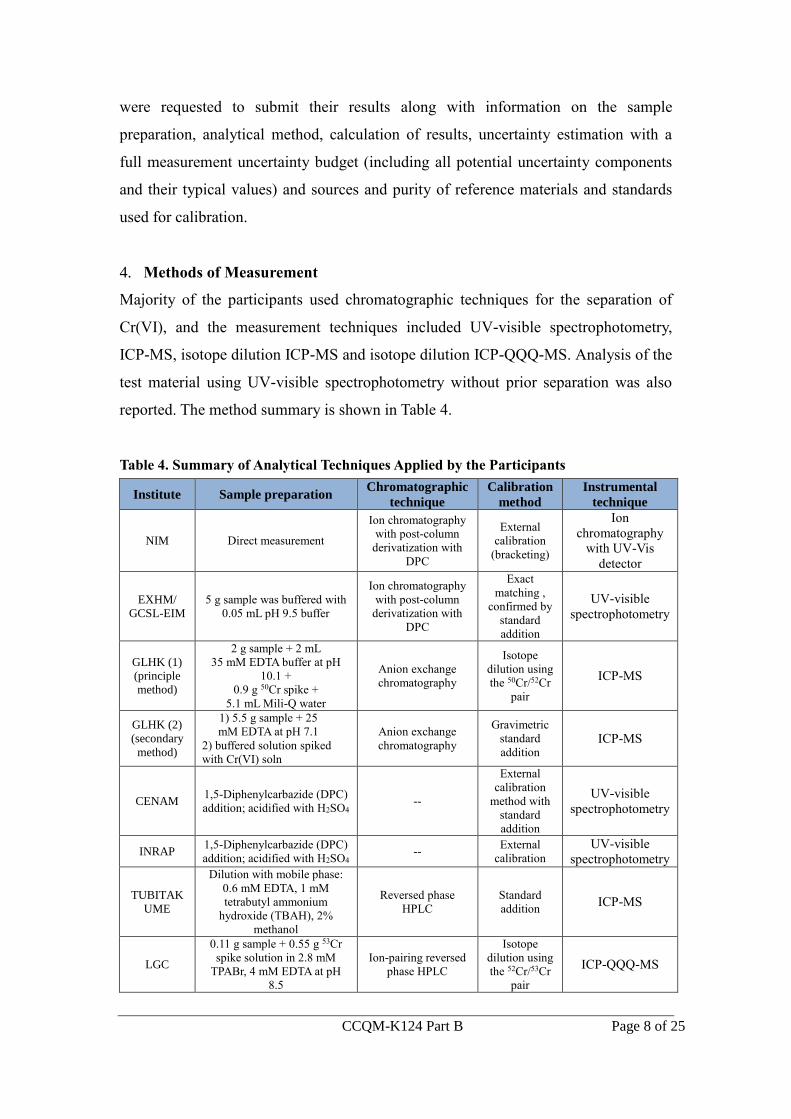
CCQM-K124 Part B Page 8 of 25
were requested to submit their results along with information on the sample
preparation, analytical method, calculation of results, uncertainty estimation with a
full measurement uncertainty budget (including all potential uncertainty components
and their typical values) and sources and purity of reference materials and standards
used for calibration.
4. Methods of Measurement
Majority of the participants used chromatographic techniques for the separation of
Cr(VI), and the measurement techniques included UV-visible spectrophotometry,
ICP-MS, isotope dilution ICP-MS and isotope dilution ICP-QQQ-MS. Analysis of the
test material using UV-visible spectrophotometry without prior separation was also
reported. The method summary is shown in Table 4.
Table 4. Summary of Analytical Techniques Applied by the Participants
Institute Sample preparation Chromatographic
technique
Calibration
method
Instrumental
technique
NIM Direct measurement
Ion chromatography
with post-column
derivatization with
DPC
External
calibration
(bracketing)
Ion
chromatography
with UV-Vis
detector
EXHM/
GCSL-EIM
5 g sample was buffered with
0.05 mL pH 9.5 buffer
Ion chromatography
with post-column
derivatization with
DPC
Exact
matching ,
confirmed by
standard
addition
UV-visible
spectrophotometry
GLHK (1)
(principle
method)
2 g sample + 2 mL
35 mM EDTA buffer at pH
10.1 +
0.9 g 50Cr spike +
5.1 mL Mili-Q water
Anion exchange
chromatography
Isotope
dilution using
the 50Cr/52Cr
pair
ICP-MS
GLHK (2)
(secondary
method)
1) 5.5 g sample + 25
mM EDTA at pH 7.1
2) buffered solution spiked
with Cr(VI) soln
Anion exchange
chromatography
Gravimetric
standard
addition ICP-MS
CENAM 1,5-Diphenylcarbazide (DPC)
addition; acidified with H2SO4 --
External
calibration
method with
standard
addition
UV-visible
spectrophotometry
INRAP 1,5-Diphenylcarbazide (DPC)
addition; acidified with H2SO4 --
External
calibration
UV-visible
spectrophotometry
TUBITAK
UME
Dilution with mobile phase:
0.6 mM EDTA, 1 mM
tetrabutyl ammonium
hydroxide (TBAH), 2%
methanol
Reversed phase
HPLC
Standard
addition ICP-MS
LGC
0.11 g sample + 0.55 g 53Cr
spike solution in 2.8 mM
TPABr, 4 mM EDTA at pH
8.5
Ion-pairing reversed
phase HPLC
Isotope
dilution using
the 52Cr/53Cr
pair
ICP-QQQ-MS
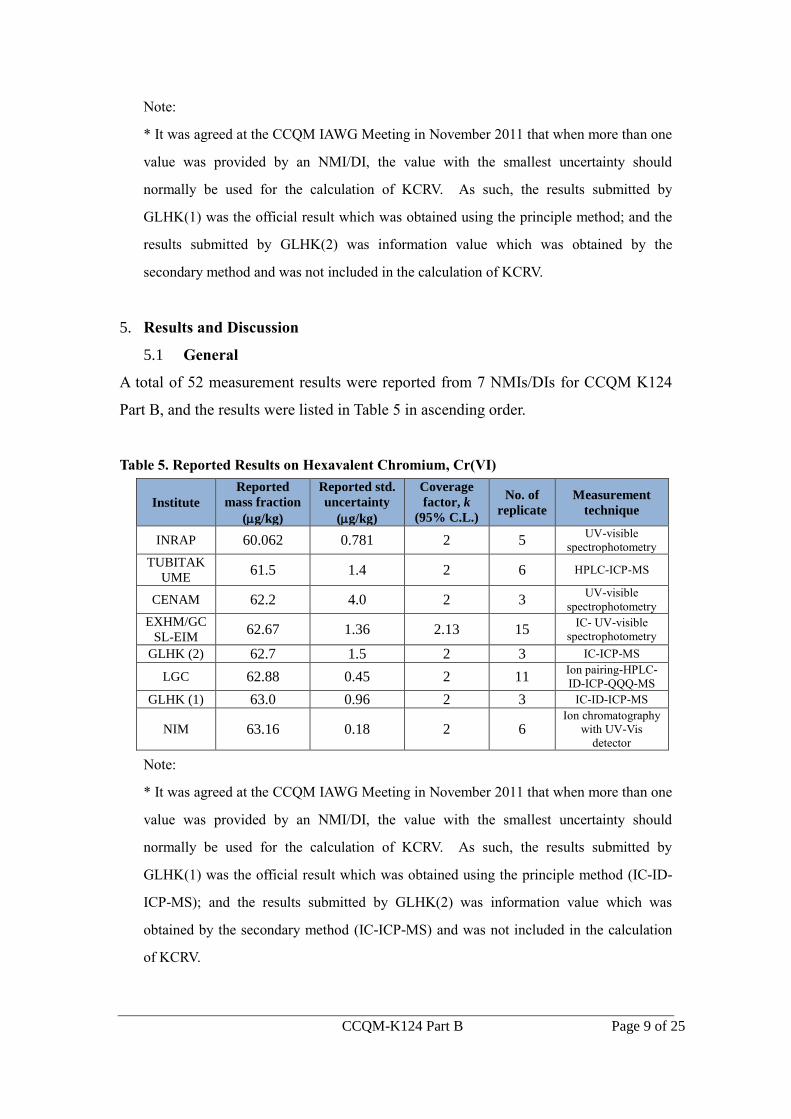
CCQM-K124 Part B Page 9 of 25
Note:
* It was agreed at the CCQM IAWG Meeting in November 2011 that when more than one
value was provided by an NMI/DI, the value with the smallest uncertainty should
normally be used for the calculation of KCRV. As such, the results submitted by
GLHK(1) was the official result which was obtained using the principle method; and the
results submitted by GLHK(2) was information value which was obtained by the
secondary method and was not included in the calculation of KCRV.
5. Results and Discussion
5.1 General
A total of 52 measurement results were reported from 7 NMIs/DIs for CCQM K124
Part B, and the results were listed in Table 5 in ascending order.
Table 5. Reported Results on Hexavalent Chromium, Cr(VI)
Institute
Reported
mass fraction
(g/kg)
Reported std.
uncertainty
(g/kg)
Coverage
factor, k
(95% C.L.)
No. of
replicate
Measurement
technique
INRAP 60.062 0.781 2 5 UV-visible
spectrophotometry
TUBITAK
UME 61.5 1.4 2 6 HPLC-ICP-MS
CENAM 62.2 4.0 2 3 UV-visible
spectrophotometry
EXHM/GC
SL-EIM 62.67 1.36 2.13 15
IC- UV-visible
spectrophotometry
GLHK (2) 62.7 1.5 2 3 IC-ICP-MS
LGC 62.88 0.45 2 11 Ion pairing-HPLC-
ID-ICP-QQQ-MS
GLHK (1) 63.0 0.96 2 3 IC-ID-ICP-MS
NIM 63.16 0.18 2 6 Ion chromatography
with UV-Vis
detector
Note:
* It was agreed at the CCQM IAWG Meeting in November 2011 that when more than one
value was provided by an NMI/DI, the value with the smallest uncertainty should
normally be used for the calculation of KCRV. As such, the results submitted by
GLHK(1) was the official result which was obtained using the principle method (IC-ID-
ICP-MS); and the results submitted by GLHK(2) was information value which was
obtained by the secondary method (IC-ICP-MS) and was not included in the calculation
of KCRV.
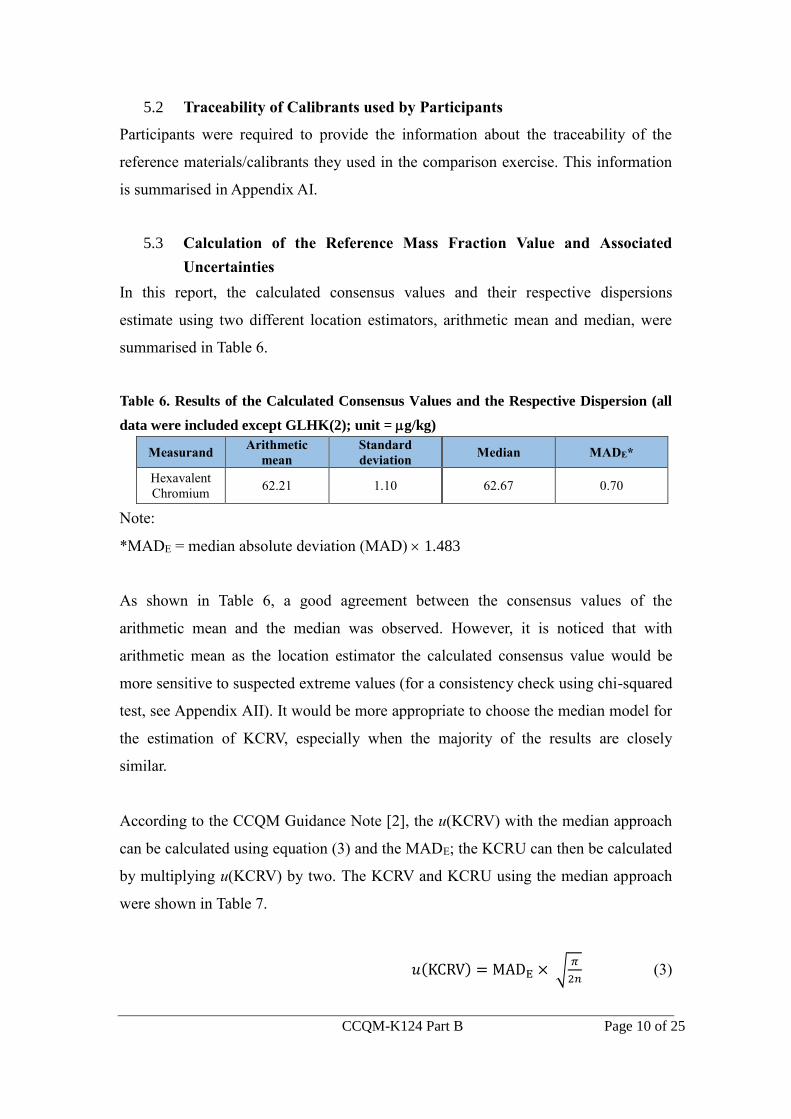
CCQM-K124 Part B Page 10 of 25
5.2 Traceability of Calibrants used by Participants
Participants were required to provide the information about the traceability of the
reference materials/calibrants they used in the comparison exercise. This information
is summarised in Appendix AI.
5.3 Calculation of the Reference Mass Fraction Value and Associated
Uncertainties
In this report, the calculated consensus values and their respective dispersions
estimate using two different location estimators, arithmetic mean and median, were
summarised in Table 6.
Table 6. Results of the Calculated Consensus Values and the Respective Dispersion (all
data were included except GLHK(2); unit = g/kg)
Measurand Arithmetic
mean
Standard
deviation Median MADE*
Hexavalent
Chromium 62.21 1.10 62.67 0.70
Note:
*MADE = median absolute deviation (MAD) 1.483
As shown in Table 6, a good agreement between the consensus values of the
arithmetic mean and the median was observed. However, it is noticed that with
arithmetic mean as the location estimator the calculated consensus value would be
more sensitive to suspected extreme values (for a consistency check using chi-squared
test, see Appendix AII). It would be more appropriate to choose the median model for
the estimation of KCRV, especially when the majority of the results are closely
similar.
According to the CCQM Guidance Note [2], the u(KCRV) with the median approach
can be calculated using equation (3) and the MADE; the KCRU can then be calculated
by multiplying u(KCRV) by two. The KCRV and KCRU using the median approach
were shown in Table 7.
𝑢(KCRV) = MADE × √𝜋
2𝑛 (3)
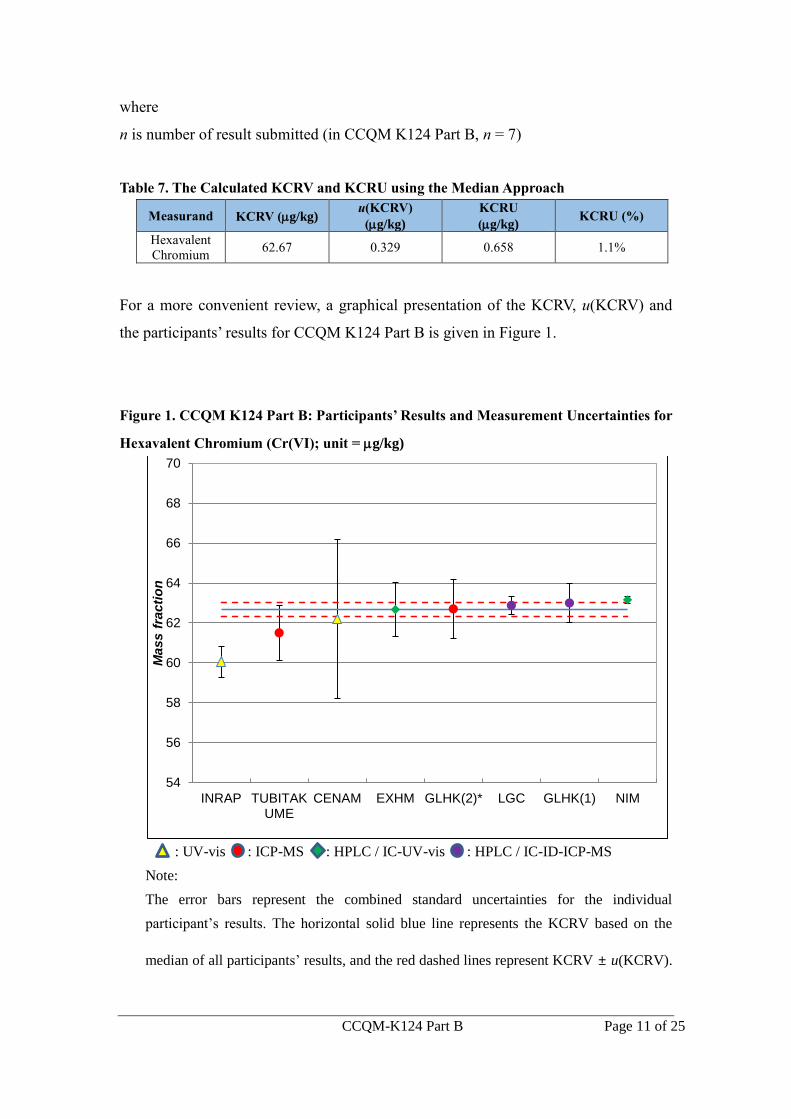
CCQM-K124 Part B Page 11 of 25
where
n is number of result submitted (in CCQM K124 Part B, n = 7)
Table 7. The Calculated KCRV and KCRU using the Median Approach
Measurand KCRV (g/kg) u(KCRV)
(g/kg)
KCRU
(g/kg) KCRU (%)
Hexavalent
Chromium 62.67 0.329 0.658 1.1%
For a more convenient review, a graphical presentation of the KCRV, u(KCRV) and
the participants’ results for CCQM K124 Part B is given in Figure 1.
Figure 1. CCQM K124 Part B: Participants’ Results and Measurement Uncertainties for
Hexavalent Chromium (Cr(VI); unit = g/kg)
: UV-vis : ICP-MS : HPLC / IC-UV-vis : HPLC / IC-ID-ICP-MS
Note:
The error bars represent the combined standard uncertainties for the individual
participant’s results. The horizontal solid blue line represents the KCRV based on the
median of all participants’ results, and the red dashed lines represent KCRV ± u(KCRV).
54
56
58
60
62
64
66
68
70
INRAP TUBITAKUME
CENAM EXHM GLHK(2)* LGC GLHK(1) NIM
Mass f
racti
on
CCQM-K124 Part B Page 12 of 25
(It was agreed at the CCQM IAWG Meeting in November 2011 that when more than one
value was provided by an NMI/DI, the value with the smallest uncertainty should
normally be used for the calculation of KCRV. As such, the results submitted by
GLHK(1) was the official result which was obtained using the principle method; and the
results submitted by GLHK(2) was information value which was obtained by the
secondary method and was not included in the calculation of KCRV.)
5.4 Equivalence Statements
The degree of equivalence and its uncertainty of a reported result by a participant
compared to the KCRV were calculated using equations (4) to (6) as follows:
𝑑𝑖 = (𝑥𝑖 − KCRV) (4)
𝑟𝑒𝑙. 𝑑𝑖 =(𝑥𝑖−KCRV)
KCRV (5)
U(𝑑𝑖) = √(𝑘𝑖)2𝑢(𝑥𝑖)2 + (𝑘𝑈)2𝑢(KCRV)2 (6)
where
xi is the reported value from a participant (i = 1 to n)
di is the difference between the participant’s reported value and the KCRV
U(di) is the expanded uncertainty of the di at a 95% confident level
ki is the coverage factor given by the participant i
kU is the coverage factor at a 95% confident level with a degree of freedom of 6 (n-1;
n = 7)
u(xi) is the standard uncertainty given by the participant i
u(KCRV) is the standard uncertainty of the KCRV
The equivalence statements for CCQM K124 Part B based on the calculated KCRV
with the median approach are listed in Table 8, and the graphical presentation is given
in Figure 2.
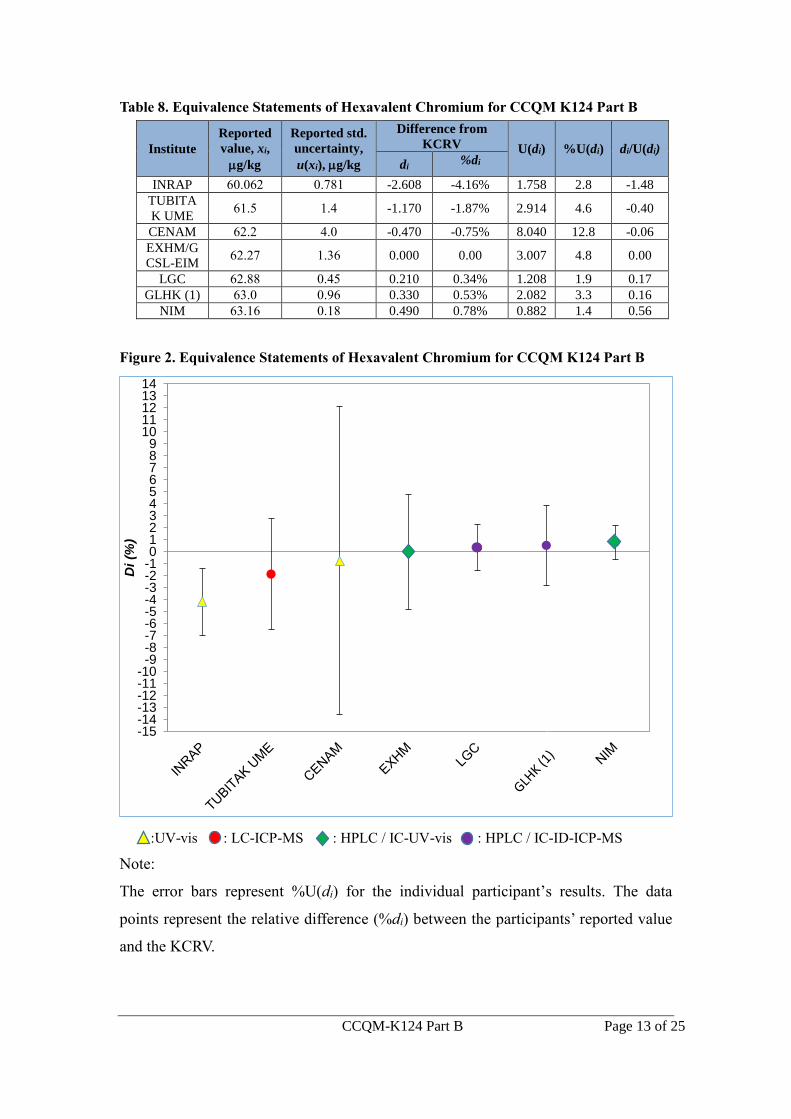
CCQM-K124 Part B Page 13 of 25
Table 8. Equivalence Statements of Hexavalent Chromium for CCQM K124 Part B
Institute
Reported
value, xi,
g/kg
Reported std.
uncertainty,
u(xi), g/kg
Difference from
KCRV U(di) %U(di) di/U(di)
di %di
INRAP 60.062 0.781 -2.608 -4.16% 1.758 2.8 -1.48
TUBITA
K UME 61.5 1.4 -1.170 -1.87% 2.914 4.6 -0.40
CENAM 62.2 4.0 -0.470 -0.75% 8.040 12.8 -0.06
EXHM/G
CSL-EIM 62.27 1.36 0.000 0.00 3.007 4.8 0.00
LGC 62.88 0.45 0.210 0.34% 1.208 1.9 0.17
GLHK (1) 63.0 0.96 0.330 0.53% 2.082 3.3 0.16
NIM 63.16 0.18 0.490 0.78% 0.882 1.4 0.56
Figure 2. Equivalence Statements of Hexavalent Chromium for CCQM K124 Part B
:UV-vis : LC-ICP-MS : HPLC / IC-UV-vis : HPLC / IC-ID-ICP-MS
Note:
The error bars represent %U(di) for the individual participant’s results. The data
points represent the relative difference (%di) between the participants’ reported value
and the KCRV.
-15-14-13-12-11-10
-9-8-7-6-5-4-3-2-10123456789
1011121314
Di (%
)
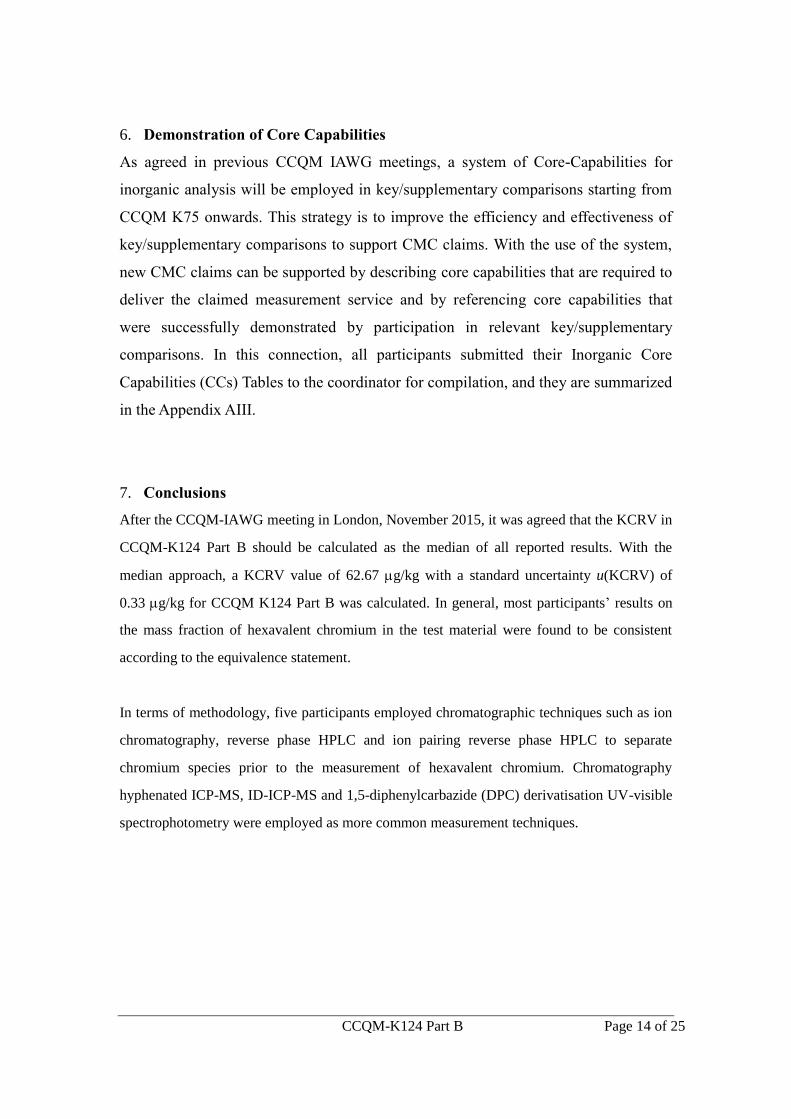
CCQM-K124 Part B Page 14 of 25
6. Demonstration of Core Capabilities
As agreed in previous CCQM IAWG meetings, a system of Core-Capabilities for
inorganic analysis will be employed in key/supplementary comparisons starting from
CCQM K75 onwards. This strategy is to improve the efficiency and effectiveness of
key/supplementary comparisons to support CMC claims. With the use of the system,
new CMC claims can be supported by describing core capabilities that are required to
deliver the claimed measurement service and by referencing core capabilities that
were successfully demonstrated by participation in relevant key/supplementary
comparisons. In this connection, all participants submitted their Inorganic Core
Capabilities (CCs) Tables to the coordinator for compilation, and they are summarized
in the Appendix AIII.
7. Conclusions
After the CCQM-IAWG meeting in London, November 2015, it was agreed that the KCRV in
CCQM-K124 Part B should be calculated as the median of all reported results. With the
median approach, a KCRV value of 62.67 g/kg with a standard uncertainty u(KCRV) of
0.33 g/kg for CCQM K124 Part B was calculated. In general, most participants’ results on
the mass fraction of hexavalent chromium in the test material were found to be consistent
according to the equivalence statement.
In terms of methodology, five participants employed chromatographic techniques such as ion
chromatography, reverse phase HPLC and ion pairing reverse phase HPLC to separate
chromium species prior to the measurement of hexavalent chromium. Chromatography
hyphenated ICP-MS, ID-ICP-MS and 1,5-diphenylcarbazide (DPC) derivatisation UV-visible
spectrophotometry were employed as more common measurement techniques.
CCQM-K124 Part B Page 15 of 25
Acknowledgement
We would like to express the most sincere gratitude for the effort and supports from
the contact persons and/or analysts of the participating NMIs/DIs.
Institute Contact person and/or analysts
NIM Jingbo Chao, Jun Wang
EXHM/GCSL-EIM Elias Kakoulides
GLHK Della Wai-Mei Sin, Alvin Wai-Hong Fung
CENAM Judith Velina Lara Manzano, María del Rocio Arvizu-
Torres, Edith Valle-Moya, Griselda Rivera-Sánchez,
Francisco Segoviano-Regalado, Francisco Javier
Matehuala-Sánchez, Itzel Santiago-Castellanos.
INRAP Hanen Klich
TUBITAK UME Süleyman Z. Can, Oktay Cankur, Betül Ari
LGC Heidi Goenaga Infante
We would like to thank Dr. Mike Sargent for providing guidance throughout the
course of this study.
References
1. International Standards Organization, ISO Guide 35: Reference materials –
General and statistical principles for certification, Geneva, Switzerland, 2006.
2. CCQM Guidance Note: Estimation of a consensus KCRV and associated
degrees of equivalence, Version 6, 2010.
3. CIPM MRA Document: Traceability in CIPM MRA, Document No.: CIPM
2009-24, Latest update: Revised 13 October 2009.
4. D. Duewer: A Robust Approach for the Determination of CCQM Key
Comparison Reference Values and Uncertainties.
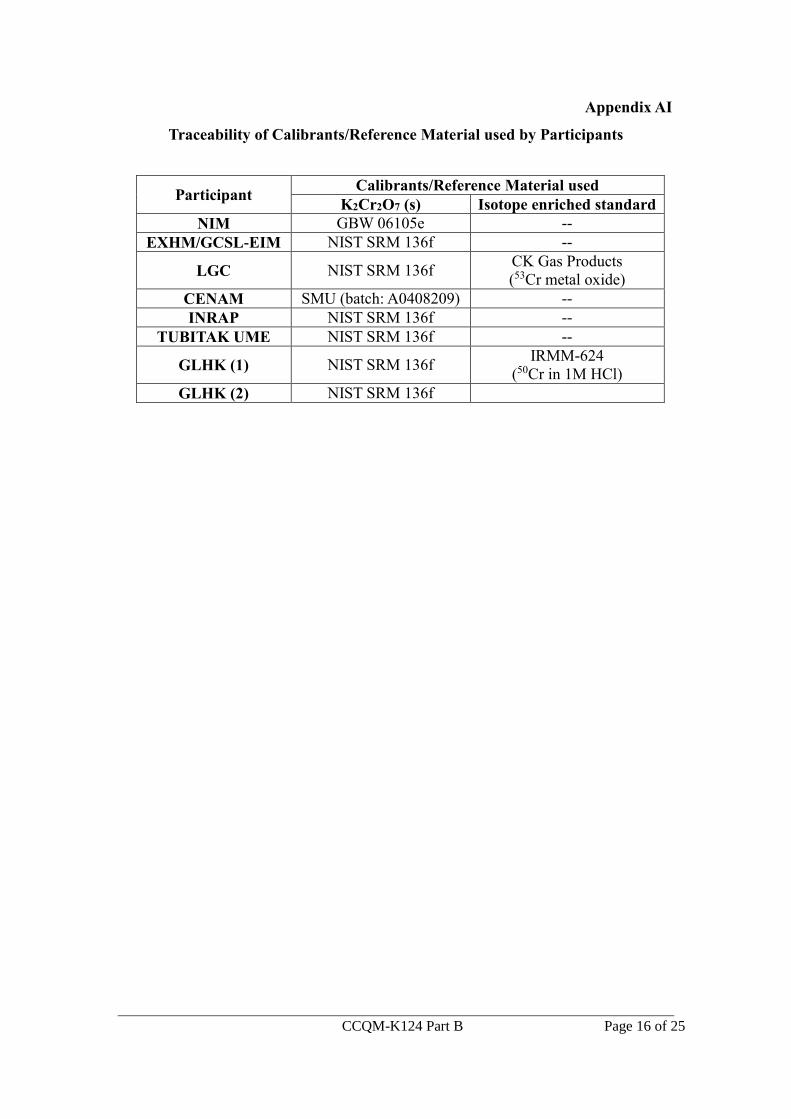
CCQM-K124 Part B Page 16 of 25
Appendix AI
Traceability of Calibrants/Reference Material used by Participants
Participant Calibrants/Reference Material used
K2Cr2O7 (s) Isotope enriched standard
NIM GBW 06105e --
EXHM/GCSL-EIM NIST SRM 136f --
LGC NIST SRM 136f CK Gas Products
(53Cr metal oxide)
CENAM SMU (batch: A0408209) --
INRAP NIST SRM 136f --
TUBITAK UME NIST SRM 136f --
GLHK (1) NIST SRM 136f IRMM-624
(50Cr in 1M HCl)
GLHK (2) NIST SRM 136f
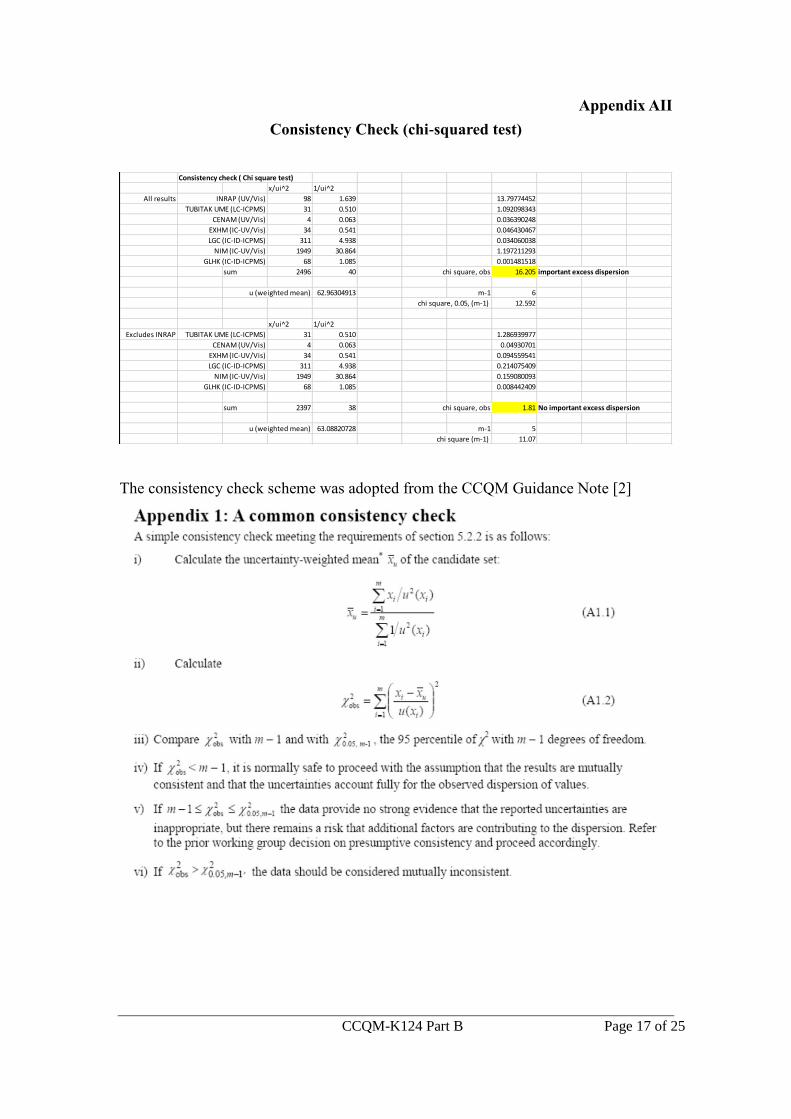
CCQM-K124 Part B Page 17 of 25
Appendix AII
Consistency Check (chi-squared test)
The consistency check scheme was adopted from the CCQM Guidance Note [2]
Consistency check ( Chi square test)
x/ui^2 1/ui^2
All results INRAP (UV/Vis) 98 1.639 13.79774452
TUBITAK UME (LC-ICPMS) 31 0.510 1.092098343
CENAM (UV/Vis) 4 0.063 0.036390248
EXHM (IC-UV/Vis) 34 0.541 0.046430467
LGC (IC-ID-ICPMS) 311 4.938 0.034060038
NIM (IC-UV/Vis) 1949 30.864 1.197211293
GLHK (IC-ID-ICPMS) 68 1.085 0.001481518
sum 2496 40 chi square, obs 16.205 important excess dispersion
u (weighted mean) 62.96304913 m-1 6
chi square, 0.05, (m-1) 12.592
x/ui^2 1/ui^2
Excludes INRAP TUBITAK UME (LC-ICPMS) 31 0.510 1.286939977
CENAM (UV/Vis) 4 0.063 0.04930701
EXHM (IC-UV/Vis) 34 0.541 0.094559541
LGC (IC-ID-ICPMS) 311 4.938 0.214075409
NIM (IC-UV/Vis) 1949 30.864 0.159080093
GLHK (IC-ID-ICPMS) 68 1.085 0.008442409
sum 2397 38 chi square, obs 1.81 No important excess dispersion
u (weighted mean) 63.08820728 m-1 5
chi square (m-1) 11.07
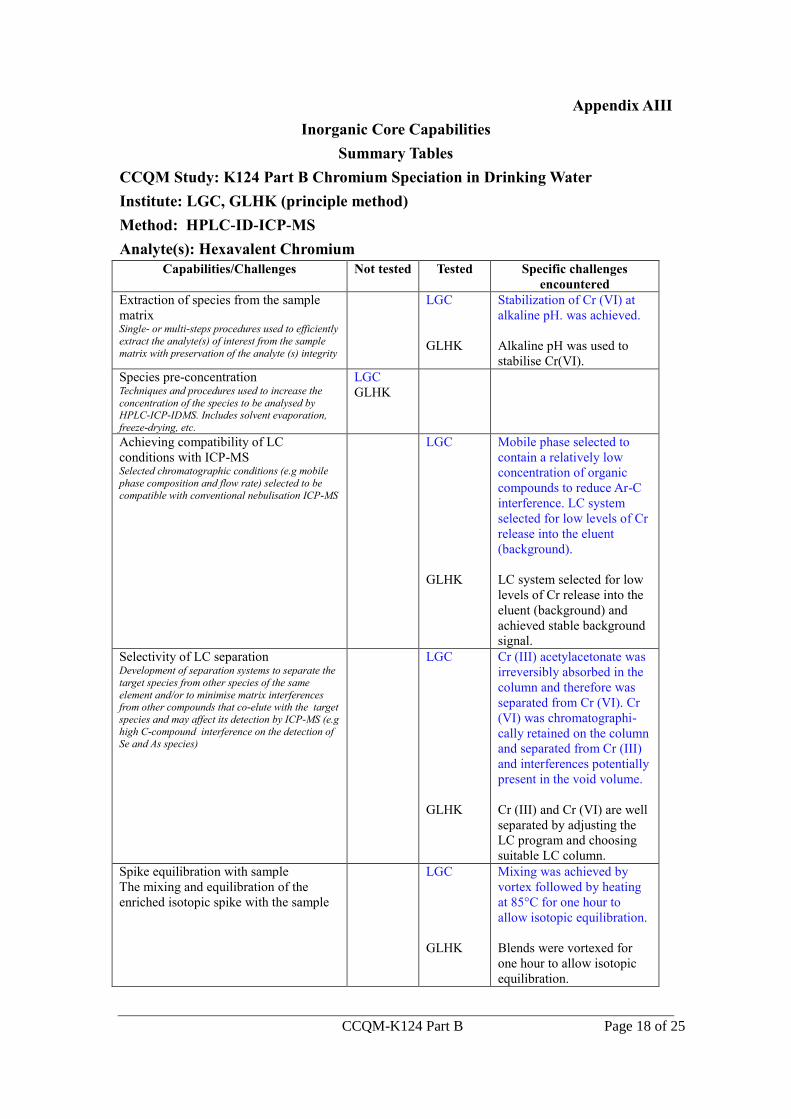
CCQM-K124 Part B Page 18 of 25
Appendix AIII
Inorganic Core Capabilities
Summary Tables
CCQM Study: K124 Part B Chromium Speciation in Drinking Water
Institute: LGC, GLHK (principle method)
Method: HPLC-ID-ICP-MS
Analyte(s): Hexavalent Chromium
Capabilities/Challenges Not tested Tested Specific challenges
encountered
Extraction of species from the sample
matrix Single- or multi-steps procedures used to efficiently
extract the analyte(s) of interest from the sample
matrix with preservation of the analyte (s) integrity
LGC
GLHK
Stabilization of Cr (VI) at
alkaline pH. was achieved.
Alkaline pH was used to
stabilise Cr(VI).
Species pre-concentration Techniques and procedures used to increase the
concentration of the species to be analysed by HPLC-ICP-IDMS. Includes solvent evaporation,
freeze-drying, etc.
LGC
GLHK
Achieving compatibility of LC
conditions with ICP-MS Selected chromatographic conditions (e.g mobile
phase composition and flow rate) selected to be
compatible with conventional nebulisation ICP-MS
LGC
GLHK
Mobile phase selected to
contain a relatively low
concentration of organic
compounds to reduce Ar-C
interference. LC system
selected for low levels of Cr
release into the eluent
(background).
LC system selected for low
levels of Cr release into the
eluent (background) and
achieved stable background
signal.
Selectivity of LC separation Development of separation systems to separate the
target species from other species of the same
element and/or to minimise matrix interferences from other compounds that co-elute with the target
species and may affect its detection by ICP-MS (e.g
high C-compound interference on the detection of Se and As species)
LGC
GLHK
Cr (III) acetylacetonate was
irreversibly absorbed in the
column and therefore was
separated from Cr (VI). Cr
(VI) was chromatographi-
cally retained on the column
and separated from Cr (III)
and interferences potentially
present in the void volume.
Cr (III) and Cr (VI) are well
separated by adjusting the
LC program and choosing
suitable LC column.
Spike equilibration with sample
The mixing and equilibration of the
enriched isotopic spike with the sample
LGC
GLHK
Mixing was achieved by
vortex followed by heating
at 85°C for one hour to
allow isotopic equilibration.
Blends were vortexed for
one hour to allow isotopic
equilibration.
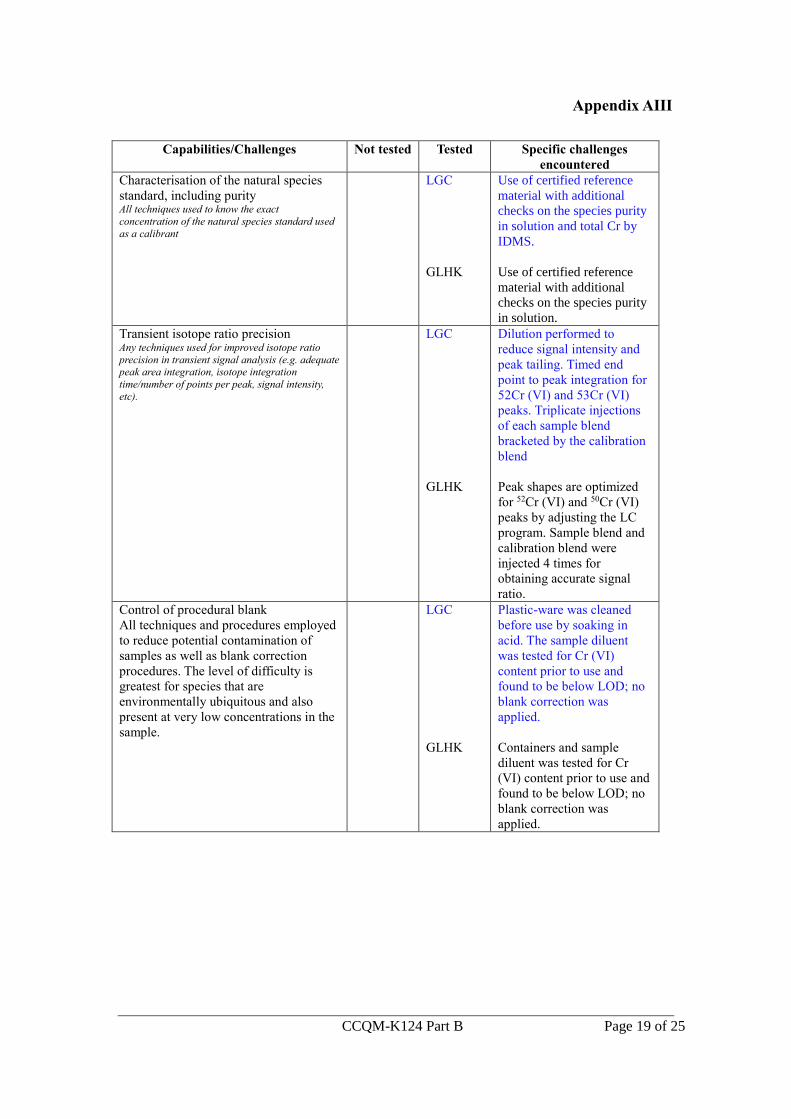
CCQM-K124 Part B Page 19 of 25
Appendix AIII
Capabilities/Challenges Not tested Tested Specific challenges
encountered
Characterisation of the natural species
standard, including purity All techniques used to know the exact
concentration of the natural species standard used
as a calibrant
LGC
GLHK
Use of certified reference
material with additional
checks on the species purity
in solution and total Cr by
IDMS.
Use of certified reference
material with additional
checks on the species purity
in solution.
Transient isotope ratio precision Any techniques used for improved isotope ratio
precision in transient signal analysis (e.g. adequate
peak area integration, isotope integration
time/number of points per peak, signal intensity,
etc).
LGC
GLHK
Dilution performed to
reduce signal intensity and
peak tailing. Timed end
point to peak integration for
52Cr (VI) and 53Cr (VI)
peaks. Triplicate injections
of each sample blend
bracketed by the calibration
blend
Peak shapes are optimized
for 52Cr (VI) and 50Cr (VI)
peaks by adjusting the LC
program. Sample blend and
calibration blend were
injected 4 times for
obtaining accurate signal
ratio.
Control of procedural blank
All techniques and procedures employed
to reduce potential contamination of
samples as well as blank correction
procedures. The level of difficulty is
greatest for species that are
environmentally ubiquitous and also
present at very low concentrations in the
sample.
LGC
GLHK
Plastic-ware was cleaned
before use by soaking in
acid. The sample diluent
was tested for Cr (VI)
content prior to use and
found to be below LOD; no
blank correction was
applied.
Containers and sample
diluent was tested for Cr
(VI) content prior to use and
found to be below LOD; no
blank correction was
applied.
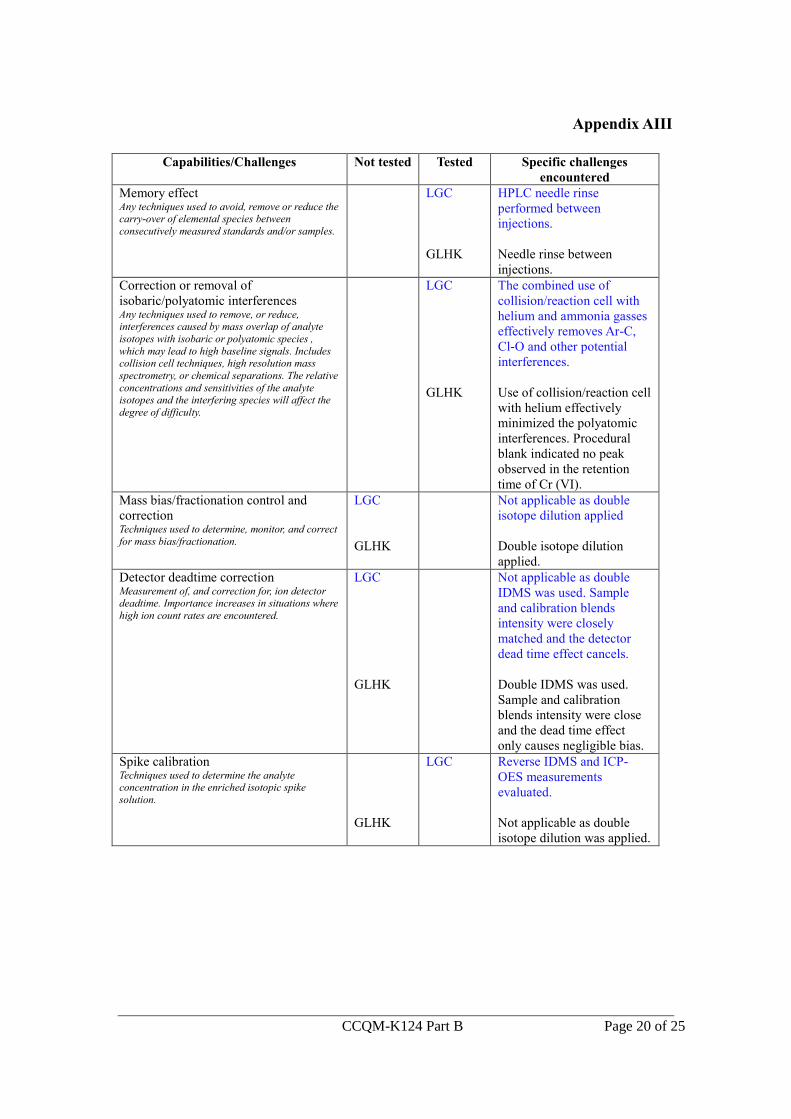
CCQM-K124 Part B Page 20 of 25
Appendix AIII
Capabilities/Challenges Not tested Tested Specific challenges
encountered
Memory effect Any techniques used to avoid, remove or reduce the carry-over of elemental species between
consecutively measured standards and/or samples.
LGC
GLHK
HPLC needle rinse
performed between
injections.
Needle rinse between
injections.
Correction or removal of
isobaric/polyatomic interferences Any techniques used to remove, or reduce, interferences caused by mass overlap of analyte
isotopes with isobaric or polyatomic species ,
which may lead to high baseline signals. Includes collision cell techniques, high resolution mass
spectrometry, or chemical separations. The relative
concentrations and sensitivities of the analyte isotopes and the interfering species will affect the
degree of difficulty.
LGC
GLHK
The combined use of
collision/reaction cell with
helium and ammonia gasses
effectively removes Ar-C,
Cl-O and other potential
interferences.
Use of collision/reaction cell
with helium effectively
minimized the polyatomic
interferences. Procedural
blank indicated no peak
observed in the retention
time of Cr (VI).
Mass bias/fractionation control and
correction Techniques used to determine, monitor, and correct
for mass bias/fractionation.
LGC
GLHK
Not applicable as double
isotope dilution applied
Double isotope dilution
applied.
Detector deadtime correction Measurement of, and correction for, ion detector deadtime. Importance increases in situations where
high ion count rates are encountered.
LGC
GLHK
Not applicable as double
IDMS was used. Sample
and calibration blends
intensity were closely
matched and the detector
dead time effect cancels.
Double IDMS was used.
Sample and calibration
blends intensity were close
and the dead time effect
only causes negligible bias.
Spike calibration Techniques used to determine the analyte concentration in the enriched isotopic spike
solution.
GLHK
LGC Reverse IDMS and ICP-
OES measurements
evaluated.
Not applicable as double
isotope dilution was applied.
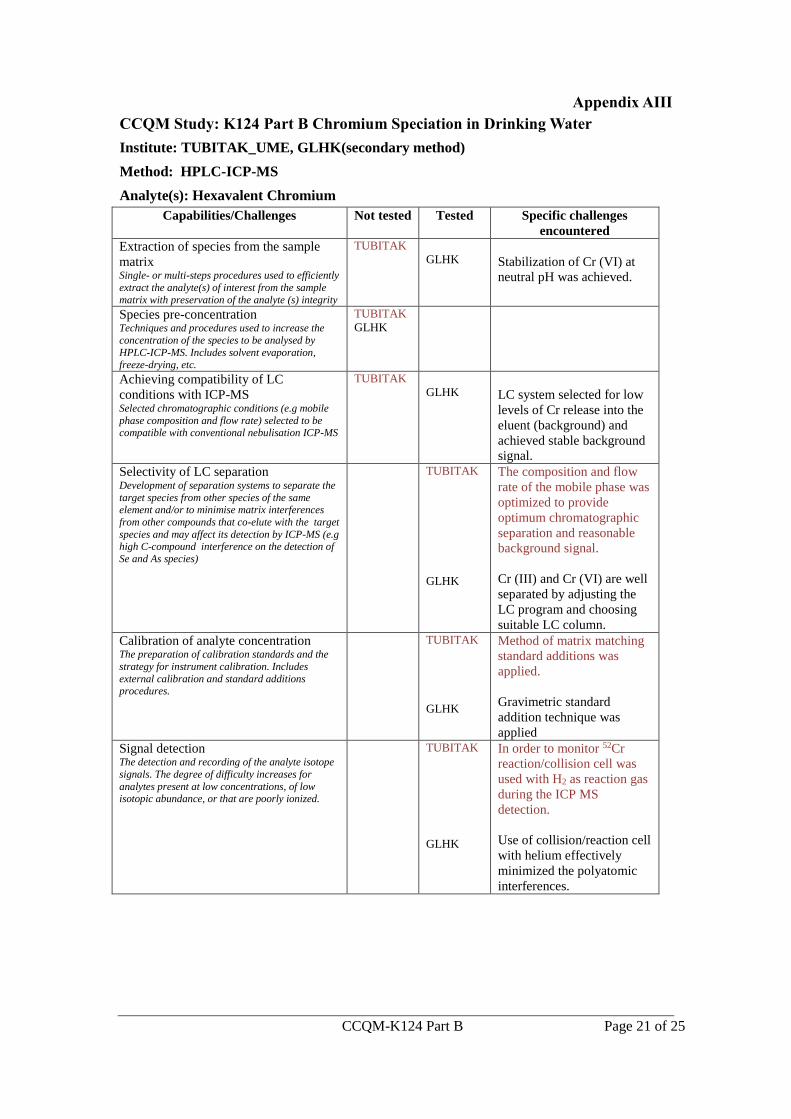
CCQM-K124 Part B Page 21 of 25
Appendix AIII
CCQM Study: K124 Part B Chromium Speciation in Drinking Water
Institute: TUBITAK_UME, GLHK(secondary method)
Method: HPLC-ICP-MS
Analyte(s): Hexavalent Chromium
Capabilities/Challenges Not tested Tested Specific challenges
encountered
Extraction of species from the sample
matrix Single- or multi-steps procedures used to efficiently
extract the analyte(s) of interest from the sample
matrix with preservation of the analyte (s) integrity
TUBITAK
GLHK
Stabilization of Cr (VI) at
neutral pH was achieved.
Species pre-concentration Techniques and procedures used to increase the
concentration of the species to be analysed by
HPLC-ICP-MS. Includes solvent evaporation,
freeze-drying, etc.
TUBITAK
GLHK
Achieving compatibility of LC
conditions with ICP-MS Selected chromatographic conditions (e.g mobile
phase composition and flow rate) selected to be compatible with conventional nebulisation ICP-MS
TUBITAK
GLHK
LC system selected for low
levels of Cr release into the
eluent (background) and
achieved stable background
signal.
Selectivity of LC separation Development of separation systems to separate the
target species from other species of the same element and/or to minimise matrix interferences
from other compounds that co-elute with the target
species and may affect its detection by ICP-MS (e.g high C-compound interference on the detection of
Se and As species)
TUBITAK
GLHK
The composition and flow
rate of the mobile phase was
optimized to provide
optimum chromatographic
separation and reasonable
background signal.
Cr (III) and Cr (VI) are well
separated by adjusting the
LC program and choosing
suitable LC column.
Calibration of analyte concentration The preparation of calibration standards and the
strategy for instrument calibration. Includes
external calibration and standard additions procedures.
TUBITAK
GLHK
Method of matrix matching
standard additions was
applied.
Gravimetric standard
addition technique was
applied
Signal detection The detection and recording of the analyte isotope
signals. The degree of difficulty increases for
analytes present at low concentrations, of low isotopic abundance, or that are poorly ionized.
TUBITAK
GLHK
In order to monitor 52Cr
reaction/collision cell was
used with H2 as reaction gas
during the ICP MS
detection.
Use of collision/reaction cell
with helium effectively
minimized the polyatomic
interferences.
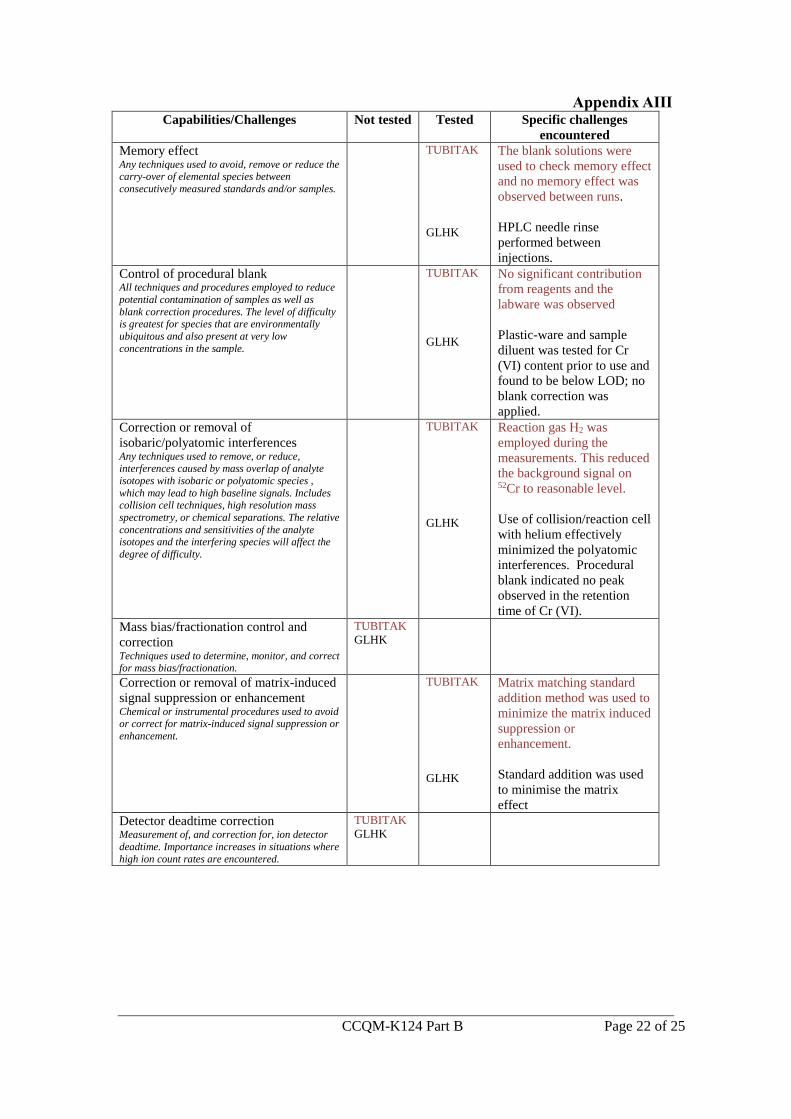
CCQM-K124 Part B Page 22 of 25
Appendix AIII Capabilities/Challenges Not tested Tested Specific challenges
encountered
Memory effect Any techniques used to avoid, remove or reduce the carry-over of elemental species between
consecutively measured standards and/or samples.
TUBITAK
GLHK
The blank solutions were
used to check memory effect
and no memory effect was
observed between runs.
HPLC needle rinse
performed between
injections.
Control of procedural blank All techniques and procedures employed to reduce
potential contamination of samples as well as
blank correction procedures. The level of difficulty is greatest for species that are environmentally
ubiquitous and also present at very low
concentrations in the sample.
TUBITAK
GLHK
No significant contribution
from reagents and the
labware was observed
Plastic-ware and sample
diluent was tested for Cr
(VI) content prior to use and
found to be below LOD; no
blank correction was
applied.
Correction or removal of
isobaric/polyatomic interferences Any techniques used to remove, or reduce, interferences caused by mass overlap of analyte
isotopes with isobaric or polyatomic species ,
which may lead to high baseline signals. Includes collision cell techniques, high resolution mass
spectrometry, or chemical separations. The relative
concentrations and sensitivities of the analyte isotopes and the interfering species will affect the
degree of difficulty.
TUBITAK
GLHK
Reaction gas H2 was
employed during the
measurements. This reduced
the background signal on 52Cr to reasonable level.
Use of collision/reaction cell
with helium effectively
minimized the polyatomic
interferences. Procedural
blank indicated no peak
observed in the retention
time of Cr (VI).
Mass bias/fractionation control and
correction Techniques used to determine, monitor, and correct for mass bias/fractionation.
TUBITAK
GLHK
Correction or removal of matrix-induced
signal suppression or enhancement Chemical or instrumental procedures used to avoid or correct for matrix-induced signal suppression or
enhancement.
TUBITAK
GLHK
Matrix matching standard
addition method was used to
minimize the matrix induced
suppression or
enhancement.
Standard addition was used
to minimise the matrix
effect
Detector deadtime correction Measurement of, and correction for, ion detector
deadtime. Importance increases in situations where
high ion count rates are encountered.
TUBITAK
GLHK
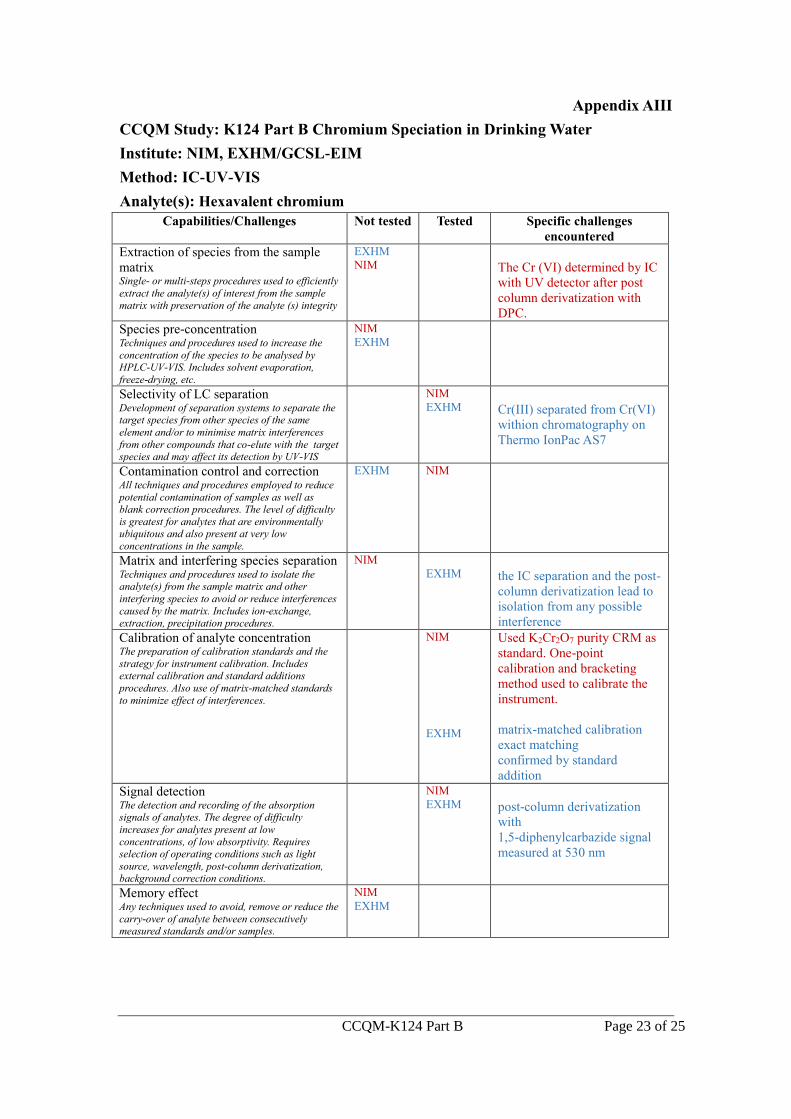
CCQM-K124 Part B Page 23 of 25
Appendix AIII
CCQM Study: K124 Part B Chromium Speciation in Drinking Water
Institute: NIM, EXHM/GCSL-EIM
Method: IC-UV-VIS
Analyte(s): Hexavalent chromium
Capabilities/Challenges Not tested Tested Specific challenges
encountered
Extraction of species from the sample
matrix Single- or multi-steps procedures used to efficiently
extract the analyte(s) of interest from the sample
matrix with preservation of the analyte (s) integrity
EXHM
NIM
The Cr (VI) determined by IC
with UV detector after post
column derivatization with
DPC.
Species pre-concentration Techniques and procedures used to increase the
concentration of the species to be analysed by
HPLC-UV-VIS. Includes solvent evaporation,
freeze-drying, etc.
NIM
EXHM
Selectivity of LC separation Development of separation systems to separate the target species from other species of the same
element and/or to minimise matrix interferences
from other compounds that co-elute with the target species and may affect its detection by UV-VIS
NIM
EXHM
Cr(III) separated from Cr(VI)
withion chromatography on
Thermo IonPac AS7
Contamination control and correction All techniques and procedures employed to reduce
potential contamination of samples as well as blank correction procedures. The level of difficulty
is greatest for analytes that are environmentally ubiquitous and also present at very low
concentrations in the sample.
EXHM NIM
Matrix and interfering species separation Techniques and procedures used to isolate the analyte(s) from the sample matrix and other
interfering species to avoid or reduce interferences
caused by the matrix. Includes ion-exchange, extraction, precipitation procedures.
NIM
EXHM
the IC separation and the post-
column derivatization lead to
isolation from any possible
interference
Calibration of analyte concentration The preparation of calibration standards and the
strategy for instrument calibration. Includes external calibration and standard additions
procedures. Also use of matrix-matched standards
to minimize effect of interferences.
NIM
EXHM
Used K2Cr2O7 purity CRM as
standard. One-point
calibration and bracketing
method used to calibrate the
instrument.
matrix-matched calibration
exact matching
confirmed by standard
addition
Signal detection The detection and recording of the absorption signals of analytes. The degree of difficulty
increases for analytes present at low
concentrations, of low absorptivity. Requires selection of operating conditions such as light
source, wavelength, post-column derivatization, background correction conditions.
NIM
EXHM
post-column derivatization
with
1,5-diphenylcarbazide signal
measured at 530 nm
Memory effect Any techniques used to avoid, remove or reduce the
carry-over of analyte between consecutively measured standards and/or samples.
NIM
EXHM
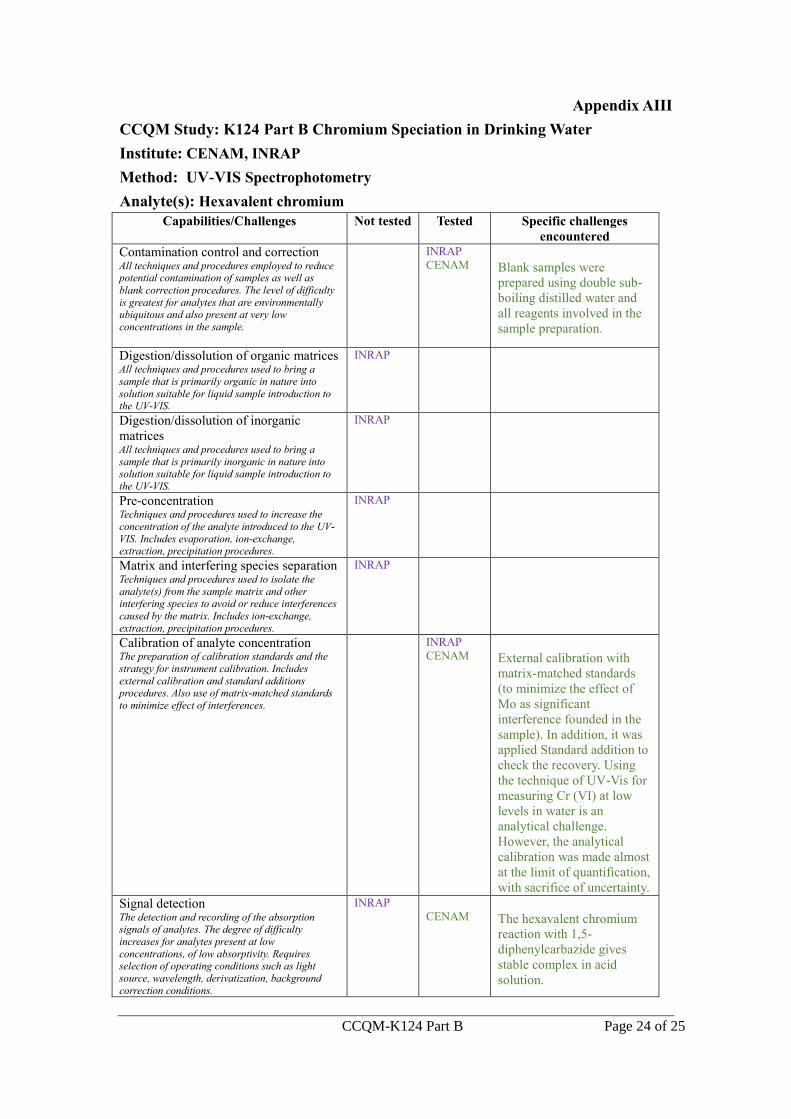
CCQM-K124 Part B Page 24 of 25
Appendix AIII
CCQM Study: K124 Part B Chromium Speciation in Drinking Water
Institute: CENAM, INRAP
Method: UV-VIS Spectrophotometry
Analyte(s): Hexavalent chromium
Capabilities/Challenges Not tested Tested Specific challenges
encountered
Contamination control and correction All techniques and procedures employed to reduce potential contamination of samples as well as
blank correction procedures. The level of difficulty
is greatest for analytes that are environmentally ubiquitous and also present at very low
concentrations in the sample.
INRAP
CENAM
Blank samples were
prepared using double sub-
boiling distilled water and
all reagents involved in the
sample preparation.
Digestion/dissolution of organic matrices All techniques and procedures used to bring a
sample that is primarily organic in nature into
solution suitable for liquid sample introduction to the UV-VIS.
INRAP
Digestion/dissolution of inorganic
matrices All techniques and procedures used to bring a
sample that is primarily inorganic in nature into solution suitable for liquid sample introduction to
the UV-VIS.
INRAP
Pre-concentration Techniques and procedures used to increase the
concentration of the analyte introduced to the UV-
VIS. Includes evaporation, ion-exchange, extraction, precipitation procedures.
INRAP
Matrix and interfering species separation Techniques and procedures used to isolate the
analyte(s) from the sample matrix and other interfering species to avoid or reduce interferences
caused by the matrix. Includes ion-exchange,
extraction, precipitation procedures.
INRAP
Calibration of analyte concentration The preparation of calibration standards and the
strategy for instrument calibration. Includes
external calibration and standard additions procedures. Also use of matrix-matched standards
to minimize effect of interferences.
INRAP
CENAM
External calibration with
matrix-matched standards
(to minimize the effect of
Mo as significant
interference founded in the
sample). In addition, it was
applied Standard addition to
check the recovery. Using
the technique of UV-Vis for
measuring Cr (VI) at low
levels in water is an
analytical challenge.
However, the analytical
calibration was made almost
at the limit of quantification,
with sacrifice of uncertainty.
Signal detection The detection and recording of the absorption signals of analytes. The degree of difficulty
increases for analytes present at low
concentrations, of low absorptivity. Requires selection of operating conditions such as light
source, wavelength, derivatization, background
correction conditions.
INRAP
CENAM
The hexavalent chromium
reaction with 1,5-
diphenylcarbazide gives
stable complex in acid
solution.
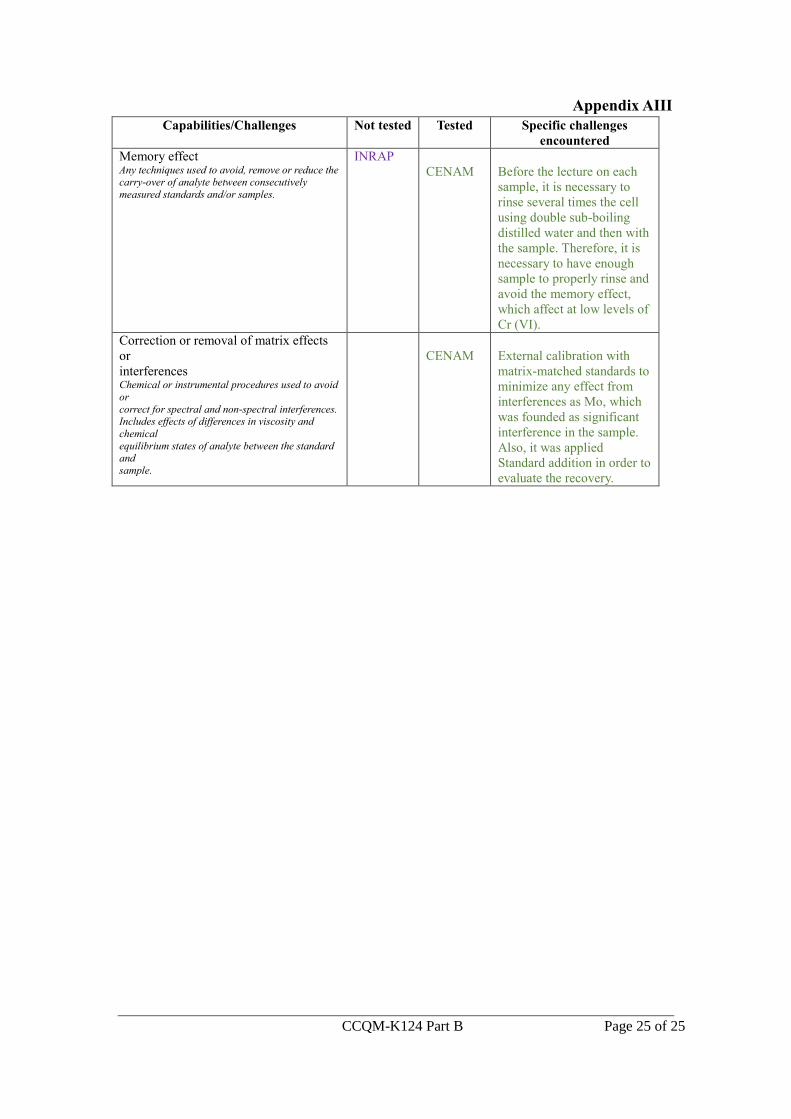
CCQM-K124 Part B Page 25 of 25
Appendix AIII
Capabilities/Challenges Not tested Tested Specific challenges
encountered
Memory effect Any techniques used to avoid, remove or reduce the carry-over of analyte between consecutively
measured standards and/or samples.
INRAP
CENAM
Before the lecture on each
sample, it is necessary to
rinse several times the cell
using double sub-boiling
distilled water and then with
the sample. Therefore, it is
necessary to have enough
sample to properly rinse and
avoid the memory effect,
which affect at low levels of
Cr (VI).
Correction or removal of matrix effects
or
interferences Chemical or instrumental procedures used to avoid
or
correct for spectral and non-spectral interferences. Includes effects of differences in viscosity and
chemical
equilibrium states of analyte between the standard and
sample.
CENAM
External calibration with
matrix-matched standards to
minimize any effect from
interferences as Mo, which
was founded as significant
interference in the sample.
Also, it was applied
Standard addition in order to
evaluate the recovery.
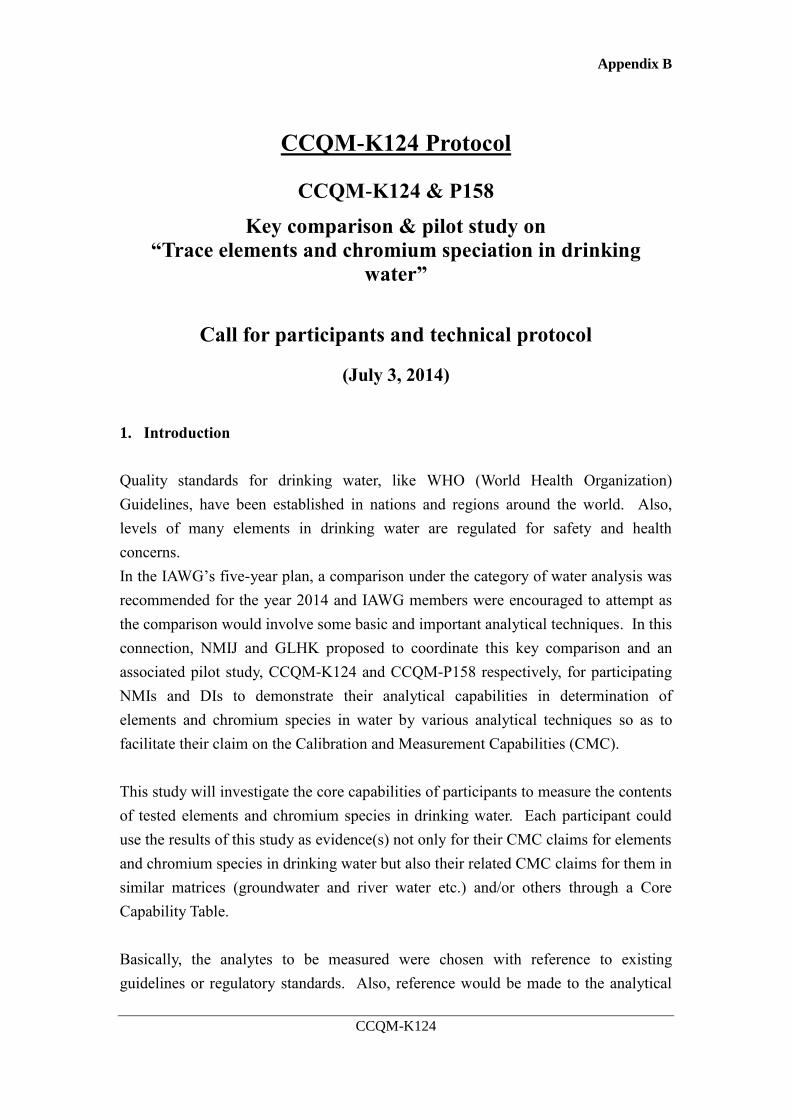
Appendix B
CCQM-K124
CCQM-K124 Protocol
CCQM-K124 & P158
Key comparison & pilot study on
“Trace elements and chromium speciation in drinking
water”
Call for participants and technical protocol
(July 3, 2014)
1. Introduction
Quality standards for drinking water, like WHO (World Health Organization)
Guidelines, have been established in nations and regions around the world. Also,
levels of many elements in drinking water are regulated for safety and health
concerns.
In the IAWG’s five-year plan, a comparison under the category of water analysis was
recommended for the year 2014 and IAWG members were encouraged to attempt as
the comparison would involve some basic and important analytical techniques. In this
connection, NMIJ and GLHK proposed to coordinate this key comparison and an
associated pilot study, CCQM-K124 and CCQM-P158 respectively, for participating
NMIs and DIs to demonstrate their analytical capabilities in determination of
elements and chromium species in water by various analytical techniques so as to
facilitate their claim on the Calibration and Measurement Capabilities (CMC).
This study will investigate the core capabilities of participants to measure the contents
of tested elements and chromium species in drinking water. Each participant could
use the results of this study as evidence(s) not only for their CMC claims for elements
and chromium species in drinking water but also their related CMC claims for them in
similar matrices (groundwater and river water etc.) and/or others through a Core
Capability Table.
Basically, the analytes to be measured were chosen with reference to existing
guidelines or regulatory standards. Also, reference would be made to the analytical
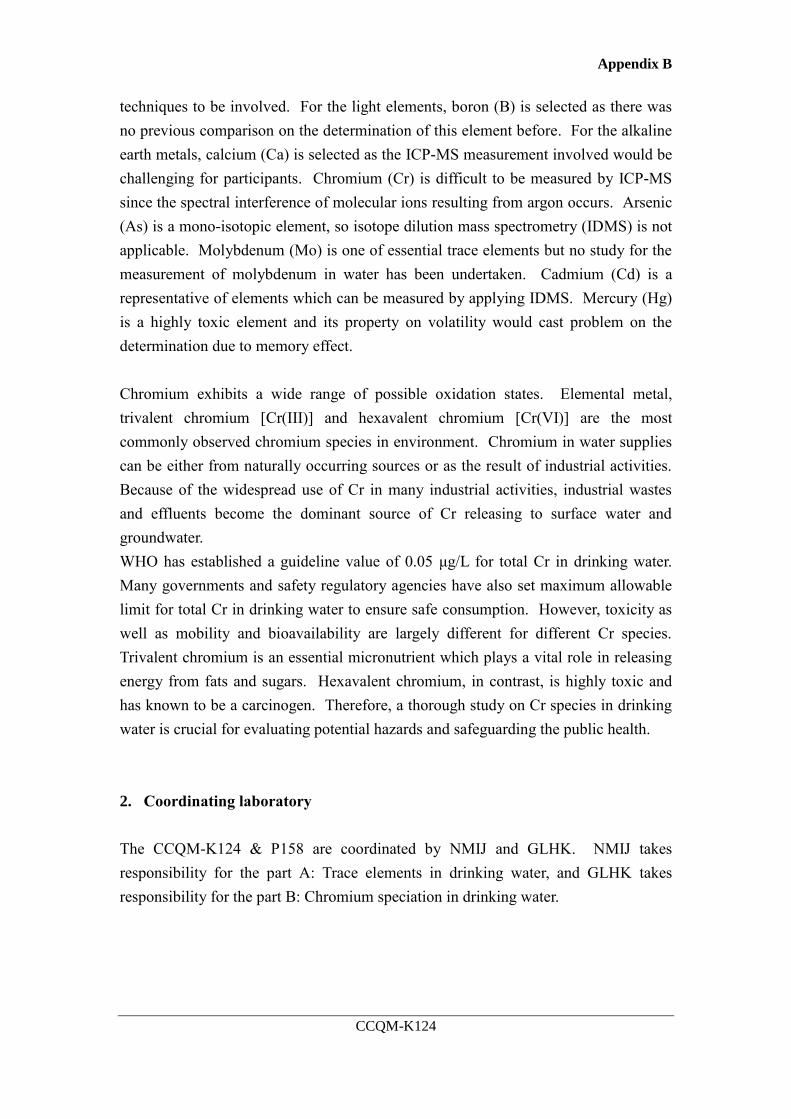
Appendix B
CCQM-K124
techniques to be involved. For the light elements, boron (B) is selected as there was
no previous comparison on the determination of this element before. For the alkaline
earth metals, calcium (Ca) is selected as the ICP-MS measurement involved would be
challenging for participants. Chromium (Cr) is difficult to be measured by ICP-MS
since the spectral interference of molecular ions resulting from argon occurs. Arsenic
(As) is a mono-isotopic element, so isotope dilution mass spectrometry (IDMS) is not
applicable. Molybdenum (Mo) is one of essential trace elements but no study for the
measurement of molybdenum in water has been undertaken. Cadmium (Cd) is a
representative of elements which can be measured by applying IDMS. Mercury (Hg)
is a highly toxic element and its property on volatility would cast problem on the
determination due to memory effect.
Chromium exhibits a wide range of possible oxidation states. Elemental metal,
trivalent chromium [Cr(III)] and hexavalent chromium [Cr(VI)] are the most
commonly observed chromium species in environment. Chromium in water supplies
can be either from naturally occurring sources or as the result of industrial activities.
Because of the widespread use of Cr in many industrial activities, industrial wastes
and effluents become the dominant source of Cr releasing to surface water and
groundwater.
WHO has established a guideline value of 0.05 μg/L for total Cr in drinking water.
Many governments and safety regulatory agencies have also set maximum allowable
limit for total Cr in drinking water to ensure safe consumption. However, toxicity as
well as mobility and bioavailability are largely different for different Cr species.
Trivalent chromium is an essential micronutrient which plays a vital role in releasing
energy from fats and sugars. Hexavalent chromium, in contrast, is highly toxic and
has known to be a carcinogen. Therefore, a thorough study on Cr species in drinking
water is crucial for evaluating potential hazards and safeguarding the public health.
2. Coordinating laboratory
The CCQM-K124 & P158 are coordinated by NMIJ and GLHK. NMIJ takes
responsibility for the part A: Trace elements in drinking water, and GLHK takes
responsibility for the part B: Chromium speciation in drinking water.
Appendix B
CCQM-K124
3. Test material
Part A: Trace elements in drinking water
The test material is a candidate material for a tap water certified reference material
(CRM). The tap water was collected by NMIJ (Tsukuba, Ibaraki, Japan) and filtered
(pore size: 0.45 μm). Standard solutions (As, Cd, Cr, Hg, Mn and Se) were spiked to
the test material at appropriate concentrations, and nitric acid and hydrochloric acid
were added so that those final concentrations were adjusted to about 0.1 mol/L and
0.03 mol/L, respectively. The 150 L test material was stirred using a magnetic stirrer
for homogenization in a 200-L polypropylene tank. After homogenization, the water
sample was filtered (pore size: 0.20 μm) and subdivided in polyethylene bottles (125
mL) by 100 mL each.
The measurands to be determined are the mass fractions of B, Ca, Cr, As, Mo, Cd and
Hg. Those nominal values are 20 μg/kg to 100 μg/kg level of B, 1 mg/kg to 10 mg/kg
level of Ca, 2 μg/kg to 20 μg/kg level of Cr, 2 μg/kg to 15 μg/kg level of As, 0.5 μg/kg
to 5 μg/kg level of Mo, 0.5 μg/kg to 4 μg/kg level of Cd and 0.1 μg/kg to 1 μg/kg
level of Hg.
The homogeneity of the material was investigated by analyzing 10 bottles selected
from 700 bottles. The data were treated with ANOVA. The relative standard
uncertainties due to between-bottle inhomogeneity for B, Ca, Cr, As, Mo, Cd and Hg
were found to be 0.45 %, 0.43 %, 0.33 %, 0.28 %, 0.29 %, 0.19 %, and 0.62 %,
respectively.
Part B: Chromium speciation in drink water
About 4 L of drinking water was purchased from local market. The drinking water
was tested free of incurred chromium species [Cr(III) and Cr(VI)] using an ion-
chromatography inductively coupled plasma mass spectrometry (IC-ICP-MS) method
with detection limit of 0.1 µg/kg for both Cr(III) and Cr(VI). A standard solution of
Cr (III) was gravimetrically prepared from chromium(III) acetylacetonate
[Cr(C5H7O2)3] which is a stable complex [1] and can be synthesized according to
published procedures [2]. A standard solution of Cr (VI) was gravimetrically
prepared from a CRM of potassium dichromate (NIST SRM 136f). A standard
solution of potassium peroxodisulfate for preservation was also gravimetrically
prepared. Having confirmed that the drinking water was free from incurred Cr
Appendix B
CCQM-K124
species by IC-ICP-MS, Cr(III) and Cr(VI) and potassium peroxodisulfate were
gravimetrically taken from the respective standard solutions and added into the
drinking water. In order to preserve the test material of chromium-spiked drinking
water, potassium peroxodisulfate was deliberately added to the test material. The
chromium-spiked drinking water was thoroughly homogenized in a 3-dimensional
mixer for 30 minutes. The homogenized water sample was packed into pre-cleaned
high-density polyethylene bottles, each of 50 g. Totally 80 sample bottles of water
were prepared. All sample bottles of water were vacuum-sealed inside aluminium-
coated bags and are stored at room temperature (20 ± 5 C) inside a Class 1000 clean
room prior to distribution or use.
The expected mass fraction of Cr(VI) is in the range of 10 µg/kg to 1000 µg/kg as
determined by IC-ICP-MS. The homogeneity study was conducted by analyzing 10
randomly selected bottles from the whole lot of bottles prepared. The data were
treated with ANOVA. The relative standard uncertainty due to between-bottle
inhomogeneity was found to be 1.28 %. Also, the short-term stability was conducted.
No instability was observed for the test material at 20 C and 40 C during the 4-week
study period. The long-term stability of the test material at room temperature (20 ± 5
C) will be continued until the deadline for submission of results.
4. Measurands
Part A: Trace elements in drinking water
Each participant will receive TWO sample bottles containing approximately 100 mL
of the tap water. Participants are required to acknowledge the receipt of the sample,
and send the return receipt to NMIJ by e-mail. If there is any damage on the sample,
NMIJ will send a substitute sample on request. A receipt form will be distributed to
the participants. The sample after receiving should be kept at the laboratory
temperature (15 °C to 25 °C). The seven analytes and their expected mass fractions
are listed in Table 1.
Table 1
Analyte Expected mass fraction
Boron 20 µg/kg to 100 µg/kg
Calcium 1 µg/kg to 10 mg/kg
Chromium 2 µg/kg to 20 µg/kg
Arsenic 2 µg/kg to 15 µg/kg
Molybdenum 0.5 µg/kg to 5 µg/kg
Cadmium 0.5 µg/kg to 4 µg/kg
Appendix B
CCQM-K124
Mercury 0.1 µg/kg to 1 µg/kg
Part B: Chromium speciation in drinking water
Participating laboratories will be provided with ONE sample bottle containing about
50 g of water. The expected mass fraction of Cr(VI) is in the range of 10 µg/kg to
1000 µg/kg. Participants are requested to acknowledge the receipt of the sample (E-
mail: [email protected]). Please report any problems with leaking or damaged
bottles immediately so that they can be replaced as fast as possible.
5. Methods/procedures
Part A: Trace elements in drinking water
NMIs or officially designated institutes are welcome to participate in this comparison
and participants can use any method(s) of measurement deemed appropriate. Four
measurements for each measurand are to be carried out by each participant.
Calibrations of analytical instruments should be carried out using standards with
metrological traceability.
Each reference value will be probably the median of the submitted data from NMIs
and officially designated institutes depending on the decision of the IAWG. If any
participant submitted individual results by multiple methods, their best result (i.e.,
with the smallest uncertainty) will be chosen for the calculation of the reference value.
Part B: Chromium speciation in drinking water
Participants should use any analytical methods of their choice. The sample should be
mixed thoroughly before processing and the analysis should be conducted with a
recommended sample size of at least 5 g. The participants are requested to perform at
least three independent measurements on three separate portions of the sample and to
determine the mass fraction of Cr(VI). If any participant submitted individual results
by multiple methods, their best result (i.e., with the smallest uncertainty) will be
chosen to calculate the reference value.
6. Reporting and submission of results
Part A: Trace elements in drinking water
The result should be reported as the mass fraction of each measurand to NMIJ,
accompanied by a full uncertainty budget. Any participant that chooses to use
Appendix B
CCQM-K124
multiple methods can decide only one composite result (e.g., an average value from
different methods) or individual results from different methods as the reporting
value(s) for each measurand. Reporting the details of the procedure (including details
of sample treatment/digestion etc.), the calibration standard and the traceability link,
and the instrument(s) used is required. The result should be submitted using the
attached Report Form for part A: trace elements in drinking water.
Furthermore, all participants in CCQM-K124 are required to complete a Core
Capability Table for the measurement technique which they use. Please choose and
download a suitable Core Capability Table from the IAWG website and the filled-out
table should be submitted together with the measurement result; if there is no suitable
table, please make a suitable one depending on the measurement method.
Please complete and submit the attached Report Form for Part A and the Core
Capability Table to NMIJ (E-mail: [email protected]) by e-mail before the
scheduled deadline.
Part B: Chromium speciation in drinking water
The mean value of at least 3 independent measurements and its associated
measurement uncertainty should be reported;
Report the mass fraction of Cr(VI) in µg/kg;
Participants should provide (i) description of analytical methods and (ii) detail of
the uncertainty estimation (including complete specification of the measurement
equations and description of all uncertainty sources and their typical values); and
Sources and purity of reference materials used for calibration purposes.
Both the Inorganic Core Capabilities table (please choose and download a suitable
Core Capability Table from the IAWG website) and the attached Report Form for Part
B should be submitted to GLHK (E-mail: [email protected]) before the
scheduled deadline.
7. Program schedule
31 July 2014 Deadline for registration
September 2014 Distribution of samples
28 February 2015 Deadline for submission of results
April 2015 Presentation of results at the CCQM IAWG Meeting
Appendix B
CCQM-K124
8. Participants
Participation is open to all interested NMIs or officially designated institutes that can
perform the determination. An NMI or an officially designated institute is
recommended to participate in the key comparison rather than in the pilot study as far
as possible. Under the rule of CCQM, an NMI or an officially designated institute
may nominate other institutes or laboratories to participate in the pilot study. The
qualification for a guest laboratory (neither NMIs nor DIs) to participate in a pilot
study was recently decided: the new approval procedure is necessary.
All guest laboratories should follow the new approval procedure. They must
complete the new request form in order to obtain approval from the CCQM president.
In particular, the guest laboratory must state the value added by the guest
participation. (See the request form:
http://www.bipm.org/utils/en/pdf/guest_laboratories_request_form.pdf)
We would like to ask NMIs or officially designated institutes to coordinate
participation within their economies including inviting participants in the pilot study,
shipping samples, and receiving the reports.
9. Registration
Please complete and return the attached registration forms to NMIJ (E-mail: t-
[email protected]) for the participation of Part A: Trace elements in drinking
water, and to GLHK (E-mail: [email protected]) for the participation of
Part B: Chromium speciation in drinking water. Successful registration will be
notified by e-mail. Please register no later than 31 July 2014.
10. Confidentiality
The participating laboratories will receive the reports giving all results for
assessment/comments. They will be identified in the reports. The key comparison
and pilot study are conducted in the belief that participants will perform the analysis
and report results with scientific rigor. Collusion between participants or falsification
of results is clearly against the spirit of this study.
Appendix B
CCQM-K124
11. Contact
For enquiries, participants may wish to contact the coordinating laboratories as
follows:
Part A: Trace Elements in Drinking Water
National Metrology Institue of Japan (NMIJ)
Dr. Takayoshi KUROIWA
E-mail: [email protected]
Phone & Fax: +81-29-861-6889
Dr. Yanbei ZHU
E-mail: [email protected]
Part B: Chromium Speciation in Drinking Water
Government Laboratory, Hong Kong Special Adminstrative Region, China
(GLHK)
Dr. Della W.M. SIN, GLHK
E-mail: [email protected]
Tel.: +852 2762 3704
Dr. Wai-hong FUNG, GLHK
E-mail: [email protected]
Tel.: +852 2762 3748
12. References
1. O. Yurchenko, K. Belikov and N. Shevtsov, Microchimica Acta, 2008, 160, 109-112.
2. W. C. Fernelius and J. E. Blanch, Inorganic Syntheses, 1957, 5, 130-131.


![V. SPECIATION A. Allopatric Speciation B. Parapatric Speciation (aka Local or Progenitor - Derivative) C. Adaptive Radiation D. Sympatric Speciation [Polyploidy]](https://img.pdfslide.us/doc/110x75/56649d3f5503460f94a186e2/v-speciation-a-allopatric-speciation-b-parapatric-speciation-aka-local.jpg)