Embed Size (px)
Citation preview

K43: Civilization as a Thermodynamic System–
Connecting Energy and Economics, and the Implications
Richard Nolthenius, PhD
• How drastic must policy actions be? • Is our goal to merely slow the descent into chaos,
or is it rather to truly halt climate change? • What is physically possible? • Enter – the insightful discoveries of cloud physicist
Prof. Tim Garrett

My Introduction to Tim Garrett • I first heard of Garrett from arch-apocalypse believer of
near-term human extinction Guy McPherson in 2014 when he came out to join, with me, a public panel discussion on climate change and the future, and who implied Garrett supported the idea that humans would go extinct because civilization was a “heat engine” and our own waste heat would cook us all.
• That’s just crazy; the waste heat of industrial civilization is less than 1% of the heat we TRAP via our CO2 (Flanner 2009). In fact, too many of McPherson’s apocalypse claims are just twisted science, junk science or otherwise plain wrong.
• So who WAS this Garrett fellow? Another from the human-extinction fringe? I told McPherson that I’d look into Garrett’s work, but this introduction didn’t motivate me to get right on it. It took a few months before I did.

When I finally began reading Garrett’s papers…
• …I was surprised and impressed. He’s not an advocate of the Near Term Human Extinction meme, nor of McPherson, and the “heat engine” reference was clearly misunderstood by McPherson (who is not a climate scientist and has no apparent background in thermodynamics).
• Garrett has nothing to say about human extinction. Instead, he’s interpreted civilization as a manifestation of thermodynamic principles, inferred a close and simple relationship between the historical growth of civilization and its current required energy consumption rate, and verified it with real data. He’s then derived a quantitative climate/economic model, identifying its key variables - which differ from those of traditional economic and IPCC modelling. He then shows such traditional models are missing key connections which impose important constraints on our possible climate actions.
• It is unfortunate that Garrett’s work has not gotten the wider reading it deserves.
• Let’s explore these discoveries…

“Learning about thermodynamics is a critical part of being an informed decision-
maker in a Democracy in dealing with our energy problems”
-Dr. Thomas Homer-Dixon
1:10:40 into this lecture

Civilization as a Thermodynamic System • Garrett (2012) (and references therein) has developed
a model of the relation between the global economy, primary energy consumption, and carbon emissions. The underlying approach has proven to have wide application across dynamical systems.
• He applies thermodynamic thinking to the ordered system which is Civilization and predicted a simple relation, which the real-world data verifies.
• His discovery of a simple global relation between energy consumption rates and the accumulated inflation-adjusted Gross World Product (GDP summed all countries summed over all time) and its theoretical link to thermodynamics is a unique and insightful new synthesis and has sobering implications.

Here’s my own framing of the logic in applying Thermodynamics to
Civilization: • In “physical thermodynamics” (like we learned in
textbooks)… • …For a given “closed system” of mass, the increment
of energy dE, which includes internal energy, outside energy input, and including the Gibbs energy dW of useful energy (“work” W) which can be extracted from a system by the production of entropy S (“disorder”) at constant temperature T is…
• dE = TdS • Taking the derivative with respect to time, we see
that the rate of energy consumption is ~proportional to the rate of entropy change

Now for Civilization… • The analog of “total energy” is called “Primary
Energy Supply” in the databases: the raw energy provided by Nature.
• Useful work accomplishes innate human values – the enhancement of networks of relationships, the enhancement and growth of civilization.
• The analog for physical entropy S, is the amount of disorder Sc in the civilization+environment.
• Growth in Civilization must correspond to a reduction in Civilization’s portion of Sc at the expense of greater Sc in the total environment system (effected by the expenditure of physical ENERGY).

Transforming Dis-Order towards Order takes ENERGY
• Any spending to reduce Sc is taking things from the way that they would have been in the natural tendency towards decay and disorder, towards the way we want them.
• This means, from relative dis-order, towards increased order:
• Order – in the form of new and stronger networks linking people, energy, systems, and materials. Order – in the form of enhanced relationships, supporting enhanced growth, and hence larger energy consumption rates.

In Civilization’s Market Economy… • …Spending in general, has a close relationship to Cost,
given competition and hence finite profit margins. We infer, then, that cost is proportional to the amount of change needing to be effected upon our physical and mental states to achieve our ordering goals.
• Laborious, time-consuming effort to make a high reduction in Civilization’s entropy Sc therefore incurs high cost, and requires proportional high physical ENERGY consumption to power it.
• Looked at this way, it would seem quite natural and even inevitable that, within the human desires for enhanced networks and personal as well as civilization growth, that total inflation adjusted past spending (meaning, corrected for mis-pricing due to non-commensurate money supply growth or wealth destruction) should be proportional to the physical ENERGY consumption rates required to support it today.
• That’s my re-framing of Garrett’s insightful work.
Alas, His Work has been Misunderstood by Many.
• Perhaps not surprising because he straddles economics and thermodynamics, and economists are rarely adept in dealing with thermodynamics, nor adeptly fair-minded (apparently) at reading objectively an economics-outsider’s work in this cross-disciplinary area.
• Worse; petty turf-guarding unfortunately has too many precedents (e.g. Wegner stepping on geologists’ toes with “Continental Drift”, astronomers discovering what paleontologists did not – the K-Pg extinction caused by asteroid impact), and smaller examples from people I know, and also being the victim of such myself).
• I have more than a passing interest in economic / political theory, and with human nature’s boundaries, and I find his work fascinating…
• What, really, is possible? And what, really, is necessary to halt our climate decline? Let’s take a quantitative look…

The Garrett Relation (my term; because it badly needs a short-hand)
The Sum Total of all Past Inflation-Adjusted Gross World Product (GWP), (call it “Wealth”) is directly proportional to the Rate of Energy Consumption Required to
Support it Today.
• The CO2 production per unit energy consumed (the “carbonization” c) can, of course, change by human efforts, so let this be a variable in the quantitative relationships.

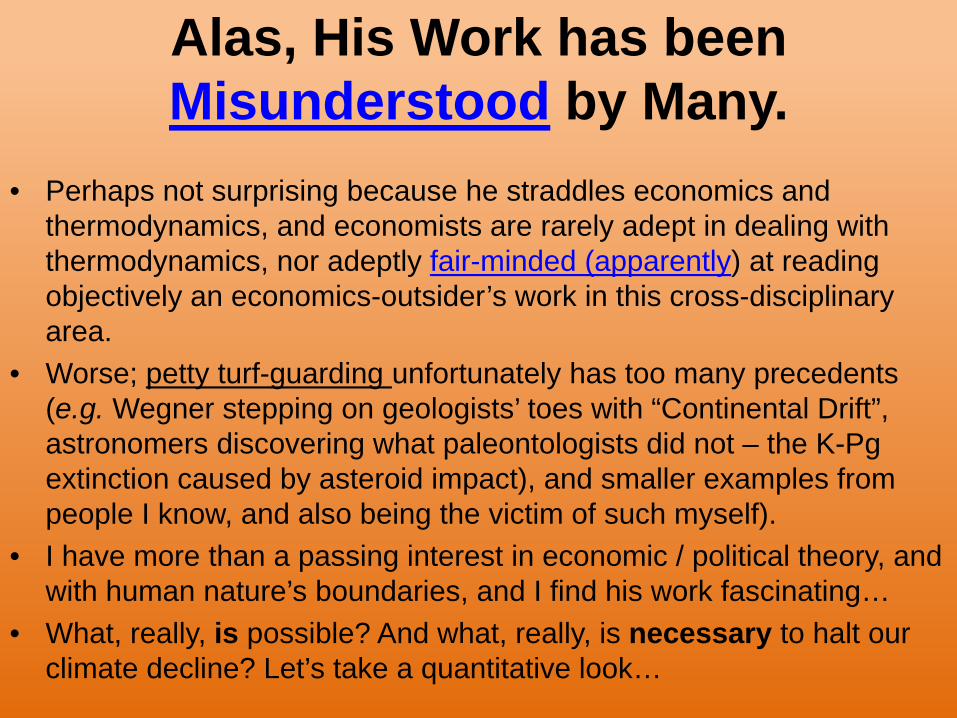
The relevant energy in this relation is PRIMARY energy. Energy in raw form provided by Nature. Why?
Because civilization must process this into useable energy first, before it can be consumed, and this will
result in losses. In other words, we must recognize the FULL costs of our energy to power Civilization. Looking
at promotional graphs which only present our progress in terms of processed energy (e.g.
electricity) will be cheery, but unrealistic in true cost
Realize that Nature only gives us
PRIMARY energy. We must then
invest money, effort and energy in converting it to useful energy.
Graphs showing improving
efficiency but don’t use PRIMARY
energy are misleading. Only
about 1/3 of primary energy
ends up as useful energy

It’s an Elegant Thesis • The theoretical basis for the equations he derives follow from
thermodynamics – the principles and equations governing the flow of heat, entropy, and energy, and their relation to generating useful work (see Garrett 2014)
• Maintaining Civilization requires a battle against the 2nd Law of Thermodynamics (the decay of ordered (i.e. low entropy) energy into disordered (high entropy) energy. The ultimate in disordered energy is heat – the energy of the random motion of atoms and molecules in a substance.
• Energy must be taken from a low-entropy “ordered” state, and “disordered” in the act of getting useful work from that energy. Useful work meaning… make things, repair things, grow food, write a symphony … anything useful at all)
• Garrett’s Climate and Thermodynamics Economic Response Model (CThERM), a computational model which results from this, has been successfully back-tested against a history of past data, and shows high skill scores when given past data, significantly better than scores using extrapolations of trends
• This hypothesis is testable, and it succeeds…

λ=7.1 mW of power is required to support every dollar (2005 inflation-adjusted) of GWP ever spent.
Below is real-world confirming data

Historical energy consumption rate (power) and total accumulated Wealth, plotted on top of each other for clarity. Result? They’re directly proportional; i.e. the
ratio (black curve) is flat.

The Garrett Relation: Power is Proportional to Wealth
• “The ratio of these two quantities remained essentially unchanged in each year between 1970 and 2010, with a standard deviation of just 3% over a time period when wealth increased by 111% and GWP increased by 238%” (Garrett 2014).
• Let’s look in more detail why should this hold…

But first: There’s a very DIFFERENT ratio – the current primary energy consumed per unit of CURRENT GDP. Now THAT ratio HAS been improving, decreasing fully 32% (but
using PPP accounting, more on that later) since 1990. Some economists accidentally or deliberately conflate these two,
then wrongly dismiss the Garrett Relation.

Why does the Garrett Relation hold? First, the larger an economy, the more energy required merely to maintain its current state against natural decay
• Obvious, yes. But even the goods and services long gone in the distant past were essential in order to grow into what we are today. So, properly appreciated, relevant “Wealth” is not merely in existing goods – it is total accumulated spending over all time.
• More important, it’s not in things themselves, which require maintenance (repair, etc.), but rather it is the continuing relationship networks which are enhanced between things and people which constitute the “wealth”. Enhanced relationships, is the value of that spending, and constitutes the real Wealth. And it is along networks where frictional energy is consumed

Wealth: It is in the Enhanced Relationship Networks Enabled
• Garrett uses the example of a road. Its value is in the efficiency with which it provides so many opportunities to expand countless relationships through its existence. Less tangibly, a symphony can inspire, energize, and promote enhanced relationships if it touches our core spiritual values and enhances our desire to live fully.
• Just as electricity moving through a wire is energy in motion and this is where frictional losses happen, so too it is along the relationship lines between people, networks, and all forms of the construction of information out of randomness, that energy is dissipated.
• And take away the Energy to support it, and it quickly becomes valueless. Energy is essential to the human VALUE

Energy Dissipation Happens Along All Civilization’s Networks, Not
Merely in Material Decay of Objects • Because these relationships are subtle, often non-physical,
and extend in countless directions not obvious at first, there is a quality of “emergence” to them which enhances their value beyond the most obvious initial physical connections one might consider.
• Thus, the global rate of primary energy consumption should be proportional not to current GWP (GWP = Gross World Product), but to the total inflation-adjusted ACCUMULATED spending of the world over all time. There is a “ghost” remaining for every dollar spent, even on things long since decayed and gone. That “ghost” exists in having enabled current Civilization.
• The GOAL of human action is to expand human life, in all the many ways that word can be interpreted. Seen this way, the Garrett Relation appears quite natural.

Thermodynamic laws are only simple in a CLOSED system. It seems energy
consumption and economic growth appear elegantly simple as well, but only when seen
in a GLOBAL (hence CLOSED) system • The great discovery moments in physics
have come from the realization and appreciation of elegant symmetries obeyed in Nature.
• Should we be surprised that one product of Nature – humans and human enterprise – might also obey elegant simplicities when the artificial borders important to most economists are removed?

Climate too is global - recall that the global diffusion time for atmospheric
GHG’s is only a few weeks • The atmosphere’s greenhouse gases are
“well mixed”. This is fundamentally important. All countries’ CO2 becomes all other countries’ CO2 very quickly.
• Likewise, economies, too, are “well mixed” in the modern world – the flow of wealth and material between countries is rapid in comparison to the evolution time scale of the global economic system as a whole.

Therefore, studying one country in isolation, and ignoring the flows of material, energy, and money across its borders can lead to
dramatically wrong conclusions.
• In the same way, The 2nd Law of Thermodynamics will appear violated if one only looks at an increasingly (ordered) complex growing system (like Tim Garrett’s son, his favorite analogy) and ignores the even larger amount of disorder imposed on the rest of the surrounding environment by the energy consumption required to create that complexity (e.g. the cost of child-raising and whatever mayhem the little one causes in learning the ropes of life!).

Local: Difficult and complex. Global: Simpler!
• Not only does the Global context greatly simplify studying the relationship between economics to energy and climate, but in fact…We NEED to consider things globally in order to avoid making fundamental errors. Errors due to false or missing feedbacks between the hundreds of parts of traditional complex economic models
• (This is not to criticize such models – so often quantities of economic interest are local and delimited and therefore NOT in a closed system, and then complexity and uncertainty multiply. It’s unavoidable.
• But there’s a deeper truth here…

Jevons’ Paradox • Implicit in the Garrett Relation is the
observational confirmation of what I will call “Generalized Jevon’s Paradox” (or, given the grim implications: “Jevon’s Revenge”). This is distinct from the older, original formulation of William Stanley Jevons.
• Most eco-friendly advocates and policy cheerleaders who compose “white papers” and speeches will claim that if we just increase energy efficiency, we’ll make big strides in cutting CO2 emissions. That’s FALSE, both in theory and fact.

Headline Boosterism • You’ve all seen the blurbs which show up on
news sites about some new energy efficiency idea…
• “Mileage standards to Increase to 45 mpg from current 25 mpg, saving a million tons of CO2 per year!”
• Wow! A million of tons! Fantastic! We’re on our Way!!

Savings! We Love ‘em! But Here’s What is Being Ignored…
• You’re going to spend those savings to expand your life, and the Garrett Relation shows that ALL spending will result in an increased rate of future energy consumption, including the carbon-based energy portion.
• We maximize our profit. If you’re eco-spirited and excited about buying a less-carbon-intensive car, you’re still almost certain to sell your old gas guzzler to someone else who can’t afford the new and more efficient cars, and so your old car will still be spewing CO2 till the end of its natural life.
• ACTUAL carbon savings? Little, or there may be none at all, and it doesn’t make such a happy story and so NO ONE WANTS TO HEAR THIS.
• It’s depressing and undermines the Gee-Whiz salability of your splashy article, so editors and writers want to ignore these facts too.

At best, it is naïve. It’s like a novice chess player, who, upon taking your rook with his pawn, gives a satisfied look of
triumph, only to find 4 moves later that his king is trapped. You MUST look several moves ahead to get the full picture.
The savings claim implicitly assumes that the “dollars”
saved in efficiency are never spent. It assumes, essentially, that the wealth created by that savings, denominated by that
money, is destroyed.

History shows quite the opposite
• Instead, those savings will be used to GROW Civilization, both enabling and necessitating its accessing new energy sources.
• And since there is 7.1 milliwatts of new ongoing power needed for every (2005 inflation-adjusted) GDP dollar spent on goods and services ever produced, then given our fossil fuel dominated global civilization, net CO2 savings do not happen, but in fact CO2 generation gets worse
• This is a deeper reformulation of the original “Jevons’ Paradox”, first discussed by William Stanley Jevons in 1865, who observed that increasing the efficiency of steam engines’ burning of coal should, and did, make for a significant INCREASE, not decrease, in coal consumption.
• A more limited aspect of this phenomenon is commonly called “Rebound”
• But “Rebound” misses the point that efficiency savings need not be spent on more of the same, but yet will be spent SOMEwhere. And it does not matter where – all spending raises future energy consumption rates: The Garrett Relation.

Those Who Dispute Generalized Jevons’ Paradox, Look Closer…
• Narrowly interpreted (“rebound”, e.g. coal steam engine to coal steam engine, say), yes, it does not necessarily apply, and indeed the link here includes links to advocates who believe that “green taxes”, for example, do not display Jevons’ Paradox,
• But here, they fail to realize that ANY economic activity requires energy. This is key to understanding how CO2 emissions relate to economic growth.
• In other words, even if the savings of coal in coal-fired steam engines did not stimulate making more steam engines burning more coal, the money saved would have been spent SOMEWHERE, and that SOMEWHERE would have needed energy to fuel it. That’s what history shows.
• To distinguish this globally understood form from Jevons’ early formulation, I will call this…
• Generalized Jevons’ Paradox. • Or more memorably: “Jevons’ Revenge”
Generalized Jevons’ Paradox
• Increasing energy efficiency (i.e. the ability of a given rate of energy consumption to produce more economic wealth) will lead not to a lessening of energy consumption, but rather to a higher energy consumption rate, as the savings from the increased efficiency can (and will) be spent in ANY area of life, and historical evidence shows any spending, as reflected in inflation-adjusted Gross World Product, will require new consumption of additional energy at a higher rate to enable it and to then continue to support/maintain the growth it created, on into the future.

But Wait! You Say… • “Money I save through efficiency might be spent in less
energy-intensive ways. Maybe I’ll take the money saved and buy more vacation days, and on my vacation days I could go trail running or just reading.”
• First, if those dollars spent don’t add to civilization and hence its energy needs, they provide a mis-match between global “wealth” and total money. This aspect is reflected in the inflation term
• But more to the point, those dollars are still going towards enhancing your life, health, relationships, and therefore your ability to spend in the future. They’re not quite the savings to Civilization’s ongoing power needs as you may think.

Even those running shoes are helping you to become a better,
healthier, happier, more expansive person and thereby increasing your future energy
needs • In other words, the consideration above is
already reflected in the historical data – the same data that confirms the Garrett Relation.

Heck, for evidence, look at me at age 64,
solo-running a 17 mile wilderness trail in
those running shoes! I could live to be 100 at this rate, and at 17 tons of CO2/yr for the average American, I’ll out-CO2-impact my
shorter-lived compatriots by a
significant amount, while they are
Cheetoh’ing and beer-guzzling their way to
a CO2-conserving early grave!

Even at zero growth - History shows that inflation-adjusted accumulated
Wealth requires constant future energy be generated in order to maintain that
Wealth against the forces of decay • There is only one alternative – if wealth is actually
destroyed or does not lead to further enhanced ability to exploit energy resources (i.e., it was not productive wealth creation),
• In that case, it is a different form of “inflation” in the CThERM quantitative model of Garrett.
• Garrett recognizes the more general nature of “inflation”, to extend beyond nominal monetary inflation (Fed policy-created money), but also to include destruction of wealth which does not also include destruction of the money which denominates it.

Inflation • If spending somehow does NOT enhance civilization,
that loss is reflected in the inflation term of the quantitative model describing these relationships. Inflation here is more generalized than monetary inflation. It includes any “drag” that takes away from nominal GWP to yield real GWP. This recognizes that inflation can have many causes, not just excess money-printing.
• Inflation, or “decay” is usually an involuntary drag, but I note for future reference that it is at least possible for it to be a voluntary choice to invest in actions which do not grow civilization.
• More on the interesting and intricate considerations around inflation later in this Presentation…

Efficiency Gains Lead to MORE Energy Consumption, not LESS
• This key fact (Garrett 2012) is simply missed, ignored, or distorted into a “straw man” by policy “white papers” and promotional publications and speeches.
• They misunderstand what humans actually DO with energy efficiency gains – we do not destroy those “dollars”, we do not get happy with a static lifestyle that costs less. Instead, we plow those savings to grow further, creating new wealth linked with new networks and relationships along which energy dissipation must be countered with continued new consumption of energy at higher rates.

We’ve All Heard the Urgings from the Eco-friendly Progressives…
• … if only we can mandate lighter vehicles instead of those heavy steel cars of old!
• … if only we would raise our mandated mileage standards for vehicles!
• … if only we can eliminate those darn “vampire power” losses in our appliances!
• … if only we would outlaw incandescent light bulbs and go to all compact fluorescent bulbs!
• ….if only we would outlaw those compact flourescents and go to all LED lights!
• …if only we can eliminate cars and go to PRT’s (personal rapid transit) community vehicles!

Yet – we’ve been dramatically increasing energy efficiency ever since the invention of the wheel.
We’re “optimal foragers”, as are all other animals, seeking to lower our energy spent per unit of
economic utility gained.

Look at U.S. Energy Efficiency Data since 1950…
Spectacular 62% increase in Energy Efficiency! Has it lowered our
Consumption?...
Not one bit! Energy consumption is up 300%, even given our off-shoring
of much manufacturing
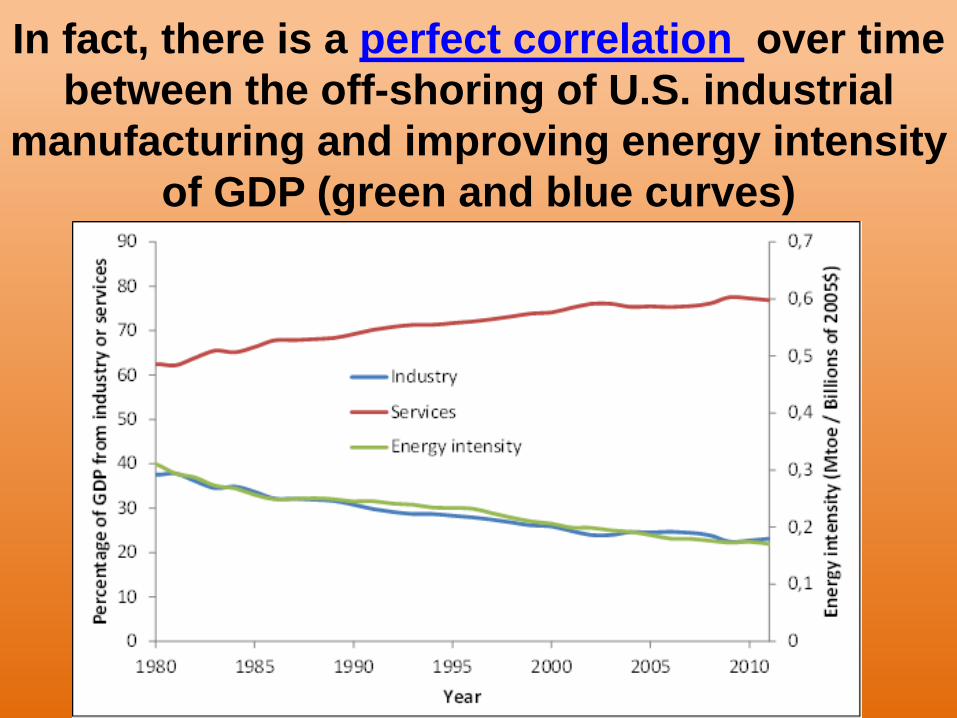
In fact, there is a perfect correlation over time between the off-shoring of U.S. industrial
manufacturing and improving energy intensity of GDP (green and blue curves)

Another: Miles/gallon for jet airplanes show striking improvements, enabling
yet more, not less, jet fuel burned

Then there’s the Holy Grail of Energy: More Storage!
• Surely, energy storage is showing the way to lower CO2 emissions – right?
• No. It’s showing the way to HIGHER energy consumption and HIGHER CO2 emissions “It’s difficult for storage to NOT to increase emissions” – Vox Article 2018
• Even paired with solar PV, storage today INCREASES CO2 emissions, when the full accounting is done (Fares and Webber 2017).
• (For the Garrett Relation, don’t confuse “energy” with CO2-generating energy. More on that later).

An Example of the Poor Grasp of “Jevons’ Revenge”, from the Otherwise Laudable National Resources Defense
Council • They failed to understand the basic Garrett Relation,
attacking with the fact that current GDP does not scale with energy consumption. True, and irrelevant! The Garrett Relation is between total time-integrated GWP, not current GWP! This betrays a dismaying lack of scholarship and plain old fashioned paying attention to what you’re reading, if not downright deliberate creation of a straw man to knock down in order to discredit what is, in fact, insightful work.
• They then smear those who point out the existence of “rebound” as enemies of renewables (certainly not true), and then try to disprove rebound by cherry-picking individual countries such as Germany and the U.S., failing to recognize the fact of global trade and off-shoring of CO2-generating manufacturing
And worst of all, they assume “rebound” narrowly refers to only the use of more of the exact product that one has savings in
• They ignore how the efficiency-created new wealth can, and will, be spent in any area of civilization.
• It seems that one must battle even the good guys in the climate fight, in order to have the real situation fully appreciated and motivate the full measure of effort required in order to realistically have hope.
• Jevons’ 1865 original formulation does not apply. Ignore it. Instead understand Generalized Jevons’ Paradox

We Do NOT Save our Efficiency Savings, We SPEND them; on
Bigger Homes…

…on more consumption spending per $ of GDP

We’re NOT Saving. Even for our own Retirement

We’re “Broke, but full of hope”

We’re Increasingly Obese, and “Livin’ Large”

In Case You Think Increased Health Research and Education has slowed
the Worsening Obesity Trend… • No. It continues up through the present (Hales et
al. 2018). Obesity rates among youth has gone up 10% in just the past decade, and even more – by 18% - among adults.
• People know eating carb-heavy junk food causes obesity, but they give in to their cravings anyway. People do what they WANT to do, helped by corporate advertising.
• This has EVERYTHING to do with the Thermodynamics of Civilization, Generalized Jevons’ Paradox, and failure of “impulse control” towards a healthy global future and away from immediate gratification.

We’re Livin’ Large!

Even if we have to borrow from future generations, impoverishing them, to afford to
do it. Private Debt/GDP is Exponentially Increasing. (Govt. debt is rising even faster)

“Being able to falsify a result lies at the core of the scientific method. It must be possible to set
up a test that could lead to a model being discarded.” – Tim Garrett
• The above is from Garrett’s article with the blunt and provocative title “Macroeconomics is not a Science”
• Integrating physics (thermodynamics) with civilization’s economic aspects, on the other hand, does qualify in this regard (i.e. scientifically testable)…
• “Current global rates of energy consumption growth and GWP growth can be accurately predicted based on conditions observed in the 1950’s, knowing only the key thermodynamic civilization relations and without appealing to any observations in the interim, with skill scores >90%. (Garrett - from same article).
• For a more detailed study of Garrett’s work, see key papers linked near the top of this page of mine. The latest and most mathematically detailed paper is Garrett 2014

Well, what if I just leave my energy efficiency savings in the bank?
• Even if you simply leave your savings in the bank, the bank uses those dollars as an asset base, enabling them to lend out a multiple of those dollars (newly minted money out of thin air) to others who will spend them. So that’s also a no-win. (We all live, globally, within a fractional reserve banking system)
• Thus, if you’re going to avoid expanding energy generation rates, you have to “destroy” the dollars saved through efficiency gains.
• (Or else, convert them to non-productive assets like gold, and literally bury it, waiting for a day when the Earth can afford your spending it.)

So, we have to essentially BURN our piles of efficiency-gained cash??

I Wish it Were That Easy… No, it’s Worse
• The cash only denominates Wealth, and if the wealth remains, the ability and reality it enables - that of further growth in energy consumption - remains.
• Burning the cash only makes for “negative inflation” after it’s burned. It doesn’t help our dilemma – our dilemma being to LOWER Civilization’s total energy consumption
• We need to actually cripple civilization’s ability to grow, or else voluntarily halt that growth by policy action or (impossibly hard) universal and continually summoned (biological energy intensive!) human will power against our desires.
• In a competitive world, this would seem extremely unlikely

To avoid Generalized Jevons’ Paradox, improved energy efficiencies cannot be spent elsewhere. Even spending them on de-carbonizing will require
energy, and will raise CO2 emissions in the present (but better spent on
decarbonizing than not)
• This last observation may help explain the next graph, which many of you will find surprising…

We’ve All Heard the Cheerleading: Solar and Wind
Taking Over the World • I’m guessing you expect the carbon intensity of
energy = CI (= CO2 emission per joule of energy consumed) over time has been falling here in the 21st Century, after perhaps rising during the smog-choked industrial 20th Century.
• …Falling, as solar and wind take the place of coal and oil, after the Industrial Age ramped during the 20th Century and gives way to the Clean Energy Century…
• Is that your guess? Let’s look at the actual data…
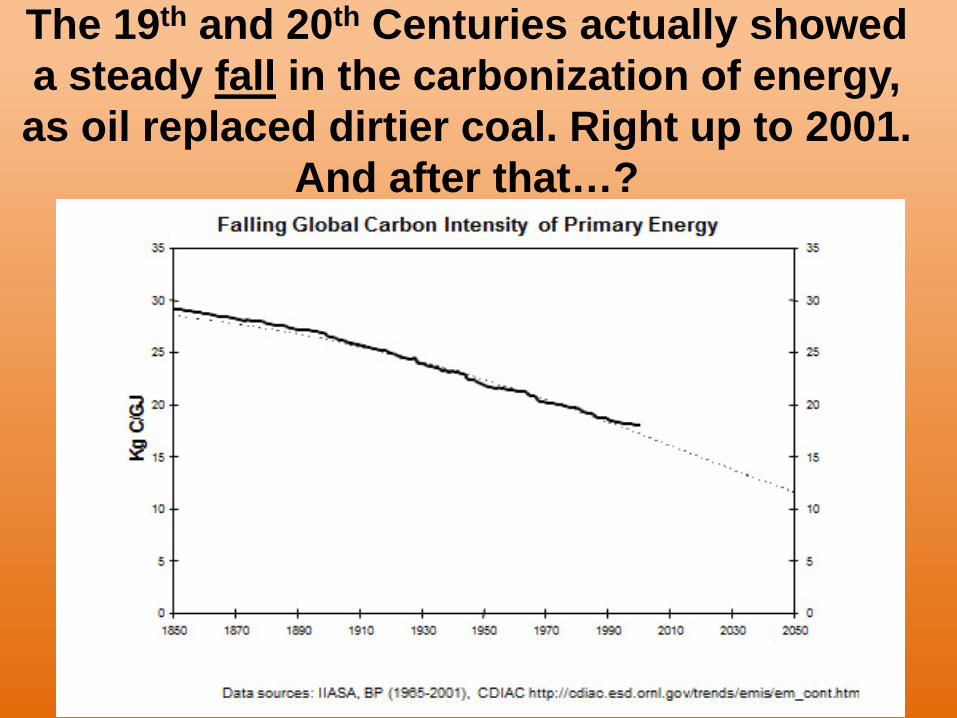
The 19th and 20th Centuries actually showed a steady fall in the carbonization of energy, as oil replaced dirtier coal. Right up to 2001.
And after that…?
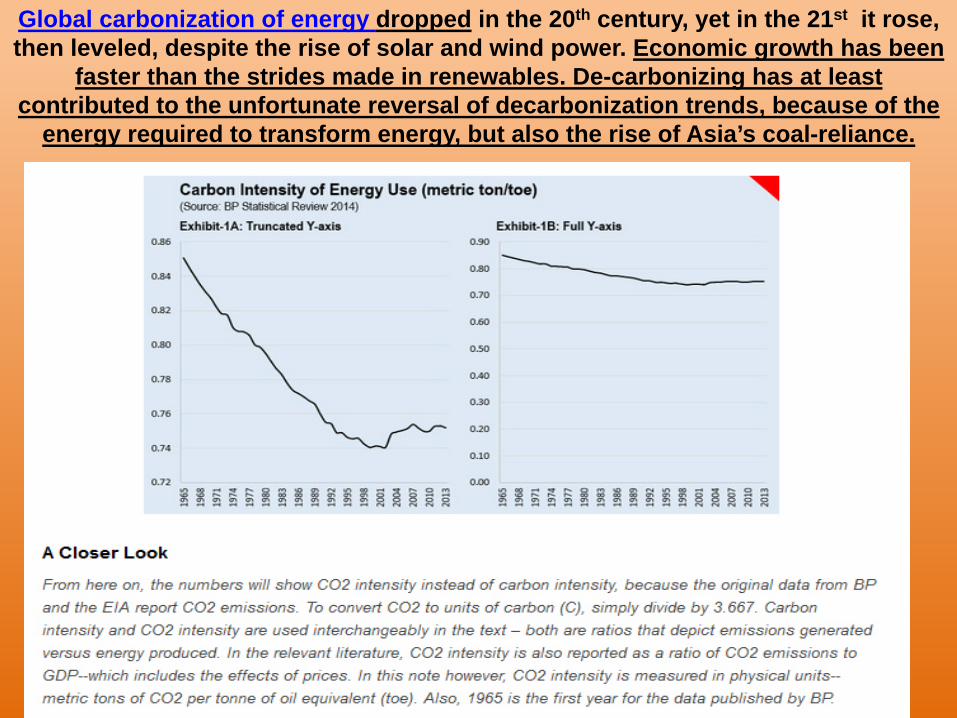
Global carbonization of energy dropped in the 20th century, yet in the 21st it rose, then leveled, despite the rise of solar and wind power. Economic growth has been
faster than the strides made in renewables. De-carbonizing has at least contributed to the unfortunate reversal of decarbonization trends, because of the
energy required to transform energy, but also the rise of Asia’s coal-reliance.

Plotted is CO2 intensity per unit of energy
generated. Strong growth from China (coal) halted
decarbonization this century. Even the non-China world (blue) has
slowed its de-carbonization, although it’s still decarbonizing.
Developed world (OECD green) is doing better.
The current (2016) global economic slow-down may see these curves
resuming downward, is my guess. But Climate cares ONLY about the black (world) curve!
Note: The exponential
halving time of carbonization 1965-2001 is 180 years

Well, OK. But we were decarbonizing for a while, Rick! We
could do it again, no? • We were indeed decarbonizing globally. Due to
the world being economically dominated then by technologically advanced countries (U.S., Europe, Japan) and the adoption of nuclear power, hydro power, and slow moves away from coal to more efficient oil and natural gas as well, to some extent.
• But for future reference, note that the smooth global carbonization curve from 1965 to its minimum in 2001, fit to a decaying exponential, produces a halving of carbonization time scale of fully 180 years. That’s a long time.

Total Policy Failure: CO2 Annual Emission RATES Are Rising Relentlessly, despite IPCC Climate Summits. But there’s a reason –
You can’t have an economy w/o CO2 emissions today, and too, the Economic Elites (Gilens/Page 2014) INSIST on growth. Without growth, Wall Street
plummets. Wall St. (who installs our politicians, who employ policy people) finds this absolutely UNACCEPTABLE. Many Greens do too, it seems

But Rick, Look at how the carbon intensity of GDP has been falling in
the U.S and even in China!

And Look at how U.S. GDP still rises while Primary Energy Consumption
has Flattened! (gray)

And look at how the U.S. has reduced its total energy
consumption in the past few years!
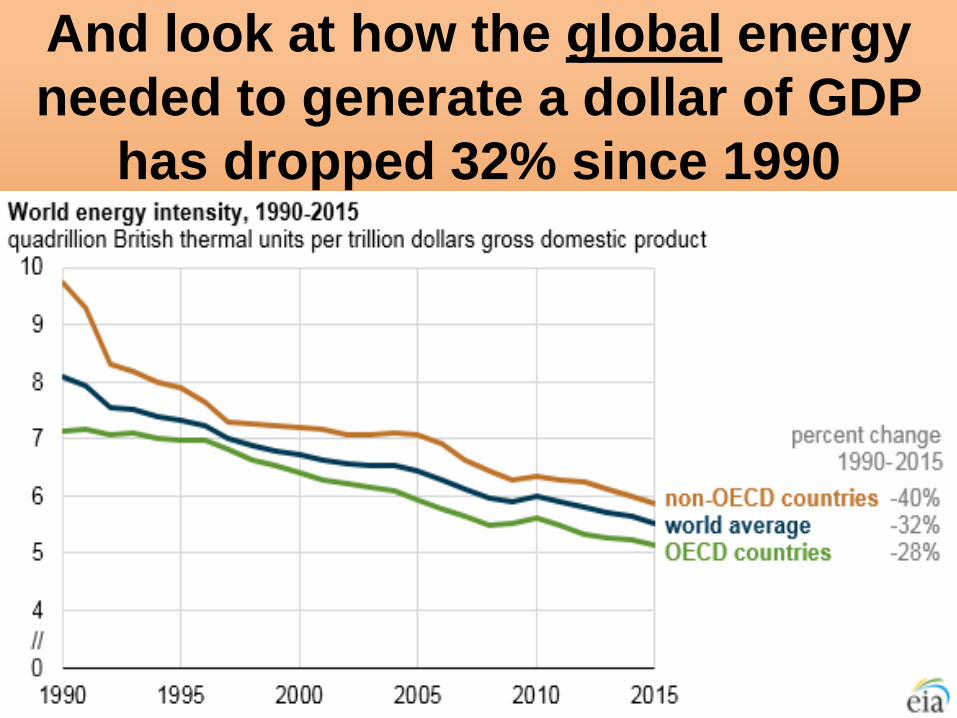
And look at how the global energy needed to generate a dollar of GDP
has dropped 32% since 1990

Yes. Impressive. But it’s a case of classic mis-direction (“look over
here!” while the real action is over there). Here’s 5 Reasons…
• 1. These rich western countries have outsourced their CO2 generating manufacturing to Asia, whose emissions have been skyrocketing.
• 2. The sources of such curves are often not careful about distinguishing energy consumption (e.g. kilowatt hrs on the meter) from PRIMARY energy supply used, which is what must first be processed into useable energy. By not doing so, they neglect major energy costs in the early stages of energy processing, as we saw.

• 3. The first curve shows the carbon intensity of GDP, not of energy itself, and it is the carbon intensity of ENERGY which is the climate-relevant quantity to consider, and since…
• 4. It’s not current GDP, but the sum total of ALL historical global GDP that is the relevant denominator in the Garrett Relation’s ratio. We need to not only generate new GDP, but support all past GDP by our current energy consumption – and the past cannot be changed.
• 5. Global economic growth in GDP is far faster than CO2/$GDP improvements, so carbon emissions continue to grow. Indeed, that growth is HELPED by these CO2/$GDP improvements.

Are You Still Bothered with the Nagging Thought…
“But wait a minute! How can power
consumption stubbornly remain proportional to total GWP over all time, and yet we are continually
getting more and more GDP for each watt of power?
It just doesn’t seem RIGHT

f(t) == P(t)/G(t): Primary Energy Consumption Rate (P) per unit of global GDP (G) is an approximately linearly dropping
function. But note that during recessions (1990, 2001 and 2008/2009) f(t) went flat, so that the slope went to zero.

The World Bank data on the previous slide shows the global energy consumption rate (power P) per unit of global GDP G. Call that changing ratio f. It’s a declining function. (1) 𝑓𝑓 𝑡𝑡 ≡ 𝑃𝑃(𝑡𝑡)/𝐺𝐺(𝑡𝑡) Differentiating with respect to time t gives…
(2) 𝜕𝜕𝜕𝜕𝜕𝜕𝜕𝜕
= 𝐺𝐺 𝜕𝜕𝑓𝑓𝜕𝜕𝜕𝜕 + 𝑓𝑓 𝜕𝜕𝐺𝐺
𝜕𝜕𝜕𝜕
Now, the Garrett Relation is…
3 𝑊𝑊 𝑡𝑡 = � 𝐺𝐺 𝑡𝑡′ 𝑑𝑑𝑡𝑡′ = λP(t)𝜕𝜕
0
Differentiating with respect to time t gives…
(4) 𝜕𝜕𝜕𝜕𝜕𝜕𝜕𝜕
= 𝐺𝐺𝜆𝜆
and substituting this into (2) then gives
(5) 1𝜆𝜆 = 𝜕𝜕𝑓𝑓
𝜕𝜕𝜕𝜕 + 𝑓𝑓
𝐺𝐺𝜕𝜕𝐺𝐺𝜕𝜕𝜕𝜕

And So…
1𝜆𝜆 = 𝜕𝜕𝑓𝑓
𝜕𝜕𝜕𝜕 + 𝑓𝑓
𝐺𝐺𝜕𝜕𝐺𝐺𝜕𝜕𝜕𝜕
• The left side is constant positive. On the right side, the first term is (historically) negative and approximately constant (~linear downward sloping f ). But the 2nd term is nearly always positive. It is negative only during the brief economic recessions when 𝜕𝜕𝐺𝐺/𝜕𝜕𝑡𝑡 is negative. But as we just saw, this is also when 𝜕𝜕𝑓𝑓/𝜕𝜕𝑡𝑡 rises to zero or even positive.
• Averaged over the noisy (and unreported uncertainty limits of the economists’ data) brief recession periods, the equation holds true (Garrett 2010).
• But note - If we were to enter a prolonged recession, it suggests that we could not simultaneously continue to improve the energy efficiency of global GDP, so that 𝝏𝝏𝝏𝝏/𝝏𝝏𝝏𝝏 would have to turn positive (ignoring lag effects). In other words - we’d be struggling with merely maintaining past growth’s Wealth, so current energy consumption would be growing FASTER than GDP, as hinted in the last recession.

China, other Autocratic Countries – OverReporting GDP, Hence Over-Rosy Energy Efficiency Figures
• A review paper from the St. Luis Federal Reserve cites numerous studies indicating China’s reported GDP growth could be as high as 1.65x to 2x overstated; political and other causes. Power consumption, on the other hand, is easier to measure even in China - night luminosity by satellites is a proxy, and, after calibration, indicates a strong over-reporting by China officials of their GDP (Owyang and Shell 2017 – St. Louis Fed). And more recently.
• What does this mean? If true, it means China energy efficiency improvements are also overstated, globally as well, since China is now so large, and so the apparent paradox is even less of a paradox.

Global energy consumption, including fossil fuels, continue to skyrocket. (2017 data)

Strong CO2 Emissions in Asia generated by manufacturing goods flowing to the U.S. and Europe. We get the goods, they get the carbon guilt. An inconvenient fact not highlighted by policy people. U.S. trade deficit,
mostly with China, set a new record $50 billion as I write this in early ‘18

For decades, China’s Central Planning has put them through Cycles of Overbuilding (think “Ghost Cities”), followed by a fallow year or two. The
latest in 2015-2016. Excited declarations of “Peak Emissions” are premature. It’s just cycles. There is no question China is determined to grow much larger, requiring more energy, still mostly provided by coal
and other fossil carbon for now. GDP growth reported 7% in 2017

So, while we in the U.S. may not be burning quite as much… instead we’re rapidly accelerating the exporting of our fossil fuels to other countries,
especially Asia, and THEY burn it. Burned is burned - climate doesn’t care WHO burned it

“Peak Emissions” Celebration? Put Away the Party Hats - 2017 CO2 Emissions
Rise +2% over ‘16, Led by China’s +3.5%
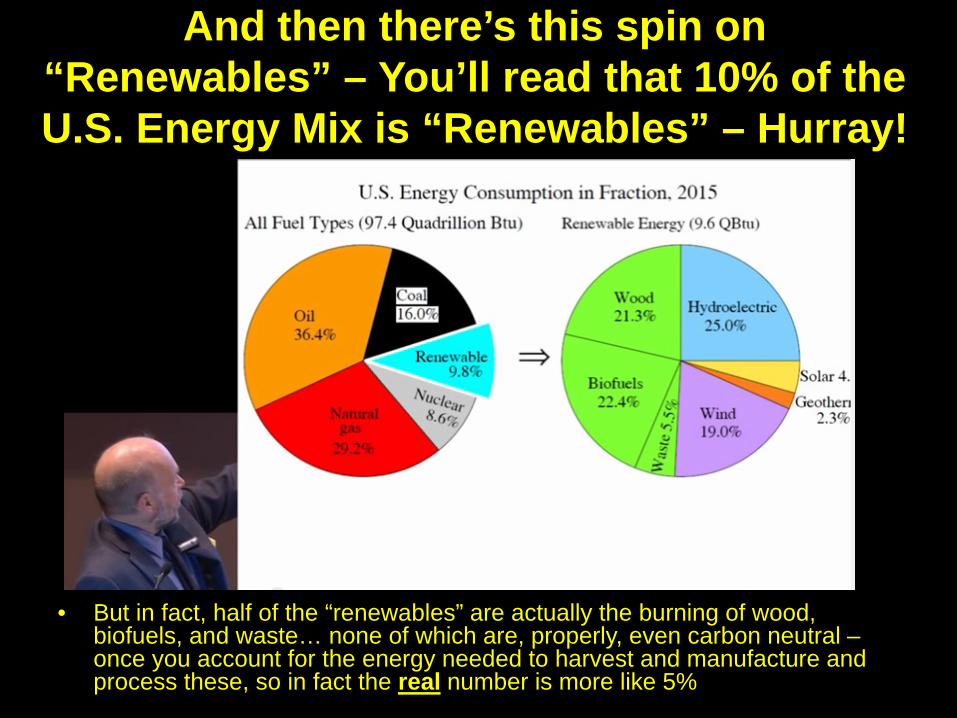
And then there’s this spin on “Renewables” – You’ll read that 10% of the U.S. Energy Mix is “Renewables” – Hurray!
• But in fact, half of the “renewables” are actually the burning of wood, biofuels, and waste… none of which are, properly, even carbon neutral – once you account for the energy needed to harvest and manufacture and process these, so in fact the real number is more like 5%

This analysis finds that global fossil fuel energy will continue to rise until peaking by 2040, and even staying higher than today right up till 2060; and this is from a solar energy organization’s scientific advisory board, whom you’d guess would err on the side of solar optimism. Well-built
fossil fuel power plants don’t get decommissioned just to save the planet, not if they produce useful energy.

China Imports of Coal and Crude Oil in 2015 and 2016; Are Rising

2012-18: Demand and supply continues to rise even during the global economic slowdown of ‘15/’16.
Millions of barrels per day. Global oil demand growth rate 2013 to 2017 is 1.9% per year
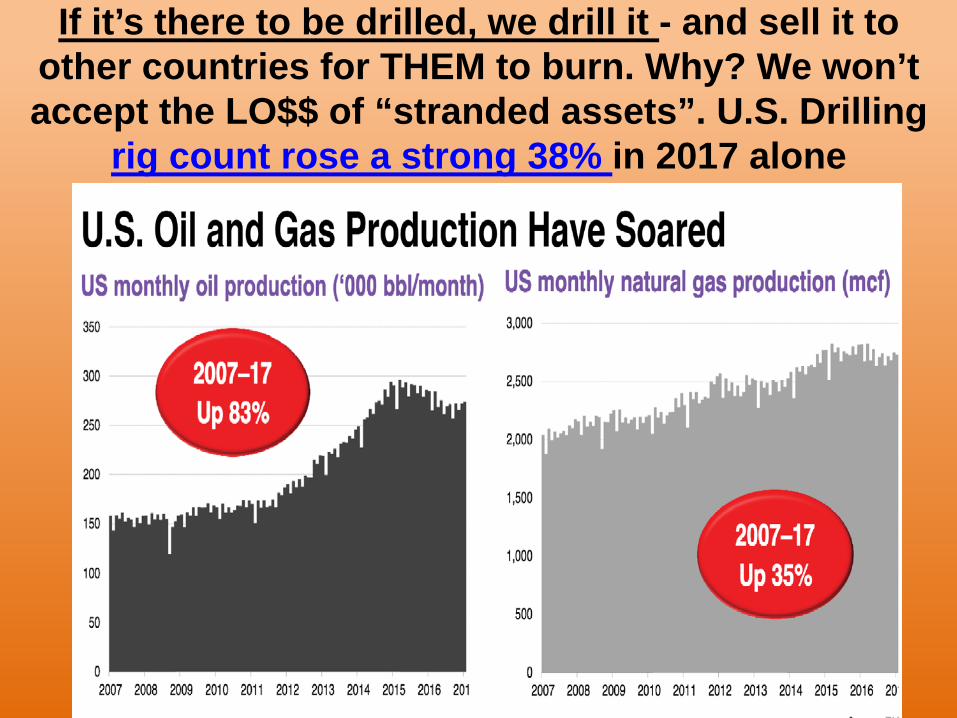
If it’s there to be drilled, we drill it - and sell it to other countries for THEM to burn. Why? We won’t accept the LO$$ of “stranded assets”. U.S. Drilling
rig count rose a strong 38% in 2017 alone

Now in Fairness to China • They are growing their fraction of new power
generation that is solar/wind. They deployed 34 GW of new solar in 2016, and expect in the 2016-2020 period to keep that pace, thus adding 110 GW of new solar. That’s admirable renewables growth.
• They’ve also promised, in 2017, to eliminate the production of new gas / diesel cars by the 2030-2040 time frame, as have many other countries (source). (But transportation is only 29% of energy consumption in the U.S., and only 25% of globally - EIA figures)
• And the cost of (subsidized) solar is down to roughly that of (subsidized) natural gas, and solar is growing rapidly in the U.S. as well.
• But that’s progress in the service of economic growth, and therefore is making our ultimate dilemma worse…

We have been continually improving energy efficiency
per dollar of GDP (red curve, middle plot). But the energy
use per person has continued to rise as more 3rd world people aspire to wealth
(green curve), and compound that with rising population,
and you see the total energy consumption rate continues
to rise in an accelerating way (top curve) (Wagner et al.
2016).

Like these confused
shoppers on a viral YouTube
video… It’s as if we’re walking 5 mph down the stairs
…of a CO2 escalator running upwards 10 mph!

For all the renewables hoopla, U.S. investment rate in renewables during the last 6 years of the Obama Administration was flat; changing the same as our investment in fossil
fuels. (Yet look at the spun-up title here)

For Climate, there is only ONE Curve that Matters
• Repeat: There is only one curve that matters – and that is the Keeling Curve: the concentration of atmospheric CO2. THAT is the curve that primarily determines global climate.
• From those rosy Western nations energy curves, and the warm glow from listening to biased policy cheerleaders, you probably expect to see at least a slight easing in the accelerating rate of our atmospheric CO2 rise, given that China and the U.S. emit most of the world’s CO2, right?
• But, no. (next slide) • It might also be relevant that China has been caught
significantly under-reporting their CO2 emissions (source).
• Nature, however, does not under-report. She does not lie. And her report is contained in the Keeling Curve

CO2 remains on an exponential rising curve. Now over 410 parts per million (ppm). Not just CO2 levels, but the acceleration rate of atmospheric CO2 sets new records each of the past few years. Partly due to the ‘15 El Nino, briefly, but only
in part (~20%). Governments can lie, but Mother Nature does not. We’ve been increasing energy efficiency for millennia, so please - Let’s STOP being
delusional about what increasing energy efficiency GETS US. It Results in HIGHER ENERGY CONSUMPTION RATES, not LOWER.

Atmospheric CO2, now seasonally adjusted, as of February 2016, set a new record in its ACCELERATION rate (New Scientist 2016), despite claims of China maybe, possibly beginning an era of declining CO2
emissions…except they’ve been caught under-reporting, and in 2016 were pausing after their “ghost cities” overbuilding. Indeed, China CO2
emissions growth increased again in 2017 by 3.5%

So Before Getting Too Encouraged by China…
• They have a growing middle class and rising wages and are themselves under increasing financial pressure to outsource CO2-intensive manufacturing to yet cheaper-wage countries. Especially to Vietnam, and to Thailand and Cambodia and more primitive countries with higher carbon intensities.
• Expect to continue to chase the carbon pollution sources down the developing countries list until there are no more lower-wage countries with standards of living to bring up to Western standards… which will be devastatingly too late to save climate. It’s highly unlikely the planet can afford that level of global energy consumption.
• These decisions are clearly dictated by pursuit of economic wealth in the “now”, not concern for the future environment

The IPCC Working Group III (on the science) found that the single biggest determiner of the growth in
GHG emissions – is income growth. Not surprisingly, the UN policy people who must sign off on what’s published, insured that this did NOT make
it into the IPCC “Summary for Policy Makers”

Again: Energy Consumption Rate is Proportional to Inflation-adjusted Gross World Product Integrated Over All Time • The rest are details of who off-shores what aspect of energy
consumption for whose increasing wealth. • Climate is global, and so is Civilization’s networks. • You’re not getting the true picture of our challenge if you limit
your focus to a single cherry-picked country’s GDP rate and CO2 emissions.
• CO2 emissions can only be reduced in a rapid (i.e. meaningful) way by elimination of GLOBAL economic growth (but then, how to finance the massive transformation of the world’s energy infrastructure?)
• This is… The Great Catch 22 • At least, you may say, we can hope that fossil fuel
consumption is slowing somewhat in this Renewables Era
• Is it? Is Oil consumption decreasing in this era of rising renewables?

Past 23 Years, oil supply and demand rising 1.52%/year on average, with just small dips during the ‘01 and ’08 “Great
Recession”. This is a rising RATE of demand curve, meaning CO2 emissions will be exponential, as indeed we saw

…Discouraging. But surely at least the U.S. is reducing its oil production, right? No. Oil production rose 50% in the 3 years up till summer ‘15, dipped, and then hit a new record in Dec
‘17, with rig counts rising once again

We continue to accelerate production rates every year for even the dirtiest of fossil fuels: Oil Sands. The red production rate fit is, of course, uncertain and depends on a speculative policy future. But
the carbon is there to be exploited.

China – Energy consumption per year rising rapidly through 2013. Nearly all is carbon
energy. But what about since 2013?

While Much Press has been made of China’s Recent Commitments to
Lower CO2 Emissions… • Glen Peters of ClimateChangeNews (2017) looks
deeper and advises strong skepticism based on under-reporting, boom/bust construction, and the unique way the numbers are reported.
• “A recent study estimated that a decline in construction activity explained about three-quarters of the decline in coal use. This is since construction requires energy-intensive inputs of products such as cement and steel.
• “Economic woes are behind the recent slowdown in Chinese coal consumption and emissions, but growth in renewables and concerns about air pollution contributed.”

China’s pledge of 60-65% reduction in CO2 emissions intensity by 2030 sounds Planet-Savingly Dramatic… until
you convolve with their growth. Do the math and see what it means: CO2 Emissions Rates Keep Rising (red circled)

Let’s Make Sure You Understand That Last Slide
• A promised 60% reduction in carbon intensity of energy by 2030 means each joule of total energy consumed contributes only 40% of the CO2 that it does in 2017.
• That corresponds to an exponential halving time t1/2 of only 14 years (!) Impressive – perhaps impossibly so.
• We’ll see how strikingly rapid that is, and certainly impossible without decommissioning perfectly working fossil fuel fired power plants; so be highly skeptical.
• It’s dramatically rapid compared to historical decarbonization rates, and yet – at China’s growth rate it still results in annual CO2 emission RATES rising in 2030 by a further ~22% above today’s.
The Conclusion is Inescapable: Economic
Growth is the Enemy of Climate. We CANNOT Transition to Renewables FAST ENOUGH to
Save Future Climate, and Civilization

And so – The climate forcing due to our GHG’s is not only rising, the growth rate of rising is itself rising! (from Hansen et al. 2017). Climate forcing rise rate by GHG’s has risen an astounding 50% in just 13 years, and accelerating. This is
dramatic exponential growth

What if the flat trend in the Carbon Intensity of Global Energy in the 21st Century remains true? This study (blue) shows it
results in a +6C world by 2100. That can’t happen – Such extreme climate would lead to
Civilization breakdown, collapsing energy use before 2100)

Now let’s look at the future implications, given the Garrett Relation
• Garrett has run forward in time the global atmospheric CO2 concentration given the Garrett Relation, and two sets of assumptions;
• Assumption Set #1: Assuming the 21st century growth rate of Global Wealth and global carbonization both continue to remain constant. Wealth growth at 2.2%/year, and also that decarbonization rate=0 (i.e. consistent with 21st century observations up to ~2014)
• This could be called the “Business as Usual” scenario… • I need to add – Garrett’s curves include NO added
CO2 from the indirect human-emissions sources – such as rising methane from tropical sources (a temperature-dependent effect), and the Permafrost Carbon Feedback which we are now triggering (see more here). Therefore, the reality will very likely be significantly worse that what we’ll show here

Garrett’s CThERM model runs vs. range of assumed resilience of civilization to Climate Change: On this graph, de-carbonization
continues its 21st century historical trend – i.e. no
decarbonizing. Even when civilization is
assumed most crippled by climate change (CC curve),
with strong decay corresponding (with his assumptions) to 137%/yr
inflationary pressure, with GWP growth falling below
zero (civilization in decline), still atmospheric CO2 rises 50% above current levels by 2100 and still rising. High
resilience means more growth, worse CO2.

New research by Motesharrei et al. 2016 adds insight
• In the summary linked above is this quote from the paper: “…all societal collapses over the past 5,000 years have involved both ’the stretching of resources due to the strain placed on the ecological carrying capacity’ and ‘the economic stratification of society into Elites [rich] and Masses (or ‘Commoners’) [poor].’ This ‘Elite’ population restricts the flow of resources accessible to the ‘masses’, accumulating a surplus for themselves that is high enough to strain natural resources. Eventually this situation will inevitably result in the destruction of society.”
• “Elite power, the report suggests, will buffer ‘detrimental effects of the environmental collapse until much later than for the Commoners,’ allowing the privileged to ‘continue business as usual despite the impending catastrophe.’ (it is disconcerting to read this, given Gilens and Page 2014)
• “’Science will surely save us’, the nay-sayers may yell. But technology, argues Motesharrei, has only damned us further…” (by way of Generalized Jevon’s Paradox, I will add)

From Garrett 2012 • “There are no plausible, thermodynamically
supported solutions that avoid inflation rates less than 100% per year, and lead to stabilized atmospheric CO2 concentrations within this century” (assuming decarbonization rates of ~0 in the 21st century, as has so far been the case, albeit not likely to continue this grim)
• Inflation, realize, can either happen through excess printing of money, or through the progressive destruction of the wealth which that money denominates (or a combination of both). 100%/year - this is “runaway inflation”, and the decline of civilization (but see next slide why I think this should be framed in terms of “decay” and not “inflation”).
• In other words: without decarbonization, civilization must contract (something it has never done), rapidly, just to slow the further rate of increase of atmospheric CO2

My Distinction to Add: The “Decay” Term Should be Kept Distinct from
Nominal “Inflation” • I contend it would be more reliable to express these
curves in terms of “decay” alone, whereby spending is diverted to repair the crippling effects of climate change rather than civilization growth.
• Why? Because inflation is strongly affected by the politically influenced actions of Central Banks – easy to effect - and so should properly be kept separate.
• To put it simply, “Inflationary pressure” (Garrett’s words), can be answered by the Fed, or not, or something in between. (I made this point to Tim Garrett, and he agrees nominal inflation in the future is subject to this wild card and so yes – perhaps best to re-frame strictly in terms of civilization decay, which is indeed already a separate term in the CThERM Model).

Collapse!? But can’t we just Decarbonize our Power Sources
Instead? • Decarbonization is a two-edged sword. Higher CO2 levels
mean a more climate-crippled civilization, which is, perversely, good in that it lowers civilization’s growth rate and hence CO2 emissions growth rate
• Alleviating this crippling by steady decarbonizing enables faster civilization growth rates and hence MORE CO2 emissions from the power sources not yet decarbonized.
• What is needed in order to stabilize, let alone reduce, atmospheric CO2 concentrations is a combination of BOTH Civilization negative growth and extremely steep rates of decarbonization.
• This point is appreciated by climatologist Prof. Kevin Anderson as well, which we will see later in this course.

So Now Let’s Examine Assumption Set #2: The
CO2 concentration trends on the next slide assume we replace carbon energy with non-carbon energy
at a rate such that the CO2 emission rate per unit of power drops exponentially with a rapid halving
time of only t1/2=50 years)
• Recall late 20th century decarbonization showed an exponential t1/2 much slower: 180 years
• With t1/2=50 years, let’s follow the trajectory of CO2 in our atmosphere vs. growth in total wealth in the next slide’s graph.
• It might be a bit confusing to look at, because time is not one of the axes. Instead, time evolves generally upward along each of the curves, time ticks are the green dotted lines

First, note that the meaning of “Resilience” of civilization to climate
change… • … means that on the zero decarbonization
slide, and also the following slide - the curves that have the strongest resilience, the BEST economic growth, and the LOWEST inflation (decay), are precisely the scenarios that have the WORST CO2 red curves.
• In other words - If we hope for lower and slower CO2 rise, we need to hope civilization is CRIPPLED by climate change so that it is FORCED against its will to grow more slowly or, better still for CO2, to reverse.

Same resilience curves as earlier slide, now including steep de-carbonization with halving time t1/2 = 50 years. All are significantly worse (red) than the IPCC eco-
friendly scenarios (blue). CO2 levels never drop for CThERM scenarios except the most crippled and not till year 2100. Economic growth is far less, and CO2 far
worse, than the simple IPCC scenarios. (IPCC SRES scenario assumptions will be examined in later slides here)

Garrett’s assumption that global
CO2 per unit of energy will drop with an exponential halving time of 50 years,
is quite steep by historical standards

If we’d committed to steep t1/2= 50yrs decarbonization back in 1965 (right side, heavy line), vs. what our human nature-determined growth paradigm has actually done (thin line)

Let’s Emphasize the Conclusion of the Last Slide…
• Even if we globally decarbonize at a historically unprecedented rate, such that the carbon intensity of energy drops in half every 50 years, even if climate change cripples civilization such that the growth rate in Global Wealth is cut in ~half by 2100, with inflation rates reaching 73% per year by 2100… (today’s is about 2-3%)
• …STILL, atmospheric CO2 levels climb, and are as high as 485 ppm by year 2100. 485 ppm is high enough to trigger the tipping points for complete thaw of all permafrost, and likely Hansen’s (2016) grim scenarios, if they haven’t already. This would add substantial indirect human-caused carbon emissions to these graphs
• Also, Garrett’s assumptions producing this graph do not include the additional energy necessary to carry out this steep decarbonization, so if anything, it is an overly optimistic scenario. This is something which might be addressable in future calculations.
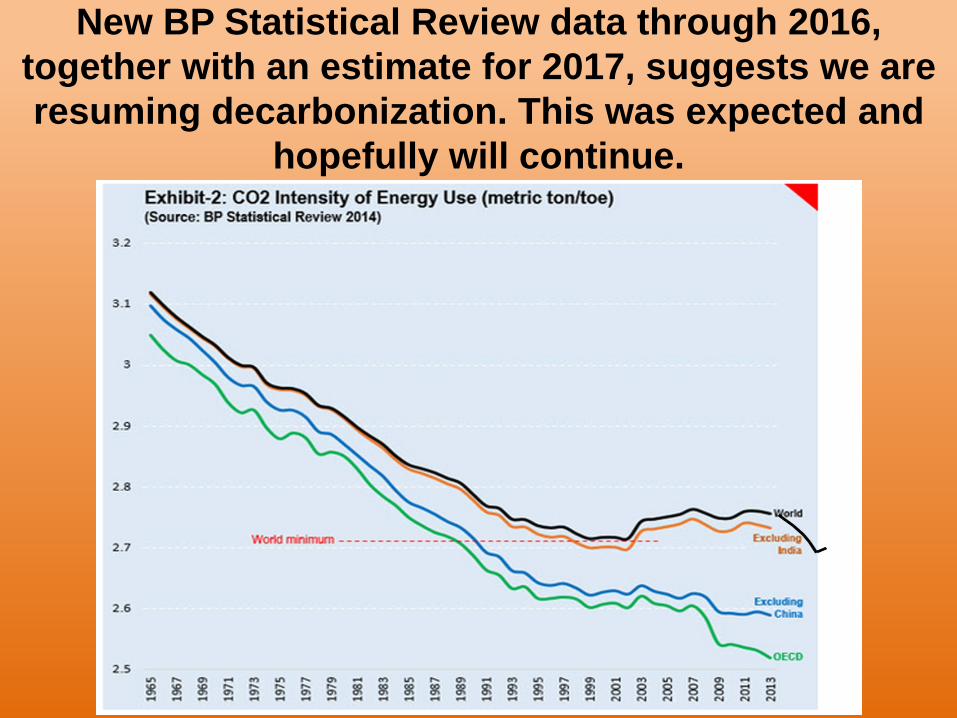
New BP Statistical Review data through 2016, together with an estimate for 2017, suggests we are resuming decarbonization. This was expected and
hopefully will continue.
Now Let’s Pause and Consider the Global Wealth Rise Rate in
the Most Crippled Case • You might be thinking “well OK, global wealth rising at only half
its current rate... Doesn’t really sound SO bad…” • But the global wealth rise rate since the Industrial Revolution
has never declined. The rate of rise of Global wealth has itself ALWAYS risen, and at worst, it has plateaued for a time (as it has in the mid 2010’s, at 2.2%/yr, and look at the tantrum that was causing on Wall St.), before new energy resources were discovered and growth rates could rise once again.
• Our 2.2%/year real rate of return (on civilization Wealth and on energy invested) is higher than it has ever been.
• With new energy resources like solar and wind … will we instead respond with even higher energy consumption growth rates into the future, as we have in the past?
If, on the other hand…
• …we somehow transform our human nature and reverse our growth…
• We’re going to have to prepare for a very different world.
• Experiencing growth rates significantly less, let alone a destruction of global wealth (a more likely scenario as climate change ramps up).

But What of all the Talk About IPCC Carbon Budgets and That
we Still Have Decades… • …before we’ve used up that budget for keeping us
below +2C temperatures? • Alas, scientists acknowledge the IPCC AR5 and
earlier CMIP5 models were missing many key climate dynamics and feedbacks, as well as the alarmingly steep rise in global temperatures since 2013’s IPCC AR5 release. (One feedback not included in IPCC models is paleo evidence of amplifying feedback from clouds. However, new work by Garrett and Krueger (pre-publication) suggest this feedback for tropical clouds might be zero. But more work needed on that)
Listen to the tone and the evasive response here to the direct question on
missing feedbacks and how carbon budgets should be changed
• Indeed, at very best, we’re expected to use up the carbon budget for +1.5C by 2020, and for +2C by 2032. The physics inertia of our massive civilization means that these temperatures are unavoidable. Since these links were written, global surface temperatures have dramatically risen, ending 17 years of slower growth (see K38a for why).
• See my 2017 talk “The New Post-IPCC Climate Science: A Darker Frame for our Options” for new physics making our plight significantly worse even than the above.

Worse still, there are at least two more reasons why Garrett’s atmospheric CO2
curves are likely too optimistic • 1. They don’t include explicitly the cost of transforming our
energy systems from high EROI energy-dense fossil fuels, to dilute and low EROI renewables – and it would require complex and uncertain assumptions to even try to include this in his explicitly global model.
• 2. His atmospheric CO2 model, for computational efficiency, is a simple parameterized source+sink model which, while it works well in hindcasts up till now, it neglects the effect of the inevitable higher temperatures to come on crippling of the ability of plants, oceans, and soil to uptake CO2 in non-linear ways, and the now-triggering Permafrost Carbon Feedback which adds significant non-human carbon to the atmosphere, and to the likelihood of new higher climate state-dependent ECS measurements (see here) cascading these warming effects further.

While Increasing the Construction of Renewable Power Sources Will be
Expensive at First… • Their ongoing upkeep will be smaller than that for conventional power. • If this results in increasing energy efficiency, and with the large amount of
solar energy falling on the planet, it may be that we will see another surge in the Global Return on Wealth (for a while), a surge such as we saw in the late 19th century from the discovery of oil, and again in the 1950’s with the discovery of the vast and easily drilled oil fields of Saudi Arabia and the Middle East (next slide)
• If so, this will require an increase in consumption rates of all energy, including the remaining carbon energy. (Jevons’ Revenge).
• In this case, Garrett’s simulations will underestimate atmosphere CO2 levels yet again – since they conservatively assumed Global Return on Wealth will no longer rise but instead stay constant at 2.2%/year from here on.

The Purple Curve Shows the Rate of Growth of Global Wealth = the “feedback efficiency” of Wealth’s ability to grow more Wealth. It has never declined, and is now at 2.2%/year. Inset
box shows the Garrett Relation (black curve flat)

How Were the IPCC SRES Emission Scenarios Arrived at?
• Conversations with IPCC scientists, relayed to me by energy expert Dr. Nate Hagens, report that what was done was to simply assume a set of global temperature growth numbers for year 2100, and a rather ad hoc guesstimate of a mix of energy sources evolving from present to 2100, and then CO2 from CO2 emitting energy sources summed to give the required assumed temperature rise, and not including all the missing climate physics discussed here.
• There is no appreciation of the actual couplings between civilization parameters as shown by Garrett’s work.

How are the IPCC SRES and CThERM Models Different?
• The IPCC’s SRES models split off the evolution of population, global average standard of living, and energy efficiency (i.e. energy expenditure’s useful return to civilization) as separate drivers which they can set independently of each other (see IPCC sec. 5 here).
• But as Garrett points out, the actual behavior of our past shows that population and standard of living growth rates are only constrained by our access to energy and our ability to raise energy efficiency and so are actually dependent variables, not independent variables which can be arbitrarily set.
• If they are to be set to what is desired, it will have to be by strongly enforced, even repressively enforced, policy action, not by merely hoping that people will somehow magically be different.

Knowing Only The Amount of Accessible Energy and the Efficiency of that Energy in
Growing Wealth…
• …Garrett shows historical population and standards of living growth can both be predicted knowing only the energy reserves and efficiency of energy consumption, given human nature…
• The CThERM model reproduces observed economic growth rates accurate to 0.1% over the 1990-2014 period (which is where data is available). The IPCC’s SRES model only reproduces this with a particular “worst case” carbon scenario (Raupach et al. 2007).
Indeed - Stevenson and Pielke(2015)…
• … show that the IPCC scenarios implicitly include much rosier assumptions of “spontaneous decarbonization” and growth than any historical analysis can support
• “Spontaneous” – meaning, occurring without any impetus from policy changes

From Stevenson & Pielke (2015) All RCP scenarios, even the most dire RCP 8.5, assume declining carbon energy intensity (CI) over time. Observations (red) show in fact carbonization lately is RISING, not falling. These
scenarios are the implicit baseline assumptions, without government enforced policy to motivate further improvements. The point is, IPCC RCP scenarios so far have been unrealistic.
Garrett’s presumed 50 yr halving time for CI (carbon intensity of energy) corresponds on this x-axis to -1.39%/yr; stronger even than any IPCC eco-friendly scenario.

As Dennis Meadows Frames it…
CO2 Emission Rate = P x S x E x C
• P = global population • E = units of energy required per capital unit
created (inverse of energy efficiency) • S = Energy use per person (“standard of
living”) • C = Carbonization of our energy, i.e. how much
CO2 is emitted per unit of energy generated

CO2 Emissions Rate = P x S x E x C
• Reduce P? Extremely unlikely we’ll reduce population. Even at optimum wealth and education, families still average 2 children = replacement level. Important as population limits are, people WANT to have children (and nothing psychopathological about that!). And they understand that their 2+ children are not going to be the kids that tip the planet into chaos, but yet will provide them with enhanced personal happiness.
• Reduce S? Even the Progressive Eco-Friendlies maintain that global economic equality is top priority, meaning efforts will continue to raise standards of living = S
• Reduce E? Energy per unit GDP has gone down, but as we showed, it has ALWAYS gone down, yet CO2 emissions continue to rise.
• That means that C=carbonization must take up the burden, overcoming the rise in P and S and then some beyond. Yet, so far this century, C has not gone down at all. It has declined slightly in the advanced countries, but is rising in 3rd World countries as they begin to afford fossil fuel powered modern life, as we saw.

We Want Wealth Stories…

…Not Spartan Stories… • Dr. Dennis Meadows points out that what gets the attention is
trying to increase energy efficiency (the E term), and trying to lower the carbonization by going to renewables (the C term)
• And we don’t want to think about the first two terms • But we haven’t, and can’t, make real progress on CO2
emissions without addressing growth per se; in population and in global economies. And Garrett has shown why.
• New work (Manoli et al. 2016) finds that the diffusion rate of green technology must spread through Civilization fully 10x faster than any technology ever in the past, to avoid crippling the attempts to meet stated temperature goals. And this work too, does not consider the indirect carbon emissions we’re now triggering in the permafrost, nor ECS dependence on climate state.

The Evolution of the Denial of “Limits to Growth” (From D. Meadows talk)

What is the Fundamental Driver? • Here are my thoughts, not necessarily
Garrett’s, although recently his reading of this PowerPoint Presentation finds him in agreement.
• For the vast majority of human genetic history, it was an advantage to evolve a biological drive to fight for our place in a vast wilderness of dangers and competitors for our needed resources – Grow, or Die.
• When we became more efficient, we became better at carving away that wilderness. This is reflected in the CThERM model, implicitly

Now in the 21st Century… • …unconquered Nature is mostly gone, and • We’ve taken 90% of all arable land for our own use,
stripped the oceans, commandeered ~37% of the entire primary productivity of the planet to ourselves… and sanity requires that growth must end.
• But….We still have the same genetic inheritance and urges – to grow, to expand, to exploit new energy and resources, to be competitive even with each other - for “choice mating opportunities” (see Nate Hagen’s talks) and to reassure shaky egos (see K40b).
• Those who most loudly voice this unquestioned mindset are those with the brains least-developed for error-checking and for dealing with complexity (the Conservatives) - see K40b Presentation for the studies confirming this.

But Wait, Isn’t there a Point Where Even Energy Gluttons are
Satiated? • The “larger” your life, the larger your energy
needs, it’s a thermodynamic law. • Still, it’s conceivable that the tendency to consume
more energy for oneself might not rise as fast as one’s individual wealth, beyond a certain high level.
• But hind-cast experiments run by Garrett so far show no evidence of this, even at the wealthy end.
• Indeed, most of the world is anything BUT “satiated”, living on wages of $3.50/day or less. They are adamantly determined to spend whatever energy they can lay hands on in order to increase their wealth to AT LEAST the level of those Americans.
• So if there is such a prosperity point, it would appear to be too high to help with our emergency now

Our Forebrain. Cause for Hope? • The only bit of hope I see, is that as part of our
evolutionary survival mechanisms, Nature also evolved in us a forebrain – capable of reason, of identifying principles, of applying them, and forecasting the future to enable better planning.
• It’s our forebrain vs. our “reptilian brain”. For most of our history, they both aimed for the same goals - Domination. Now… they are in conflict, and our survival and well-being requires that our forebrain assume agency. Will we use our forebrain to do so, in time? Scientists do, but they are ignored, and even threatened if their work conflicts with the ruling paradigm of eternal economic growth.

Natural Selection’s Imprint on our Genetic Nature…
• …is to impel us to grow, to compete, and to fight other species for a larger place in this world, and to compete with each other for status and “choice mating opportunities”.
• As long as the species hasn’t yet succeeded, the game can go on. If they fail, that is unfortunate – but for that one species.
• The real tragedy happens…WHEN YOU WIN • Because then, your final domination means the end of vast
numbers of other species as well, and a crippling change to the future of Planet Earth.
• For Homo Sapiens, we are at that point now. • With “victory” in sight, it then requires a deep and
fundamental transformation in our motivational programming, else we kill the planet and ourselves, just as cancer kills its host. How will that transformation happen?

Can Human Nature Change? • Can such deep fundamental change in human
behavior globally happen? • It must be achieved by the large majority of
global population in order to change climate, such that we would voluntarily inflict on ourselves a substantial negative growth of civilization, affecting the decay/inflation term in CThERM and while still decarbonizing and allowing atmospheric CO2 to not rise beyond ~500 ppm?
• Garrett is quite skeptical and so am I, although I still hope that education may make some difference.

Inanimate Systems Have No Choice but to Obey the Laws of Thermodynamics PERFECTLY
• But humans have free will (…we hope. There’s some question among researchers).
• We can voluntarily create legal enforced barriers to acting on our impulses and desires for immediate gratification, for the sake of a better future.
• It’s going “uphill” in a thermodynamic system sense, against the grain, doing the hard thing… but it’s not physically impossible.

It Requires Voluntary “Decay”
• In the CThERM model, what that would mean is voluntarily inducing civilization “decay” in the form of hard work which did NOT lead to expanding civilization.
• Decay that arose not by the involuntary crippling of society by the ravages of climate change and low resiliency, but was chosen voluntarily as a path (see my K44-Policy Presentation), hopefully more gracefully than Nature will choose for us, if we choose not.

Genetic Inheritance is Destiny? • Remember from Chapter 0 – our brain is only
~2% of our body mass, but uses 20% of our energy (which must come from food grown by our agricultural industry)
• If you’ve ever tried to over-rule your biological desires (going on a diet, say), you know how hard it is. It demands energy.
• Will power requires the constant input of biological ENERGY.
• Will power will go only so far, because it takes real ongoing biological ENERGY to fight against desires. It’s like holding up a barbell. No matter how strong you are, eventually that Olympic barbell is coming down

If instead, somehow, we could personally evolve…
• …to ENJOY a new “less is more”, “small is beautiful” way of being, perhaps this consideration would not hold quite as much sway.
• But experience says that this will take such intensive individual human psychological maturing on a massively global scale, and so quickly, that it would seem impossibly unrealistic.

People CAN change, but for the vast majority, only after their dysfunctional habitual way of
life forces them to “hit bottom”
• Only truly deep pain felt by each of us individually might induce such a commitment for such deep personal growth, and by the time climate chaos delivers us there, then physics says it’ll be far too late to halt dire climate change.
• Rather than rise to the massive organizational and technological challenges required, we’ll likely be struggling with bare survival as societal complexity breaks down into simplicity (Strumsky, Lobo, and Tainter, 2010).

Nolthenius’ First Law: “People Learn the Hard Way”
• I know from experience and that of others, that it usually takes long-standing pain to motivate a person to change. And even then, it takes real work, real commitment, to overcome ingrained patterns of thought and achieve emotional maturity.
• How can we expect this of the entire global population?
A few do learn… • We hear their voices from the science community,
and at least some from the Green community. But they are a tiny minority – the far tail of the bell curve.
• Despite what economic growth is doing to this planet, most of the Earth is peopled by those desperate for MORE, not LESS. And not a single leader will dare talk of limiting population, or reversing growth in wealth, for fear of losing power.
• And worse, our global political/economic power systems are designed to reward short-term greed, not nurture long term planetary health (review K44 – Policy and especially the importance of Gilens and Page 2014).

To Show How Hard it Has Been To Change…
In 42 years, fossil fuels (coal, oil, natural gas) only dropped from 86.7% to 81.4% of TPES (Total Primary Energy Production), while
total consumption of all energy has more than doubled
Merely Halting the Further Rise of CO2 Emission RATES is a
Very Difficult Task • In 2016, the global primary energy
consumption rate was 17 trillion watts (TW), growing at about 1.5% per year (down from 2% for most of the 21st Century).
• That’s 255 GW of additional power needed per year, or 700 MW of additional power generation installation per day.
• To keep CO2 emission rates constant, this additional 700 MW per day must be carbon-free power…

Considering Solar Photovoltaics as the Carbon-Free Power Source…
• …700 MW per day is equivalent to 3.5 gigawatts of “boiler plate” rating capacity per day (given the standard 20% capacity factor between peak output and actual average continuous output). Multiply by 365 days per year to get…
• = 1,277 GW (rated) additional solar PV power to deploy every year
• = 4,100 square miles of solar PV active panel area, every year. Or, 11.23 square miles of solar panels every day.
• That’s equivalent to a square 64 miles on a side, of solid PV panel, every year. Realize that is what’s required not to reduce CO2 emissions, that’s just to keep the human CO2 emissions rate merely constant, and not rising further

That’s 11.23 square miles of PV or about 20 square miles including supporting structure and land… taken away from other species and other human uses… every single day. Below is Carrizo Plain National Monument, CA. It is now the site of the
$2.5 billion 10 mi2 550 MW Topaz Solar Farm (world’s 4th largest currently)

To put 700 Megawatts/Day of carbon-free power into a Nuclear
Power Plant Context • The Diablo Canyon Nuclear Power Plant - the entire
generating facility takes up only 12 acres - produces the equivalent of 2,055 MW of continuous power averaged over the year.
• Diablo Canyon is the equivalent of 33 square miles of modern solar PV panel area (or very roughly 50 square miles of utility-scale solar power plant facility area, by today’s standards).
• Are you beginning to see the challenge of trying to transition from exploiting the concentrated ACCUMULATED energy of 50 million years of banked solar energy in the form of energy-dense fossil hydro-carbons, and instead running the same existing Civilization only on the dilute currently arriving solar energy?

Let’s assume a 30% capacity factor for the mix of solar (20%), and wind (~40%), which dominates renewables. New
renewable power capacity was 161 GW in 2016. (but includes substantial biofuels
which are not even carbon neutral). Still, using 161 GW 161x0.3 = 48 GW actual power output. This is only 20% of the needed 255 GW needed to keep CO2
emissions constant

That’s based on 1.5% global wealth growth rates and therefore global energy consumption growth rates. Below, note that for the past 5 years, solar deployment in the U.S. has risen only linearly, not exponentially. Most of the gain is in utility-scale
projects)
Suppose we DO deploy another 11 square miles of solar PV panels equivalent every
single day… Would constant CO2 emission rates mean constant atmospheric CO2
levels? • No. This is a common misunderstanding
by the lay public. • Instead it would mean that atmospheric CO2 would continue
to rise, but now linearly (as an upward sloping line of the same rapid slope as we’re currently seeing), rather than exponentially (an upwardly accelerating curve)
• Except, that’s very likely too optimistic, since at today’s rising temperatures, we can’t halt growing methane emissions and carbon release from the permafrost melt, so hit is highly likely the CO2 rise rate would still be exponential (albeit with less acceleration than at present).
Prof. Kevin Anderson Points Out • Total global energy consumption in 2015 was 105,000,000
Gigawatt-hrs; Nuclear power provides 2.5% of that. • Merely to get nuclear to provide ¼ of our power means we
need to build 4,000 new nuclear power plants in the next 30 years. Instead, we have scheduled 70 (and dropping).
• His bottom line is, whether it’s wind, solar, CCS, or whatever the new technology trumpeted – “you cannot build them fast enough to prevent us from blowing through our carbon budget” designed to hold temperature rise to ~+3C
• Anderson’s lecture presentation reinforces the conclusions of Garrett, and highlights the incredible unreality within so many policy reports delivered to climate policy negotiators.
• And Anderson’s conclusions are without the additional constraints discovered by Garrett, nor the new science on permafrost melt and rising ECS.

This temperature trend is both frightening, and much harder to turn around than you’ve
been led to believe

Global Energy – Dominated by the discovery and burning of ~50 Million years of accumulated concentrated solar energy
(fossil carbon) … The tiny blip of yellow is non-hydro renewables, on top of steeply rising fossil fuels underneath.
Hydro and Nuclear (blue) have not grown for decades.

Energy discovery allowed us to multiply ourselves, our Civilization. Now; we’re stuck with supporting that bloated Civilization. That population is IN PLACE. That Wealth is IN PLACE. That infrastructure is IN PLACE, all needing constant feeding
of more energy just to maintain it. Short of apocalypse, that is a FACT of our LIVES. We’ve dug a very deep hole: our power needs. That manna from heaven –
fossil carbon – is killing our planet. It is IN PLACE as our energy source supporting the massive Civilization that it created, and we can’t get off of it fast
enough to avoid the planetary disaster it is creating. (1min History of Population)

Prof. Joseph Tainter, on Parallels with the Fall of the Roman Empire: Plundering ACCUMULATED Wealth
vs. ONGOING GENERATED Wealth • Rome grew by conquering neighbors and then plundering the
accumulated wealth of those neighbors. Rome could keep growing because its larger needs could be met by absorbing not merely the on-going generated wealth of conquered neighbors, but rather the much larger accumulated wealth of those neighbors it conquered.
• When Rome ran out of rich neighbors to exploit, it could not sustain itself with merely the currently generated new wealth of its existing slaves and the sun (via agriculture)… and so it collapsed.
• (especially 33 min into this talk) • We are in the same situation. We have multiplied our civilization by
orders of magnitude by plundering the accumulated energy of the Carboniferous Era; ~60 million years of accumulated solar energy.
• We are faced with having grown vastly by using an energy source which in fact is a poison to our future, and face the necessity of having to shift support of our current vast civilization to only the currently arriving, not accumulated, solar energy.
• This is going to be far more difficult than appreciated.

How Robust is the Garrett Relation?
• Even though oil prices have gone through huge spikes; in the ‘70’s Arab Oil Embargo, again during the Gulf War, and just before the “Great Recession” of ’09, with large drops in oil prices in between – still the constancy of (time-integrated inflation-adjusted GWP)/(Energy consumption rate) - the Garrett Relation - continues to hold.
• Even though the rate of growth on global growth rates have slowed markedly in the past 20 of the 50 year dataset – still, the Garrett Relation continues to hold.
• Even with the largest and most populous nation on Earth – China – enforcing 35 years of 1-child-per-family, still the Garrett relation has held.
• Even though the efficiency with which energy can generate a dollar of GDP has more than doubled since 1970, still the Garrett Relation has held.
• These are impressive confirmations. Yet we can ponder… • …What kind of shock would it take for this relation to be
broken?

Oil Prices have bounced Wildly Over the Past 50 years, but the
Garrett Relation Remains Constant

Would a Giant Asteroid Impact do the Job?
• In that case, global wealth would be cut to a small fraction of today all at once, and so would our energy consumption rate.
• Yet, time-integrated GWP would not change immediately since it includes all past GWP as well – and the past cannot be changed
• There would have to be quite a few years before that integral dropped low enough to again match lower energy consumption rates. So does this reveal a flaw in the model?

No. The CThERM model includes a key term – inflation.
• Remember that the Garrett Relation applies only for inflation-adjusted wealth. A massive destruction of wealth would leave the existing nominal dollars of integrated GWP paired with far less actual wealth to denominate– i.e. the monetary number assigned to each unit of remaining wealth not destroyed by the asteroid would be far higher: Inflation!
• Thus, it appears to be a very robust relation, which ultimately is based in Nature…
• Of course, it’s a different question as to what the asteroid impact would do to our energy needs. Destroying much of civilization would indeed lower our energy needs. Still consistent with CThERM after the negative hit on the Wealth term. Wouldn’t be my first choice option, though.
• Nature created both physics, and human nature. The integration of thermodynamics with actual human nature, as revealed by data encompassing most of the accumulation of all world Wealth, perhaps therefore makes these results less surprising.
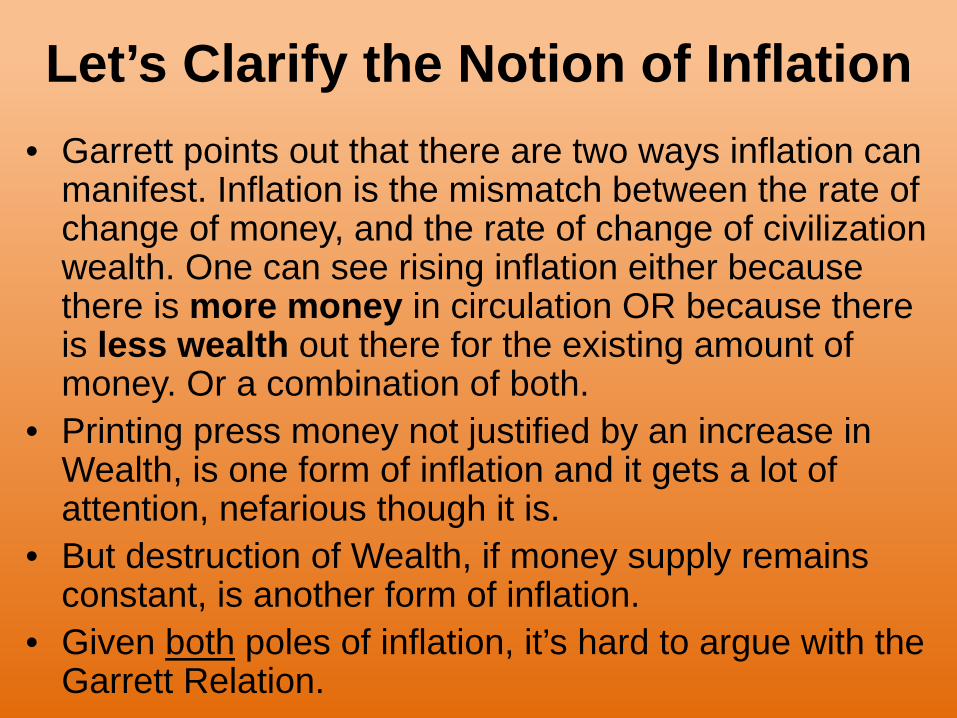
Let’s Clarify the Notion of Inflation • Garrett points out that there are two ways inflation can
manifest. Inflation is the mismatch between the rate of change of money, and the rate of change of civilization wealth. One can see rising inflation either because there is more money in circulation OR because there is less wealth out there for the existing amount of money. Or a combination of both.
• Printing press money not justified by an increase in Wealth, is one form of inflation and it gets a lot of attention, nefarious though it is.
• But destruction of Wealth, if money supply remains constant, is another form of inflation.
• Given both poles of inflation, it’s hard to argue with the Garrett Relation.

Said Another Way… • The CThERM model includes inflation, and in
cataclysms we see that governments and central banks in the past have tried to force savings to be invested for growth by penalizing savings via massive monetary inflation.
• Examples: Germany post WWI, Argentina in the 1970’s, some African social/political cataclysms… but a notable exception being after the start of the U.S. Great Depression, when the Fed tightened credit in 1931, ‘33, and ‘37 – alas, a decision the current Federal Reserve has vowed to never ever repeat

Currency Wars to Out-Inflate your Competitor Countries
• The fact that economic growth rates of “only” 2%/year are not accelerating upward as Wall Street demands, are motivating central banks to fire up all-out currency wars in Japan, the U.S., Europe, Russia, China… to devalue their currency through massive creation of money, and
• “Nuclear Option” talk of negative interest rates as the ultimate weapon to pry-bar savings out of people’s pockets and into Wall Street risk assets markets, where the Economic Elites’ computer algorithms of ever increasing complexity are ready to further extract the wealth of the citizen owners.
• In Dec ‘17, an ominous move on the Federal Reserve from President Trump in this direction, appointing a Fed governor who wants to abolish cash, making it much easier to control your money, forcing it into risk assets through negative interest rates.

Monetary inflation leads to price inflation. So far in this post - “Great Recession” world, mostly confined to asset price inflation: houses, stocks…, since the
average consumer is tapped out and can’t afford higher prices.

Monetary inflation worldwide was unleashed when governments ceased backing their currencies with gold (which cannot be inflated) and began
rampant money printing. This forces depreciating money into risk assets – equities - which are the first repository of new money, and
which are primarily owned by most wealthy; “The 1%”

Economic growth is 2% per year, but money supply inflation is 5-8% in the U.S this decade, 13% in the Eurozone, and even higher in Asia. • Generalized inflation has the effect of lowering the
efficiency (albeit raising the velocity of money) of the economy and thus lowering the rate of return on energy investment. It is impressive that the world has yet been able to maintain a 2.2% return on energy investment, despite this drag.
• Global Central Banks are openly desperate to cause monetary inflation. The reason is that rising prices will spur consumers to buy now rather than save their increasingly devalued dollars for the future, and a higher velocity of money spurs GDP, making the economy look good.
• It speaks to our unshakable addiction to at least the illusion of growth …

U.S. Money Supply. The U.S. Federal
Reserve is absolutely determined to raise
economic growth rates, even if it requires
massive money creation and enforced low
interest rates, (even negative rates, in a
number of countries). They are penalizing
saving, and FORCING us to take money out of savings accounts and
put them into risky “growth” assets. “Growth”, even
artificially induced, requires energy
consumption

So we go even deeper into debt, which is borrowing from future generations (who aren’t here to protest).
In the U.S., Private Debt is exponentially crossing 370% of GDP in 2017, and 69% of families have less
than $1,000 in savings (source)

Same is true in China. Debt rocketing even faster than their GDP. In 20 years their total public+private debt has gone up 3x faster than GDP, and is now 3x
higher than their GDP. This trend will end badly.

“QE”: A euphemism for central banks issuing bond debt, and then buying it up themselves, to raise demand. Gone up by
900% in just 16 years. Graph below is for the 6 biggest global Central Banks: U.S., Europe, England, Japan, China…

But Rick - We LOVE QE! (Quantitative Easing). It’s Boosted our Stock
Markets! • Sure, just like a new credit card to an
irresponsible teenager “solves” their financial problems... or so it appears to the short-sighted.
• Imagine McDonald’s sending out employees to their stores to buy up most of their Big Mac’s (because too many customers instead start to eat healthy, elsewhere?) so they can report to Wall Street some great sales figures on their next quarterly Earnings Report, and watch investors respond by bidding up their stock price.
• That’s what the Fed has done. THAT’s what we’ve come to, in this crazy world.

In fact, our private credit card debt is accelerating; up 21% in the past 4 years
alone

The CThERM Model’s Key Parameters
• Future projections require assuming … • 1. How fast can we decarbonize our energy? • 2. How fast can we create energy
consumption efficiencies? • Decarbonization is explicitly included by a
free parameter; the decarbonization rate c • Garrett parameterizes it as a simple
exponential decline. Other assumptions are possible.

Removing CO2 from Carbon Burning is Costly in both $ and Energy
• The cost and energy input is comparable or greater than the energy gotten from the fossil fuels themselves by 40-60%, (making the whole enterprise pointless http://sciencepolicy.colorado.edu/admin/publication_files/2015.32.pdf whether natural gas or coal (Samuela Bassi, energy analyst).
• Professor Vaclav Smil calculates that even to capture and store just 20% of today’s CO2 emissions “would need a capacity 70 percent larger than the petroleum flow handled by the global crude oil industry” (source). In other words, massive energy investment is required for this new infrastructure, producing more CO2 along the way.
• He, along with climatologist Dr. Kevin Anderson, and Tim Garrett, is among a handful of realists who are puncturing the complacency encouraged by the governments and corporations and policy people they employ, of the largest carbon polluting countries on Earth.

Well, that’s discouragingly expensive in CO2 emissions. But can’t we just Do It anyway, and still have a better future?
• Better than not doing it – yes. But CO2 is a tough molecule. It doesn’t go away. As Anderson emphasizes, studies show that ultimate equilibrium temperature depends only on the cumulative CO2 emissions. You can’t fix later what you emit today unless you pull CO2 back out artificially.
• If CO2 is emitted, it raises global temperatures. Permanently. (absent atmospheric CO2 scrubbers at ~$800/ton CO2)
• Doesn’t matter if it’s emitted today, or in 20 years. You can’t get away with emitting it now and then waiting for the ocean to absorb it later.
• It’s cumulative emissions that determine final temperatures. Recall that temperatures rise until carbon emissions cease, and then remain constant thereafter, for thousands of years.
• For climate, you can’t afford to emit it in the first place.

Suppose somehow, impossibly, we rapidly transform to a ~Zero Carbon
global energy system… • In such a new world, we have a landscape covered with solar PV
panels and giant wind turbines, enough even to perhaps power atmospheric CO2 capture devices and induce lowering global temperatures.
• But if the ruling urges are still “Growth”, we must consume ever larger amounts of raw materials as well. Some critical materials are already almost impossible to find in mine-able ore quality – the “Rare Earth”’s of the Periodic Table, which are so important in high tech, with the only mines in China and in short supply there as well.
• We must grow food even more efficiently (since the oceans are largely stripped of wild large fish, and nearly all arable land is already put to human use) to enable our further domination of the planet, to continue yet further, destroying our fellow creatures, bulldozing wild places, to perhaps only end up in a “Blade Runner” future.

“Blade Runner” World: I Don’t Find this Inspiring

Am I a genetic freak in feeling that Growth Uber Alles does not inspire?
• I hope not. The Earth is finite. We’ll have to deal with it. • Garrett observes that species and systems have a
natural arc; of growth, peak, and decay. But for our civilization, how does decay just happen to be starting today? Scientists have learned to be skeptical of arguments that seem to imply “fine tuning” of the time or parameters.
• It’s actually not surprising we find ourselves at this point, since a good fraction of the people who ever lived are alive today, thanks to exponential population growth enabled by the discovery of fossil fuel.
• You need not feel massively unlucky, or feel the “fine tuning” argument invalidates that today is special.

Today’s constant ‘mere’ 2% GDP growth, as Wall Street constantly
bemoans, is still exponential growth • It leads to a doubling of the consumption
rate of energy, food and raw materials every 36 years, even if you pave the rest of the Earth with solar panels.
• Earth IS finite. Growth WILL end. • Our ONLY choice is this: Do we learn that
lesson BEFORE we trash and doom the last square mile of unspoiled Earth, or AFTER?
• If AFTER, what end will WE meet?
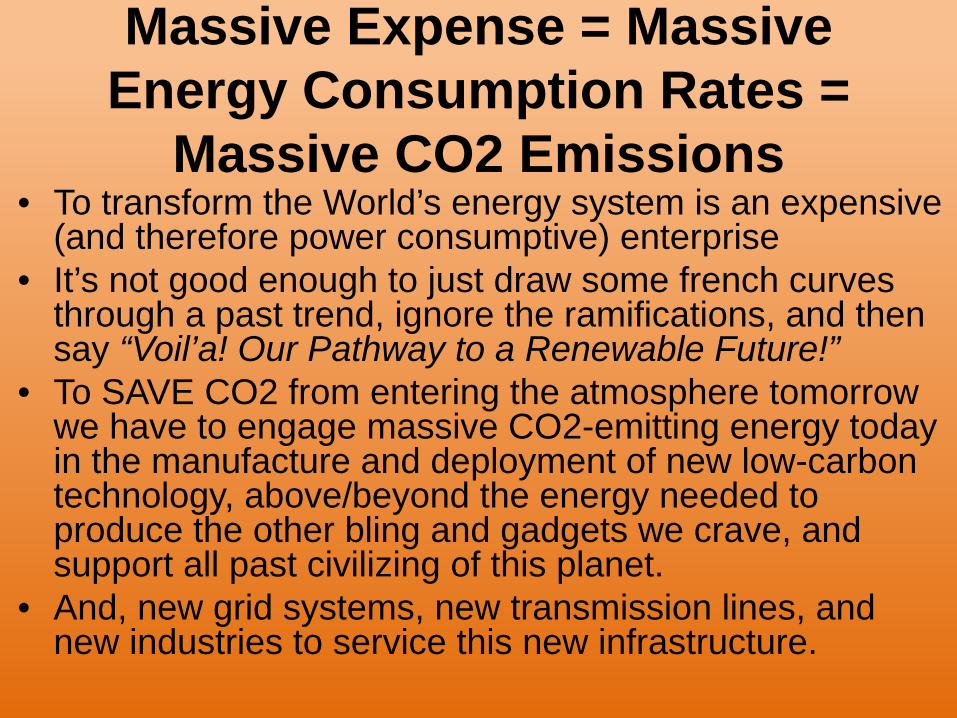
Massive Expense = Massive Energy Consumption Rates =
Massive CO2 Emissions • To transform the World’s energy system is an expensive
(and therefore power consumptive) enterprise • It’s not good enough to just draw some french curves
through a past trend, ignore the ramifications, and then say “Voil’a! Our Pathway to a Renewable Future!”
• To SAVE CO2 from entering the atmosphere tomorrow we have to engage massive CO2-emitting energy today in the manufacture and deployment of new low-carbon technology, above/beyond the energy needed to produce the other bling and gadgets we crave, and support all past civilizing of this planet.
• And, new grid systems, new transmission lines, and new industries to service this new infrastructure.

Garrett finds… • "There are no plausible, thermodynamically
supported solutions that avoid inflation rates less than 100%/yr, and lead to stabilized atmospheric CO2 concentrations within this century” (in the Abstract from this paper).
• “plausible” meaning decarbonization no steeper than 50% per 50 years. We have to do better than that.

From Dr. Vaclav Smil…. …”Turning around the world’s fossil fuel based energy system is a
truly gargantuan task” (source) • “That system now has an annual throughput of
more than 7 billion metric tons of hard coal and lignite, about 4 billion metric tons of crude oil, and more than 3 trillion cubic meters of natural gas. This adds up to 14 trillion watts of power (RN: 18 today in 2018) And its infrastructure—coal mines, oil and gas fields, refineries, pipelines, trains, trucks, tankers, filling stations, power plants, transformers, transmission and distribution lines, and hundreds of millions of gasoline, kerosene, diesel, and fuel oil engines—constitutes the costliest and most extensive set of installations, networks, and machines that the world has ever built, one that has taken generations and tens of trillions of dollars to put in place.”

Dr. Smil Continues… • “It is impossible to displace this super-system in a decade or
two—or five, for that matter. Replacing it with an equally extensive and reliable alternative based on renewable energy flows is a task that will require decades of expensive commitment. It is the work of generations of engineers.”
• Manoli et al. (2016) find the diffusion time for green carbon-free tech must be no more than 6 years, vs. the 60 years that is the historical value, to avoid +2C global temperature rise – and this, again, uses the obsolete IPCC carbon budget, does not consider indirect human-caused carbon emissions from the permafrost now melting, nor rising ECS with climate state.
• I very much want to believe that human ingenuity and commitment may allow at least a little more optimism than this. In 5 decades, ~all current fossil fuel power plants will be too old and need replacement even if they are still economical. I suspect we’ll do a little better than Smil’s quote, but perhaps not by much.

Even Some Scientists Are Part of this Problem
• Tyndall Climate Centre director Prof. Kevin Anderson points out that too many scientists have no appreciation of engineering and how hard and how long it will take to transform the world to technological solutions.
• As much as I admire high profile climatologist Michael Mann, I reluctantly may have to put him into this category, based on listening to a recent interview of Mann here, and contrast that with former engineer and climatologist Kevin Anderson here.
• I too have early years in my past working in aerospace and thermal engineering, and can applaud Professor Anderson for noting this key point which is so rarely acknowledged.
• I have also found that the most fervent promoters and unwavering devotees of the “scientists/engineers will save us” mantra are non-scientists/non-engineers. They have trouble distinguishing between solid work, and narrow-thinking promotionals or out-right hype.

Dr. Kevin Anderson in an interview following the Paris COP21 Conference (boldface mine)
• “In true Orwellian style, the political and economic dogma that has come to pervade all facets of society must not be questioned. For many years, green-growth oratory has quashed any voice with the audacity to suggest that the carbon budgets associated with 2 °C cannot be reconciled with the mantra of economic growth.”
• “I was in Paris, and there was a real sense of unease among many scientists present. The almost euphoric atmosphere that accompanied the circulation of the various drafts could not be squared with their content. Desperate to maintain order, a club of senior figures and influential handlers briefed against those who dared to say so—just look at some of the Twitter discussions!”
• “It is pantomime season and the world has just gambled its future on the appearance in a puff of smoke of a carbon-sucking fairy godmother. The Paris agreement is a road map to a better future? Oh no it’s not.”

By using consumption statistics for each country, and ecology studies on regeneration rates, the Global Footprint
Network has kept track of Civilization’s “Ecological Footprint”. Here in 2017, we’re using up Earth’s resources at
1.70x the rate of Earth’s regeneration capacity (vs 1.57x below in 2008), and this number is going up 2% per year (source)

Another Interview in Paris, with Stanford’s Mark Jacobson and Tyndall
Climate’s Kevin Anderson together • Delucchi and Jacobson’s policy publication showing how the world’s
different countries could split up renewable technologies between catagories in pursuit of 100% renewable, was a big hit among the negotiators, and eco-friendlies generally. Jacobson summarizes in this Youtube interview, with Anderson part of the interview as well.
• A telling moment: Notice Anderson pointing out that rising renewables need to REPLACE, not be an ADDITION to, carbon energy sources, and that in fact renewables now are simply globally being used on top of fossil fuels (i.e. the unstoppable prime directive continues - to engage any and all energy sources)…. Jacobson’s response was: silence.
• Since Jacobson is now the darling of the policy people, this was a very important opportunity to reinforce this truth pointed out by Kevin Anderson, and he did not take it.
• Silence, is how the World is reacting to these disturbing physics: the physics of the material world, and of human civilization.


Jevons’ Revenge: Prepare to pay the FULL costs, when you embark on a global transformation

Closely Related: Increasing Complexity in Civilization leads to Diminishing
Returns on Energy Invested
• This is the work of Prof. Joseph Tainter and colleagues.
• Link shows how the productivity of innovation is declining in all scientific and engineering fields they studied, over the past 50 years

Higher complexity and worsening Energy Return on Energy Invested (EROI) slows innovation in all fields, including in energy (Strumsky, Lobo and
Tainter 2010)

Over all fields, there are fewer and fewer patentable innovations per inflation-adjusted dollar of R&D, as
the complexity of Civilization increases

Prof. Joseph Tainter: The Collapse of Sustainability
• Human beings only have a finite ability to master the knowledge of the (constantly growing) past, master the technology needed for today, and then make even more complex inventions for the future.
• Past civilizations have been forced to either massively simplify, or collapse, when they reach this point of diminishing returns on complexity.
• This work of Tainter and colleagues supports the conclusion that we are reaching that point now.
• Not good, when we have such challenges in front of us.

This is Very Depressing. So Let’s Try Harder to
Knock Down the Garrett Relation - Can We Find
Weaknesses in the Derivation and Data
Confirmation?

Lines of Attack • In the spirit of healthy skepticism, I can
think of 4 general lines of attack to use in dissecting the validity of the Garrett Relation.
• #1. Measuring the Inflation correction • #2. GDP as a measure of spending • #3. Calibration of GDP measures between
nations to assemble a global measure • #4. Inflation vs. Decay in Civilization’s
Evolution

#1. The Treatment of Inflation • The constancy of the Garrett Relation requires past
GDP figures to be inflation-adjusted. GDP figures are corrected for inflation by the GDP Deflator, which is calculated by governments from the prices of a basket of goods and services which varies year by year.
• On the one hand, Garrett made post-dictions (“hind-casts”) using the CThERM model and got results which matched observations quite well, strongly suggesting that up till now, the official GDP deflator measure captures the large majority of Garrett’s deeper meaning of inflation.
• But on the other hand…

Is the GDP Deflator really an accurate and unbiased measure of
generalized inflation? • First – some explanation: The Consumer Price
Index (CPI) is a measure of the prices paid by consumers.
• The GDP Deflator (dGDP) is a wider measure of inflation which includes non-consumer items, meant to be more representative of the total economy.
• U.S. CPI has tended to be ~1% per year higher than the GDP Deflator lately, which seems reasonable as a reflection of adding in the increasing prices paid by the producers of goods and services and their rising profit margins (Sorry, Wall St. insists!)

The U.S. GDP Deflator follows the Consumer Price Index (CPI), with perhaps only a slight trend low of
less than 1% year-on-year relative to “headline CPI” and shows no trend over time this century

Yet There is a Financial Motivation for Governments to Underestimate Official
Inflation Figures • …Because ~70 trillion dollars of U.S. government liabilities
(e.g. social security, medicare… - that’s $200,000 per person!) are indexed to CPI-derived inflation.
• By underestimating CPI inflation, this makes a significant improvement on the government’s balance sheet, keeps international bond rating agencies from de-rating U.S. debt, and generally keeps the Debt Supercycle game going a while longer.
• And Europe and many other countries have followed the lead of the U.S. in doing similar accounting.
• These are the richest countries on Earth, so this will have a significant effect on inflation corrections to Gross World Product.

So…Is the CPI Biased Low? • Consider: if prices rise faster than incomes for the vast
majority of people (as has happened for decades; next 2 slides), then consumers are forced to continually migrate down scale in their purchases.
• …down, from filet mignon, to T-bone steak, to chuck steak, and then to ground round instead of any steak, then to chicken, and then canned chicken, and finally to beans. See the next 3 slides…
• Other flaws: Healthcare is 18% of the U.S. Economy but only 8% of the CPI. Health insurance increases are not included at all. Rent-equivalent housing cost estimate low-balls actual mortgages and rents paid. Education costs rising faster than assumed. Plenty of other such examples.
• Hence, the CPI should be consistently beneath the true inflation rate. A bit less so for the GDP deflator, perhaps, but the consumer is ~70% of the U.S. economy.

And yes – this is a significant effect: Income Growth never came back after the ‘01
Recession. In fact, since 1973…
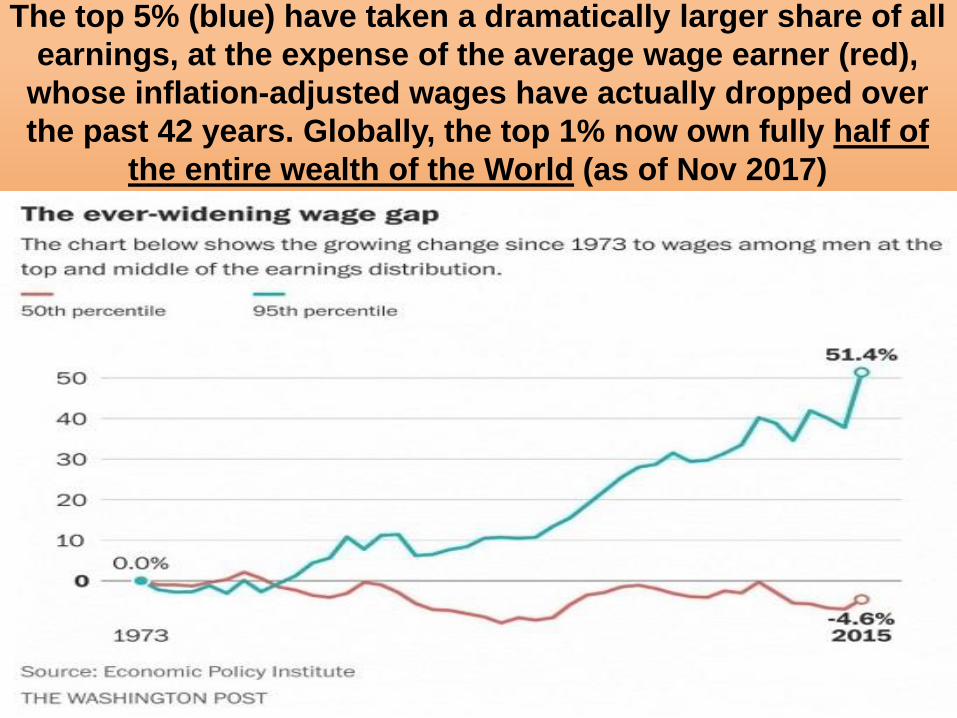
The top 5% (blue) have taken a dramatically larger share of all earnings, at the expense of the average wage earner (red),
whose inflation-adjusted wages have actually dropped over the past 42 years. Globally, the top 1% now own fully half of
the entire wealth of the World (as of Nov 2017)

Conservatives claim “trickle down” economics enriches all, whereby $help given to corporations trickles down to the
average workers. The truth is quite different…

Therefore: CPI is Biased low:
ShadowStats makes an attempt to remove the bias mentioned, and claims the
actual U.S. CPI rate is consistently as much as
3% to 4% per year above headline CPI. As a ratio of percents, roughly 2x higher
than the stated CPI. However, ShadowStats’ CPI has been strongly
criticized by economists as producing “absurdly” high inflation measures.

Another Estimate: Kitov (2012) argues that developed countries in general, under-
estimate the GDP Deflator. • Kitov uses trend analysis to determine that the GDP
Deflator for 14 industrialized countries needs to be multiplied by 1.37. This is milder than ShadowStats claimed 2x bias.
• What’s intriguing is that this factor is the same as that by which the Fed Funds Rate (R) (Federal Reserve interbank lending rate) exceeds the nominal CPI, the inference being that, averaged over time, the Fed Funds Rate R is an accurate measure of true CPI inflation.
• The logic: If inflation is the mismatch between the growth in money supply and the true growth of the economy, and if the goal of the Federal Reserve (if!) is to aim for a neutral monetary policy, then this is a credible argument that the Fed Funds Rate R is indeed a de facto better measure of CPI inflation.

Kitov (2012) Figure 5, showing U.S. official CPI from the Bureau of Economic Analysis (black, scaling of y axis not
explained), and when multiplied by the 1.4x factor determined independently from trend analysis going back to 1870 (dotted),
remarkably gives the Fed Funds Interest Rate R.

Kitov Concludes… • “In the long run, the scaled CPI and R evolve along the same
trend and intersect every fifteen to twenty years. One might assume that the main intention of the FRB (Federal Reserve Board) is to keep R above the rate of consumer price inflation, and the higher funds rate should suppress price inflation due to the effect of expensive money. In reality the FRB has been retaining the interest rate at the long term level of price inflation in order to create neutral conditions for money supply.”
• This has some logic to it. However CPI is only one component of dGDP, so the effect on dGDP may be slightly different than the 1.37x factor.
• Kitov dismisses the slope change of official GWP in ~1950 as bad analysis, failing to appreciate the importance of the discovery of the huge reservoir of cheap Saudi oil energy in lowering global inflation.
I Have 2 Arguments Against Kitov’s Thesis…
• Kitov’s analysis begins by assuming a constant GDP/capita rate must hold over time, and for more than a century. He doesn’t justify why this should be true, although it does seem to hold in the Maddison (2004) approximate data.
• That leaves it open to my major argument… • …It completely ignores a very good reason why GDP per
capita should indeed have taken a large jump upwards after 1950. The discovery and exploitation of vast cheap energy in the form of the shallow and easily-drilled Saudi oil fields, which continue to pump today.
• Energy is EVERYTHING
• Next, here’s my final entry for an argument modifying the official GDP deflator…

MIT’s BillionPrices Project uses a much wider range of global online prices to compile a more complete
CPI. They too find official annual CPI (CPIo) understated, but by a much smaller amount: Official
CPI since 2009 has averaged 1.567%, and BillionPrices CPI has averaged 1.826% per year)

Let’s Do a Quick Reasonable-ness Check
• Inflation is negative when genuine productivity outstrips money supply growth, positive if the reverse.
• U.S. Labor Productivity averaged 1.9%/yr since 1990, (only 1% post-recession), about the same as since 1970.
• M3 Money Supply, the most comprehensive measure, has, according to ShadowStats, averaged 4.6%/yr since 2003
• An additional and valid correction in inflation (i) figures is the adjustment for changing quality of the “same” goods - this is not identical to LABOR productivity, which has to do with manufacturing efficiency gains. Increasing quality counts as a negative inflation.
• So, taking the true GDP deflator in the U.S. as d(M3-Productivity)/dt gives i=2.7% this century, then minus an (unknown) correction for product quality improvements. Products HAVE improved, so clearly the resulting dGDP is much smaller than the Shadowstats 5%/yr .
• Since 2003, the official U.S. dGDP has been ~1.95%/yr, which, thus, does look not too far from the appropriate value.

Alternative Inflation Measures vs. Official CPI (CPIo) and GDP
Deflator (dGDP) • ShadowStats claims true CPI is ~2.0x CPIo • Kitov (2012) finds CPI is 1.37x higher than CPIo, and dGDP
perhaps a little less than 1.37x higher, but misses the importance of Saudi oil fields in reducing inflation post-1950
• The Billion Prices Project, using a much larger sample than official CPI, finds true CPI = 1.17x higher than CPIo
• Doing an admittedly over-simplified order-of-magnitude check by subtracing labor productivity from the rate of money supply growth gives a dGDP of 1.38x CPIo but this misses the product quality correction and so needs to be lower than 1.38. The point is – this makes a good case for dismissing ShadowStats version of CPI as too high.
• My Tentative Conclusion: The Billion Prices Project estimate is the best motivated and likely gives the most reasonable CPI correction of these.

How would the BillionPrices adjustment affect the Garrett
Relation’s ratio? • dGDP as been 2% since the mid 1990’s; multiplying by
1.17 gives 2.33%. It raises the Garrett Ratio (see slide 13) at the end point from 7.1 to 7.5, well within the narrow scatter band of the ratio (On slide 13, the Garrett Ratio bounced between 6.8 and 7.6 during the entire period)
• Given the uncertainties (Garrett himself makes the pithy comment that, unlike good scientists, economists don’t put error bars on their numbers), this might be the best we can do for now.
• Hence: The Garrett Relation’s constancy remains supported (even improved) by the existing inflation data at this time, within the uncertainties.

#2. GDP as Spending Measure in the Context of the Garrett
Relation? • Garrett has used GDP as the widest measure of
spending that is carefully compiled and available. But the thermodynamic framing argues that all spending, not just GDP spending, should be included.
• This is not fatal to the Garrett Relation as long as true total spending shows a constant proportionality to official global GDP figures over time.
• Does it? Let’s see…

GDP does not include barter, nor most black market activity… the “Shadow Economy” • Many studies have attempted to quantify the
“shadow economy” as a fraction of GDP, but have been marred by heterogenous data and analysis techniques.
• Elgin and Oztunali (2012) developed an improved analysis method to produce the largest uniform dataset available in this historical time frame.
• They find the “Shadow Economy”, as of 2010 was 22% of global GDP, down from 26% in 1950 (Elgin and Oztunali 2012), and they calculate it for each year. What does it show?

The Shadow Economy as % of global GDP dropped more steeply from 1960 to ~1975, shallowing afterwards (Elgin and Oztunali 2012). The “World” curve is falling gently with some bumps, while the OECD minus EU countries (bottom curve)
fall gently but consistently. And for EU countries…?

The “Shadow Economy” has also been a consistently declining fraction of GDP in the EU (Europe) (Schneider
2013), black curve below. Therefore the entire OECD world has shown a gently declining fraction for the “shadow economy”. What does this imply for their (the 35 OECD
countries) total spending vs. energy consumption?

So, Total Spending in OECD Countries is Not Rising As Fast As
Official GDP Figures • If official GDP’s are, as we now see, including a
rising % of the total economy, then total economic spending isn’t rising as fast as official GDP figures.
• This, in turn, says that energy efficiency ($ of GDP per joule of energy consumed) isn’t rising as fast as official figures either.
• Figures showing improving energy efficiency in the industrialized countries need to be lowered somewhat, it seems.
• But for the more important question here, on the implications for the Garrett Relation…

The global size of the shadow economy as a fraction of official
GDP is also declining slowly. How does this affect the Garrett Relation?
• Correcting GDP by including the Shadow Economy reduces the year-to-year scatter in the Garrett Relation (=Current Power/Total Wealth = constant)
• It actually makes the Garrett Relation trend flatter with less deviation from constancy; 16% wide band goes to less than 14%, and less still if we additionally correct for inflation bias assuming the BillionPrices Project at M.I.T.
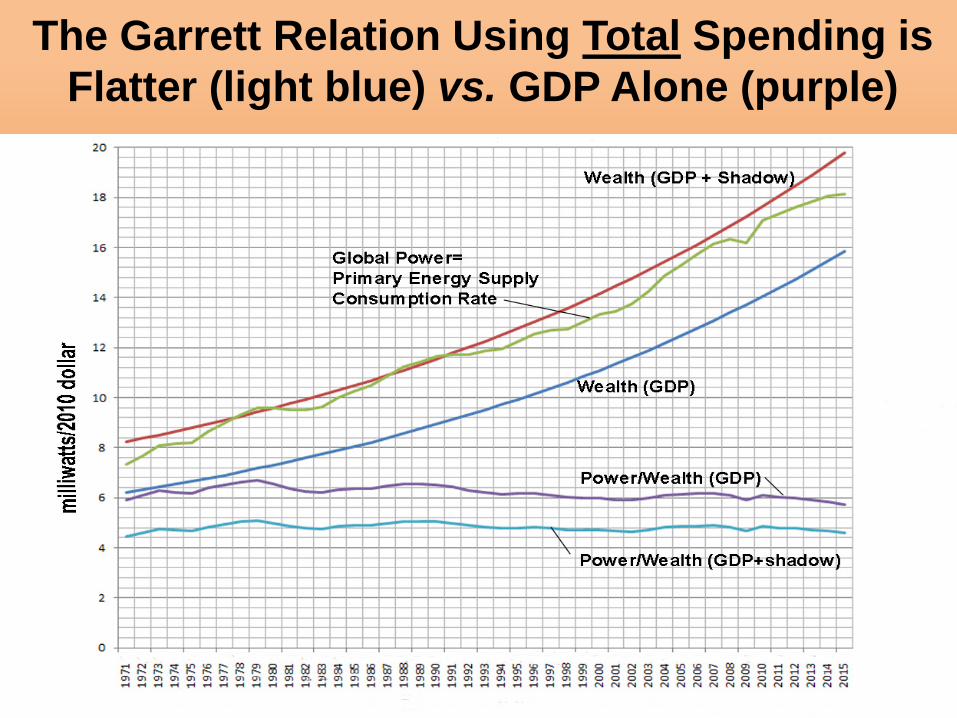
The Garrett Relation Using Total Spending is Flatter (light blue) vs. GDP Alone (purple)

#3. Converting Individual National GDP Data to a Single Global GDP: The Currency
Calibration Debate • One can convert between currencies using either of two
different methods: Basics explained here • PPP = “Purchase Price Parity”. This attempts to look at
consumer goods which are “identical” (near as can be judged) and measure how their prices differ between countries. It converts currencies so that a weighted average of a basket of such consumer prices is the same across countries. Quite difficult to calculate.
• MER = “Market Exchange Rates”. Currencies are traded freely on the world markets in large volume, and provide an instantaneously determined way of translating one currency to another. Real differences are (or should be) quickly arbitraged away by profit seekers expecting market inefficiencies will be temporary.

An Argument Against MER for Global GDP Growth Measurement
• Some countries artificially peg their exchange rate to major currencies; mainly the Euro or Dollar. If their currency would otherwise rise in value, it would hurt their export industries, which likely motivates the peg.
• However, these pegs are periodically changed, which argues that they are merely coarser (in time) determinations of fair calibration value, lessening this argument. Yet PPP determinations are usually even more sparse in time, so this whole argument has little weight.

36 countries peg their exchange rates to other currencies, mainly the Euro, but the
Dollar comes in second
• If their country’s economy is growing faster than the pegged country, the effect is a faster rise in global GDP using PPP, and the opposite if they are growing slower.
• The list is dominated by small African countries with negligible GDP, but also included is Hong Kong, and Mideast oil countries Bahrain, Saudi Arabia, Qatar, and the UAE.

From the IPCC AR4. GDPPPP is actually slightly lower than GDPMER for the rich
countries that dominate global
GDP. Small developing countries are the opposite. Net global GDP growth
rate is slightly higher by PPP measures

Arguments Against PPP for Measuring Global GDP Growth
• PPP only measures consumer price levels, not the total economy. It’s a better measure for standard of living, but not necessarily economic activity – which is what the Garrett Relation is about.
• PPP is poorly determined. Less than 200 countries have any PPP calibrations determined.
• PPP has many subjective elements, particularly in trying to judge equivalencies in products. A loaf of bread in South Sudan is a different thing than in Paris.
• PPP determinations can be politically motivated, as aid to countries from rich countries can be influenced by perceived standards of living rise rates, justifying aid given.

Purchasing Power Parity vs. Market Exchange Rate.
Arguments in favor of MER Accounting • Well-determined by large frequent trading • Measures much wider realm of economy than consumer
prices • Available for longer time series • Economists agree it's the better measure when international
trade is a strong component of what is desired to be measured. Certainly true for our ThermoCiv purpose.
• PPP only measured every few years, and for not all countries. Measures standard of living perhaps better than MER, but so what? We care instead about the energy consumption encumbered by the future from today's spending to enhance Civilization.

PPP might be appropriate…
• …if one were only concerned with consumer goods pricing, and not the total economy i.e. similar to concern only with the CPI portion of the GDP deflator.
• But, the thermodynamic arguments for the Garrett Relation require as wide a measure of the economy’s spending as possible.
• MER would accomplish this better, and is universally available and determined ~daily for all countries. Economists agree it is the better measure where international trade is an important consideration, which is certainly true in validating the Garrett Relation.

But the Most Powerful Argument Against PPP Accounting for Our
Purposes… • The core of the Garrett Relation is that the
accumulated spending in building civilization’s networks encumbers future energy consumption to support the growth enabled by that spending.
• And, given the exact same spending on a given good or service, growing civilization’s networks will be enhanced more strongly in a rich country than in a poor country, because the enhanced networks facilitating this growth are already in existence in the richer country.

Economists Have Been Debating Why PPP Accounting Gives a Larger Global GDP Growth Rate Over Time
than does MER Accounting • A popular, if over-simplistic, measure of PPP
accounting is the “Big Mac” index done by “The Economist” publication.
• Garrett (private conversation) made the prior point of the greater value to civilization growth (and hence to future energy consumption rates) supplied by a “Big Mac” eaten in a rich country vs. in a poor country, and I agree with this.

It’s not standard of living so much as the future ENERGY encumbrance
enabled and required by GDP spending. • Justifications for PPP as a proper measure for
“standard of living” argue that goods and services that are cheaper in real currency terms in a poorer country should reflect 1-to-1 with their measure of GDP. But in fact, there is an additional reduction in value that is not necessarily reflected in that accounting.
• For example. A “Big Mac” consumed in New York City by a high powered CEO will enable more Civilization network building and therefore require more future energy to support it than will the exact same Big Mac consumed in a poor country, beyond the mere currency conversion by PPP accounting.
PPP accounting mistakenly assumes equal goods provide equal value
• Putting this together, I will offer that this may indeed be why we should expect PPP accounting to consistently over-estimate GDP growth in poor countries in our energy-relevant context - because this accounting inaccurately assumes equal value-to-civilization for equal goods and services across rich and poor countries. It’s the other side of the Balassa-Samuelson Effect.
• Further I’ll suggest that market exchange rates determined by currency traders recognize this fact. There’s no one with more interest to do his homework properly than someone with $ at stake in a trade. I think the currency market traders who determine MER, get it right, on average.
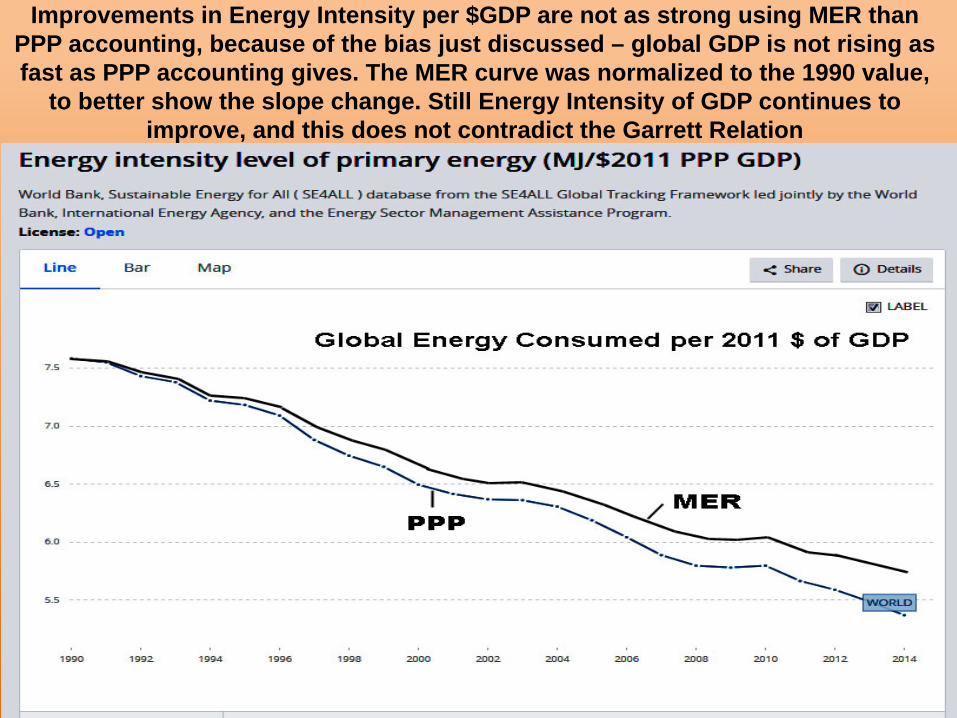
Improvements in Energy Intensity per $GDP are not as strong using MER than PPP accounting, because of the bias just discussed – global GDP is not rising as fast as PPP accounting gives. The MER curve was normalized to the 1990 value,
to better show the slope change. Still Energy Intensity of GDP continues to improve, and this does not contradict the Garrett Relation

So Would Using PPP instead of MER Calibration Make Any Difference in
Validating the Garrett Relation? • Not as much as you might think. There are PPP
determinations for many countries and from these, a fit between MER and PPP global GDP measures can be made
• To convert global MER GDP measures to PPP, multiply by… • 1 + 0.258 exp((YR-1998)/73) (Garrett 2014) • It would skew the slope of the Garrett Ratio by only -3% from
1990 to 2014, the last of our data points. Still, within uncertainties, supporting constancy of the ratio.
• If we take no sides and just split the difference, this gives a 1.5% drop for the final point in the Garrett Ratio, from 4.7 to 4.6 mW/$. Compare to the value of 4.4 where the data series ratio starts in 1971 (see Garrett Relation graph 5 slides earlier):
• Constancy remains supported

Theoretical Beauty vs. Real World Mayhem
• I confess to having two very different emotional reactions to pondering the work of Garrett.
• My astrophysicist side finds the theoretical results beautiful and elegant. And so I completely understand Garrett’s reaction to the discovery of this principle - my physicist side roots for the Garrett Relation to be true, much like when I worked in Dark Matter research in the 1990’s, finding SUSY a deep symmetry so beautifully tempting to believe it must be obeyed by Mother Nature, and providing Dark Matter candidate sub-atomic particles as a practical benefit to boot (alas, still elusively unconfirmed).

But my humanist side finds the Garrett Relation frightening
• Our predicament is then much harder to escape from than if we could just “efficiency” our way to a happy ending, as so many fervently and stubbornly hope. And that side of me hopes there is yet a fatal flaw somewhere, for the sake of my grand nieces and nephews.
• But… despite my efforts, the Garrett Relation only stands stronger

#4. I Do Have One Minor Bone to Pick with Garrett’s CThERM
Mathematical Model
• He makes an equation between inflation and “Decay”.
• Recall “Decay” is the inevitable energy spent not on expanding civilization but instead on repairing climate-induced crippling of Civilization’s networks. It is a subtraction from civilization growth rate.

Both concepts are essential, but real-world inflation is ultimately a
money supply phenomenon… • …and a perfectly efficient set of global Central Banks with a
proper (I believe) goal of zero inflation could simply alter the rules of the money supply to insure zero inflation no matter how crippled we become.
• That would be relatively easy, compared to the large energy and effort of wealth creation/destruction on the other side of the equations.
• The arbitrary by-the-pen actions of Central Banks in setting reserve requirements and offering T-bonds are not allowed for in Garrett’s equations linking the GDP deflator, inflation, with decay. Yet for correcting nominal GDP in current dollars, past Central Banks’ actions are essential. So far, though, inflation and decay have been low.
• The atmospheric CO2 curves in Garrett’s future scenarios, I believe, should be exclusively denoted with the assumed decay term, and not with inflation.

So Civilization Appears Stuck with the Garrett Relation’s Sobering Implications.
And yet, what if…..? • Garrett’s shown that energy exploitation has only
been limited by opportunity, not human will power. • I strongly expect this will stay true as long as we
have billions of people living well below the standard of living of Western Europe and the U.S. and even more so, given the drive for relative status-seeking by the human animal.
• But what if, at a certain high standard of living – say that reached by a well-to-do state like California – increasing Wealth increasingly led to less energy-intensive leisure time? There are only so many hours in a day and so many days in a life.

Can the world make it to such a place before it is terminally
crippled? • The evidence suggests no - the Western
lifestyle is enjoyed by only 20% or less of World population.
• There are too many poor but hard-working people seeking to RAISE their energy consumption. For quite some time, that will require carbon-releasing energy consumption.

Cryptocurrencies: A New Entry in the Complexity / Energy Conundrum • The cyber-war to protect financial transactions against
fraud and cyber-theft (and prying government tax eyes) has created BitCoin, which the world is now in love with, along with growing list of alternate cyber-currencies.
• But the process of creating block-chains is incredibly energy intensive for computers to accomplish. The numbers are staggering. As of mid November 2017…
• …it costs 273,000 kilowatt-hours of energy to enable one BitCoin transaction, when the BitCoin mining process is included (source). This is enough to power a typical American house for over 9 days! (sorry – that was Nov ‘17 figures)
• (now it is 12.2 days of power for that house, just 2 months later in mid Jan ’18!)

BitCoin vs. Credit Cards • Each BitCoin transaction consumes 5,000 times as
much energy as a Visa credit card transaction, as of January 2017, and rising.
• The computational difficulty of creating a new entry in the block chain is continually raised to compensate for higher processing power, in order to keep security high. While alternative algorithms and block creation ideas exist, they are not favored by those desiring hack-proof security, so that “the power-sucking BitCoin leech will remain ravenous for the forseeable future” (source).
• Globally, BitCoin currently consumes energy at a rate that is 12% that of the entire country of Australia(!) and rising very rapidly (as of Nov ‘17)

Even doing math with no apparent obvious PHYSICAL MOVING things
going on – consumes energy • Landauer’s Principle: Every bit flip (i.e. 0 to 1) requires a bare
minimum of kT ln(2) joules of energy at perfect efficiency. • “Any logically irreversible manipulation of information, such as the
erasure of a bit or the merging of two computation paths, must be accompanied by a corresponding entropy increase in non-information-bearing degrees of freedom of the information-processing apparatus or its environment".[1]
• Another way of phrasing Landauer's principle is that if an observer loses information about a physical system, the observer loses the ability to extract work from that system.
• We’re nowhere near that limit right now – computers use 3 orders of magnitude more energy per bit flip than this. But at current rates of increasing efficiency, we’ll reach this limit about the year 2050.

In just the past 1 month, BitCoin’s energy consumption index rose from 35 to 43.1 or by 23%.
It’s been rising with a doubling time of only 3 months. As of Jan ‘18, it was consuming 0.20% of global electricity. Other cryptocurrencies add in.

Apr ‘18 – Crypto-currencies have been Tumbling in Value… BitCoin DOWN
60% in ‘18 (! That’s a log scale)
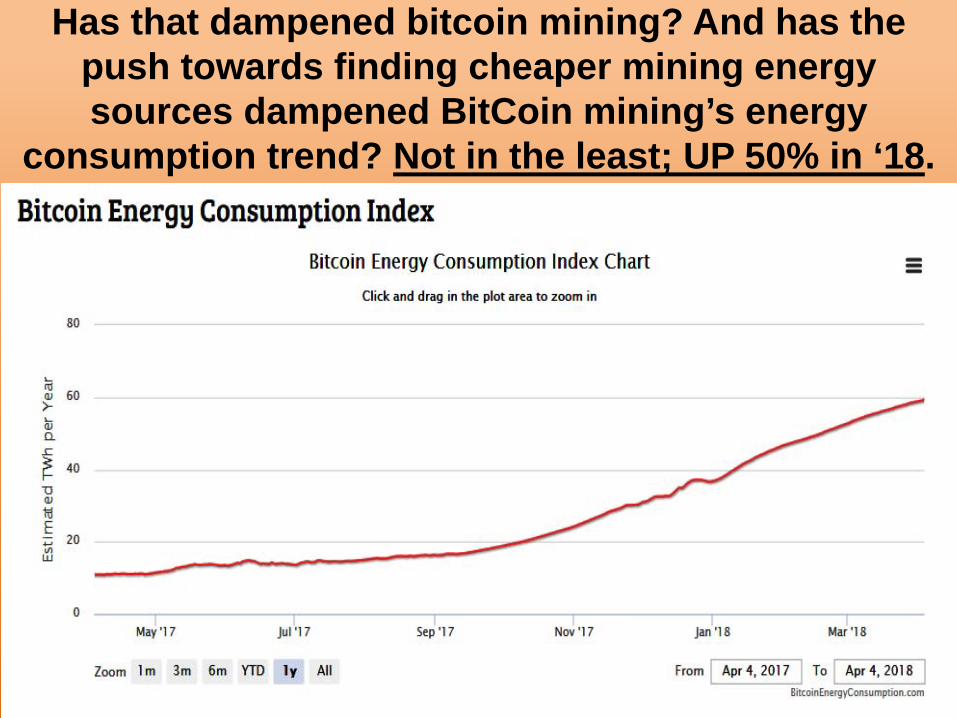
Has that dampened bitcoin mining? And has the push towards finding cheaper mining energy sources dampened BitCoin mining’s energy
consumption trend? Not in the least; UP 50% in ‘18.

It is on track to consume ALL global electric power output by the end of 2019
(source) (!) Clearly this won’t happen. Something will break first.

“Magical” Transformation Needed? • Striving solely for energy efficiency is NOT the answer (I
completely agree with Garrett on this part). Left with human nature as is, it will hurt, not help our future. Increasing energy efficiency, with unreconstructed human nature, is a dangerous combination as history shows it leads to even stronger growth in a world already far past sustainability.
• What is first required is a deep transformation of the global psyche, a radical, pervasive personal growth which is strong enough to overcome the envy of others’ riches, of material wealth as the measure of virtue, instead embracing the value of unspoiled Nature, and seeing other species as fellow travelers on this planet and not fodder for our advantage.
• The possibility of such a transformation of humanity before Nolthenius’ First Law takes full effect, appears very remote as I write this.
Nate Hagens argues such human transformation is not possible – we are
slaves to our inherited hormonally driven compulsion for relative status, and for out-competing the neighbors • And yet, I don’t feel such overwhelming
compulsions, and I know of others (well, a few) who also (largely) don’t
• Are we genetic freaks? Or is the power to mature in this way still within us all?
• I highly recommend spending an hour to listen to this insightful and excellent 2016 talk by Hagens on our predicament

Transformation must include purposeful policy-enforced
reduction in human population • It is tightly correlated with energy consumption. • Up till now, population growth has been limited only by
our ability to exploit energy resources and improve energy efficiency in expanding Civilization.
• Unwanted pregnancies in much of the world have high infant mortality if energy (=wealth) cannot sustain them, so if increasing wealth includes reduced infant mortality, then evidence indicates that greater education and access to birth control globally will change adult population growth only in a relatively minor way. (Bradshaw and Brooks 2014)
• Children are a joy; if we can personally afford them (never mind the Planet), we have them, on average; it’s how Nature designed us).

To ReFrame the Bottom Line: • Increasing energy efficiency only accelerates our
energy use and environmental degradation, UNTIL we have transformed our very human nature FIRST (…if that’s possible; I believe Garrett considers it ~impossible.
• Unlike the Thermodynamics of inanimate systems, human systems do have choice, even if against-the-grain hard.
• This is not to say the CThERM mathematical model is wrong. In fact, the voluntary choice to throttle back from growth would enter the CThERM model through the inflation and resilience terms – engaging in energy consumptive activities which do NOT expand civilization (e.g. dismantling rather than constructing, having FEWER children than you can afford or desire…).

It is physically possible to live simply and frugally, and even
happily • Social pressure to conform to the “Rat
Race” only keeps us from appreciating where true happiness really comes from.
• Those wedded to high-energy life-styles can subtly or not-so-subtly exert social pressure on those living simply and frugally. Little enhanced happiness to be found from this.

Get your dopamine fix from engaging Nature, not the Rat Race of relative status-seeking. Try it. You’ll Like it!

But remember: if you save your earnings, investing or putting
them in the bank… • …they are STILL going to be borrowed by
others to do the energy-intensive things you swore off of.
• Beyond frugal, you must torch your spending! • I run and bike everywhere I can, but don’t torch
my savings (alas, I “donate” some to the voracious Wall Street ‘bots and algorithms. Those guys DO spend it!)
• I don’t run and bike for making a big show of my carbon footprint. I do it for my sanity, trying to generate moments of happiness in this insane culture.

Alas, most people are ruled by relative status, and income inequality is making Americans more and more unhappy,
despite rising per capita income. Historically, growing income inequality can end in societal collapse (Motesharrei
et al. 2014)

The biggest and fastest rising carbon polluters are firmly engaged in the “rat race”. India and China are still on the rapidly rising
portion of the Life Satisfaction vs. per capita GDP curve. The log scale at right shows that for life satisfaction to increase at the same rate, income must grow exponentially. Fatal to climate! the “fuel” of desire will continue to impel us to rising
power consumption.

Put Another Way. It’s a Conflict in Human Inclinations: With vs. Against
• The “solutions” one hears in the media are easy because we love them: • 1. Increasing energy efficiency? We LOVE doing this! It’s an intriguing
challenge to science and engineering, and gets us more wealth • 2. Recycling, biking instead of driving, etc? Most LOVE doing this! – we feel
empowered, we feel healthier and indeed are healthier. • 3. Creating techno-fixes like better-adapted crops and conserving or re-
cycling? We LOVE doing this! It’s an invigorating scientific challenge, and gets us more nutrition and more wealth and the game goes a little longer.
• 4. Creating transformed cities that draw people into them. Studies find that cities judged to be the most successful, are those that turn out to show not just exponential growth, but exponential of exponential (super-exponential) growth.
• But these INCREASE Energy’s efficiency in ENHANCING Civilization growth, and hence…
• They raise energy consumption rates.

Instead, the real solutions include actions AGAINST human desire, so very few want to talk about them…
A. Enforced strong population control, globally. B. Putting civilization’s growth sanely and gracefully (if that is possible) into reverse C. Ending carbon emissions even before we can fully replace with renewables, and thereby requiring unprecedented belt-tightening D. Changing how political leaders are empowered, so such policies have some hope of being enacted, against our individual desires, but for our civilization’s long term health


The Actions which Reverse Growth are HARD, precisely because we HATE to do them
• These run AGAINST the innate programming of humans. I see stiff resistance to even admitting the possibility of truth to these, so myopically are people focused on the local and the short-term, and which ignore global and longer term reality.
• That includes many if not most, who are politically “Green”.

Are we genetically programmed for the Rat Race?
• If so, only crippling confrontation with resulting pain might make the average person reconsider it all – Nolthenius’ First Law: “People Learn the Hard Way” – a principle I’ve taught my students for 31 years
• So far I see no evidence of any such transformation in human nature, even among too many Greens (except perhaps in small pockets of people who are already rich enough to afford such personal evolution. The low-hanging fruit, the far tail of the curve, for human transformation). The evolution of the rest may be very hard and slow.
• Speculating now into the wild blue yonder (with a bit of black humor)… what about CRISPR technology, applied to human genetic alteration on an advanced, industrial scale?

…Churning out millions of genetically re-programmed replacement humans without our
flawed urges?
Or would that turn out badly, on an Apocalyptic scale?

It’s Even Possible that our Free Will to Change our Fate is an Illusion • Some research suggests this (Morris
review 2009, Bear 2016). Garrett is of the opinion that human civilization is a deterministic system and our freedom to change is much less than we imagine.
• I am not convinced. While impulses and snap judgments certainly exist, it is possible to pause and reflect consciously and decide differently (or was I fated to believe this?!)

For Those Doggedly Attached to the Power of Individual Action
• Consider another thermodynamic analog of our situation.
• It is impossible even in principle to determine the path of individual molecules in a gas, no matter how much computer power one has. It is fundamentally indeterminate.
• Yet the laws of Thermodynamics (pressure, temperature, heat capacitance, entropy change…) are all well described with precision FOR THE SYSTEM AS A WHOLE

Only the System as a WHOLE has predictable behavior. Given the Laws of Human Nature,
Unrestrained by Repressive Government, we Follow Similarly

Nobel Prize Winning Psychologist Daniel Kahneman, on People and
Climate Change
“No amount of psychological awareness will overcome people’s
reluctance to lower their standard of living. So that’s my bottom line.
There’s not much hope. I’m thoroughly pessimistic. I’m sorry.”
(source)

My Agenda is NOT “We’re Doomed! - Accept your Demise”
• The message to those involved in trying to save the future, is not to give up, but to UP the ANTE
• The task is FAR beyond the happy-talk cheerleading I hear even from the climate activists who are the good guys in this tragic drama. They fail to appreciate the numbers! They hear a happy news bite and fail to appreciate just how far down the hole we already are, and the forces that have taken us there, by our own hand.

Their meme is -“You can HAVE your growth and a wonderful future too!”
• Realize the concerted interests of the stake-holders and those they control to have you believing we’re already on our way so just be patient and smile and don’t panic…
• …and, above all, don’t agitate for any radical painful political/economic changes to the Status Quo.

Too many HappyTalkers come from a salesmanship place that believes, like Colonel
Jessup in “A Few Good Men”… ”You Want the Truth”?!!

And Yet… If that’s truly the way it is, then we indeed ARE doomed.
• I want to believe you CAN handle the truth, and sufficiently educated, are willing to transform our political/economic/genetic inheritance in the radical ways necessary for stabilizing climate back to the state we evolved in.
• It will require much more sacrifice than you’ve been led to believe. Don’t be seduced into what is, in fact, complacency that smart people in a lab are going to let you have it all.
• Sacrifice - enough that sober minds don’t believe it is realistically possible. I hope that is wrong.

According to Tyndall Climate Centre’s Kevin Anderson…
• Policy intermediaries – acting between the scientists and the politicians – are judged to be “successful” when they paint happy pictures for the politicians who ultimately employ them, so the politicians (meaning, the corporations who bought/installed them) can quote them in their speeches advocating for economic GROWTH.
• As always in our sad world – “Follow the Money”. Such motivations are vital to understand! Or better – Follow the Reward System
• Scientists, on the other hand, joined their field to satisfy curiosity. They love to figure out the true nature of things. They also, of course, like prestige and to be well-paid… BUT, the key is that the scientific culture and jobs system rewards them with such tangibles ONLY when they show they are good at actually figuring out and communicating scientific truth! The “coin of the realm” is scientific truth!

Clipped from a recent talk by James Hansen…

After realizing all this… • … I am no longer scratching my head over
Professor Kevin Anderson’s conversations with, and depressing accounts of, policy people’s avoidance of the facts on the key considerations outlined here.
• The incentive systems motivate too many policy professionals’ refusal to confront and communicate clearly these facts.
• See “Post-IPCC Climate Science” for more on this, and K40b: “The Psychopathologies of Climate Denial”

Strong Evidence shows that politely asking our “Parents” in Washington DC
for better policy has gone, and will continue to go, nowhere
• This, despite the spin and continuously ballyhoo’d “encouraging signs” which seduce one to believe that “we’re turning the corner”.
• The corner we’re turning, is towards a dire future, which physics insures if we continue with our current slow remedial path, and that includes continued faith in the political/economic structure as it now exists.
• This is the subject of the next Presentation: K44 - “Strategies: Policy”

Garrett has identified a key link between energy and civilization, and the “Garrett
Relation” puts sobering constraints on our future options
• But, only in the case of an “unforced” human system. “Unforced” meaning, without repressively enforced global government policy to curb Human Nature and take the hard path.
• Unlike the laws of physics, the laws of Human Nature can be bent in practice. It is physically possible for us to live simpler, lower energy lives. We just don’t want to.

After my experiences with people…
• I believe that we will not take this route. The sharpest and most accomplished thinkers in this area that I’ve found, agree.
• Governments are installed by the economically powerful. We’re even flag-wavingly proud of the fact that anyone who can fog a mirror and is born in the U.S. can be voted into national office by the most uninformed, selfish, racist, small-minded people among us. Their vote counts the same as the wisest, most benevolent, and the most far-thinking. And the non-living corporations’ desires count most of all. I see no hint that this will change, I see no backbone…
• I see no backbone for the necessary level of confrontation with government-as-it-is, to transform it to government-as-it-needs-to-be, to achieve a climate livable future.

So How Do I See the Future Unfolding?
• I see continued and reasonably successful efforts in improving energy efficiency, which will expand civilization and hence by necessity, energy consumption rates. This has been the history of civilization and it will continue for a while.
• I see continued rising standards of living in the 3rd World, and hence energy consumption rates, …until climate chaos really sets in, triggered likely first in the tropics, sending waves of desperate immigrants north.
• I see a resumption in global decarbonization, perhaps even to the rate of 50% reduction per 50 years, as Garrett thinks is almost impossibly too rapid. I don’t agree. My impression from recent advances is that it’s do-able, and even perhaps likely, if we somehow avoid societal collapse.

Hold on… on that last point • After the 2016 election, how will global decarbonization
trends change? More poorly in the U.S. While China continues to deploy more solar PV and that should continue, the more painful efforts actually required in the US and the West are now much more in doubt, near term.
• At the least, that rate of decarbonization will be less than it might have been.
• Worse, the scientific advances needed are now in severe danger, as the mindset of the Dark Ages and religious dogmatism has returned the U.S. with a devastating blow to the support of fundamental science now in the works, promising to end the scientific leadership of the U.S., worst of all in climate research.
• And trust in the U.S. regarding climate is now badly damaged. Trust, once broken, is very hard to win back.
• We’ve just dug another very deep hole for ourselves.

We will only do what is economical, what is cheaper, what is the short term
comfortable thing to do, for ourselves personally
We will not make, individually and voluntarily, the hard sacrifices GLOBALLY that the Thermodynamics of Civilization show are necessary to save the future and to respect other species. That’s our history. Human beings make
their decisions “on the margin”.
The “resiliency” term in the CThERM model will, I suspect, turn out to be fairly high; human ingenuity will find a way to further wrestle resources out of an
increasingly crippled planet and march the Growth of Civilization forward to a surprisingly large extent... for a while.
And therefore, atmospheric CO2 will pass 500 ppm, we will pass the tipping points dooming our coastal cities, dooming permafrost carbon,
dooming the livability of the tropics, quite possibly dooming us to an era of super-storms and mass extinctions as Greenland’s melt accelerates, and the AMOC shuts down. Indeed, we may have already passed them,
thanks to the lies from Big Oil and their shills in education, in media, and in Government, aided by our willing complicity in wanting the easy path.

People Do What they WANT to Do… unless compelled
• From my 9 years in climate science, this is as true among Liberals as among Conservatives (discussed in K40b).
• It is very rare for people to assess new evidence, identify their faulty positions, change their tribal alliances, their world view, and follow the actions their stated goals now require.
• People do what they WANT, and this follows perfectly with Jevons’ Paradox, with the Garrett Relation, and why I remain very pessimistic we will solve climate.

Humans apply a steep discount rate to the future: 3% per year
• That says that in 82 years, the World in 2100 means only 8% as much to us as Today does.
• And the stark choice we’ve been given: Us and our present comforts vs. all future generations – with rare exceptions we choose our own short term comforts. My apology if it doesn’t apply to you personally - it is only the global sum that counts for climate, where it is certainly true.
• This was at first a shocking, even traumatic surprise to me, as there’s plenty of evidence of people’s love for their own children, and children in general. But not, it seems, for their children’s world, which can only be safe-guarded by intelligent and benevolent government, which we refuse to install.
• This logic disconnect is amazing to behold.

So it’s a VERY tough reversal that is needed.

The key and fundamental fatal flaw in the political/economic system that
runs Civilization, is this… • Doing personal activities that benefit ourselves and our family in
significant and material ways are, of course, the humane thing to do. We are genetically designed to experience powerful human motivation to do these things. It’s not a psychopathology.
• If our personal activities hurt climate and our future, they do so in such an infinitesimal and completely negligible amount, that it provides no rational brake on doing those activities. And yet is it only our personal actions that we have the power to control.
• The marginal VALUE of increasing your wealth and family size and energy expenditures is high, while the marginal COST to climate of helping yourself and your family by economic growth and increasing energy spending, is ~zero.
• Again – Homo Economis = Modern Homo Sapien, makes his economic decisions “on the margin”, and therefore we will continue to destroy our future by individually doing our part.
• ONLY government action can change this…

We Refuse to Face Up to This Issue
• While the purpose and value of governments is to enforce decisions in such a way that the marginal cost of personal decisions is closer to the true societal cost in aggregate…
• …But, in fact governments have long ago become mere tools of those who are content to continue their personal gain and forget about societal cost altogether.
• It is astounding to look back on governments in world history, at how vanishingly few are staffed by genuinely benevolent, intelligent, and effective leaders.
• No less true today in America.

If I sound Pessimistic and Bitter • Then you, my reader, are paying attention. • How can a thinking, feeling person NOT experience these emotions as we
watch the last chances for a climate-stable future slip away for the most petty, pretentious and pathological of political “leadership”?
• We’re not heroically fighting for the future, we’re letting the worst in us come to the fore; New Age delusions, building walls and bunkers, getting ours before the next guy can take it, deluding ourselves on the nature of our situation to indulge our short term pleasures a little while longer…
• It’s not inspiring. Future generations deserve better. • I differ from Garrett. He believes that Civilization’s evolution is deterministic
and so simply observes humans on the brink of decline as the next inevitable phase begins, common to all systems with crippling feedback forcings.
• I think humans actually COULD engage their higher brain, respect science, compel their governments to enforce painful restraint and fight for a better future… but we do not. Growth Uber Alles continues.

Chap K43: Key Points - Thermodynamic Constraints on Civilization
• The Garrett Relation: Civilization’s energy consumption rate is proportional to the total inflation-adjusted Gross World Product accumulated over all time. Civilization requires energy consumption even at zero growth rate
• Civilization has continually and increased the efficiency of energy to produce GDP, throughout all of history, and most strongly since the 1700’s.
• Increasing energy efficiency has always lead to INCREASED global energy usage, not decreased, since it improves civilization’s ability to expand and exploit available untapped energy.
• Merely to keep CO2 emission rate constant requires the construction of the equivalent of a new 1.5 Gigawatt solar PV power plant per day (rated capacity).
• Generalized Jevon’s Paradox and CO2 – energy efficiency increases have not led to lower CO2 emissions, since the savings are spent elsewhere, requiring new energy and CO2 emissions.
• Garrett Relation even stronger after closer look at inflation, at total vs GDP spending, at PPP vs MER calibration between countries to arrive at global GDP.
• Garrett’s work shows that no future scenario leads to lower atmospheric CO2 concentrations on any time scale short of a century or more, except for a “collapse” of industrial civilization plus a decarbonization rate that is extremely rapid by any measure.