Embed Size (px)
Citation preview
CCI
BIOMASS
PRODUCT VALIDATION & INTERCOMPARISON REPORT YEAR 2
VERSION 2.0
DOCUMENT REF: CCI_BIOMASS_PVIR_V2.0
DELIVERABLE REF: D4.1_PVIR
VERSION: 2.0
CREATION DATE: 2020-12-17
LAST MODIFIED 2020-12-17
Ref CCI Biomass Product Validation & Intercomparison Report v2
Issue Page Date 2.0 2 17.12.2020
© Aberystwyth University and GAMMA Remote Sensing, 2018 This document is the property of the CCI-Biomass partnership, no part of it shall be reproduced or transmitted without the express prior written
authorization of Aberystwyth University and Gamma Remote Sensing AG.
Document Authorship
NAME FUNCTION ORGANISATION SIGNATURE DATE
PREPARED S. de Bruin WP7 Wageningen University
PREPARED A. Araza WP7 Wageningen University
PREPARED M. Herold WP7 Lead Wageningen University
PREPARED
PREPARED
PREPARED
PREPARED
PREPARED
PREPARED H. Kay A. Project Manager Aberystwyth University
PREPARED R. Lucas Project Manager Aberystwyth University
VERIFIED S. Quegan Science Leader Sheffield University
APPROVED
Document Distribution
ORGANISATION NAME QUANTITY ESA Frank Seifert
Document History
VERSION DATE DESCRIPTION APPROVED 0.1 2019-12-18 First draft version 1.0 2019-12-18
Document Change Record (from Year 1 to Year 2)
VERSION DATE DESCRIPTION APPROVED 2.0 2020-12-17 Finalised version 2.0
Ref CCI Biomass Product Validation & Intercomparison Report v2
Issue Page Date 2.0 3 17.12.2020
© Aberystwyth University and GAMMA Remote Sensing, 2018 This document is the property of the CCI-Biomass partnership, no part of it shall be reproduced or transmitted without the express prior written
authorization of Aberystwyth University and Gamma Remote Sensing AG.
TABLEOFCONTENTSList of tables .............................................................................................................................................. 4
List of figures ............................................................................................................................................. 6
Symbols and acronyms .............................................................................................................................. 8
1. Introduction ........................................................................................................................................ 9
2. Materials and methods ..................................................................................................................... 10
2.1. Forest plot data ....................................................................................................................................... 10
2.2. LiDAR-based and 1-km pixel Congo basin Forests AGB ............................................................................. 12
2.3. Preparation of validation datasets ........................................................................................................... 12 Temporal harmonization ........................................................................................................................................................... 12 Correction for forest fraction .................................................................................................................................................... 12 Comparisons at 0.1° cell resolution ........................................................................................................................................... 13 Ecoregions / biomes .................................................................................................................................................................. 13
2.4. Comparing AGB map pixels with reference data ...................................................................................... 13 Assumptions .............................................................................................................................................................................. 13 Measures ................................................................................................................................................................................... 13
2.5. Spatial correlation of AGB ........................................................................................................................ 14
2.6. Effect spatial support on sampling error and suggested map bias ............................................................ 14
3. Validation results for the global maps .............................................................................................. 15
3.1. Global assessments per tier of plot data .................................................................................................. 15 Tier 1 non-aggregated ............................................................................................................................................................... 15 Tier 2 non-aggregated ............................................................................................................................................................... 18 Tier 3 non-aggregated ............................................................................................................................................................... 22
3.2. Tier 1 plot data spatially aggregated to 0.1° cells ..................................................................................... 24
3.3. Comparisons with LiDAR-based and 1-km pixel Congo basin Forests AGB ................................................ 26
3.4. Summary tables on tier 1-3 comparisons ................................................................................................. 29
3.5. Assessments by ecoregion ....................................................................................................................... 30
3.6. Summary tables of the assessments by ecoregion .................................................................................... 34
3.7. AGB maps intercomparison ..................................................................................................................... 38 Stability of AGBmap – AGBref differences among the 2010, 2017 and 2018 AGB products ......................................................... 38 Comparison of current maps with previous 2010 and 2017 AGB products .............................................................................. 40
3.8. Within-pixel sampling error ..................................................................................................................... 41
Conclusions .............................................................................................................................................. 44
Acknowledgements ................................................................................................................................. 45
References (including references from Appendix A) ................................................................................. 46
Appendix A - Details on the used forest plot data .................................................................................... 48
Appendix B – Tables of assessments per biome ........................................................................................ 53
Ref CCI Biomass Product Validation & Intercomparison Report v2
Issue Page Date 2.0 4 17.12.2020
© Aberystwyth University and GAMMA Remote Sensing, 2018 This document is the property of the CCI-Biomass partnership, no part of it shall be reproduced or transmitted without the express prior written
authorization of Aberystwyth University and Gamma Remote Sensing AG.
LIST OF TABLES
Table 1. Number of plots used in each tier for the different AGB map reference years. ................................................................... 10 Table 2. Number of LiDAR and CoFor footprints used for the different AGB map reference years. .................................................. 12 Table 3. Validation results per biomass range for tier 1 data at original resolution for the 2010 map. ............................................ 17 Table 4. Validation results per biomass range for tier 1 data at original resolution for the 2017 map. ............................................ 17 Table 5. Validation results per biomass range for tier 1 data at original resolution for the 2018 map. ............................................ 18 Table 6. Validation results per biomass range for tier 2 data at original resolution for the 2010 map. ............................................ 18 Table 7. Validation results per biomass range for tier 2 data at original resolution for the 2017 map. ............................................ 20 Table 8. Validation results per biomass range for tier 2 data at original resolution for the 2018 map. ............................................ 20 Table 9. Validation results per biomass range for tier 3 data at the original resolution for the 2010 map. ...................................... 22 Table 10. Validation results per biomass range for tier 3 data at the original resolution for the 2017 map. .................................... 23 Table 11. Validation results per biomass range for tier 3 data at the original resolution for the 2018 map. .................................... 23 Table 12. Validation results per biomass range for tier 1 data spatially aggregated to 0.1° cells for the 2010 map. ....................... 24 Table 13. Validation results per biomass range for tier 1 data spatially aggregated to 0.1° cells for the 2017 map. ....................... 26 Table 14. Validation results per biomass range for tier 1 data spatially aggregated to 0.1° cells for the 2018 map. ....................... 26 Table 15. Validation results per biomass range using LiDAR-based and CoFor AGB data spatially aggregated to 0.1° cells for the
2010 map. ........................................................................................................................................................................................... 28 Table 16. Validation results per biomass range using LiDAR-based and CoFor AGB data spatially aggregated to 0.1° cells for the
2017 map. ........................................................................................................................................................................................... 28 Table 17. Validation results per biomass range using LiDAR-based and CoFor AGB data spatially aggregated to 0.1° cells for the
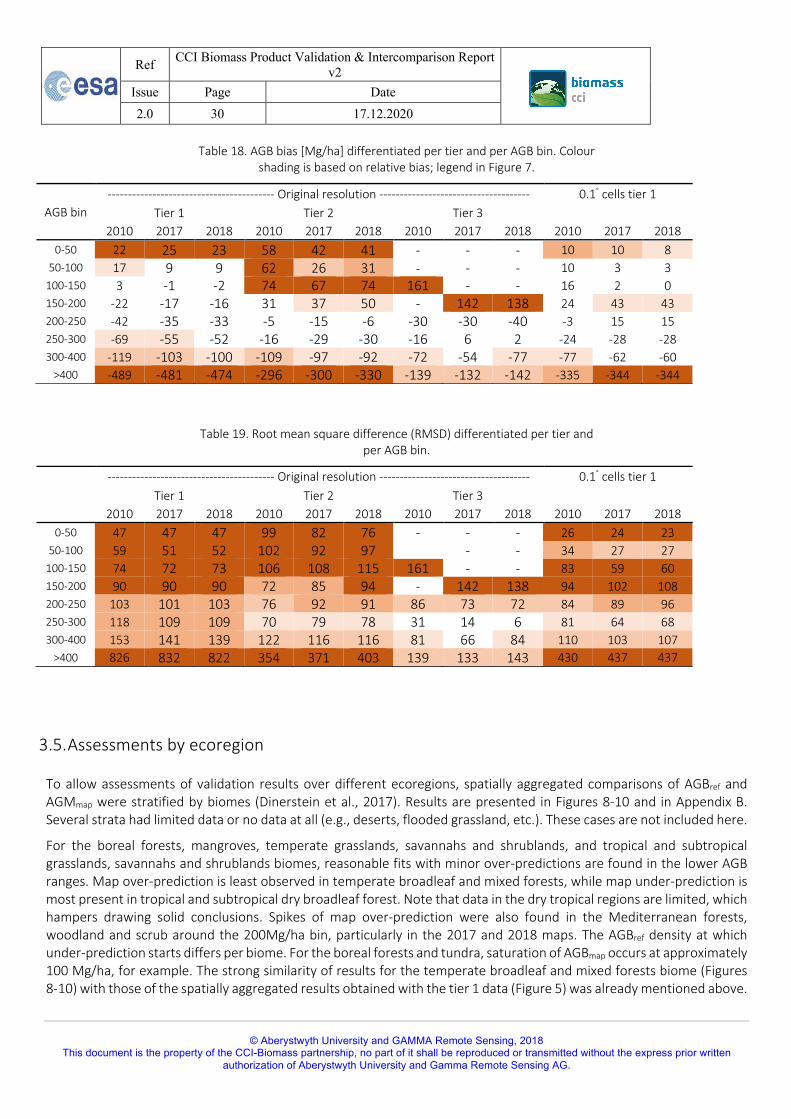
2018 map ............................................................................................................................................................................................ 29 Table 18. AGB bias [Mg/ha] differentiated per tier and per AGB bin. Colour shading is based on relative bias; legend in Figure 7. .. 30 Table 19. Root mean square difference (RMSD) differentiated per tier and per AGB bin. ................................................................. 30 Table 20. AGB bias [Mg/ha] differentiated per biome and per AGB bin for the 2010 map. Colour shading is based the legend
shown in Figure 7. .............................................................................................................................................................................. 35 Table 21. Root mean square difference (RMSD) differentiated per biome and per AGB bin for the 2010 map. Colour shading is
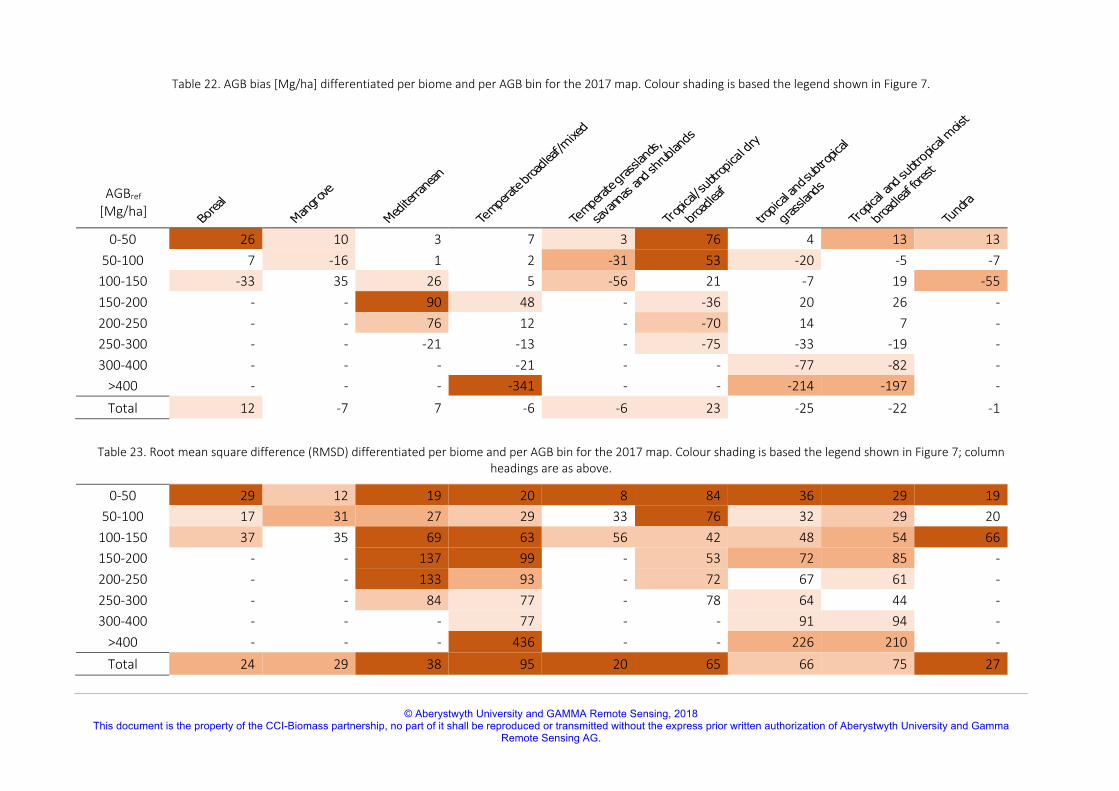
based the legend shown in Figure 7; column headings are as above. ............................................................................................... 35 Table 22. AGB bias [Mg/ha] differentiated per biome and per AGB bin for the 2017 map. Colour shading is based the legend
shown in Figure 7. .............................................................................................................................................................................. 36 Table 23. Root mean square difference (RMSD) differentiated per biome and per AGB bin for the 2017 map. Colour shading is
based the legend shown in Figure 7; column headings are as above. ............................................................................................... 36 Table 24. AGB bias [Mg/ha] differentiated per biome and per AGB bin for the 2018 map. Colour shading is based the legend
shown in Figure 7. .............................................................................................................................................................................. 37 Table 25. Root mean square difference (RMSD) differentiated per biome and per AGB bin for the 2018 map. Colour shading is
based the legend shown in Figure 7; column headings are as above. ............................................................................................... 37 Table 26. Validation results for the boreal forests biome based on spatially aggregated data of all tiers, LiDAR-based and CoFor AGB data. .................................................................................................................................................................................................... 53

Ref CCI Biomass Product Validation & Intercomparison Report v2
Issue Page Date 2.0 5 17.12.2020
© Aberystwyth University and GAMMA Remote Sensing, 2018 This document is the property of the CCI-Biomass partnership, no part of it shall be reproduced or transmitted without the express prior written
authorization of Aberystwyth University and Gamma Remote Sensing AG.
Table 27. Validation results for the mangroves biome based on spatially aggregated data of all tiers, LiDAR-based and CoFor AGB data. .................................................................................................................................................................................................... 53 Table 28. Validation results for the Mediterranean forests, woodland and scrub biome based on spatially aggregated data of all tiers, LiDAR-based and CoFor AGB data. ............................................................................................................................................. 54 Table 29. Validation results for the temperate broadleaf and mixed forests biome based on spatially aggregated data of all tiers, LiDAR-based and CoFor AGB data. ...................................................................................................................................................... 55 Table 30. Validation results for the temperate grasslands, savannas and shrublands biome based on spatially aggregated data of all tiers, LiDAR-based and CoFor AGB data. ............................................................................................................................................. 56 Table 31. Validation results for the tropical and subtropical dry broadleaf forest biome based on spatially aggregated data of all tiers, LiDAR-based and CoFor AGB data. ............................................................................................................................................. 56 Table 32. Validation results for the tropical and subtropical grasslands, savannas and shrublands biome based on spatially aggregated data of all tiers, LiDAR-based and CoFor AGB data. ......................................................................................................... 57 Table 33. Validation results for the Tropical and subtropical moist broadleaf forest biome based on spatially aggregated data of all tiers, LiDAR-based and CoFor AGB data. ............................................................................................................................................. 58 Table 34. Validation results for the tundra biome based on spatially aggregated data of all tiers, LiDAR-based and CoFor AGB data. ............................................................................................................................................................................................................ 58

Ref CCI Biomass Product Validation & Intercomparison Report v2
Issue Page Date 2.0 6 17.12.2020
© Aberystwyth University and GAMMA Remote Sensing, 2018 This document is the property of the CCI-Biomass partnership, no part of it shall be reproduced or transmitted without the express prior written
authorization of Aberystwyth University and Gamma Remote Sensing AG.
LIST OF FIGURES
Figure 1. Geographical locations of plots and footprints (CoFor and LiDAR) of the reference datasets. 11 Figure 2. Plot-map comparisons for tier 1 data at original resolution (i.e., without spatial aggregation) for the three AGB maps;
left column: scatterplots; right column: binned over 25 Mg/ha wide biomass ranges with whiskers representing the interquartile
range of mapped biomass values. AGBref > 350 Mg/ha data are grouped into a single bin. Note the different scales on the left and
right graphs. 16 Figure 3. Plot-map comparisons for tier 2 data at original resolution (i.e., without spatial aggregation); left column: scatterplots;
rights column: binned over 25 Mg/ha wide biomass ranges with whiskers representing the interquartile range of mapped biomass
values and symbol size representing the number of plots per biomass range. AGBref > 350 Mg/ha data are grouped into a single
bin. Note the different scales on the left and right graphs. 19 Figure 4. Plot-map comparisons for tier 3 data at original resolution (i.e., without spatial aggregation); left column: scatterplots;
right column: binned over 25 Mg/ha wide biomass ranges with whiskers representing the interquartile range of mapped biomass
values and symbol size representing the number of plots per biomass range. AGBref > 350 Mg/ha data are grouped into a single
bin. Note the different scales in the left and right graphs. 21 Figure 5. AGBref - AGMmap comparisons for tier 1 data spatially aggregated to 0.1° and binned over 25 Mg/ha wide biomass
ranges with whiskers representing the interquartile range of mapped biomass values and symbol size representing the number of
0.1° cells per biomass range. AGBref > 350 Mg/ha data are grouped into a single bin. 25 Figure 6. AGBref - AGMmap comparisons for LiDAR-based and CoFor AGB data spatially aggregated to 0.1° and binned over 25
Mg/ha wide biomass ranges with whiskers representing the interquartile range of mapped biomass values and symbol size
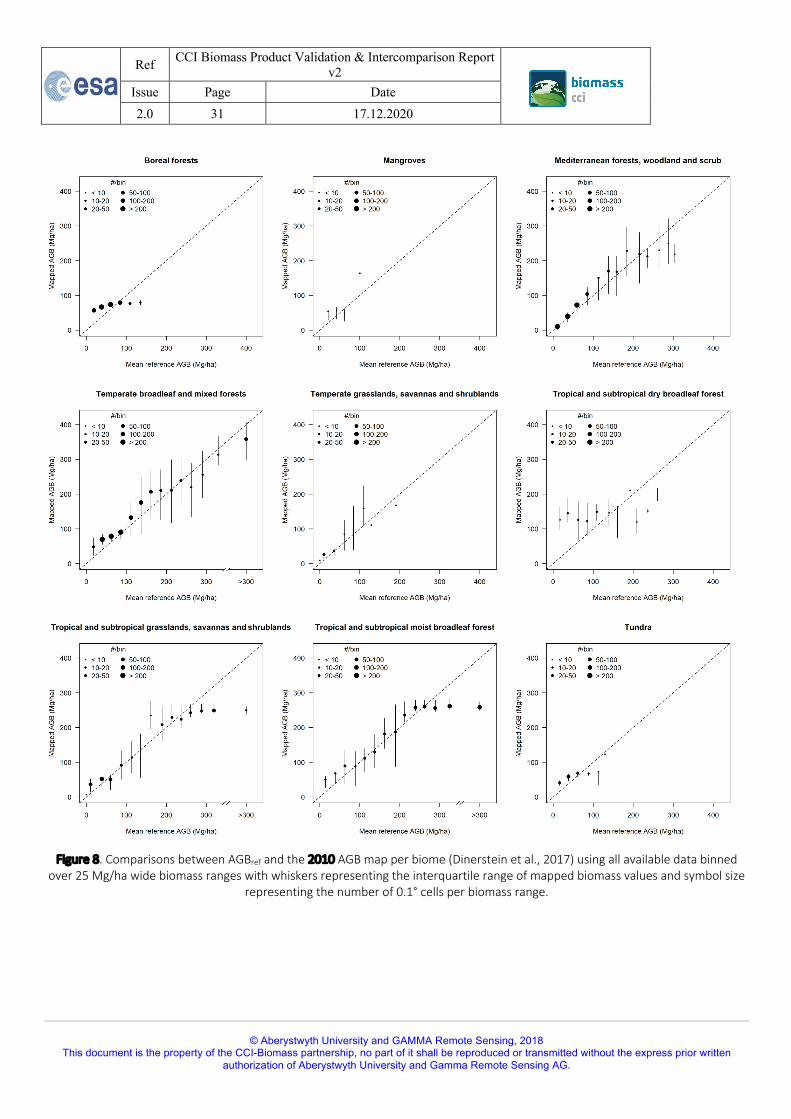
representing the number of 0.1° cells per biomass range. AGBref > 350 Mg/ha data are grouped into a single bin. 27 Figure 7. Legend for colour schemes used in summary tables of bias and RMSD. 29 Figure 8. Comparisons between AGBref and the 2010 AGB map per biome (Dinerstein et al., 2017) using all available data binned
over 25 Mg/ha wide biomass ranges with whiskers representing the interquartile range of mapped biomass values and symbol
size representing the number of 0.1° cells per biomass range. 31 Figure 9. Comparisons between AGBref and the 2017 AGB map per biome (Dinerstein et al., 2017) using all available data binned
over 25 Mg/ha wide biomass ranges with whiskers representing the interquartile range of mapped biomass values and symbol
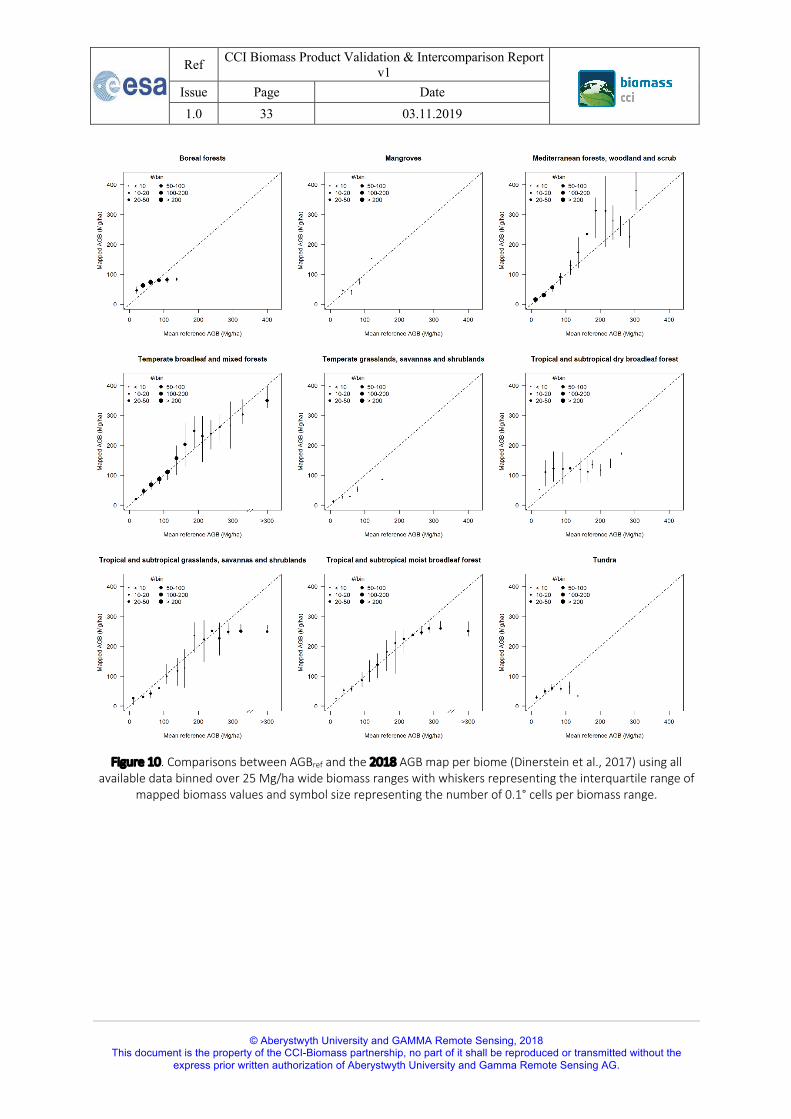
size representing the number of 0.1° cells per biomass range. 32 Figure 10. Comparisons between AGBref and the 2018 AGB map per biome (Dinerstein et al., 2017) using all available data binned
over 25 Mg/ha wide biomass ranges with whiskers representing the interquartile range of mapped biomass values and symbol
size representing the number of 0.1° cells per biomass range. 33 Figure 11. AGB residuals between harmonized tier1-3 plot data and mapped AGB at 0.1° cell level for each combination of map
reference years. The red dashed line is the 1:1 line. 38 Figure 12. Locations of 0.1° cells with the most extreme differences between residuals in the 2010 and 2017 AGB products (2010
– 2017). The 5% cells with the most negative differences (i.e., 2017 > 2010) are indicated in red whilst the 5% largest positive
differences (i.e., 2017 < 2010) are shown in blue. 39 Figure 13. Locations of 0.1° cells with the most extreme differences between residuals in the 2010 and 2018 AGB products (2010 – 2018). The 5% cells with the most negative differences (i.e., 2018 > 2010) are indicated in red whilst the 5% largest positive differences (i.e., 2018 < 2010) are shown in blue. 39 Figure 14. Locations of 0.1° cells with the most extreme differences between residuals in the 2017 and 2018 AGB products (2017 – 2018). The 5% cells with the most negative differences (i.e., 2018 > 2017) are indicated in red whilst the 5% largest positive differences (i.e., 2018 < 2017) are shown in blue. 40 Figure 15. Global AGMmap - AGBref comparisons based on inverse variance weighted tier 1-3 plot data spatially aggregated to 0.1°
cells. 41
Ref CCI Biomass Product Validation & Intercomparison Report v2
Issue Page Date 2.0 7 17.12.2020
© Aberystwyth University and GAMMA Remote Sensing, 2018 This document is the property of the CCI-Biomass partnership, no part of it shall be reproduced or transmitted without the express prior written
authorization of Aberystwyth University and Gamma Remote Sensing AG.
Figure 16. Variograms for the Remningstorp and Lope forest sites. Open dots indicate the experimental variogram and the solid
lines represent the fitted models. 42 Figure 17. Scatterplot of 0.04 ha plot values conditioned on 1 ha pixel values (left) and binned over 30 Mg/ha wide biomass
ranges with dots representing mean AGB and whiskers representing the interquartile range of pixel biomass values for plots
inside the bins (right). The dashed red lines are 1:1 lines. 42 Figure 18. Scatterplot of the mean of 0.04 ha plot values conditioned on 1 ha pixel values (left) and binned over 30 Mg/ha wide
biomass ranges with dots representing mean AGB and whiskers representing the interquartile range of pixel biomass values
(right). The dashed red lines are 1:1 lines. 43
Ref CCI Biomass Product Validation & Intercomparison Report v2
Issue Page Date 2.0 8 17.12.2020
© Aberystwyth University and GAMMA Remote Sensing, 2018 This document is the property of the CCI-Biomass partnership, no part of it shall be reproduced or transmitted without the express prior written
authorization of Aberystwyth University and Gamma Remote Sensing AG.
SYMBOLS AND ACRONYMS
AGB Aboveground biomass
AGBmap Aboveground biomass according to the map
AGBref Aboveground biomass from plot, corrected for plot inventory date and if plot size < 1 ha, corrected for partial forest fraction at pixel level
CCI Climate Change Initiative
CoFor Congo basin Forests AGB dataset (Ploton et al., 2020)
GNSS Global Navigation Satellite System
IPCC Intergovernmental Panel on Clmate Change
IVar Indicator variable: 1 if the SECCI is consistent with !"#($%&), MD and MSD, and 0 otherwise. The latter indicates that the SECCI layer is overly pessimistic regarding AGB map precision.
LiDAR LIght Detection And Ranging
MD Mean difference between AGBmap and AGBref
MSD Mean square difference (between AGBmap and AGBref)
NEON National Ecological Observatory Network, USA
NFI National Forest Inventory
PUG Product User Guide (Santoro, 2020)
PVIR Product Validation and Inter-comparison Report
PVP CCI Biomass Product Validation Plan
RMSD Root mean square difference (between AGBmap and AGBref)
SECCI Error layer (standard deviation) provided with the CCI Biomass product; if squared denoted as '(!!"# .
SLB Sustainable Landscape Brazil
SRTM Shuttle Radar Topography Mission
TERN Terrestrial Ecosystem Research Network, Australia
Var(Plt) Estimated variance of the plot measurement error
Var(S(x)) Estimated variance of the within-pixel sampling error (owing to smaller plot footprint)
Ref CCI Biomass Product Validation & Intercomparison Report v2
Issue Page Date 2.0 9 17.12.2020
© Aberystwyth University and GAMMA Remote Sensing, 2018 This document is the property of the CCI-Biomass partnership, no part of it shall be reproduced or transmitted without the express prior written
authorization of Aberystwyth University and Gamma Remote Sensing AG.
1. Introduction Validation is critical for raising acceptance of satellite-derived products in the user community. To assess the accuracy of the aboveground biomass (AGB; Mg/ha) estimates of the epochs 2017, 2018 and the refined 2010 CCI Biomass global products (Santoro, 2020), AGB predictions from the map have been compared with independent AGB data from plots and LiDAR campaigns, which were used as reference values. The main aim of this report is to provide an independent assessment of the quality of the three CCI Biomass products, with this primarily providing (climate) users with uncertainty information when using the map for global and regional climate modelling and assessment purposes. A second purpose is to provide feedback to map producers to establish where the map can be improved.
The reference AGB data are not error-free. In situ estimates of AGB are computed based on stem diameter (typically cm), tree height (m), wood density (g cm3) and allometric models, while geolocation is determined using Global Navigation Satellite System (GNSS) measurements having variable and often limited accuracy. GNSS accuracy is degraded if the paths between the satellites and the GNSS receiver are partly blocked by vegetation cover, which is not uncommon in forests. An additional cause of discrepancies between plots and pixel-based AGB estimates is the difference in support (shape and size) between map pixels and plots. The latter are often much smaller than the pixels they are being compared with, which may introduce a spatial representation error (referred to as the within-pixel sampling error). This occurs, for example, if a forest plot is used to represent a pixel that is only partially forested. But even if the pixel’s footprint is fully covered by forest, AGB heterogeneity inside the pixel produces differences between plot values and pixel AGB. A similar effect occurs when comparing pixel means over, for example, 0.1° cells to the mean of plots inside these blocks. Additionally, the plot inventory date often differs from the biomass map epoch, which gives a temporal mismatch between the compared AGB values.
LiDAR-based AGB estimates used as reference data can completely cover map pixels or even larger pixel blocks, which eliminates the sampling errors referred to above. However, just like the in situ estimates of AGB, LiDAR-based AGB values are themselves predictions, so are subject to prediction error that has to be taken into account.
Each of the above-mentioned factors can introduce errors with a random or a systematic nature. The latter type of error is of particular concern since it cannot be reduced by aggregating individual tree measurements over large plots or by averaging small plot data over many plots. Systematic errors in reference data have to be reduced as much as possible by adhering to a standardized measurement protocol (Labrière et al., 2018).
Versions 1 and 2 of the CCI Biomass Product Validation Plan (PVP; de Bruin et al., 2019a, 2020) presented approaches for addressing the temporal mismatch between plot and pixel data and partial forest fractions within map pixels. The reports also proposed methods for assessing the variance of the other error sources. In this second PVIR, the temporal mismatch between plot and pixel data and partial forest fractions within map pixel are handled similarly as in the first PVIR. The proposed approaches for accounting for other error sources are partly implemented, up to the point supported by available data.
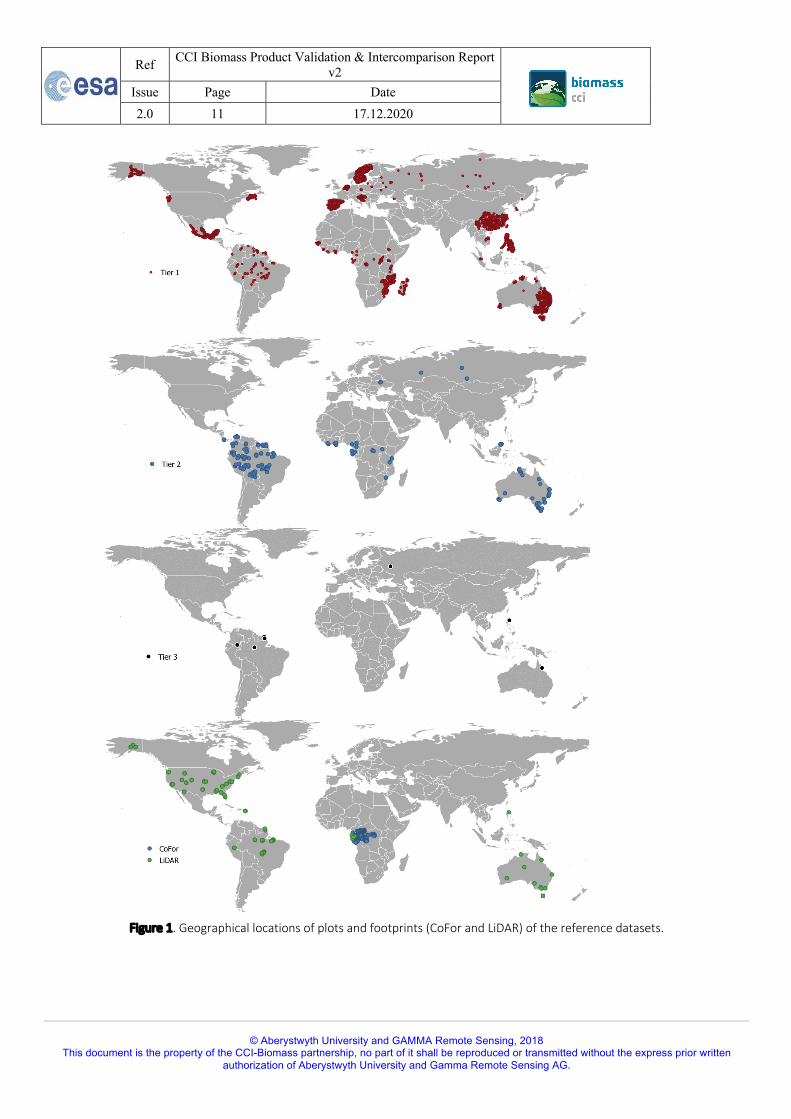
An extensive dataset of forest plot data across the world was acquired for the purpose of the validation (see Appendix A, Figure 1 and Table 1). Like before, the plots underwent a series of quality checks (see Section 2.1). Forest plot data and LiDAR were not used to calibrate the CCI Biomass map in order to guarantee full independence from the production process. The contributions of AGB measurement error and spatial representation error are known to be largest for small plots such as National Forest Inventory (NFI) plots, while detailed measurements of all trees within large plots are deemed to deliver highest quality AGB data (Réjou-Méchain et al., 2019; Réjou-Méchain et al., 2014). To take into account expected differences in the accuracy of plot data, a tiered approach was chosen which comprised:
• Tier 1 - small plots (≤ 0.6 ha) including National Forest Inventory (NFI) data,
• Tier 2 - larger plots (0.9-3 ha; tier 2), and
• Tier 3- high-quality large super-plots (≥ 6 ha; mainly from Labrière et al. (2018).

Ref CCI Biomass Product Validation & Intercomparison Report v2
Issue Page Date 2.0 10 17.12.2020
© Aberystwyth University and GAMMA Remote Sensing, 2018 This document is the property of the CCI-Biomass partnership, no part of it shall be reproduced or transmitted without the express prior written
authorization of Aberystwyth University and Gamma Remote Sensing AG.
Note that the tier numbering differs from PVIR version 1, to make it consistent with IPCC (2006) tier numbering where tier 3 is the most demanding in terms of data requirements. The tiers were analysed separately in the plot-pixel comparisons. AGB map comparisons with data derived from LiDAR and aggregated plot data (see Section 2.2) were also analysed separately.
The map inter-comparison presented in this document concerns consistency of map-reference deviations amongst the three current CCI Biomass AGB products and comparisons with the GlobBiomass 2010 AGB product (http://globbiomass.org) and version 1 of the CCI Biomass 2017 product.
2. Materials and methods
2.1. Forest plot data
For CCI Biomass, new forest inventory and plot data from research networks were added to the existing GlobBiomass reference database (Rozendaal et al., 2017). Reference data were only included if quality criteria, as described in the PVP, were met. Specifically, the plots needed:
• A proper citable reference source and metadata to assess the procedures and quality of biomass estimation.
• Precise coordinates (4-6 decimals for coordinates in decimal degrees).
• A census date within ten years from the reference year of the AGB map to avoid temporal inconsistency with the assessed maps.
• Measurements of all trees of diameter ≥ 10 cm (or less) were included.
• Not deforested between the year of the inventory and the reference year of the CCI Biomass map (i.e., 2010, 2017 and 2018). The latter assessment was based on the 2018 forest loss layer of the Hansen dataset (Hansen et al., 2013).
Table 1 lists the numbers of plots used in each tier and for each of the map reference years.
Table 1. Number of plots used in each tier for the different AGB map reference years.
Map ref. year tier1 tier2 tier3 Total
2010 118126 737 27 118853 2017 68286 557 23 68845 2018 65088 485 21 65573
Ref CCI Biomass Product Validation & Intercomparison Report v2
Issue Page Date 2.0 11 17.12.2020
© Aberystwyth University and GAMMA Remote Sensing, 2018 This document is the property of the CCI-Biomass partnership, no part of it shall be reproduced or transmitted without the express prior written
authorization of Aberystwyth University and Gamma Remote Sensing AG.
Figure 1. Geographical locations of plots and footprints (CoFor and LiDAR) of the reference datasets.
Ref CCI Biomass Product Validation & Intercomparison Report v2
Issue Page Date 2.0 12 17.12.2020
© Aberystwyth University and GAMMA Remote Sensing, 2018 This document is the property of the CCI-Biomass partnership, no part of it shall be reproduced or transmitted without the express prior written
authorization of Aberystwyth University and Gamma Remote Sensing AG.
2.2. LiDAR-based and 1-km pixel Congo basin Forests AGB
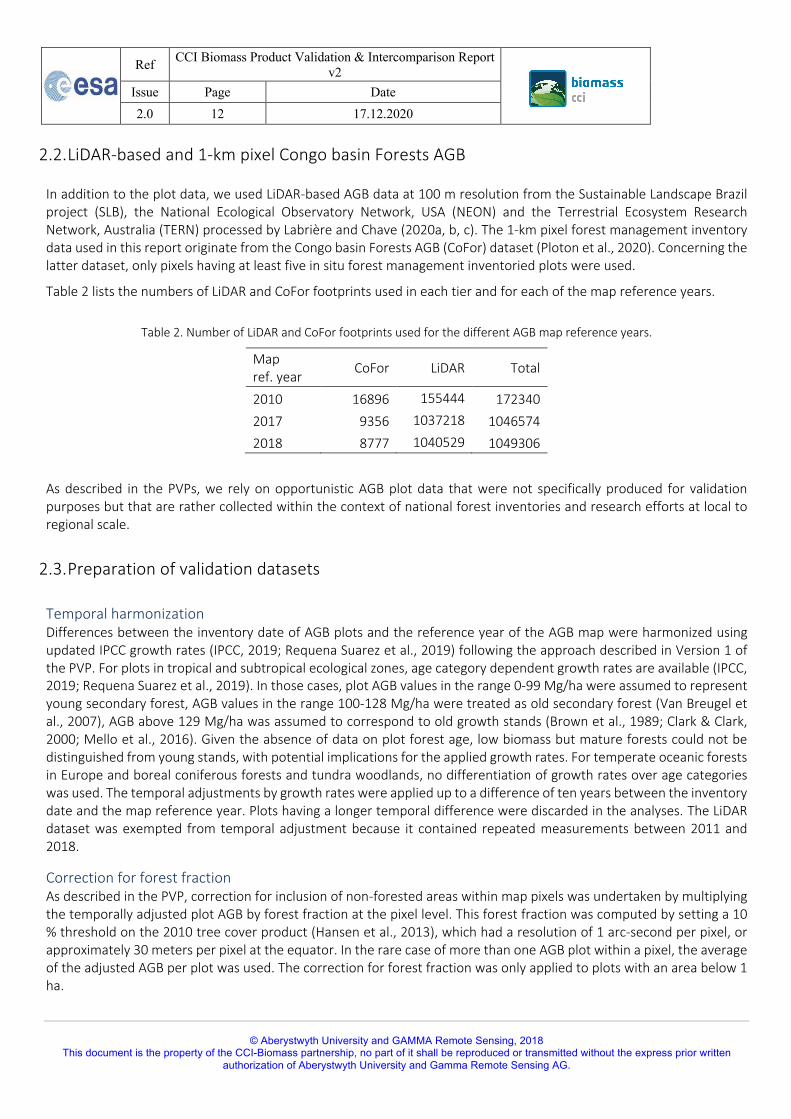
In addition to the plot data, we used LiDAR-based AGB data at 100 m resolution from the Sustainable Landscape Brazil project (SLB), the National Ecological Observatory Network, USA (NEON) and the Terrestrial Ecosystem Research Network, Australia (TERN) processed by Labrière and Chave (2020a, b, c). The 1-km pixel forest management inventory data used in this report originate from the Congo basin Forests AGB (CoFor) dataset (Ploton et al., 2020). Concerning the latter dataset, only pixels having at least five in situ forest management inventoried plots were used.
Table 2 lists the numbers of LiDAR and CoFor footprints used in each tier and for each of the map reference years.
Table 2. Number of LiDAR and CoFor footprints used for the different AGB map reference years.
Map ref. year CoFor LiDAR Total
2010 16896 155444 172340 2017 9356 1037218 1046574 2018 8777 1040529 1049306
As described in the PVPs, we rely on opportunistic AGB plot data that were not specifically produced for validation purposes but that are rather collected within the context of national forest inventories and research efforts at local to regional scale.
2.3. Preparation of validation datasets
Temporal harmonization Differences between the inventory date of AGB plots and the reference year of the AGB map were harmonized using updated IPCC growth rates (IPCC, 2019; Requena Suarez et al., 2019) following the approach described in Version 1 of the PVP. For plots in tropical and subtropical ecological zones, age category dependent growth rates are available (IPCC, 2019; Requena Suarez et al., 2019). In those cases, plot AGB values in the range 0-99 Mg/ha were assumed to represent young secondary forest, AGB values in the range 100-128 Mg/ha were treated as old secondary forest (Van Breugel et al., 2007), AGB above 129 Mg/ha was assumed to correspond to old growth stands (Brown et al., 1989; Clark & Clark, 2000; Mello et al., 2016). Given the absence of data on plot forest age, low biomass but mature forests could not be distinguished from young stands, with potential implications for the applied growth rates. For temperate oceanic forests in Europe and boreal coniferous forests and tundra woodlands, no differentiation of growth rates over age categories was used. The temporal adjustments by growth rates were applied up to a difference of ten years between the inventory date and the map reference year. Plots having a longer temporal difference were discarded in the analyses. The LiDAR dataset was exempted from temporal adjustment because it contained repeated measurements between 2011 and 2018.
Correction for forest fraction As described in the PVP, correction for inclusion of non-forested areas within map pixels was undertaken by multiplying the temporally adjusted plot AGB by forest fraction at the pixel level. This forest fraction was computed by setting a 10 % threshold on the 2010 tree cover product (Hansen et al., 2013), which had a resolution of 1 arc-second per pixel, or approximately 30 meters per pixel at the equator. In the rare case of more than one AGB plot within a pixel, the average of the adjusted AGB per plot was used. The correction for forest fraction was only applied to plots with an area below 1 ha.
Ref CCI Biomass Product Validation & Intercomparison Report v2
Issue Page Date 2.0 13 17.12.2020
© Aberystwyth University and GAMMA Remote Sensing, 2018 This document is the property of the CCI-Biomass partnership, no part of it shall be reproduced or transmitted without the express prior written
authorization of Aberystwyth University and Gamma Remote Sensing AG.
Comparisons at 0.1° cell resolution To reduce the effect of short range AGB variations in the map and their potential interaction with plot-map geolocation mismatches and to assess the CCI Biomass map at a resolution commonly used by climate modellers, AGBmap - AGBref comparisons from tier 1 data were also made over multi-pixel blocks at 0.1° cell resolution. In this case, correction for partial forest fraction (see above) was undertaken at the level of the coarse resolution cells. Mean AGBref at 0.1° cell level was computed by multiplying forest fraction at the 0.1° cell level by the mean temporally adjusted AGB of at least five plots in that cell. The procedure is illustrated in Figure 5 of the PVP (de Bruin et al., 2019a). The AGB reference values thus obtained were compared with the average map AGB spatially aggregated over the 0.1° cells.
The correction for forest fraction was not applied to the LiDAR dataset since the LiDAR footprints were assumed to representatively sample forest/non-forest fractions within the 0.1° cells, i.e., forested areas were not preferentially sampled.
Ecoregions / biomes AGBmap - AGBref comparisons at 0.1° cell resolution were also stratified according to ecoregions derived from the recent global ecoregion map (Dinerstein et al., 2017), which was downloaded from https://ecoregions2017.appspot.com/. The original vector maps were rasterized to 0.1° resolution. Resulting raster cells were assigned to the category covering the largest portion of the cell area. We stratified comparisons from tier 3 data at 0.1° cell resolution per biome.
2.4. Comparing AGB map pixels with reference data
Assumptions After adjustments for temporal discrepancies and partial forest fraction and having at least ten plots within a reference biomass range, we assumed unweighted means computed from reference data in tiers 1 and 2 to be unbiased. The biomass ranges used are listed in the first column of Table 2. For tier 1 data, we relaxed the requirement of ten plots per biomass range because these data were recorded over large plots (≥ 6 ha) and followed a strict measurement protocol. Under the unbiasedness assumption, mean differences between harmonized plot data and map values aggregated over bins covering ranges of reference AGB values are interpreted as map bias. To empirically verify the assumption of unbiased plot data, we conducted the analyses for each of the three tiers and assessed consistency of results over the three tiers, whenever data volume allowed us to do so.
When reporting mean differences (MD) and (root) mean square difference ((R)MSD) over ecoregions, we assume that plot-map comparisons within ecoregions are representative of those regions.
To facilitate a preliminary assessment of the standard deviation layer accompanying the CCI Biomass maps (see below), we assumed map error and plot measurement error to be spatially uncorrelated and mutually uncorrelated. This assumption was made because, at the time of writing this report, we had only limited data for assessing spatial correlation structures of the error components see sections 2.5 and 2.6).
Measures Besides reporting mean differences between reference and map AGB per biomass range, which are interpreted as map bias (see above), we also report (root) mean square deviations (MSD) between map values and plots. At this stage, we did not interpret MSD as the mean square errors of the map since we will elaborate on the assessment of the variance of individual error components in later stages of the project. However, we did assess whether the mean variance of map error ()*"+('(!!"# ))—where SECCI is the standard error layer provided with the CCI Biomass map—is consistent with MSD, MD and the mean variance of plot measurement error !"#$(&#'(()*)). The SECCI layer only represents the random part of AGB errors (Santoro, personal communication). Leaving out three random error components listed in the PVP (positional error, within-pixel representation error and the data harmonization error) and under the assumptions given above, we checked whether
Ref CCI Biomass Product Validation & Intercomparison Report v2
Issue Page Date 2.0 14 17.12.2020
© Aberystwyth University and GAMMA Remote Sensing, 2018 This document is the property of the CCI-Biomass partnership, no part of it shall be reproduced or transmitted without the express prior written
authorization of Aberystwyth University and Gamma Remote Sensing AG.
)*"+('(!!"# ) ≤ 0'1–01#– )*"+(!"#($%&)). For this purpose, we defined an indicator variable IVar, as follows:
,!"# =/112)*"+(34$$%& ) ≤ 0'1–012– )*"+(!"#($%&))
06*ℎ"'819"
If IVar attains the value zero, )*"+('(!!"# ) would be too large or—in other words—the SECCI layer provided with the biomass product would be overly pessimistic about map precision, unless the variance of plot measurement error is greatly underestimated.
For plots having tree-level data, &#'(()*) was computed using the Réjou-Méchain et al. (2017) biomass R-package. For other plots lacking such data, &#'(()*) was predicted by a random forest model trained on the plots having tree-level data, using plot biomass, plot size, general and specific eco-zones and continent as explanatory variables.
2.5. Spatial correlation of AGB
Experimental semi-variograms were computed and variogram models were fitted using gstat (Pebesma, 2004) based on LiDAR-AGB data acquired over two forest sites in Remningstorp, Sweden, and Lope, Gabon, i.e., a boreal and a tropical forest site. These ALS datasets were acquired in the framework of the airborne ESA BIOSAR (Ulander et al., 2011) and AfriSAR (Hajnsek et al., 2017) campaigns to provide detailed information on forest vertical structure and to produce high-resolution AGB maps. The AGB data have a spatial resolution of 10 m (Remningstorp) and 20 m (Lope) and were also used in version 2 of the Product User Guide (PUG; Santoro, 2020). Non-forest areas (such as savanna in the Lope study area) were masked out after manually digitizing forested areas using high resolution Google Earth imagery. Accordingly, the variogram models represent spatial correlation of AGB within forested area at the study sites.
2.6. Effect spatial support on sampling error and suggested map bias
The variogram models described above were used to assess the effects of the within-pixel sampling error (see Introduction) for the forest sites in Remningstorp and Lope. This was undertaken through two means:
• By computing the variance of the difference between sub-pixel plots and plot configurations (i.e., for plots smaller than pixels) and AGB map pixels at locations x as:
&#':3(;)< = &#' =>?@#'((;) −>?@)"*(;)B
= &#':>?@#'(< + &#':>?@)"*< − 2 ∗ F6G:>?@#'( , >?@)"*<,
where &#':>?@#'(< is the sill of the variogram at the spatial support of the plots, &#':>?@)"*< is the within pixel covariance, and F6G:>?@#'( , >?@)"*< is the plot to pixel covariance. Note that for brevity reference to the location x is omitted at the right-hand side of the above equation. The latter two terms are computed using the geostatistical framework of change of support (Kyriakidis, 2010).
• By simulating possible plot AGB, conditional on given AGB values at the pixel level, using the &#':>?@#'( −>?@)"*< computed in the above step. The aim of this simulation is to reproduce and explain results in section 3.3 of the PUG (Santoro, 2020) by a geostatistical approach.

Ref CCI Biomass Product Validation & Intercomparison Report v2
Issue Page Date 2.0 15 17.12.2020
© Aberystwyth University and GAMMA Remote Sensing, 2018 This document is the property of the CCI-Biomass partnership, no part of it shall be reproduced or transmitted without the express prior written
authorization of Aberystwyth University and Gamma Remote Sensing AG.
3. Validation results for the global maps
3.1. Global assessments per tier of plot data
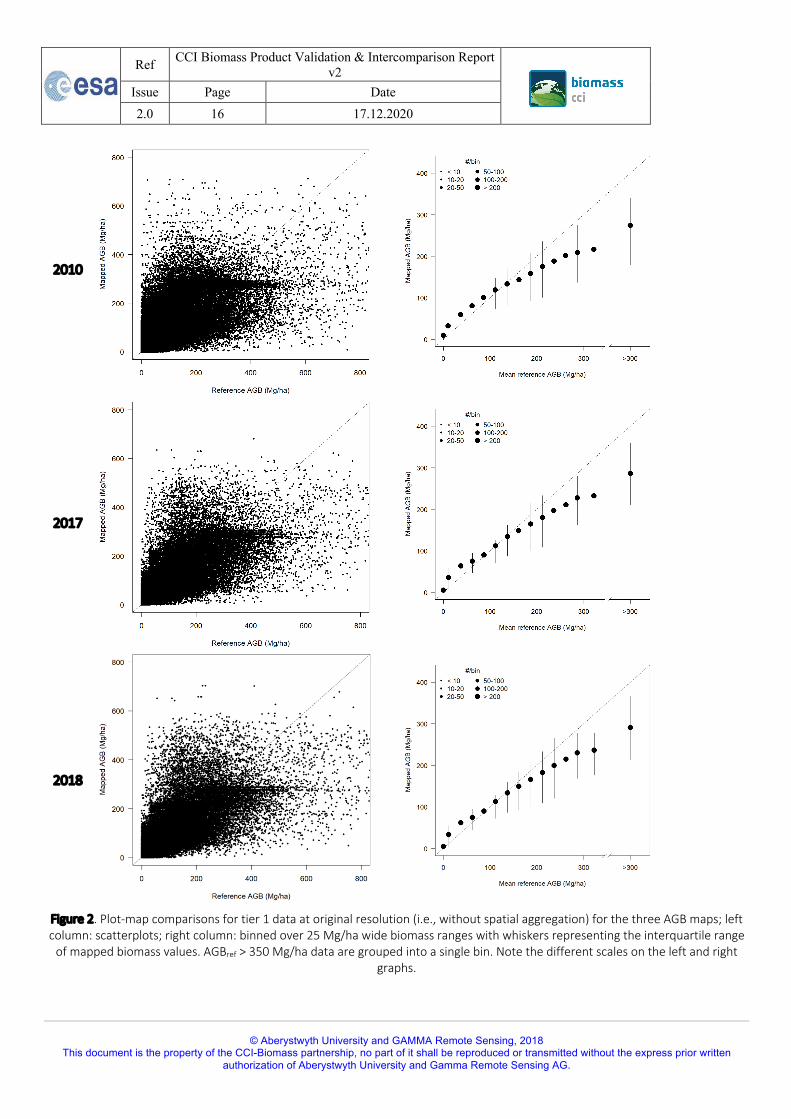
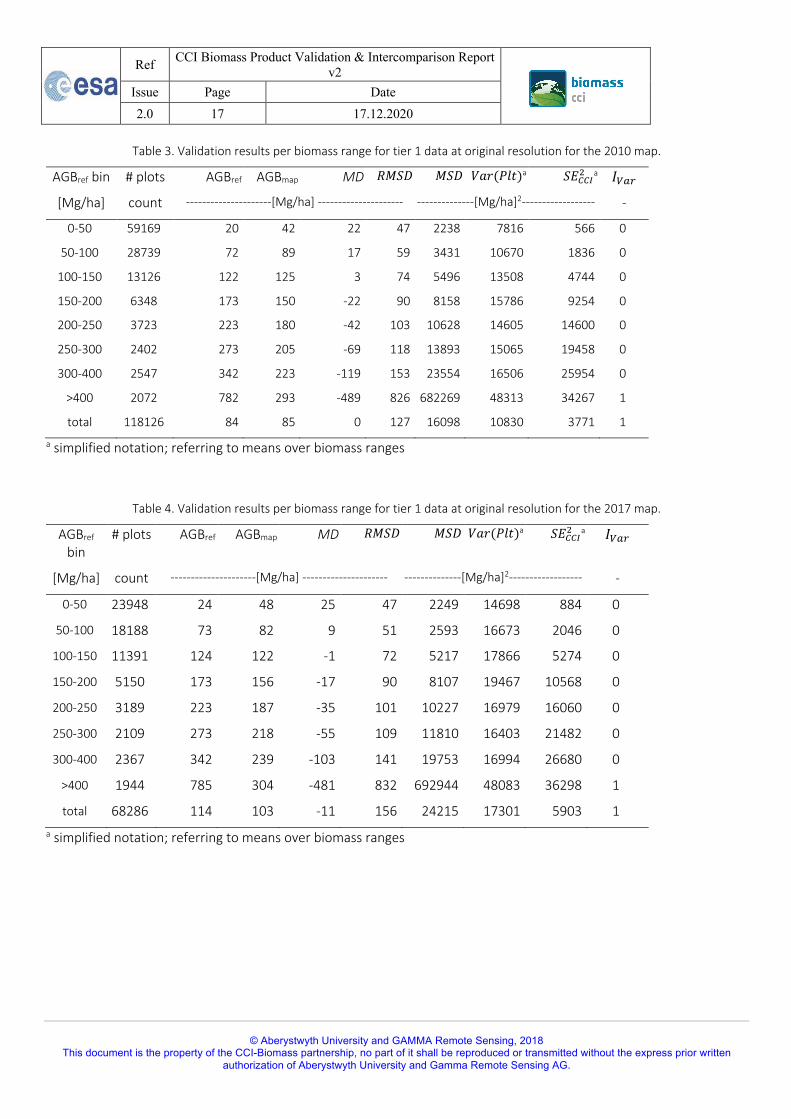
Tier 1 non-aggregated The non-aggregated results (i.e., at original resolution) of global plot-map comparisons using tier 1 data (plot size ≤ 0.6 ha) are shown in Figure 2 and Tables 3-5.
An overall feature of the comparisons is over-prediction of low reference biomass and under-prediction of higher reference biomass values, while relative accuracy is within 20 % in the middle range. On average, under-prediction by the map starts occurring at a reference biomass of approximately 150 Mg/ha but the interquartile range of plot data still covers the 1:1 line between AGBref and AGBmap up to approximately 275 Mg/ha. The under-prediction increases with reference biomass and reaches maxima of 489 Mg/ha (2010), 481 Mg/ha (2017) and 474 (2018) for mean reference biomass densities of 782, 785 and 783 Mg/ha, respectively. The latter values originate from small plots with exceptionally high biomass that are unlikely to cover extensive areas and are unlikely to be captured by the biomass retrieval algorithm. The banding observed in the left column of Figure 2 seems to be caused by a maximum AGB level set for particular regions in the retrieval algorithm. Upon a first impression, the accuracy of the 2017 map has improved with respect to the previous edition as reported in de Bruin et al. (2019b: Table 4 and Figure 4 therein). This is further analysed in section 3.7.
As noted in the PUG (Santoro, 2020), the within-pixel sampling error contributes to the observed over-prediction of low reference biomass and under-prediction of higher reference biomass values, even if the mean AGB of the population from which the small plot is drawn agrees with the map at pixel level. This is elaborated on in section 3.8.
In all cases but the two bottom rows of Tables 3-5, the indicator variable IVar = 0, suggesting the SECCI layer provided with the biomass product is overly pessimistic about the precision of the CCI Biomass 2017 map. The considerable mean variance of plot measurement error, !"#$(&#'(()*)), of the smallest plot size category definitely contributes to this observation. Only for the highest reference biomass value IVar attained the value 1. Further analyses of the random error components are needed to assess whether the reported SECCI for AGBref > 400 Mg/ha is indeed reasonable.
Ref CCI Biomass Product Validation & Intercomparison Report v2
Issue Page Date 2.0 16 17.12.2020
© Aberystwyth University and GAMMA Remote Sensing, 2018 This document is the property of the CCI-Biomass partnership, no part of it shall be reproduced or transmitted without the express prior written
authorization of Aberystwyth University and Gamma Remote Sensing AG.
2010
2017
2018
Figure 2. Plot-map comparisons for tier 1 data at original resolution (i.e., without spatial aggregation) for the three AGB maps; left column: scatterplots; right column: binned over 25 Mg/ha wide biomass ranges with whiskers representing the interquartile range
of mapped biomass values. AGBref > 350 Mg/ha data are grouped into a single bin. Note the different scales on the left and right graphs.
Ref CCI Biomass Product Validation & Intercomparison Report v2
Issue Page Date 2.0 17 17.12.2020
© Aberystwyth University and GAMMA Remote Sensing, 2018 This document is the property of the CCI-Biomass partnership, no part of it shall be reproduced or transmitted without the express prior written
authorization of Aberystwyth University and Gamma Remote Sensing AG.
Table 3. Validation results per biomass range for tier 1 data at original resolution for the 2010 map.
AGBref bin # plots AGBref AGBmap MD 30'1 0'1 !"#($%&)a '(!!"# a ,!"#
[Mg/ha] count ---------------------[Mg/ha] --------------------- --------------[Mg/ha]2------------------ -
0-50 59169 20 42 22 47 2238 7816 566 0
50-100 28739 72 89 17 59 3431 10670 1836 0
100-150 13126 122 125 3 74 5496 13508 4744 0
150-200 6348 173 150 -22 90 8158 15786 9254 0
200-250 3723 223 180 -42 103 10628 14605 14600 0
250-300 2402 273 205 -69 118 13893 15065 19458 0
300-400 2547 342 223 -119 153 23554 16506 25954 0
>400 2072 782 293 -489 826 682269 48313 34267 1
total 118126 84 85 0 127 16098 10830 3771 1 a simplified notation; referring to means over biomass ranges
Table 4. Validation results per biomass range for tier 1 data at original resolution for the 2017 map.
AGBref bin
# plots AGBref AGBmap MD 30'1 0'1 !"#($%&)a '(!!"# a ,!"#
[Mg/ha] count ---------------------[Mg/ha] --------------------- --------------[Mg/ha]2------------------ -
0-50 23948 24 48 25 47 2249 14698 884 0
50-100 18188 73 82 9 51 2593 16673 2046 0
100-150 11391 124 122 -1 72 5217 17866 5274 0
150-200 5150 173 156 -17 90 8107 19467 10568 0
200-250 3189 223 187 -35 101 10227 16979 16060 0
250-300 2109 273 218 -55 109 11810 16403 21482 0
300-400 2367 342 239 -103 141 19753 16994 26680 0
>400 1944 785 304 -481 832 692944 48083 36298 1
total 68286 114 103 -11 156 24215 17301 5903 1 a simplified notation; referring to means over biomass ranges
Ref CCI Biomass Product Validation & Intercomparison Report v2
Issue Page Date 2.0 18 17.12.2020
© Aberystwyth University and GAMMA Remote Sensing, 2018 This document is the property of the CCI-Biomass partnership, no part of it shall be reproduced or transmitted without the express prior written
authorization of Aberystwyth University and Gamma Remote Sensing AG.
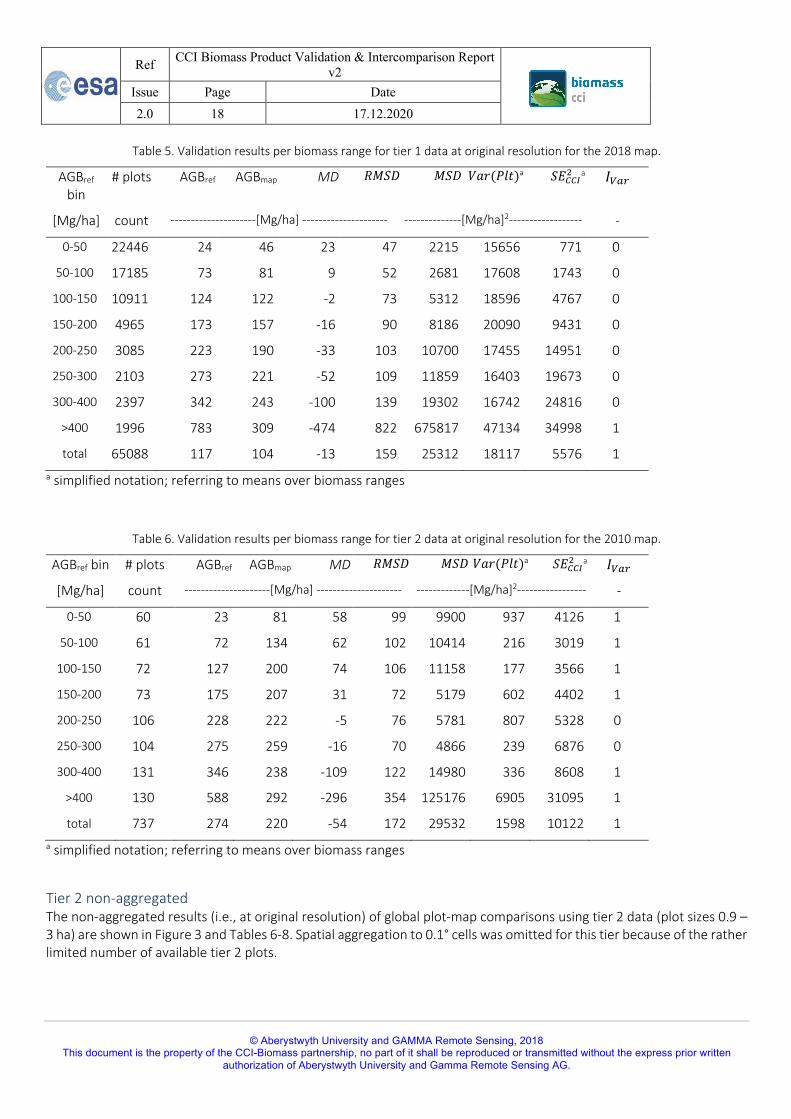
Table 5. Validation results per biomass range for tier 1 data at original resolution for the 2018 map.
AGBref bin
# plots AGBref AGBmap MD 30'1 0'1 !"#($%&)a '(!!"# a ,!"#
[Mg/ha] count ---------------------[Mg/ha] --------------------- --------------[Mg/ha]2------------------ -
0-50 22446 24 46 23 47 2215 15656 771 0
50-100 17185 73 81 9 52 2681 17608 1743 0
100-150 10911 124 122 -2 73 5312 18596 4767 0
150-200 4965 173 157 -16 90 8186 20090 9431 0
200-250 3085 223 190 -33 103 10700 17455 14951 0
250-300 2103 273 221 -52 109 11859 16403 19673 0
300-400 2397 342 243 -100 139 19302 16742 24816 0
>400 1996 783 309 -474 822 675817 47134 34998 1
total 65088 117 104 -13 159 25312 18117 5576 1 a simplified notation; referring to means over biomass ranges
Table 6. Validation results per biomass range for tier 2 data at original resolution for the 2010 map.
AGBref bin # plots AGBref AGBmap MD 30'1 0'1 !"#($%&)a '(!!"# a ,!"#
[Mg/ha] count ---------------------[Mg/ha] --------------------- -------------[Mg/ha]2----------------- -
0-50 60 23 81 58 99 9900 937 4126 1
50-100 61 72 134 62 102 10414 216 3019 1
100-150 72 127 200 74 106 11158 177 3566 1
150-200 73 175 207 31 72 5179 602 4402 1
200-250 106 228 222 -5 76 5781 807 5328 0
250-300 104 275 259 -16 70 4866 239 6876 0
300-400 131 346 238 -109 122 14980 336 8608 1
>400 130 588 292 -296 354 125176 6905 31095 1
total 737 274 220 -54 172 29532 1598 10122 1 a simplified notation; referring to means over biomass ranges
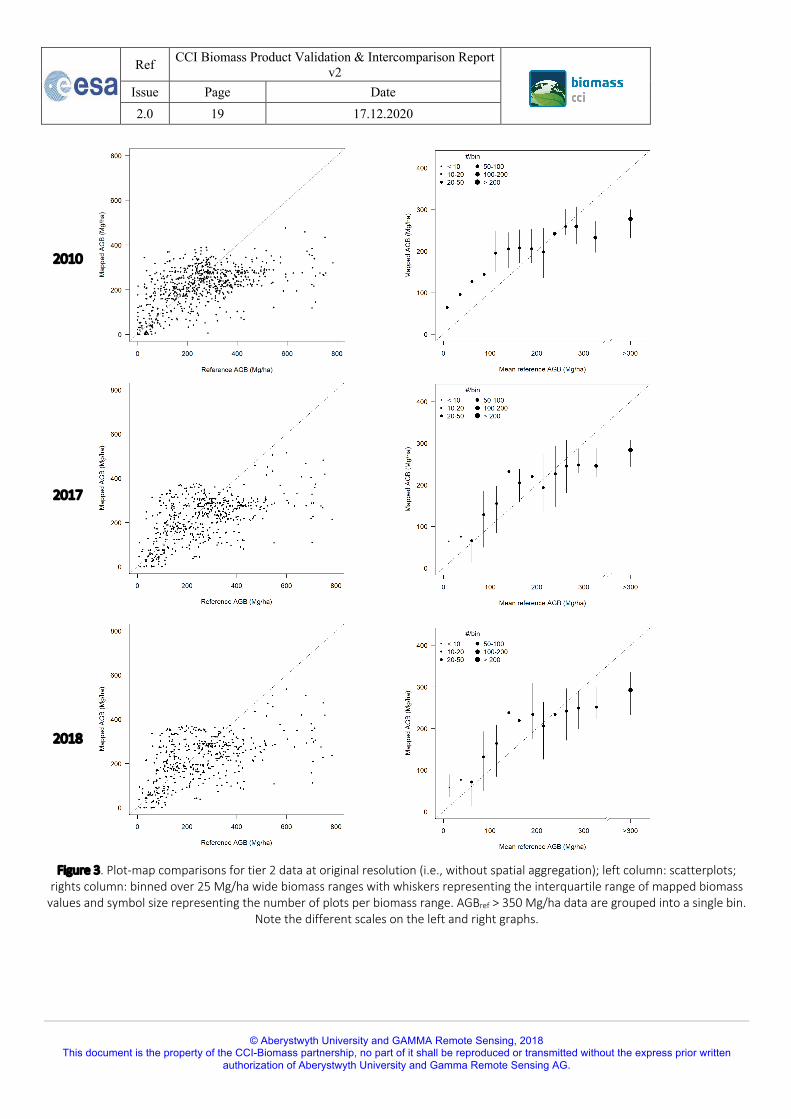
Tier 2 non-aggregated The non-aggregated results (i.e., at original resolution) of global plot-map comparisons using tier 2 data (plot sizes 0.9 – 3 ha) are shown in Figure 3 and Tables 6-8. Spatial aggregation to 0.1° cells was omitted for this tier because of the rather limited number of available tier 2 plots.
Ref CCI Biomass Product Validation & Intercomparison Report v2
Issue Page Date 2.0 19 17.12.2020
© Aberystwyth University and GAMMA Remote Sensing, 2018 This document is the property of the CCI-Biomass partnership, no part of it shall be reproduced or transmitted without the express prior written
authorization of Aberystwyth University and Gamma Remote Sensing AG.
2010
2017
2018
Figure 3. Plot-map comparisons for tier 2 data at original resolution (i.e., without spatial aggregation); left column: scatterplots;
rights column: binned over 25 Mg/ha wide biomass ranges with whiskers representing the interquartile range of mapped biomass values and symbol size representing the number of plots per biomass range. AGBref > 350 Mg/ha data are grouped into a single bin.
Note the different scales on the left and right graphs.
Ref CCI Biomass Product Validation & Intercomparison Report v2
Issue Page Date 2.0 20 17.12.2020
© Aberystwyth University and GAMMA Remote Sensing, 2018 This document is the property of the CCI-Biomass partnership, no part of it shall be reproduced or transmitted without the express prior written
authorization of Aberystwyth University and Gamma Remote Sensing AG.
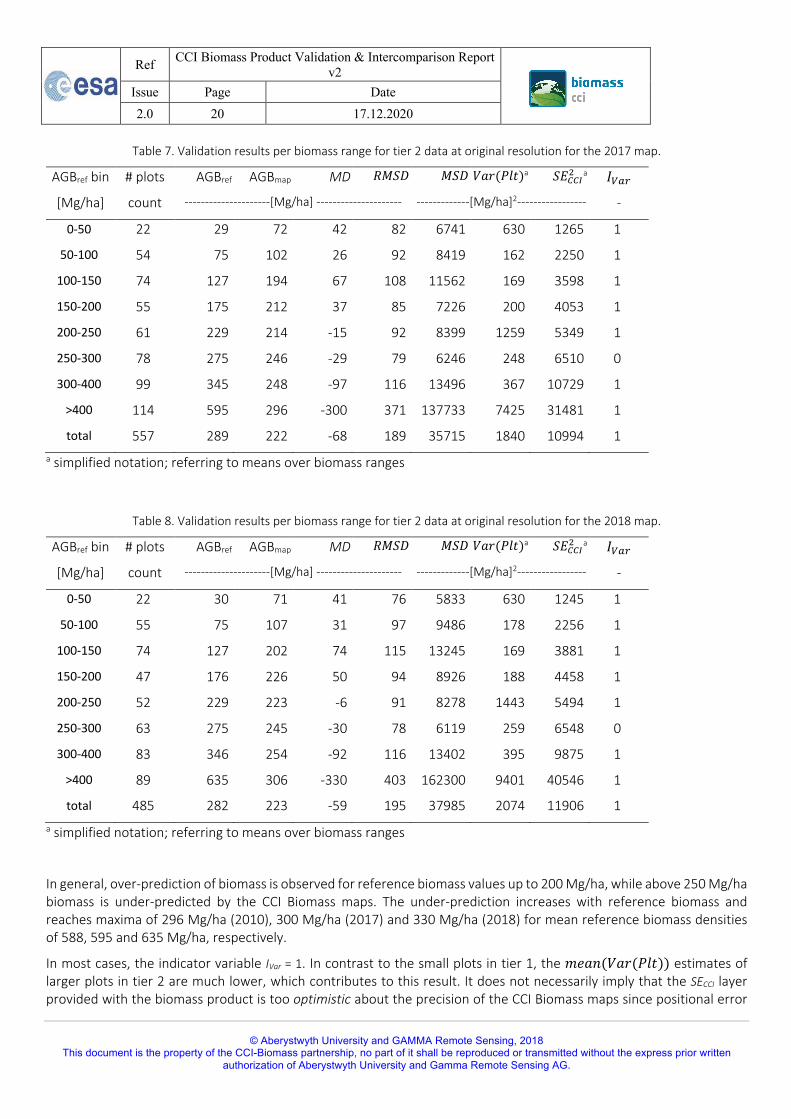
Table 7. Validation results per biomass range for tier 2 data at original resolution for the 2017 map.
AGBref bin # plots AGBref AGBmap MD 30'1 0'1 !"#($%&)a '(!!"# a ,!"#
[Mg/ha] count ---------------------[Mg/ha] --------------------- -------------[Mg/ha]2----------------- -
0-50 22 29 72 42 82 6741 630 1265 1
50-100 54 75 102 26 92 8419 162 2250 1
100-150 74 127 194 67 108 11562 169 3598 1
150-200 55 175 212 37 85 7226 200 4053 1
200-250 61 229 214 -15 92 8399 1259 5349 1
250-300 78 275 246 -29 79 6246 248 6510 0
300-400 99 345 248 -97 116 13496 367 10729 1
>400 114 595 296 -300 371 137733 7425 31481 1
total 557 289 222 -68 189 35715 1840 10994 1 a simplified notation; referring to means over biomass ranges
Table 8. Validation results per biomass range for tier 2 data at original resolution for the 2018 map.
AGBref bin # plots AGBref AGBmap MD 30'1 0'1 !"#($%&)a '(!!"# a ,!"#
[Mg/ha] count ---------------------[Mg/ha] --------------------- -------------[Mg/ha]2----------------- -
0-50 22 30 71 41 76 5833 630 1245 1
50-100 55 75 107 31 97 9486 178 2256 1
100-150 74 127 202 74 115 13245 169 3881 1
150-200 47 176 226 50 94 8926 188 4458 1
200-250 52 229 223 -6 91 8278 1443 5494 1
250-300 63 275 245 -30 78 6119 259 6548 0
300-400 83 346 254 -92 116 13402 395 9875 1
>400 89 635 306 -330 403 162300 9401 40546 1
total 485 282 223 -59 195 37985 2074 11906 1 a simplified notation; referring to means over biomass ranges
In general, over-prediction of biomass is observed for reference biomass values up to 200 Mg/ha, while above 250 Mg/ha biomass is under-predicted by the CCI Biomass maps. The under-prediction increases with reference biomass and reaches maxima of 296 Mg/ha (2010), 300 Mg/ha (2017) and 330 Mg/ha (2018) for mean reference biomass densities of 588, 595 and 635 Mg/ha, respectively.
In most cases, the indicator variable IVar = 1. In contrast to the small plots in tier 1, the !"#$(&#'(()*)) estimates of larger plots in tier 2 are much lower, which contributes to this result. It does not necessarily imply that the SECCI layer provided with the biomass product is too optimistic about the precision of the CCI Biomass maps since positional error

Ref CCI Biomass Product Validation & Intercomparison Report v2
Issue Page Date 2.0 21 17.12.2020
© Aberystwyth University and GAMMA Remote Sensing, 2018 This document is the property of the CCI-Biomass partnership, no part of it shall be reproduced or transmitted without the express prior written
authorization of Aberystwyth University and Gamma Remote Sensing AG.
and within-pixel sampling error may also contribute to observed differences between AGBmap and AGBref (see PVPs). However, note that the within-pixel sampling error will be small since the plots in this tier are comparable in size or even larger than the map pixels. The effect of positional error plays a role in areas with AGB gradients and needs further analysis.
Figure 4. Plot-map comparisons for tier 3 data at original resolution (i.e., without spatial aggregation); left column: scatterplots;
right column: binned over 25 Mg/ha wide biomass ranges with whiskers representing the interquartile range of mapped biomass values and symbol size representing the number of plots per biomass range. AGBref > 350 Mg/ha data are grouped into a single bin.
Note the different scales in the left and right graphs.
2010
2017
2018

Ref CCI Biomass Product Validation & Intercomparison Report v2
Issue Page Date 2.0 22 17.12.2020
© Aberystwyth University and GAMMA Remote Sensing, 2018 This document is the property of the CCI-Biomass partnership, no part of it shall be reproduced or transmitted without the express prior written
authorization of Aberystwyth University and Gamma Remote Sensing AG.
Tier 3 non-aggregated The non-aggregated results (i.e., at original plot level) of global plot-map comparisons using tier 3 data (plot size ≥ 6 ha) are shown in Figure 4 and Tables 9-11. Similar to tier 2, spatial aggregation to 0.1° cells was omitted because of the small number of available tier 3 plots.
It is important to note that most tier 3 plots are in the tropics and cover a biomass range between 150 and 450 Mg/ha (i.e., the biomass range where SAR sensors lose sensitivity), so lack low biomass densities. The small number of plots and the large scatter hardly allow conclusions to be drawn based on these data, except for the general trend of the map to under-predict biomass in the higher part of the assessed biomass range, which was also observed with the tier 1-2 data.
Table 9. Validation results per biomass range for tier 3 data at the original resolution for the 2010 map.
AGBref bin # plots AGBref AGBmap MD 30'1 0'1 !"#($%&)a '(!!"# a ,!"#
[Mg/ha] count ---------------------[Mg/ha] --------------------- --------------[Mg/ha]2------------------
-
0-50 - - - - - - - - -
50-100 - - - - - - - - -
100-150 1 134 295 161 161 25893 70 9216 1
150-200 - - - - - - - - -
200-250 3 225 194 -30 86 7436 459 6719 1
250-300 6 285 269 -16 31 991 167 5978 0
300-400 13 350 278 -72 81 6581 176 7165 0
>400 4 413 273 -139 139 19435 214 6680 1
total 27 323 267 -56 90 8053 207 6856 1 a simplified notation; referring to means over the biomass ranges

Ref CCI Biomass Product Validation & Intercomparison Report v2
Issue Page Date 2.0 23 17.12.2020
© Aberystwyth University and GAMMA Remote Sensing, 2018 This document is the property of the CCI-Biomass partnership, no part of it shall be reproduced or transmitted without the express prior written
authorization of Aberystwyth University and Gamma Remote Sensing AG.
Table 10. Validation results per biomass range for tier 3 data at the original resolution for the 2017 map.
AGBref bin # plots AGBref AGBmap MD 30'1 0'1 !"#($%&)a '(!!"# a ,!"#
[Mg/ha] count ---------------------[Mg/ha] --------------------- --------------[Mg/ha]2------------------
-
0-50 - - - - - - - - -
50-100 - - - - - - - - -
100-150 - - - - - - - - -
150-200 1 150 293 142 142 20246 70 8464 1
200-250 2 220 191 -30 73 5376 611 3946 1
250-300 3 268 274 6 14 200 151 7360 0
300-400 12 344 290 -54 66 4375 169 5963 0
>400 5 416 284 -132 133 17803 208 7198 1
total 23 331 278 -53 87 7527 209 6347 1 a simplified notation; referring to means over the biomass ranges
Table 11. Validation results per biomass range for tier 3 data at the original resolution for the 2018 map.
AGBref bin # plots AGBref AGBmap MD 30'1 0'1 !"#($%&)a '(!!"# a ,!"#
[Mg/ha] count ---------------------[Mg/ha] --------------------- --------------[Mg/ha]2------------------
-
0-50 - - - - - - - - -
50-100 - - - - - - - - -
100-150 - - - - - - - - -
150-200 1 150 288 138 138 19055 70 9216 1
200-250 2 221 181 -40 72 5213 611 5661 0
250-300 3 268 271 2 6 31 151 8034 0
300-400 10 351 275 -77 84 7026 169 7325 0
>400 5 416 274 -142 143 20395 208 7149 1
total 21 333 266 -67 98 9610 213 7316 1 a simplified notation; referring to means over the biomass ranges

Ref CCI Biomass Product Validation & Intercomparison Report v2
Issue Page Date 2.0 24 17.12.2020
© Aberystwyth University and GAMMA Remote Sensing, 2018 This document is the property of the CCI-Biomass partnership, no part of it shall be reproduced or transmitted without the express prior written
authorization of Aberystwyth University and Gamma Remote Sensing AG.
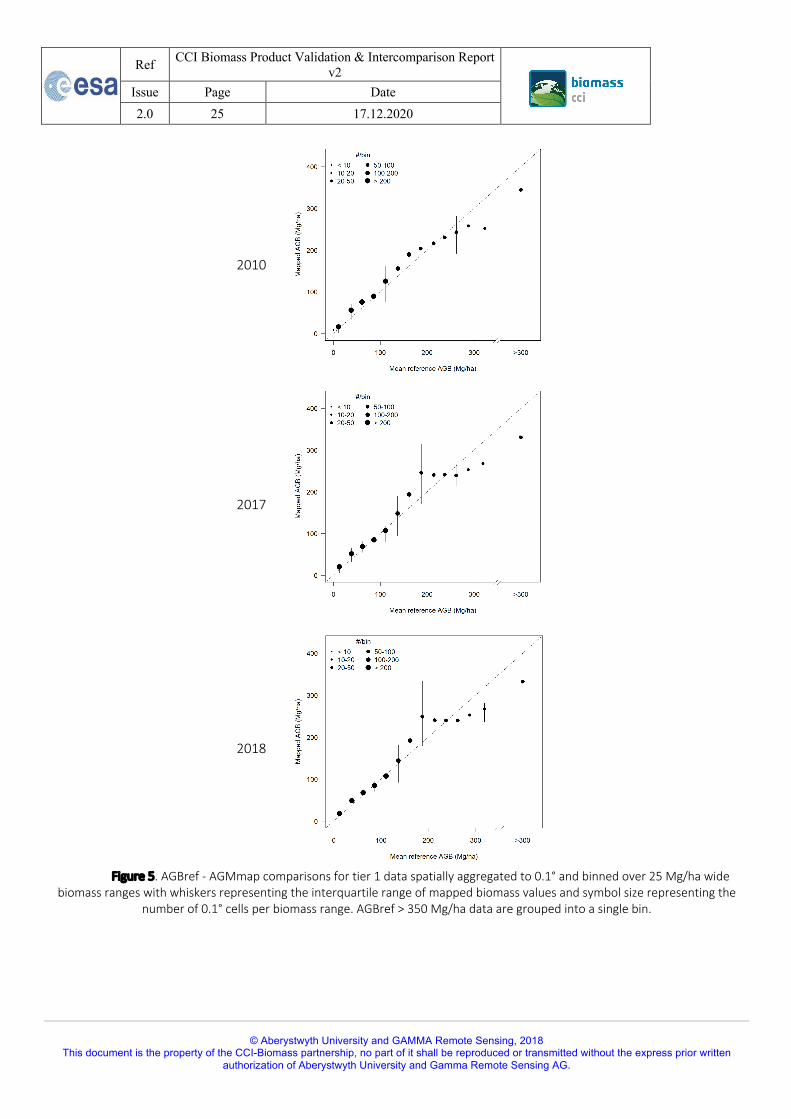
3.2. Tier 1 plot data spatially aggregated to 0.1° cells
The results of global AGMmap - AGBref comparisons using tier 1 data (plot size ≤ 0.6 ha) spatially aggregated to 0.1° cells are shown in Figure 5 and Tables 12-14. The rightmost variance columns shown in Tables 3-11 are omitted here because spatial correlation of errors within 0.1° cells may be non-negligible but we lack data to assess such correlation for most biomes at the current stage of the project.
Spatial aggregation to 0.1° cells improved the fit between AGBref and AGBmap. The higher reference biomass is still under-predicted, but up to 300 Mg/ha, except for peaks around AGBref ≈ 200 Mg/ha, the absolute mean differences are within 30 Mg/ha. The 0.1° cells producing the peak at AGBref ≈ 200 Mg/ha are located in east Australia (not shown here).
Apart from the above issue, spatial aggregation successfully reduced the effect of localized AGB fluctuations in the map and their potential interaction with plot-map geolocation mismatches. These results (Figure 5, Tables 12-14) suggest the CCI Biomass predictions at 0.1° cell resolution are more accurate than at the original pixel resolution. As we will see later, very similar results were obtained for the temperate broadleaf and mixed forest biome. Most 0.1° cells meeting the criterion of at least five plots per cell happen to be located in that biome.
Table 12. Validation results per biomass range for tier 1 data spatially aggregated to 0.1° cells for the 2010 map.
AGBref bin # cells AGBref AGBmap MD 30'1
[Mg/ha] count ---------------------[Mg/ha] ---------------------
0-50 3809 23 33 10 26
50-100 1847 70 80 10 34
100-150 506 121 136 16 83
150-200 194 171 195 24 94
200-250 127 226 223 -3 84
250-300 90 273 249 -24 81
300-400 49 338 261 -77 110
>400 48 700 365 -335 430
total 6670 62 69 7 56
Ref CCI Biomass Product Validation & Intercomparison Report v2
Issue Page Date 2.0 25 17.12.2020
© Aberystwyth University and GAMMA Remote Sensing, 2018 This document is the property of the CCI-Biomass partnership, no part of it shall be reproduced or transmitted without the express prior written
authorization of Aberystwyth University and Gamma Remote Sensing AG.
2010
2017
2018
Figure 5. AGBref - AGMmap comparisons for tier 1 data spatially aggregated to 0.1° and binned over 25 Mg/ha wide
biomass ranges with whiskers representing the interquartile range of mapped biomass values and symbol size representing the number of 0.1° cells per biomass range. AGBref > 350 Mg/ha data are grouped into a single bin.

Ref CCI Biomass Product Validation & Intercomparison Report v2
Issue Page Date 2.0 26 17.12.2020
© Aberystwyth University and GAMMA Remote Sensing, 2018 This document is the property of the CCI-Biomass partnership, no part of it shall be reproduced or transmitted without the express prior written
authorization of Aberystwyth University and Gamma Remote Sensing AG.
Table 13. Validation results per biomass range for tier 1 data spatially aggregated to 0.1° cells for the 2017 map.
AGBref bin # cells AGBref AGBmap MD 30'1
[Mg/ha] count ---------------------[Mg/ha] ---------------------
0-50 1664 27 37 10 24
50-100 1646 72 75 3 27
100-150 554 120 122 2 59
150-200 173 172 215 43 102
200-250 113 225 240 15 89
250-300 93 273 245 -28 64
300-400 54 337 274 -62 103
>400 52 690 346 -344 437
total 4349 84 86 2 64
Table 14. Validation results per biomass range for tier 1 data spatially aggregated to 0.1° cells for the 2018 map.
AGBref bin # cells AGBref AGBmap MD 30'1
[Mg/ha] count ---------------------[Mg/ha] ---------------------
0-50 1659 27 35 8 23
50-100 1649 72 75 3 27
100-150 553 120 120 0 60
150-200 173 172 215 43 108
200-250 113 225 240 15 96
250-300 93 272 245 -28 68
300-400 54 337 276 -60 107
>400 52 690 346 -344 437
total 4346 84 85 1 65
3.3. Comparisons with LiDAR-based and 1-km pixel Congo basin Forests AGB
The results of the global AGMmap - AGBre comparisons at 0.1° resolution using LiDAR-based and CoFor AGB as reference data are shown in Figure 6 and Tables 15-17.
.

Ref CCI Biomass Product Validation & Intercomparison Report v2
Issue Page Date 2.0 27 17.12.2020
© Aberystwyth University and GAMMA Remote Sensing, 2018 This document is the property of the CCI-Biomass partnership, no part of it shall be reproduced or transmitted without the express prior written
authorization of Aberystwyth University and Gamma Remote Sensing AG.
The key observation, common to all three AGB maps, is the map underestimation starting at 300 Mg/ha. This effect may be influenced by the CoFor data having a dense plot network in the forest management areas of Congo basin. Since the original plot data inside the 1-km aggregates of the CoFor dataset are unavailable, we were unable to account for partly deforested areas. Such areas are likely to exist given the active forestry activities in the area. On the other hand, similar results were observed using the plot data, which builds confidence in using LiDAR and CoFor data for accuracy assessments.
2010
2017
2018
Figure 6. AGBref - AGMmap comparisons for LiDAR-based and CoFor AGB data spatially aggregated to 0.1° and binned over 25
Mg/ha wide biomass ranges with whiskers representing the interquartile range of mapped biomass values and symbol size representing the number of 0.1° cells per biomass range. AGBref > 350 Mg/ha data are grouped into a single bin.

Ref CCI Biomass Product Validation & Intercomparison Report v2
Issue Page Date 2.0 28 17.12.2020
© Aberystwyth University and GAMMA Remote Sensing, 2018 This document is the property of the CCI-Biomass partnership, no part of it shall be reproduced or transmitted without the express prior written
authorization of Aberystwyth University and Gamma Remote Sensing AG.
Table 15. Validation results per biomass range using LiDAR-based and CoFor AGB data spatially aggregated to 0.1° cells for the 2010 map.
AGBref bin # cells AGBref AGBmap MD 30'1
[Mg/ha] count ---------------------[Mg/ha] ---------------------
0-50 30 27 63 36 65
50-100 24 66 83 16 51
100-150 37 130 137 7 45
150-200 51 175 187 11 55
200-250 117 227 240 12 51
250-300 174 276 256 -20 42
300-400 204 333 259 -74 84
>400 25 450 259 -191 204
total 662 257 227 -30 73
Table 16. Validation results per biomass range using LiDAR-based and CoFor AGB data spatially
aggregated to 0.1° cells for the 2017 map.
AGBref bin # cells AGBref AGBmap MD 30'1
[Mg/ha] count ---------------------[Mg/ha] ---------------------
0-50 141 14 42 28 44
50-100 62 77 104 27 47
100-150 63 128 151 24 45
150-200 62 172 187 15 58
200-250 81 226 244 18 55
250-300 93 274 259 -15 44
300-400 72 331 274 -57 65
>400 5 438 270 -167 169
total 579 164 170 5 53

Ref CCI Biomass Product Validation & Intercomparison Report v2
Issue Page Date 2.0 29 17.12.2020
© Aberystwyth University and GAMMA Remote Sensing, 2018 This document is the property of the CCI-Biomass partnership, no part of it shall be reproduced or transmitted without the express prior written
authorization of Aberystwyth University and Gamma Remote Sensing AG.
Table 17. Validation results per biomass range using LiDAR-based and CoFor AGB data spatially aggregated to 0.1° cells for the 2018 map
AGBref bin # cells AGBref AGBmap MD 30'1
[Mg/ha] count ---------------------[Mg/ha] ---------------------
0-50 128 13 32 19 29
50-100 41 77 94 17 41
100-150 45 126 153 27 51
150-200 53 171 192 21 65
200-250 76 225 245 20 55
250-300 93 274 257 -17 44
300-400 58 326 270 -56 62
>400 3 446 265 -181 183
total 497 166 169 3 50
3.4. Summary tables on tier 1-3 comparisons
To facilitate interpretation, the bias and RMSD estimates per map for different AGBref bins differentiated by tier are shown in Table 21 and Table 19, respectively. Figure 7 provides the legend for the colour schemes used in these tables.
Table 21 shows that for the mid-range of AGBref, bias tends to be within 20% of AGBref. The 100-150 bin of tier 2 and the 150-200 Mg/ha bin of tier 3 are exceptions. AGB between 250 and 400 Mg/ha appears to be within 30% of AGBref. However, these are each based on data from a single plot. At the lower and upper ends of the considered AGB range, bias mostly exceeds the 20% threshold. The RMSD exceeds the 20% threshold in all cases but the 250-300 Mg/ha bin for tier 2 and extending until the 300-400 Mg/ha bin for tier 3 (Table 19).
Figure 7. Legend for colour schemes used in summary tables of bias and RMSD.
≥50% 40% 30% 20%
0%
Ref CCI Biomass Product Validation & Intercomparison Report v2
Issue Page Date 2.0 30 17.12.2020
© Aberystwyth University and GAMMA Remote Sensing, 2018 This document is the property of the CCI-Biomass partnership, no part of it shall be reproduced or transmitted without the express prior written
authorization of Aberystwyth University and Gamma Remote Sensing AG.
Table 18. AGB bias [Mg/ha] differentiated per tier and per AGB bin. Colour shading is based on relative bias; legend in Figure 7.
AGB bin ----------------------------------------- Original resolution ------------------------------------- 0.1° cells tier 1
Tier 1 Tier 2 Tier 3
2010 2017 2018 2010 2017 2018 2010 2017 2018 2010 2017 2018 0-50 22 25 23 58 42 41 - - - 10 10 8
50-100 17 9 9 62 26 31 - - - 10 3 3 100-150 3 -1 -2 74 67 74 161 - - 16 2 0 150-200 -22 -17 -16 31 37 50 - 142 138 24 43 43 200-250 -42 -35 -33 -5 -15 -6 -30 -30 -40 -3 15 15 250-300 -69 -55 -52 -16 -29 -30 -16 6 2 -24 -28 -28 300-400 -119 -103 -100 -109 -97 -92 -72 -54 -77 -77 -62 -60
>400 -489 -481 -474 -296 -300 -330 -139 -132 -142 -335 -344 -344
Table 19. Root mean square difference (RMSD) differentiated per tier and per AGB bin.
----------------------------------------- Original resolution ------------------------------------- 0.1° cells tier 1 Tier 1 Tier 2 Tier 3
2010 2017 2018 2010 2017 2018 2010 2017 2018 2010 2017 2018 0-50 47 47 47 99 82 76 - - - 26 24 23
50-100 59 51 52 102 92 97 - - 34 27 27 100-150 74 72 73 106 108 115 161 - - 83 59 60 150-200 90 90 90 72 85 94 - 142 138 94 102 108 200-250 103 101 103 76 92 91 86 73 72 84 89 96 250-300 118 109 109 70 79 78 31 14 6 81 64 68 300-400 153 141 139 122 116 116 81 66 84 110 103 107
>400 826 832 822 354 371 403 139 133 143 430 437 437
3.5. Assessments by ecoregion
To allow assessments of validation results over different ecoregions, spatially aggregated comparisons of AGBref and AGMmap were stratified by biomes (Dinerstein et al., 2017). Results are presented in Figures 8-10 and in Appendix B. Several strata had limited data or no data at all (e.g., deserts, flooded grassland, etc.). These cases are not included here.
For the boreal forests, mangroves, temperate grasslands, savannahs and shrublands, and tropical and subtropical grasslands, savannahs and shrublands biomes, reasonable fits with minor over-predictions are found in the lower AGB ranges. Map over-prediction is least observed in temperate broadleaf and mixed forests, while map under-prediction is most present in tropical and subtropical dry broadleaf forest. Note that data in the dry tropical regions are limited, which hampers drawing solid conclusions. Spikes of map over-prediction were also found in the Mediterranean forests, woodland and scrub around the 200Mg/ha bin, particularly in the 2017 and 2018 maps. The AGBref density at which under-prediction starts differs per biome. For the boreal forests and tundra, saturation of AGBmap occurs at approximately 100 Mg/ha, for example. The strong similarity of results for the temperate broadleaf and mixed forests biome (Figures 8-10) with those of the spatially aggregated results obtained with the tier 1 data (Figure 5) was already mentioned above.
Ref CCI Biomass Product Validation & Intercomparison Report v2
Issue Page Date 2.0 31 17.12.2020
© Aberystwyth University and GAMMA Remote Sensing, 2018 This document is the property of the CCI-Biomass partnership, no part of it shall be reproduced or transmitted without the express prior written
authorization of Aberystwyth University and Gamma Remote Sensing AG.
Figure 8. Comparisons between AGBref and the 2010 AGB map per biome (Dinerstein et al., 2017) using all available data binned
over 25 Mg/ha wide biomass ranges with whiskers representing the interquartile range of mapped biomass values and symbol size representing the number of 0.1° cells per biomass range.

Ref CCI Biomass Product Validation & Intercomparison Report v1
Issue Page Date 1.0 32 03.11.2019
© Aberystwyth University and GAMMA Remote Sensing, 2018 This document is the property of the CCI-Biomass partnership, no part of it shall be reproduced or transmitted without the
express prior written authorization of Aberystwyth University and Gamma Remote Sensing AG.
Figure 9. Comparisons between AGBref and the 2017 AGB map per biome (Dinerstein et al., 2017) using all
available data binned over 25 Mg/ha wide biomass ranges with whiskers representing the interquartile range of mapped biomass values and symbol size representing the number of 0.1° cells per biomass range.
Ref CCI Biomass Product Validation & Intercomparison Report v1
Issue Page Date 1.0 33 03.11.2019
© Aberystwyth University and GAMMA Remote Sensing, 2018 This document is the property of the CCI-Biomass partnership, no part of it shall be reproduced or transmitted without the
express prior written authorization of Aberystwyth University and Gamma Remote Sensing AG.
Figure 10. Comparisons between AGBref and the 2018 AGB map per biome (Dinerstein et al., 2017) using all
available data binned over 25 Mg/ha wide biomass ranges with whiskers representing the interquartile range of mapped biomass values and symbol size representing the number of 0.1° cells per biomass range.
Ref CCI Biomass Product Validation & Intercomparison Report v1
Issue Page Date 1.0 34 03.11.2019
© Aberystwyth University and GAMMA Remote Sensing, 2018 This document is the property of the CCI-Biomass partnership, no part of it shall be reproduced or transmitted without the
express prior written authorization of Aberystwyth University and Gamma Remote Sensing AG.
3.6. Summary tables of the assessments by ecoregion
To facilitate interpretation per AGB map, the bias and RMSD estimates for different AGBref bins differentiated by biome are shown from Table 20 to Table 25.
The tables re-emphasize our overall finding that in the lower and higher biomass ranges the bias and RMSD are larger than for the mid-ranges. The bias for the mid-ranges for most biomes is around or below 20%, while the RMSD is above 20%.
The quantity of available reference information varies for different regions and there is lower confidence for some with limited reference data, including the (sub-)tropical dry forests and grasslands, mangroves, temperate grasslands and tundra.

© Aberystwyth University and GAMMA Remote Sensing, 2018 This document is the property of the CCI-Biomass partnership, no part of it shall be reproduced or transmitted without the express prior written authorization of Aberystwyth University and Gamma
Remote Sensing AG.
Table 20. AGB bias [Mg/ha] differentiated per biome and per AGB bin for the 2010 map. Colour shading is based the legend shown in Figure 7.
AGBref
[Mg/ha]
0-50 30 21 1 30 10 108 17 32 21 50-100 7 -14 14 11 17 50 -5 14 -3
100-150 -38 64 34 27 41 27 -11 -4 -35 150-200 - - 26 37 -23 -41 33 9 - 200-250 - - -7 0 - -88 1 20 - 250-300 - - -36 -39 - -67 -28 -18 - 300-400 - - -85 -33 - - -76 -84 -
>400 - - - -333 - - -209 -171 - Total 16 9 3 9 15 41 -8 -38 11
Table 21. Root mean square difference (RMSD) differentiated per biome and per AGB bin for the 2010 map. Colour shading is based the legend shown in Figure 7; column headings are as above.
0-50 32 47 15 37 25 120 41 61 28 50-100 16 26 37 35 55 73 43 61 25
100-150 40 64 101 90 89 61 58 59 59 150-200 - - 94 100 23 67 73 77 - 200-250 - - 87 99 - 93 59 54 - 250-300 - - 91 102 - 73 50 46 - 300-400 - - 96 96 - - 89 95 -
>400 - - - 429 - - 213 176 - Total 27 41 26 92 45 86 58 82 29
AGB
Borea
lMan
grove
Medite
rrane
an
Tempe
rate b
roadle
af/mixe
d
Tempe
rate g
rassla
nds,
savann
as and
shrub
lands
Tropic
al/su
btrop
ical d
ry
broad
leaf
tropic
al and
subtr
opical
grassl
ands
Tropic
al and
subtr
opica
l mois
t
broad
leaf fo
rest
Tund
raAGB
© Aberystwyth University and GAMMA Remote Sensing, 2018 This document is the property of the CCI-Biomass partnership, no part of it shall be reproduced or transmitted without the express prior written authorization of Aberystwyth University and Gamma
Remote Sensing AG.
Table 22. AGB bias [Mg/ha] differentiated per biome and per AGB bin for the 2017 map. Colour shading is based the legend shown in Figure 7.
AGBref
[Mg/ha]
0-50 26 10 3 7 3 76 4 13 13 50-100 7 -16 1 2 -31 53 -20 -5 -7
100-150 -33 35 26 5 -56 21 -7 19 -55 150-200 - - 90 48 - -36 20 26 - 200-250 - - 76 12 - -70 14 7 - 250-300 - - -21 -13 - -75 -33 -19 - 300-400 - - - -21 - - -77 -82 -
>400 - - - -341 - - -214 -197 - Total 12 -7 7 -6 -6 23 -25 -22 -1
Table 23. Root mean square difference (RMSD) differentiated per biome and per AGB bin for the 2017 map. Colour shading is based the legend shown in Figure 7; column headings are as above.
0-50 29 12 19 20 8 84 36 29 19 50-100 17 31 27 29 33 76 32 29 20
100-150 37 35 69 63 56 42 48 54 66 150-200 - - 137 99 - 53 72 85 - 200-250 - - 133 93 - 72 67 61 - 250-300 - - 84 77 - 78 64 44 - 300-400 - - - 77 - - 91 94 -
>400 - - - 436 - - 226 210 - Total 24 29 38 95 20 65 66 75 27
AGB
Borea
lMan
grove
Medite
rrane
an
Tempe
rate b
roadle
af/mixe
d
Tempe
rate g
rassla
nds,
savann
as and
shrub
lands
Tropic
al/su
btrop
ical d
ry
broad
leaf
tropic
al and
subtr
opical
grassl
ands
Tropic
al and
subtr
opica
l mois
t
broad
leaf fo
rest
Tund
raAGB
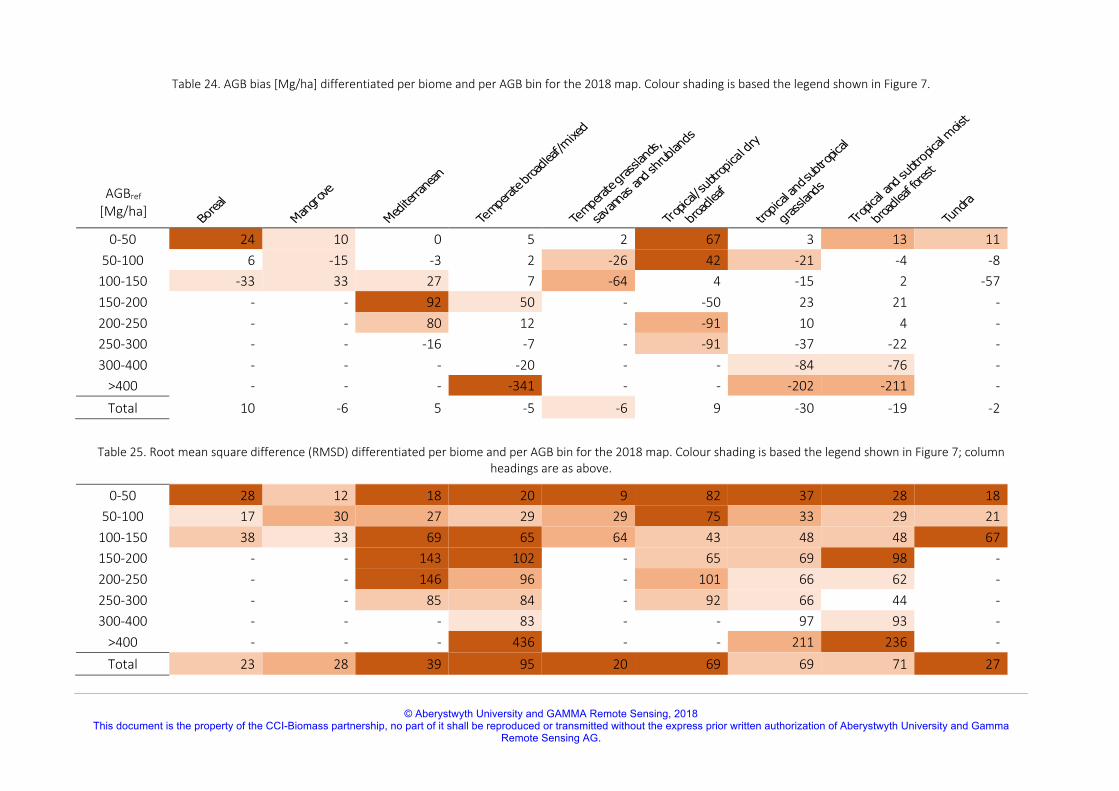
© Aberystwyth University and GAMMA Remote Sensing, 2018 This document is the property of the CCI-Biomass partnership, no part of it shall be reproduced or transmitted without the express prior written authorization of Aberystwyth University and Gamma
Remote Sensing AG.
Table 24. AGB bias [Mg/ha] differentiated per biome and per AGB bin for the 2018 map. Colour shading is based the legend shown in Figure 7.
AGBref
[Mg/ha]
0-50 24 10 0 5 2 67 3 13 11 50-100 6 -15 -3 2 -26 42 -21 -4 -8
100-150 -33 33 27 7 -64 4 -15 2 -57 150-200 - - 92 50 - -50 23 21 - 200-250 - - 80 12 - -91 10 4 - 250-300 - - -16 -7 - -91 -37 -22 - 300-400 - - - -20 - - -84 -76 -
>400 - - - -341 - - -202 -211 - Total 10 -6 5 -5 -6 9 -30 -19 -2
Table 25. Root mean square difference (RMSD) differentiated per biome and per AGB bin for the 2018 map. Colour shading is based the legend shown in Figure 7; column headings are as above.
0-50 28 12 18 20 9 82 37 28 18 50-100 17 30 27 29 29 75 33 29 21
100-150 38 33 69 65 64 43 48 48 67 150-200 - - 143 102 - 65 69 98 - 200-250 - - 146 96 - 101 66 62 - 250-300 - - 85 84 - 92 66 44 - 300-400 - - - 83 - - 97 93 -
>400 - - - 436 - - 211 236 - Total 23 28 39 95 20 69 69 71 27
AGB
Borea
lMan
grove
Medite
rrane
an
Tempe
rate b
roadle
af/mixe
d
Tempe
rate g
rassla
nds,
savann
as and
shrub
lands
Tropic
al/su
btrop
ical d
ry
broad
leaf
tropic
al and
subtr
opical
grassl
ands
Tropic
al and
subtr
opica
l mois
t
broad
leaf fo
rest
Tund
raAGB
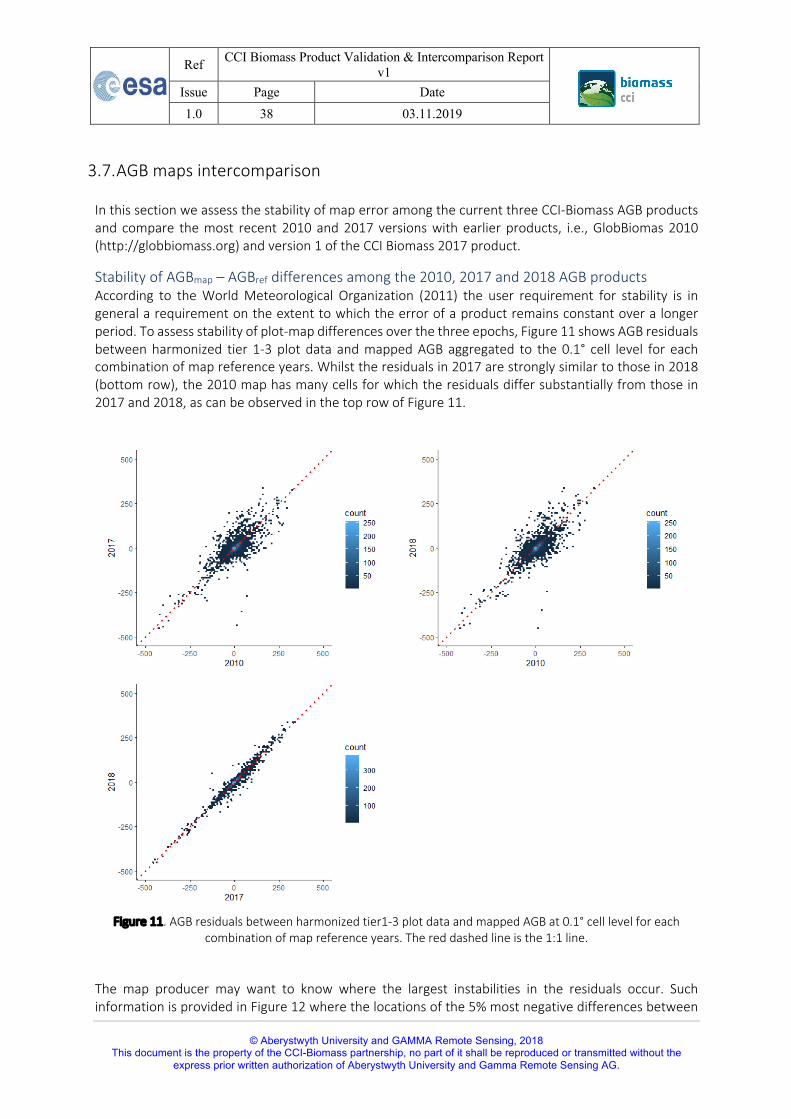
Ref CCI Biomass Product Validation & Intercomparison Report v1
Issue Page Date 1.0 38 03.11.2019
© Aberystwyth University and GAMMA Remote Sensing, 2018 This document is the property of the CCI-Biomass partnership, no part of it shall be reproduced or transmitted without the
express prior written authorization of Aberystwyth University and Gamma Remote Sensing AG.
3.7. AGB maps intercomparison
In this section we assess the stability of map error among the current three CCI-Biomass AGB products and compare the most recent 2010 and 2017 versions with earlier products, i.e., GlobBiomas 2010 (http://globbiomass.org) and version 1 of the CCI Biomass 2017 product.
Stability of AGBmap – AGBref differences among the 2010, 2017 and 2018 AGB products According to the World Meteorological Organization (2011) the user requirement for stability is in general a requirement on the extent to which the error of a product remains constant over a longer period. To assess stability of plot-map differences over the three epochs, Figure 11 shows AGB residuals between harmonized tier 1-3 plot data and mapped AGB aggregated to the 0.1° cell level for each combination of map reference years. Whilst the residuals in 2017 are strongly similar to those in 2018 (bottom row), the 2010 map has many cells for which the residuals differ substantially from those in 2017 and 2018, as can be observed in the top row of Figure 11.
Figure 11. AGB residuals between harmonized tier1-3 plot data and mapped AGB at 0.1° cell level for each combination of map reference years. The red dashed line is the 1:1 line.
The map producer may want to know where the largest instabilities in the residuals occur. Such information is provided in Figure 12 where the locations of the 5% most negative differences between

Ref CCI Biomass Product Validation & Intercomparison Report v1
Issue Page Date 1.0 39 03.11.2019
© Aberystwyth University and GAMMA Remote Sensing, 2018 This document is the property of the CCI-Biomass partnership, no part of it shall be reproduced or transmitted without the
express prior written authorization of Aberystwyth University and Gamma Remote Sensing AG.
the 2010 and 2017 products (2010 – 2017; i.e., points above the 1:1 diagonal in Figure 11) are plotted as red circles whilst the 5% largest positive differences (i.e., points below the 1:1 diagonal) are shown by blue crosses. Several sites have entirely either large positive or large negative differences but in other places, such as east Australia, Madagascar, the northern Balkans and Mexico (Yucatán), both extremes occur close to one another. Figure 13 is a virtually identical figure showing the locations of cells with the most extreme differences between 2010 and 2018 residuals while Figure 14 does so for the 2017 and 2018 residuals. The latter figure has a different pattern of highs and lows but, with additional nearby occurrences of extremes in Gabon.
Figure 12. Locations of 0.1° cells with the most extreme differences between residuals in the 2010 and 2017 AGB products (2010 – 2017). The 5% cells with the most negative differences (i.e., 2017 > 2010) are indicated in red
whilst the 5% largest positive differences (i.e., 2017 < 2010) are shown in blue.
Figure 13. Locations of 0.1° cells with the most extreme differences between residuals in the 2010 and 2018 AGB products (2010 – 2018). The 5% cells with the most negative differences (i.e., 2018 > 2010)
are indicated in red whilst the 5% largest positive differences (i.e., 2018 < 2010) are shown in blue.
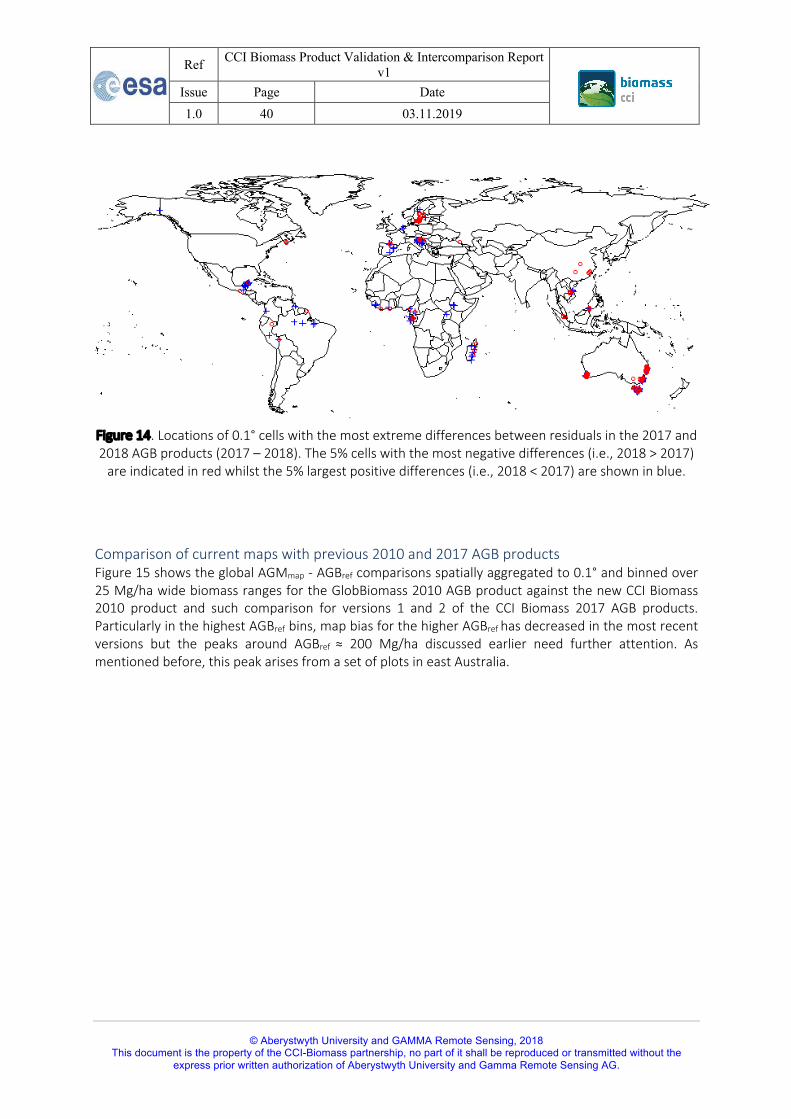
Ref CCI Biomass Product Validation & Intercomparison Report v1
Issue Page Date 1.0 40 03.11.2019
© Aberystwyth University and GAMMA Remote Sensing, 2018 This document is the property of the CCI-Biomass partnership, no part of it shall be reproduced or transmitted without the
express prior written authorization of Aberystwyth University and Gamma Remote Sensing AG.
Figure 14. Locations of 0.1° cells with the most extreme differences between residuals in the 2017 and 2018 AGB products (2017 – 2018). The 5% cells with the most negative differences (i.e., 2018 > 2017)
are indicated in red whilst the 5% largest positive differences (i.e., 2018 < 2017) are shown in blue.
Comparison of current maps with previous 2010 and 2017 AGB products Figure 15 shows the global AGMmap - AGBref comparisons spatially aggregated to 0.1° and binned over 25 Mg/ha wide biomass ranges for the GlobBiomass 2010 AGB product against the new CCI Biomass 2010 product and such comparison for versions 1 and 2 of the CCI Biomass 2017 AGB products. Particularly in the highest AGBref bins, map bias for the higher AGBref has decreased in the most recent versions but the peaks around AGBref ≈ 200 Mg/ha discussed earlier need further attention. As mentioned before, this peak arises from a set of plots in east Australia.

Ref CCI Biomass Product Validation & Intercomparison Report v1
Issue Page Date 1.0 41 03.11.2019
© Aberystwyth University and GAMMA Remote Sensing, 2018 This document is the property of the CCI-Biomass partnership, no part of it shall be reproduced or transmitted without the
express prior written authorization of Aberystwyth University and Gamma Remote Sensing AG.
Figure 15. Global AGMmap - AGBref comparisons based on inverse variance weighted tier 1-3 plot data spatially
aggregated to 0.1° cells.
3.8. Within-pixel sampling error
Using the —forest only— LiDAR derived AGB data from forest sites in Remningstorp, Sweden (Ulander et al., 2011), and Lope, Gabon (Hajnsek et al., 2017) the variograms shown in Figure 16 were estimated. The Remningstorp variogram was modelled by two exponential structures with partial sills of 3579 and 1899 Mg2/ha2 and range parameters of 95 and 531 m, respectively. The Lope variogram was modelled by a 4053 Mg2/ha2 nugget and a single exponential structure with partial sill of 10553 Mg2/ha2 and a range parameter of 85 m. Note that the effective range of an exponential variogram is approximately three times the range parameter.
Not surprisingly, the tropical high biomass Lope site has much larger short-range spatial variation than the boreal Remningstorp site (note the different scales on the y-axes).
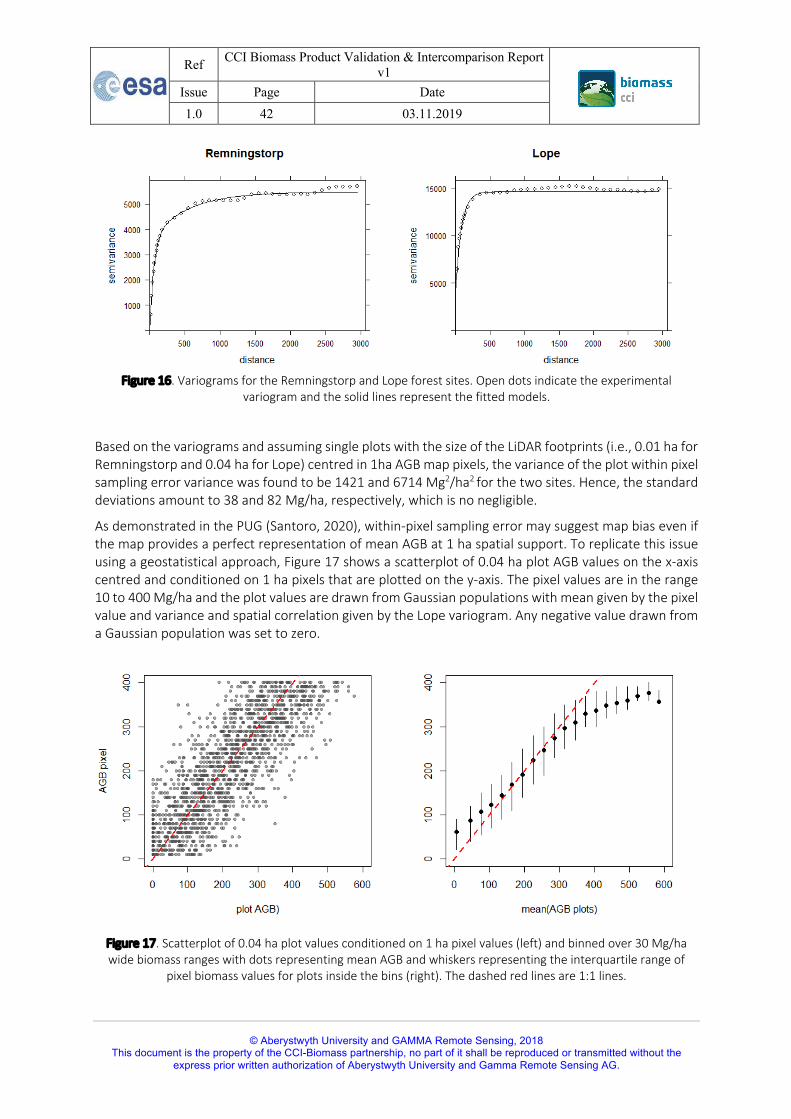
Ref CCI Biomass Product Validation & Intercomparison Report v1
Issue Page Date 1.0 42 03.11.2019
© Aberystwyth University and GAMMA Remote Sensing, 2018 This document is the property of the CCI-Biomass partnership, no part of it shall be reproduced or transmitted without the
express prior written authorization of Aberystwyth University and Gamma Remote Sensing AG.
Figure 16. Variograms for the Remningstorp and Lope forest sites. Open dots indicate the experimental
variogram and the solid lines represent the fitted models.
Based on the variograms and assuming single plots with the size of the LiDAR footprints (i.e., 0.01 ha for Remningstorp and 0.04 ha for Lope) centred in 1ha AGB map pixels, the variance of the plot within pixel sampling error variance was found to be 1421 and 6714 Mg2/ha2 for the two sites. Hence, the standard deviations amount to 38 and 82 Mg/ha, respectively, which is no negligible.
As demonstrated in the PUG (Santoro, 2020), within-pixel sampling error may suggest map bias even if the map provides a perfect representation of mean AGB at 1 ha spatial support. To replicate this issue using a geostatistical approach, Figure 17 shows a scatterplot of 0.04 ha plot AGB values on the x-axis centred and conditioned on 1 ha pixels that are plotted on the y-axis. The pixel values are in the range 10 to 400 Mg/ha and the plot values are drawn from Gaussian populations with mean given by the pixel value and variance and spatial correlation given by the Lope variogram. Any negative value drawn from a Gaussian population was set to zero.
Figure 17. Scatterplot of 0.04 ha plot values conditioned on 1 ha pixel values (left) and binned over 30 Mg/ha wide biomass ranges with dots representing mean AGB and whiskers representing the interquartile range of
pixel biomass values for plots inside the bins (right). The dashed red lines are 1:1 lines.
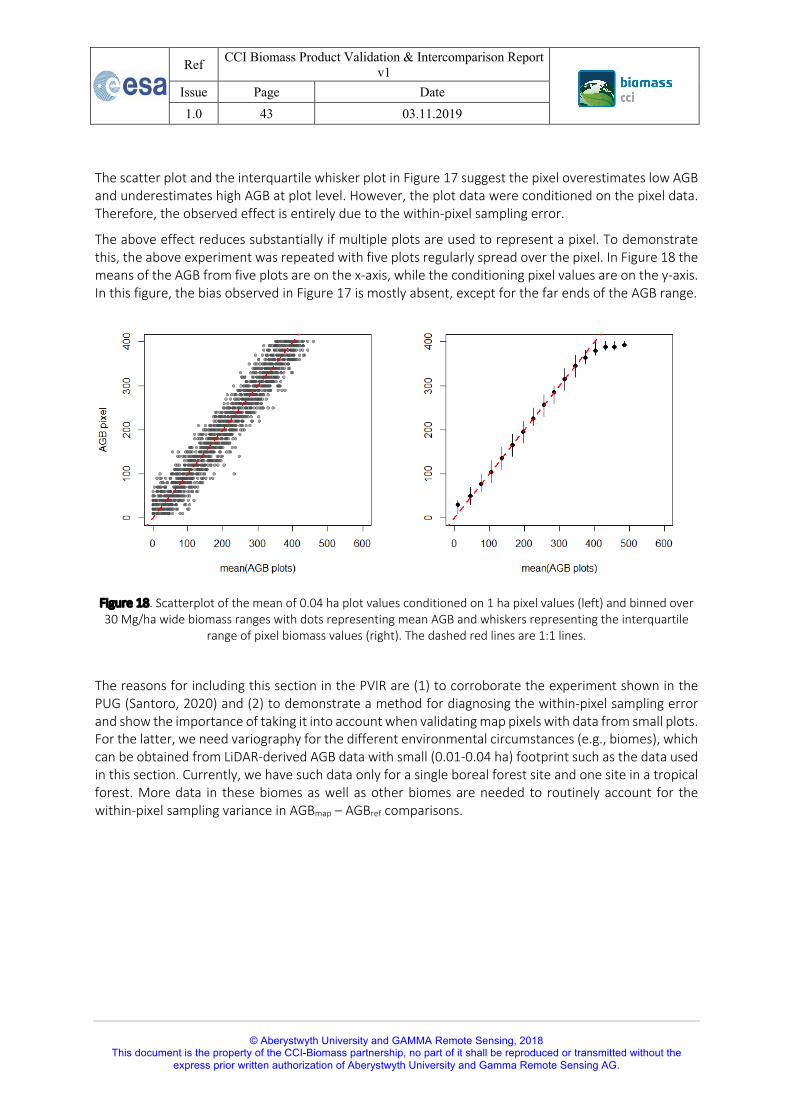
Ref CCI Biomass Product Validation & Intercomparison Report v1
Issue Page Date 1.0 43 03.11.2019
© Aberystwyth University and GAMMA Remote Sensing, 2018 This document is the property of the CCI-Biomass partnership, no part of it shall be reproduced or transmitted without the
express prior written authorization of Aberystwyth University and Gamma Remote Sensing AG.
The scatter plot and the interquartile whisker plot in Figure 17 suggest the pixel overestimates low AGB and underestimates high AGB at plot level. However, the plot data were conditioned on the pixel data. Therefore, the observed effect is entirely due to the within-pixel sampling error.
The above effect reduces substantially if multiple plots are used to represent a pixel. To demonstrate this, the above experiment was repeated with five plots regularly spread over the pixel. In Figure 18 the means of the AGB from five plots are on the x-axis, while the conditioning pixel values are on the y-axis. In this figure, the bias observed in Figure 17 is mostly absent, except for the far ends of the AGB range.
Figure 18. Scatterplot of the mean of 0.04 ha plot values conditioned on 1 ha pixel values (left) and binned over 30 Mg/ha wide biomass ranges with dots representing mean AGB and whiskers representing the interquartile
range of pixel biomass values (right). The dashed red lines are 1:1 lines.
The reasons for including this section in the PVIR are (1) to corroborate the experiment shown in the PUG (Santoro, 2020) and (2) to demonstrate a method for diagnosing the within-pixel sampling error and show the importance of taking it into account when validating map pixels with data from small plots. For the latter, we need variography for the different environmental circumstances (e.g., biomes), which can be obtained from LiDAR-derived AGB data with small (0.01-0.04 ha) footprint such as the data used in this section. Currently, we have such data only for a single boreal forest site and one site in a tropical forest. More data in these biomes as well as other biomes are needed to routinely account for the within-pixel sampling variance in AGBmap – AGBref comparisons.
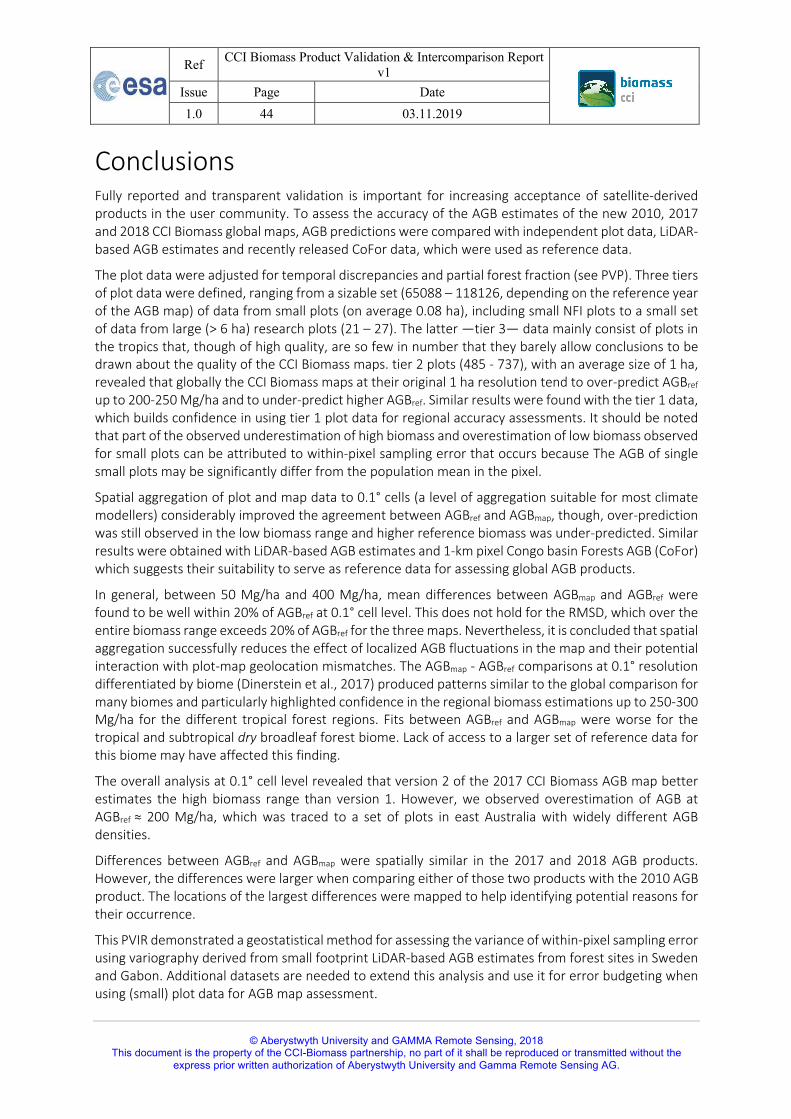
Ref CCI Biomass Product Validation & Intercomparison Report v1
Issue Page Date 1.0 44 03.11.2019
© Aberystwyth University and GAMMA Remote Sensing, 2018 This document is the property of the CCI-Biomass partnership, no part of it shall be reproduced or transmitted without the
express prior written authorization of Aberystwyth University and Gamma Remote Sensing AG.
Conclusions Fully reported and transparent validation is important for increasing acceptance of satellite-derived products in the user community. To assess the accuracy of the AGB estimates of the new 2010, 2017 and 2018 CCI Biomass global maps, AGB predictions were compared with independent plot data, LiDAR-based AGB estimates and recently released CoFor data, which were used as reference data.
The plot data were adjusted for temporal discrepancies and partial forest fraction (see PVP). Three tiers of plot data were defined, ranging from a sizable set (65088 – 118126, depending on the reference year of the AGB map) of data from small plots (on average 0.08 ha), including small NFI plots to a small set of data from large (> 6 ha) research plots (21 – 27). The latter —tier 3— data mainly consist of plots in the tropics that, though of high quality, are so few in number that they barely allow conclusions to be drawn about the quality of the CCI Biomass maps. tier 2 plots (485 - 737), with an average size of 1 ha, revealed that globally the CCI Biomass maps at their original 1 ha resolution tend to over-predict AGBref up to 200-250 Mg/ha and to under-predict higher AGBref. Similar results were found with the tier 1 data, which builds confidence in using tier 1 plot data for regional accuracy assessments. It should be noted that part of the observed underestimation of high biomass and overestimation of low biomass observed for small plots can be attributed to within-pixel sampling error that occurs because The AGB of single small plots may be significantly differ from the population mean in the pixel.
Spatial aggregation of plot and map data to 0.1° cells (a level of aggregation suitable for most climate modellers) considerably improved the agreement between AGBref and AGBmap, though, over-prediction was still observed in the low biomass range and higher reference biomass was under-predicted. Similar results were obtained with LiDAR-based AGB estimates and 1-km pixel Congo basin Forests AGB (CoFor) which suggests their suitability to serve as reference data for assessing global AGB products.
In general, between 50 Mg/ha and 400 Mg/ha, mean differences between AGBmap and AGBref were found to be well within 20% of AGBref at 0.1° cell level. This does not hold for the RMSD, which over the entire biomass range exceeds 20% of AGBref for the three maps. Nevertheless, it is concluded that spatial aggregation successfully reduces the effect of localized AGB fluctuations in the map and their potential interaction with plot-map geolocation mismatches. The AGBmap - AGBref comparisons at 0.1° resolution differentiated by biome (Dinerstein et al., 2017) produced patterns similar to the global comparison for many biomes and particularly highlighted confidence in the regional biomass estimations up to 250-300 Mg/ha for the different tropical forest regions. Fits between AGBref and AGBmap were worse for the tropical and subtropical dry broadleaf forest biome. Lack of access to a larger set of reference data for this biome may have affected this finding.
The overall analysis at 0.1° cell level revealed that version 2 of the 2017 CCI Biomass AGB map better estimates the high biomass range than version 1. However, we observed overestimation of AGB at AGBref ≈ 200 Mg/ha, which was traced to a set of plots in east Australia with widely different AGB densities.
Differences between AGBref and AGBmap were spatially similar in the 2017 and 2018 AGB products. However, the differences were larger when comparing either of those two products with the 2010 AGB product. The locations of the largest differences were mapped to help identifying potential reasons for their occurrence.
This PVIR demonstrated a geostatistical method for assessing the variance of within-pixel sampling error using variography derived from small footprint LiDAR-based AGB estimates from forest sites in Sweden and Gabon. Additional datasets are needed to extend this analysis and use it for error budgeting when using (small) plot data for AGB map assessment.
Ref CCI Biomass Product Validation & Intercomparison Report v1
Issue Page Date 1.0 45 03.11.2019
© Aberystwyth University and GAMMA Remote Sensing, 2018 This document is the property of the CCI-Biomass partnership, no part of it shall be reproduced or transmitted without the
express prior written authorization of Aberystwyth University and Gamma Remote Sensing AG.
Acknowledgements We are grateful to all data contributors (see Appendix A) for providing forest plot data for the independent validation of the CCI Biomass maps.

Ref CCI Biomass Product Validation & Intercomparison Report v1
Issue Page Date 1.0 46 03.11.2019
© Aberystwyth University and GAMMA Remote Sensing, 2018 This document is the property of the CCI-Biomass partnership, no part of it shall be reproduced or transmitted without the
express prior written authorization of Aberystwyth University and Gamma Remote Sensing AG.
References (including references from Appendix A)
Avitabile, V., Baccini, A., Friedl, M. A., & Schmullius, C. (2012). Capabilities and limitations of Landsat and land cover data for aboveground woody biomass estimation of Uganda. Remote Sensing of Environment, 117, 366-380. https://doi.org/10.1016/j.rse.2011.10.012.
Avitabile, V., Schultz, M., Herold, N., de Bruin, S., Pratihast, A. K., Manh, C. P., . . . Herold, M. (2016). Carbon emissions from land cover change in Central Vietnam. Carbon Management, 7(5-6), 333-346. doi:10.1080/17583004.2016.1254009
Brown, S., Gillespie, A. J. R., & Lugo, A. E. (1989). Biomass Estimation Methods for Tropical Forests with Applications to Forest Inventory Data. Forest Science, 35(4), 881-902. https://doi.org/10.1093/forestscience/35.4.881.
Carreiras, J. M. B., Vasconcelos, M. J., & Lucas, R. M. (2012). Understanding the relationship between aboveground biomass and ALOS PALSAR data in the forests of Guinea-Bissau (West Africa). Remote Sensing of Environment, 121, 426-442. https://doi.org/10.1016/j.rse.2012.02.012.
Clark, D. B., & Clark, D. A. (2000). Landscape-scale variation in forest structure and biomass in a tropical rain forest. Forest Ecology and Management, 137(1), 185-198. https://doi.org/10.1016/S0378-1127(99)00327-8.
de Bruin, S., Herold, M., & Araza, A. (2019a). CCI Biomass Product Validation Plan, Year 1, Version 1. Retrieved from http://cci.esa.int/sites/default/files/biomass%20D2.5%20Product%20Validation%20Plan%20%28PVP%29%20V1.0.pdf.
de Bruin, S., Herold, M., & Araza, A. (2019b). CCI Biomass Product Validation & Intercomparison Report Year 1 Version 1.0. https://climate.esa.int/sites/default/files/biomass_D4.1_Product_Validation_%26_Intercomparison_Report_V1.1.pdf.
de Bruin, S., Herold, M., & Araza, A., Lucas, R. (2020). CCI Biomass Product Validation Plan, Year 2, Version 2. https://climate.esa.int/sites/default/files/Biomass_D2.5_Product_Validation_Plan_V2.0.pdf.
DeVries, B., Avitabile, V., Kooistra, L., & Herold, M. (2012). Monitoring the impact of REDD+ implementation in the Unesco Kafa biosphere reserve, Ethiopia. Paper presented at the Sensing a Changing World, Wageningen. http://www.wageningenur.nl/upload_mm/9/d/c/f80b6db7-9c3c-4957-8717-6fdc6e46e60f_deVries.pdf.
Dinerstein, E., Olson, D., Joshi, A., Vynne, C., Burgess, N. D., Wikramanayake, E., . . . Saleem, M. (2017). An Ecoregion-Based Approach to Protecting Half the Terrestrial Realm. BioScience, 67(6), 534-545. https://doi.org/10.1093/biosci/bix014.
Hajnsek, I., Pardini, M., Jäger, M., Horn, R., Kim, J.S., Jörg, H., Papathanassiou, K., Dubois-Fernandez, P., Dupuis, X., Wasik, V. (2017). Technical Assistance for the Development of Airborne SAR and Geophysical Measurements During the AFRISAR Experiment. Final Report, Deliverable DD-4. pp. 152.
Hansen, M. C., Potapov, P. V., Moore, R., Hancher, M., Turubanova, S. A., Tyukavina, A., . . . Townshend, J. R. G. (2013). High-Resolution Global Maps of 21st-Century Forest Cover Change. Science, 342(6160), 850-853. https://doi.org/10.1126/science.1244693.
Hijmans, R. J. (2017). raster: Geographic Data Analysis and Modeling (Version 2.6). Retrieved from https://CRAN.R-project.org/package=raster.
Hirsh, F., Jourget, J. G., Feintrenie, L., Bayol, N., & Ebaá Atyi, R. (2013). Projet pilote REDD+ de la Lukénie. Retrieved from Bogor, Indonesia: https://agritrop.cirad.fr/572060/1/document_572060.pdf.
Horn, B. (1981). Hill shading and the reflectance map. Proceedings of the IEEE, 69, 14-47. doi:10.1109/PROC.1981.11918 IPPC. (2006). IPCC Guidelines for National Greenhouse Gas Inventories. https://www.ipcc.ch/report/2006-ipcc-guidelines-for-
national-greenhouse-gas-inventories/ IPCC. (2019). 2019 Refinement to the 2006 IPCC Guidelines for National Greenhouse Gas Inventories. (table 4.9).
https://www.ipcc.ch/report/2019-refinement-to-the-2006-ipcc-guidelines-for-national-greenhouse-gas-inventories/
Kyriakidis, P.C. (2004). A Geostatistical Framework for Area-to-Point Spatial Interpolation. Geographical Analysis, 36: 259-289. https://doi.org/10.1111/j.1538-4632.2004.tb01135.x.
Labrière, N., Tao, S., Chave, J., Scipal, K., Toan, T. L., Abernethy, K., . . . Saatchi, S. (2018). In SituReference Datasets From the TropiSAR and AfriSAR Campaigns in Support of Upcoming Spaceborne Biomass Missions. IEEE Journal of Selected Topics in Applied Earth Observations and Remote Sensing, 11(10), 3617-3627. doi:10.1109/JSTARS.2018.2851606
Labrière, N., & Chave, J. (2020a) CCI Biomass project – In situ datasets: Processing and validation of Sustainable Landscape Brazil data (CCI Biomass internal report).
Labrière, N., & Chave, J. (2020b) CCI Biomass project – In situ datasets: Processing and validation of NEON data (USA) (CCI Biomass internal report).
Labrière, N., & Chave, J. (2020c) In situ datasets: Processing and validation of TERN data (CCI Biomass internal report). Lewis, S. L., Sonké, B., Sunderland, T., Begne, S. K., Lopez-Gonzalez, G., van der Heijden, G. M. F., . . . Zemagho, L. (2013). Above-
ground biomass and structure of 260 African tropical forests. Philosophical Transactions of the Royal Society B: Biological Sciences, 368(1625), 20120295. https://doi.org/10.1098/rstb.2012.0295.
Mello, L. N. C., Sales, M. H. R., & Rosa, L. P. (2016). Analysis of results of biomass forest inventory in northeastern Amazon for development of REDD+ carbon project. Anais da Academia Brasileira de Ciências, 88, 55-64.

Ref CCI Biomass Product Validation & Intercomparison Report v1
Issue Page Date 1.0 47 03.11.2019
© Aberystwyth University and GAMMA Remote Sensing, 2018 This document is the property of the CCI-Biomass partnership, no part of it shall be reproduced or transmitted without the
express prior written authorization of Aberystwyth University and Gamma Remote Sensing AG.
Mitchard, E. T. A., Saatchi, S. S., Lewis, S. L., Feldpausch, T. R., Gerard, F. F., Woodhouse, I. H., & Meir, P. (2011). Comment on ‘A first map of tropical Africa’s above-ground biomass derived from satellite imagery’. Environmental Research Letters, 6(4), 049001. https://doi.org/10.1088/1748-9326/6/4/049001.
Mitchard, E. T. A., Saatchi, S. S., Woodhouse, I. H., Nangendo, G., Ribeiro, N. S., Williams, M., . . . Meir, P. (2009). Using satellite radar backscatter to predict above-ground woody biomass: A consistent relationship across four different African landscapes. Geophysical Research Letters, 36(23). https://doi.org/10.1029/2009gl040692.
Morel, A. C., Saatchi, S. S., Malhi, Y., Berry, N. J., Banin, L., Burslem, D., . . . Ong, R. C. (2011). Estimating aboveground biomass in forest and oil palm plantation in Sabah, Malaysian Borneo using ALOS PALSAR data. Forest Ecology and Management, 262(9), 1786-1798. https://doi.org/10.1016/j.foreco.2011.07.008.
Paul, K. I., Roxburgh, S. H., Chave, J., England, J. R., Zerihun, A., Specht, A., . . . Sinclair, J. (2016). Testing the generality of above-ground biomass allometry across plant functional types at the continent scale. Global Change Biology, 22(6), 2106-2124. https://doi.org/10.1111/gcb.13201.
Pebesma, E.J. (2004). Multivariable geostatistics in S: the gstat package. Computers & Geosciences, 30: 683-691. Ploton, P., Mortier, F., Barbier, N. et al. (2020). A map of African humid tropical forest aboveground biomass derived from
management inventories. Sci Data 7, 221. https://doi.org/10.1038/s41597-020-0561-0. Réjou-Méchain, M., Barbier, N., Couteron, P., Ploton, P., Vincent, G., Herold, M., . . . Pélissier, R. (2019). Upscaling Forest
Biomass from Field to Satellite Measurements: Sources of Errors and Ways to Reduce Them. Surveys in Geophysics. https://doi.org/10.1007/s10712-019-09532-0.
Réjou-Méchain, M., Muller-Landau, H. C., Detto, M., Thomas, S. C., Le Toan, T., Saatchi, S. S., . . . Chave, J. (2014). Local spatial structure of forest biomass and its consequences for remote sensing of carbon stocks. Biogeosciences, 11(23), 6827-6840. https://doi.org/10.5194/bg-11-6827-2014.
Réjou-Méchain, M., Tanguy, A., Piponiot, C., Chave, J., & Hérault, B. (2017). biomass: an r package for estimating above-ground biomass and its uncertainty in tropical forests. Methods in Ecology and Evolution, 8(9), 1163-1167. https://doi.org/10.1111/2041-210X.12753.
Requena Suarez, D., Rozendaal, D. M. A., De Sy, V., Phillips, O. L., Alvarez-Dávila, E., Anderson-Teixeira, K., . . . Herold, M. (2019). Estimating aboveground net biomass change for tropical and subtropical forests: Refinement of IPCC default rates using forest plot data. Global Change Biology, 25(11), 3609-3624. doi:10.1111/gcb.14767
Rozendaal, D. M. A., M. Santoro, D. Schepaschenko, V. Avitabile and M. Herold (2017). DUE GlobBiomass D17 Validation Report, European Space Agency (ESA-ESRIN): 26.
Ryan, C. M., Berry, N. J., & Joshi, N. (2014). Quantifying the causes of deforestation and degradation and creating transparent REDD+ baselines: A method and case study from central Mozambique. Applied Geography, 53, 45-54. https://doi.org/10.1016/j.apgeog.2014.05.014.
Santoro, M., 2020. CCI Biomass Product User Guide, Year 2, Version 2. (CCI Biomass internal report). Schepaschenko, D., Chave, J., Phillips, O. L., Lewis, S. L., Davies, S. J., Réjou-Méchain, M., . . . Zo-Bi, I. C. (2019). The Forest
Observation System, building a global reference dataset for remote sensing of forest biomass. Scientific Data, 6(1), 198. https://doi.org/10.1038/s41597-019-0196-1.
Ulander, L.M.H., Gustavsson, A., Flood, B., Murdin, D., Dubois-Fernandez, P., Dupuis, X., Sandberg, G., Soja, M.J., Eriksson, L.E.B., Fransson, J.E.S., Holmgren, J., Wallerman, J. (2011). BioSAR 2010 - Technical assistance for the development of airborne SAR and geophysical measurements during the BioSAR 2010 experiment.
Vaglio Laurin, G., Hawthorne, W., Chiti, T., Di Paola, A., Cazzolla Gatti, R., Marconi, S., . . . Valentini, R. (2016). Does degradation from selective logging and illegal activities differently impact forest resources? A case study in Ghana. [Does degradation from selective logging and illegal activities differently impact forest resources? A case study in Ghana]. iForest - Biogeosciences and Forestry, 9(3), 354-362. https://doi.org/10.3832/ifor1779-008.
Van Breugel, M., Bongers, F., & Martínez-Ramos, M. (2007). Species Dynamics During Early Secondary Forest Succession: Recruitment, Mortality and Species Turnover. Biotropica, 39(5), 610-619. https://doi.org/10.1111/j.1744-7429.2007.00316.x.
Vieilledent, G., Gardi, O., Grinand, C., Burren, C., Andriamanjato, M., Camara, C., . . . Rakotoarijaona, J.-R. (2016). Bioclimatic envelope models predict a decrease in tropical forest carbon stocks with climate change in Madagascar. Journal of Ecology, 104(3), 703-715. https://doi.org/10.1111/1365-2745.12548.
Willcock, S., Phillips, O. L., Platts, P. J., Balmford, A., Burgess, N. D., Lovett, J. C., . . . Lewis, S. L. (2014). Quantifying and understanding carbon storage and sequestration within the Eastern Arc Mountains of Tanzania, a tropical biodiversity hotspot. Carbon Balance and Management, 9(1), 2. https://doi.org/10.1186/1750-0680-9-2.
World Meteorological Organization (2011). Systematic observation requirements for satellite-based data products for climate: Supplemental details to the satellite-based component of the Implementation Plan for the Global Observing System for Climate in Support of the UNFCCC (2010 Update). https://library.wmo.int/doc_num.php?explnum_id=3710.

© Aberystwyth University and GAMMA Remote Sensing, 2018 This document is the property of the CCI-Biomass partnership, no part of it shall be reproduced or transmitted without the express prior written authorization of Aberystwyth University and Gamma
Remote Sensing AG.
Appendix A - Details on the used forest plot data ID Tier Average
year Average size (ha)
Count Biome URL Paper/
source
Data access
AFR_L 3 2011 25.00 1 Tropical rainforest https://dspace.stir.ac.uk/retrieve/74d3b352-fa46-418f-ba95-728bb33f4cfc/08417912.pdf (Labrière et al., 2018)
open
EU_FOS 3 2014 16.25 1 Tropical rainforest https://www.-ture.com/articles/s41597-019-0196-1?fbclid=IwAR08vLoOm4xEQo4EUdLtoKsnP6nsNIY5CYnfcoqGcS5Z0_UcyaNIr-jcdDg
(Schepaschenko et al., 2019)
open
SAM_L 3 2010 7.65 20 Tropical rainforest https://dspace.stir.ac.uk/retrieve/74d3b352-fa46-418f-ba95-728bb33f4cfc/08417912.pdf (Labrière et al., 2018)
open
AUS1 3 2009 25.00 1 Tropical dry forest http://data.auscover.org.au/xwiki/bin/view/Product+pages/Biomass+Plot+Library (Paul et al., 2016) source-WUR agreement
SAM_RF 3 2008 5.3 10 Tropical rainforest http://www.rainfor.org/en/project/about-rainfor Lopez-Gonzales et al., 2011
Open
AFR_FOS 2 2013 1.00 44 Tropical rainforest https://www.-ture.com/articles/s41597-019-0196-1?fbclid=IwAR08vLoOm4xEQo4EUdLtoKsnP6nsNIY5CYnfcoqGcS5Z0_UcyaNIr-jcdDg
(Schepaschenko et al., 2019)
open
AFR_L 2 2016 1.00 56 Tropical rainforest https://dspace.stir.ac.uk/retrieve/74d3b352-fa46-418f-ba95-728bb33f4cfc/08417912.pdf (Labrière et al., 2018)
open
AUS_FOS 2 2008 1.00 2 Tropical dry forest https://www.-ture.com/articles/s41597-019-0196-1?fbclid=IwAR08vLoOm4xEQo4EUdLtoKsnP6nsNIY5CYnfcoqGcS5Z0_UcyaNIr-jcdDg
(Schepaschenko et al., 2019)
open
CAM_FOS 2 2012 1.01 18 Tropical rainforest https://www.-ture.com/articles/s41597-019-0196-1?fbclid=IwAR08vLoOm4xEQo4EUdLtoKsnP6nsNIY5CYnfcoqGcS5Z0_UcyaNIr-jcdDg
(Schepaschenko et al., 2019)
open
EU_FOS 2 2010 2.23 2 Boreal coniferous forest
https://www.-ture.com/articles/s41597-019-0196-1?fbclid=IwAR08vLoOm4xEQo4EUdLtoKsnP6nsNIY5CYnfcoqGcS5Z0_UcyaNIr-jcdDg
(Schepaschenko et al., 2019)
open
SAM_FOS 2 2011 1.00 23 Tropical rainforest https://www.-ture.com/articles/s41597-019-0196-1?fbclid=IwAR08vLoOm4xEQo4EUdLtoKsnP6nsNIY5CYnfcoqGcS5Z0_UcyaNIr-jcdDg
(Schepaschenko et al., 2019)
open
SAM_L 2 2013 1.04 28 Tropical rainforest https://dspace.stir.ac.uk/retrieve/74d3b352-fa46-418f-ba95-728bb33f4cfc/08417912.pdf (Labrière et al., 2018)
open

© Aberystwyth University and GAMMA Remote Sensing, 2018 This document is the property of the CCI-Biomass partnership, no part of it shall be reproduced or transmitted without the express prior written authorization of Aberystwyth University and Gamma
Remote Sensing AG.
SAM_BAJ 2 2017 1 3 Tropical rainforest https://ieeexplore.ieee.org/abstract/document/8518871 Pacheco-Pasccagaza et al., 2020
source-WUR agreement
SAM_RF 2 2008 1 374 Tropical rainforest http://www.rainfor.org/en/project/about-rainfor Lopez-Gonzales et al., 2011
Open
UK_FOS 2 2015 1.20 1 Tropical rainforest https://www.-ture.com/articles/s41597-019-0196-1?fbclid=IwAR08vLoOm4xEQo4EUdLtoKsnP6nsNIY5CYnfcoqGcS5Z0_UcyaNIr-jcdDg
(Schepaschenko et al., 2019)
open
AFR10 2 2007 1.00 7 Tropical rainforest https://iopscience.iop.org/article/10.1088/1748-9326/6/4/049001/meta (Mitchard et al., 2011)
source-WUR agreement
AFR13 2 2008 1.00 2 Tropical rainforest https://agupubs.onlinelibrary.wiley.com/doi/full/10.1029/2009GL040692 (Mitchard et al., 2009)
source-WUR agreement
AFR14 2 2009 1.63 4 Tropical rainforest https://www.sciencedirect.com/science/article/abs/pii/S014362281400109X (Ryan, Berry, & Joshi, 2014)
source-WUR agreement
AFR6 2 2009 1.00 12 Tropical rainforest https://cbmjour-l.biomedcentral.com/articles/10.1186/1750-0680-9-2 (Willcock et al., 2014)
source-WUR agreement
AFR7 2 2012 1.00 19 Tropical rainforest https://royalsocietypublishing.org/doi/full/10.1098/rstb.2012.0295 (Lewis et al., 2013) source-WUR agreement
ASI3 2 2007 1.00 92 Tropical rainforest https://www.sciencedirect.com/science/article/abs/pii/S0378112711004361 (Morel et al., 2011) source-WUR agreement
AUS1 2 2012 1.01 63 Subtropical steppe http://data.auscover.org.au/xwiki/bin/view/Product+pages/Biomass+Plot+Library (Paul et al., 2016) source-WUR agreement
SAM2 2 2012 1.00 40 Tropical rainforest http://geoinfo.cnpm.embrapa.br/geonetwork/srv/ eng/main.home
source-WUR agreement
SAM_FOS 1 2011 0.25 142 Tropical rainforest https://www.-ture.com/articles/s41597-019-0196-1?fbclid=IwAR08vLoOm4xEQo4EUdLtoKsnP6nsNIY5CYnfcoqGcS5Z0_UcyaNIr-jcdDg
(Schepaschenko et al., 2019)
open
AFR15 1 2013 0.25 136 Tropical rainforest https://besjour-ls.onlinelibrary.wiley.com/doi/full/10.1111/1365-2745.12548%4010.1111/%28ISSN%291365-2745.FORESTRY
(Vieilledent et al., 2016)
source-WUR agreement
AFR1 1 2008 0.50 1152 Tropical rainforest https://agritrop.cirad.fr/572060/1/document_572060.pdf (Hirsh, Jourget, Feintrenie, Bayol,
source-WUR

© Aberystwyth University and GAMMA Remote Sensing, 2018 This document is the property of the CCI-Biomass partnership, no part of it shall be reproduced or transmitted without the express prior written authorization of Aberystwyth University and Gamma
Remote Sensing AG.
& Ebaá Atyi, 2013) agreement
AFR10 1 2007 0.50 11 Tropical rainforest https://iopscience.iop.org/article/10.1088/1748-9326/6/4/049001/meta (Mitchard et al., 2011)
source-WUR agreement
AFR12 1 2008 0.16 108 Tropical rainforest https://www.sciencedirect.com/science/article/abs/pii/S0034425711003609 (Avitabile, Baccini, Friedl, & Schmullius, 2012)
source-WUR agreement
AFR13 1 2008 0.50 23 Tropical rainforest https://agupubs.onlinelibrary.wiley.com/doi/full/10.1029/2009GL040692 (Mitchard et al., 2009)
source-WUR agreement
AFR14 1 2009 0.51 70 Tropical dry forest https://www.sciencedirect.com/science/article/abs/pii/S014362281400109X (Ryan et al., 2014) source-WUR agreement
AFR4 1 2012 0.13 110 Tropical mountain system
http://www.geo-informatie.nl/workshops/scw2/papers/deVries.pdf (DeVries, Avitabile, Kooistra, & Herold, 2012)
source-WUR agreement
AFR5 1 2012 0.08 71 Tropical rainforest https://pure.mpg.de/pubman/faces/ViewItemOverviewPage.jsp?itemId=item_2281402 (Vaglio Laurin et al., 2016)
source-WUR agreement
AFR6 1 2009 0.33 12 Tropical dry forest https://cbmjour-l.biomedcentral.com/articles/10.1186/1750-0680-9-2 (Willcock et al., 2014)
source-WUR agreement
AFR8 1 2008 0.13 105 Tropical moist forest https://www.sciencedirect.com/science/article/abs/pii/S0034425712001058 (Carreiras, Vasconcelos, & Lucas, 2012)
source-WUR agreement
AFR9 1 2016 0.13 9642 Tropical dry forest https://www.mdpi.com/2072-4292/5/4/1524
https://fndsmoz.maps.arcgis.com/apps/MapSeries/index.html?appid=6602939f39ad4626a10f87bf6253af1e
(Carreiras et al., 2012)
open, source-WUR agreement
AFR_KEN 1 2011 0.09 362 Tropical and subtropical grasslands, savannas and shrublands
source-WUR agreement
ASI1 1 2008 0.05 2903 Tropical mountain system and rainforest
https://www.tandfonline.com/doi/full/10.1080/17583004.2016.1254009 (Avitabile et al., 2016)
source-WUR agreement
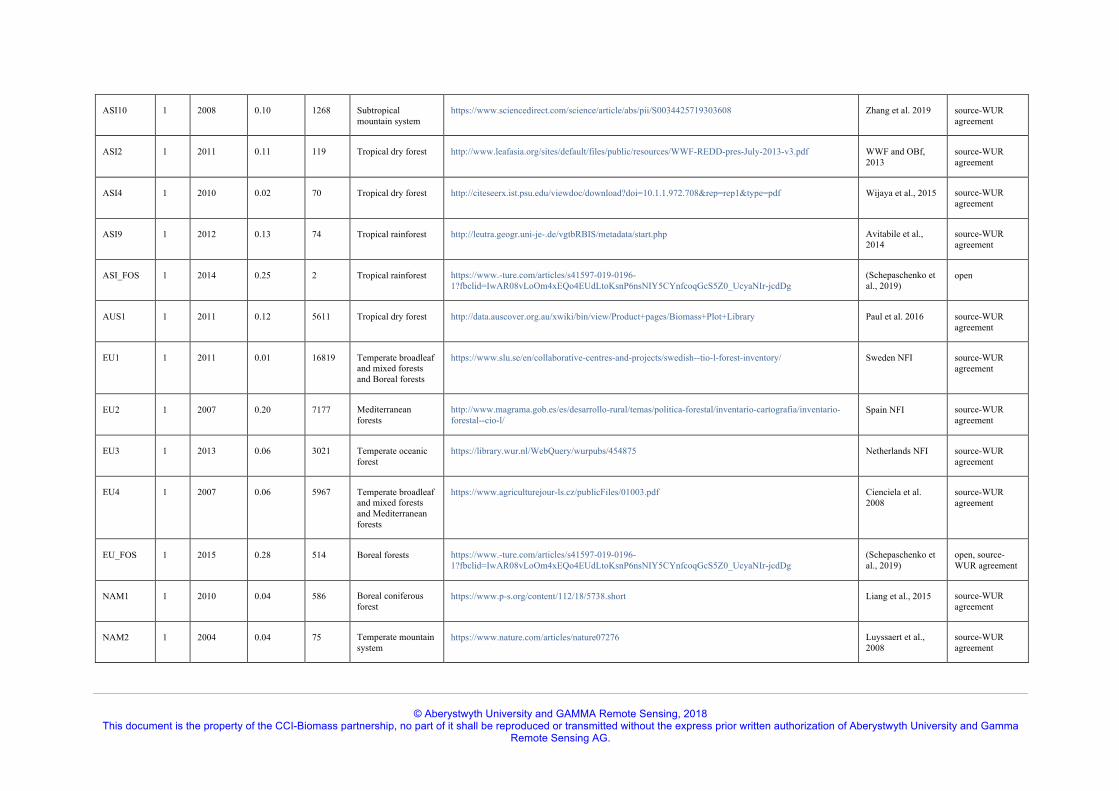
© Aberystwyth University and GAMMA Remote Sensing, 2018 This document is the property of the CCI-Biomass partnership, no part of it shall be reproduced or transmitted without the express prior written authorization of Aberystwyth University and Gamma
Remote Sensing AG.
ASI10 1 2008 0.10 1268 Subtropical mountain system
https://www.sciencedirect.com/science/article/abs/pii/S0034425719303608 Zhang et al. 2019 source-WUR agreement
ASI2 1 2011 0.11 119 Tropical dry forest http://www.leafasia.org/sites/default/files/public/resources/WWF-REDD-pres-July-2013-v3.pdf WWF and OBf, 2013
source-WUR agreement
ASI4 1 2010 0.02 70 Tropical dry forest http://citeseerx.ist.psu.edu/viewdoc/download?doi=10.1.1.972.708&rep=rep1&type=pdf Wijaya et al., 2015 source-WUR agreement
ASI9 1 2012 0.13 74 Tropical rainforest http://leutra.geogr.uni-je-.de/vgtbRBIS/metadata/start.php Avitabile et al., 2014
source-WUR agreement
ASI_FOS 1 2014 0.25 2 Tropical rainforest https://www.-ture.com/articles/s41597-019-0196-1?fbclid=IwAR08vLoOm4xEQo4EUdLtoKsnP6nsNIY5CYnfcoqGcS5Z0_UcyaNIr-jcdDg
(Schepaschenko et al., 2019)
open
AUS1 1 2011 0.12 5611 Tropical dry forest http://data.auscover.org.au/xwiki/bin/view/Product+pages/Biomass+Plot+Library Paul et al. 2016 source-WUR agreement
EU1 1 2011 0.01 16819 Temperate broadleaf and mixed forests and Boreal forests
https://www.slu.se/en/collaborative-centres-and-projects/swedish--tio-l-forest-inventory/ Sweden NFI source-WUR agreement
EU2 1 2007 0.20 7177 Mediterranean forests
http://www.magrama.gob.es/es/desarrollo-rural/temas/politica-forestal/inventario-cartografia/inventario-forestal--cio-l/
Spain NFI source-WUR agreement
EU3 1 2013 0.06 3021 Temperate oceanic forest
https://library.wur.nl/WebQuery/wurpubs/454875 Netherlands NFI source-WUR agreement
EU4 1 2007 0.06 5967 Temperate broadleaf and mixed forests and Mediterranean forests
https://www.agriculturejour-ls.cz/publicFiles/01003.pdf Cienciela et al. 2008
source-WUR agreement
EU_FOS 1 2015 0.28 514 Boreal forests https://www.-ture.com/articles/s41597-019-0196-1?fbclid=IwAR08vLoOm4xEQo4EUdLtoKsnP6nsNIY5CYnfcoqGcS5Z0_UcyaNIr-jcdDg
(Schepaschenko et al., 2019)
open, source-WUR agreement
NAM1 1 2010 0.04 586 Boreal coniferous forest
https://www.p-s.org/content/112/18/5738.short Liang et al., 2015 source-WUR agreement
NAM2 1 2004 0.04 75 Temperate mountain system
https://www.nature.com/articles/nature07276 Luyssaert et al., 2008
source-WUR agreement
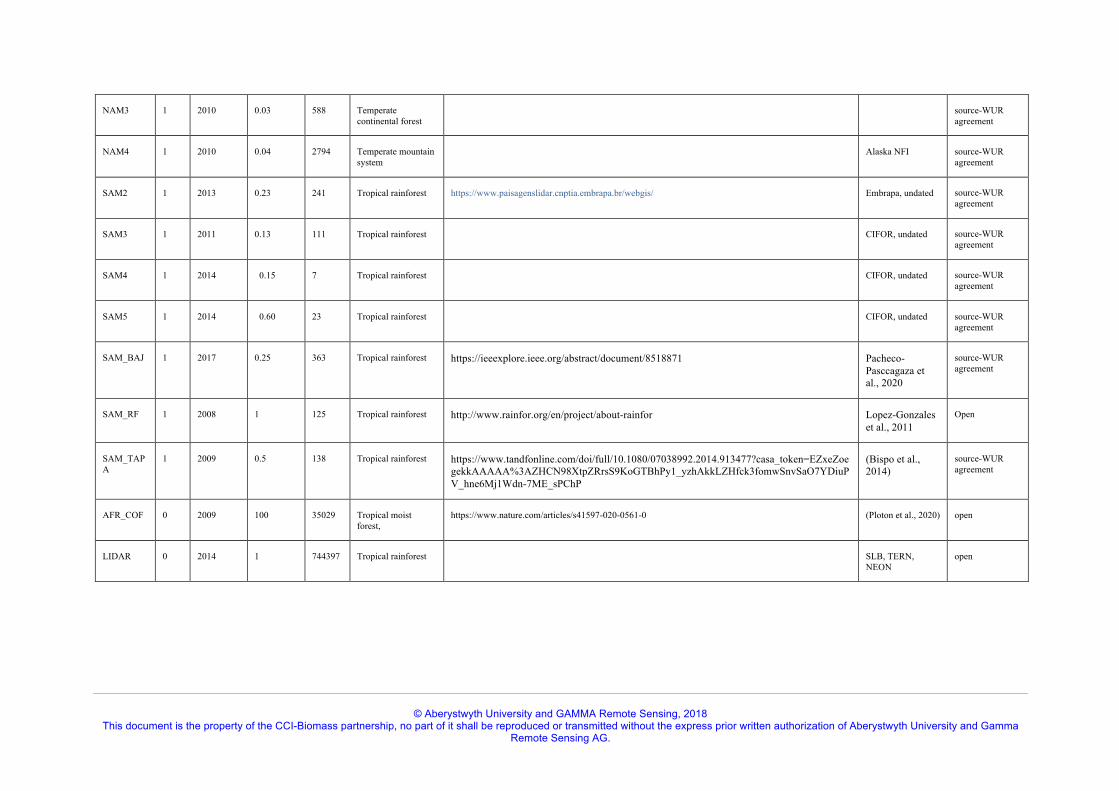
© Aberystwyth University and GAMMA Remote Sensing, 2018 This document is the property of the CCI-Biomass partnership, no part of it shall be reproduced or transmitted without the express prior written authorization of Aberystwyth University and Gamma
Remote Sensing AG.
NAM3 1 2010 0.03 588 Temperate continental forest
source-WUR agreement
NAM4 1 2010 0.04 2794 Temperate mountain system
Alaska NFI source-WUR agreement
SAM2 1 2013 0.23 241 Tropical rainforest https://www.paisagenslidar.cnptia.embrapa.br/webgis/ Embrapa, undated source-WUR agreement
SAM3 1 2011 0.13 111 Tropical rainforest
CIFOR, undated source-WUR agreement
SAM4 1 2014 0.15 7 Tropical rainforest
CIFOR, undated source-WUR agreement
SAM5 1 2014 0.60 23 Tropical rainforest
CIFOR, undated source-WUR agreement
SAM_BAJ 1 2017 0.25 363 Tropical rainforest https://ieeexplore.ieee.org/abstract/document/8518871 Pacheco-Pasccagaza et al., 2020
source-WUR agreement
SAM_RF 1 2008 1 125 Tropical rainforest http://www.rainfor.org/en/project/about-rainfor Lopez-Gonzales et al., 2011
Open
SAM_TAPA
1 2009 0.5 138 Tropical rainforest https://www.tandfonline.com/doi/full/10.1080/07038992.2014.913477?casa_token=EZxeZoegekkAAAAA%3AZHCN98XtpZRrsS9KoGTBhPy1_yzhAkkLZHfck3fomwSnvSaO7YDiuPV_hne6Mj1Wdn-7ME_sPChP
(Bispo et al., 2014)
source-WUR agreement
AFR_COF 0 2009 100 35029 Tropical moist forest,
https://www.nature.com/articles/s41597-020-0561-0 (Ploton et al., 2020) open
LIDAR 0 2014 1 744397 Tropical rainforest SLB, TERN, NEON
open
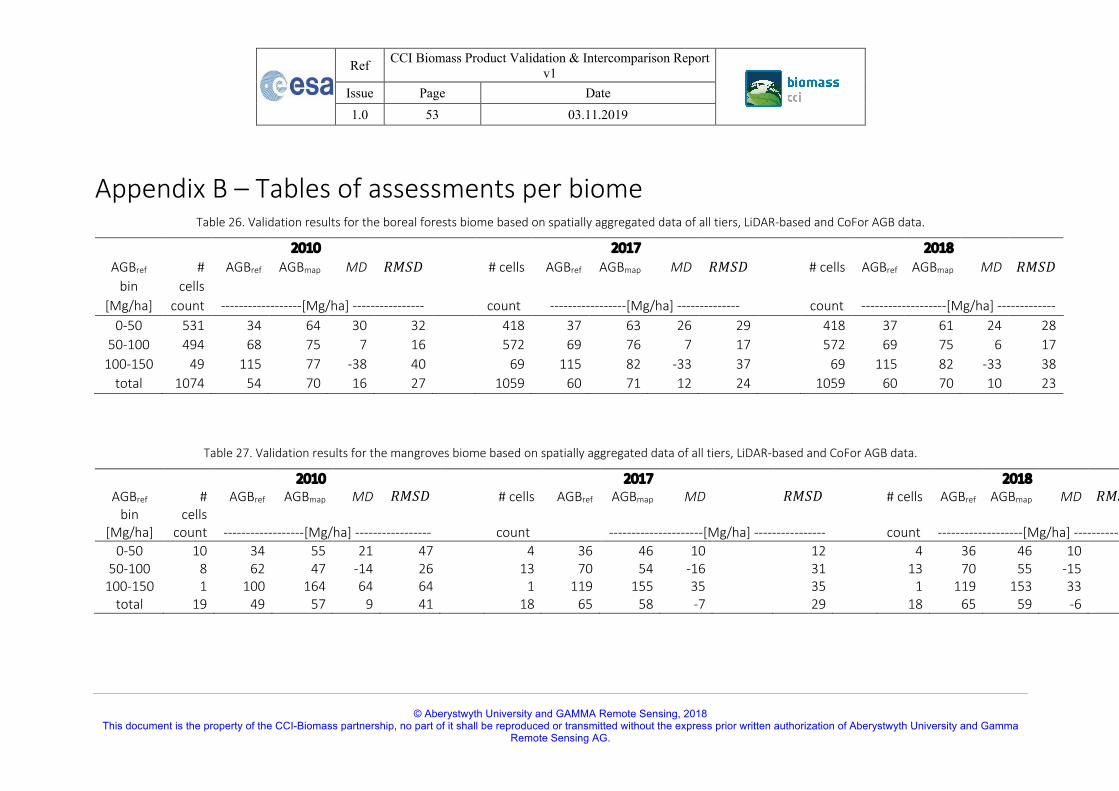
Ref CCI Biomass Product Validation & Intercomparison Report v1
Issue Page Date 1.0 53 03.11.2019
© Aberystwyth University and GAMMA Remote Sensing, 2018 This document is the property of the CCI-Biomass partnership, no part of it shall be reproduced or transmitted without the express prior written authorization of Aberystwyth University and Gamma
Remote Sensing AG.
Appendix B – Tables of assessments per biome Table 26. Validation results for the boreal forests biome based on spatially aggregated data of all tiers, LiDAR-based and CoFor AGB data.
AGBref
bin
#
cells
AGBref
2010 AGBmap
MD
!"#$
# cells
AGBref
2017 AGBmap
MD
!"#$
# cells
AGBref
2018 AGBmap
MD
!"#$
[Mg/ha] count ------------------[Mg/ha] ---------------- count -----------------[Mg/ha] -------------- count -------------------[Mg/ha] ------------- 0-50 531 34 64 30 32 418 37 63 26 29 418 37 61 24 28
50-100 494 68 75 7 16 572 69 76 7 17 572 69 75 6 17 100-150 49 115 77 -38 40 69 115 82 -33 37 69 115 82 -33 38
total 1074 54 70 16 27 1059 60 71 12 24 1059 60 70 10 23
Table 27. Validation results for the mangroves biome based on spatially aggregated data of all tiers, LiDAR-based and CoFor AGB data.
AGBref
bin
#
cells
AGBref
2010 AGBmap
MD
!"#$
# cells
AGBref
2017 AGBmap
MD
!"#$
# cells
AGBref
2018 AGBmap
MD
!"#$
[Mg/ha] count ------------------[Mg/ha] ----------------- count ---------------------[Mg/ha] ---------------- count -------------------[Mg/ha] -------------- 0-50 10 34 55 21 47 4 36 46 10 12 4 36 46 10 12
50-100 8 62 47 -14 26 13 70 54 -16 31 13 70 55 -15 30 100-150 1 100 164 64 64 1 119 155 35 35 1 119 153 33 33
total 19 49 57 9 41 18 65 58 -7 29 18 65 59 -6 28

Ref CCI Biomass Product Validation & Intercomparison Report v1
Issue Page Date 1.0 54 03.11.2019
© Aberystwyth University and GAMMA Remote Sensing, 2018 This document is the property of the CCI-Biomass partnership, no part of it shall be reproduced or transmitted without the express prior written authorization of Aberystwyth University and Gamma
Remote Sensing AG.
Table 28. Validation results for the Mediterranean forests, woodland and scrub biome based on spatially aggregated data of all tiers, LiDAR-based and CoFor AGB data.
AGBref
bin
#
cells
AGBref
2010 AGBmap
MD
!"#$
# cells
AGBref
2017 AGBmap
MD
!"#$
# cells
AGBref
2018 AGBmap
MD
!"#$
[Mg/ha] count ------------------[Mg/ha] ----------------- count ---------------------[Mg/ha] ---------------- count -------------------[Mg/ha] -------------- 0-50 2518 17 18 1 15 886 20 23 3 19 886 20 20 0 18
50-100 292 64 78 14 37 136 65 66 1 27 136 65 62 -3 27 100-150 40 127 161 34 101 28 126 151 26 69 28 126 152 27 69 150-200 29 171 197 26 94 31 170 260 90 137 31 170 263 92 143 200-250 26 224 217 -7 87 23 222 298 76 133 23 222 302 80 146 250-300 8 273 238 -36 91 7 270 249 -21 84 7 270 254 -16 85 300-400 3 304 219 -85 96 3 304 344 40 90 3 304 380 77 138
total 2916 28 30 3 26 1114 39 46 7 38 1114 39 44 5 39
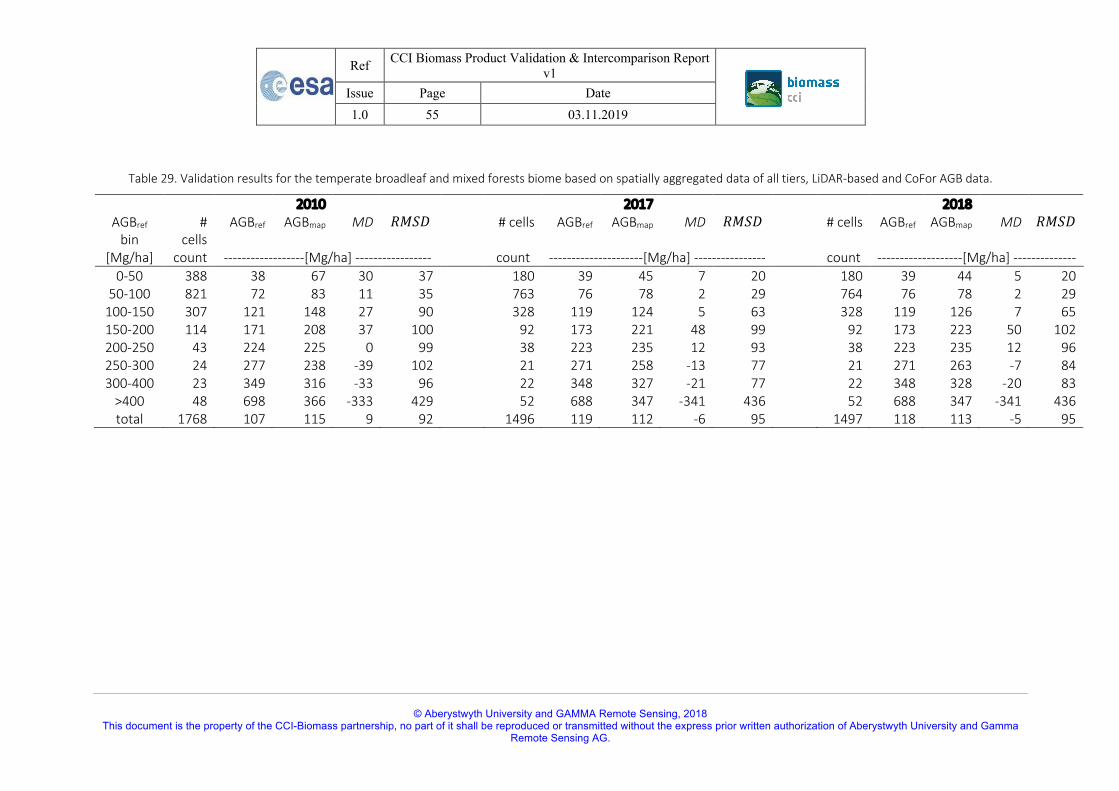
Ref CCI Biomass Product Validation & Intercomparison Report v1
Issue Page Date 1.0 55 03.11.2019
© Aberystwyth University and GAMMA Remote Sensing, 2018 This document is the property of the CCI-Biomass partnership, no part of it shall be reproduced or transmitted without the express prior written authorization of Aberystwyth University and Gamma
Remote Sensing AG.
Table 29. Validation results for the temperate broadleaf and mixed forests biome based on spatially aggregated data of all tiers, LiDAR-based and CoFor AGB data.
AGBref
bin
#
cells
AGBref
2010 AGBmap
MD
!"#$
# cells
AGBref
2017 AGBmap
MD
!"#$
# cells
AGBref
2018 AGBmap
MD
!"#$
[Mg/ha] count ------------------[Mg/ha] ----------------- count ---------------------[Mg/ha] ---------------- count -------------------[Mg/ha] -------------- 0-50 388 38 67 30 37 180 39 45 7 20 180 39 44 5 20
50-100 821 72 83 11 35 763 76 78 2 29 764 76 78 2 29 100-150 307 121 148 27 90 328 119 124 5 63 328 119 126 7 65 150-200 114 171 208 37 100 92 173 221 48 99 92 173 223 50 102 200-250 43 224 225 0 99 38 223 235 12 93 38 223 235 12 96 250-300 24 277 238 -39 102 21 271 258 -13 77 21 271 263 -7 84 300-400 23 349 316 -33 96 22 348 327 -21 77 22 348 328 -20 83
>400 48 698 366 -333 429 52 688 347 -341 436 52 688 347 -341 436 total 1768 107 115 9 92 1496 119 112 -6 95 1497 118 113 -5 95
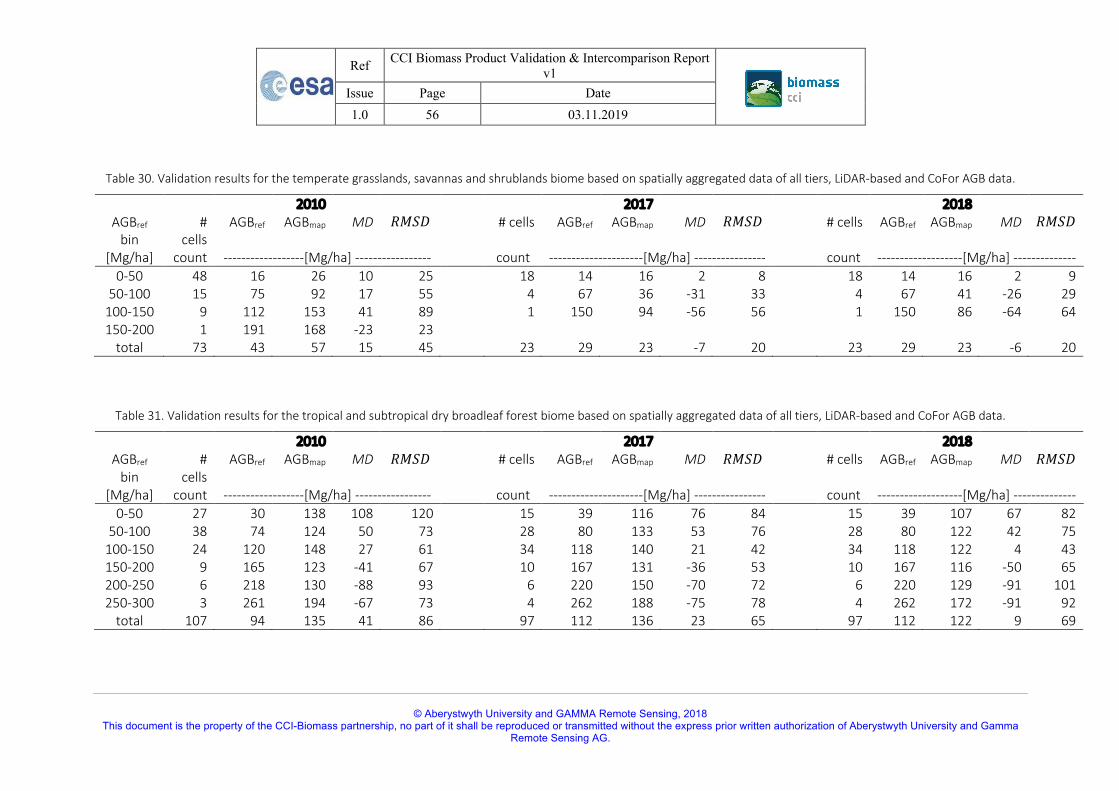
Ref CCI Biomass Product Validation & Intercomparison Report v1
Issue Page Date 1.0 56 03.11.2019
© Aberystwyth University and GAMMA Remote Sensing, 2018 This document is the property of the CCI-Biomass partnership, no part of it shall be reproduced or transmitted without the express prior written authorization of Aberystwyth University and Gamma
Remote Sensing AG.
Table 30. Validation results for the temperate grasslands, savannas and shrublands biome based on spatially aggregated data of all tiers, LiDAR-based and CoFor AGB data.
AGBref
bin
#
cells
AGBref
2010 AGBmap
MD
!"#$
# cells
AGBref
2017 AGBmap
MD
!"#$
# cells
AGBref
2018 AGBmap
MD
!"#$
[Mg/ha] count ------------------[Mg/ha] ----------------- count ---------------------[Mg/ha] ---------------- count -------------------[Mg/ha] -------------- 0-50 48 16 26 10 25 18 14 16 2 8 18 14 16 2 9
50-100 15 75 92 17 55 4 67 36 -31 33 4 67 41 -26 29 100-150 9 112 153 41 89 1 150 94 -56 56 1 150 86 -64 64 150-200 1 191 168 -23 23
total 73 43 57 15 45 23 29 23 -7 20 23 29 23 -6 20
Table 31. Validation results for the tropical and subtropical dry broadleaf forest biome based on spatially aggregated data of all tiers, LiDAR-based and CoFor AGB data.
AGBref
bin
#
cells
AGBref
2010 AGBmap
MD
!"#$
# cells
AGBref
2017 AGBmap
MD
!"#$
# cells
AGBref
2018 AGBmap
MD
!"#$
[Mg/ha] count ------------------[Mg/ha] ----------------- count ---------------------[Mg/ha] ---------------- count -------------------[Mg/ha] -------------- 0-50 27 30 138 108 120 15 39 116 76 84 15 39 107 67 82
50-100 38 74 124 50 73 28 80 133 53 76 28 80 122 42 75 100-150 24 120 148 27 61 34 118 140 21 42 34 118 122 4 43 150-200 9 165 123 -41 67 10 167 131 -36 53 10 167 116 -50 65 200-250 6 218 130 -88 93 6 220 150 -70 72 6 220 129 -91 101 250-300 3 261 194 -67 73 4 262 188 -75 78 4 262 172 -91 92
total 107 94 135 41 86 97 112 136 23 65 97 112 122 9 69
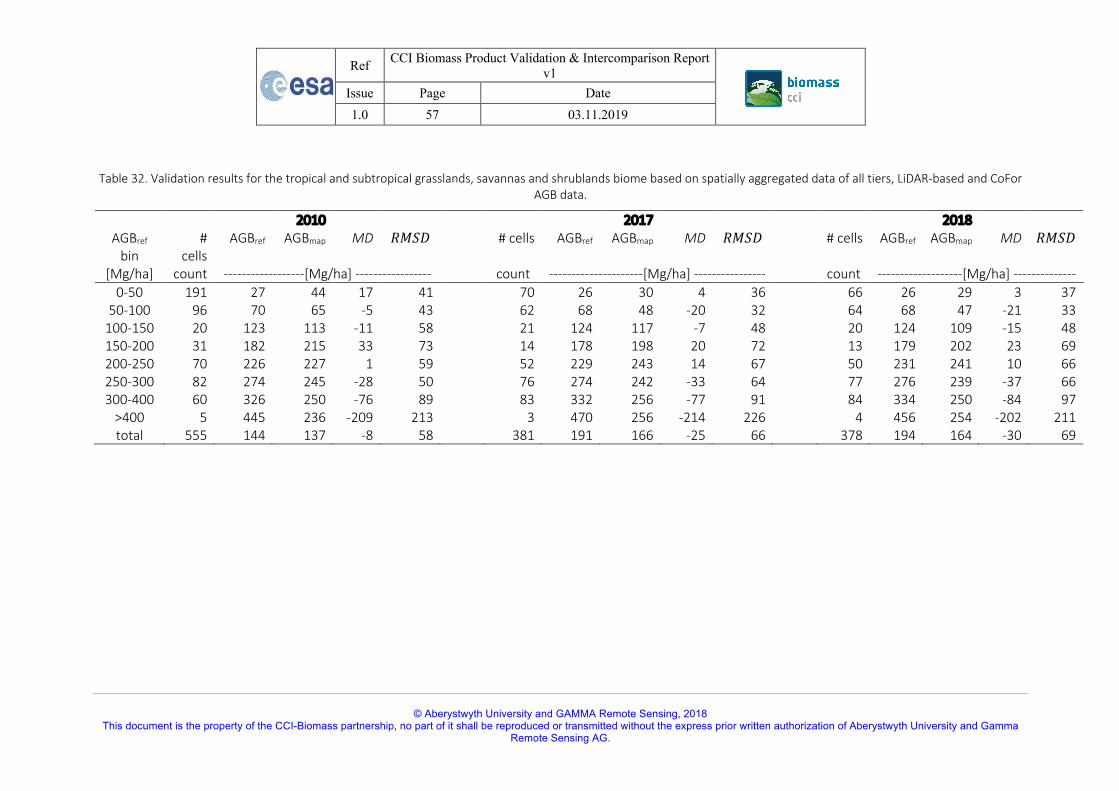
Ref CCI Biomass Product Validation & Intercomparison Report v1
Issue Page Date 1.0 57 03.11.2019
© Aberystwyth University and GAMMA Remote Sensing, 2018 This document is the property of the CCI-Biomass partnership, no part of it shall be reproduced or transmitted without the express prior written authorization of Aberystwyth University and Gamma
Remote Sensing AG.
Table 32. Validation results for the tropical and subtropical grasslands, savannas and shrublands biome based on spatially aggregated data of all tiers, LiDAR-based and CoFor AGB data.
AGBref
bin
#
cells
AGBref
2010 AGBmap
MD
!"#$
# cells
AGBref
2017 AGBmap
MD
!"#$
# cells
AGBref
2018 AGBmap
MD
!"#$
[Mg/ha] count ------------------[Mg/ha] ----------------- count ---------------------[Mg/ha] ---------------- count -------------------[Mg/ha] -------------- 0-50 191 27 44 17 41 70 26 30 4 36 66 26 29 3 37
50-100 96 70 65 -5 43 62 68 48 -20 32 64 68 47 -21 33 100-150 20 123 113 -11 58 21 124 117 -7 48 20 124 109 -15 48 150-200 31 182 215 33 73 14 178 198 20 72 13 179 202 23 69 200-250 70 226 227 1 59 52 229 243 14 67 50 231 241 10 66 250-300 82 274 245 -28 50 76 274 242 -33 64 77 276 239 -37 66 300-400 60 326 250 -76 89 83 332 256 -77 91 84 334 250 -84 97
>400 5 445 236 -209 213 3 470 256 -214 226 4 456 254 -202 211 total 555 144 137 -8 58 381 191 166 -25 66 378 194 164 -30 69

Ref CCI Biomass Product Validation & Intercomparison Report v1
Issue Page Date 1.0 58 03.11.2019
© Aberystwyth University and GAMMA Remote Sensing, 2018 This document is the property of the CCI-Biomass partnership, no part of it shall be reproduced or transmitted without the express prior written authorization of Aberystwyth University and Gamma
Remote Sensing AG.
Table 33. Validation results for the Tropical and subtropical moist broadleaf forest biome based on spatially aggregated data of all tiers, LiDAR-based and CoFor AGB data.
AGBref
bin
#
cells
AGBref
2010 AGBmap
MD
!"#$
# cells
AGBref
2017 AGBmap
MD
!"#$
# cells
AGBref
2018 AGBmap
MD
!"#$
[Mg/ha] count ------------------[Mg/ha] ----------------- count ---------------------[Mg/ha] ---------------- count -------------------[Mg/ha] -------------- 0-50 29 28 60 32 61 18 29 42 13 29 17 29 42 13 28
50-100 37 75 89 14 61 28 75 70 -5 29 29 75 70 -4 29 100-150 50 124 120 -4 59 51 128 147 19 54 51 128 130 2 48 150-200 42 175 184 9 77 33 177 203 26 85 33 177 198 21 98 200-250 91 228 248 20 54 53 228 235 7 61 52 228 233 4 62 250-300 136 276 258 -18 46 74 275 256 -19 44 69 275 253 -22 44 300-400 238 344 260 -84 95 74 342 260 -82 94 60 334 258 -76 93
>400 36 432 261 -171 176 11 448 251 -197 210 5 449 238 -211 236 total 659 262 224 -38 82 342 227 206 -22 75 316 216 197 -19 71
Table 34. Validation results for the tundra biome based on spatially aggregated data of all tiers, LiDAR-based and CoFor AGB data.
AGBref
bin
#
cells
AGBref
2010 AGBmap
MD
!"#$
# cells
AGBref
2017 AGBmap
MD
!"#$
# cells
AGBref
2018 AGBmap
MD
!"#$
[Mg/ha] count ------------------[Mg/ha] ----------------- count ---------------------[Mg/ha] ---------------- count -------------------[Mg/ha] -------------- 0-50 72 32 53 21 28 58 34 47 13 19 58 34 45 11 18
50-100 34 71 68 -3 25 44 67 60 -7 20 44 67 59 -8 21 100-150 6 115 81 -35 59 10 115 61 -55 66 10 115 59 -57 67
total 112 48 59 11 29 112 54 54 -1 27 112 54 52 -2 27