Embed Size (px)
Citation preview
INTERCOMPARISON OF RADIONUCLIDE MEASUREMENTS IN MARINE SEDIMENT SAMPLE IAEA-367
by
S. Ballestra, J .J . Lopez, J. Gastaud, D . V a s , V . Noshkin
August 1991
International Atomic Energy Agency Marine Environment Laboratory
19, Avenue des Castellans MC 98000 Monaco
Principality of Monaco
CONTENTS
Page
1. Introduction 1
2. Scope of the study 1
3. Description of the material 1
4. Sample dispatch and data return 2
5. Evaluation of the results 2
5.1 Data treatment 2 5.2 Evaluation procedure 2 5.3 Explanation of tables 3
5.4 Criteria for certification and recommended values 3
6. Results and discussion : artificial radionuclides 3
7. Results and discussion : natural radionuclides 6
8. Conclusion 7
9. References 7
10. Acknowledgments 7
Annex: List of participants
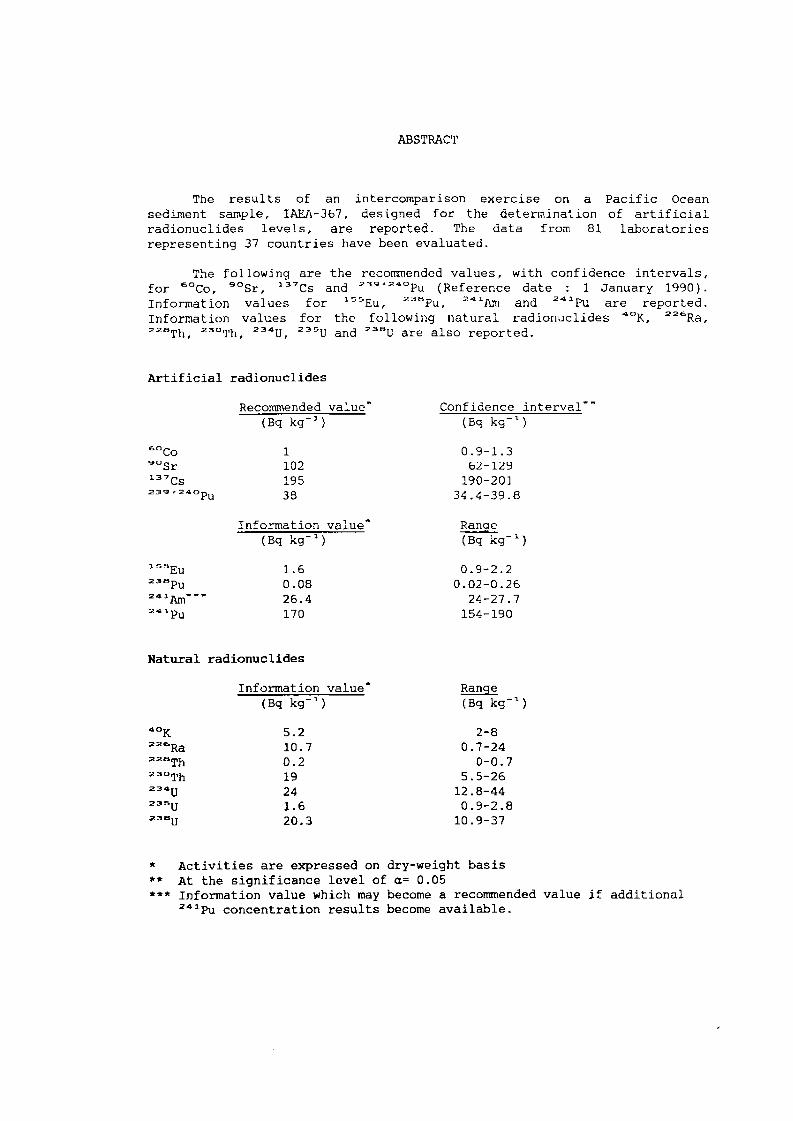
ABSTRACT
The results of an intercomparison exercise on a Pacific Ocean sediment sample, IAEA-367, designed for the determination of artificial radionuclides levels, are reported. The data from 81 laboratories representing 37 countries have been evaluated.
The following are the recommended values, with confidence intervals, for
6
°Co, *°Sr, 1 3 7
C s and (Reference date : 1 January 1990). Information values for
1 5 5
E u , 2 3 S
P u , 2 4 l
A m and 2 A 1
P u are reported. Information values for the following natural radionuclides
2 2 6
R a , 2 2 S
T h , 2 3
°Th, 2 3 A
U , 2 3 5
U and 2 3 S
U are also reported.
Artificial radionuclides
Recommended value' (Bq kg"
1
} Confidence interval'
(Bq k g "1
}
fe
°Co ^"Sr 1 3 7
C s 239»-240p u
1 102
195 38
0 . 9 - 1 . 3 62-129
190-201 34.4-39.8
Information value' (Bq kg"
1
) Range (Bq k g "
1
)
l s s
E u 2 3 8
P u 2 4 1
A m '
1.6 0.08 26.4 170
0.9-2.2 0 . 0 2 - 0 . 2 6
24-27.7 154-190
Natural radionuclides
Information value" Range
(Bq k g " ) (Bq kg-
5 . 2 2 -8 2 Z 6
R a 10 .7 0 . 7 - 2 4 Z 2 8 T h 0 . 2 0 - 0 . 7 23
°Th 19 5 . 5 - 2 6 24 1 2 . 8 - 4 4
2 3 5 u 1 . 6 0 . 9 - 2 . 8 2 3 S u 2 0 . 3 10 .9 -37
* Activities are expressed on dry-weight basis ** At the significance level of a= 0.05 *** Information value which may become a recommended value if additional
2 4
* P u concentration results become available.
1
1. Introduction
In 1989-1990, the Marine Environment Laboratory (MEL) in Monaco formerly International Laboratory of Marine Radioactivity, prepared and distributed new marine sediment samples with quantities of some artificial and natural radionuclides for intercomparison and certification.
This sample was sediment from the Pacific Ocean coded IAEA-367 collected in 1982. It was anticipated that the concentrations of the artificial radionuclides in this sediment would be higher than the environmental levels usually found and, therefore, would constitute an excellent intercomparison sample.
All participants were informed that the expected concentration range for the artificial radionuclides in the IAEA-367 sediment was 0-200 Bq k g
- 1
and 10-50 Bq k g- 1
for the gamma emitters and the transuranic elements, respectively.
2. Scope of the study
Participating laboratories were requested to determine as many radionuclides as possible by gamma spectrometry and any transuranic and other elements requiring radiochemical separation and alpha or beta counting.
3. Description of the material
The sediment sample was collected in 1982 by the Lawrence Livermore National Laboratory (U.S.A.) at the Enewetak Atoll in the Marshall Islands (Central Pacific Ocean). This atoll was used by the U.S. during the period 1948-1958 to test different nuclear devices. Testing resulted in the deposition of fission and activation products and nuclear fuel material in the terrestrial and aquatic environment.
The soil sediment sample, mainly composed of a mixture of carbonate species, was dried, ground in a ball mill and homogenized. A sieving test showed that 95% of the material was below 500 pirn and 85% was in the size range 63 ^m-500 urt. The most abundant fraction, between 250 \m and 500 ^im, represented 41% of the total material.
The moisture content of the sample, determined at the time of packaging by drying several aliquots at 80°C to constant weight, was found to be about 0.9%. Forty laboratories reported moisture content measurements: 33 values were below 1%, 6 values were between 1% and 2% and 1 value was higher than 5%.
Plastic bottles were filled with 40 g of the sediment and labelled with the code name IAEA-367. Participants were requested to report results on a dry-weight basis. The reference date for reporting the radionuclide concentrations was 1 January 1990.
Prior to releasing any intercomparison sample from MEL, it is a requirement to assure that the radionuclides are homogeneously distributed in the sediment material. The homogeneity was assessed by measuring the
2
activity of &
°Co, 1 3 7
C s , «»-^«opu a n d i n s e V
e r a l samples from bottles taken at random. Homogeneity was determined using one-way analysis of variance and it was concluded that the material satisfied the homogeneity criteria for the radionuclides measured.
4. Sample dispatch and data return
The samples were distributed to 107 laboratories. The deadline for reporting the data was set for 31 December 1990. Many of the participants met this deadline while other laboratories expressed their intention to report later.
As of 15 February 1991, results were received from 69 laboratories. An interim report was issued and we noted that some of the reported values were far from the mean values determined from a statistical analysis of the available data base. Participants were informed of the interim results and were urged to look over their data and inform us of any possible errors. We received several replies and corrected the data accordingly. As of 1 May 1991, 81 sets of results (including MEL) were received from 37 countries.
In spite of the fact that the IAEA-367 material was mainly designed for the measurement of artificial radionuclides, several laboratories also reported values for many natural radionuclides.
Concentrations of 17 artificial and 11 natural radionuclides were reported by some but not necessarily all participants. These 28 radionuclides are shown in Table 1 with the number of laboratories submitting results. The results for the most frequently measured radionuclides are shown in Tables 2 to 9 while the less frequently measured artificial radionuclides are presented in Table 10. The code number of a respective laboratory is provided in these tables and the list of participants is shown in the Annex.
5. Evaluation of the results
5.1. Data treatment
We calculated laboratory averages when necessary from individual results and they were given either as arithmetical means with corresponding standard deviation when more than two results were reported or as weighted means with weighted errors in the case of only two reported results. All values have been rounded off to the most significant figure.
5.2. Evaluation procedure
The "less than" values were segregated from the results and the remaining values were checked for the presence of outliers using a box and whisker plot test (1). Outliers are identified with an asterisk in Tables 2 to 9. Median values were calculated from all results passing the test.
These values are the most reliable estimates of the unknown true values. Confidence intervals were taken from a non-parametric sample population (2). They represent a two-sided interval at a significance level of 0.05.
3
5.3. Explanation of the tables
5.3.1. Laboratory code number: each laboratory was assigned a code number. The numbers do not correspond to the sequence in the list of the participants given in the Annex in order to ensure the anonymity.
5.3.2. Method code : the analytical techniques employed by the participants are:
Method code Method
Aln*, t* Alpha spectrometry after chemical separation AAS Atomic absorption spectrometry B Beta measurements after chemical separation Em Radon Emanation method F Fluorometry G Gamma spectrometry: not specified Gl " " : direct Ge (Li)/Ge (HP) G2 " " : indirect (of a daughter radionuclide
assumed in equilibrium) NAA Neutron activation analysis
* n: for acid leaching techniques * t: for total dissolution techniques
5.3.3. Activity: corresponds to the arithmetical or weighted mean computed from all the individual results obtained from the participants with the corresponding standard deviation or weighted error.
5.4. Criteria for certification and recommended values
For data sets comprising 5 or more accepted laboratory means, median values and confidence intervals were calculated as estimations of true activity concentrations.
Please note that the following criteria are specially designed for this report.
The median values of the overall data, excluding outliers, were considered as the recommended values when:
1. More than 10 laboratory means were available 2. The percentage of outliers was not greater than 20% 3. The relative uncertainty of the overall median did not exceed
± 10% for activity concentrations equal or higher than 100 Bq k g- 1
and ± 30% for activity lower than 100 Bq k g- 1
.
An activity concentration value is classified as an information value when it is based on at least 3 laboratory means that are within the same order of magnitude.
6. Results and discussion: artificial radionuclides
Results of feQ
Co, *°Sr, 1 3 7
C s , l s s
E u , 2 3 S
P u , 2 3 9 + 2 4 Q
P u and Z 4 1
A m are presented in Tables 2 , 3 and 4.
4
Strontiuro-90
Twelve results were reported that included one "less than " value {Table 2). No outlying value was identified in the data set- The median of the accepted values is 102 Bq k g
- 1
with a confidence interval of 62-129 Bq k g "
1
.
Most of the laboratories have used conventional techniques based on : acid leaching of the material followed by carbonate or oxalate precipitation, separation of Sr and Ca with fuming nitric acid ending by either precipitation and counting of Sr as Sr carbonate or by milking and beta counting of
9
°Y.
Cobalt-60
Twenty-three results were reported that included four "less than" values (Table 3). One value, 5.7 Bq k g
- 1
reported by Lab. 49 was determined to be outlier. The median of the accepted values is 1 Bq k g
- 1
with a confidence interval of 0.9-1.3 Bq k g
- 1
.
Caesium-137
Seventy-three results were reported including one "less than" value (Table 3). All results but one have been obtained by using gamma spectrometry techniques. Lab. 68 has used the following technique: acid leaching, adsorption of Cs on AMP, purification of the Cs fraction, precipitation of Cs
2PtCl
f e and beta counting.
It is possible that the "less than" value, <0.1 Bq k g- 1
, reported by Lab. 93 resulted from mislabelling of the two recent sediment intercomparison samples received by the participant. Four results reported by Labs. 20, 29, 49 and 52 were considered to be outliers.
The median of the accepted values is 195 Bq k g- 1
with a confidence interval of 190-201 Bq k g
- 1
.
Europium-155
Nine results were reported that included four "less than" values (Table 3). The test for the outliers showed that the result reported by Labs. 82, was not part of the acceptable data set. The four remaining results give an information value for the concentration of
1 5 5
E u of 1.6 Bq kg"
1
with a range of 0.9-2.2 Bq k g- 1
.
Transuranium elements
Plutonium-238 and plutonium-239+240 were determined by 21 and 31 laboratories, respectively (Table 4). Nine results were reported as "less than" values for
2 3 S
P u . After excluding four outliers reported by Labs. 1, 13, 15 and 21, the median of the remaining
2 3 a
P u values is 0.08 Bq k g- 1
with a confidence interval of 0.02-0.26 Bq k g- 1
.
Only one value reported by Lab. 8 was determined as an outlier for plutonium-239+240. The median value is 38 Bq kg"
1
with a confidence interval of 34.4-39.8 Bq k g
- 1
.
5
Most of the laboratories have used very similar chemical procedures: pretreatment of the sediment with either HN0
3 conc. or HN0
3 8M or Aqua
regia; or a mixture of HN03/HF/HC10
4; precipitation either with iron
hydroxide or calcium oxalate or both; separation and purification of plutonium with either anion-exchange in HCl or HNO
a medium or with liquid-
liquid extraction (TIOA, TTA) then electrodeposition or, in some cases, lanthanum fluoride precipitation followed by alpha spectrometry. All participants have used
2 4 2
P u as yield monitor for plutonium isotope analyses except seven who used
2 3 f o
Pu as a tracer.
Forty-six results were reported for 3
Am (Table 4). Sixteen of the results were determined by alpha spectrometry following radiochemical separation; 29 by direct gamma spectrometry; and one (Lab. 33) by a combination of radiochemical separation followed by gamma spectrometry using a Ge(Li) well detector. Very little information was given by the participants regarding the chemical procedures used for
2 , a : i
Am.
The application of the t-test to the two groups of data of 2 4 1
A m obtained either directly by gamma spectrometry or by alpha spectrometry shows that the mean values (or medians) obtained for the two populations are very close: 26.1 Bq k g
- 1
(or 26.4 Bq k g- 1
for the median) for the alpha data set and 25.8 Bq k g
- 1
(or 26.4 Bq k g- 1
as median) for the gamma data set. The probability of the two data sets coming from the same population of results is quite high (t=0.36, significance level=0.72). Therefore, it is justified to pool all
2 4 1
A m results. The median value, 26.4 Bq k g- 1
, shown in Table 4 was generated after removing 6 outliers from the combined alpha and gamma spectrometry results. The confidence interval is 24-27.7 Bq kg"
1
.
At an activity level of 26.4 Bq k g- 1
, both techniques, direct gamma spectrometry or radiochemical separation followed by alpha spectrometry, give similar quality results.
In using the value for 2 4 1
A m one must keep in mind that it applies to the reference date of 1 January 1990. The activity of
2 4 1
A m will increase with time as the
2
*a
P u present in the sample decays. Unfortunately the 2 4 3
Pu content of the IAEA-367 sediment sample has not been precisely estimated. The four results reported (see table 10) give an average value of 174 Bq kg"
1
at the reference date of 1 January 1990.
Following the ingrowth formula:
X Am (
2 4 1
A m K = 2 4 1
P u0 x x (e - e )
X Am
where: t= time in years
2 4 1
P u0 = activity of
2 A 1
P u at reference date 2 , 8
'i
Amt = activity of
2 4 < 1 1
Am at time t
X = 2 A 1
P u decay constant with Tl/2(Pu)= 14.3 y X =
2 J l l
A m decay constant with Tl/2(Am)= 433 y
and taking into account the decay of 2 4 1
A m with time, the 2 4 1
Am concentration will increase in the sample with an amount of 0.23 Bq k g
- 1
on 1 January 1991, 0.45 Bq k g
- 1
on 1 January 1992 and 0.65 Bq kg~1
on 1 January 1993, which corresponds to an increase of about 0.8% per year.
6
Other man-made isotopes
Several laboratories submitted results on S f e
Co, 1 0 6
R u , 1 2 5
S b , 1 3 4
C s , 1 3 9
C e , 1 < l
"Ce, 1 4 7
P m , 2 3 7
N p , 2 A 5
P u and 2
*z
C m . Those results are presented in Table 10. Most of these results are reported as "less than" values.
7. Results and discussion: natural radionuclides
Some laboratories reported results for natural radionuclides such as *
D
K , 2 2 f e
R a , z 3 a
U , etc. even though only man-made activities were requested. The results are presented in Tables 5 to 9.
Whenever laboratories reported results for daughter products of the uranium series 4n+2, the actinium series 4n+3 and the thorium series 4n such as
z o s
T l , z l 4
P b , 2 1
* B i , z z s
A c and 3 3 4
T h , each daughter was considered in equilibrium with its immediate parent:
2 3
* T h for 2 3 e
u , 2 I
* P b and z l
* B i for
Z Z 6
R a , 2 2 8
A c for 2 2 e
R a and 2
°a
T l /a i 2
P b for z z s
T h and concentrations were calculated accordingly.
In t h e c a s e s of z l
°Pb, 2 1
°Po, 2 2 e
R a , 2 3 2
T h , 2 3 < l
U , 2 3 5
U , number of results reported were too few or too spread to allow any statistical treatment. Application of statistical treatment and test for outliers for Ä O
K , 2 2 6
R a , 2 2 S
T h , 2 3
°Th Z 3
* U , Z 3 S
U and 2 3 G
U have generated only information values for the concentrations of these isotopes.
Potassium-40
Lab. 68 determined by measuring stable potassium by atomic absorption spectrometry while the other 19 results were obtained by gamma spectrometry (Table 5). The data have a considerable range that cover two orders of magnitude from 2 to 245 Bq k g
- 1
. Five laboratories reported "less than" values. After the rejection of eight outliers, the remaining seven results give a median value of 5.2 Bq k g
- 1
with a confidence interval of 2-8 Bq k g "
1
.
Uranium isotopes
After the rejection of one outlier obtained by NAA and reported by Lab. 3 , the median value of the remaining eight results of
2 3
® U is 20.3 Bq k g
- 1
with a confidence interval of 10.9-37 Bq k g "1
(Table 6).
Information values only are provided for 2 3
* U and 3 3 5
u which are 24 Bq k g
- 1
and 1.6 Bq k g- 1
, respectively.
Thorium isotopes
Due to the small number of results reported on thorium, information values only were obtained for
2 2 B
T h and z3
°Th which are 0.2 Bq k g- 1
and 19 Bq k g "
1
, respectively (Table 7).
Radium-226
Fifteen results including four "less than" values were reported for 2 2 &
R a (Table 8). Two results were obtained by the radon emanation technique while the others were obtained by gamma spectrometry. No outlier was found
7
in the Z Z f e
R a data set which gives a median value of 10.7 Bq kg 1
with a confidence interval of 0.7-24 Bq k g
- 3
.
Lead-210 and Polonium-210
The results reported were too few and covered too great a range in values to allow any conclusion (Table 9).
8. Conclusion
A summary of data for the concentrations of the radionuclides determined in the sediment sample IAEA-367 is shown in Table 11. The median concentrations for the sets of individual data -after rejection of outliers- were chosen as the most reliable estimators of the true values. The recommended values with confidence intervals for the most frequently reported radionuclides are given.
9. References
(1) J.W. Tukey. Exploratory data analysis. Addison-Wesley Publishing Company, Reading, Mass, 1977.
(2) Geigy Scientific Tables (1982) in "Statistical Methods for Environmental Pollution Monitoring", pages 173 and 266, by R.O. Gilbert, Van Nostrand Reinhold Company, New York, 1987.
10. Acknowledgments
The assistance of the Lawrence Livermore National Laboratory (U.S.A.) for providing the sediment sample is gratefully acknowledged. More than 80% of the participants responded to this intercomparison exercise and the laboratories which contributed their time and facilities to the present work are hereby acknowledged. We have also to acknowledge the efforts made by the laboratories which reported, in addition to
fe
°Co, 3
°Sr, 1 3 7
C s , 1 5 5 E U , 2 3 S P U , and
2 4 1
A m , values for 1 4 7
P m , 2 3 7
N p and 2 4 1
P u .
Note: The results presented in this report are subject to further revision and re-evaluation with the admission of additional analytical data. Data of 2 4 1
P u will be especially welcome for the certification of 2 4 1
A m . The users of the reference material IAEA-367 are therefore encouraged to report all meaningful data as well as any remarks and comments on the sample and the reported concentration values which may help achieve this objective. They will be notified of any changes in the certification status of the sample that may result. The correspondence should be addressed to:
International Atomic Energy Agency Marine Environment Laboratory
19, Avenue des Castellans MC 98000 Monaco
Principality of Monaco
Your laboratory code number is :
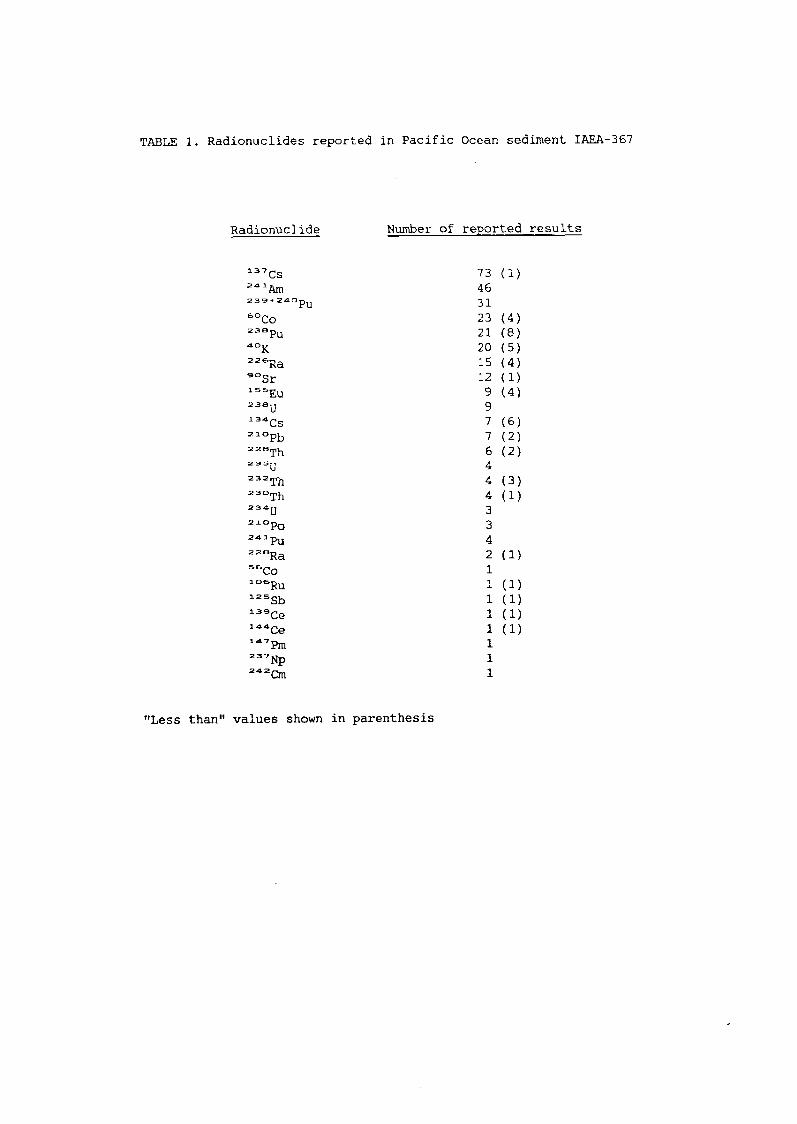
TABLE 1. Radionuclides reported in Pacific Ocean sediment IAEA-367
Radionuclide Number of reported results
1 3 7
C s 73 (1) 2 < l l
A m 46 Z39-»
2 i l 0
pu 31
6
°Co 23 (4) 2 3 0
P u 21 (8) 4
°K 20 (5) Z Z f e
R a 15 (4)
*°Sr 12 (1) 1 s s
E u 9 (4) 2 3 a
u 9 1 3 4
C s 7 (6) z l o
P b 7 (2) 22 8 ^ 6 (2) Z 3 S
U 4 2 3 2
T h 4 (3) Z 3
°Th 4 (1) 2 3 A
U 3 2 1
°Po 3 ZA1Pu 4 z z s
R a 2 (1) S f e
Co 1 1 D &
R u 1 (1) 1 2 S
S b 1 (1) 1 3 9
C e 1 (1) ^ « C e 1 (1)
1 2 3 7
N p 1 2 4 2
C m 1
"Less than" values shown in parenthesis
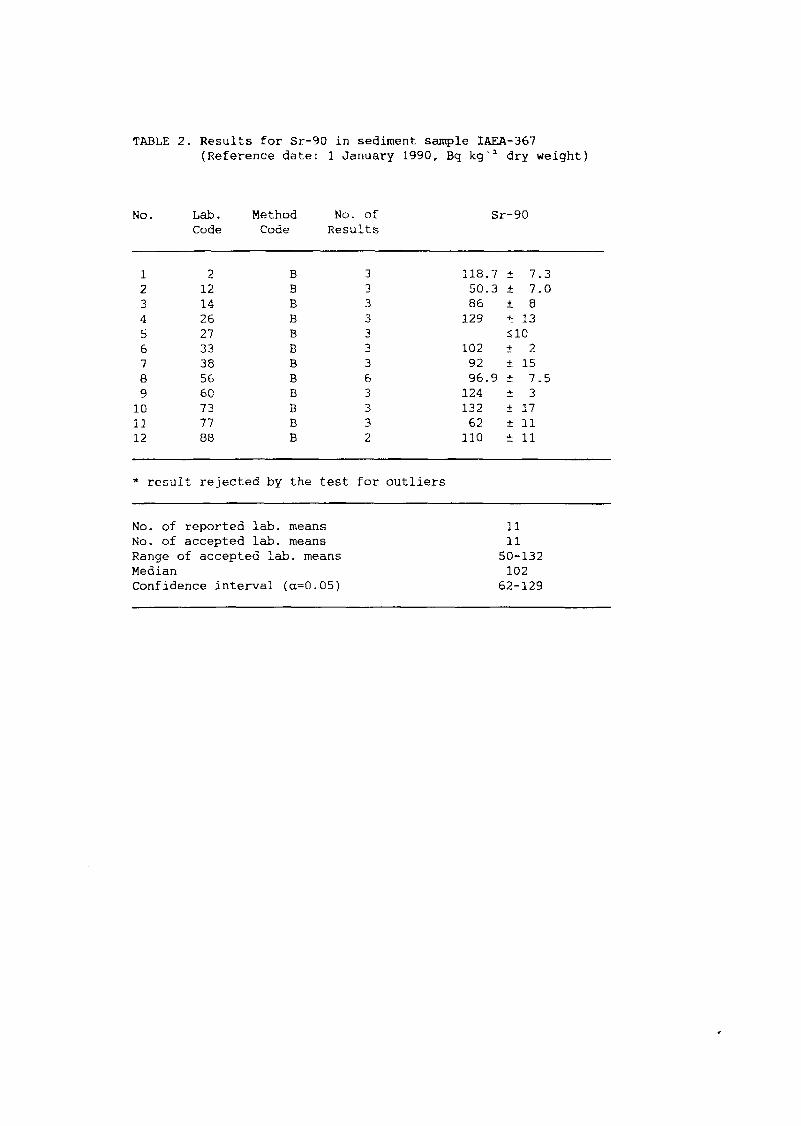
TABLE 8. Results for Th-228, Th-230 and Th-232 in sediment sample IAEA-368 (Reference date: 1 January 1990, Bq k g
- 1
dry weight)
No. Lab. Code
Method Code
No. of Results
Sr-90
1 2 B 3 118. .7 ± 7. .3 2 12 B 3 50. .3 ± 7. .0 3 14 B 3 86 ± 8 4 26 B 3 129 ± 13 5 27 B 3 <10 6 33 B 3 102 + 2 7 38 B 3 92 ± 15 8 56 B 6 96. .9 ± 7. .5 9 60 B 3 124 ± 3
10 73 B 3 132 ± 17 11 77 B 3 62 ± 11 12 88 B 2 110 ± 11
* result rejected by the test for outliers
No. of reported lab. means 11 No. of accepted lab. means 11 Range of accepted lab. means 50-132 Median 102 Confidence interval (a=0.05) 62-129
TABLE 8. Results for Th-228, Th-230 and Th-232 in sediment sample IAEA-368 (Reference date: 1 January 1990, Bq k g
- 1
dry weight)
No Lab. Method No. of Co-60 Cs-137 Eu-155 Code Code Results
1 1 Gl 5 <0.5 186 ± 1 2 2 Gl 7 - 192 ± 7 3 4 Gl 5 - 194 ± 8 4 5 Gl 2 1.4 ± 1.0 220 ± 10 5 6 Gl 2 - 214 ± 4 6 8 Gl 1 0.9 ± 0.2 211 ± 2 7 9 Gl 6 1.0 ± 0.2 192 ± 6 8 10 Gl 4 - 199 ± 10 9 11 Gl 2-5 0.8 ± 0.2 180 ± 5
10 12 Gl 3 - 208 ± 17 11 13 Gl 3 - 202 ± 20 12 14 Gl 3 - 200 ±100 13 15 Gl 6 - 230 ± 10 14 16 Gl 2 _ 184 ± 7 15 19 Gl 6 - 188 ± 22 16 20 Gl 5 - 123 ± 8* 17 24 Gl 6 0.8 ± 0 . 1 196 ± 10 18 25 Gl 1 0.9 ± 0.3 190 ± 10 19 26 Gl 1-5 0.9 ± 0.2 187 ± 9 20 27 Gl 3 <3 172 ± 10 21 29 Gl 1 0.9 ± 0.3 242 ± 25* 22 30 Gl 5 - 167 ± 9 23 33 Gl 3 - 194 + 14 24 34 Gl 2 - 190 ± 10 25 36 Gl 5 - 181 ± 6 26 38 Gl 1 - 194 ± 20 27 39 Gl 4 - 187 ± 15 28 40 Gl 3 - 195 ± 11 29 41 Gl 3 1.3 ± 0.6 209 ± 5 30 42 Gl 3 - 200 ± 10 31 43 Gl 3 0.63 - 0.03 175 ± 3 32 44 Gl 7 <1.5 181 ± 5 33 46 Gl 1 1 194 ± 2 34 47 Gl 3 - 202 ± 1 35 48 Gl 7 - 182 ± 10 36 49 Gl 3 5.7 ± 0.9* 242 ± 4* 37 50 Gl 3 - 207 ± 14 38 51 Gl 5 - 212 ± 6 39 52 Gl - - 350 ± 70* 40 53 Gl 4 - 186 ± 6 41 54 Gl 3 - 188 ± 10 42 55 Gl 6 1.0 ± 0.7 208 ± 9 43 56 Gl 6 - 186 ± 16 44 59 Gl 3 1.3 ± 0.7 207 ± 7 45 60 Gl 3 1.4 ± 0.4 196 ± 9 46 62 Gl 3 - 217 ± 7
0.9 ± 0.3
1.2 ± 0.3
<7
1.9 ± 0.4
TABLE 3 (contd). Results for Co-60, Cs-137 and Eu-155 in sediment sample IAEA-367 (Reference date: 1 January 1990, Bq k g
- 3
dry weight)
No Lab. Method No. of Co-60 Cs-137 Eu-155 Code Code Results
47 63 Gl 3 - 195 + 7 -
48 64 Gl 2 - 195 + 5 -
49 65 Gl 3 - 194 + 2 -
50 66 Gl 2 - 197 + 11 -
51 67 Gl 2 <1 214 + 11 <2.7 52 68a Bt 6 - 202 + 21 -
53 68b Bn 1 - 201 10 -
54 69 Gl 3 - 183 5 <5.8 55 70 Gl 1 - 175 ± 7 2. .2 i 0.4 56 71 Gl 8 - 217 ± 5 -
57 73 Gl 1 - 190 ± 23 -
58 74 Gl 3 - 187 ± 7 -
59 76 Gl 3 - 214 ± 5 -
60 79 Gl 3 - 201 ± 3 -
61 80 Gl 4 0. .9 ± 0. .1 200 ± 6 -
62 81 Gl 6 - 212 + 35 -
63 82 Gl 3 - 188 + 12 5. .6 ±3.6* 64 84 Gl 6 1. .1 + 0, .3 205 + 15 -
65 85 Gl 4 1. .1 + 0. .2 217 + 6 -
66 87 Gl 1 - 224 + 4 -
67 88 Gl 3 - 209 + 10 -
68 89 Gl 1 - 162 + 1 -
69 90 Gl 2 1. .4 + 0. .8 214 + 33 <2.5 70 92 Gl 1 - 170 + 20 -
71 93 Gl 5 - <0 M -
72 94 Gl 3 - 180 + 6 -
73 95 Gl 3 - 178 + 3 -
result rejected by the test for outliers
Number of reported lab. means 19 72 5 Number of accepted lab. means 18 68 4 Range of accepted lab. means 0.6-1.4 162-230 0.9-2.2 Median 1 195 1.6 Confidence interval (a= 0.05) 0.9-1.3 190-201
TABLE 4. Results for Pu-238, Pu-239+240 and Am-241 in sediment sample IAEA-367 (Reference date: 1 January 1990, Bq k g
- 3
dry weight)
No Lab. Method No. of Pu-238 Pu-239+240 Am-241 Code Code Results
1 la Al 4 0.68* 48. ,2 + 2. .6 25.9 + 2.8 2 lb Gl 5 - - 23.0 + 0.3 3 4 Al 3 - 42 + 6 -
4 8a Al 5 - 54. ,7 + 6. .1" -
5 8b Gl 1 - 22.2 + 1.2 6 9a Aln-t 6-8 0.02 ± 0.02 42 ± 3 26.9 + 1.9 7 9b Gl 6 - - 23.7 + 2.5 8 10 Gl 4 - - 31 + 2 9 11 Gl 5 - - 28 ± 1
10 13a AI 1 4 + 1 * 49. 3 + 4. ,0 -
11 13b Gl 3 - - 19.6 + 2.0 12 14 AI 3 < 1 24 + 2 18 + 2 13 15a AI 4 1.0 ± 0.3* 36. 6 + 9. ,8 48.7 + 7.9* 14 15b Gl 6 - - 40 12* 15 16 Gl 2 - - 24 + 4 16 18 AI 4 0.03 ± 0.10 39. 8 + 3. ,3 _ 17 20 Gl 5 - - 13.3 + 4.0* 18 21 AI 3 10 + 5* 32 + 9 -
19 24a AI 4-7 <0.18 38. 0 + 1. ,5 -
20 24b Gl 6 - - 27.7 ± 2.0 21 25 Aln 3 0.08 + 0.06 33 + 3 20 + 3 22 26 Aln 1 0.26 ± 0.06 37. 8 + 2. 3 26.3 ± 1.8 23 28 Aln 3 - 39. 0 ± 1. 4 -
24 29 Gl 1 - - 34 ± 6 25 32 Aln 1 - 41. 6 + 1. .7 29.3 ± 0.7 26 33a Aln 3 0.05 ± 0.05 39 ± 1 -
27 33b G** 3 - - 25 ± 3 28 38 Aln 3 <0.2 51 + 5 33 ± 4 29 40 Gl 3 - - 27 ± 2 30 41 Gl 3 - - 28.1 + 1.3 31 42 Gl 3 - - 23 ± 6 32 43a AI 3 - 34. 3 + 1. 6 -
33 43b Gl 3 - - 23.7 + 2.4 34 47 AI 1 - 38.2 -
35 48 Gl 7 - - 28.2 + 2.0 36 50 Gl 3 - - 21.7 + 10.8 37 53a AI 1 - 30 ± 3 24 + 3 38 53b G 4 - - 9 + 4*
39 54 G 3 - - 12.8 ± 1.3* 40 56 Al 3-5 <0.05 40. 6 + 5. 2 -
41 59 G 3 - - 27 + 2 42 60a Alt 3 0.08 ± 0.04 43. 4 + 0 . 8 30.1 + 1.3 43 60b G 3 - - 29.2 + 1.5 44 61a Aln 1 <0.12 28. 6 + 1. 2 29.4 ± 1.3 45 61b Alt 2 <0.06 30. 8 + 2. ,4 24.5 + 0.8
TABLE 4 (contd). Results for Pu-238, Pu-239+240 and Am-241 in sediment sample IAEA-367 (Reference date: 1 January 1990, Bq k g
_ 1
d r y weight)
No Lab. Method No. of Pu-238 Pu-239+240 Am-241 Code Code Results
46 66 G 2 - - 19 + 3 47 67 G 1 - - 28, .8 ± 2.0 48 68 Alt 4 0. .07 ± 0.01 38 + 2 -
49 70a AI 3 0. .22 ±0.04 37, .2 + 2.3 24. .7 ± 1.4 50 70b G 1 - - 22. .6 + 9.0 51 73 Alt 3 <2 40 + 10 27. .0 ± 5.7 52 74 Al 3 - 33 ± 3 -
53 80 Gl 4 - - 22. .2 ± 0.8 54 82 Gl 3 - - 28. .9 ± 2.2 55 84 Gl 2 - - 28 ± 3 56 87 Gl 1 - - 75 ± 5* 57 88 AI 3 - 25. .6 ± 1.3 -
58 90 Gl 2 - - 25 ± 8 59 91 Alt 4 <0.35 34. .4 + 2.5 26. .5 ± 1.3 69 92 AI 2 - 36 + 8 -
61 95 AI 3 <0.08 39. .0 ± 1.1 26. ,7 ± 0.5
* result rejected by the test for outliers G**: total dissolution + Nd oxalate ppt + Gamma spectrometry
Number of reported lab. means 12 31 46 Number of accepted lab. means 8 30 40 Range of accepted lab. means 0.02-0.26 24-51 18-34 Median 0.08 38 26.4 Confidence interval (a= 0.05) 0.02-0.26 34.4-39.8 24-27.7
TABLE 8. Results for Th-228, Th-230 and Th-232 in sediment sample IAEA-368 (Reference date: 1 January 1990, Bq k g
- 1
dry weight)
No Lab. Method No. of K-40 Code Code Results
1 2 Gl 7 111 ± 4* 2 8 Gl 1 5.6 ± 1.0 3 11 Gl 3 8 ± 3 4 12 Gl 3 5.2 ± 0.4 5 19 Gl 6 <25 6 25 Gl 1 <ND 7 34 Gl 2 71 ± 15* 8 38 Gl 1 43 ± 10* 9 49 Gl 3 94 ± 14*
10 51 Gl 5 <47 11 68 AAS 3 32 ± 7* 12 69 G 2 <239 13 70 G 1 6.3 ± 0.3 14 74 G 3 245 ± 37* 15 85 G 3 3.2 ± 0.9 16 87 G 1 2 ± 17 17 88 G 3 15 ± 7.5* 18 89 G 1 4.9 ± 0.2 19 90 G 2 <13 20 94 G 3 507 ± 17*
* result rejected by the test for outliers
Number of reported lab. means 15 Number of accepted lab. means 7 Range of accepted lab. means 2-8 Median 5.2 Confidence interval (a=0.05) 2-8
TABLE 8. Results for Th-228, Th-230 and Th-232 in sediment sample IAEA-368 (Reference date: 1 January 1990, Bq k g
- 1
dry weight)
No Lab. Method No. of U-238 U-235 U-234 Code Code Results
1 1 G2 5
2 3 NAA 1
3 5 G 2
4 11 G2 4
5 13 Al 1-2 6 14 F 3 7 21 Al 3 8 27 Al 2 9 42 G 3 10 53 G2 4
11 55 G 6 12 69 G 2 13 80 G 4 14 87 G2 1
18.1 ± 1.3 4.6 ± 1.0*
2.8 + 1.3 19 ± 2
20.5 ± 2.0 0.9 ± 0.2 24 ± 2 Total U = 330 ± 30
37 ± 5 - 4 4 + 7 10.9 ± 2.0 - 12.8± 2 3 2 + 1 1 27 ± 11
2.1 ± 1.4 Total U = 8.9 ± 3.3
1.07 ± 0.12 20 ± 13
* result rejected by the test for outliers
Number of reported lab. means 9 Number of accepted lab. means 8 Range of accepted lab. means 10.9-37 Median 20.3 Confidence interval (a=0.05) 10,9-37
4 4
0.9-2.8 1.6
3 3
12.8-44 24
TABLE 7. Results for Th-232, Th-230 and Th-228 in sediment sample IAEA-367 (Reference date: 1 January 1990, Bq k g
- 1
dry weight)
No Lab. Method No. of Th-232 Th-230 Th-228 Code Code Results
1 3 G2 - - - 3. .6 ± 1.2 2 11 G2 2 - - 0. .2 ± 0.2 3 14 Al 3 <500 <500 <10 4 21 Al 3 - 26 ± 5 «
5 29 G2 1 <4 - -
6 53 G2 - - - i5 7 68 Alt 1 0.2 ± 0.2 5.5 ± 0.6 0 . .7 ± 0.3 8 74 Al 3 - 19 ± 2 -
9 87 G 1 - - 0 ± 2 10 90 G2 2 $4 - -
TABLE 8. Results for Th-228, Th-230 and Th-232 in sediment sample IAEA-368 (Reference date: 1 January 1990, Bq k g
- 1
dry weight)
No Lab. Method No.of Ra-226 Ra-228 Code Code Results
1 3 Em 1 0.5 ± 0.3 -
2 8 G 1 15.3 ± 2 -
3 11 G2 4 0.7 ± 0.3 1.2 ± 0 4 13 G 3 <2 -
5 14 Em 3 2.1 ± 0.9 -
6 21 G2 3 24 ± 4 -
7 29 G2 1 <1.1 -
8 34 G 2 10.7 ± 0.5 -
9 49 G2 3 13.6 ± 2 -
10 53a G 4 25 ± 14 <4 11 53b G2 4 <3 -
12 69 G x 6.5 ± 2.0 -
13 85 G 3 1 ± 0.3 -
14 87 G 1 18 ± 2 -
15 90 G2 2 <5 -
* result rejected by the test for outliers
Number of reported lab. means 11 Number of accepted lab. means 11 Range of accepted lab.means 0.5-25 Median 10.7 Confidence interval (a=0.05) 0.7-24
TABLE 9. Results for Pb-210 and Po-210 in sediment sample IAEA-367 (Bq k g
- 1
dry weight)
NO Lab. Method No. of Pb-210 Method No. of Reference Po-210 Code Code Results Code Results Date
1 13 B 1 12.3 ± 1.0 _ _ 2 14 B 3 <25 - - - -
3 24 B 6 0.45 ±0.10 - - -
4 26 G 2 <1.6 A 4 01/01/90 6.1 ± 0.8 5 40 A 3 5.4 ± 0.6
+
A 3 19/12/90 5.2 ± 0.6 6 45 A 3 5.8 ± 0.5* - - - -
7 53 - - - A 1 01/01/90 10 ± 2 8 69 G 1 536 ± 212 - - - -
For Pb-210, the reference date is 01/01/90 ^ assuming equilibrium between Pb-210 and Po-210
TABLE 10. Results for the less frequently reported artificial radionuclides in sediment sample IAEA-367 (Reference date: 1 January 1990, Bq k g
- 1
dry weight)
Isotope Lab. Code
No. of Results
Activity Concentrât ion
Co-56
Ru-106
Sb-125
Cs-134
Ce-139
Ce-144
Pm-147
Np-237
Pu-241
46
90
90
19
20 34 53 59 70 93
53
90
60
60
9 60 91 95
= 5
<15
<3
<2.5 <0.9
2.5 ± 1.2 <5 < 0 . 8 <1 SO. 14
<7
<10
33.5 ± 1
0.39 ± 0.21
170 ± 20 183 ± 4 190 ± 50 154 ± 7
Cm-242 15 3.5 ± 0.8
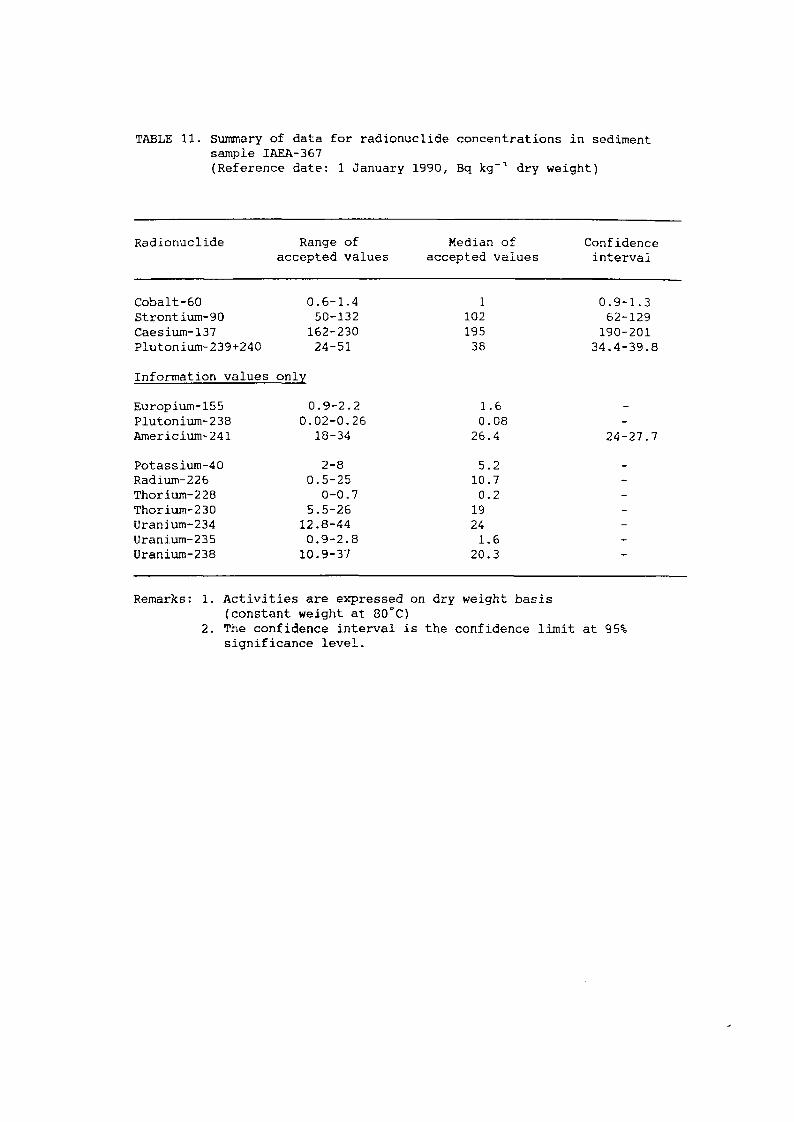
TABLE 11. Summary of data for radionuclide concentrations in sediment sample IAEA-367 (Reference date: 1 January 1990, Bq k g
- 1
dry weight)
Radionuclide Range of Median of Confidence accepted values accepted values interval
Cobalt-60 0.6-1.4 1 0.9-1.3 Strontium-90 50-132 102 62-129 Caesium-137 162-230 195 190-201 Plutonium-239+240 24-51 38 34.4-39.8
Information values only
Europium-155 0.9-2.2 1 .6 -
Plutonium-238 0.02-0.26 0, ,08 -
Americium-241 18-34 26. ,4 24-27.7
Potassium-40 2-8 5. 2 _ Radium-226 0.5-25 10. 7 -
Thorium-228 0-0.7 0. 2 -
Thorium-230 5.5-26 19 -
Uranium-234 12.8-44 24 -
Uranium-235 0.9-2.8 1. 6 -
Uranium-238 10.9-37 20. 3 -
Remarks: 1. Activities are expressed on dry weight basis (constant weight at 80°C)
2. The confidence interval is the confidence limit at 95% significance level.
ANNEX L i s t o f p a r t i c i p a t i n g l a b o r a t o r i e s
Dr. Stephen A . Short, Manager Dr. E. Henrich Environmental Radiochemistry Lab. BALUF Wien Australian Nuclear Science and Abt. 14/Strahlenschutz
and Technology Organisation Berggasse 11 Private Mail Box 1 A-1090 Wien Menai, N.S.W. 2234 Austria Australia
Dr. F.J. Maringer BVFA Arsenal Geotechnisches Institut Isotopengeophys ik Faradaygasse 3 A-1030 Wien Austria
Dr. H. Vanmarcke C.E.N/S.C.K Boeretang 200 B-2400 Mol Belgium
Dr. Ieda I.L. Cunha IPEN-CNEN/SP Rua do Matao Trav. R No.400 - CEP 05508 Caixa Postal 11049 (Pinheiros) Sao Paulo Brazil
Dr. Kleber Riheiro Cosenza Furnas Centrais Eletricas S.A. Depart, de Geracao de Angra. DGA.N -DNPA.N-Setor Ambiental 1. Rod. Rio Santos Kml32 - CEP 23.900 Angra dos Reis - Rio de Janeiro 3razil
Dr. Luzia Venturini Environmental Monitoring Division Dept. of Radiological Protection IPEN-CNEN-SP- NP NPA Caixa Postal 11049 - Pinheiros 05499 Sao Paulo - SP Brazil
Ms. M.E. Vianna Instituto de Radioprotecao Depto. de Protecao Radiologica A m b . Av. Americas km 11.5 Caixa Postal 37750 - RJ 22602 - Barba da Tijura Brazil
D r . A . Kudo Senior Research Officer
and Visiting Professor National Research Council of Canada 100 Sussex Drive Ottawa, Ontario K1A 0R6 Canada
Dr. Richard Nelson Bedford Institute of Oceanography Dept. of Fisheries and Oceans Marine Chemistry Division P.O. Box 1006 Dartmouth, N.S. Canada B2Y 4A2
Dr. John Tai-Pow Ontario Ministry of Labour Radiation Protection Service 81 Resources Road Weston, Ontario M9P 3T1 / Canada
Dr. L. Zikovsky Ecole Polytechnique C.P. 6079, Succ. "A" Montréal, QC H3C 3A7 Canada
Dr. Shaoming Pan Department of GEO & OCEAN Services Nanjing University Nanjing 210008 China, People's Republic of
Dr. Zhu Shuzhong Institute of Atomic Energy P.O. Box 275-20 Beijing China, People's Republic of
Dr. A. Slavik V U J E Nuclear Power Plants Research Institute 919 31 Jaslovske Bohunice Czechoslovakia
Dr. Denisa Nikodemova, CSC Research Institute of
Preventive Medicine Limbova 14 CS-833 01 Bratislava Czechoslovakia
Dr. I. Malatova Laboratory of Spectrometry Centre of Radiation Hygiene Institute of Hygiene and Epidem. Srobarova 48 Praha 10 Cz e c ho slovakia
Dr. A. Aarkrog Health Physics Department Riso National Laboratory DK-4000 Roskilde Denmark
Dr. M.Lafon Marine Nationale Sect, de Surveillance Radiologique B.P.61 83800 Toulon France
Mr. Y. Bourlat CEA/DIRCEN SMSR B.P. 16 F-91311 Montlhéry Cédex France
Hr. C. Poletiko CEA - IP3N Lab. d'Etude et de Surveillance de 1'Environnement B.P. 519 Papeete
French Polynesia
Dr. G. Kanisch Bundesforschungsanstalt für fisher. Labor f. Radioökologie der Gewässer Wüstland 2 D-2000 Hamburg 55 Germany
Dr. Hans-Ulrich Fusban Institut f. Wabohu-Hygiene Labor BI 2 Corrensplatz 1 D-1000 Berlin 33 Germany
Dr. Harmut Nies Federal Maritime and Hydrographie Agency
Bernhard-Nocht-Straße 78 Postfach 30 12 20 D-2000 Hamburg 36 Germany
Dr. J. Thiele National Board of Nuclear Safety
and Radiation Protection Waldowallee 117 D-1157 Berlin Germany
Dr. M . Rossbach Institute of Applied Physical Chem. Nuclear Research Centre - Jülich D-5170 Jülich Germany
Dr. Wolfgang Staede Niedersaechsisches Landesamt
für Wasser und Abfall an der Scharlake 38 Postfach D-3200 Hildesheim Germany
Prof. Dr. med. Edmund Lengfelder Strahlenbiologisches Institut
der Universität München Schillerstrasse 42 D-8000 München Germany
Ms. H. Florou NCRPS "Democritos" Institute of Nuclear Technology Environmental Radioactivity Lab. P.O. Box 60228 15310 Aghia Paraskevi - Athens Greece
Mr. W . M. Leung Royal Observatory, Hong Kong Hong Kong Government 134A Nathan Road Kowloon Hong Kong
Dr. Agota Ugron National Research Institute for
Radiobiology and Radiohygiene P.O. Box 101 H-1775 Budafok 1 Hungary
Dr. Peter Zombori Central Research Institute for Physics of the Hungarian Academy of Sciences - Health Physics Dept. P.O. Box 49 H-1525 Budapest 114 Hungary
Ms. Stephanie Long Nuclear Energy Board 3 Clonskeagh Square Clonskeagh Road Dublin 14 Ireland
Dr. M. Terrani Istituto di Ingegneria Nucleare Politecnico di Milano Via Ponzio 3413 20133 Milano Italy
Dr. T. Kimura Japan Chemical Analysis Centre 295-3 Sanno-cho Chiba-Shi Chiba 281 Japan
Dr. Rafael Martinez Lugo C.N.S.N.S. Env. Radiation Surveillance Branch Apartado Postal 20-188 01000 Mexico, D.F. Mexico
Dr. A.W. van Weers Netherlands Energy Research Foundation ECN Westerduinweg 3 - Postbus 1 NL-1755 ZG Petten Netherlands
Mr. Hans Nootenboom Food Inspection Service P.O. Box 260 NL-6500 AG Nijmegen Netherlands
Dr. G.C. Christensen Institute for Energy Technology Health and Safety Department P.O. Box 40 N-2007 Kjeller Norway
Mr. Finn Ugletveit National Institute for
Radiation Hygiene P.O. Box 55 N-1345 Oesteras Norway
Dr. Flora Santos Philippine Nuclear Research Inst. Don Mariano Marcos Ave. Diliman, Quezon City Philippines
Dr. A. Pietrusziewski Central Laboratory for Radiological Protection Department of Dosimetry Konwaliowa 7 03-194 Warsaw Poland
Dr. R. Bojanowski Institute of Oceanology - PAN ul. Powstancow Warszawy 55 81-967 Sopot Poland
Dr. A. Ortins de Bettencourt LNETI Dept. de Protec. e Segur. Radiolog. Estrada Nacional No.10 2685 Sacavem Portugal
Dr. C. Milu Head, Radiation Hygiene Laboratory Inst, for Hygiene & Public Health Str. Dr. Leonte No. 1-3 R-76256 Bucharest 35 Romania
Dr. I. Popescu Institute for Nucl. Power Reactors Environmental Monitoring Laboratory P.O. Box 78 0300 Pitesti Romania
Dr. I.I. Georgescu Polytechnic Institute "Georghe Georghiu-Dej" Faculty of Chemical Engineering Bucharest Romania
Dr. Iolanda Osvath Environmental Radioactivity Research Laboratory Inst, of Meteorology and Hydrology P.O. Box 11, C.P. 11-2 Bucharest Romania
Dr. M . Salagean Institute for Physics and Nuclear Engineering P.O. Box MG-6 Bucharest Romania
Mr. Ovidiu Ferdes Scientific Research. Institute of Food Chemistry Str. Girlei No.l, Sect.l Bucharest Romania
Dr. R.J.N. Brits Council for Nuclear Safety P.O. Box 7106 Hennopsmeer 0046 South Africa
Mr. B. Marshall Koeberg Nuclear Power Station Environmental Survey Laboratory Private Bag X10 7440 Kernkrag South Africa
Dr. C. Gasco Leonarte CIEMAT (P.R.Y.M.A.) ED.3 Av. de la Complutense 22 28040 Madrid Spain
Dr. I. Vallès Instituto de Tecnicas Energeticas Univers. Politecnicas de Barcelona Diagonal 647, ETS11B 8028 Barcelona 28 Spain
Dr. J.A. Sanchez-Cabeza Servei de Fisica de les Radiacions Universität Autonoma de Barcelona Environmental Radioactivity Lab. 08193 - Bellaterra (Barcelona) Spain
Dr. Juan Palomares Lopez Jefe Seccion Analisis y Medidas Av. de la Complutense, 22 Ciudad Universitaria 28040 Madrid Spain
Dr. Elis Holm Institute of Science & Technology Lund University Lasarettet S-221 85 Lund Sweden
Dr. Georg Neumann Statens Naturvardsverk National Swedish Environment Protection Board Department of Coastal Water S-170 11 Drottningholm Sweden
Ms. Judith Melin, Division Head National Institute of Radiation
Protection Environmental Laboratories P.O. Box 60204 S-104 01 Stockholm Sweden
Ms. Pornsri Polphong Radiation Measurement Division Office of Atomic Ehergy for Peace Vibhavadee Rangsit Road, Bangkhen Bangkok 10900 Thailand
Dr. B.R. Harvey MAFF Directorate of Fisheries Research Pakefield Road Lowestoft, Suffolk NR33 OHT UK
Dr. J. Toole Environm. & Medical Sciences Div. AEA Technology Harwell Laboratory Didcot
Oxfordshire 0X11 ORA UK
Dr. K.J. Ode11 Central Electricity Generating Bd Scientific and Technical Branch Canal Road Gravesend, Kent DA12 2RS UK
Dr. M. Williams Cardiff City Analysts Crofts Street Cardiff CF2 3DY South Wales UK
Mr. M.J. Youngman National Radiological
Protection Board Chilton, Didcot Oxfordshire 0X11 ORQ UK
Mr. P. Fannon, Leader U.K.A.E.A. Dounreay Nuclear Power Caithness UK
Mr. I.P. Los All-Union Scientific Centre
of Radiation Medicine Medical Academy Melnikova 53 Kiev 50 - 252050 UKSSR
Dr. Carlos Kreimer Catedra de Radioquimica Facultad de Quimica Casilla de Correo 1157
Montevideo URuguay
Dr. I.L. Larsen Environmental Sciences Division Oak Ridge National Laboratory Oak Ridge, TN 37831-6036 USA
Dr. James B . Moore QC Coordinator Environmental Protection Agency 1504 Avenue A Montgomery, AL 36115-2601 USA
Dr. K.M. Wong Lawrence Livermore National Lab. P.O. Box 808 7000 East Avenue Livermore, CA 94550 USA
Dr. Liaquat Husain, Rm. D345 Laboratory of Inorganic and Nuclear Chemistry Wadsworth Center for Labs. & Res. Empire State Plaza - P.O. Box 509 Albany, NY 12201-0509 USA
Dr. Shawki A . Ibrahim Department of Radiology 339 MRB Building Colorado State University Fort Collins, Colorado 80523 USA
Dr. Evgeny G. Vertman, Head Polytechnic Institute Geological Faculty 30 Lenin Prospect 634004 Tomsk USSR
Mr. Pham Quang Dien Viet Nam National
Atomic Energy Commission 67 Nguyen Du Hanoi Viet Nam
Dr. Alica Bauman Inst. Med. Research & Occ. Health Department of Radiation Protection Mose Pijade 158 - P.O. Box 291 41001 Zagreb Yugoslavia
Dr. M. Korun Dr. Istvan Bikit Nuclear Institute "Jozef Stefan" Institute of Physics Jamova 39 Iiije Duricica 4 P.O. Box 100 21000 Novi Sad YU-61111 Ljubljana Yugoslavia Yugoslavia
Dr. Miran Kanduc, Head Zavod SRS za varstvo pri delu Bohoriceva 22A YU-61000 Ljubljana Yugoslavia
Dr. Stjepan Lulic Institute "Rudjer Boskovic" Bijenicka 54 P.O. Box 16 YU-41001 Zagreb Yugoslavia
Dr. S. Ballestra International Atomic Energy Agency International Marine Laboratory 19, Avenue des Castellans MC-98000 Monaco Monaco principality