Embed Size (px)
Citation preview
Causes of differing temperature trends in radiosonde upper air
data sets
Melissa Free and Dian J. SeidelAir Resources Laboratory, NOAA, Silver Spring, Maryland, USA
Received 30 September 2004; revised 26 January 2005; accepted 10 February 2005; published 6 April 2005.
[1] Differences between trends in different radiosonde temperature products resultingfrom the varying choices made by the developers of the data sets create obstacles for useof those products in climate change detection and attribution. To clarify the causes of thesedifferences, one must examine results using a common subset of locations to minimizespatial sampling effects. When this is done for the Lanzante-Klein-Seidel (LKS) andHadley Center (HadRT) radiosonde data sets, differences are reduced by at least one third.Differing homogeneity adjustment methods and differences in the source data are bothimportant factors contributing to the remaining discrepancies. In contrast, subsampling themicrowave sounding unit (MSU) satellite data sets according to the radiosonde coveragedoes not generally bring the trends in the satellite data closer to those in the radiosondedata so that adjustments and other processing differences appear to be the predominantsources of satellite-radiosonde discrepancies. Experiments in which we subsampleglobally complete data sets provide additional insight into the role of sampling errors. Inthe troposphere, spatial sampling errors are frequently comparable to the trends for 1979–1997, while in the stratosphere the errors are generally small relative to the trends.Sampling effects estimated from National Centers for Environmental Prediction reanalysisand MSU satellite data for seven actual radiosonde networks show little consistent relationbetween sampling error and network size. These results may have significant implicationsfor the design of future climate monitoring networks. However, estimates of samplingeffects using the reanalysis and the satellite data sets differ noticeably from each other andfrom effects estimated from actual radiosonde data, suggesting that these globallycomplete data sets may not fully reproduce actual sampling effects.
Citation: Free, M., and D. J. Seidel (2005), Causes of differing temperature trends in radiosonde upper air data sets, J. Geophys. Res.,
110, D07101, doi:10.1029/2004JD005481.
1. Introduction
[2] Several radiosonde temperature data sets have beencreated in recent years, including the Angell [2003],Lanzante-Klein-Seidel (LKS) [Lanzante et al., 2003a,2003b], and Hadley Center (HadRT) [Parker et al., 1997]data sets. These temperature records are important forclimate change detection and attribution studies [e.g.,Santer et al., 1996; Tett et al., 1996; Thorne et al.,2002]. Unfortunately, the data sets do not give the sametrends for large-scale means on multidecadal timescales.Seidel et al. [2004] compared trends and other signalsfrom upper air data sets using layer mean and microwavesounding unit (MSU) satellite equivalent temperatures,showing that the data sets give relatively consistentvalues for the El Nino–Southern Oscillation, volcanic,and quasi-biennial oscillation signals but more widelyvarying results for trends. Differences between tempera-ture trends in the tropics derived from the HadRT and
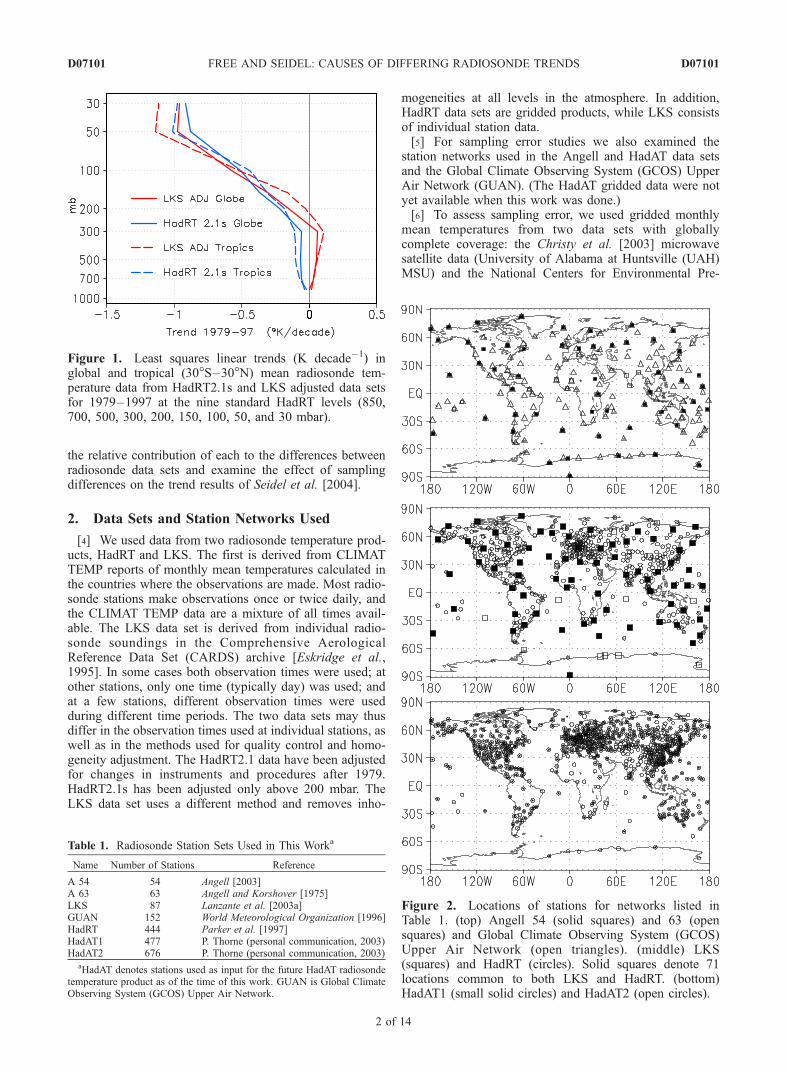
LKS radiosonde data sets for a midtropospheric layercorresponding to that measured by the MSU channel 2satellite product were 0.1 K decade�1 (�0.132 for HadRTversus �0.032 for LKS) for 1979–1997. Global radio-sonde temperature trends differed from actual MSUsatellite trends by 0.16–0.31 K decade�1 in the strato-sphere, or 26–51% of the mean trend. Trends inHadRT2.1s and LKS adjusted data plotted by pressurelevel also show marked differences (Figure 1) not only inmagnitude but even in sign. Moreover, HadRT showstrends that are more negative with increasing altitudewhile LKS shows more warming with height up to300 mbar in the tropics. These differences may haveimportant implications for detection of long-term climatechange and attribution of its causes. They contribute touncertainties in vertical differences in temperature trends,which are currently the subject of considerable scientificinterest. How can we account for them?[3] Possible sources of these differences include spatial
sampling differences, temporal sampling differences, differ-ences in the original data, adjustments for inhomogeneities,and other differences in processing. In this paper we assess
JOURNAL OF GEOPHYSICAL RESEARCH, VOL. 110, D07101, doi:10.1029/2004JD005481, 2005
This paper is not subject to U.S. copyright.Published in 2005 by the American Geophysical Union.
D07101 1 of 14
the relative contribution of each to the differences betweenradiosonde data sets and examine the effect of samplingdifferences on the trend results of Seidel et al. [2004].
2. Data Sets and Station Networks Used
[4] We used data from two radiosonde temperature prod-ucts, HadRT and LKS. The first is derived from CLIMATTEMP reports of monthly mean temperatures calculated inthe countries where the observations are made. Most radio-sonde stations make observations once or twice daily, andthe CLIMAT TEMP data are a mixture of all times avail-able. The LKS data set is derived from individual radio-sonde soundings in the Comprehensive AerologicalReference Data Set (CARDS) archive [Eskridge et al.,1995]. In some cases both observation times were used; atother stations, only one time (typically day) was used; andat a few stations, different observation times were usedduring different time periods. The two data sets may thusdiffer in the observation times used at individual stations, aswell as in the methods used for quality control and homo-geneity adjustment. The HadRT2.1 data have been adjustedfor changes in instruments and procedures after 1979.HadRT2.1s has been adjusted only above 200 mbar. TheLKS data set uses a different method and removes inho-
mogeneities at all levels in the atmosphere. In addition,HadRT data sets are gridded products, while LKS consistsof individual station data.[5] For sampling error studies we also examined the
station networks used in the Angell and HadAT data setsand the Global Climate Observing System (GCOS) UpperAir Network (GUAN). (The HadAT gridded data were notyet available when this work was done.)[6] To assess sampling error, we used gridded monthly
mean temperatures from two data sets with globallycomplete coverage: the Christy et al. [2003] microwavesatellite data (University of Alabama at Huntsville (UAH)MSU) and the National Centers for Environmental Pre-
Figure 1. Least squares linear trends (K decade�1) inglobal and tropical (30�S–30�N) mean radiosonde tem-perature data from HadRT2.1s and LKS adjusted data setsfor 1979–1997 at the nine standard HadRT levels (850,700, 500, 300, 200, 150, 100, 50, and 30 mbar).
Table 1. Radiosonde Station Sets Used in This Worka
Name Number of Stations Reference
A 54 54 Angell [2003]A 63 63 Angell and Korshover [1975]LKS 87 Lanzante et al. [2003a]GUAN 152 World Meteorological Organization [1996]HadRT 444 Parker et al. [1997]HadAT1 477 P. Thorne (personal communication, 2003)HadAT2 676 P. Thorne (personal communication, 2003)
aHadAT denotes stations used as input for the future HadAT radiosondetemperature product as of the time of this work. GUAN is Global ClimateObserving System (GCOS) Upper Air Network.
Figure 2. Locations of stations for networks listed inTable 1. (top) Angell 54 (solid squares) and 63 (opensquares) and Global Climate Observing System (GCOS)Upper Air Network (open triangles). (middle) LKS(squares) and HadRT (circles). Solid squares denote 71locations common to both LKS and HadRT. (bottom)HadAT1 (small solid circles) and HadAT2 (open circles).
D07101 FREE AND SEIDEL: CAUSES OF DIFFERING RADIOSONDE TRENDS
2 of 14
D07101
diction (NCEP)/National Center for Atmospheric Researchreanalysis [Kalnay et al., 1996]. In section 4.1 we alsoshow results from the Mears et al. [2003] satellite dataset (Remote Sensing Systems, Inc. (RSS)), derived fromthe same satellite observations as Christy et al. but usingdifferent processing. While radiosonde data sets arederived from point measurements at specific locationsand discrete pressure levels, the satellite observationsrepresent emissions over a large horizontal and verticalarea. Sonde data sets include at least nine atmosphericlevels, while the satellite data available for the last 23years are reported for only two or three broad verticallayers. For comparison purposes we translate sonde datainto layer means approximately equivalent to the MSUlayers using a globally uniform weighting function as in
Seidel et al. [2004], applied to the temperatures atpressure levels available in the radiosonde data sets.The results are referred to herein as MSU equivalentlayer means. Because the satellite data have much lessvertical and horizontal resolution, they would not beexpected to show the same spatial and temporal variabil-ity as the radiosonde observations.[7] The reanalysis data set is derived from in situ and
satellite observations combined using a numerical weatherforecasting model. As with the satellite data, griddeddata in the reanalysis represent the mean of conditionswithin an area spanning several degrees latitude andlongitude, rather than the single point represented byradiosonde data. The use of several data sources and theinfluence of the model might be expected to reduce
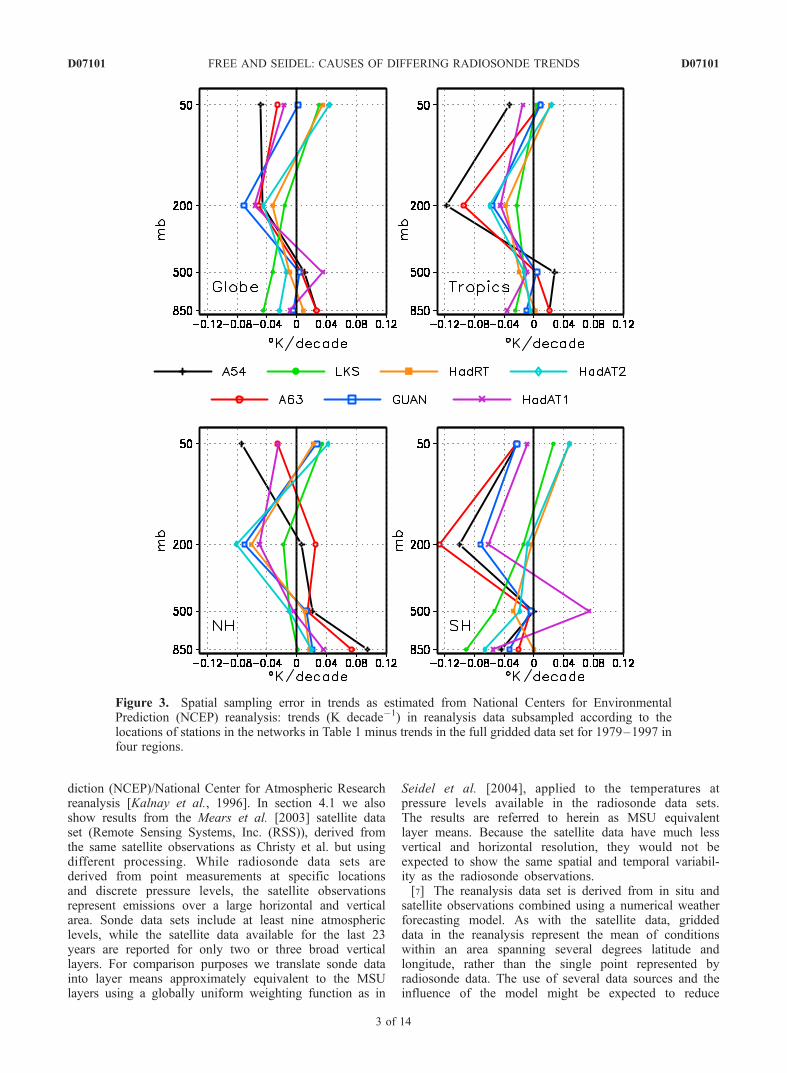
Figure 3. Spatial sampling error in trends as estimated from National Centers for EnvironmentalPrediction (NCEP) reanalysis: trends (K decade�1) in reanalysis data subsampled according to thelocations of stations in the networks in Table 1 minus trends in the full gridded data set for 1979–1997 infour regions.
D07101 FREE AND SEIDEL: CAUSES OF DIFFERING RADIOSONDE TRENDS
3 of 14
D07101
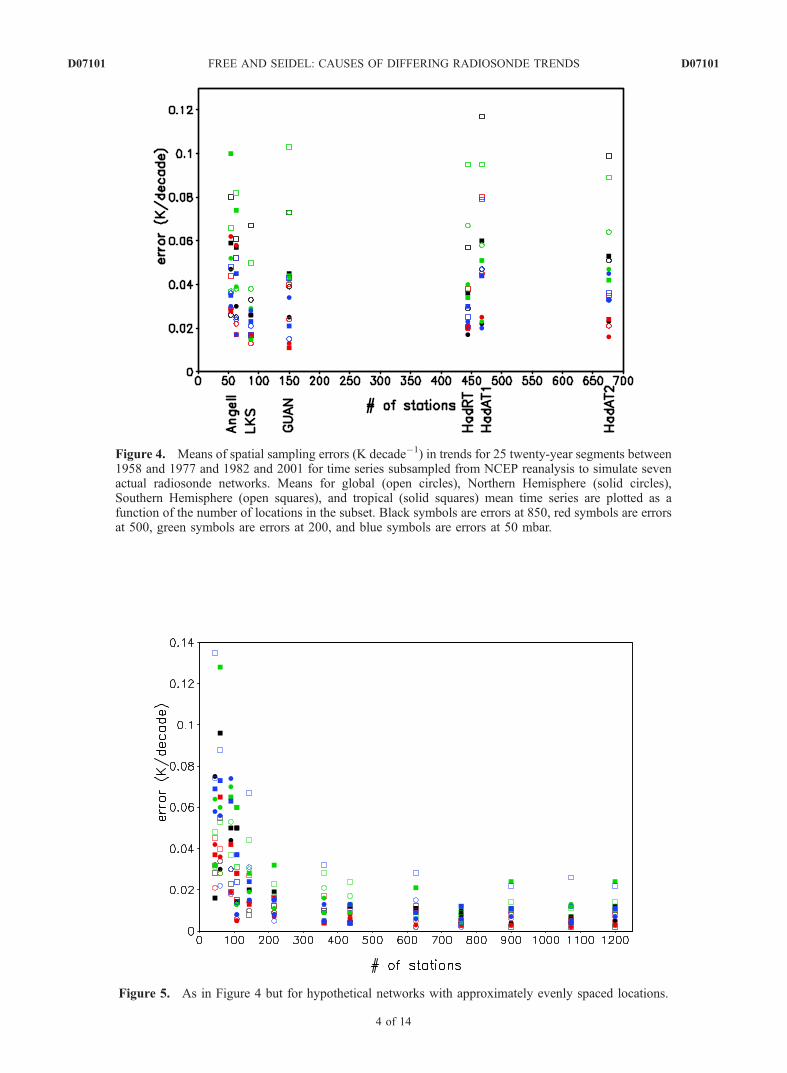
Figure 4. Means of spatial sampling errors (K decade�1) in trends for 25 twenty-year segments between1958 and 1977 and 1982 and 2001 for time series subsampled from NCEP reanalysis to simulate sevenactual radiosonde networks. Means for global (open circles), Northern Hemisphere (solid circles),Southern Hemisphere (open squares), and tropical (solid squares) mean time series are plotted as afunction of the number of locations in the subset. Black symbols are errors at 850, red symbols are errorsat 500, green symbols are errors at 200, and blue symbols are errors at 50 mbar.
Figure 5. As in Figure 4 but for hypothetical networks with approximately evenly spaced locations.
D07101 FREE AND SEIDEL: CAUSES OF DIFFERING RADIOSONDE TRENDS
4 of 14
D07101
noise in the observations so that, like the satellite data,the reanalysis temperatures are not expected to containall of the spatial and temporal variability of the radio-sonde data.
3. Sampling Error
3.1. Previous Work
[8] Several earlier studies have subsampled globallycomplete data sets according to radiosonde network cover-age to assess sampling error. Using Geophysical FluidDynamics Laboratory model output, Oort [1978] estimatedthat RMS errors in monthly mean global tropospheric upperair temperatures due to spatial sampling gaps at individualpressure levels were 0.5–1.0 K for an 855-station network.Oort [1978] concluded that the network was generally
adequate for determining large-scale circulation statisticsand trends in the Northern Hemisphere (NH) but not in theSouthern Hemisphere (SH). Trenberth and Olson [1991]used European Centre for Medium-Range Weather Fore-casts (ECMWF) operational analyses subsampled accordingto the Angell 63-station network [Angell and Korshover,1975]. They found that RMS differences between completeand subsampled seasonal mean layer mean series in thetroposphere were 0.07–0.11 K for global means, 0.10–0.20for the NH, and 0.08–0.20 for the SH.[9] In more recent work, Santer et al. [1999] compared
the effects of coverage differences on trends for the globe,NH, and SH for MSU equivalent layers using the coverageof the HadRT data set applied to NCEP and ECMWFreanalysis (ERA) [Gibson et al., 1997] and MSU satellitedata. For global mean trends from 1979 to 1993 the differ-
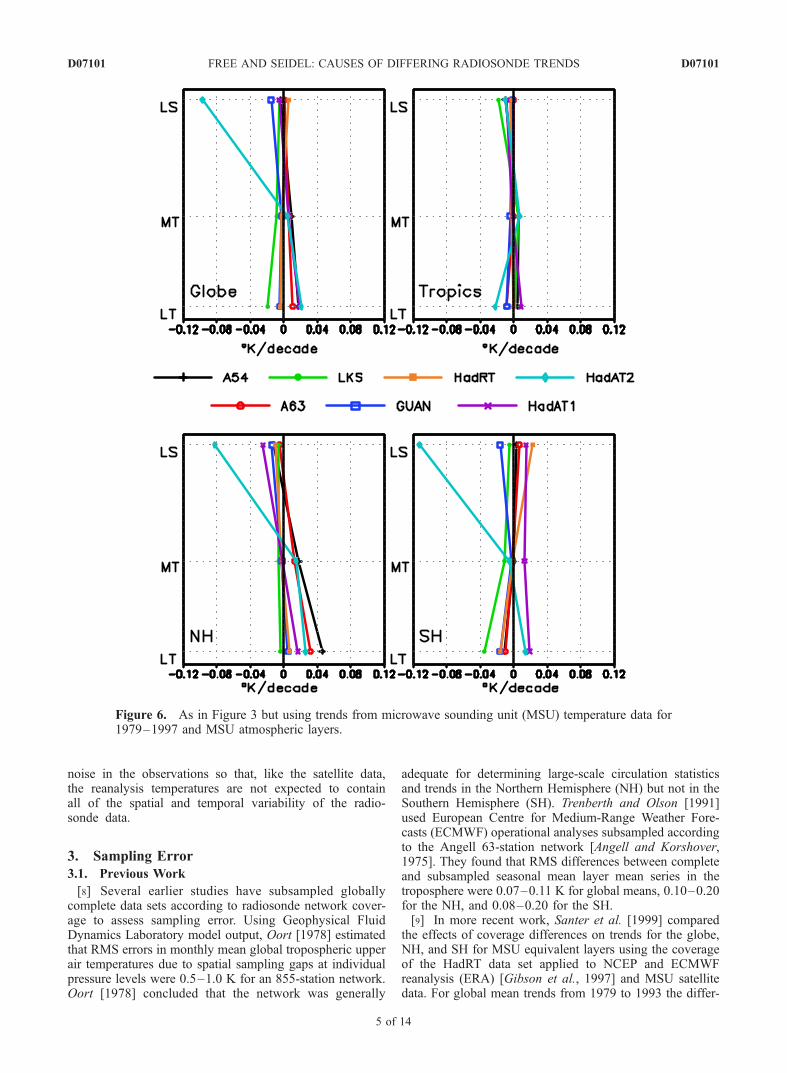
Figure 6. As in Figure 3 but using trends from microwave sounding unit (MSU) temperature data for1979–1997 and MSU atmospheric layers.
D07101 FREE AND SEIDEL: CAUSES OF DIFFERING RADIOSONDE TRENDS
5 of 14
D07101
ences ranged from near zero for the midtroposphere usingthe ERA temperatures to 0.131 K decade�1 (out of a trendof �0.3) for the stratosphere. Rosen et al. [2003] sub-sampled NCEP reanalysis data to evaluate various radio-sonde station networks in the United States and NorthAmerica and found that differences in 500-mbar trendsamong the networks were no larger than 0.03 K decade�1
(�10–50% of the trend). In contrast, Agudelo and Curry[2004] found differences of up to 0.08 K decade�1 betweentropospheric trends in full global data sets and the same datasets subsampled according to the LKS network using anonparametric trend estimator. They concluded that theLKS network overestimated the temperature trend becauseof the shortage of observations over the oceans.[10] Similar approaches have been used for surface data
[e.g., Hansen and Lebedeff, 1987; Karl et al., 1994]. Analternative approach to spatial sampling error is to estimatespatial degrees of freedom from correlation decay lengths[e.g., Jones et al., 1997]. That approach is deferred forfuture investigation.[11] Here we expand on previous sampling error work by
using a longer time period and additional station networks,and we examine effects at individual pressure levels as well
as for layer means. We compare results based on the NCEPreanalysis with those from the UAH MSU satellite record[Christy et al., 2003] and from actual radiosonde data todetermine sensitivity of the estimates to choice of data set.We also directly address the causes of previously identifieddifferences in trends and compare trends in different upperair data sets using similar spatial and temporal sampling foreach.
3.2. Spatial Sampling Error Estimated From GloballyComplete Data Sets
[12] The usefulness of error estimates obtained by sub-sampling a global data set depends on the realism of thespatial and temporal variability in the globally completedata set. As discussed in section 2, the globally completedata sets report temperatures at different spatial and tempo-ral resolutions than the radiosonde data sets. We calculatedthe spatial standard deviations of trends in annual meandata in the MSU and NCEP data sets using locationscorresponding to 444 stations used in the HadRT data set.As might be expected, the standard deviations of theglobally complete data sets are one half to two thirds ofthose for actual radiosonde data (which range from 0.37 Kdecade�1 at 500 mbar to 0.70 K decade�1 at 50 mbar).Given this difference, the error estimates from our subsam-pling method are likely to be smaller than actual sampling
Table 2. Total Sampling Error (in Time and Space) in LKS and HadRT Networks Estimated From Reanalysisa
Millibars
1979–1997 1960–1997
Globe NH SH 30�S–30�N 20�S–20�N Globe NH SH 30�S–30�N 20�S–20�N
LKS50 0.057 0.017 0.097 0.050 0.073 �0.033 0.036 �0.101 0.013 �0.002200 �0.022 �0.018 �0.026 �0.041 �0.045 �0.061 �0.023 �0.101 �0.022 �0.021500 �0.028 �0.011 �0.046 �0.021 �0.010 �0.025 0.013 �0.064 0.009 0.020850 �0.049 �0.002 �0.098 �0.017 0.018 �0.083 �0.003 �0.163 �0.077 �0.064
HadRT50 0.067 0.045 0.089 0.018 �0.007 �0.023 0.031 �0.076 0.008 �0.007200 �0.041 �0.080 �0.002 �0.077 �0.042 �0.079 �0.043 �0.115 �0.059 �0.023500 �0.010 �0.005 �0.014 �0.038 �0.034 �0.008 0.026 �0.044 0.012 0.009850 0.002 0.018 �0.015 �0.000 0.033 �0.027 0.008 �0.063 �0.043 0.006aTrends in data subsampled in space and time according to the LKS and HadRT radiosonde data minus trends in full reanalysis data set (K decade�1) are
given. NH is Northern Hemisphere; SH is Southern Hemisphere.
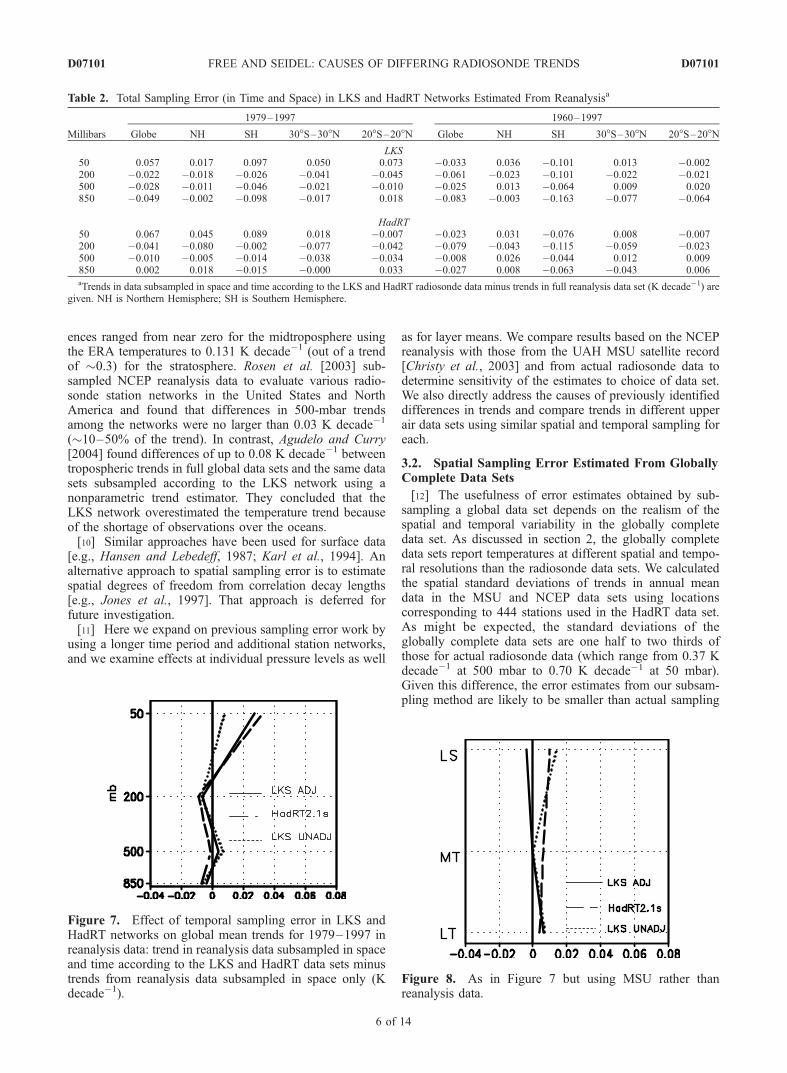
Figure 7. Effect of temporal sampling error in LKS andHadRT networks on global mean trends for 1979–1997 inreanalysis data: trend in reanalysis data subsampled in spaceand time according to the LKS and HadRT data sets minustrends from reanalysis data subsampled in space only (Kdecade�1).
Figure 8. As in Figure 7 but using MSU rather thanreanalysis data.
D07101 FREE AND SEIDEL: CAUSES OF DIFFERING RADIOSONDE TRENDS
6 of 14
D07101
errors. In addition, spatial patterns of temperature changesare not quite the same in the MSU and reanalysis data sets[Agudelo and Curry, 2004], so the error estimates are likelyto differ between the two. As discussed in section 3.4, errorestimates from this method also differ noticeably from thosederived from actual radiosonde data.[13] We assess large-scale spatial sampling error by
subsampling NCEP reanalysis and MSU temperature dataaccording to several radiosonde station subsets listed inTable 1. The locations of stations included in eachnetwork are shown in Figure 2. Each of these networkshas been used in the past or proposed for use in thefuture for climate monitoring. For each network wesubsampled the NCEP reanalysis data by selecting gridboxes containing the stations in the network. We thencreated global, hemispheric, and tropical (30�S–30�N)mean time series by averaging the selected grid boxesinto 10� zonal means and combining the zonal meanswith weighting equal to the cosine of the latitude at themiddle of each zone. We calculated linear least squaresregression trends for each such mean time series and forthe mean time series from the full data set, and thedifferences between the subsampled and full data settrends, for four atmospheric pressure levels chosen torepresent the lower troposphere (850 mbar), midtropo-sphere (500 mbar), upper troposphere-tropopause region(200 mbar), and stratosphere (50 mbar). Although non-parametric trend estimation methods are more robust thanlinear regression, they are seldom used in discussions ofupper air temperatures, and other studies have found littledifference between least squares trends and the nonpara-metric median of pairwise slopes [Gaffen et al., 2000;Huth and Pokorna, 2004].[14] The differences between full and subsampled global
mean trends for 1979–1997 (Figure 3) range from lessthan 0.002 K decade�1 for the GUAN at 50 mbar to0.071 for the same network at 200 (or 24% of the trend
from the complete reanalysis data set). At 850, 500, and50 mbar, most differences are less than 0.05 K decade�1.(For comparison, standard error of the trends in thereanalysis is �0.07 K decade�1 for 850 and 500 mbar,�0.2 at 200 mbar, and �0.5 at 50 mbar.) There are noclear overall best or worst networks and no apparentrelationships between size of network and size ofsampling error. The size of the errors is reasonablyconsistent with Santer et al. [1999], and the finding ofrelatively little difference in trends from smaller versuslarger networks is consistent with Rosen et al. [2003] inthe NH.[15] We also examined trend differences for 1960–1997
and found generally similar overall results. Because thesetwo time periods might not be representative of samplingerrors for other periods, we calculated trends for 25 seg-ments of 20 years each, starting with 1958–1977 andending with 1982–2001, using the same subsampled andfull reanalysis time series. When errors are plotted as afunction of network size, there is again no apparent rela-tionship between network size and spatial sampling error(Figure 4). Although errors for the LKS network aresmaller overall than for the Angell networks, large outliersfrom the GUAN, HadRT, and HadAT results suggest noreliable improvement with increasing network size. (Wealso calculated errors using the median of pairwise slopesinstead of linear least squares trends and found thatalthough many details were different, our overall conclu-sions were unaffected.)[16] To explore the reasons for this surprising result, we
constructed 13 hypothetical networks with approximatelyevenly spaced locations by taking every nth grid box inthe NCEP reanalysis data set, with n chosen to givenetwork sizes from 48 to 1200. This method gives agreater density of sampling at higher latitudes, but thisgeographic imbalance is eliminated by our use of zonalaveraging. The spatial sampling trend errors in these
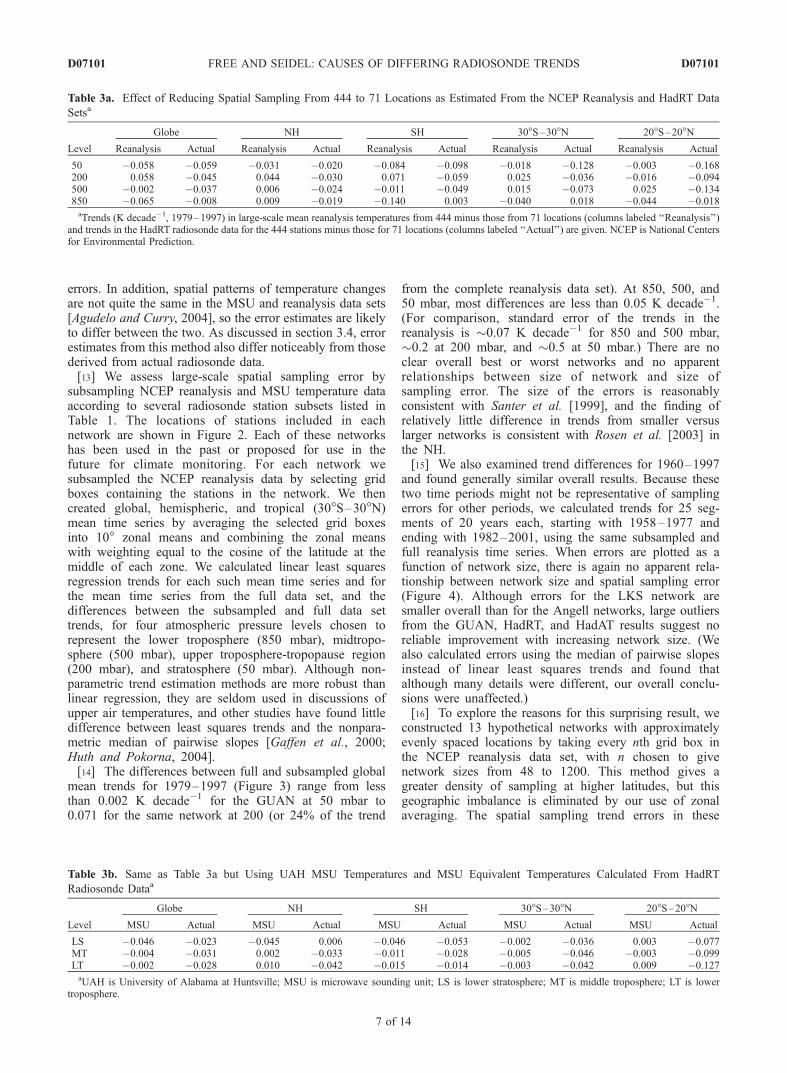
Table 3a. Effect of Reducing Spatial Sampling From 444 to 71 Locations as Estimated From the NCEP Reanalysis and HadRT Data
Setsa
Level
Globe NH SH 30�S–30�N 20�S–20�N
Reanalysis Actual Reanalysis Actual Reanalysis Actual Reanalysis Actual Reanalysis Actual
50 �0.058 �0.059 �0.031 �0.020 �0.084 �0.098 �0.018 �0.128 �0.003 �0.168200 0.058 �0.045 0.044 �0.030 0.071 �0.059 0.025 �0.036 �0.016 �0.094500 �0.002 �0.037 0.006 �0.024 �0.011 �0.049 0.015 �0.073 0.025 �0.134850 �0.065 �0.008 0.009 �0.019 �0.140 0.003 �0.040 0.018 �0.044 �0.018aTrends (K decade�1, 1979–1997) in large-scale mean reanalysis temperatures from 444 minus those from 71 locations (columns labeled ‘‘Reanalysis’’)
and trends in the HadRT radiosonde data for the 444 stations minus those for 71 locations (columns labeled ‘‘Actual’’) are given. NCEP is National Centersfor Environmental Prediction.
Table 3b. Same as Table 3a but Using UAH MSU Temperatures and MSU Equivalent Temperatures Calculated From HadRT
Radiosonde Dataa
Level
Globe NH SH 30�S–30�N 20�S–20�N
MSU Actual MSU Actual MSU Actual MSU Actual MSU Actual
LS �0.046 �0.023 �0.045 0.006 �0.046 �0.053 �0.002 �0.036 0.003 �0.077MT �0.004 �0.031 0.002 �0.033 �0.011 �0.028 �0.005 �0.046 �0.003 �0.099LT �0.002 �0.028 0.010 �0.042 �0.015 �0.014 �0.003 �0.042 0.009 �0.127aUAH is University of Alabama at Huntsville; MSU is microwave sounding unit; LS is lower stratosphere; MT is middle troposphere; LT is lower
troposphere.
D07101 FREE AND SEIDEL: CAUSES OF DIFFERING RADIOSONDE TRENDS
7 of 14
D07101
networks (Figure 5) decline as network size increasesfrom 48 to around 400 locations and are then roughlysimilar for larger networks, showing a clear relationshipto size only for the smaller networks. The error fornetworks larger than 360 stations is less than 0.02 Kdecade�1, in contrast to the much larger errors for theHadRT and HadAT networks. We speculate that theadvantage of a larger number of stations is overcome inthe radiosonde networks by errors caused by the unrep-resentative distribution of the additional stations. Theseresults suggest that relatively small (e.g., under 100 stations)but carefully designed radiosonde networks may be almostas good as larger ones for monitoring long-term temper-ature trends. We also tested a limited number of hypo-thetical uneven networks created by ‘‘flipping’’ theHadAT network east to west and/or north to south orshifting it a fixed number of degrees. In most cases thesealternative uneven networks showed smaller samplingerror than the actual HadAT network but more than theevenly spaced networks. These experiments suggest that
the concentration of stations in North America, Europe,and China may be particularly unrepresentative, perhapsbecause it oversamples continental areas as opposed tooceans. These findings may be useful for network design.Further investigation of these and related network designissues is left for future work.[17] Santer et al. [1999] showed that coverage effects
can be different when tested using reanalysis versussatellite data. Since the reanalysis may not accuratelyreproduce the regional distribution of temperature vari-ability, we also subsampled the MSU lower troposphere(LT), middle troposphere (MT), and lower stratosphere(LS) data [Christy et al., 2003] in the same manner as forthe reanalysis (Figure 6). Overall, the error estimates fromMSU are smaller than those from reanalysis, and theresults from the MSU and reanalysis experiments differ inmany details. As with the reanalysis, however, the differ-ences between the trends in the full and subsampled timeseries are in most cases relatively small, no networks areconsistently superior to the others, and no consistent
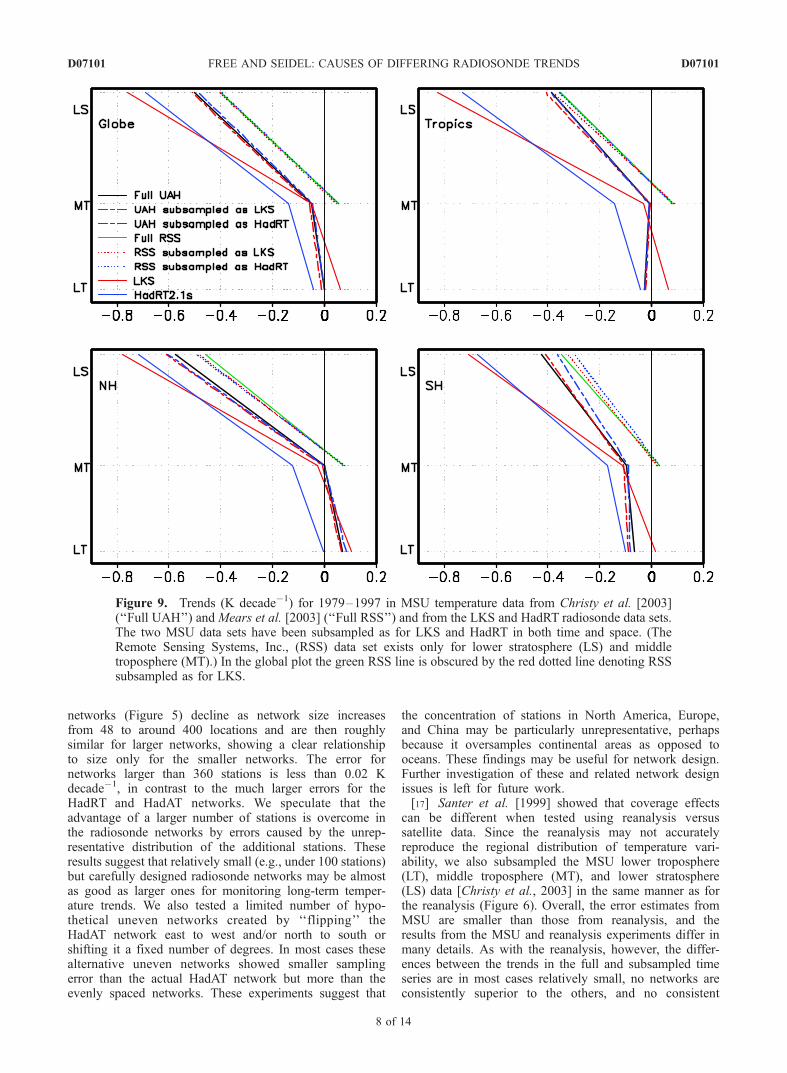
Figure 9. Trends (K decade�1) for 1979–1997 in MSU temperature data from Christy et al. [2003](‘‘Full UAH’’) and Mears et al. [2003] (‘‘Full RSS’’) and from the LKS and HadRT radiosonde data sets.The two MSU data sets have been subsampled as for LKS and HadRT in both time and space. (TheRemote Sensing Systems, Inc., (RSS) data set exists only for lower stratosphere (LS) and middletroposphere (MT).) In the global plot the green RSS line is obscured by the red dotted line denoting RSSsubsampled as for LKS.
D07101 FREE AND SEIDEL: CAUSES OF DIFFERING RADIOSONDE TRENDS
8 of 14
D07101
relationship between size of network and sampling erroris apparent.
3.3. Temporal Sampling Error From GloballyComplete Data Sets
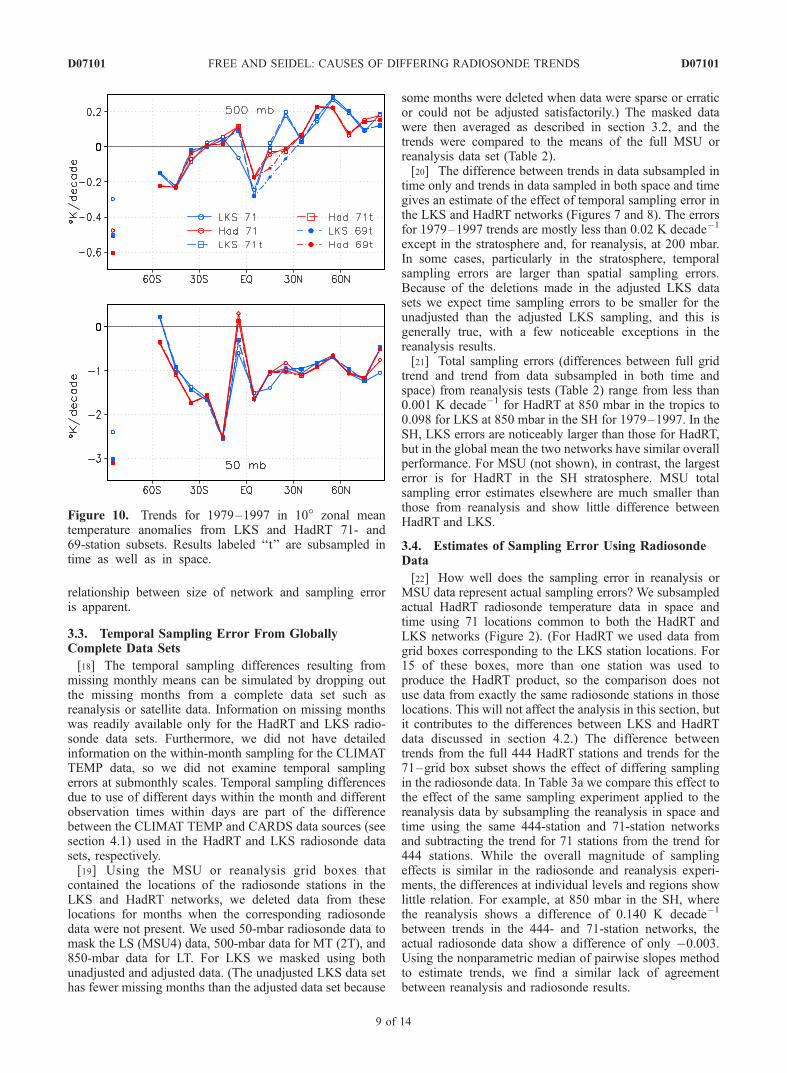
[18] The temporal sampling differences resulting frommissing monthly means can be simulated by dropping outthe missing months from a complete data set such asreanalysis or satellite data. Information on missing monthswas readily available only for the HadRT and LKS radio-sonde data sets. Furthermore, we did not have detailedinformation on the within-month sampling for the CLIMATTEMP data, so we did not examine temporal samplingerrors at submonthly scales. Temporal sampling differencesdue to use of different days within the month and differentobservation times within days are part of the differencebetween the CLIMAT TEMP and CARDS data sources (seesection 4.1) used in the HadRT and LKS radiosonde datasets, respectively.[19] Using the MSU or reanalysis grid boxes that
contained the locations of the radiosonde stations in theLKS and HadRT networks, we deleted data from theselocations for months when the corresponding radiosondedata were not present. We used 50-mbar radiosonde data tomask the LS (MSU4) data, 500-mbar data for MT (2T), and850-mbar data for LT. For LKS we masked using bothunadjusted and adjusted data. (The unadjusted LKS data sethas fewer missing months than the adjusted data set because
some months were deleted when data were sparse or erraticor could not be adjusted satisfactorily.) The masked datawere then averaged as described in section 3.2, and thetrends were compared to the means of the full MSU orreanalysis data set (Table 2).[20] The difference between trends in data subsampled in
time only and trends in data sampled in both space and timegives an estimate of the effect of temporal sampling error inthe LKS and HadRT networks (Figures 7 and 8). The errorsfor 1979–1997 trends are mostly less than 0.02 K decade�1
except in the stratosphere and, for reanalysis, at 200 mbar.In some cases, particularly in the stratosphere, temporalsampling errors are larger than spatial sampling errors.Because of the deletions made in the adjusted LKS datasets we expect time sampling errors to be smaller for theunadjusted than the adjusted LKS sampling, and this isgenerally true, with a few noticeable exceptions in thereanalysis results.[21] Total sampling errors (differences between full grid
trend and trend from data subsampled in both time andspace) from reanalysis tests (Table 2) range from less than0.001 K decade�1 for HadRT at 850 mbar in the tropics to0.098 for LKS at 850 mbar in the SH for 1979–1997. In theSH, LKS errors are noticeably larger than those for HadRT,but in the global mean the two networks have similar overallperformance. For MSU (not shown), in contrast, the largesterror is for HadRT in the SH stratosphere. MSU totalsampling error estimates elsewhere are much smaller thanthose from reanalysis and show little difference betweenHadRT and LKS.
3.4. Estimates of Sampling Error Using RadiosondeData
[22] How well does the sampling error in reanalysis orMSU data represent actual sampling errors? We subsampledactual HadRT radiosonde temperature data in space andtime using 71 locations common to both the HadRT andLKS networks (Figure 2). (For HadRT we used data fromgrid boxes corresponding to the LKS station locations. For15 of these boxes, more than one station was used toproduce the HadRT product, so the comparison does notuse data from exactly the same radiosonde stations in thoselocations. This will not affect the analysis in this section, butit contributes to the differences between LKS and HadRTdata discussed in section 4.2.) The difference betweentrends from the full 444 HadRT stations and trends for the71–grid box subset shows the effect of differing samplingin the radiosonde data. In Table 3a we compare this effect tothe effect of the same sampling experiment applied to thereanalysis data by subsampling the reanalysis in space andtime using the same 444-station and 71-station networksand subtracting the trend for 71 stations from the trend for444 stations. While the overall magnitude of samplingeffects is similar in the radiosonde and reanalysis experi-ments, the differences at individual levels and regions showlittle relation. For example, at 850 mbar in the SH, wherethe reanalysis shows a difference of 0.140 K decade�1
between trends in the 444- and 71-station networks, theactual radiosonde data show a difference of only �0.003.Using the nonparametric median of pairwise slopes methodto estimate trends, we find a similar lack of agreementbetween reanalysis and radiosonde results.
Figure 10. Trends for 1979–1997 in 10� zonal meantemperature anomalies from LKS and HadRT 71- and69-station subsets. Results labeled ‘‘t’’ are subsampled intime as well as in space.
D07101 FREE AND SEIDEL: CAUSES OF DIFFERING RADIOSONDE TRENDS
9 of 14
D07101
[23] We did the same test using the UAH MSU data(Table 3b). As with the reanalysis experiment the actualsampling effect and that estimated from UAH MSU dataoften differ in size and show different vertical and regionalpatterns.[24] Thus the sampling error estimates from reanalysis
and MSU data are not a foolproof guide to the effect ofnetwork selection in actual radiosonde data. Some differ-ences between estimated and actual errors are expectedgiven the differences between the quantities measured byradiosondes and those measured by satellites and thereanalysis (see section 2). Nevertheless, the results suggestthe possibility that the large-scale geographic patterns oftrends in the reanalysis and MSU may not be sufficientlysimilar to those in radiosonde upper air data to permit
confident assessment of sampling errors. Alternatively, theeffects of small-scale sampling error and random instru-mental error present in the radiosonde data sets but not inthe globally complete data sets may be so large as tooverwhelm effects of large-scale sampling errors in theradiosonde data.
4. Comparison of Trends in Radiosonde andMSU Data Sets Using Similar Sampling
4.1. MSU Versus LKS and HadRT
[25] How do the subsampled MSU data compare to theactual radiosonde data? We calculated MSU equivalentglobal, hemispheric, and tropical temperature series fromHadRT2.1s gridded temperature data and LKS adjusted data
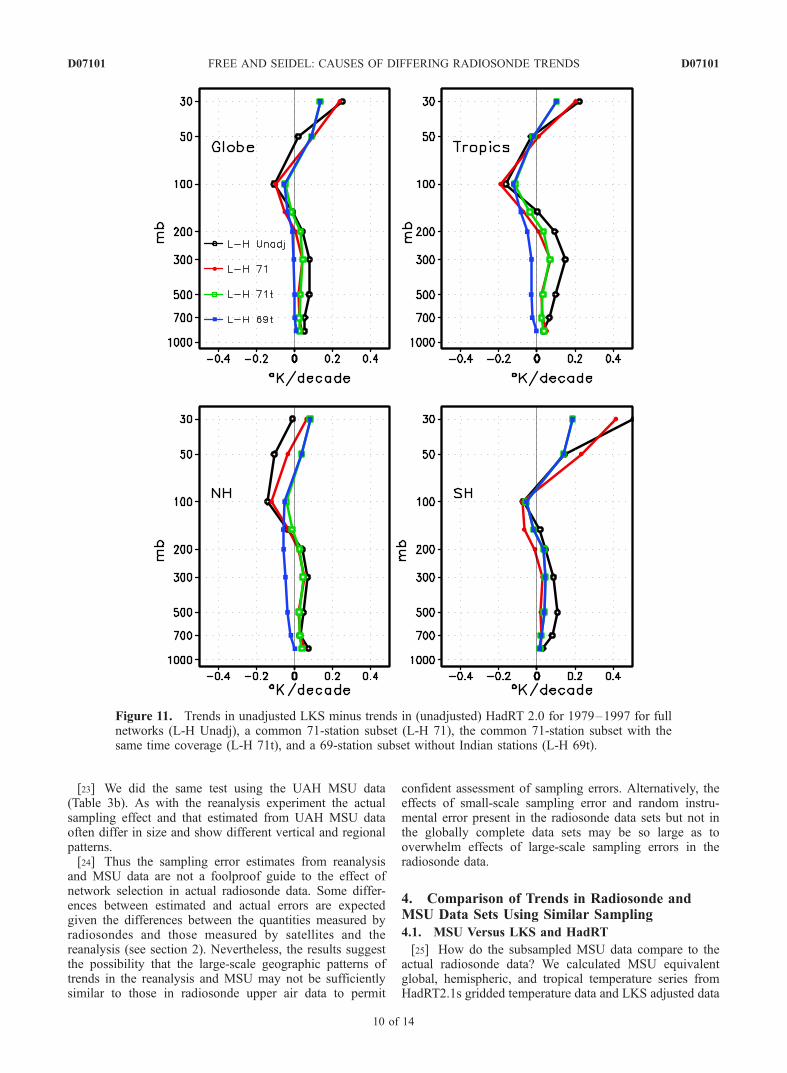
Figure 11. Trends in unadjusted LKS minus trends in (unadjusted) HadRT 2.0 for 1979–1997 for fullnetworks (L-H Unadj), a common 71-station subset (L-H 71), the common 71-station subset with thesame time coverage (L-H 71t), and a 69-station subset without Indian stations (L-H 69t).
D07101 FREE AND SEIDEL: CAUSES OF DIFFERING RADIOSONDE TRENDS
10 of 14
D07101
using the static weighting function method as described bySeidel et al. [2004]. In that paper, only latitude zones with atleast three grid boxes of data were used to construct large-scale means for HadRT. Here we use all grid boxes withdata. UAH and RSS MSU data were subsampled in spaceand time as described in section 3.3.[26] Figure 9 shows that trends in the subsampled MSU
series are not appreciably closer to the actual radiosondetrends than are those for the complete MSU. In some cases,such as the lower stratosphere in the SH, the trend in MSUsubsampled as for HadRT shows noticeably less coolingthan the complete MSU, but the actual HadRT trend is morenegative than the full MSU trend by more than 0.2 K.[27] From these results it appears that inadequate spatial
coverage and missing months of data are not major causesof differences between MSU and radiosonde trends. Morelikely sources of discrepancies are time-varying biases inone or more data sets, differences in processing and adjust-ments, and the inherent difference between the point mea-surement of a radiosonde and the horizontally and verticallyaveraged measurement of the satellite instrument.
4.2. HadRT Versus LKS
[28] Gaffen et al. [2000], examining a 20-station set,showed that differences between trends in CLIMAT TEMPand CARDS radiosonde data from individual stations weregenerally less than 0.1 K decade�1 but occasionally as muchas 0.2 K decade�1 for 1959–1991. Here we extend thatwork to a larger set of stations and examine the large-scaleeffects of those differences.[29] We identified 71 locations common to the LKS and
HadRT networks (Figure 2). (As discussed above, 16 of
these locations included more than one station in therelevant HadRT grid box. For these locations the compar-ison is not an exact station-to-station match.) To test theinfluence of differing temporal sampling, we deleted fromeach unadjusted data set those months that were missing inthe corresponding station or grid box in the other data set.Comparing least squares linear trends at 500 mbar for1979–1997 for each of these locations individually, wefind that 10 of the 71 locations, all in the NorthernHemisphere, have trend differences greater than 0.2 Kdecade�1 even with uniform temporal sampling. Seven ofthese ten locations contain exactly the same stations in bothdata sets. Trends at an additional 11 locations differed by0.1–0.2 K decade�1. The difference of 1.07 K decade�1 forthe Calcutta area is the largest, followed by 0.57 at Bombayand 0.39 at Tripoli. Because of the particularly large differ-ences for the Indian locations and because Indian sonde datamay be of particularly poor quality, we used a 69-stationsubset excluding Calcutta and Bombay in addition to the71-station set in the large-scale mean comparisons below.[30] When these 71- and 69-station data sets are com-
bined into 10� zonal means for 500 mbar (Figure 10), theirtrends show little effect from temporal masking except atthe South Pole and at 0�–10�S (where the zonal meansinclude only one or two stations). Removing the Indianlocations reduces the difference between the LKS andHadRT trends at 20�–30�N by more than 0.15 K decade�1.Even after the exclusion of locations in India and thetemporal masking, trends at 0�–10�N and 60�–70�N stilldiffer by more than 0.1 K decade�1 in the troposphere andby as much as 0.4–0.6 K decade�1 at some latitudes inthe stratosphere.[31] Of the 59 identical stations present in both HadRT
and LKS, 7 have trends that differ by more than 0.2 Kdecade�1, and 8 more differ by more than 0.1 K decade�1.Using only these 59 locations, we still find differences of0.1 K decade�1 or more in zonal means at 10�–20�N, 20�–30�N, 60�–70�N, and 80�–90�S (not shown).[32] To assess the effect of these differences on larger-
scale means, we subtracted the trend in the HadRT meandata set from the trend in the LKS mean for the globe,tropics, and hemispheres using the complete data sets andthe 71-station and 69-station subsets. The subsets weremasked as described above to use the same months in eachdata set. The global mean trends for 1979–1997 for the fullunadjusted data sets (87 stations for LKS and 444 forHadRT) differ by up to 0.1 K decade�1 below 30 mbar(Figure 11). This difference is almost eliminated in thetroposphere when only the common station set (withoutIndia) is used. However, this agreement is the result ofcompensating differences of �0.05 K decade�1 in the twohemispheres. Results are similar for trends calculated usingthe median of pairwise slopes.[33] Where the common locations include more than one
HadRT station, differences may be caused primarily by thesubgrid-scale spatial variability, reflected in the differencesin trends for nearby stations. The differences betweenHadRT and LKS data for the same stations may arise fromdifferences in within-month time sampling, including dif-ferent days in the month and different times within a day,from different procedures used to calculate monthly means,or from differing errors in transmission of the two sets of
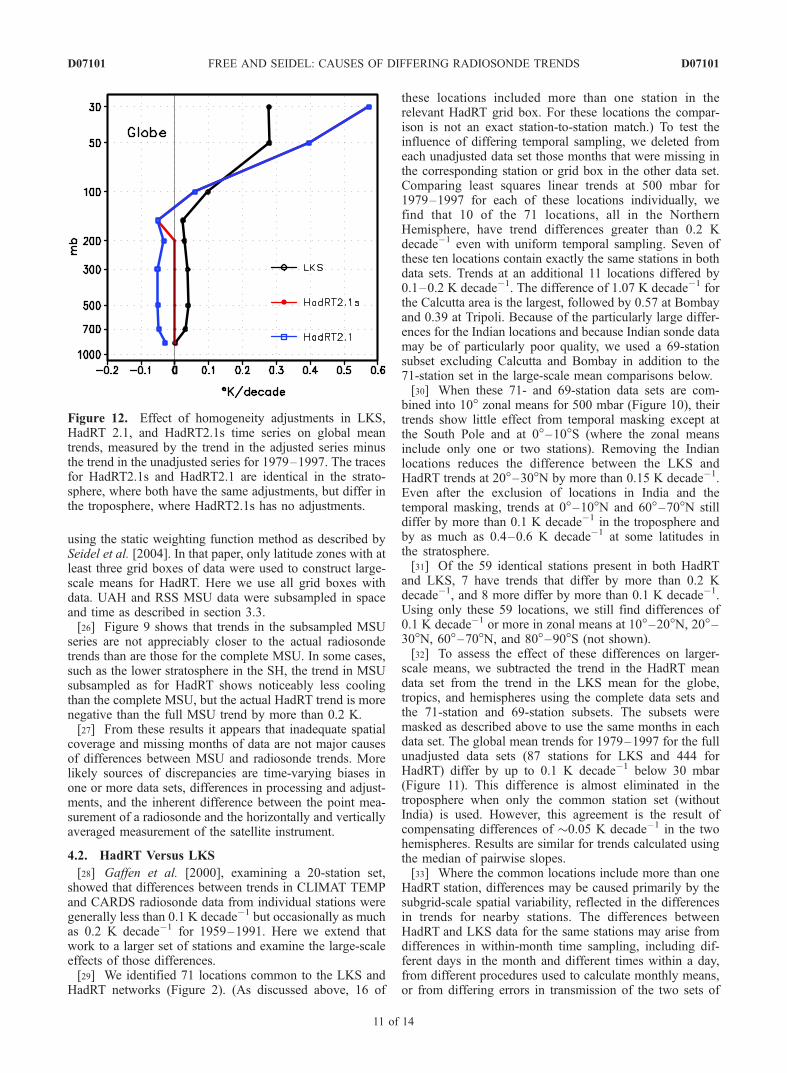
Figure 12. Effect of homogeneity adjustments in LKS,HadRT 2.1, and HadRT2.1s time series on global meantrends, measured by the trend in the adjusted series minusthe trend in the unadjusted series for 1979–1997. The tracesfor HadRT2.1s and HadRT2.1 are identical in the strato-sphere, where both have the same adjustments, but differ inthe troposphere, where HadRT2.1s has no adjustments.
D07101 FREE AND SEIDEL: CAUSES OF DIFFERING RADIOSONDE TRENDS
11 of 14
D07101
data. In most cases, LKS data are likely to be more reliablebecause their monthly means are based on a uniformaveraging and quality control procedure, but several prob-lems have been identified in the CARDS database (onwhich LKS is based) since the LKS data set was created(I. Durre et al., Overview of the integrated global radio-sonde archive, submitted to Journal of Climate, 2005),which could have affected the LKS data set, particularlyin early years.
5. Comparison of Sampling, HomogeneityAdjustment, and Source Data Effects on Trendsin LKS and HadRT Data Sets
[34] Section 4.2 considers the differences in sampling andsource data between LKS and HadRT. The other principal
difference is the adjustments made by the two groups toremove temporal inhomogeneities in the data. Here weshow the effect of those adjustments on trends in large-scale mean time series and compare the effects of all threefactors.[35] Comparing the unadjusted and adjusted versions of
radiosonde data sets provides a measure of the impact ofhomogeneity adjustments. Free et al. [2002] showed majordifferences between homogeneity adjustments by differentgroups at 12 stations and their effects on local trends but didnot address the effect of these differences on large-scalemean trends. Lanzante et al. [2003b] compared unadjustedand adjusted trends for 87 stations by pressure level. In thatwork the authors calculated trends by station and thencombined them to get global and other large-scale trends.Here we created global, hemispheric, and tropical mean
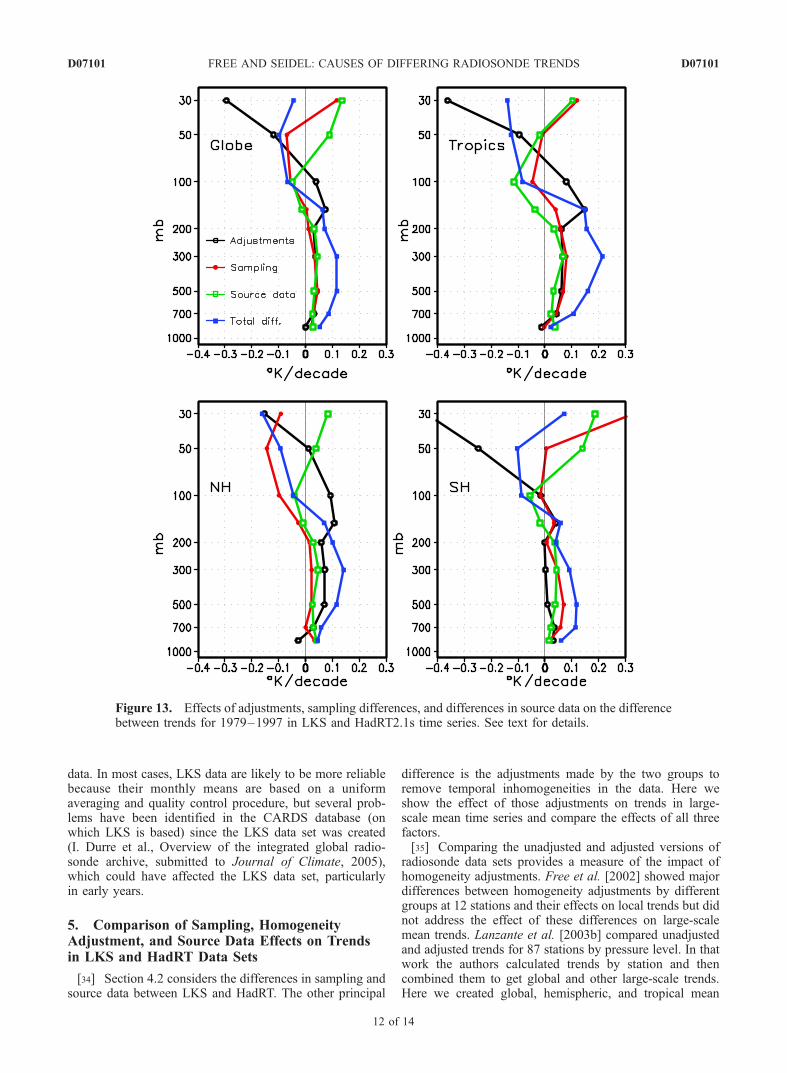
Figure 13. Effects of adjustments, sampling differences, and differences in source data on the differencebetween trends for 1979–1997 in LKS and HadRT2.1s time series. See text for details.
D07101 FREE AND SEIDEL: CAUSES OF DIFFERING RADIOSONDE TRENDS
12 of 14
D07101
time series from the station data and compared trends inthose series. The effects of the LKS and HadRT adjustments(using HadRT 2.1) are opposite in sign in the troposphere(LKS adjustments increase the warming, and HadRT adjust-ments increase the cooling trend in their respective datasets), while both reduce the cooling trend in the stratospherein the global (Figure 12), hemispheric, and tropical means(not shown). Results using the median of pairwise slopesare similar.[36] In Figure 13 we compare the effects of adjustments,
input differences, and sampling differences between LKSand HadRT2.1s. To estimate the effect of adjustments on theLKS-HadRT differences, we first compute the effect ofadjustments (DTrendadj) for each data set by subtractingtrends in the unadjusted from the trends in the adjustedseries (2.1s for HadRT) for each data set separately. Theeffect on LKS-HadRT differences is then DTrendadj(LKS) �DTrendadj(HadRT). We compare differences betweensubsampled and full series in the same way. The effectof differences in source data is shown by the trend inthe 71-station unadjusted LKS data minus the trend inthe 71-station unadjusted HadRT subset.[37] The effect of adjustments in the troposphere in the
global mean (1979–1997) is roughly similar in size to theeffects of sampling differences and differences in input dataand is of the same sign. In the tropics the pattern is similar,but the effects are larger, with almost 0.2 K decade�1 totaldifference in trend at 300 mbar. If the tropics are limited to20�S–20�N (not shown), the total difference between datasets is larger, and sampling effects predominate, whilesource data effects become minimal. Using trends fromthe median of pairwise slopes, again, sampling effects arethe largest factor, and source data differences are lessimportant. In the stratosphere, large effects of opposite signresult in smaller net differences between trends in the twodata sets. The relative roles of the three factors differ in theSH and NH and when we use a smaller subset of locationswith identical stations.[38] The specific contributions of sampling, source data,
and adjustments will also differ with time period, geo-graphic area, and data set, but it is reasonable to expect allthree factors to be important for other data sets as well.The roughly similar contributions of differences in sourcedata, adjustments, and station networks have implicationsfor efforts to create improved upper air temperature datasets from radiosonde data. To narrow uncertainties signif-icantly, these efforts will need to address all three issues.
6. Conclusions
[39] If MSU and reanalysis depictions of long-term spa-tial variability are adequate, the effects of spatial samplingdifferences on trends are usually less than 0.05 K decade�1
but can occasionally be as large as 0.12 K decade�1. In thelower troposphere, where trends are small, spatial samplingeffects are often larger than the trends themselves and arecomparable to the standard error of the trends. In the uppertroposphere and stratosphere, errors are usually no morethan 25% of the trends and are much smaller than thestandard error. The effect of missing months of data istypically �0.02 but may be as large as 0.08 K decade�1.However, estimates of coverage effects based on reanalysis
and MSU data differ noticeably from those seen in actualradiosonde data as well as from each other. Effects in actualdata are generally larger than those in the globally completedata sets. It is thus unclear to what extent these completeglobal data sets can reliably reproduce the behavior ofactual radiosonde data.[40] In this work, although spatial sampling errors
decrease with network size in hypothetical evenly spacednetworks, the larger actual radiosonde networks, with lessregular station distributions, do not give consistentlysmaller spatial sampling error than the smaller networks.Thus these experiments provide little basis for preferringone network over another and suggest that a carefullychosen network with fewer than 100 stations may be almostas good as much larger networks for monitoring long-termtrends. Other benefits of a larger network, such as reductionof the effects of random instrumental errors and errors dueto inadequate subgrid or submonthly sampling, are beyondthe scope of this work.[41] Differences in spatial coverage and in months for
which data are available do not explain the differencesbetween trends in MSU and radiosonde data sets. In somecases, subsampling increases the differences between thesetrends (as shown by Santer et al. [1999]). We do not addressdifferences in within-month sampling.[42] Using 71 locations common to the LKS and HadRT
data sets improves the agreement between trends in the twodata sets for 1979–1997, but LKS trends are still 0.03–0.05 K decade�1 more positive in the troposphere thanHadRT even for unadjusted data. Results are very sensitiveto elimination of the stations in India. Trends for the sameindividual locations in the two data sets before homogeneityadjustments can differ by more than 0.2 K decade�1.[43] Homogeneity adjustments, sampling differences, and
differences in input data make roughly comparable contri-butions to total differences between trends in the LKS andHadRT temperature data set for 1979–1997. It follows thatto narrow uncertainties in radiosonde temperatures, we mustconsider all three sources of disagreement. New data setsusing improved data sources and new adjustment methodsare currently under construction and may show smallerdifferences in trends than the HadRT and LKS data setsdiscussed in this paper.
[44] Acknowledgments. We thank Peter Thorne, Mark McCarthy,and David Parker of the U. K. Met Office for providing the Hadley Centerdata and station lists. John Lanzante, Jim Angell, and an anonymousreviewer provided helpful comments on the manuscript. This work wassupported in part by the Climate Change Data and Detection element ofNOAA’s Office of Global Programs.
ReferencesAgudelo, P. A., and J. Curry (2004), Analysis of spatial distribution intropospheric temperature trends, Geophys. Res. Lett., 31, L22207,doi:10.1029/2004GL020818.
Angell, J. K. (2003), Effect of exclusion of anomalous tropical stations ontemperature trends from a 63-station radiosonde network, and compar-ison with other analyses, J. Clim., 16, 2288–2295.
Angell, J. K., and J. Korshover (1975), Estimate of the global change intropospheric temperature between 1958 and 1973, Mon. Weather Rev.,103, 1007–1012.
Christy, J. R., R. W. Spencer, W. B. Norris, W. D. Braswell, and D. E.Parker (2003), Error estimates of version 5.0 of MSU/AMSU bulk atmo-spheric temperatures, J. Atmos. Oceanic Technol., 20, 613–629.
Eskridge, R. E., O. A. Alduchov, I. V. Chernykh, P. Zhai, A. C. Polansky,and S. R. Doty (1995), A comprehensive aerological reference data set
D07101 FREE AND SEIDEL: CAUSES OF DIFFERING RADIOSONDE TRENDS
13 of 14
D07101
(CARDS): Rough and systematic errors, Bull. Am. Meteorol. Soc., 76,1759–1775.
Free, M., et al. (2002), Creating climate reference datasets: CARDS work-shop on adjusting radiosonde temperature data for climate monitoring,Bull. Am. Meteorol. Soc., 83, 891–899.
Gaffen, D. J., M. Sargent, R. E. Habermann, and J. R. Lanzante (2000),Sensitivity of tropospheric and stratospheric temperature trends to radio-sonde data quality, J. Clim., 13, 1776–1796.
Gibson, J. K., P. Kallberg, S. Uppala, A. Hernandez, A. Nomura, andE. Serrano (1997), ERA description, ECMWF Reanal. Proj. Rep. Ser., 1,66 pp., Eur. Cent. For Medium-Range Weather Forecasts, Reading, U. K.
Hansen, J., and S. Lebedeff (1987), Global trends of measured surface airtemperature, J. Geophys. Res., 92, 13,345–13,372.
Huth, R., and L. Pokorna (2004), Parametric versus non-parametric esti-mates of climatic trends, Theor. Appl. Climatol., 77, 107–112.
Jones, P. D., T. J. Osborn, and K. R. Briffa (1997), Estimating samplingerrors in large-scale temperature averages, J. Clim., 10, 2548–2568.
Kalnay, E., et al. (1996), The NCEP/NCAR 40-year reanalysis project, Bull.Am. Meteorol. Soc., 77, 437–471.
Karl, T., R. Knight, and J. Christy (1994), Global and hemispherictemperature trends: Uncertainties related to inadequate spatial sampling,J. Clim., 7, 1144–1163.
Lanzante, J. R., S. A. Klein, and D. J. Seidel (2003a), Temporal homo-genization of monthly radiosonde temperature data. Part I: Methodology,J. Clim., 16, 224–240.
Lanzante, J. R., S. A. Klein, and D. J. Seidel (2003b), Temporal homo-genization of monthly radiosonde temperature data. Part II: Trends, sen-sitivities, and MSU comparison, J. Clim., 16, 241–262.
Mears, C. A., M. C. Schabel, and F. J. Wentz (2003), A reanalysis of theMSU channel 2 tropospheric temperature record, J. Clim., 16, 3650–3664.
Oort, A. (1978), Adequacy of the rawinsonde network for global circulationstudies tested through numerical model output, Mon. Weather Rev., 106,174–195.
Parker, D. E., M. Gordon, D. P. N. Cullum, D. M. H. Sexton, C. K. Folland,and N. Rayner (1997), A new gridded radiosonde temperature data baseand recent temperature trends, Geophys. Res. Lett., 24, 1499–1502.
Rosen, R., J. M. Henderson, and D. Salstein (2003), Sensitivity of conti-nental-scale climate trend estimates to the distribution of radiosondesover North America, J. Atmos. Oceanic Technol., 20, 262 – 268,doi:10.1175/1520-0426.
Santer, B., et al. (1996), A search for human influences on the thermalstructure of the atmosphere, Nature, 382, 39–46.
Santer, B., et al. (1999), Uncertainties in observationally based estimates oftemperature change in the free atmosphere, J. Geophys. Res., 104, 6305–6333.
Seidel, D. J., et al. (2004), Uncertainty in signals of large-scale climatevariations in radiosonde and satellite upper-air temperature datasets,J. Clim., 17, 2225–2240.
Tett, S., J. Mitchell, D. Parker, and M. Allen (1996), Human influence onthe atmospheric vertical temperature structure: Detection and observa-tions, Science, 274, 1170–1173.
Thorne, P. W., P. D. Jones, T. J. Osborn, T. Davies, S. F. B. Tett, D. E.Parker, P. Stott, G. Jones, and M. Allen (2002), Assessing the robustnessof zonal mean climate change detection, Geophys. Res. Lett., 29(19),1920, doi:10.1029/2002GL015717.
Trenberth, K., and J. Olson (1991), Representativeness of a 63-stationnetwork for depicting climate changes, in Greenhouse-Gas-InducedClimatic Change: A Critical Appraisal of Simulations and Observations,edited by M. Schlesinger, pp. 249–260, Elsevier, New York.
World Meteorological Organization (1996), GCOS plans progress, WorldClim. News, 9, 9–10.
�����������������������M. Free and D. J. Seidel, NOAA, Air Resources Laboratory, Silver
Spring, MD 20910, USA. ([email protected])
D07101 FREE AND SEIDEL: CAUSES OF DIFFERING RADIOSONDE TRENDS
14 of 14
D07101