Embed Size (px)
Citation preview
An Advanced Radiosonde System for Aerospace Applications
U. S. DIVYA, J. GIRIJA, S. SATYANARAYANA,* AND JOHN P. ZACHARIAH
Avionics Entity, Vikram Sarabhai Space Centre, Thiruvananthapuram, Kerala, India
(Manuscript received 31 January 2013, in final form 29 March 2014)
ABSTRACT
The Indian Space Research Organization (ISRO)’s Vikram Sarabhai Space Centre (VSSC) has developed
a new GPS radiosonde, called Pisharoty sonde, with its ground station for atmospheric research and opera-
tional meteorology. The latest version of this radiosonde weighs 125 g and uses a bead thermistor, a capacitive
humidity sensor, and a GPS receiver module. It computes geopotential heights and pressures using the
temperature and GPS altitude profile. This paper describes the radiosonde and its associated ground system,
summarizes its different versions, and discusses balloon tests of the newly developed version, including
comparisons with internationally accepted high-quality radiosondes.
1. Introduction
The Indian Space Research Organization (ISRO)’s
Vikram Sarabhai Space Centre (VSSC) has developed a
new, low-costGPS radiosonde system called the Pisharoty
sonde system. It is named after P.R. Pisharoty, the famous
Indian physicist and meteorologist who founded the In-
dian Institute of Tropical Meteorology. To meet ISRO
requirements for detailed profiles, especially in the lower
troposphere, simple operation, light weight, and low cost,
the current operational Pisharoty sonde (weighing 125 g,
including batteries) has a single electronics board, a bead
thermistor, a capacitive relative humidity (RH) sensor,
and a GPS module to obtain height and wind data. Pres-
sure is computed hydrostatically. The system provides
detailed lower-troposphere profiles at a lesser cost than its
available counterparts in the international market. The
Pisharoty sonde system supports all ISRO space launch
activities and atmospheric research programs. It is also
used by agencies like the India Meteorological De-
partment (IMD) and universities for their meteorological
studies. The technology developed by ISRO-VSSC
is transferred to another ISRO center, Semi-Conductor
Laboratories (SCL) in Chandigarh, for manufacturing the
sondes. The following sections summarize the latest ver-
sion of the radiosonde, the ground station and data
processing, different versions, validation, and special ap-
plications.
2. System configuration
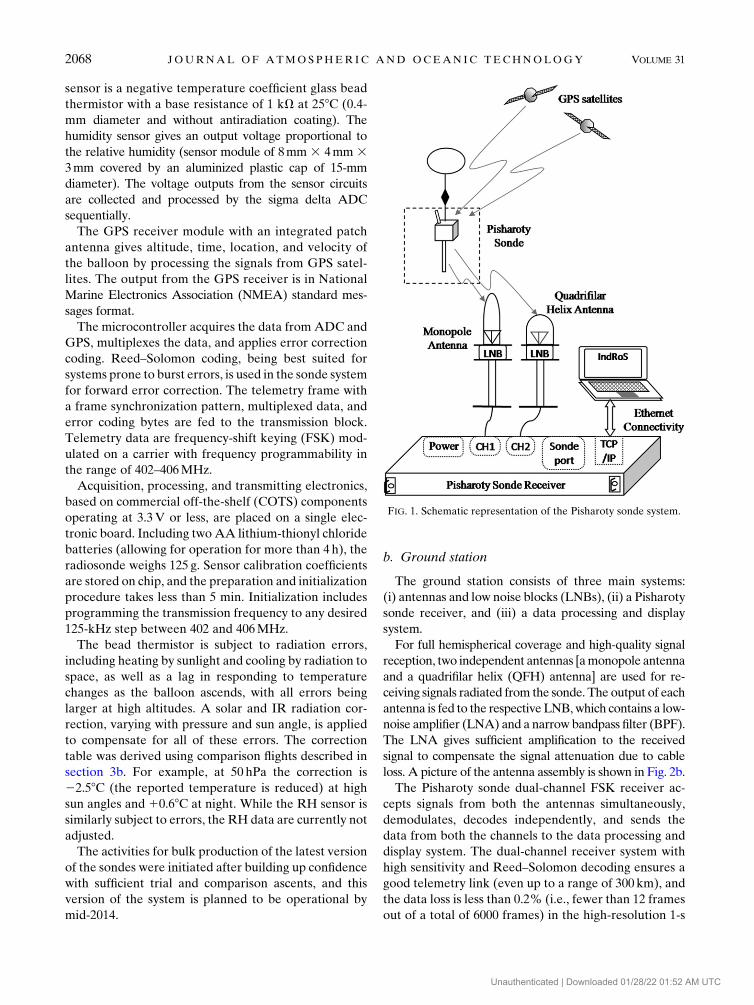
The Pisharoty sonde system consists of two sub-
systems, namely, the sonde and the ground station.
Figure 1 gives a schematic representation of the Pisharoty
sonde system.
a. Pisharoty sonde
The sonde consists of sensors for measuring tempera-
ture and relative humidity; a sigma delta analog-to-digital
converter (ADC) to process sensor data; a GPS module
to get the navigation parameters; a microcontroller for
initialization, data acquisition, and frame formatting;
a transmitter module for carrier generation, modulation,
and transmission; an antenna; and a battery.
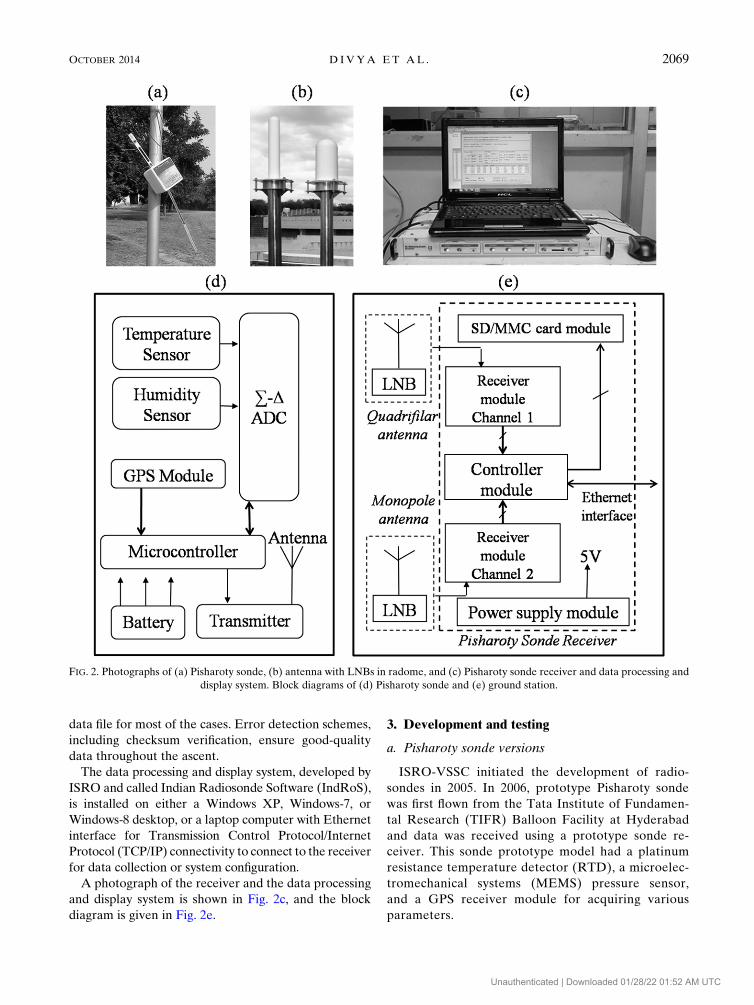
A photograph of the sonde is given in Fig. 2a and the
block diagram in Fig. 2d. The temperature and RH
sensor are mounted outside the sonde package on
a flexible printed circuit board (PCB), but the batteries
and other electronic parts are inside the insulated ra-
diosonde case.
Pressure is calculated from temperature and geo-
potential height using software in the data processing and
display system of the ground station. The temperature
*Retired.
Corresponding author address: U. S. Divya, RF Advanced
Technology Division, Avionics Entity, Vikram Sarabhai Space
Centre, Veli, ISRO Post, Thiruvananthapuram 695022, Kerala,
India.
E-mail: [email protected]; [email protected]; john_zachariah@
vssc.gov.in
OCTOBER 2014 D IVYA ET AL . 2067
DOI: 10.1175/JTECH-D-13-00050.1
� 2014 American Meteorological SocietyUnauthenticated | Downloaded 01/28/22 01:52 AM UTC
sensor is a negative temperature coefficient glass bead
thermistor with a base resistance of 1 kV at 258C (0.4-
mm diameter and without antiradiation coating). The
humidity sensor gives an output voltage proportional to
the relative humidity (sensor module of 8mm 3 4mm 33mm covered by an aluminized plastic cap of 15-mm
diameter). The voltage outputs from the sensor circuits
are collected and processed by the sigma delta ADC
sequentially.
The GPS receiver module with an integrated patch
antenna gives altitude, time, location, and velocity of
the balloon by processing the signals from GPS satel-
lites. The output from the GPS receiver is in National
Marine Electronics Association (NMEA) standard mes-
sages format.
The microcontroller acquires the data from ADC and
GPS, multiplexes the data, and applies error correction
coding. Reed–Solomon coding, being best suited for
systems prone to burst errors, is used in the sonde system
for forward error correction. The telemetry frame with
a frame synchronization pattern, multiplexed data, and
error coding bytes are fed to the transmission block.
Telemetry data are frequency-shift keying (FSK) mod-
ulated on a carrier with frequency programmability in
the range of 402–406MHz.
Acquisition, processing, and transmitting electronics,
based on commercial off-the-shelf (COTS) components
operating at 3.3V or less, are placed on a single elec-
tronic board. Including two AA lithium-thionyl chloride
batteries (allowing for operation for more than 4 h), the
radiosonde weighs 125 g. Sensor calibration coefficients
are stored on chip, and the preparation and initialization
procedure takes less than 5 min. Initialization includes
programming the transmission frequency to any desired
125-kHz step between 402 and 406MHz.
The bead thermistor is subject to radiation errors,
including heating by sunlight and cooling by radiation to
space, as well as a lag in responding to temperature
changes as the balloon ascends, with all errors being
larger at high altitudes. A solar and IR radiation cor-
rection, varying with pressure and sun angle, is applied
to compensate for all of these errors. The correction
table was derived using comparison flights described in
section 3b. For example, at 50 hPa the correction is
22.58C (the reported temperature is reduced) at high
sun angles and 10.68C at night. While the RH sensor is
similarly subject to errors, the RH data are currently not
adjusted.
The activities for bulk production of the latest version
of the sondes were initiated after building up confidence
with sufficient trial and comparison ascents, and this
version of the system is planned to be operational by
mid-2014.
b. Ground station
The ground station consists of three main systems:
(i) antennas and low noise blocks (LNBs), (ii) a Pisharoty
sonde receiver, and (iii) a data processing and display
system.
For full hemispherical coverage and high-quality signal
reception, two independent antennas [amonopole antenna
and a quadrifilar helix (QFH) antenna] are used for re-
ceiving signals radiated from the sonde. The output of each
antenna is fed to the respective LNB,which contains a low-
noise amplifier (LNA) and a narrow bandpass filter (BPF).
The LNA gives sufficient amplification to the received
signal to compensate the signal attenuation due to cable
loss. A picture of the antenna assembly is shown in Fig. 2b.
The Pisharoty sonde dual-channel FSK receiver ac-
cepts signals from both the antennas simultaneously,
demodulates, decodes independently, and sends the
data from both the channels to the data processing and
display system. The dual-channel receiver system with
high sensitivity and Reed–Solomon decoding ensures a
good telemetry link (even up to a range of 300 km), and
the data loss is less than 0.2% (i.e., fewer than 12 frames
out of a total of 6000 frames) in the high-resolution 1-s
FIG. 1. Schematic representation of the Pisharoty sonde system.
2068 JOURNAL OF ATMOSPHER IC AND OCEAN IC TECHNOLOGY VOLUME 31
Unauthenticated | Downloaded 01/28/22 01:52 AM UTC
data file for most of the cases. Error detection schemes,
including checksum verification, ensure good-quality
data throughout the ascent.
The data processing and display system, developed by
ISRO and called Indian Radiosonde Software (IndRoS),
is installed on either a Windows XP, Windows-7, or
Windows-8 desktop, or a laptop computer with Ethernet
interface for Transmission Control Protocol/Internet
Protocol (TCP/IP) connectivity to connect to the receiver
for data collection or system configuration.
A photograph of the receiver and the data processing
and display system is shown in Fig. 2c, and the block
diagram is given in Fig. 2e.
3. Development and testing
a. Pisharoty sonde versions
ISRO-VSSC initiated the development of radio-
sondes in 2005. In 2006, prototype Pisharoty sonde
was first flown from the Tata Institute of Fundamen-
tal Research (TIFR) Balloon Facility at Hyderabad
and data was received using a prototype sonde re-
ceiver. This sonde prototype model had a platinum
resistance temperature detector (RTD), a microelec-
tromechanical systems (MEMS) pressure sensor,
and a GPS receiver module for acquiring various
parameters.
FIG. 2. Photographs of (a) Pisharoty sonde, (b) antenna with LNBs in radome, and (c) Pisharoty sonde receiver and data processing and
display system. Block diagrams of (d) Pisharoty sonde and (e) ground station.
OCTOBER 2014 D IVYA ET AL . 2069
Unauthenticated | Downloaded 01/28/22 01:52 AM UTC
The first operational version of the system includes
the PS01_A1 Pisharoty sonde, with similar sensors and
GPS receiver as the prototype, a capacitive humidity
sensor, a modified data acquisition module, and an
upgraded transmitter. Also, the ground system, including
the signal acquisition antennas and the data processing
software, was further improved. However, this version
had no on-chip coefficient storage, no frequency pro-
grammability as part of initialization, and no temperature
or humidity radiation correction. This system was tested
by radiosonde releases from the Vikram Sarabhi Space
Centre at Thumba (WMO station 43373) and the ocean
Research Vessel Sagar Kanya (call sign VTJR) between
September 2008 andOctober 2010 (Bala Subrahamanyam
et al. 2012; Bala Subrahamanyam and Anurose 2011;
Anurose et al. 2012; Rao 2008).
Highly accurate pressure sensors capable of working
at low temperatures make the sondes heavy and costly.
The second operational version of the Pisharoty sonde
(PS01_B2) is used routinely at Thumba and in various
Indian research programs starting in late 2011. It adopts
the software approach to compute pressure using the
temperature profile and geopotential height, which is
calculated accurately from the geometric height obtained
fromGPS (Nash et al. 2011). The PS01_A1 and PS01_B2
sensors are identical (although the temperature–humidity
sensor PCB is modified), but the data processing and
display software allows the user to select pressure data
either from the software or from the pressure sensor.
The PS01_B2 software also corrects temperature read-
ings to minimize solar radiation errors (corrections were
derived from comparison flights with imported radio-
sondes in mid-2011). Other modifications in sonde, re-
ceiver, and software incorporate features like frequency
programmability and onboard coefficient storage.
The first two operational versions of the Pisharoty
sondes had a platinum wire RTD as a temperature
sensor, but because of large radiative heating errors, the
third (latest) operational version (PS01_B3) of sondes
was developed with a very small glass bead thermistor as
a temperature sensor (custom made for VSSC), with
solar and infrared radiation corrections in ground soft-
ware. The pressure sensor is omitted and pressure is
computed in ground software. Development and vali-
dation of this system has been completed, and the results
are discussed in detail in the following section. Specifi-
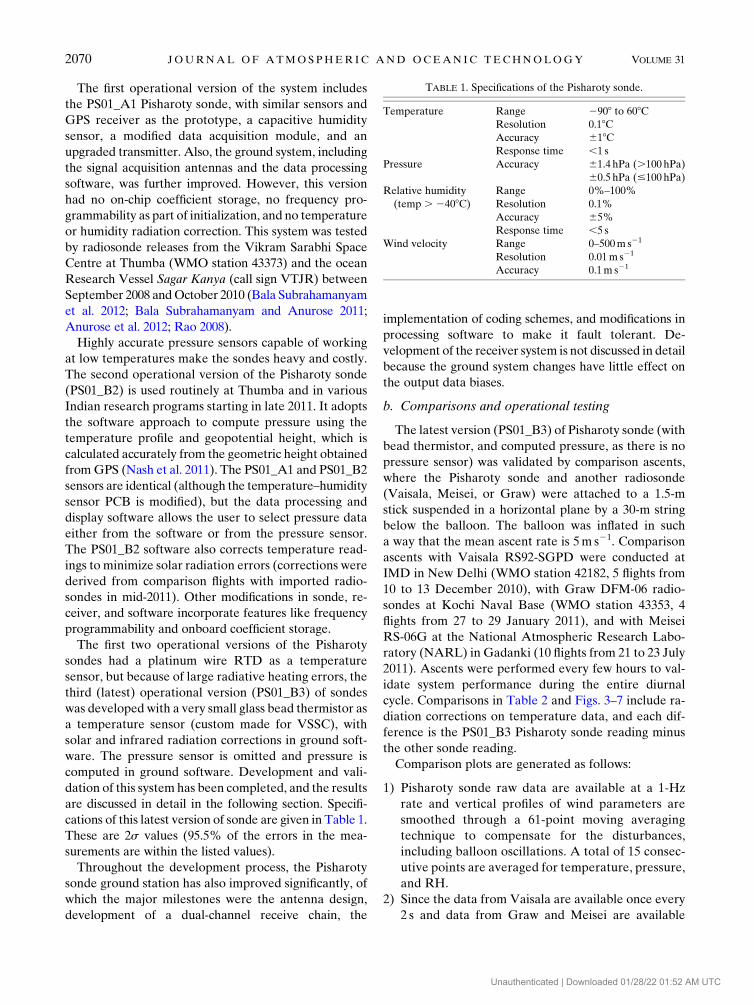
cations of this latest version of sonde are given in Table 1.
These are 2s values (95.5% of the errors in the mea-
surements are within the listed values).
Throughout the development process, the Pisharoty
sonde ground station has also improved significantly, of
which the major milestones were the antenna design,
development of a dual-channel receive chain, the
implementation of coding schemes, and modifications in
processing software to make it fault tolerant. De-
velopment of the receiver system is not discussed in detail
because the ground system changes have little effect on
the output data biases.
b. Comparisons and operational testing
The latest version (PS01_B3) of Pisharoty sonde (with
bead thermistor, and computed pressure, as there is no
pressure sensor) was validated by comparison ascents,
where the Pisharoty sonde and another radiosonde
(Vaisala, Meisei, or Graw) were attached to a 1.5-m
stick suspended in a horizontal plane by a 30-m string
below the balloon. The balloon was inflated in such
a way that the mean ascent rate is 5m s21. Comparison
ascents with Vaisala RS92-SGPD were conducted at
IMD in New Delhi (WMO station 42182, 5 flights from
10 to 13 December 2010), with Graw DFM-06 radio-
sondes at Kochi Naval Base (WMO station 43353, 4
flights from 27 to 29 January 2011), and with Meisei
RS-06G at the National Atmospheric Research Labo-
ratory (NARL) in Gadanki (10 flights from 21 to 23 July
2011). Ascents were performed every few hours to val-
idate system performance during the entire diurnal
cycle. Comparisons in Table 2 and Figs. 3–7 include ra-
diation corrections on temperature data, and each dif-
ference is the PS01_B3 Pisharoty sonde reading minus
the other sonde reading.
Comparison plots are generated as follows:
1) Pisharoty sonde raw data are available at a 1-Hz
rate and vertical profiles of wind parameters are
smoothed through a 61-point moving averaging
technique to compensate for the disturbances,
including balloon oscillations. A total of 15 consec-
utive points are averaged for temperature, pressure,
and RH.
2) Since the data from Vaisala are available once every
2 s and data from Graw and Meisei are available
TABLE 1. Specifications of the Pisharoty sonde.
Temperature Range 2908 to 608CResolution 0.18CAccuracy 618CResponse time ,1 s
Pressure Accuracy 61.4 hPa (.100 hPa)
60.5 hPa (#100 hPa)
Relative humidity
(temp . 2408C)Range 0%–100%
Resolution 0.1%
Accuracy 65%
Response time ,5 s
Wind velocity Range 0–500m s21
Resolution 0.01m s21
Accuracy 0.1m s21
2070 JOURNAL OF ATMOSPHER IC AND OCEAN IC TECHNOLOGY VOLUME 31
Unauthenticated | Downloaded 01/28/22 01:52 AM UTC
every second, data points for comparison are taken at
4-s intervals (i.e., points corresponding to time count
1, 5, 9, etc.), which provides sufficiently high-
resolution data. If any of these points are not avail-
able (a missing point), then linear interpolation is
done, provided an adjacent point is available within
4 s. Otherwise, the data point is treated as a missing
point in the 4-s interval profile and is not considered
for error computation.
3) Differences between the corresponding values of two
sondes for various parameters are calculated.
4) Before plotting, a 61-point moving averaging is done
on differences in the 4-s interval vertical profile to
remove random noises.
Typical comparison plots of the Pisharoty sonde with
Vaisala and Meisei are shown in Figs. 3–6 (temperature,
pressure, humidity, and wind speed and direction, re-
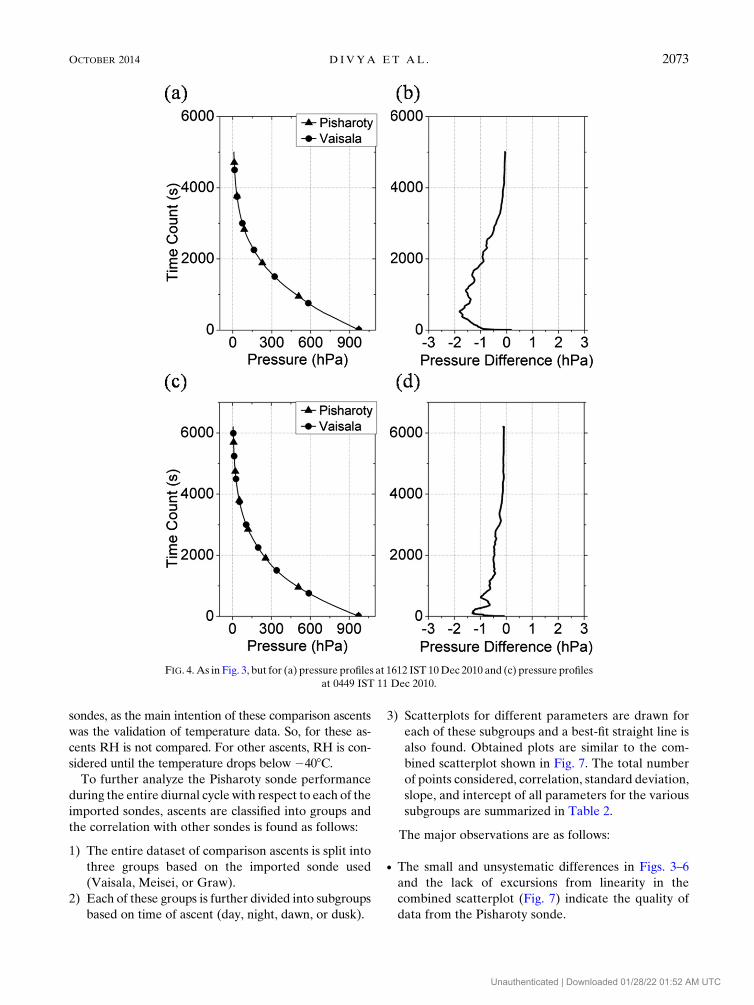
spectively). In Fig. 4, computed Pisharoty sonde pressures
are compared with that of Vaisala. For RH, Pisharoty
sonde RH is compared only until the temperature drops
below2408C. In all plots, the time count is the number of
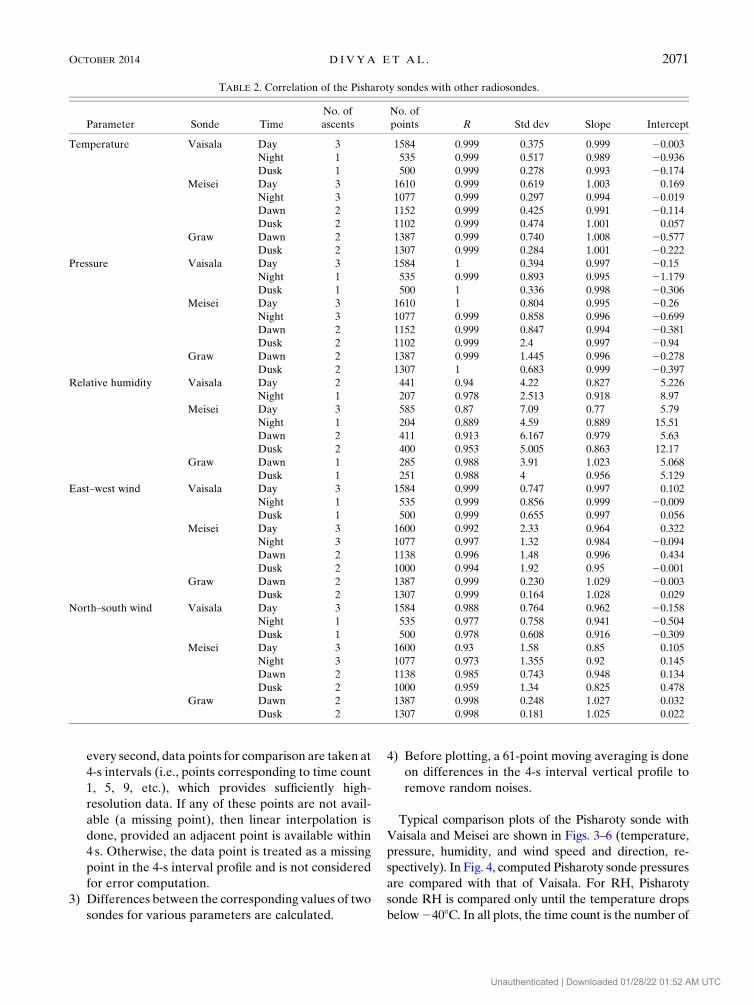
TABLE 2. Correlation of the Pisharoty sondes with other radiosondes.
Parameter Sonde Time
No. of
ascents
No. of
points R Std dev Slope Intercept
Temperature Vaisala Day 3 1584 0.999 0.375 0.999 20.003
Night 1 535 0.999 0.517 0.989 20.936
Dusk 1 500 0.999 0.278 0.993 20.174
Meisei Day 3 1610 0.999 0.619 1.003 0.169
Night 3 1077 0.999 0.297 0.994 20.019
Dawn 2 1152 0.999 0.425 0.991 20.114
Dusk 2 1102 0.999 0.474 1.001 0.057
Graw Dawn 2 1387 0.999 0.740 1.008 20.577
Dusk 2 1307 0.999 0.284 1.001 20.222
Pressure Vaisala Day 3 1584 1 0.394 0.997 20.15
Night 1 535 0.999 0.893 0.995 21.179
Dusk 1 500 1 0.336 0.998 20.306
Meisei Day 3 1610 1 0.804 0.995 20.26
Night 3 1077 0.999 0.858 0.996 20.699
Dawn 2 1152 0.999 0.847 0.994 20.381
Dusk 2 1102 0.999 2.4 0.997 20.94
Graw Dawn 2 1387 0.999 1.445 0.996 20.278
Dusk 2 1307 1 0.683 0.999 20.397
Relative humidity Vaisala Day 2 441 0.94 4.22 0.827 5.226
Night 1 207 0.978 2.513 0.918 8.97
Meisei Day 3 585 0.87 7.09 0.77 5.79
Night 1 204 0.889 4.59 0.889 15.51
Dawn 2 411 0.913 6.167 0.979 5.63
Dusk 2 400 0.953 5.005 0.863 12.17
Graw Dawn 1 285 0.988 3.91 1.023 5.068
Dusk 1 251 0.988 4 0.956 5.129
East–west wind Vaisala Day 3 1584 0.999 0.747 0.997 0.102
Night 1 535 0.999 0.856 0.999 20.009
Dusk 1 500 0.999 0.655 0.997 0.056
Meisei Day 3 1600 0.992 2.33 0.964 0.322
Night 3 1077 0.997 1.32 0.984 20.094
Dawn 2 1138 0.996 1.48 0.996 0.434
Dusk 2 1000 0.994 1.92 0.95 20.001
Graw Dawn 2 1387 0.999 0.230 1.029 20.003
Dusk 2 1307 0.999 0.164 1.028 0.029
North–south wind Vaisala Day 3 1584 0.988 0.764 0.962 20.158
Night 1 535 0.977 0.758 0.941 20.504
Dusk 1 500 0.978 0.608 0.916 20.309
Meisei Day 3 1600 0.93 1.58 0.85 0.105
Night 3 1077 0.973 1.355 0.92 0.145
Dawn 2 1138 0.985 0.743 0.948 0.134
Dusk 2 1000 0.959 1.34 0.825 0.478
Graw Dawn 2 1387 0.998 0.248 1.027 0.032
Dusk 2 1307 0.998 0.181 1.025 0.022
OCTOBER 2014 D IVYA ET AL . 2071
Unauthenticated | Downloaded 01/28/22 01:52 AM UTC
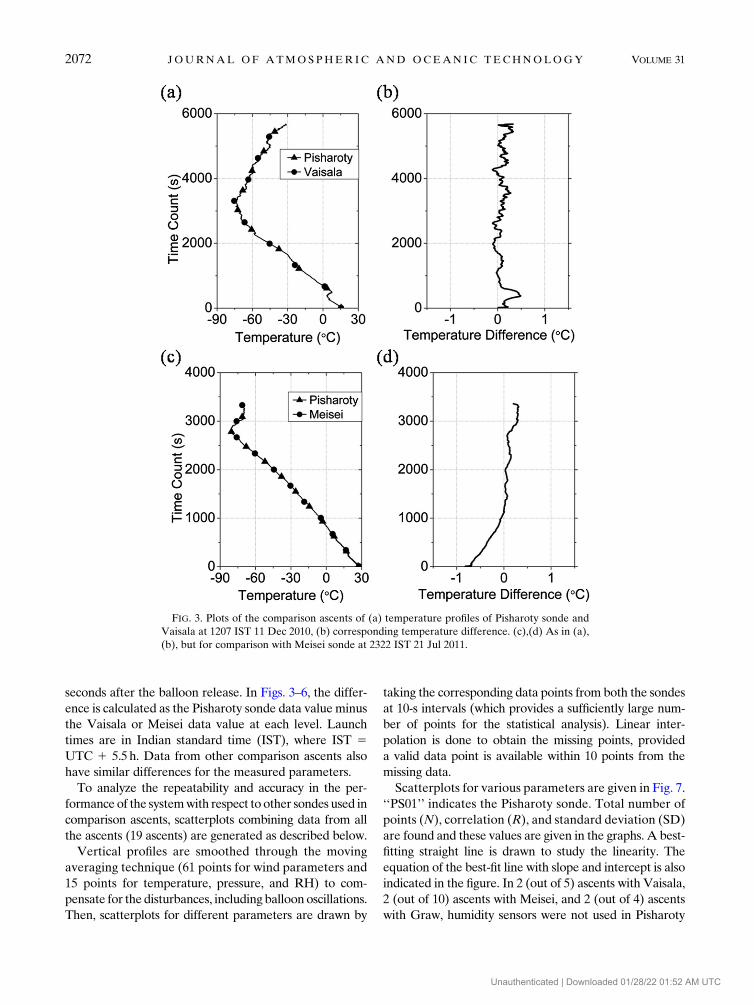
seconds after the balloon release. In Figs. 3–6, the differ-
ence is calculated as the Pisharoty sonde data valueminus
the Vaisala or Meisei data value at each level. Launch
times are in Indian standard time (IST), where IST 5UTC 1 5.5 h. Data from other comparison ascents also
have similar differences for the measured parameters.
To analyze the repeatability and accuracy in the per-
formance of the systemwith respect to other sondes used in
comparison ascents, scatterplots combining data from all
the ascents (19 ascents) are generated as described below.
Vertical profiles are smoothed through the moving
averaging technique (61 points for wind parameters and
15 points for temperature, pressure, and RH) to com-
pensate for the disturbances, including balloonoscillations.
Then, scatterplots for different parameters are drawn by
taking the corresponding data points from both the sondes
at 10-s intervals (which provides a sufficiently large num-
ber of points for the statistical analysis). Linear inter-
polation is done to obtain the missing points, provided
a valid data point is available within 10 points from the
missing data.
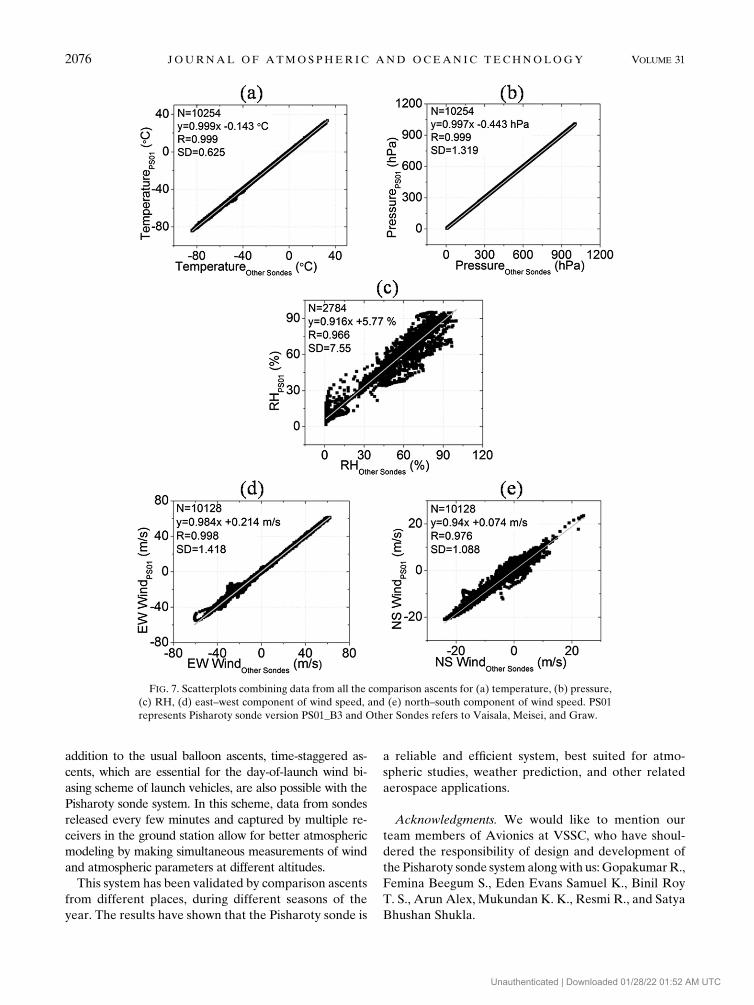
Scatterplots for various parameters are given in Fig. 7.
‘‘PS01’’ indicates the Pisharoty sonde. Total number of
points (N), correlation (R), and standard deviation (SD)
are found and these values are given in the graphs. A best-
fitting straight line is drawn to study the linearity. The
equation of the best-fit line with slope and intercept is also
indicated in the figure. In 2 (out of 5) ascents with Vaisala,
2 (out of 10) ascents with Meisei, and 2 (out of 4) ascents
with Graw, humidity sensors were not used in Pisharoty
FIG. 3. Plots of the comparison ascents of (a) temperature profiles of Pisharoty sonde and
Vaisala at 1207 IST 11 Dec 2010, (b) corresponding temperature difference. (c),(d) As in (a),
(b), but for comparison with Meisei sonde at 2322 IST 21 Jul 2011.
2072 JOURNAL OF ATMOSPHER IC AND OCEAN IC TECHNOLOGY VOLUME 31
Unauthenticated | Downloaded 01/28/22 01:52 AM UTC
sondes, as the main intention of these comparison ascents
was the validation of temperature data. So, for these as-
cents RH is not compared. For other ascents, RH is con-
sidered until the temperature drops below 2408C.To further analyze the Pisharoty sonde performance
during the entire diurnal cycle with respect to each of the
imported sondes, ascents are classified into groups and
the correlation with other sondes is found as follows:
1) The entire dataset of comparison ascents is split into
three groups based on the imported sonde used
(Vaisala, Meisei, or Graw).
2) Each of these groups is further divided into subgroups
based on time of ascent (day, night, dawn, or dusk).
3) Scatterplots for different parameters are drawn for
each of these subgroups and a best-fit straight line is
also found. Obtained plots are similar to the com-
bined scatterplot shown in Fig. 7. The total number
of points considered, correlation, standard deviation,
slope, and intercept of all parameters for the various
subgroups are summarized in Table 2.
The major observations are as follows:
d The small and unsystematic differences in Figs. 3–6
and the lack of excursions from linearity in the
combined scatterplot (Fig. 7) indicate the quality of
data from the Pisharoty sonde.
FIG. 4. As in Fig. 3, but for (a) pressure profiles at 1612 IST 10Dec 2010 and (c) pressure profiles
at 0449 IST 11 Dec 2010.
OCTOBER 2014 D IVYA ET AL . 2073
Unauthenticated | Downloaded 01/28/22 01:52 AM UTC
d Temperature data are matched with the data obtained
from imported sondes irrespective of the time of
ascent. This is evident from the small standard de-
viations and a high correlation value of 0.999 (Table 2)
across various subgroups.d Pressure data are also matched, especially at higher
altitudes (within 0.5 hPa), where the accuracy required
is higher. Scatterplot analysis also indicates a high
correlation of Pisharoty sonde pressure with that of
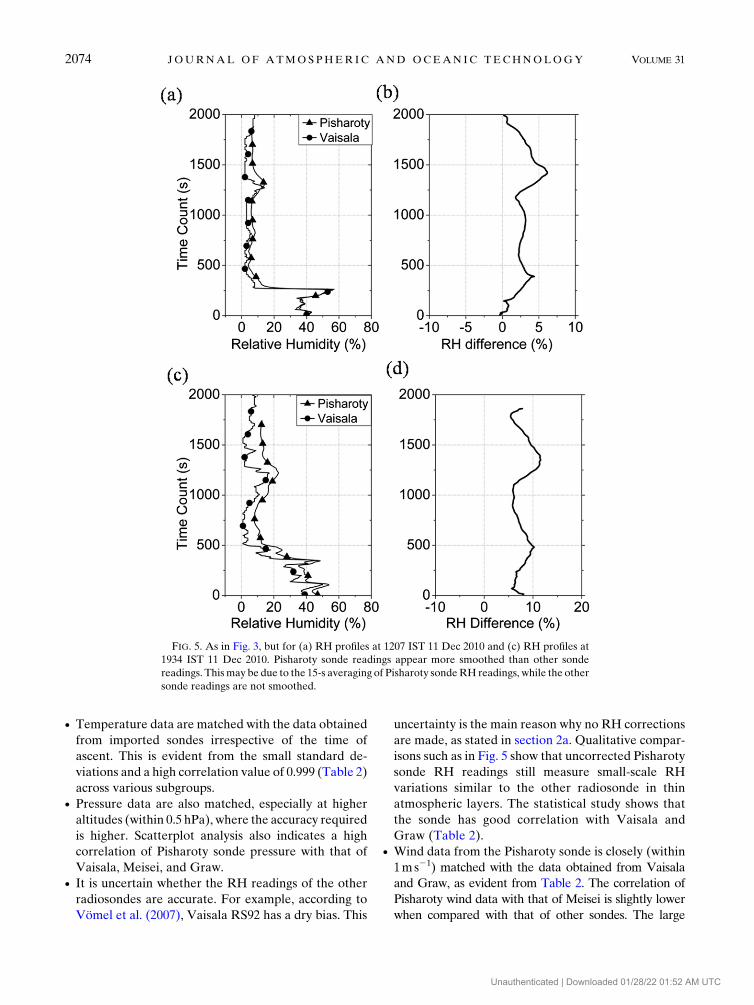
Vaisala, Meisei, and Graw.d It is uncertain whether the RH readings of the other
radiosondes are accurate. For example, according to
Vömel et al. (2007), Vaisala RS92 has a dry bias. This
uncertainty is the main reason why no RH corrections
are made, as stated in section 2a. Qualitative compar-
isons such as in Fig. 5 show that uncorrected Pisharoty
sonde RH readings still measure small-scale RH
variations similar to the other radiosonde in thin
atmospheric layers. The statistical study shows that
the sonde has good correlation with Vaisala and
Graw (Table 2).d Wind data from the Pisharoty sonde is closely (within
1ms21) matched with the data obtained from Vaisala
and Graw, as evident from Table 2. The correlation of
Pisharoty wind data with that of Meisei is slightly lower
when compared with that of other sondes. The large
FIG. 5. As in Fig. 3, but for (a) RH profiles at 1207 IST 11 Dec 2010 and (c) RH profiles at
1934 IST 11 Dec 2010. Pisharoty sonde readings appear more smoothed than other sonde
readings. Thismay be due to the 15-s averaging of Pisharoty sondeRH readings, while the other
sonde readings are not smoothed.
2074 JOURNAL OF ATMOSPHER IC AND OCEAN IC TECHNOLOGY VOLUME 31
Unauthenticated | Downloaded 01/28/22 01:52 AM UTC
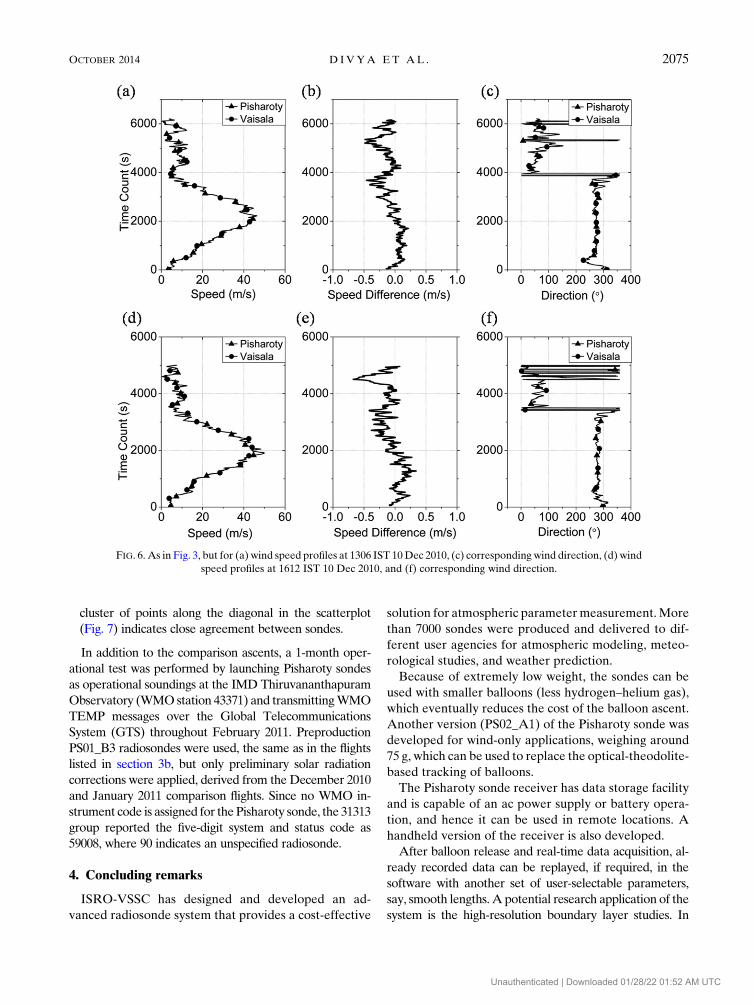
cluster of points along the diagonal in the scatterplot
(Fig. 7) indicates close agreement between sondes.
In addition to the comparison ascents, a 1-month oper-
ational test was performed by launching Pisharoty sondes
as operational soundings at the IMD Thiruvananthapuram
Observatory (WMOstation 43371) and transmittingWMO
TEMP messages over the Global Telecommunications
System (GTS) throughout February 2011. Preproduction
PS01_B3 radiosondes were used, the same as in the flights
listed in section 3b, but only preliminary solar radiation
corrections were applied, derived from the December 2010
and January 2011 comparison flights. Since no WMO in-
strument code is assigned for thePisharoty sonde, the 31313
group reported the five-digit system and status code as
59008, where 90 indicates an unspecified radiosonde.
4. Concluding remarks
ISRO-VSSC has designed and developed an ad-
vanced radiosonde system that provides a cost-effective
solution for atmospheric parametermeasurement.More
than 7000 sondes were produced and delivered to dif-
ferent user agencies for atmospheric modeling, meteo-
rological studies, and weather prediction.
Because of extremely low weight, the sondes can be
used with smaller balloons (less hydrogen–helium gas),
which eventually reduces the cost of the balloon ascent.
Another version (PS02_A1) of the Pisharoty sonde was
developed for wind-only applications, weighing around
75 g, which can be used to replace the optical-theodolite-
based tracking of balloons.
The Pisharoty sonde receiver has data storage facility
and is capable of an ac power supply or battery opera-
tion, and hence it can be used in remote locations. A
handheld version of the receiver is also developed.
After balloon release and real-time data acquisition, al-
ready recorded data can be replayed, if required, in the
software with another set of user-selectable parameters,
say, smooth lengths.A potential research application of the
system is the high-resolution boundary layer studies. In
FIG. 6. As in Fig. 3, but for (a) wind speed profiles at 1306 IST 10Dec 2010, (c) corresponding wind direction, (d) wind
speed profiles at 1612 IST 10 Dec 2010, and (f) corresponding wind direction.
OCTOBER 2014 D IVYA ET AL . 2075
Unauthenticated | Downloaded 01/28/22 01:52 AM UTC
addition to the usual balloon ascents, time-staggered as-
cents, which are essential for the day-of-launch wind bi-
asing scheme of launch vehicles, are also possible with the
Pisharoty sonde system. In this scheme, data from sondes
released every few minutes and captured by multiple re-
ceivers in the ground station allow for better atmospheric
modeling by making simultaneous measurements of wind
and atmospheric parameters at different altitudes.
This system has been validated by comparison ascents
from different places, during different seasons of the
year. The results have shown that the Pisharoty sonde is
a reliable and efficient system, best suited for atmo-
spheric studies, weather prediction, and other related
aerospace applications.
Acknowledgments. We would like to mention our
team members of Avionics at VSSC, who have shoul-
dered the responsibility of design and development of
the Pisharoty sonde system alongwith us:GopakumarR.,
Femina Beegum S., Eden Evans Samuel K., Binil Roy
T. S., Arun Alex, Mukundan K. K., Resmi R., and Satya
Bhushan Shukla.
FIG. 7. Scatterplots combining data from all the comparison ascents for (a) temperature, (b) pressure,
(c) RH, (d) east–west component of wind speed, and (e) north–south component of wind speed. PS01
represents Pisharoty sonde version PS01_B3 and Other Sondes refers to Vaisala, Meisei, and Graw.
2076 JOURNAL OF ATMOSPHER IC AND OCEAN IC TECHNOLOGY VOLUME 31
Unauthenticated | Downloaded 01/28/22 01:52 AM UTC
We are grateful to the anonymous reviewers, who spent
their much valuable time reviewing and refining our paper.
We thank the team at the National Atmospheric Research
Laboratory (NARL) in Gadanki, IMD in New Delhi,
the Space Physics Laboratory (SPL) of VSSC, the Mete-
orology Facility (METF) Thumba Equatorial Rocket
Launching Station (TERLS) of VSSC, and the Kochi
Naval Base for their wholehearted support in conducting
the comparison ascents at these locations. We also thank
our colleagues at Satish Dawan Space Centre (SDSC)
in Sriharikota and various other centers of ISRO for
their valuable advice and support in system realization
and evaluation. Our sincere thanks are due to the di-
rector of VSSC for the inspiration and encouragement
provided during the various phases of systemdevelopment.
REFERENCES
Anurose, T. J., and Coauthors 2012: Vertical structure of sea-
breeze circulation over Thumba (8.58N, 76.98E, India) in the
winter months and a case study during W-ICARB field
experiment.Meteor. Atmos. Phys., 115, 113–121, doi:10.1007/
s00703-011-0178-0.
Bala Subrahamanyam, D., and T. J. Anurose, 2011: Solar eclipse
induced impacts on sea/land breeze circulation over Thumba:A
case study. J. Atmos. Sol.-Terr. Phys., 73, 703–708, doi:10.1016/
j.jastp.2011.01.002.
——, ——, N. V. P. Kiran Kumar, M. Mohan, P. K. Kunhikrishnan,
S. R. John, S. S. Prijith, and C. B. S. Dutt, 2012: Spatial and
temporal variabilities in vertical structure of the marine atmo-
spheric boundary layer overBay ofBengal duringwinter phase of
Integrated Campaign for Aerosols, Gases andRadiation Budget.
Atmos. Res., 107, 178–185, doi:10.1016/j.atmosres.2011.12.014.
Nash, J., T. Oakley, H. Vömel, and L. I. Wei, 2011: WMO inter-
comparison of high quality radiosonde systems. WMO Doc.
WMO/TD-1580, Instruments and Observing Methods Rep. 107,
248 pp.
Rao, K. G., 2008: PRWONAM—An innovative approach to ac-
curate meso-scale weather prediction for southern peninsula;
Comparisons between predicted rain band and KALPANA
cloud imagery at the time of PSLV-C7 launch from Sriharikota.
Atmospheric Science Programme Office, Indian Space Re-
search Organisation, 79 pp.
Vömel, H., and Coauthors, 2007: Radiation dry bias of the Vaisala
RS92 humidity sensor. J. Atmos. Oceanic Technol., 24, 953–
963, doi:10.1175/JTECH2019.1.
OCTOBER 2014 D IVYA ET AL . 2077
Unauthenticated | Downloaded 01/28/22 01:52 AM UTC