Embed Size (px)
Citation preview
TROPICAL CYCLONE RESEARCH REPORTTCRR 15-2: 1–?? (2015)Meteorological InstituteLudwig Maximilians University of Munich
Mean radiosonde soundings for the Australianmonsoon/cyclone season
Nina Crniveca and Roger K. Smitha
a Meteorological Institute, Ludwig Maximilians University of Munich, Munich, Germany
Abstract:Motivated in part by a potential application to modelling tropical cyclones in the Australian region, mean radiosonde soundings aredetermined for the three northern Australian stations, Willis Island, Darwin and Weipa, during the core months of the cyclone season(December-February). More than 8500 individual soundings are examined in 30-year data sets for Willis Island and Darwin (1980-2010) and a 15-year data set for Weipa (1998-2013). These soundings are stratified into three groups according to the low-level winddirection (monsoon regime, easterly flow regime and the rest). The mean soundings for the monsoon regime (low-level winds in thesector west to north) are compared at the three stations and diurnal differences are investigated at stations with two soundings perday. The mean monsoon Willis Island sounding is compared also with the Dunion moist tropical (MT) sounding, which is frequentlyused as an environmental sounding in the numerical modelling of tropical cyclones. The Willis Island sounding is 1-3°C warmer andsomewhat drier than the Dunion MT sounding through the entire troposphere, although the relative humidity differences are relativelysmall (less than 5% at most observed levels).Idealized numerical simulations of tropical cyclone evolution are performed to assess the implications of using one thermodynamicsounding or another for tropical cyclones in the Australian region. The simulations highlight the importance of not only theenvironmental sounding for the intensification of model storms, but also the sea surface temperature combined with the sounding.
KEY WORDS Tropical cyclones, hurricanes, typhoons, monsoon, radiosonde soundings, Willis Island, Weipa, Darwin, Australia
Date: January 13, 2016; Revised ; Accepted
1 Introduction
Idealized numerical simulations of tropical cyclonebehaviour often use a mean sounding for the cyclone seasonas their environmental sounding. A traditional and muchused sounding for the North Atlantic and Caribbean Seahas been the Jordan mean sounding for the hurricane sea-son (Jordan 1958), while others have used a mean soundingfor the Western North Pacific constructed by Gray et al.(1975).
More recently, Dunion and Marron (2008) questionedthe representativeness of the Jordan sounding, noting thatthe tropical atmosphere in the North Atlantic Ocean andCaribbean Sea regions has two distinct sounding types withdiffering thermodynamic and kinematic structures: thoseincorporating a Saharan Air Layer (SAL) and those that donot (the non-SAL soundings). Thus, they argue, a singlemean sounding like Jordan's does not effectively representthese differences. Indeed, their examination of over 750radiosondes from the region during the 2002 hurricaneseason showed that the Jordan sounding does not represent
1Correspondence to: Prof. Roger K. Smith, Meteorological Institute,Ludwig Maximilians University of Munich, Theresienstr. 37, 80333Munich, Germany. E-mail: [email protected]
either type of air mass particularly well and recommendedthat it be updated “ ... to provide a more robust depictionof the thermodynamics and kinematics that exist in thetropical North Atlantic Ocean and Caribbean Sea duringthe hurricane season”.
In a subsequent paper, Dunion (2011) showed thatthe tropical North Atlantic and the Caribbean Sea aredominated by three distinct air masses: a moist tropicalairmass, those containing a SAL and those consisting ofmid-latitude dry air intrusions. He suggested that the moisttropical (MT) sounding composite is the most prevalentand most supportive of tropical cyclone formation andintensification and would serve as an improved replacementfor the Jordan sounding.
The Dunion MT sounding is based on radiosondeobservations from four Caribbean stations and the questionis: to what extent is this sounding appropriate to tropicalcyclone environments in other parts of the globe? In theAustralian region, for example, cyclones form in conditionswhere the sea surface temperatures north of the monsoonshear line often exceed 30°C during the cyclone season,perhaps one or two degrees higher than in the Caribbean.A few authors have preferred to use the mean WillisIsland sounding as a basis for studying tropical cyclones(Holland 1997, Wang 2001, 2002) and the question iswhether this sounding differs much from the Dunion MTsounding? Another question is whether the mean sounding
Copyright © 2015 Meteorological Institute

2 N. CRNIVEC AND R. K. SMITH
(a)
(b)
Figure 1. (a) Location of Darwin, Weipa and Willis Island stations,used in this study. (b) Willis Island station (Courtesy: Bureau of
Meteorology).
at Willis Island (149.97°E, 16.29°S) is similar to that atother stations across northern Australia including Darwin(130.89°E, 12.42°S) and Weipa (141.93°E, 12.67°S) duringmonsoonal flow conditions? The location of all three ofthese Australian stations is shown in Fig. 1a.
Willis Island is a tiny coral island to the east of Aus-tralia (Fig. 1b) and provides an excellent site for monitoringthe oceanic atmosphere in the vicinity of northeastern Aus-tralia. Radiosonde soundings are carried out there mostlyonce a day, usually at the nominal time 22 UTC, whichis 8 am local time. Other radiosonde stations across theAustralian deep tropics include Darwin and Weipa, both nomore than a few kilometres from the coast. The radiosondesoundings at Darwin and Weipa are carried out mostlytwice daily, typically at 23 UTC and 11 UTC (i.e. 8:30 amand 8:30 pm local time in Darwin, 9 am and 9 pm localtime in Weipa).
In this paper, we present mean soundings for thepeak of the monsoon season (December-February, hence-forth DJF) at the three Australian stations. These sound-ings should be suitable for modelling both tropical cyclonesin the region and perhaps the monsoon itself. We exam-ine also whether the differences between the Australiansoundings and the Dunion MT sounding are important formodelling tropical cyclones. The study complements therecent study of Pope et al. (2009), who presented an analy-sis of radiosonde soundings at Darwin in different weather
regimes. The principal aim of their study was to character-ize the main modes of variability over northern Australia. Incontrast, the present study focusses on the moist monsoonalenvironment and its capacity to support tropical cycloneintensification.
The paper is organized as follows. First, in section2 we describe the data sets and criteria used to stratifythe individual soundings. In sections 3 and 4 we presenta series of results for the three Australian stations. Insection 5 we compare the mean DJF Willis Island soundingfor the monsoon regime with the Dunion MT sounding.Finally, in section 6, we compare the vortex evolution inseveral idealized numerical simulations of tropical cycloneintensification in a quiescent environment, using selectedAustralian DJF monsoon soundings or the Dunion MTsounding as background environmental profile. The mainfindings are summarized in section 7.
2 Data processing and methodology
This study examines radiosonde observations from threeAustralian stations: Willis Island (World MeteorologicalOrganization (WMO) index: 94299), Weipa (WMO index:94170) and Darwin (WMO index: 94120). The locationsof the stations are marked in Figure 1a. The radiosondedata for all three stations were obtained from IntegratedGlobal Radiosonde Archive, a new radiosonde data setfrom the National Climatic Data Center (NCDC). Obser-vations include pressure, geopotential height, temperature,dew-point depression, wind direction and wind speed at thesurface, standard, tropopause, and significant levels. Theraw data for each sounding has been subjected to variousquality control procedures by NCDC, which have signifi-cantly improved in recent years.
From the long term record of individual soundings wecalculate long term mean temperatures (T ) and dew-pointtemperatures (Td) along with other thermodynamic quan-tities (RH, specific humidity) at the surface and standardpressure levels. The data sets for Willis Island and Dar-win range from 1980 to 2010, resulting in about 2500 and4300 radiosonde observations at each station, respectively,for the core months of the Australian cyclone season (DJF).The radiosonde data from Weipa, a relatively new station,are available from 1998 and a 15-year data set (1998-2013)was examined, giving about 1800 radiosonde observationsfor the months DJF.
Since we are primarily interested in the soundingstructure for monsoonal flow where the winds have typ-ically a deep westerly or northwesterly component, thesoundings have been stratified into three groups accord-ing to the vertically-averaged wind direction up to 700 mb.At Willis Island, the monsoon regime is defined as that inwhich the mean wind direction lies in the interval from 270and 360 deg. Since Darwin and Weipa may have a shallowwesterly component on account of sea breeze influence, wechose to base the wind stratification solely on the winddirection at 700 mb, which should be largely unaffected
Copyright © 2015 Meteorological Institute TCRR 15-2: 1–?? (2015)

WILLIS ISLAND MEAN SOUNDINGS 3
by the local sea breeze. For comparison of the monsoonsoundings, we examined also soundings for an easterly flowregime where the mean wind direction lies in the intervalfrom 45 and 135 deg. Other soundings in the whole data setconstitute the residual regime and were disregarded.
The large number of radiosonde observations in the30-year data sets for Willis Island and Darwin provide anexcellent sample size of data at most standard levels, evenat some levels high in the stratosphere (30 mb, 20 mb, 10mb). However, there are almost no data available at 150 mb,100 mb, 70 mb and 50 mb. We are at a loss to explain thisdeficiency of the data. For this reason our analyses at thesestations are confined to pressures of 200 mb and higher.
For all three stations we compute the mean thermo-dynamic sounding for December, January and Februaryseparately as well as for the nominal monsoon season(DJF). We examine also the mean DJF wind profiles at thethree Australian stations because of the influence of ver-tical wind shear on tropical cyclone behaviour. Since thewind measurements are made up to four or five times perday, there is larger number of wind data at all observed lev-els than thermodynamic data. For this reason, there are nodeficiencies in the wind data at any level, even when thesample size is reduced by stratifying the data into differentflow regimes.
A detailed discussion of the results is presented below.
3 The mean Willis Island soundings
Figure 2 shows the mean soundings for the peak mon-soon season (DJF) at Willis Island during the easterly andmonsoon flow regimes. Since the 150 mb and 100 mb lev-els were poorly represented in the radiosonde data set forWillis Island, temperature and dew-point temperature pro-files are shown only up to 200 mb in Fig. 2. This is the casealso in all other skew-T log-p diagrams for Willis Islandand Darwin for the same reason (Figs. 4, 6, 11 and 13).The Willis Island monsoon regime sounding is marginallywarmer than that for the easterly flow regime throughoutthe entire troposphere with differences typically less than1°C. The dew-point temperature differences between thetwo regimes are much larger, reaching over 8°C in the mid-dle troposphere, a feature that would be consistent withthe occurrence of more widespread deep convection in themonsoonal flow. As a result, the relative humidity is largerat all heights in the monsoon, the difference increasing fromapproximately 7% at the surface to a peak value of 25% at500 mb. Similar results were found also for each individualmonth separately (not shown).
All mean soundings at Willis Island have a large super-adiabatic layer between the surface and 1000 mb (thefirst standard level in the data set). Such a layer is oftenseen in individual soundings in the tropics and a possiblereason for it might be the change in ventilation of thetemperature sensor on the radiosonde after the balloon isreleased. A similar sharp change is seen also in the dew-point temperature. It is noteworthy that these sharp changes
Figure 2. Mean Willis Island soundings for the cyclone season(December-February): monsoon regime sounding (red) and easterly
flow regime sounding (blue).
Figure 3. Data stratification for Willis Island based on the 30-yeardata set (1980-2010). The first (red) column in a group refers tothe monsoon regime radiosonde soundings, the second (blue) columnrepresents the easterly flow regime radiosonde soundings, while thethird (green) column represents the radiosonde soundings that were
not classified in either of these two wind regimes.
survive the averaging, although as shown below they aremuch less prominent in the mean soundings at the othertwo stations.
Figure 3 shows monthly and seasonal distribution ofradiosonde soundings in the monsoon and easterly flowregimes for Willis Island. Shown also is the residualregime, the set of soundings with low-level wind direc-tions that lie outside these two regimes. Out of the approx-imately 2500 December-February radiosondes for Willis
Copyright © 2015 Meteorological Institute TCRR 15-2: 1–?? (2015)

4 N. CRNIVEC AND R. K. SMITH
Figure 4. Mean Willis Island monsoon regime soundings for individ-ual months: December (blue), January (red) and February (black).
Island examined, over 40% of the soundings lie in the resid-ual regime. Further, the easterly flow events are more fre-quent than the monsoon events during all months of thecyclone season, accounting for ∼45% of the total sound-ings, while the monsoon regime events account for only∼12% (approx. 300 radiosonde observations) of the totalthroughout the DJF season. The number of monsoon flowevents is the lowest in December and highest in Februarywith about 5% of total soundings.
Figure 4 shows the mean soundings for the WillisIsland monsoon regime during the individual monthsDecember, January and February. While the mean temper-ature curves hardly differ, the dew-point curves indicate aprogressive build up of moisture from December to Febru-ary. The RH differences between the January and Febru-ary soundings in the lower and upper troposphere are lessthan 1.5%, while in the middle troposphere they remainbelow 9%, the maximum difference occurring at 400 mb.In contrast, the mean December monsoon regime soundingis significantly drier than the other two. The RH differencesbetween the December and February soundings range fromabout 3% at the surface to almost 30% at 500 mb.
Figure 5 shows mean vertical profiles of wind direc-tion (panel a) and wind speed (panel b) for DJF monsoonand easterly flow regimes at Willis Island. The easterly flowregime exhibits easterly and southeasterly winds belowabout 500 mb, with southerly and southwesterly winds atupper levels between 500 mb and 100 mb. The wind pro-file for the monsoon flow regime is westerly to approxi-mately 150 mb, with easterly winds above this level. Thewind speed for the monsoon regime is about 2 to 3 m s−1
larger than that for the easterly flow regime throughout themajority of the troposphere (from the surface up to nearly
(a)
(b)
Figure 5. Vertical profiles of: (a) mean wind direction and (b) meanwind speed for DJF monsoon regime (red) and easterly flow regime(blue) Willis Island soundings. M denotes monsoon regime and E
denotes easterly flow regime.
300 mb). The magnitude of the vertical wind shear vectorbetween 200 mb and 850 mb, a metric often used for assess-ing shear in tropical cyclones (e.g. Gray 1968, DeMariaand Kaplan 1999 and refs., Zeng et al. 2010), is large inboth easterly flow regime (18.0 m s−1) and in the monsoonregime (14.9 m s−1). Such a value could be an impedimentto tropical cyclone formation and intensification (e.g. Gray1968, Zeng et al. 2010). The magnitude and the directionof 850-200 mb vertical shear for both DJF Willis Islandsoundings are listed in Table II.
Some additional thermodynamic features of the WillisIsland soundings are presented in the next section, togetherwith the results for Darwin and Weipa.
4 Comparison with Darwin and Weipa soundings
Figure 6 compares the mean DJF monsoon soundings forDarwin and Weipa with that for Willis Island. All three sta-tions have nearly the same temperature profile, although thesounding at Willis Island is marginally warmer at pressuresabove 850 mb and slightly cooler between 700 mb and200 mb. More noticeably, the Darwin and Weipa soundings
Copyright © 2015 Meteorological Institute TCRR 15-2: 1–?? (2015)

WILLIS ISLAND MEAN SOUNDINGS 5
Figure 6. Mean DJF monsoon regime soundings for Willis Island(black), Weipa (red) and Darwin (blue).
200
300
400
500
600
700
800
900
1000
20 30 40 50 60 70 80 90 100
Pre
ss
ure
(m
b)
RH (%)
WillisWeipa
Darwin
Figure 7. Mean DJF monsoon regime profiles of RH (%) for WillisIsland (black), Weipa (red) and Darwin (blue).
are moister than the Willis Island sounding, presumably aconsequence of the slightly warmer ocean temperatures inthose locations (typically 1-2°C higher). Relative humid-ity differences between the Darwin sounding, which is themost humid sounding, and that at Willis Island are mostpronounced between 500 mb and 300 mb where they rangefrom 20-25%. However, the RH differences are less than10% at levels below 700 mb. The seasonal DJF relativehumidity profiles at all three stations are compared in Fig.7.
As foreshadowed above, the mean soundings at Dar-win and Weipa do not show appreciable changes in temper-ature and dew-point temperature between the surface andthe first standard level (1000 mb).
Table I lists standard deviations of temperature and
Table I. Standard deviations of temperature and dew-point tempera-ture for selected standard pressure levels in the mean DJF monsoon
regime soundings for Willis Island, Weipa and Darwin.
Pressure (mb) σT (°C) σTd (°C)
200 Willis Island 1.2 6.9Weipa 0.9 4.0Darwin 0.9 4.6
300 Willis Island 1.6 9.0Weipa 1.0 6.9Darwin 1.0 5.0
500 Willis Island 1.2 9.3Weipa 0.8 6.4Darwin 1.0 5.5
700 Willis Island 1.2 6.7Weipa 1.0 4.6Darwin 0.9 4.5
850 Willis Island 1.1 4.2Weipa 0.9 3.3Darwin 0.8 2.8
1000 Willis Island 1.1 1.9Weipa 1.5 2.2Darwin 1.5 2.3
dew-point temperature at selected standard pressure levelsfor the seasonal DJF monsoon regime soundings at thethree stations, Willis Island, Weipa and Darwin. The meandeviations of temperature at each of the three stations areon the order of 1°C, while the mean deviations of dew-point temperature are somewhat larger, ranging from ∼2°Cnear the surface to a maximum value of ∼9°C reachedat Willis Island in the middle and upper troposphere. TheWillis Island sounding exhibits larger variability in bothtemperature and dew-point temperature than the other twostations at all levels except at 1000 mb, perhaps becausethis station is influenced more by the tropical extension ofmiddle latitude systems.
Figure 8 shows a histogram of the data stratifica-tion for Darwin and Weipa. Out of approximately 4300radiosondes for Darwin during DJF, about 50% fall in theeasterly flow regime. Monsoon events account for ∼20% ofthe total soundings and the remaining ∼30% of soundingsconstitute the residual. The situation at Weipa is similar.Easterly wind soundings are prevalent throughout the sea-son and account for more than 40% of the total. From allthree stations examined in this study, Weipa has the largestpercentage of monsoon soundings (about 30%). The mon-soon events at both Darwin and Weipa are most frequent
Copyright © 2015 Meteorological Institute TCRR 15-2: 1–?? (2015)

6 N. CRNIVEC AND R. K. SMITH
(a)
(b)
Figure 8. Data stratification for: (a) Darwin, based on 30-year dataset (1980-2010); (b) Weipa, based on 15-year data set (1998-2013).The first (red) column in a group represents the monsoon regimeradiosonde soundings, the second (blue) column represents the east-erly flow regime radiosonde soundings, while the third (green) col-umn represents the radiosonde soundings that were not classified in
either of these two wind regimes.
in January and February, their number in these two monthsbeing almost twice as high as in December at both stations.
Table II compares the magnitude and the directionof 850-200 mb vertical wind shear for DJF monsoonsoundings at Darwin and Weipa with those at Willis Island.The magnitude of vertical shear is relatively large at allthree stations, with the largest value observed in Darwinsounding (18.1 m s−1). The 850-200 mb shear direction ofthe DJF monsoon soundings is southerly (173 deg) at WillisIsland, southeasterly (124 deg) at Weipa and easterly (108deg) in Darwin.
4.1 CAPE and CIN
The foregoing mean monsoon soundings exhibit distinctdifferences in moist stability as measured by the Convec-tive Available Potential Energy (CAPE) and ConvectiveInhibition (CIN). Values of CAPE and CIN for a range ofmean soundings are listed in Table III. The level of neutralbuoyancy (LNB) and level of free convection (LFC) for the
Table II. 850-200 mb vertical wind shear for the mean DJF soundingsexamined in this study and for the Dunion MT sounding. The twowind regimes are denoted as: M (monsoon regime) and E (easterly
flow regime). Both the shear magnitude and direction are shown.
Sounding Regime Speed Direction(m s−1) (deg)
Willis Island sounding M 14.9 173Willis Island sounding E 18.0 243Weipa sounding M 13.3 124Darwin sounding M 18.1 108Dunion MT sounding 8.2 298
soundings are listed in Table III also. The values given arefor an air parcel lifted from a height of 100 m. As the heightfrom which the parcel is lifted is increased (e.g. 200-500m), the LFC increases and the LNB decreases.
The calculation of CAPE and CIN follows the methoddescribed in the Appendix of Smith and Montgomery(2012). In brief, the CAPE is computed as an average ofCAPE values for air parcels lifted pseudo-adiabatically at100 m intervals, from a height of 100 m up to 500 mabove the surface, until the LNB for the particular parcel.The value of the CAPE for the parcel lifted from thesurface is omitted as, in some situations, it can be asmuch as twice the value at 100 m, calling into questionits representativeness. For example, the sharp changes inthe temperature and dew-point temperature between thesurface and the first standard level discussed in section 3,have a large impact on the values of CAPE at the two levels.Indeed, in the DJF monsoon sounding at Willis Island theCAPE for a parcel lifted from the surface is 3289 J kg−1
and that for a parcel lifted from a height of 100 m is 1918 Jkg−1.
The reader is reminded that the foregoing method canresult in somewhat lower values of CAPE compared withthe results of other methods, where sometimes only thevalue for an air parcel lifted from the surface is considered,or an average of parcel properties in some shallow surface-based layer is used.
The calculations of CAPE and CIN use Bolton's for-mula (Bolton, 1980) to evaluate the pseudo-equivalentpotential temperature and the formula given in Emanuel(1994, p. 116, Eq. 4.4.13) to calculate the saturation vapourpressure.
The value of CIN listed in Table III is defined as thesmallest value in magnitude for the five parcels lifted from100 m to 500 m.
The data in Table III show that the CAPE in theDJF monsoon regime at Willis Island is significantly largerthan that in the DJF easterly flow regime there, whereasthe magnitude of the CIN is appreciably larger in theeasterly flow regime. Thus, not surprisingly, the monsoon
Copyright © 2015 Meteorological Institute TCRR 15-2: 1–?? (2015)

WILLIS ISLAND MEAN SOUNDINGS 7
Table III. Values of CAPE, CIN, LFC, LNB and TPW for the mean DJF soundings examined in this study and for the Dunion MT sounding.The two wind regimes are denoted as: M (monsoon regime) and E (easterly flow regime). The values of LFC and LNB are given for an air
parcel lifted from 100 m.
Sounding Regime CAPE CIN LFC LNB TPW(J kg−1) (J kg−1) (km) (km) (kg m−2)
Willis Island sounding M 1426 -54 1.0 15.0 51.2Willis Island sounding E 343 -72 1.3 11.7 39.9Weipa sounding M 794 -52 1.3 14.0 56.7Darwin sounding M 1120 -47 1.1 14.5 57.2Dunion MT sounding 1704 -49 0.9 13.7 44.9
0
5
10
15
20
-2 -1 0 1 2 3 4 5
z [
km
]
Tvp - Tve [K]
parcel lifted from 100 m
WillisWeipa
Darwin
Figure 9. Virtual temperature difference between lifted parcel andits environment for DJF monsoon soundings at Willis Island (black),Weipa (red) and Darwin (blue). Parcel was lifted from a height of 100
m.
regime is much more favourable for the occurrence of deepconvection. These features are consistent with a lower LFCand makedly higher LNB in the monsoon regime.
The CAPE in the DJF monsoon sounding for Darwin(1120 J kg−1) is ∼ 20% less than that in the correspondingWillis Island sounding (1426 J kg−1). The CAPE at Weipa(794 J kg−1) is even lower than that in Darwin. Thesedifferences are easy to discern in Fig. 9, which shows thevirtual temperature difference between that of an air parcellifted pseudo-adiabatically from a height of 100 m and thatof its local environment.
Because of the lack of data at levels 150 mb, 100 mb,70 mb and 50 mb in the DJF monsoon soundings at WillisIsland and Darwin (see section 2), the temperature datafrom the corresponding Weipa sounding at these levels isused for the calculation of CAPE at these two stations. Thisis necessary in the monsoon soundings because the LNB ismostly higher than the 200 mb-level, but it is not an issuein the DJF easterly flow sounding where the LNB is alwaysbelow this level.
The LNB for the Dunion sounding is 1.3 km lower
than that of the DJF monsoon regime at Willis Island, andindeed at the other two Australian stations, but the LFC ismarginally lower also (Table III).
4.2 TPW
A measure of the moisture content in a particular atmos-pheric environment is the Total Precipitable Water (TPW),which is the total amount of water vapour in a columnof unit cross section (1 m2) extending from the surfacethrough the depth of the atmosphere. Values of TPW forthe various soundings examined here are listed in Table IIIalso. In the DJF monsoon regime, the TPW at Willis Islandis 51.2 kg m−2 compared with only 39.9 kg m−2 in the DJFeasterly regime. There is a monotonic increase of TPW inthe monsoon regime at this station during the DJF periodfrom 44.2 kg m−2 in December to 54.9 kg m−2 in February.Values of TPW in the DJF monsoon regime at Darwin (57.2kg m−2) and Weipa (56.7 kg m−2) are somewhat largerthan at Willis Island.
4.3 Day time versus night time soundings
The radiosonde soundings can be stratified in terms of theobservation hour. The results of this stratification for allDJF radiosonde observations at each of the three Australianstations are shown in Fig. 10. As noted in the Introduc-tion, the radiosonde soundings at Willis Island are carriedout predominantly once a day (Fig. 10a). The twice dailyradiosonde soundings carried out at Darwin and Weipa,mostly at 23 UTC and 11 UTC (±1 hour), enable differ-ences between day time and night time soundings to beinvestigated. To this end, the monsoon regime soundingsfor these stations were stratified into day time and nighttime soundings as follows. Soundings carried out at 22,23 and 00 UTC were classified as day time (Darwin localtimes: 7:30 am, 8:30 am, 9:30 am) while those at 10, 11 and12 UTC were classified as night time (Darwin local times:7:30 pm, 8:30 pm, 9:30 pm). The local time in Weipa is halfan hour ahead of that in Darwin.
Figure 11 shows the results of this stratification forDarwin. The night time sounding is slightly warmer than
Copyright © 2015 Meteorological Institute TCRR 15-2: 1–?? (2015)

8 N. CRNIVEC AND R. K. SMITH
(a)
(b)
(c)
Figure 10. Stratification of radiosonde observations in terms ofobservation hour for: (a) Willis Island, based on the 30-year dataset (1980-2010); (b) Weipa, based on 15-year data set (1998-2013);(c) Darwin, based on 30-year data set (1980-2010). Radiosondeobservations taken at 10, 11 and 12 UTC are classified as night time(blue), while those taken at 22, 23 and 00 UTC are classified as day
time (red).
the day time sounding throughout the entire troposphere,although the temperature differences do not exceed 1°C.The night time sounding is somewhat moister than the daytime sounding, especially in the upper troposphere at levels
Figure 11. Mean Darwin day time (red) and night time (blue) mon-soon regime soundings for the cyclone season (December-February).
200
300
400
500
600
700
800
900
1000
30 40 50 60 70 80 90 100
Pre
ss
ure
(m
b)
RH (%)
daynight
Figure 12. Mean Darwin day time (red) and night time (blue)monsoon regime sounding profiles of RH (%) for the cyclone season
(December-February).
above 400 mb (Figs. 11 and 12). The largest RH differenceof almost 20% occurs at 250 mb.
Similar results are found for Weipa. The moister nighttime soundings at Darwin and Weipa account partially forthe larger RH values in the mean DJF monsoon soundingsat these two stations compared with the sounding at WillisIsland (see Fig. 7), where the radiosonde observations arecarried out only once per day during the day time hours.Nevertheless, a comparison of the day time soundings atall three stations which eliminates the effect of increasednight time humidity, revealed that the Willis Island meansounding is still drier than the soundings at the other twostations (not shown). A possible explanation for this findingcould be the slightly lower sea surface temperatures around
Copyright © 2015 Meteorological Institute TCRR 15-2: 1–?? (2015)

WILLIS ISLAND MEAN SOUNDINGS 9
Willis Island compared with those around Darwin andWeipa, typically by 1-2°C. There may be some continentalinfluence also at Willis Island for winds that have a largewesterly component. These may be somewhat drier belowthe continental mixed layer depth.
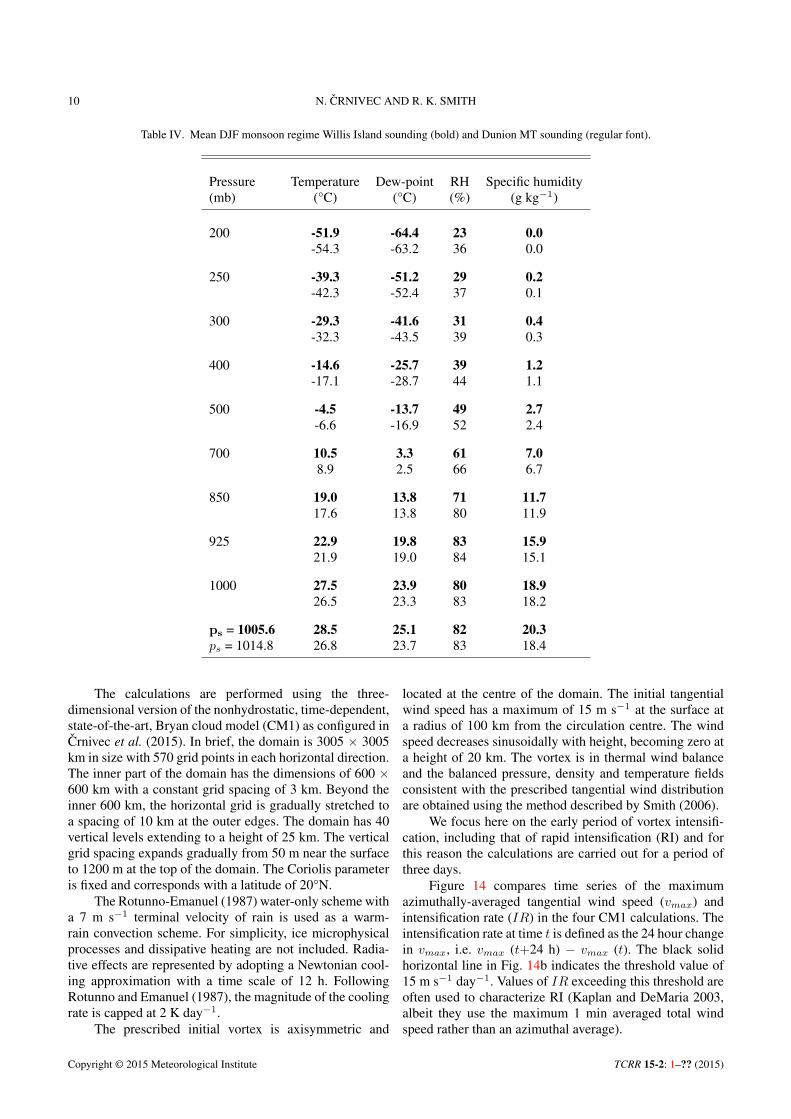
5 Comparison of Willis Island monsoon sounding withDunion MT sounding
In the comparison of the mean DJF monsoon soundings forWillis Island, Weipa and Darwin in section 4, it was foundthat the Willis Island sounding is the driest of the three,especially at the middle and upper levels. Nevertheless,we choose the Willis Island DJF monsoon sounding forcomparison with Dunion MT sounding as it has been usedpreviously for tropical cyclone modelling. This comparisonis shown in Fig. 13 and a listing of the temperature, dew-point temperature, RH and specific humidity (q) at thesurface and standard pressure levels up to 200 mb is givenin Table IV. The values of RH and q for Willis Island,shown in Table IV, were calculated using the Clausius-Clapeyron equation to obtain the saturation water vapourpressure:
es(T ) = es(T0) exp
[Lv
Rv
(1
T0− 1
T
)], (1)
where T0 = 273 K, es(T0) = 6.1 mb, Lv is the specificlatent heat of vaporization (2.5× 10⁶ J kg−1) and Rv is thespecific gas constant for water vapour (461.5 J kg−1 K−1).
The values of T , Td, RH and q for the Dunion MTsounding shown in Table IV are based on the data fromDunion (2011, p. 903, Table 2), with q calculated from themixing ratio given by Dunion.
The Willis Island sounding is 1-3°C warmer thanDunion MT sounding throughout the entire troposphere.Although the dew-point depression (T − Td) at most levelsis a little less at Willis Island, the warmer temperaturesat this station contribute to slightly lower values of RHcompared with the Dunion MT sounding, although theRH difference between the two is small (less than 5% atmost observed levels). The greatest disparity is found inthe upper troposphere above 300 mb and near the 850 mbpressure level, where the RH difference exceeds 8%.
Dunion (2011) gave a value of CAPE for the MTsounding as 1922 J kg−1. However, this can not be com-pared with the values of CAPE given above, because themethod of calculation is different. For this reason we cal-culated the CAPE for the Dunion MT sounding using thesame method as for the Australian soundings and found thevalue to be 1704 J kg−1 (Table III). This value is ∼20%higher than that for the DJF monsoon Willis Island sound-ing.
It should be pointed out that all other parameters (i.e.CIN, LFC, LNB) for the Dunion MT sounding listed inTable III were calculated using the same method as for
Figure 13. Comparison of the mean DJF monsoon regime WillisIsland sounding (red) with the Dunion MT sounding (blue).
the three Australian stations and might differ slightly fromoriginal values given in Dunion (2011).
The Dunion MT sounding has an appreciably lowervalue of TPW (44.9 kg m−2) than the DJF monsoonsounding at Willis Island (51.2 kg m−2), which, in turn,is somewhat lower than those at Darwin (57.2 kg m−2) andWeipa (56.7 kg m−2).
The data in Table II show that the magnitude of verti-cal wind shear in the Dunion MT sounding is considerablylower than that in any other Australian sounding examined.The 850-200 mb vertical wind shear in the Dunion MTsounding is a moderate 8.2 m s−1 from 298 deg.
6 Implications for tropical cyclone modelling
The remaining question to be addressed is whether theuse of different mean environmental soundings leads tosignificant differences in the intensification rate of modeltropical cyclones. In an attempt to answer this questionwe have carried out four numerical simulations of trop-ical cyclones using different soundings discussed here asa background thermodynamic profile. The first simulationuses the Dunion MT sounding to represent the environ-ment, the second uses the DJF monsoon Willis Islandsounding and the third uses the DJF monsoon Darwinsounding. In each of these three cases the sea surface tem-perature (SST) is fixed at 28°C. The fourth simulationis initialized using the same DJF monsoon Willis Islandsounding, but the SST is increased to 29°C. All simulationsrelate to the prototype problem for intensification, whichconsiders the evolution of a prescribed, initially cloud-free,axisymmetric, baroclinic, balanced vortex in a quiescentenvironment on an f -plane.
Copyright © 2015 Meteorological Institute TCRR 15-2: 1–?? (2015)
10 N. CRNIVEC AND R. K. SMITH
Table IV. Mean DJF monsoon regime Willis Island sounding (bold) and Dunion MT sounding (regular font).
Pressure Temperature Dew-point RH Specific humidity(mb) (°C) (°C) (%) (g kg−1)
200 -51.9 -64.4 23 0.0-54.3 -63.2 36 0.0
250 -39.3 -51.2 29 0.2-42.3 -52.4 37 0.1
300 -29.3 -41.6 31 0.4-32.3 -43.5 39 0.3
400 -14.6 -25.7 39 1.2-17.1 -28.7 44 1.1
500 -4.5 -13.7 49 2.7-6.6 -16.9 52 2.4
700 10.5 3.3 61 7.08.9 2.5 66 6.7
850 19.0 13.8 71 11.717.6 13.8 80 11.9
925 22.9 19.8 83 15.921.9 19.0 84 15.1
1000 27.5 23.9 80 18.926.5 23.3 83 18.2
ps = 1005.6 28.5 25.1 82 20.3ps = 1014.8 26.8 23.7 83 18.4
The calculations are performed using the three-dimensional version of the nonhydrostatic, time-dependent,state-of-the-art, Bryan cloud model (CM1) as configured inCrnivec et al. (2015). In brief, the domain is 3005 × 3005km in size with 570 grid points in each horizontal direction.The inner part of the domain has the dimensions of 600 ×600 km with a constant grid spacing of 3 km. Beyond theinner 600 km, the horizontal grid is gradually stretched toa spacing of 10 km at the outer edges. The domain has 40vertical levels extending to a height of 25 km. The verticalgrid spacing expands gradually from 50 m near the surfaceto 1200 m at the top of the domain. The Coriolis parameteris fixed and corresponds with a latitude of 20°N.
The Rotunno-Emanuel (1987) water-only scheme witha 7 m s−1 terminal velocity of rain is used as a warm-rain convection scheme. For simplicity, ice microphysicalprocesses and dissipative heating are not included. Radia-tive effects are represented by adopting a Newtonian cool-ing approximation with a time scale of 12 h. FollowingRotunno and Emanuel (1987), the magnitude of the coolingrate is capped at 2 K day−1.
The prescribed initial vortex is axisymmetric and
located at the centre of the domain. The initial tangentialwind speed has a maximum of 15 m s−1 at the surface ata radius of 100 km from the circulation centre. The windspeed decreases sinusoidally with height, becoming zero ata height of 20 km. The vortex is in thermal wind balanceand the balanced pressure, density and temperature fieldsconsistent with the prescribed tangential wind distributionare obtained using the method described by Smith (2006).
We focus here on the early period of vortex intensifi-cation, including that of rapid intensification (RI) and forthis reason the calculations are carried out for a period ofthree days.
Figure 14 compares time series of the maximumazimuthally-averaged tangential wind speed (vmax) andintensification rate (IR) in the four CM1 calculations. Theintensification rate at time t is defined as the 24 hour changein vmax, i.e. vmax (t+24 h) − vmax (t). The black solidhorizontal line in Fig. 14b indicates the threshold value of15 m s−1 day−1. Values of IR exceeding this threshold areoften used to characterize RI (Kaplan and DeMaria 2003,albeit they use the maximum 1 min averaged total windspeed rather than an azimuthal average).
Copyright © 2015 Meteorological Institute TCRR 15-2: 1–?? (2015)

WILLIS ISLAND MEAN SOUNDINGS 11
(a)
(b)
Figure 14. Time series of: (a) maximum azimuthally-averaged tan-gential wind speed (vmax) and (b) intensification rate (IR) in theCM1 simulations with an SST of 28°C and different soundings usedas a background environmental profile: Dunion MT sounding (blue),mean DJF monsoon Willis Island sounding (red) and mean DJF mon-soon Darwin sounding (black). Orange curve shows vmax evolutionin the CM1 simulation where the mean DJF monsoon Willis Islandsounding was used together with an increased SST (29°C). Note thedifference in time period on the abscissa between panel (a) and panel
(b).
First we compare the three simulations with the sameSST of 28°C. The vortex intensification is most rapidand the onset of RI occurs earliest when the Dunion MTsounding is used as a background thermodynamic state. Inthis simulation, the maximum intensification rate is almost30 m s−1 day−1 and it is reached after 36 h of integrationtime. In the simulation with the DJF monsoon Darwinsounding, vortex intensification begins later than in theDunion MT simulation and the intensification rate is lower,at least during the first ∼45 h of integration (Fig. 14b). Atlater times the IR at Darwin exceeds that in the DunionMT simulation and the intensities of the vortices after 72h are similar (approx. 50 m s−1) in the two simulations.The vortex intensification is the weakest in the simulationwith the DJF monsoon Willis Island sounding, where themaximum IR only slightly exceeds 15 m s−1 day−1.Therefore the final intensity after 72 h in the Willis Islandexperiment is much lower (approx. 33 m s−1). In summary,there is a significant sensitivity of vortex intensification to
the sounding used if the SST is held the same.In a recent paper we showed that the intensification
rate depends strongly on the SST (Crnivec et al. 2015) sothat, for example, a 1 deg increase in SST when using theWillis Island sounding would be expected to significantlyelevate the intensification rate. In this paper we showed thata larger SST leads to an increase in the surface moisturefluxes, which, in turn, result in higher values of near-surface moisture, equivalent potential temperature and,most significantly, to a larger radial gradient of diabaticheating rate in the lower to mid troposphere. This largerradial gradient leads to a stronger secondary circulation,which, in turn, leads to a stronger radial import of absoluteangular momentum surfaces above the boundary layer andtherefore to more rapid spin up there. This more rapid spinup leads through boundary layer dynamics to a more rapidspin up of the tangential wind in the boundary layer, wherethe maximum tangential wind speed occurs (see e.g. Kilroyet al. (2015) and references therein).
Based on the foregoing findings, the most likely factorthat would explain the differences in the vortex intensifi-cation rate between the Dunion MT and the Willis Islandenvironments is the different surface specific humidity, qs,of the two soundings combined with the assumption of thesame SST. At Willis Island, qs = 20.3 g kg−1 while that ofthe Dunion MT sounding is qs = 18.4 g kg−1 (Table IV).For an SST of 28°C, the saturation specific humidity, q∗s ,is 24.1 g kg−1 at Willis Island (where ps = 1005.6 mb)and 23.9 g kg−1 in the Dunion MT Sounding (where ps =1014.8 mb). Thus the environmental sea-surface mois-ture disequilibrium is larger for the Dunion MT sounding,which might be expected to lead to larger surface moisturefluxes at all radii. To confirm that this is the case we show inFig. 15 radius-time diagrams of azimuthally-averaged sur-face water vapour fluxes in the three CM1 simulations withthe Dunion MT and Willis Island soundings. As surmisedabove, the surface moisture fluxes in the Dunion MT simu-lation are considerably larger than in the Willis Island sim-ulation, when the SST is 28°C (Figs. 15a and 15b). Whenthe SST is increased to 29°C in the Willis Island simula-tion, the magnitude of the surface fluxes in the inner-coreregion of the vortex is significantly increased (Fig. 15c).
The implications of these higher fluxes are confirmedby intensity curve for the fourth simulation shown in Fig.14, i.e. the one that uses the DJF monsoon Willis Islandsounding in combination with an increased SST of 29°C.In this case, the vortex enters the RI phase earlier and therate of intensification is increased in comparison with thatfor the Willis Island simulation with an SST of 28°C. The 1deg SST increase leads to an increase in the maximum IRvalue from barely 15 m s−1 day−1 to approximately 25 ms−1 day−1.
Taken together, the results of Crnivec et al. (2015) andthe present study indicate that tropical cyclone intensifica-tion rate is sensitive to both the environmental soundingused and the sea surface temperature.
Copyright © 2015 Meteorological Institute TCRR 15-2: 1–?? (2015)

12 N. CRNIVEC AND R. K. SMITH
(a)
(b)
(c)
Figure 15. Radius-time plots of azimuthally-averaged surface watervapour flux in the CM1 simulations with different soundings usedas background environmental profile: Dunion MT sounding (panel a)and the mean DJF monsoon Willis Island sounding (panels b and c).In the simulations shown in panels (a) and (b) the SST is held fixedat 28°C, while in the simulation shown in panel (c) it is held fixed at29°C. Contour interval is 0.05 g kg−1 s−1. Shading as indicated in
the colour bar.
We remind the reader that the simulations presentedherein relate to the prototype problem for intensification,which examines the vortex evolution in an environmentwith no background flow. However, as it was shown in Fig.5, the monsoonal flow exhibits a degree of vertical windshear, which would be expected to impede the intensifica-tion rate of tropical cyclones. Exploration of the effects ofthe background vertical wind shear is the topic of a futurestudy.
7 Summary
In the Australian region, tropical cyclones tend to formon the monsoon shear line, sometimes over sea surfacetemperatures exceeding 30°C and the question we haveaddressed was to what extent the Dunion moist tropicalsounding, based on stations around the Caribbean, mightbe representative of their environment. The Dunion MTsounding has replaced the much used Jordan sounding andthe occasionally used Willis Island sounding to becomea benchmark for the environmental sounding in idealizednumerical studies of tropical cyclones. To this end we haveanalysed long term records of radiosonde soundings atWillis Island, Darwin and Weipa, focussing mainly on themean thermodynamic structure in the monsoonal regime(winds in the sector west to north). These soundings werecompared with each other and the Willis Island soundingwas compared with the Dunion MT sounding. The mainresults are as follows.
(1) The monsoon regime sounding for the December-February period at Willis Island, typical of the trop-ical cyclone season, is much moister than the meansounding there for easterly flow conditions (meanwind directions up to 700 mb lying in the sectorsoutheast to northeast). The TPW in the monsoonregime is ∼ 51 kg m−2, compared with ∼ 40 kg m−2
in the easterly flow regime and the RH at 500 mbis about 25% higher. Nevertheless, the temperatureprofiles are similar in the two regimes.
(2) The mean monsoon sounding at Willis Island pro-gressively moistens between December and Febru-ary (TPW increasing from ∼44 kg m−2 to ∼55 kgm−2 and the RH at 500 mb increasing from ∼30% to∼60%).
(3) The mean monsoonal soundings at Darwin andWeipa are moister than that at Willis Island, withTPW values ∼57 kg m−2 at Darwin and Weipaand ∼51 kg m−2 at Willis Island. Relative humid-ity differences between the Darwin and Willis Islandsoundings are most pronounced between 500 mb and300 mb where the values at Darwin are typically 20-25% higher.
(5) The night time seasonal monsoon regime sound-ings at Darwin and Weipa are marginally warmerand markedly moister (especially in the upper tropo-sphere) than the corresponding day time soundings.
Copyright © 2015 Meteorological Institute TCRR 15-2: 1–?? (2015)
WILLIS ISLAND MEAN SOUNDINGS 13
(6) The December-February monsoon Willis Islandsounding is 1-3°C warmer than Dunion MT sound-ing throughout the entire troposphere. Although thedew-point depression (T − Td) at most levels is a lit-tle less at Willis Island, the warmer temperatures atthis station contribute to slightly lower values of RHcompared with the Dunion MT sounding, althoughthe RH difference between the two is relatively small(less than 5% at most observed levels).
(7) Numerical model simulations showed significant dif-ferences in the intensification rates of vortices in theprototype problem for intensification when differentsoundings examined in this study were used as anenvironmental sounding, while keeping all other fac-tors the same. In particular, the maximum intensi-fication rate in the simulation with the Dunion MTsounding is almost 30 m s−1 day−1, while it is onlyabout 15 m s−1 day−1 in the simulation with the DJFmonsoon Willis Island sounding. However, the inten-sification rate depends strongly on the SST so thatan increase in SST of 1°C brings the intensificationcurve at Willis Island much more in line with thatfound using the Dunion MT sounding.
Acknowledgements
We thank Michael Reeder, Michael Montgomery andan anonymous reviewer for their perceptive and construc-tive critiques of the original version of the manuscript.RKS acknowledges financial support for this research fromthe German Research Council (Deutsche Forschungsge-meinschaft) under Grant number SM30-23 and the Officeof Naval Research Global under Grant No. N62909-15-1-N021.
References
Bolton D. 1980: The computation of equivalent potentialtemperature. Mon. Wea. Rev., 108, 1046-1053.
Crnivec N, Smith RK, Kilroy G. 2015: Dependence oftropical cyclone intensification rate on sea surface temperature.Q. J. R. Meteorol. Soc., (submitted).
Dunion JP. 2011: Rewriting the climatology of the tropicalNorth Atlantic and Caribbean Sea atmosphere. J. Climate, 24,893-908.
Dunion JP, Marron CS. 2008: A reexamination of the Jordanmean tropical sounding based on awareness of the Saharan airlayer: Results from 2002. J. Climate, 21, 5242-5253.
Emanuel KA. 1994. Atmospheric convection. Oxford Uni-versity Press, Oxford, UK.
Gray WM, Ruprecht E, Phelps R. 1975: Relative humidityin tropical weather systems. Mon. Wea. Rev., 103, 685-690.
Holland GH. 1997: The maximum potential intensity oftropical cyclones. J. Atmos. Sci., 54, 2519-2541.
Jordan CL. 1958 Mean soundings for the West Indies area.J. Meteor., 15, 91-97.
DeMaria M, Kaplan J. 1999: A Statistical Hurricane Inten-sity Prediction Scheme (SHIPS) for the Atlantic basin. Wea. Fore-casting, 9, 209220.
DeMaria M, Kaplan J. 1999: An updated Statistical Hurri-cane Intensity Prediction Scheme (SHIPS) for the Atlantic andEastern North Pacific Basins. Wea. Forecasting, 14, 326-337.
Gray WM. 1968: Global view of the origin of tropicaldisturbances and storms. Mon. Wea. Rev., , 96, 669-700.
Kaplan J, DeMaria M. 2003: Large-scale characteristics ofrapidly intensifying tropical cyclones in the North Atlantic Basin.Wea. Forecasting, 18, 1093-1108.
Kilroy G, Smith RK, Montgomery MT. 2015: Why do modeltropical cyclones grow progressively in size and decay in intensityafter reaching maturity? J. Atmos. Sci., (in press).
Pope M, Jakob C, Reeder MJ. 2009: Regimes of the NorthAustralian wet season. J. Climate, 22, 6699-6719.
Rotunno R, Emanuel KA. 1987: An air-sea interactiontheory for tropical cyclones. Part II: Evolutionary study using anonhydrostatic axisymmetric numerical model. J. Atmos. Sci., 44,542-561.
Smith RK. 2006: Accurate determination of a balancedaxisymmetric vortex. Tellus, 58A, 98-103.
Smith RK, Montgomery MT. 2012: Observations of the con-vective environment in developing and non-developing tropicaldisturbances. Q. J. R. Meteorol. Soc., 138, 1721-1739.
Wang Y. 2001: An explicit simulation of tropical cycloneswith a triply nested movable mesh primitive equation model:TCM3. Part I: Model description and control experiment. Mon.Wea. Rev., 129, 1370-1394.
Wang Y. 2002: Vortex Rossby waves in a numericallysimulated tropical cyclone. part i: overall structure, potentialvorticity, and kinetic energy budgets. J. Atmos. Sci., 59, 1213-1238.
Zeng Z, Wang Y, Chen L. 2010: A statistical anal-ysis of vertical shear effect on tropical cyclone intensitychange in the North Atlantic. Geo. Res. Lett. 37, L02802,doi:10.1029/2009GL041788.
Copyright © 2015 Meteorological Institute TCRR 15-2: 1–?? (2015)