Embed Size (px)
Citation preview
Deepwater Horizon Study Group Working Paper – January 2011
1
Causative Technical and Operational Elements of the Deepwater Horizon Blowout
Gary L. Marshi
Summary Without intimate detail of plans, permits, and most of all, operations, a thoroughgoing and
definitive analysis of the blowout is impossible. Hence, much of what is presented here deals with only the salient features of the planning and drilling of the Macondo well, most of which has been obtained from participants‘ sworn testimony and submissions to investigative boards—US Senate, US House, and Coast Guard/MMS joint hearings. As a consequence, only tentative conclusions can be drawn, and most often these consist of only alternate hypotheses of the possible causes and effects leading up to the blowout. As the saying goes, ―The Devil is in the details.‖ and details available for study are few and far between, in a large measure due to the tragic deaths of those who were most deeply involved in the event, the rig crew.
It is hoped, however, that what is presented, however limited, will serve to assist further
investigations and to guide future plans and practices in deep water drilling and development. License is taken to verge on the outright speculative in places with the intent of fostering some thinking ―outside the box‖ as the search for definitive answers continues into the future. Be aware, however, that even the speculative points raised are not mere conjecture, but are based on author‘s extensive knowledge of deepwater drilling and downhole mechanics as applied to the puzzles that the Macondo blowout faces us with.
In the opinion of the author and many others around the world, some bad choices were made in
the planning and execution of this well by the principal participants: BP, Transocean, MMS (Minerals Management Service), and some of the third party service companies. While the author agrees that some of these are an outfall of bad work culture and/or bad safety practices as some contend, those elements are mostly not dealt with here. This analysis was confined to the mechanics of the well as planned and executed.
Preface This paper was originally drafted by about mid-August, 2010. Certain relevant information
subsequently became available which might alter conclusions to some extent and might enable additional ones to be drawn. For the sake of expediency, these are summarized in Appendix 4 rather than woven into the original text. Where such information might be useful, reference to Appendix 4 has been added to the original text.
i Gary L. Marsh is an ex Shell employee, now retired after a 30-year career in drilling engineering with stints in drilling research, production engineering supervision, and floating drilling operation supervision. Much of the last half of his career was devoted to engineering wells and drilling equipment for deep water exploratory and development drilling. BSME (1965), University of Tulsa.
Deepwater Horizon Study Group – Working Paper
Causative Technical and Operational Elements of the Deepwater Horizon Blowout
2
Table of Contents
1. What Happened?............................................................................................................................... 3
2. What Led Up to the Initial Blowout .............................................................................................. 4
3. Candidate Flow Paths from Total Depth (TD) to the Rig Floor .............................................. 5
4. Executed Plans Which Increased Risks ......................................................................................... 6
5. Operations and Omissions Which Increased Risks ..................................................................... 7
6. Possible Well Behavior Due to Plans, Actions, and Risks Taken.............................................. 8
7. Possible Outcomes Due to Plans, Actions, and Risks Taken .................................................... 9
8. Alternative to Nitrogen Cement ................................................................................................... 10
9. Idiosyncrasies of Oil Muds ............................................................................................................ 11
10. Why Didn‘t the BOP B/S Rams Cut Drill Pipe and Seal Off the Well? ................................ 12
11. 20-20 Hindsight ............................................................................................................................... 12
12. References ........................................................................................................................................ 15
Appendix 1 – Particulars Of Macondo Production Casing ............................................................... 18
Appendix 2 – Record Of Halliburton/Sperry PVT Last Two Hours Before The Blowout ......... 22
Appendix 3 – Hydrate Formation Diagram .......................................................................................... 24
Appendix 4 – Late Coming Information ............................................................................................... 25
Deepwater Horizon Study Group – Working Paper
Causative Technical and Operational Elements of the Deepwater Horizon Blowout
3
1. What Happened?
At approximately 21:50 hours (9:50 PM) on the evening of April 20, 2010, an apparently uncontrollable flow of water, oil mud, oil, and gas came out of the drilling riser top (and possibly the drill pipe)1 on the dynamically positioned drilling vessel Deepwater Horizon owned by Transocean and contracted by BP to drill the Mississippi Canyon 252 #1 well in the deep water Gulf of Mexico.
A series of explosions (probably two) and a huge fire followed shortly after the uncontrolled flow commenced.2, 3, 4 The fire continued unabated for something under two days fueled by hydrocarbons coming from the well.5
The vessel was abandoned shortly after the fire started, but 11 of 126 persons aboard perished.5
The vessel sank about thirty-six hours later for reasons unknown and the fire was thereby
extinguished.5
The riser (and drill pipe within) bent at the top of the subsea Blowout Preventer (BOP) and lay crumpled and broken on the seafloor, spewing gas and oil.6
A long series of attempts was made to stop the oil from entering the deep, cold water at the sea
floor after the vessel sank by:
a. Closing the BOP B/S (blind/shear) rams and variable pipe rams with Remotely Operated Vehicle (ROV) intervention (failed).7
b. Closing off the spewing end of the drill pipe out on the sea floor (succeeded).8
c. Capturing oil spewing from the broken riser end out on the sea floor with a box-like capture containment device to divert to a drilling vessel above (failed).9
d. Capturing oil spewing from the riser end with an insertion tube (partially successful).10
e. Capturing the oil spewing from the BOP top (and at the sea floor) by shearing off the bent over and ruptured riser (and drill pipe within) at the BOP top and installing a small, but unsealing capture device, the so called ―Top Hat‖, also known as LMRP (Lower Marine Riser Package) Cap (partially successful). 11, 12
f. Killing the well by injecting heavy mud into the BOP (failed—Flow at Top hat still persisted during and after attempt and partial capture still continued afterward).13
g. Removing remnant riser at the BOP top and bolting on a sealing cap with a BOP above it.14 That succeeded in shutting in the well15 with only a few small leaks.16
Deepwater Horizon Study Group – Working Paper
Causative Technical and Operational Elements of the Deepwater Horizon Blowout
4
h. Pumping heavy kill mud into the well to drive well effluent down and reduce pressure. (succeeded).17
i. Pumping cement following the kill mud to ―permanently‖ seal off the flow path(s).
j. (The outcomes are still being evaluated as of August 19, 2010, - no flow to sea18 except perhaps a few small leaks as before.)19
k. During all of the above, relief wells were being permitted and drilled to provide bottom kill capability. (The first relief well was near to an intercept point as of August 19, 2010, but stopped to evaluated well condition before intercept.)1
2. What Led Up to the Initial Blowout
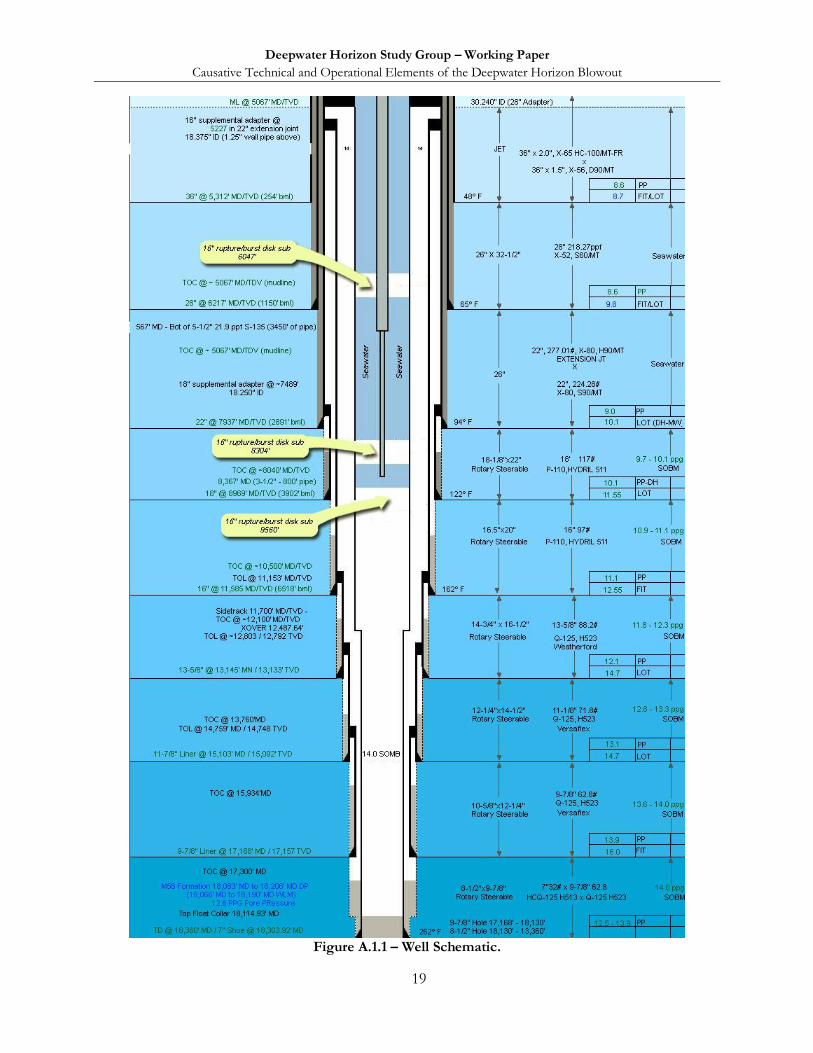
a. The well had been drilled to total measured depth 18,380 ft below rig floor (Kelly Bushing (KB) reference point—75 ft above mean sea level), some 13,293 ft below the mud line.20 A schematic of the well below mud line is reproduced in Appendix 1 as Figure A.1.1.
b. It had penetrated a hydrocarbon productive zone of perhaps 124 ft thickness.20
c. A tapered string of production-type casing was run and cemented using cement mix containing Nitrogen2 with the bottom of the 7 in casing shoe sitting at 18,303 ft KB.21, 20
d. The crossover from 7 in to 9⅞ in production casing was at 12,487 ft KB.20
e. The 9⅞ in casing hanger in the subsea wellhead at 5067 ft KB was then promptly equipped with a seal assembly to seal off the annulus between production casing and the drilling casings used to drill the well.22 A trip was made to shed the running tools and a tapered displacement string was run it to just above the BOP.
f. The casing was tested to 2500 psi under the closed blind/shear (B/S) rams in the subsea BOP by pressuring up the kill line mounted on the drilling riser.23
g. The tapered drill string was deployed onward to 8367 ft KB and a spacer and seawater pumped into it and around its end and upward into the annulus up to the BOP.24
h. The annular BOP was closed around the drill pipe to isolate the riser and pressure bled from the drill pipe to provide a negative test of the casing, seal assembly, and cement job at the total depth (TD).24 Thus (eventually) was provided about a 2000 psi under balance referenced to the estimated productive zone pore pressure of about 13,000 psi at TD. A few hours later, a similar second negative test was conducted, except bleeding off of pressure and volume was
Deepwater Horizon Study Group – Working Paper
Causative Technical and Operational Elements of the Deepwater Horizon Blowout
5
done from the kill line top.
i. In some way, productive zone hydrocarbons made their way into the well structure25 and up to the rig. To this day, August 19, 2010, there is no definitive public information pinpointing why, how, and where this incursion occurred, and how the hydrocarbons made the journey upward to the rig through or around more or less quiescent well fluids residing in the well structure from 8367 ft KB down. Above that depth, pumping was occurring inside the 9⅞ in production casing bore on an intermittent or steady basis during the last two hours.26
j. It is reported that last-ditch efforts to control the flow at surface and at the subsea BOP were made, as follows: 1. The lower annular in the subsea BOP and the Diverter packer which closes
around the drill pipe just below the rig floor were shown to have been activated by indicator lights in the vessel bridge space BOP control panel.27
2. The Emergency Disconnect Sequence (ESD) was triggered on the BOP control panel in the vessel bridge space just before the vessel was abandoned.28
k. The BOP apparently remained connected to the vessel through the riser up until the vessel sank—continuously feeding the fire. None of the last-ditch efforts succeeded in stemming the hydrocarbon flow or disconnecting from the well.
l. After the vessel was abandoned and before and after it sank, extensive operations by Remotely Operated Vehicles (ROV‘s) were carried out in an attempt to close the blind shear (B/S) ram BOP and the variable pipe ram BOP elements. None were successful.
3. Candidate Flow Paths from Total Depth (TD) to the Rig Floor
A flow path from the productive zone through channels or micro-annuli upward into the open hole annular space and thence into annular space between the production casing string and the innermost casing strings used in drilling the well.29 Author deduces that this necessarily has to have triggered failure somewhere else in the well system to enable well fluids to enter the BOP bore and proceed on up through the riser to the rig. Candidates for this include the following: A failure of the 9⅞ in production casing (leak or parting).
a. A failure of the 7 in production casing (leak or parting). 1. Had all these barriers remained intact, the fluid could not have fed
out of the annular space and found its way into the BOP bore, riser, and to the vessel.
A flow path from the productive zone through channels in the cement downward to the shoe of the production casing, through the guide shoe and cement-filled(?) ―shoetrack‖ consisting of
Deepwater Horizon Study Group – Working Paper
Causative Technical and Operational Elements of the Deepwater Horizon Blowout
6
about 189 ft of 7 in casing, through the float collar, and on upward into the 9⅞ in production casing bore, BOP, and riser. No other failures other than those of the cement and float equipment would be necessary for the flow path to become open to the BOP, and thence through the riser (and perhaps, the drill pipe) to the rig.29
There is some possibility that some incursion occurred along both paths, but one was cut short
by an effective barrier in the well.
Very unfortunately, the risks of an incursion from the zone and the failure of a barrier or barriers in the flow paths to the rig were increased by the way the well was planned and executed—risks increased to the degree that the blowout event started and proceeded to its catastrophic end.
4. Executed Plans Which Increased Risks
a. Plan to leave all drilling liner overlaps uncemented.30 Sole reliance on drilling liner hanger packers and the parallel single o-ring seal in the hydraulic setting mechanism for the liner hanger in the event the annulus became subject to pressure.31
b. Plan to leave operations for installation of the lock-down for the 9⅞ in
production casing hanger seal assembly until after the riser mud was circulated out.32
c. Plan to run production casing as an all-in-one tapered string instead of as a liner
and tieback.33, 35
d. Plan to perform a meager positive pressure test on the production casing as cemented.34
e. Plan to leave off most of recommended casing centralizers.35
f. Plan to put 5000 psi rated packer element in 10,000 psi rated lower annular
BOP.36
g. Plan to circulate bottoms only part way up before cement job.37
h. Plan to run underbalance test with most of the drill pipe out of the wellbore instead of running a full string with shoe near total depth (TD).38
i. Plan to omit bond log only on the basis of cement lift [back pressure from
cement in annular space] and absence of fluid losses during cementing process.39
j. Plan to leave annulus between 7 in production casing and 9⅞ in drilling liner uncemented.40
Deepwater Horizon Study Group – Working Paper
Causative Technical and Operational Elements of the Deepwater Horizon Blowout
7
k. Plan to place sole reliance on float equipment and shoetrack cement to isolate shoe of production casing that was, as it were, minimally spaced from the base of the productive zone.41
l. Plan to use Nitrogen in the cement mix42 as an expedient to lightening the slurry
density. Non-gaseous additives (glass microspheres) are available for that purpose.43 See Section 8.0 on alternative technology.
m. Plan for negative testing departed from MMS approved one and showed no
technical advice on bleed back volumes that were to be expected.44
n. General: most of the above plans seem to have been keyed to minimizing rig time and material expense with (perhaps, probably) less regard for their effect on safety. As Chairman Stupak put it (addressing Tony Howard with BP), ―Quite
frankly, BP blew it. You cut corners to save money and time.‖ 45 Three levels of plans before final execution are perceived:
a. MMS approved plan. b. ―The detailed procedure is created on the rig site‖ 42-op. cit., p 24 c. Last minute changes—via e-mails, faxes, or phone??
5. Operations and Omissions Which Increased Risks
Prompt setting of seal assembly after cementing46 would have masked any significant flow into the annulus. Physical fact: Unless that seal or something else in the well system failed then and there, the pressure effects from an annular incursion would not have been detected. A lockdown device to hold the seal and hanger in place was not installed.47
Negative pressure testing started (and completed) in time frame after cementing that lab tests
indicated Nitrogen infused cement would not have developed any strength.48, 49
Puzzles presented by negative testing not honored in terms of potential flow from the well.
Extraneous pressures and bled back volumes in excess of those accounted for by mud expansion and casing contraction misinterpreted, ignored, or glossed over.49
Pit level monitoring to detect excess volumes not set up cleanly for Pressure-Volume-
Temperature (PVT) totalizing during circulating out riser with seawater or extraneous trip tank operations, or both confused results.49, 50 Excess flow from PVT monitoring of flow-in vs. flow-out (at shaker) not monitored or not honored and investigated. Flow out PVT sensor (at shaker) completely bypassed by returns going overboard after 21:10 hours.51, 52 Flow line monitor in PVT was grossly miss-calibrated (showed less than half of pumping volume)52 This was apparently ignored. The PVT record for the last two hours, with author‘s annotations is shown as Figure A.2.1 in Appendix 2.
Flow line monitor in PVT indication of flow at 20:18 hours with pump off not honored or effectively investigated (It was substantially off calibration but showed some flow at that juncture).52
Deepwater Horizon Study Group – Working Paper
Causative Technical and Operational Elements of the Deepwater Horizon Blowout
8
No effective response to indications of substantial drill pipe pressure with pumps off at 21:18 (3000 psi) and 21:30 hours (2500 psi)—with all spacer out of riser—seawater in both drill pipe and riser legs (BOP and diverter not closed until later).53
Reportedly did not close annular BOP and diverter until extreme events occurred.53 Here is a quote from the Transocean Senior Toolpusher:
“…according to that alarm clock, it was ten minutes till 10:00 [21:50]. And the person at the other end of the line there was the assistant driller, Steve Curtis. Steve opened up by saying “We have a situation.” He said “The well is blown out.” He said “We have mud going to the crown.” And I said “Well --” I was just horrified. I said “Do y'all have it shut in?” He said “Jason is shutting it in now.”
6. Possible Well Behavior Due to Plans, Actions, and Risks Taken
In summary, gas (Nitrogen or gassy oil) could have entered the annulus behind the production casing and migrated upward. The gas could have come from separation of the Nitrogen mixed into the cement slurry. Pressure in the closed annular space would rise and could have resulted in the loss-prone zone below the thick pay starting to take fluid. Alternately, as fluid was lost to the permeable pay zone from the high water loss cement slurry, pressure in the annular space could have dropped and hydrocarbons near the top of the thick pay zone might have commenced to flow. Also, a thin, probably water-bearing zone with higher pore fluid pressure than the thick pay zone could have commenced to flow water. With probable channels up and down the annulus due to poor mud displacement, the water could have flowed downward into the bottom of the thick pay or perhaps even into the loss-prone zone below (which had given severe lost circulation problems while drilling). The point here is that due to high water loss cement from which gaseous free Nitrogen could have evolved, and/or due to the presence of channels from poor mud displacement, active flow paths could have been formed from the topmost permeable zone to the loss-prone zone near the casings shoe. And that could have happened without any induced underbalance from an intentional negative test having yet been imposed.
Then, when the several underbalance tests were imposed, the hydrocarbons could have traversed
the short distance to the casing shoe and worked their way up the shoetrack filled with poor and unset cement, and through faulty (perhaps still un-released) flappers in the float collar into the casing bore.
The only alternative for a path into the casing bore when the underbalances were imposed is a
casing connection leak due to undetected mechanical damage to it while making it up on the rig floor during deployment. The casing plan called for the casing connections to be lubricated at the shore base and only the boxes wiped out during running54—hence shipping or stabbing damage to the metal to metal seal surfaces of the connection could have easily escaped notice.
Either way, the flow path into the casing could have been substantially restricted and thereby
limited the volume of invading hydrocarbons to the 5-20 barrels the records show may have come in during underbalance testing. Due to erosion and dilution of solid laden mud with cleaner
Deepwater Horizon Study Group – Working Paper
Causative Technical and Operational Elements of the Deepwater Horizon Blowout
9
hydrocarbons, the flow path could have become progressively more and more open as more and more fluid invaded during the much longer term operation to displace the mud out of the riser.
7. Possible Outcomes Due to Plans, Actions, and Risks Taken
In summary, gas could have entered the bore of the 9⅞ in x 7 in production casing string through the shoe and so-called ―shoetrack‖ (first few joints of 7 in casing up to the float collar) at TD and migrated upward as outlined above. If such gas were pulled in thusly due to poor cementing and float integrity during the first negative test, then extra volume to bleed down the test line would have resulted, as was observed but not properly interpreted. A very large 16 ppg water-based spacer pill, 354 barrels, was intended to be placed above the BOP stack, but wound up being placed across it instead.55 That was an additional confusing factor.
Also, complicating the interpretation was leakage from the riser through the closed annular BOP intended to hold out the pressure of the mud in the riser. No mention is made in testimony about where about 60 barrels of [leaked] mud required to refill the riser may have gone. Annular operating pressure was increased and the riser stayed full thereafter.
The arithmetic based on the numbers presented55 would show that about 511 ft of spacer was in the 9⅞ in x 5½ in drill pipe annulus after first placement. Even if all 60 barrels of leaked volume was added to that, the 16 ppg spacer would occupy only 1900 ft of that annular space, and would therefore only account for 735 psi of the 1400 psi observed on the drill pipe when the kill line was bled to zero with the annular BOP still sealing off the riser.
The likelihood of having pulled 5-10 bbl of lightweight hydrocarbon liquid (a mixture of methane and heavier hydrocarbons) into the casing bore during the various negative testing activities is adjudged pretty high. That much light hydrocarbon liquid mix would commence migrating through the approximate 10,000 ft of quiescent mud up to the circulation depth of 8367 ft KB. And like all methane everywhere, it would have expanded some as it migrated and probably its ascent would accelerate. The expanded gas would fill more annular vertical space and further reduce pressure, eventually leading to continuous flow from the productive zone.
A 10 bbl influx of gas in the 7 in casing bore near TD would occupy about 278 ft of vertical height. Its gradient at that position might be approximately 0.147 psi/ft 56 replacing mud with gradient of 0.728 psi/ft. Hence, the pressure at the bottom would be reduced by 160 psi notwithstanding that the hydrocarbon mix was probably spread out some and intimately mixed with the oil mud. By the time it migrated to the top of the 7 in casing, however, the gradient would have been about 0.136 psi/ft and height about 316 ft. Pressure reduction at TD would be 187 psi. Meanwhile, more and more 14 ppg mud was being replaced in the riser with seawater so the expansion of the gas would have accelerated markedly despite declining temperature and compressibility factors as it moved up.
Formation of gas hydrates from gas migrating into the displacement fluids might have been possible depending on the circulating temperature that prevailed. At the start of riser displacement, there was still a lot of 14 ppg mud and 16 ppg spacer in the riser, and the absolute pressure at 8367 ft (shoe of displacement string) would have been about 5400 psia plus some friction pressure from pumping. According to an available phase diagram57 if temperatures dropped below about 75 oF,
Deepwater Horizon Study Group – Working Paper
Causative Technical and Operational Elements of the Deepwater Horizon Blowout
10
hydrates could form with the seawater being used for the displacement, masking the actual volume of methane moving in the well until the entrained hydrates were moved up to a lower pressure portion of the riser and/or warmed up some. For example, if hydrates were moved up to a depth of about 2000 ft below the rig, pressures of only about 1500 psia would have prevailed and temperature would have had to be below about 60 oF to prevent regeneration of free gas. Harrell58 states that about 164 m3 of gas (at standard conditions) could reside in 1 m3 of hydrate or 164 ft3 of gas in ~1 ft3 of water. That means at a pump rate of greater than 20 bbl/minute (112 ft3/min) of water a large volume of methane could become hydrated with only 50 % saturation of the water, i.e., 164 x 0.5 x 112= 9184 ft3/min at standard temperature (0 oC). That is roughly equal to the entire volume inside the riser that could be regenerated in just one minute if indeed it ever had formed and then became free gas again as it neared the rig elevation. See Appendix 3 for a hydrate diagram and interpretation.
8. Alternative to Nitrogen Cement
There is no direct evidence to suggest that introducing Nitrogen to the cement mix to lighten it contributed to the blowout, but Jimmy Harrell made some comments in his testimony which indicated he felt it could introduce additional risk.59 Information about zero developed strength in 24 hours as previously cited48 is the only characteristic mentioned in the records and is not impressive at all. May it be suggested that this was not probably the best available and safest technology (BAST) for cementing in the deepest, highest pressure sections of the well. This author‘s calculations show that there is such a large contrast between the bottom hole pressures and the mixing and pumping pressures that the slurry so mixed to obtain a lighter mix at 12,000 psi plus bottom hole pressures results in a very light weight mix indeed at, say, 1000 psi mix-and-pump pressures. For example, about 3 ft3 of nitrogen at 1000 psi must be mixed with every 0.87 ft3 of base cement mix to obtain the desired properties at the bottom hole conditions. The resulting slurry would only weigh about 3.5 ppg at 1000 psi imposed pressure.
For mixing of shallow casing cement where light weight is desired, Halliburton offers slurries mixed with Spherelite, an additive comprised of micro-sized spherical balloons in which air is trapped.59 Descriptions thereof say it can be used up to 12,000 psi, but cautions that some degradation to properties can occur. Other sources say competent up to 6000 psi.60 Which pressure rating is right? We don‘t know.
We do know, however, that air filled glass beads competent up to 18,000 psi are available in quantity at reasonable cost from 3M under the trade name HSG18000.61 Ballpark cost FOB 3M‘s Alabama plant is $3/lb in bulk. Even if that cost is doubled in the process of transportation, profit, etc., the extra material cost for mixing 50 barrels of 14 ppg slurry would be in the order of $13,000. The Nitrogen, complete with Halliburton specialist to the rig to mix it, is likely in the same ballpark. But even if not, the advantages of an ―all-solids,‖ ―just add water,‖ ―no chance for segregation‖ mix for a critical job like Macondo production casing are worth a consideration of paying the full price of admission and working with a cementing service company to get it incorporated into the cement design for future wells of this nature. See Appendix 4 for further links to details about the cement job.
Deepwater Horizon Study Group – Working Paper
Causative Technical and Operational Elements of the Deepwater Horizon Blowout
11
9. Idiosyncrasies of Oil Muds
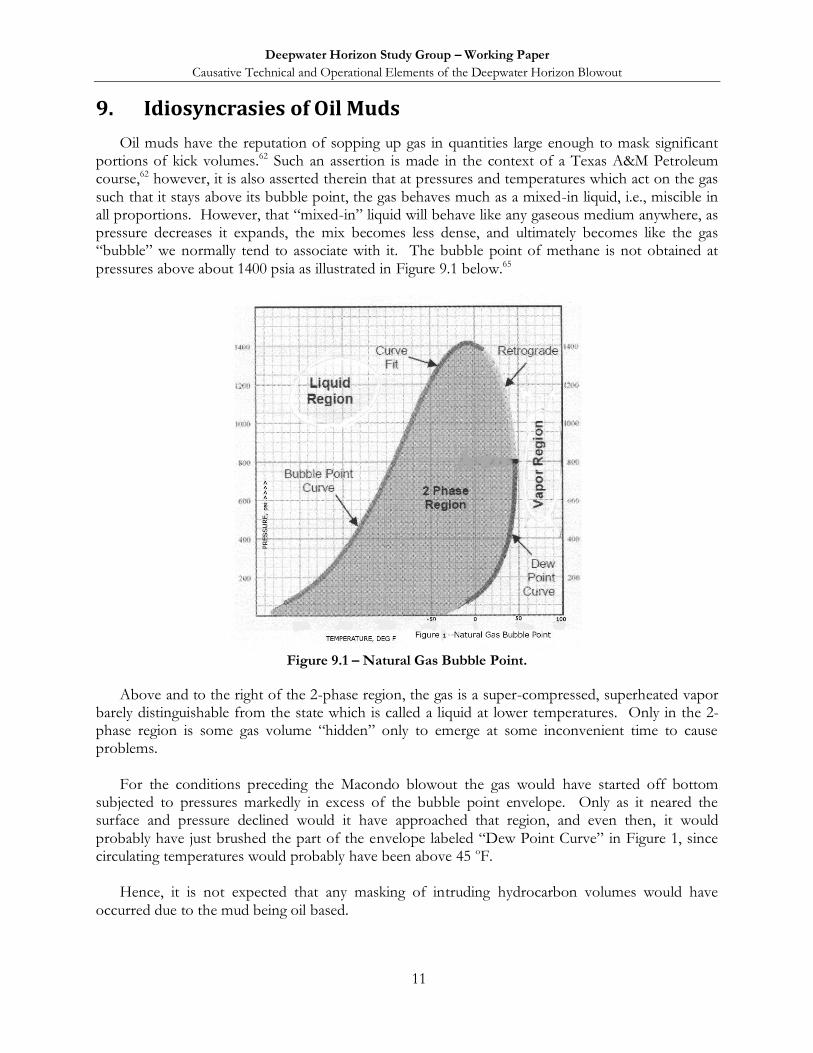
Oil muds have the reputation of sopping up gas in quantities large enough to mask significant portions of kick volumes.62 Such an assertion is made in the context of a Texas A&M Petroleum course,62 however, it is also asserted therein that at pressures and temperatures which act on the gas such that it stays above its bubble point, the gas behaves much as a mixed-in liquid, i.e., miscible in all proportions. However, that ―mixed-in‖ liquid will behave like any gaseous medium anywhere, as pressure decreases it expands, the mix becomes less dense, and ultimately becomes like the gas ―bubble‖ we normally tend to associate with it. The bubble point of methane is not obtained at pressures above about 1400 psia as illustrated in Figure 9.1 below.65
Figure 9.1 – Natural Gas Bubble Point.
Above and to the right of the 2-phase region, the gas is a super-compressed, superheated vapor barely distinguishable from the state which is called a liquid at lower temperatures. Only in the 2-phase region is some gas volume ―hidden‖ only to emerge at some inconvenient time to cause problems.
For the conditions preceding the Macondo blowout the gas would have started off bottom subjected to pressures markedly in excess of the bubble point envelope. Only as it neared the surface and pressure declined would it have approached that region, and even then, it would probably have just brushed the part of the envelope labeled ―Dew Point Curve‖ in Figure 1, since circulating temperatures would probably have been above 45 oF.
Hence, it is not expected that any masking of intruding hydrocarbon volumes would have occurred due to the mud being oil based.
Deepwater Horizon Study Group – Working Paper
Causative Technical and Operational Elements of the Deepwater Horizon Blowout
12
What is likely to have occurred is an overestimation of how much the oil mud would have expanded (and the casing would have relaxed) when attempting to bleed pressure off at the surface for the negative testing. It is in that realm that there was an apparent paucity of guidance in the planning and in the rig site engineering. These are physical effects that could have been quantified within rather narrow limits given detailed knowledge of the mud composition and of the casing program. Either such guidance was not given or it was not given sufficient credibility by those in charge to raise the safety flags when there were apparent discrepancies.
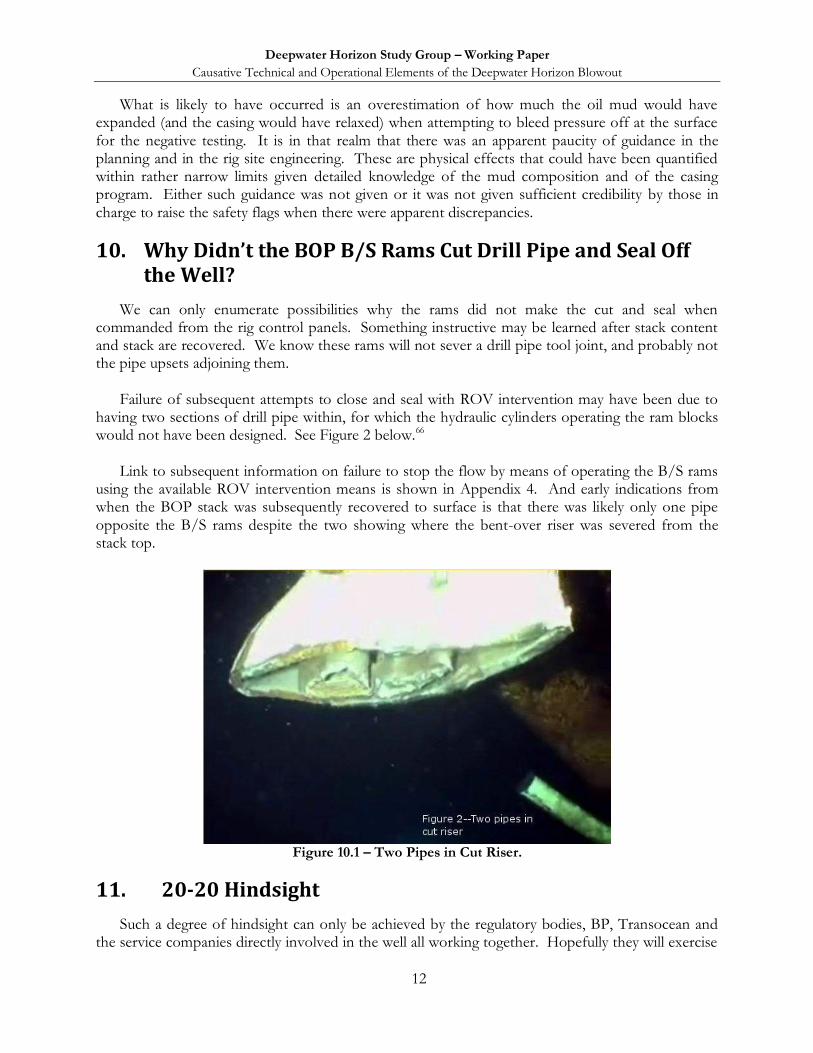
10. Why Didn’t the BOP B/S Rams Cut Drill Pipe and Seal Off the Well?
We can only enumerate possibilities why the rams did not make the cut and seal when commanded from the rig control panels. Something instructive may be learned after stack content and stack are recovered. We know these rams will not sever a drill pipe tool joint, and probably not the pipe upsets adjoining them.
Failure of subsequent attempts to close and seal with ROV intervention may have been due to
having two sections of drill pipe within, for which the hydraulic cylinders operating the ram blocks would not have been designed. See Figure 2 below.66
Link to subsequent information on failure to stop the flow by means of operating the B/S rams
using the available ROV intervention means is shown in Appendix 4. And early indications from when the BOP stack was subsequently recovered to surface is that there was likely only one pipe opposite the B/S rams despite the two showing where the bent-over riser was severed from the stack top.
Figure 10.1 – Two Pipes in Cut Riser.
11. 20-20 Hindsight
Such a degree of hindsight can only be achieved by the regulatory bodies, BP, Transocean and the service companies directly involved in the well all working together. Hopefully they will exercise
Deepwater Horizon Study Group – Working Paper
Causative Technical and Operational Elements of the Deepwater Horizon Blowout
13
20-20 hindsight to the fullest in defining improvements for future engineering and operations and will share insights with the industry. We ―outsiders‖ do not have the information to make the most thoroughgoing analyses and define all the better practices that should come from lessons learned. Still, some of the criticisms of how this well was planned, regulated, and drilled bear repeating, and some other recommendations can be made to reduce risk of another Macondo-type blowout:
a. More attention should have been paid to redundancy in barriers. Most notably, the presentation and remarks by Leimkuhler and Howell33 are most instructive in that regard. Whether a more optimum protective casing program could have been used is open to question. Every exploratory and even development well is different. The Macondo well was successfully drilled to total depth despite a number of complicating difficulties that were encountered. The protective tubulars were robust enough to do the job and seemed to have been adequately cemented except for the liner overlaps being left open. However, the production casing run as an all-in-one tapered string was clearly a higher risk venture than if it was to have been run as a liner and tieback. Very high quality tieback arrangements are available, including metal-to-metal sealing ones, so that future production completion plans would not have been compromised.
b. A more rigid and thorough monitoring of well control should have been used. No activity is more important than to maintain primary control with the drilling fluid and be ready, willing, and able to restore that if the well kicks. When prolific productive zones, especially those with abnormal pore pressure --the kind needed to pay off the tremendous investments in deep water drilling and development—are involved, this is, or should be, paramount in the mind of everyone involved, every hour of every day until the vessel is safely on its way to the next location. There is just no practical way to have more than the two barriers of the drilling fluid and the BOP system while drilling ahead, casing, and cementing. Volumetric and flow rate monitoring, and gas monitoring should be kept fine tuned. Crew response to abnormalities in the well should be exercised regularly and on a surprise basis. For example, just raise the pit level sensor to simulate a subtle kick and build in like capability to simulate flow and gas rate increases on electronic monitors.
c. There is no reason at all why the blow to surface out of the riser should have been a surprise. The flow discrepancies registered in the PVT during part of the displacement of the riser with seawater were clear enough, and with some verification from better pit level monitoring, the well could have been shut in at the subsea BOP. The gas already in the riser could have been diverted. A static kill on the well similar to that eventually used after the blowout or a pump and bleed kill could probably have been successfully executed afterward.
d. Exceptions to engineered and approved plans should be given exceptional treatment. That is not to say that 21 casing centralizers rather than 6 should absolutely have been run on the Macondo production casing string. Certainly there are some down sides to the devices in terms of circulating pressures and sometimes their integrity. But if the plan was to apply all 21, someone may have had a good reason to think that that was the best tradeoff between all aspects.
Deepwater Horizon Study Group – Working Paper
Causative Technical and Operational Elements of the Deepwater Horizon Blowout
14
Challenging, comparing thoughts, even demanding re-engineering and formal plan revision should all take place if deviations from the plans are to be considered.
e. Blowout Preventers (BOP‘s) and associated well control equipment-- riser, choke manifolds, gas separators, and so on, should be maintained to the highest standards. Pulling a subsea stack for needed maintenance is an excruciatingly expensive proposition, but there should be no hesitation to do it at the next safe opportunity vis-à-vis the wellbore unless the issue is adjudged very minor indeed. The BOP and associated gear for deep water operations comprise a very complicated system. Given the mobility of DP-type vessels, it is easy to envision that time to maintain and retest them between locations could easily be the critical path for the operation. Sufficient manpower for the maintenance and testing should be made available to insure thoroughness in the effort by well-rested crew. The Subsea Engineer or Supervisor is most times responsible not just for the stack itself, but for all the subsea equipment, riser, tensioners, etc, and the surface equipment to make them work. The miss-routing of a hose and the loose connection found on the DH stack63, 64 sounds like a typical outfall of hurry-up and/or crew fatigue and/or under-manning during the surface maintenance and testing before splashing the stack for the Macondo well operation. No less than three and preferably four trained crew should be available for testing—two to monitor actual stack operation in the moon pool, one to operate the control panel, and the Subsea Engineer to man the clipboard with all the checklists of things to be checked and the radio to communicate with the others.
f. Links to late coming information on weaknesses of the mud-gas separation system and its use aboard the Deepwater Horizon are shown in Appendix 4. Also, it has come to light that the 27-volt battery in the blue pod was found to have near zero voltage. That battery powers the solenoid valves which direct power fluid to operate the B/S rams if and when all communication through the MUX cables and the hydraulic conduit are lost.
g. Elastomeric stabbing guides should be used when deploying tubulars the
connectors of which depend on perfect metal-to-metal seals for pressure integrity in service. Also, the practice of pre-doping at the dock or pipe yard yields the potential for damage or contamination with grit in transit to be missed when deploying. As a minimum, the metal sealing surfaces for production tubulars should be cleaned, visually inspected, and then re-doped while deploying. Future testimony should be directed toward answering whether or not this was done on the Macondo production casing.
h. Results of cement slurry lab testing should be honored strictly before undertaking any testing of the cement job using pressure. Reliance on landed plugs and valves in the float equipment to hold the test pressure subverts the intent of the test and gives rise to risk of moving or channeling through unset cement if sufficient waiting on cement time is not allowed.
Deepwater Horizon Study Group – Working Paper
Causative Technical and Operational Elements of the Deepwater Horizon Blowout
15
12. References
1. Testimony by Miles Randall Ezell, Senior Toolpusher with Transocean to CG/MMS Board, May 28, 2010, 284.
2. Testimony of Micah Sandell, Transocean Crane Operator, to CG/MMS Board May 29, 2010, 9. 3. Testimony of Mr. Herber Morales. Transocean Roustabout to to CG/MMS Board May 29,
2010, 144. 4. Testimony of Jimmy Harrell, Transocean OIM to to CG/MMS Board May 27, 2010, 65. 5. Time Line from wikipedia,
http://en.wikipedia.org/wiki/Timeline_of_the_Deepwater_Horizon_oil_spill. 6. Picture of bent over riser at The Oil Drum site. Available at:
http://www.theoildrum.com/node/6547. 7. Commentary on ROV interventionfrom Wikipedia, Deepwater Horizon blowout
section,http://en.wikipedia.org/wiki/Blowout_preventer. 8. Neftgaz.ru, August 22nd, 2010. Available at: http://www.neftegaz.ru/en/news/view/94614. 9. Harry R. Weber and Ray Henry, , ―What Next? After Failure , BP Mulls Gusher Options.,‖
ABC News, May 9, 2010, http://abcnews.go.com/Business/wireStory?id=10595783. 10. Shaila Dewan, ―BP Reports Some Success in Capturing Leaking Oil,‖ New York Times, May
16, 2010, http://www.nytimes.com/2010/05/17/us/17spill.html. 11. Ben Geman, ―E2 Round-up: ‗Top Hat‘ in place over BP leak,‖ The Hill, August 21, 2010,
http://thehill.com/blogs/e2-wire/677-e2-wire/101383-e2-round-up-top-hat-in-place-over-bp-leak-but-effectiveness-unclear-questions-swirl-around-drilling-policy-and-epa-toughens-standards-for-a-major-air-pollutant.
12. Ihatethedukes, June 4, 2010, comment on bp.com news release (http://www.bp.com/genericarticle.do?categoryId=2012968&contentId=7062653) posted on Overclock.net, http://www.overclock.net/technology-science-news/747804-bp-lmrp-cap-place-riser-some.html.
13. CNNWire Staff, ―'Top kill' fails, BP moves on 'to next option‘,‖ CNN U.S., May 29, 2010, http://www.cnn.com/2010/US/05/29/us.gulf.oil.spill/index.html.
14. Joel Achenback and Mary Pat Flaherty, ―Sealing cap placed on oil well as Interior Dept. issues ban on offshore drilling,‖ Washington Post, July 13, 2010, http://www.washingtonpost.com/wp-dyn/content/article/2010/07/12/AR2010071202027.html.
15. ―BP: No New Oil Flowing into the Gulf,‖ CBS News, July 15, 2010, http://www.cbsnews.com/stories/2010/07/15/national/main6681825.shtml.
16. Associated Press, ―New Gulf oil well leaks are small; BP‘s cap will stay,‖ Cleveland.com, July 20, 2010, http://www.cleveland.com/nation/index.ssf/2010/07/new_gulf_oil_well_leaks_are_sm.html, (includes quotes from Cmdr. Allen).
17. Greg Bluestein and Harry R Weber, ―BP: Mud Pumped Into Well Is Holding Back the Oil,‖ ABC News, August 4, 2010, http://abcnews.go.com/Business/wireStory?id=11318381.
18. Greg Bluestein and Harry R. Weber, ―BP finishes pumping cement into well,‖ MSNBC News, August 5, 2010, http://www.msnbc.msn.com/id/38573593/ns/38641469.
19. ―Transcript Press briefing by National Incident Commander Admiral Thad Allen with Dr. Jane Lubchenco,‖ August 18, 2010, Par 6, http://www.restorethegulf.gov/release/2010/08/18/transcript-press-briefing-national-incident-commander-admiral-thad-allen-dr-jane-.
Deepwater Horizon Study Group – Working Paper
Causative Technical and Operational Elements of the Deepwater Horizon Blowout
16
20. By admin, ―U.S. Dept of Energy: MC252 Blowout Preventer and Well Schematic Diagrams,‖ June 21, 2010, http://ikonstantin.com/2010/06/mc252-bop-and-well-schematics/.
21. Testimony of Christopher Haire, Halliburton Service Supervisor, from transcript of The Joint United States Coast Guard Minerals Management Service Investigation, Saturday, May 28, 2010, 269-270.
22. Testimony of Charles Credeur with Dril Quip, from transcript of The Joint United States Coast Guard Minerals Management Service Investigation, Saturday, May 29, 2010, 59.
23. Testimony of Micah Burgess with Transocean [Driller] from transcript of The Joint United States Coast Guard Minerals Management Service Investigation, Saturday, May 29, 2010, 103.
24. Reference 4, op. cit.—Jimmy Harrell testimony, 33. 25. Reference 20, op.cit. 26. Last two hours of Halliburton PVT,
http://energycommerce.house.gov/index.php?option=com_content&view=article&id=1997:hearing-on-inquiry-into-the-deepwater-horizon-gulf-coast-oil-spill&catid=133:subcommittee-on-oversight-and-investigations&Itemid=73.
27. Testimony of Christopher Pleasant, Transocean Subsea Engineer to The Joint United States Coast Guard Minerals Management Service Investigation, Friday, May 28, 2010, 164.
28. ibid., 153. 29. Reference 20, op.cit. 30. Reference 20, op. cit. 31. Weatherford, ―Liner Hanger Selection,‖ Hydraulic Line Hangers – cutaway drawing of
hydraulic-set hanger (p11), Line Hangers – comment on ports for hydraulic-set hanger (p8), May 2006,http://www.weatherford.com/weatherford/groups/web/documents/weatherfordcorp/WFT036003.pdf.
32. Reference 22, op. cit., 66. 33. Andrew C. Revkin, ―BP, Shell and the Design of Deep Wells,‖ with video of J Leimkuhler &
John Howell presentation at the Aspen Ideas Festival, July 15, 2010, http://dotearth.blogs.nytimes.com/2010/07/15/bp-shell-and-the-design-of-deep-wells/.
34. Macando Production casing running, cementation, and testing plan, ―GoM Exploration Wells MC 252 #1ST00BP01 – Macondo Prospect 7‖ x 9⅞‖ Interval.‖ http://energycommerce.house.gov/documents/20100614/Macondo.Well.Casing.Production.Operations.pdf , 8.
35. Rep. Henry Waxman and Rep. Bart Stupak, ―Letter to Tony Hayward, Chief Executive Officer of BP (Rep. Henry Waxman and Rep. Bart Stupak),‖ The Hill, June 15, 2010, http://thehill.com/blogs/congress-blog/energy-a-environment/103255-letter-to-tony-hayward-chief-executive-officer-of-bp-rep-henry-waxman-and-rep-bart-stupak.
36. Testimony of Adrian Rose Transocean HSE Manager to CG/MMS Board, May 26, 2010, 484. 37. Reference 34, op. cit., 6. 38. ―Deepwater Horizon Incident – Internal Investigation, Investigation Update – Interim Report,‖
June 8, 2010, 10, http://energycommerce.house.gov/documents/20100614/Transocean.DWH.Internal.Investigation.Update.Interim.Report.June.8.2010.pdf.
39. Reference 34, op. cit., 8. 40. Reference 20, op. cit. 41. Reference 38, op. cit., 8, Reference 20, op. cit. 42. Testimony of Mark Hafle, BP Drilling Engineer, to The Joint United States Coast Guard
Minerals Management Service Investigation, Friday, May 28, 2010, 30.
Deepwater Horizon Study Group – Working Paper
Causative Technical and Operational Elements of the Deepwater Horizon Blowout
17
43. 3M™ Glass Bubbles iM30K, http://solutions.3m.com/wps/portal/3M/en_US/Energy-Advanced/Materials/Product_Info/Prod_Catalog-SMD/?PC_7_RJH9U5230GE3E02LECFTDQ4G06_nid=0192X3ZPGMbeWHB23F5LMRgl.
44. Reference 38, op. cit. 45. Comments in record of THE ROLE OF BP IN THE DEEPWATER HORIZON EXPLOSION
AND OIL SPILL THURSDAY, JUNE 17, 2010 House of Representatives, Subcommittee on Oversight and Investigations, Committee on Energy and Commerce, Washington, D.C., 70.
46. Reference 34, op. cit., 7, - Steps 7-12 are setting seal assembly and Reference 22, op. cit., 61, - Service rendered during early morning hours indicated.
47. Reference 22, op. cit., 69. 48. Reference 38, op cit., 6, 9. 49. BP, ―Washington Briefing – Deepwater Horizon Incident Investigation,‖ (Draft), May 24, 2010,
16-27, http://energycommerce.house.gov/documents/20100527/BP.Presentation.pdf. Note time frameworks listed.
50. Reference 26, op.cit. 51. Testimony of Gregory Luke Meche M-I Swaco Compliance Specialist from transcript of The
Joint United States Coast Guard Minerals Management Service Investigation, Friday, May 28, 2010, 209, 217.
52. Reference 49, op. cit., 28. 53. Reference 1, op. cit. 54. MC 252 #1 STOOBP01 - Macondo Prospect 7" x 9-7/8" Interval as submitted to
Congressional hearing records. 55. Reference 49, op. cit., 20. 56. Natural gas density calculator, http://www.petrospec-technologies.com/resource/rhogcalc.htm. 57. Stanford Exploration Project, ―METHANE HYDRATE STABILITY AND BREAKDOWN,‖
November 12, 1997, http://sepwww.stanford.edu/public/docs/sep92/christin1/paper_html/node2.html. Lecture Summary.
57. Methane clathrate, http://en.wikipedia.org/wiki/Methane_clathrate. 58. Testimony of Jimmy Harrell, Transocean OIM to CG/MMS Board, May 11, 2010, 72. 59. Halliburton, ―SphereliteR Cement Additive,‖
http://www.halliburton.com/ps/Default.aspx?navid=482&pageid=1312&prodid=PRN%3a%3aJ1A2JP8UU.
60. Spherelite definition, http://books.google.com/books?id=X5xUuWvYow8C&pg=PA67&lpg=PA67&dq=Spherelite&source=bl&ots=CQ0q6RtHOm&sig=VuruBXCt1xxvDO4nQq2maj3DtPk&hl=en&ei=hlNzTMyOEIK78gb49YnDAw&sa=X&oi=book_result&ct=result&resnum=1&ved=0CBEQ6AEwADgK#v=onepage&q=Spherelite&f=false.
61. Personal communication by phone, Gary Marsh to Rob Hunter with 3M, August-24, -2010. 62. ―PETE 625 Well Control, Lesson 4, Gas Solubility,‖
http://www.google.com/url?sa=t&source=web&cd=1&sqi=2&ved=0CBIQFjAA&url=http%3A%2F%2Fwww.pe.tamu.edu%2Fschubert%2Fpublic_html%2FPETE%2520625%2F4.%2520Gas%2520Solubility.ppt&rct=j&q=gas%20solubility%20in%20oil%20mud&ei=hzhfTNXHAsSqlAew8dC_CA&usg=AFQjCNGIZDGPWblq4tUsUqWwZf_jQ66LWg&cad=rja.
63. Congressman Stupac‘s statement to Inquiry into the Deepwater Horizon Gulf Coast Oil Spill, House of Representatives Subcommittee on Oversight and Investigations, Committee on Energy and Commerce, May 12, 2010, 16.
64. Reference 49, op. cit., 37.
Deepwater Horizon Study Group – Working Paper
Causative Technical and Operational Elements of the Deepwater Horizon Blowout
18
65. Spectra Sensors, ―Natural Gas – Phase Diagram Example,‖ http://www.sag-automation.com/PDF/Spectra/App Notes/Tech Note - Gas Phase.pdf, 1. Derived from document.
66. Jaquetta White, ―BP ‗fishing‘ for 3 pieces of drill pipe in blowout preventer in Gulf Oil Well,‖ August 23, 2010. http://www.nola.com/news/gulf-oil-spill/index.ssf/2010/08/bp_fishing_for_3_pieces_of_dri.html. Derived from article.
67. Reference 57, op. cit. Derived from Figure 1.
Appendix 1 – Particulars Of Macondo Production Casing
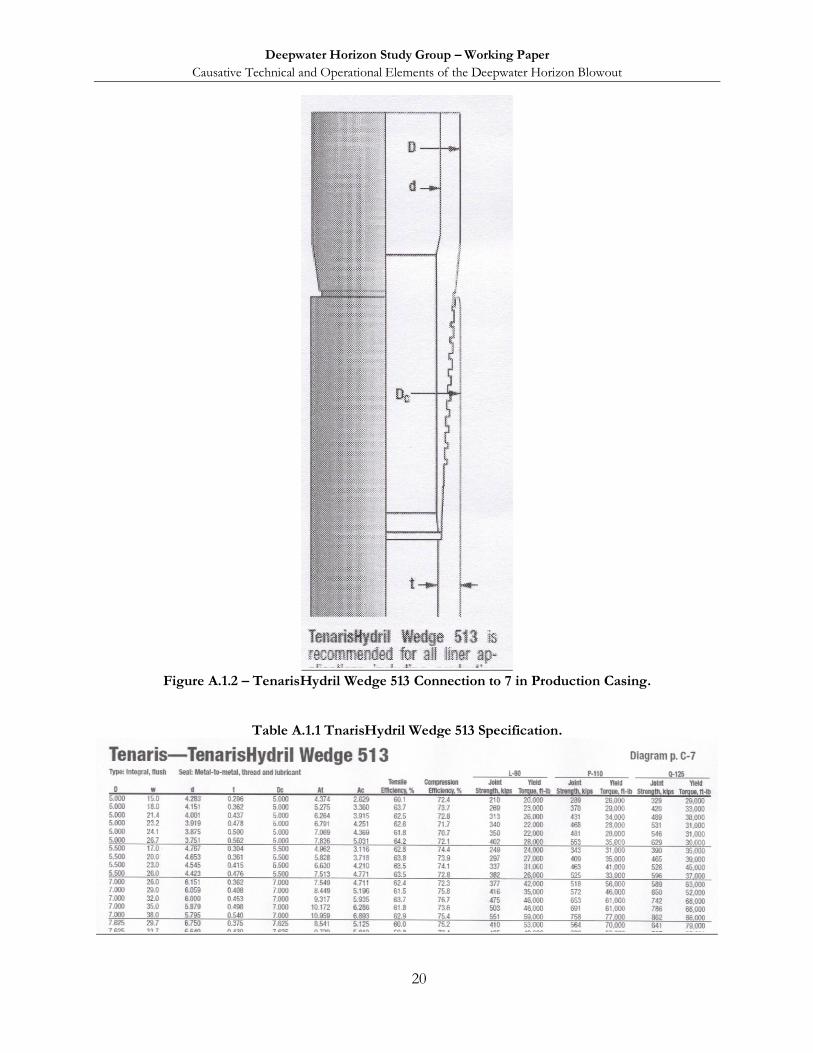
See next page for graphical summary of production casings run. These are from World Oil‘s
casing reference tables which provide information on premium casing connection dimensions, entitled ―CasingTables_2008.pdf.‖ Connection configuration can also be found at the Canaris web site (Use a search for ―500 Series.‖): http://www.tenaris.com/en/Products/PremiumConnections/TenarisHydrilRunningManual.aspx.
Casing collapse values were calculated using API equations in http://76.12.124.68/MCS/MathcadWorksheets/LoggedInNew/APIcollapseresistanceJIT.xmcd.
Equations were programmed into a worksheet since web site author‘s in-built does not include
the option of casing as large and heavy as the 9⅞ in 62.8# Q-125. The Well Schematic is shown in Figure A.1.1. Note that the rupture disks shown are miniature
Fike assemblies embedded into the walls or connections of the 16 in casing, not into the body of the 9⅞ in casing. No testimony has revealed what the rupture disk settings were.
Deepwater Horizon Study Group – Working Paper
Causative Technical and Operational Elements of the Deepwater Horizon Blowout
19
Figure A.1.1 – Well Schematic.
Deepwater Horizon Study Group – Working Paper
Causative Technical and Operational Elements of the Deepwater Horizon Blowout
20
Figure A.1.2 – TenarisHydril Wedge 513 Connection to 7 in Production Casing.
Table A.1.1 TnarisHydril Wedge 513 Specification.
Deepwater Horizon Study Group – Working Paper
Causative Technical and Operational Elements of the Deepwater Horizon Blowout
21
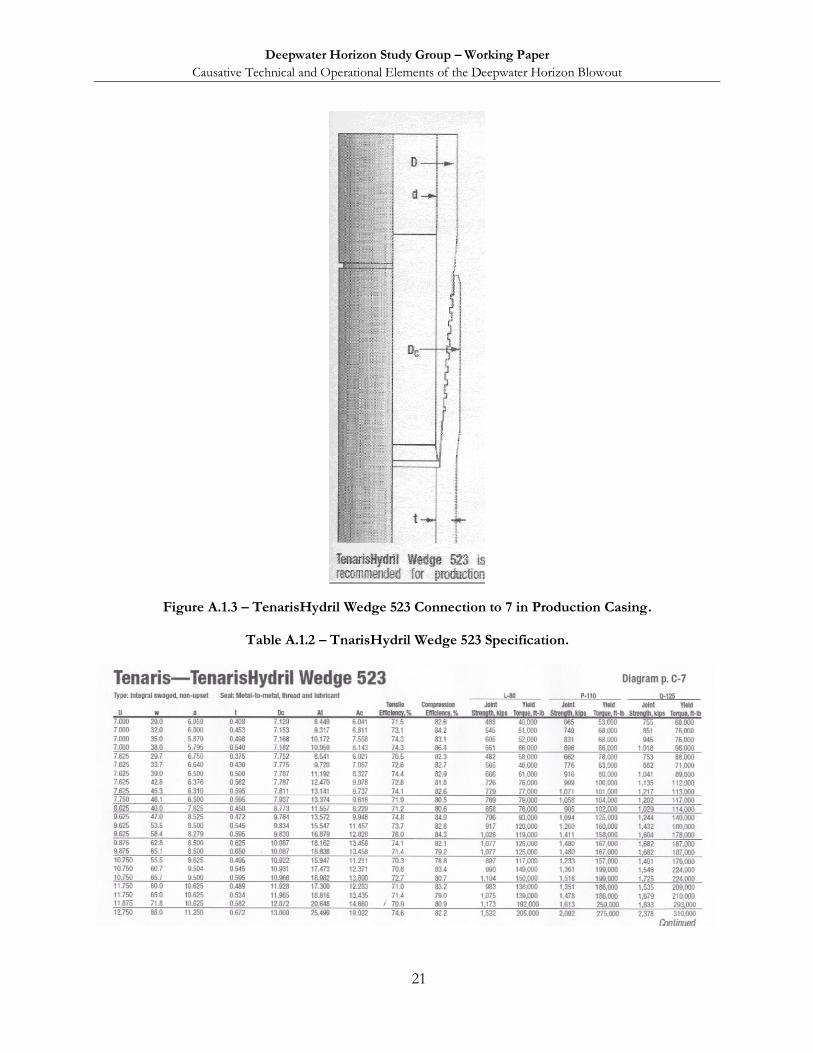
Figure A.1.3 – TenarisHydril Wedge 523 Connection to 7 in Production Casing.
Table A.1.2 – TnarisHydril Wedge 523 Specification.
Deepwater Horizon Study Group – Working Paper
Causative Technical and Operational Elements of the Deepwater Horizon Blowout
22
Appendix 2 – Record Of Halliburton/Sperry PVT Last Two Hours Before The Blowout
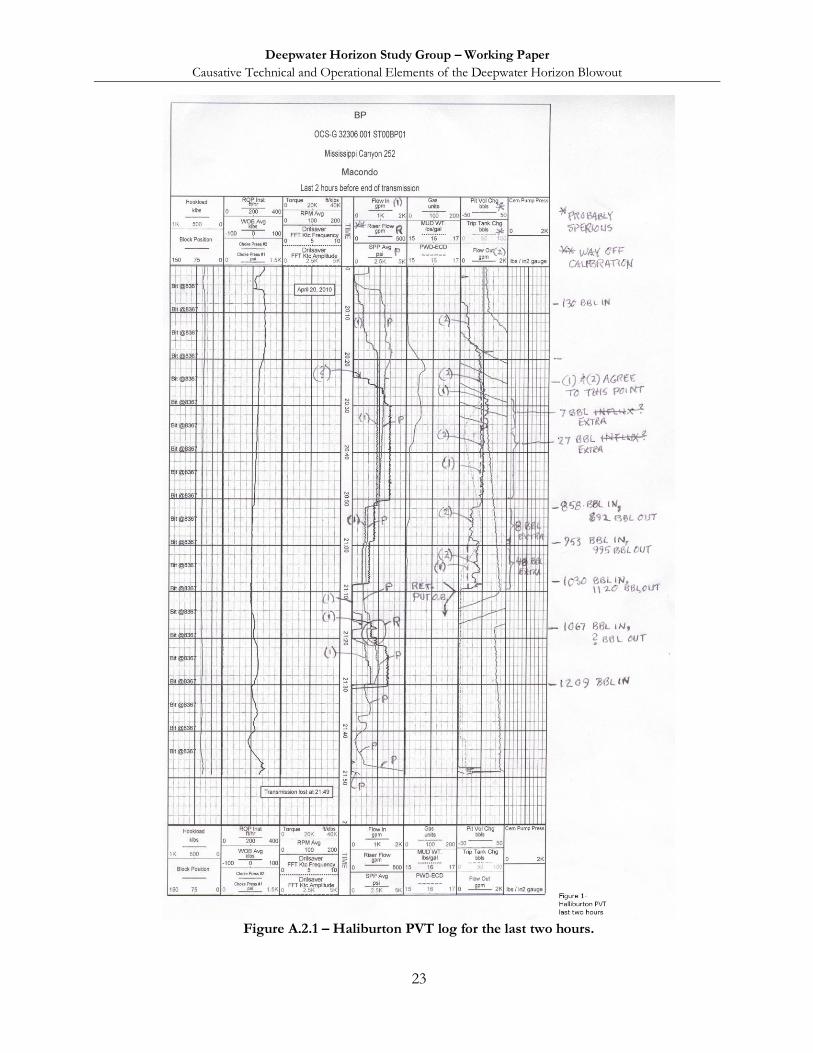
Annotations are by this author for Figure A.2.1. A rough hand integration of pump rate versus time indicated on the Halliburton-furnished PVT graphic, Figure 1 shows that about 1030 bbl of seawater was pumped over a period of 68 minutes, followed by a shut down period of about six minutes, probably for the sheen test conducted by M.I. Swaco on the first ―clean‖ returns of the spacer fluid that had been spotted for the negative testing. The drill pipe pressure increased from 1000 psi just after shutting the pumps down to 1200 or 1250 psi just before restarting. The sheen test was adjudged good and subsequent returns were pumped overboard. Pumping was resumed for about four minutes at about 400 gpm with pumping drill pipe pressure increasing from about 1700 psi to 1800 psi. The pumps were shut down for two minutes with drill pipe pressure showing about 1500 psi with the pump off. Pumping resumed at 21:20 hours at rates starting at 500 gpm and increasing slowly over 10 minutes to 700 gpm. Standpipe (drill pipe) pressure during this 10 minute period varied from 2450 psi to 2500 psi. The pumps were shut down at this point (21:30 hours), but the drill pipe pressure wobbled between 500 psi low at 21:42 to as high as 1800 psi for a period of about 17 minutes (to 21:47 hours). At this point drill pipe pressure climbed steadily to over 5000 psi in about two minutes. In the latter minute of the record, there was some indication that mud flowed or was blown past the location of the PVT ―Flow Out‖ metering which had not registered any flow from the time returns were routed overboard.
The sum and substance of the matter is this: Only about 1210 barrels of seawater were pumped
into the well and riser to displace the riser/drill pipe annulus volume approximating 1626 barrels. Just before the final blow, therefore, there may have been as much as 400 bbl volume of gas in the riser to drill pipe annulus! The roughly 100 bbl of excess returns calculated from the Halliburton PVT would more than account for 400 bbl of riser gas later in the game since the 100 bbl volume would have moved upward by migration and by pumping with consequent expansion after the returns were shunted overboard and the PVT outflow measurement device was apparently bypassed.
The riser outflow (flow line sensor as contrasted to the mud room PVT outflow sensor
discussed above) registered no flow at all until about 260 bbl had been pumped, then registered less than half of the pump rate from there on. The indication of this trace that there was zero flow with the pump shut down at various times is adjudged meaningless since it was under-reporting the flow with the pumps on so badly. However, note that at 21:18-21:20 with the pumps shut down, the under-reporting flow line indicator showed something in the order of 4 bbl/min of flow, whereas it had consistently shown zero flow with pumps off previously. Previous zero indications may have been spurious and 4 bbl/min indication may have been from a much stronger flow.
PVT indications of pit level showed about 500 bbl pit level gain from 20:10 to 20:34 with flow-
in/flow-out comparisons agreeing almost perfectly in the same time frame. It is concluded that the mud pit and piping system was just not set up for effective pit level monitoring at all and that this pit level gain is spurious.
Deepwater Horizon Study Group – Working Paper
Causative Technical and Operational Elements of the Deepwater Horizon Blowout
23
Figure A.2.1 – Haliburton PVT log for the last two hours.
Deepwater Horizon Study Group – Working Paper
Causative Technical and Operational Elements of the Deepwater Horizon Blowout
24
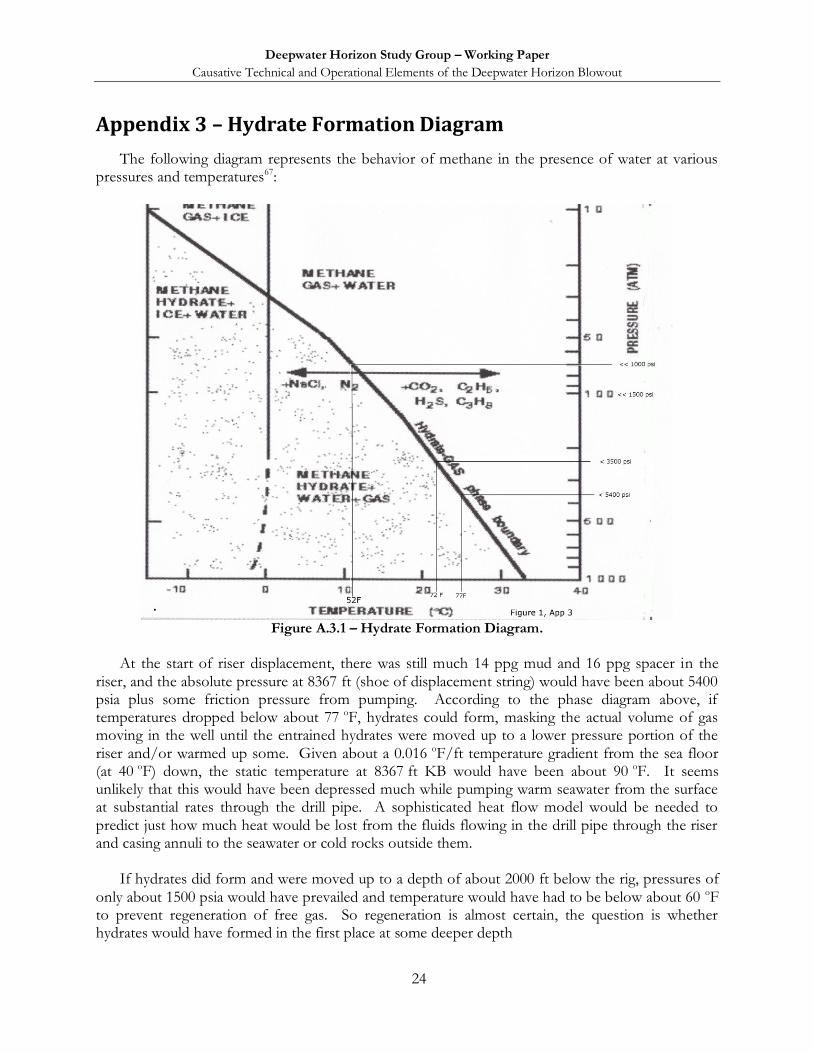
Appendix 3 – Hydrate Formation Diagram
The following diagram represents the behavior of methane in the presence of water at various pressures and temperatures67:
Figure A.3.1 – Hydrate Formation Diagram.
At the start of riser displacement, there was still much 14 ppg mud and 16 ppg spacer in the
riser, and the absolute pressure at 8367 ft (shoe of displacement string) would have been about 5400 psia plus some friction pressure from pumping. According to the phase diagram above, if temperatures dropped below about 77 oF, hydrates could form, masking the actual volume of gas moving in the well until the entrained hydrates were moved up to a lower pressure portion of the riser and/or warmed up some. Given about a 0.016 oF/ft temperature gradient from the sea floor (at 40 oF) down, the static temperature at 8367 ft KB would have been about 90 oF. It seems unlikely that this would have been depressed much while pumping warm seawater from the surface at substantial rates through the drill pipe. A sophisticated heat flow model would be needed to predict just how much heat would be lost from the fluids flowing in the drill pipe through the riser and casing annuli to the seawater or cold rocks outside them.
If hydrates did form and were moved up to a depth of about 2000 ft below the rig, pressures of
only about 1500 psia would have prevailed and temperature would have had to be below about 60 oF to prevent regeneration of free gas. So regeneration is almost certain, the question is whether hydrates would have formed in the first place at some deeper depth
Deepwater Horizon Study Group – Working Paper
Causative Technical and Operational Elements of the Deepwater Horizon Blowout
25
Appendix 4 – Late Coming Information
A white paper entitled “CEMENTING 7"x 9-7/8" Production Casing AT MC 252#1 WELL‖ by this author is available as an Annex to the Final DHSG report.
A white paper entitled “Why B/S RAMs may not Have Sealed on ROV Deadman Command‖ by this author is available as an Annex to the Final DHSG report.
Preliminary video photos taken inside the recovered BOP stack bore showed the sheared top of
a single section of drill pipe below the B/S rams after they were opened. The photos also showed extreme erosion at the margins of the B/S ram blocks extending into the BOP pressure containing body and into the ram blocks themselves. See the Video clip of BOP stack interior after recovery at: http://www.youtube.com/watch?v=LBCIIw3m39M&feature=channel.
A white paper entitled ―Final Fateful Flaws‖ by this author describes weaknesses in the mud-gas
separation facility and its use aboard the Deepwater Horizon. It is available as an Annex to the Final DHSG report.
Photos of the recovered 9⅞ in hanger seal assembly furnished as part of a preliminary Master
Report by the National Oil Spill Commission show substantial erosion of the inside of the seal assembly, but not on the outside. This rather conclusively shows that the blowout came up the bore of the casing, not up the annulus and past the hanger and seal.