Embed Size (px)
DESCRIPTION
Incident study.
Citation preview
Deepwater Horizon Study Group Working Paper – January 2011
1
The New Domain in Deepwater Drilling: Applied Engineering and Organizational Impacts on Uncertainties and Risk
David M. Pritchardi and Kenneth J. Kotowii
Successful Energy Practices International, LLC
Abstract The Macondo blowout highlights the need for well designs capable of consistently obtaining
commercial and technical well objectives while improving safety for personnel and the environment. But in order to identify a problem, it must be recognized that there is a problem.
This paper discusses key issues concerning setting and aligning safety objectives to achieve an acceptable balance among a plethora of risks and maintaining a healthy deep-water drilling industry. In particular we focus on how this impacts performance and, more importantly, safe well designs.
It is important to fully realize how well-drilling objectives and their associated uncertainties are linked to the safe drilling margin. At first blush, this issue may be viewed as a purely technical matter but it is primarily a human one, grounded in the forces that inspire to create false choices in risk and reward.
This paper illustrates how just one key uncertainty can lead to an unsafe well design, e.g., how the Rig Schedule plays into routinely ignoring warning signs and how risk-taking behavior can insidiously infect a risk-adverse goal. The symptoms of this infection of an otherwise healthy safety management system can lead to operator manipulation of both company design practices and also regulatory requirements under the assumption that any increase in risk or error in judgment is manageable by „last resort‟ safety systems. Inevitably, in this environment, „black swan‟ disasters will eventually occur.iii
©Successful Energy Practices International, LLC 2010
i David M. Pritchard, Owner, Successful Energy Practices International, LLC. Mr. Pritchard is a Registered Professional
Petroleum Engineer associated with the Petroleum industry since 1970. He has extensive experience managing, planning and supervising worldwide drilling and production operations.
ii Kenneth J. Kotow, Successful Energy Practices International, LLC. He has a B.Sc. in Mineral Engineering from the University of Alberta, with a specialization in Petroleum Engineering, and is a professional engineer with the Association of Professional Engineers, Geologists and Geophysicists of Alberta (APEGGA). Mr. Kotow is a SEPI associate.
iii “Black Swan Theory is a philosophical and mathematical theory founded by Nassim Nicholas Taleb. It describes randomness and uncertainty. The theory was described in Taleb's book The Black Swan: The Impact of the Highly Improbable. Its name originates in the assumption in Medieval Europe that black swans could not exist, when in fact, they are rare, but do exist.” From http://www.mahalo.com/black-swan-theory.
Deepwater Horizon Study Group – Working Paper
The New Domain in Deepwater Drilling: Applied Engineering and Organizational Impacts on Uncertainties and Risk
2
Table of Contents 1. Forward ........................................................................................................................................................ 3 2. Rig Schedule and the Macondo Prospect ............................................................................................... 4 3. The Rig Schedule and Compromised Designs – A Design Example............................................... 11 4. What Are the Solutions to the Rig Schedule Dilemma? ..................................................................... 13 5. What Are the Options for the Rig Schedule Dilemma? ..................................................................... 14 6. More On Casing Seat Depth Fundamentals ......................................................................................... 14 7. How Did Casing Seats Influence the Completion of the Macondo Well – A Story Not Heard . 16 8. Understanding Wellbore Instability – Well Listening and the Rig Team Interactive Factors ...... 23 9. Discussion of Key Hazards Leading to Wellbore Instability ............................................................. 24 10. Analyzing the Risk of Deepwater Drilling – The Metrics of Wellbore Instability ......................... 28 11. Conclusion ................................................................................................................................................. 31 12. Acronyms and Definitions ...................................................................................................................... 32 13. References .................................................................................................................................................. 36
Figures Figure 2.1 – The difference between long casing and liner: the 13⅝ in liner. ................................................... 5 Figure 2.2 – First mistake, fewer barriers to gas flow. ........................................................................................... 6 Figure 3.3 – Second mistake,, fewer centralizers to evenly distribute the cement. ........................................... 7 Figure 2.4 – Third mistake, a bond log was dismissed as being unnecessary. ................................................... 7 Figure 2.5 – Fourth mistake, the pressure test results were misinterpreted....................................................... 8 Figure 2.6 – Fifth mistake, the mud barrier to well pressure was removed early. ............................................ 9 Figure 2.7 – Sixth mistake, the blowout preventer failed to close the well. ..................................................... 10 Figure 3.1 – Acona WellPro Macondo mini seminar, August 2010. ................................................................. 11 Figure 3.2 – Type Dodson MRI 5 deepwater well. .............................................................................................. 12 Figure 6.1 – Typical deepwater riserless casing seat rationale. ........................................................................... 15 Figure 6.2 – Fundamentals of casing seat optimization. ..................................................................................... 15 Figure 7.1 – Acona WellPro Macondo mini seminar, August 2010. ................................................................. 16 Figure 7.2 – Hydrocarbon Zones and Potential Flow Paths. ............................................................................. 21 Figure 7.3 – BP knew they had a tight margin. ..................................................................................................... 22 Figure 9.1 – Downhole pressure during fluid feedback from formation. ........................................................ 27 Figure 10.1 – Graphic of total days of wellbore instability. ................................................................................ 29 Figure 10.2 – NPT for 263 wells drilled in less than 600 ft of water. ............................................................... 30 Figure 10.3 – NPT for 99 non-subsalt wells drilled in greater than 3000 ft of water. ................................... 30 Figure 10.4 – NPT for 65 wells subsalt wells drilled in greater than 3000 ft of water. .................................. 31
Tables Table 3.1 – Summary table for the Dodson deepwater Mechanical Risk Index ............................................. 12 Table 3.2 – A caption from a deepwater well program. ...................................................................................... 13 Table 7.1 – Deepwater well example. ..................................................................................................................... 17 Table 8.1 – Interpretive well listening: the human factors. ................................................................................ 23 Table 9.1 – Deepwater ballooning case history. ................................................................................................... 25 Table 10.1 – Days of wellbore instability as a percent of total time (exclusive of weather).......................... 29 Table 12.1 – Key drilling acronyms. ....................................................................................................................... 32 Table 12.2 – Key drilling definitions. ..................................................................................................................... 33
Deepwater Horizon Study Group – Working Paper
The New Domain in Deepwater Drilling: Applied Engineering and Organizational Impacts on Uncertainties and Risk
3
1. Forward
The Macondo blowout highlights the need for well designs capable of consistently obtaining commercial and technical well objectives while improving safety for personnel and the environment.
In order to identify a problem, it must be recognized that there is a problem. Examining deep
water operations in the Gulf of Mexico (GOM) indicate that there are unidentified and, consequently, reoccurring systemic risk management problems unique to complex deepwater well development that have not as yet been fully understood or effectively treated by some offshore operators.1 Fundamentally this stems from a deficient safety culture and a resulting dysfunctional safety management system.
Professor Andrew Hopkins2 has analyzed high-performing organizations and found that
organizational “mindfulness” is a key leading indicator of such problems, i.e., a mindset that exists in some organizations that support a culture of denial, as characterized by following:
A belief that it can't happen here. It usually will, especially when in denial.
A tendency to dismiss warning signs. Many deepwater well operators experience an frequent subsurface problems that have risk implications that are not fully analyzed or appreciated.
A tendency to normalize warning signs. At what point are abnormal operations considered routine and safe? Recognizing a conditioned behavioral response by the crew due to frequency of occurrence is a function of a successful safety management system.
Rather than proving that an activity is unsafe, there is a tendency to prove that an activity is safe (important distinction). The safety of the complex operations should not be assumed.
Group think. The tendency to ignore the dissenting voice and move towards the loudest or more popular choice without fully regard of the issue. How many times does this happen?
From an organizational perspective, drilling management equals risk management. As
J. C. Cunha has observed3:
“It is clear to me that drilling management is related closely to risk management”… and… “The
correct assessment of all risks involved in drilling operations will provide better planning and will consequentially improve operational results.” Furthermore, “A proficient drilling–management process is now more important than ever. This process must permeate all phases of a project, from early planning to final execution. Risk assessment of all operations must become a routine.”
Indeed, risk assessment of all operations must become routine; however, it must also be
performed in a mindful-manner – NOT as a matter of routine or with a “compliance-mentality.” Drilling performance and safety is a multidisciplinary responsibility. Managing risks begins with well planning and clearly stated objectives agreed to by all stakeholders and by setting forth clear lines of responsibility and accountability in the decision-making process.4
Deepwater Horizon Study Group – Working Paper
The New Domain in Deepwater Drilling: Applied Engineering and Organizational Impacts on Uncertainties and Risk
4
This paper discusses key issues concerning setting and aligning objectives, and how this impacts performance and, more importantly, safe well designs. It is important to fully realize how well-drilling objectives and their associated uncertainties are linked to the safe drilling margin. At first blush, this issue may be viewed as a purely technical matter. However, that would be a mistake -- it is not and this paper illustrates how just one key uncertainty can lead to an unsafe well design, e.g., How the Rig Schedule plays into routinely ignoring warning signs and how risk-taking behavior can insidiously infect a risk-adverse goal. The symptoms of this infection of an otherwise healthy safety management system can lead to operator manipulation of both company design practices and also regulatory requirements and complacency. Schedule driven decisions create a dynamic characterized by a tendency to overlook or possibly ignore essential design requirements to ensure a safe drilling margin and properly manage uncertainties and ancillary risks. Like a virulent virus, as the contagion spreads, it can and has escalated into an unhealthy co-dependent relationship between operators and regulators, contaminating the intended system of checks and balances in favor of doing it cheaper and faster.
2. Rig Schedule and the Macondo Prospect
The record shows that BP Macondo well rig schedule and budget over-runs influenced the
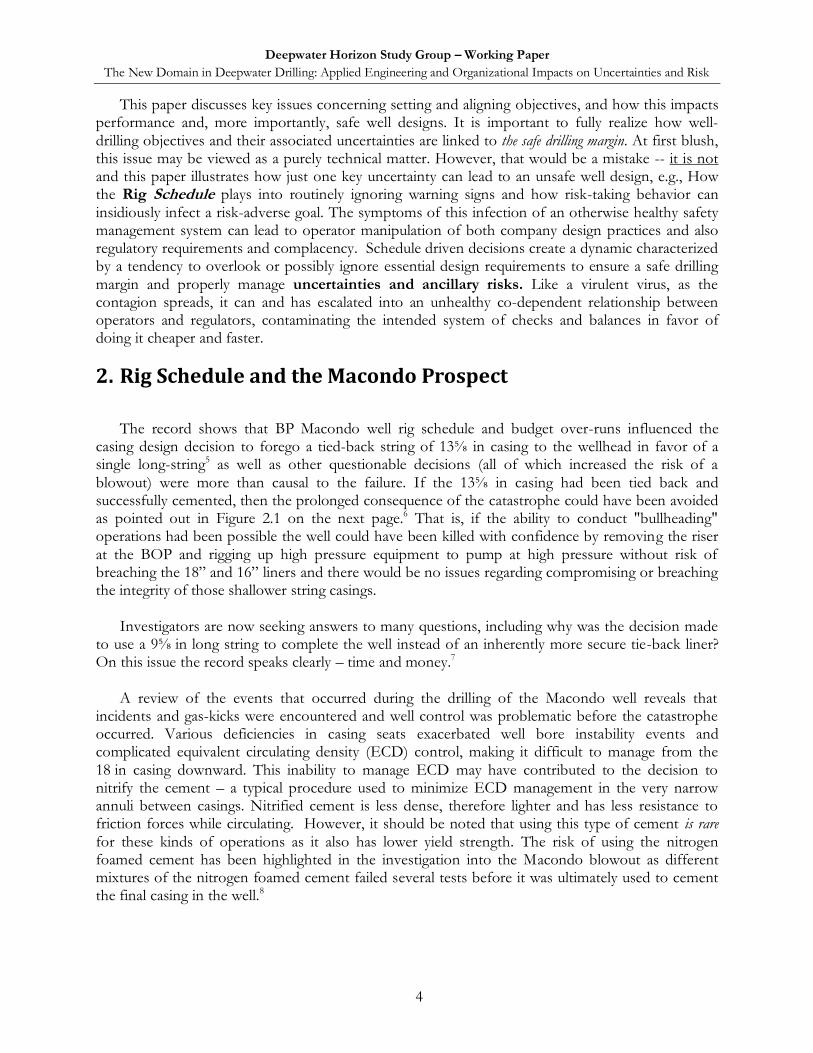
casing design decision to forego a tied-back string of 13⅝ in casing to the wellhead in favor of a single long-string5 as well as other questionable decisions (all of which increased the risk of a blowout) were more than causal to the failure. If the 13⅝ in casing had been tied back and successfully cemented, then the prolonged consequence of the catastrophe could have been avoided as pointed out in Figure 2.1 on the next page.6 That is, if the ability to conduct "bullheading" operations had been possible the well could have been killed with confidence by removing the riser at the BOP and rigging up high pressure equipment to pump at high pressure without risk of breaching the 18” and 16” liners and there would be no issues regarding compromising or breaching the integrity of those shallower string casings.
Investigators are now seeking answers to many questions, including why was the decision made
to use a 9⅝ in long string to complete the well instead of an inherently more secure tie-back liner? On this issue the record speaks clearly – time and money.7
A review of the events that occurred during the drilling of the Macondo well reveals that
incidents and gas-kicks were encountered and well control was problematic before the catastrophe occurred. Various deficiencies in casing seats exacerbated well bore instability events and complicated equivalent circulating density (ECD) control, making it difficult to manage from the 18 in casing downward. This inability to manage ECD may have contributed to the decision to nitrify the cement – a typical procedure used to minimize ECD management in the very narrow annuli between casings. Nitrified cement is less dense, therefore lighter and has less resistance to friction forces while circulating. However, it should be noted that using this type of cement is rare for these kinds of operations as it also has lower yield strength. The risk of using the nitrogen foamed cement has been highlighted in the investigation into the Macondo blowout as different mixtures of the nitrogen foamed cement failed several tests before it was ultimately used to cement the final casing in the well.8
Deepwater Horizon Study Group – Working Paper
The New Domain in Deepwater Drilling: Applied Engineering and Organizational Impacts on Uncertainties and Risk
5
Figure 2.1 – The difference between long casing and liner: the 13⅝ in liner.iv
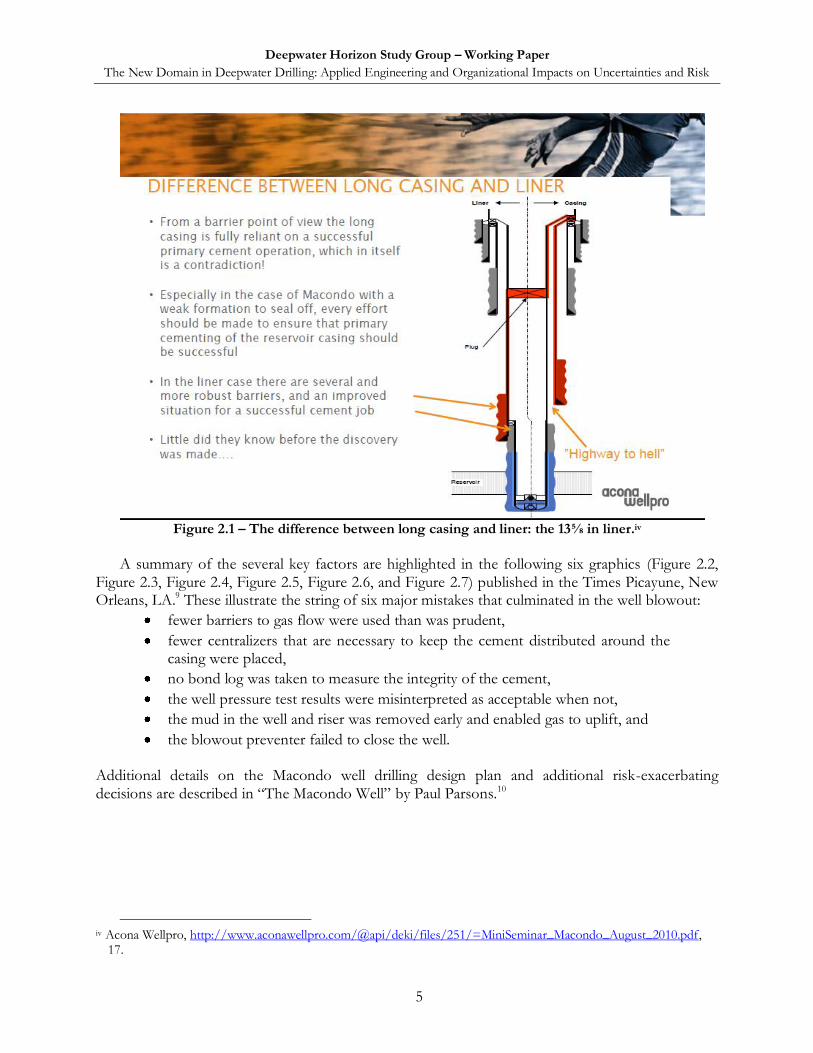
A summary of the several key factors are highlighted in the following six graphics (Figure 2.2,
Figure 2.3, Figure 2.4, Figure 2.5, Figure 2.6, and Figure 2.7) published in the Times Picayune, New Orleans, LA.9 These illustrate the string of six major mistakes that culminated in the well blowout:
fewer barriers to gas flow were used than was prudent,
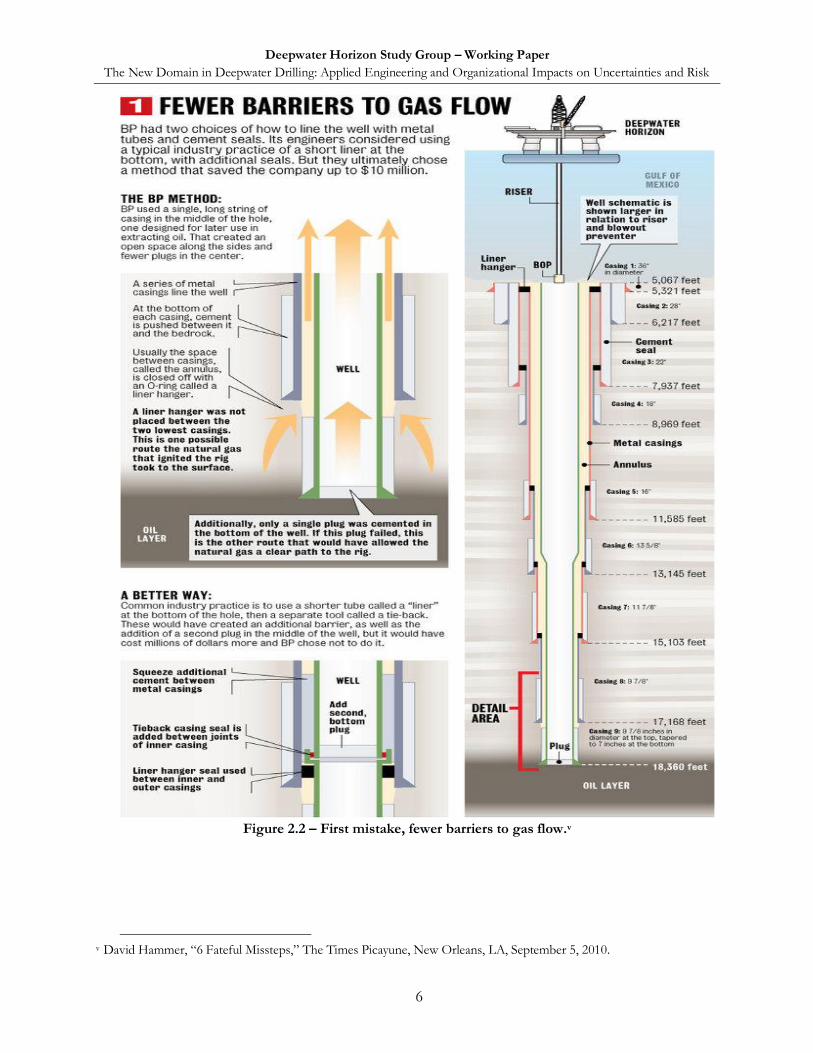
fewer centralizers that are necessary to keep the cement distributed around the casing were placed,
no bond log was taken to measure the integrity of the cement,
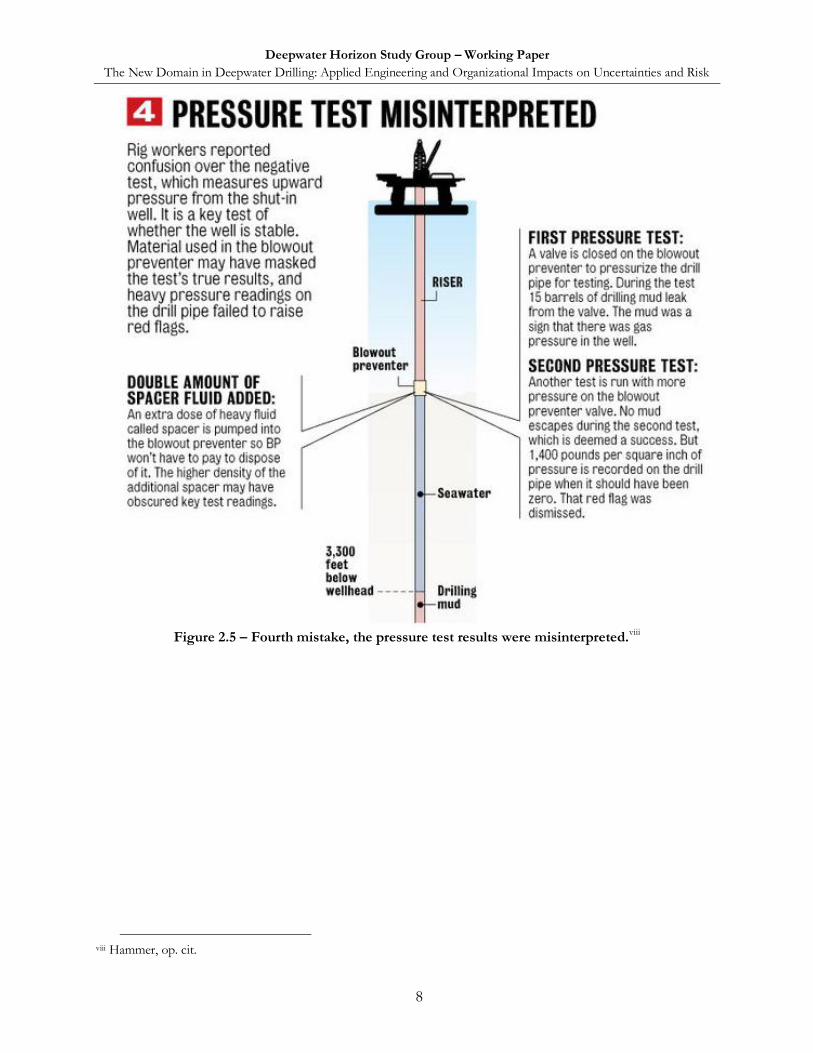
the well pressure test results were misinterpreted as acceptable when not,
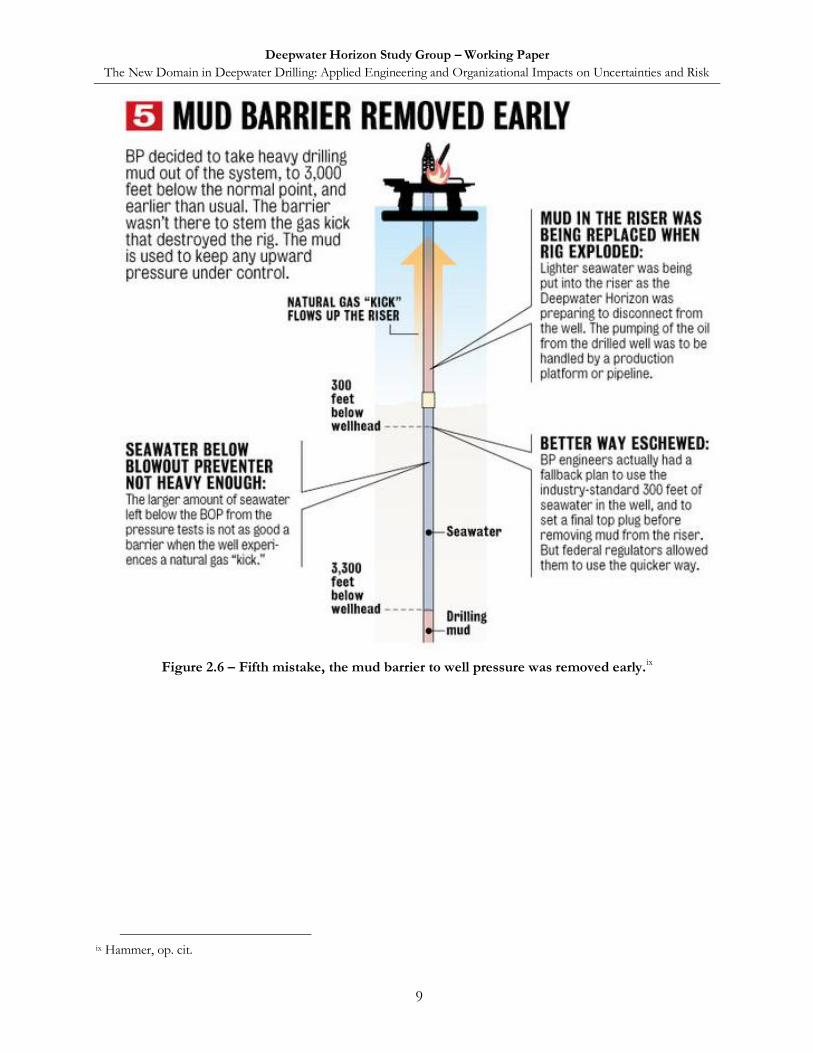
the mud in the well and riser was removed early and enabled gas to uplift, and
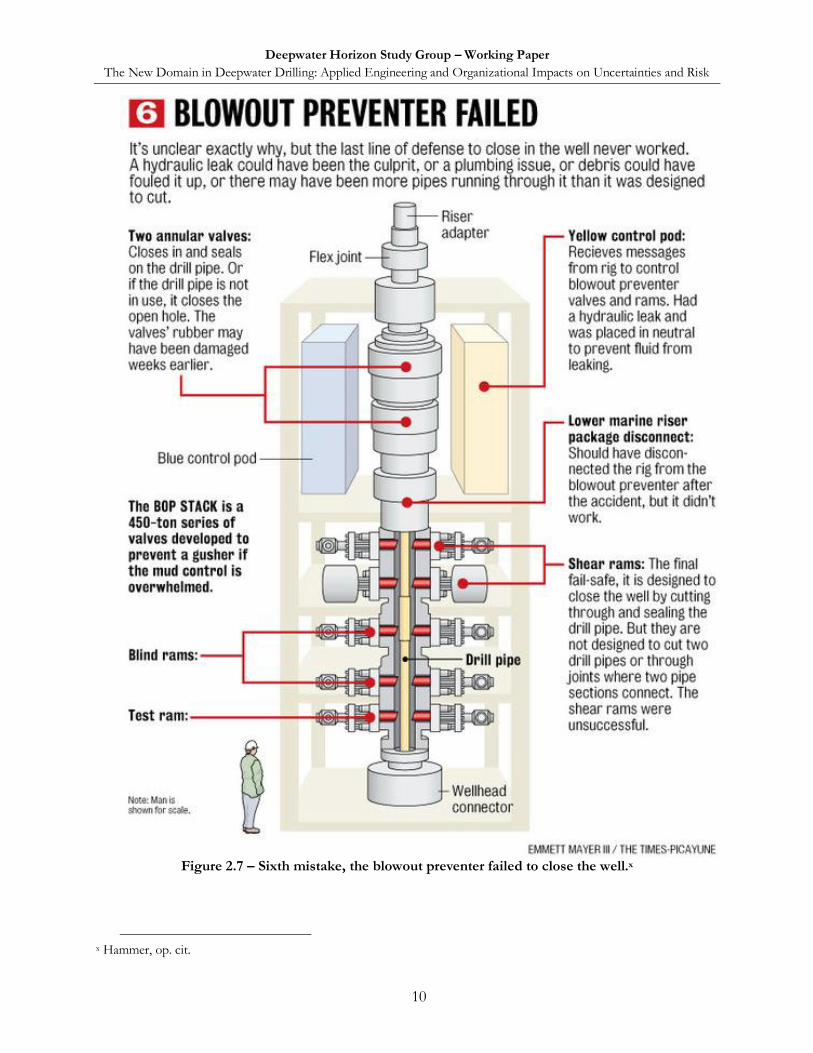
the blowout preventer failed to close the well. Additional details on the Macondo well drilling design plan and additional risk-exacerbating decisions are described in “The Macondo Well” by Paul Parsons.10
iv Acona Wellpro, http://www.aconawellpro.com/@api/deki/files/251/=MiniSeminar_Macondo_August_2010.pdf,
17.
Deepwater Horizon Study Group – Working Paper
The New Domain in Deepwater Drilling: Applied Engineering and Organizational Impacts on Uncertainties and Risk
6
Figure 2.2 – First mistake, fewer barriers to gas flow.v
v David Hammer, “6 Fateful Missteps,” The Times Picayune, New Orleans, LA, September 5, 2010.
Deepwater Horizon Study Group – Working Paper
The New Domain in Deepwater Drilling: Applied Engineering and Organizational Impacts on Uncertainties and Risk
7
Figure 3.3 – Second mistake,, fewer centralizers to evenly distribute the cement.vi
Figure 2.4 – Third mistake, a bond log was dismissed as being unnecessary.vii
vi Hammer, op. cit. vii Hammer, op. cit.
Deepwater Horizon Study Group – Working Paper
The New Domain in Deepwater Drilling: Applied Engineering and Organizational Impacts on Uncertainties and Risk
8
Figure 2.5 – Fourth mistake, the pressure test results were misinterpreted.viii
viii Hammer, op. cit.
Deepwater Horizon Study Group – Working Paper
The New Domain in Deepwater Drilling: Applied Engineering and Organizational Impacts on Uncertainties and Risk
9
Figure 2.6 – Fifth mistake, the mud barrier to well pressure was removed early.ix
ix Hammer, op. cit.
Deepwater Horizon Study Group – Working Paper
The New Domain in Deepwater Drilling: Applied Engineering and Organizational Impacts on Uncertainties and Risk
10
Figure 2.7 – Sixth mistake, the blowout preventer failed to close the well.x
x Hammer, op. cit.
Deepwater Horizon Study Group – Working Paper
The New Domain in Deepwater Drilling: Applied Engineering and Organizational Impacts on Uncertainties and Risk
11
3. The Rig Schedule and Compromised Designs – A Design Example
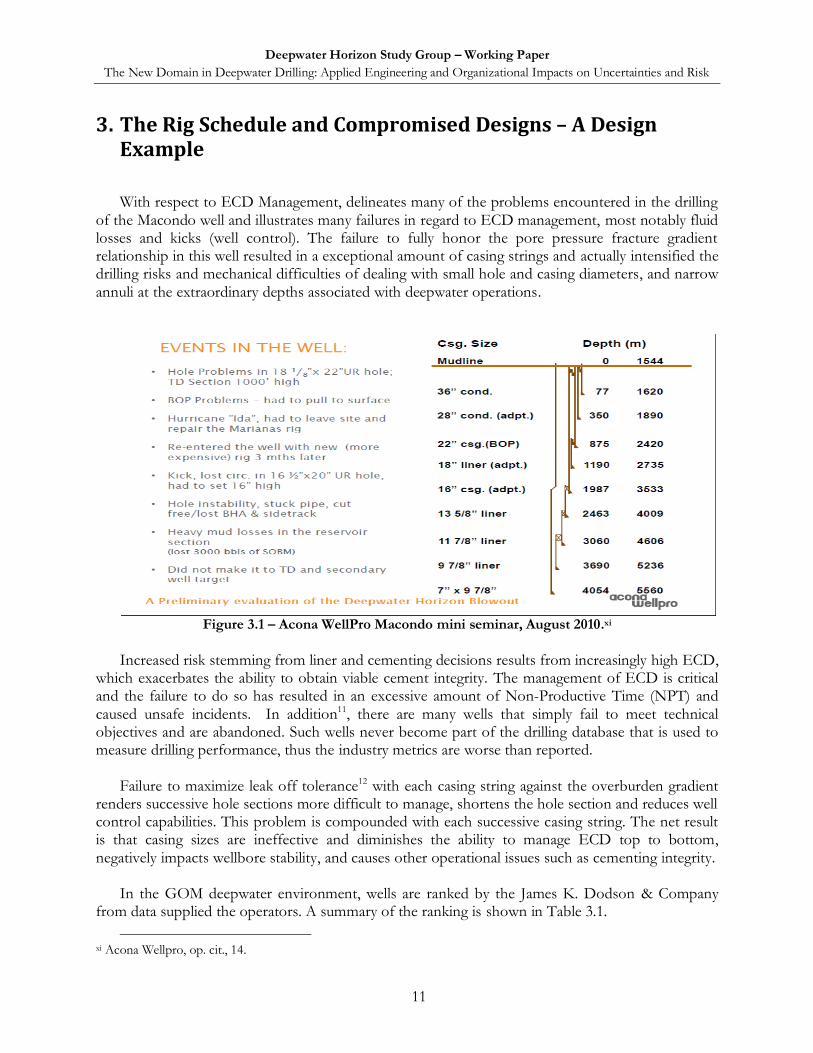
With respect to ECD Management, delineates many of the problems encountered in the drilling
of the Macondo well and illustrates many failures in regard to ECD management, most notably fluid losses and kicks (well control). The failure to fully honor the pore pressure fracture gradient relationship in this well resulted in a exceptional amount of casing strings and actually intensified the drilling risks and mechanical difficulties of dealing with small hole and casing diameters, and narrow annuli at the extraordinary depths associated with deepwater operations.
Figure 3.1 – Acona WellPro Macondo mini seminar, August 2010.xi
Increased risk stemming from liner and cementing decisions results from increasingly high ECD,
which exacerbates the ability to obtain viable cement integrity. The management of ECD is critical and the failure to do so has resulted in an excessive amount of Non-Productive Time (NPT) and caused unsafe incidents. In addition11, there are many wells that simply fail to meet technical objectives and are abandoned. Such wells never become part of the drilling database that is used to measure drilling performance, thus the industry metrics are worse than reported.
Failure to maximize leak off tolerance12 with each casing string against the overburden gradient
renders successive hole sections more difficult to manage, shortens the hole section and reduces well control capabilities. This problem is compounded with each successive casing string. The net result is that casing sizes are ineffective and diminishes the ability to manage ECD top to bottom, negatively impacts wellbore stability, and causes other operational issues such as cementing integrity.
In the GOM deepwater environment, wells are ranked by the James K. Dodson & Company
from data supplied the operators. A summary of the ranking is shown in Table 3.1.
xi Acona Wellpro, op. cit., 14.
Deepwater Horizon Study Group – Working Paper
The New Domain in Deepwater Drilling: Applied Engineering and Organizational Impacts on Uncertainties and Risk
12
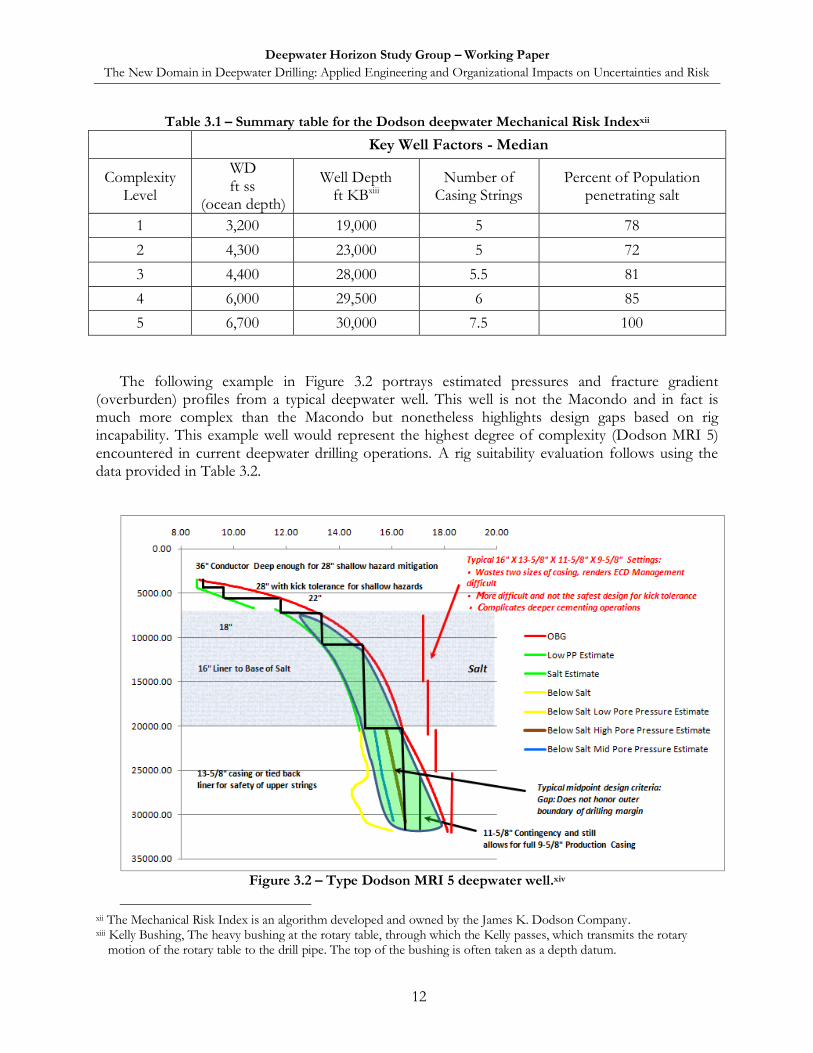
Table 3.1 – Summary table for the Dodson deepwater Mechanical Risk Indexxii
Key Well Factors - Median
Complexity Level
WD ft ss
(ocean depth)
Well Depth ft KBxiii
Number of Casing Strings
Percent of Population penetrating salt
1 3,200 19,000 5 78
2 4,300 23,000 5 72
3 4,400 28,000 5.5 81
4 6,000 29,500 6 85
5 6,700 30,000 7.5 100
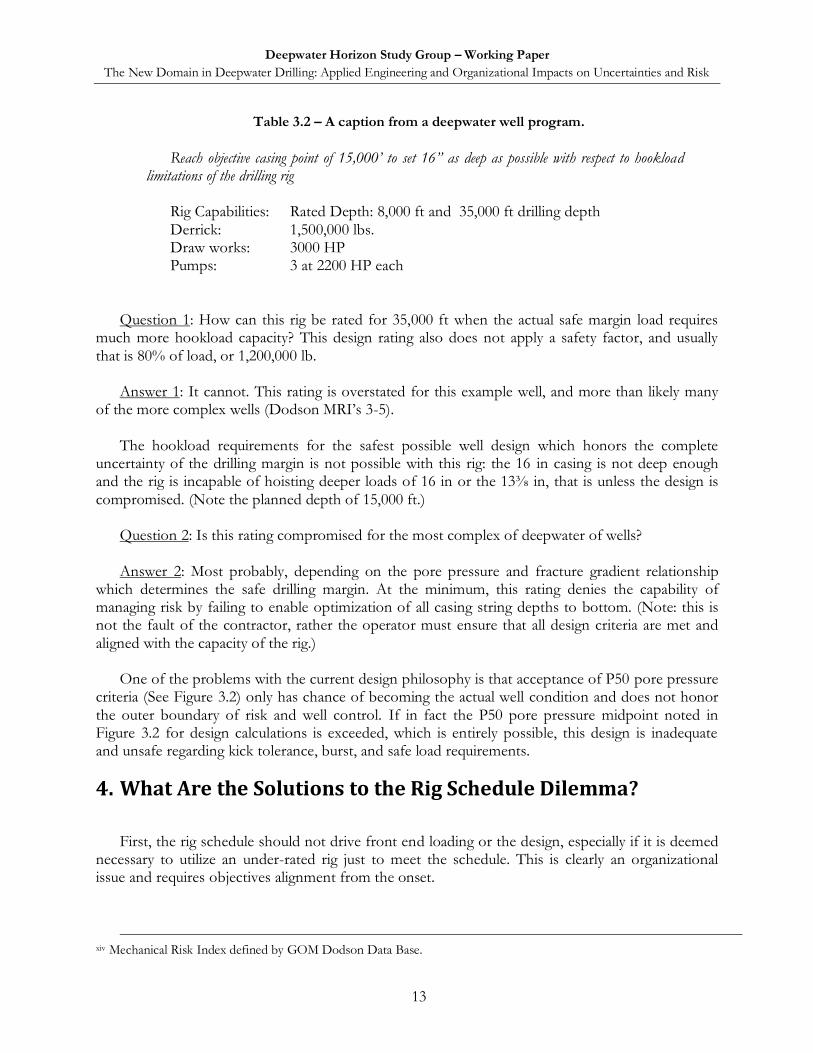
The following example in Figure 3.2 portrays estimated pressures and fracture gradient
(overburden) profiles from a typical deepwater well. This well is not the Macondo and in fact is much more complex than the Macondo but nonetheless highlights design gaps based on rig incapability. This example well would represent the highest degree of complexity (Dodson MRI 5) encountered in current deepwater drilling operations. A rig suitability evaluation follows using the data provided in Table 3.2.
Figure 3.2 – Type Dodson MRI 5 deepwater well.xiv
xii The Mechanical Risk Index is an algorithm developed and owned by the James K. Dodson Company. xiii Kelly Bushing, The heavy bushing at the rotary table, through which the Kelly passes, which transmits the rotary
motion of the rotary table to the drill pipe. The top of the bushing is often taken as a depth datum.
Deepwater Horizon Study Group – Working Paper
The New Domain in Deepwater Drilling: Applied Engineering and Organizational Impacts on Uncertainties and Risk
13
Table 3.2 – A caption from a deepwater well program.
Reach objective casing point of 15,000’ to set 16” as deep as possible with respect to hookload limitations of the drilling rig
Rig Capabilities: Rated Depth: 8,000 ft and 35,000 ft drilling depth Derrick: 1,500,000 lbs. Draw works: 3000 HP Pumps: 3 at 2200 HP each
Question 1: How can this rig be rated for 35,000 ft when the actual safe margin load requires
much more hookload capacity? This design rating also does not apply a safety factor, and usually that is 80% of load, or 1,200,000 lb.
Answer 1: It cannot. This rating is overstated for this example well, and more than likely many
of the more complex wells (Dodson MRI‟s 3-5). The hookload requirements for the safest possible well design which honors the complete
uncertainty of the drilling margin is not possible with this rig: the 16 in casing is not deep enough and the rig is incapable of hoisting deeper loads of 16 in or the 13⅜ in, that is unless the design is compromised. (Note the planned depth of 15,000 ft.)
Question 2: Is this rating compromised for the most complex of deepwater of wells? Answer 2: Most probably, depending on the pore pressure and fracture gradient relationship
which determines the safe drilling margin. At the minimum, this rating denies the capability of managing risk by failing to enable optimization of all casing string depths to bottom. (Note: this is not the fault of the contractor, rather the operator must ensure that all design criteria are met and aligned with the capacity of the rig.)
One of the problems with the current design philosophy is that acceptance of P50 pore pressure
criteria (See Figure 3.2) only has chance of becoming the actual well condition and does not honor the outer boundary of risk and well control. If in fact the P50 pore pressure midpoint noted in Figure 3.2 for design calculations is exceeded, which is entirely possible, this design is inadequate and unsafe regarding kick tolerance, burst, and safe load requirements.
4. What Are the Solutions to the Rig Schedule Dilemma?
First, the rig schedule should not drive front end loading or the design, especially if it is deemed
necessary to utilize an under-rated rig just to meet the schedule. This is clearly an organizational issue and requires objectives alignment from the onset.
xiv Mechanical Risk Index defined by GOM Dodson Data Base.
Deepwater Horizon Study Group – Working Paper
The New Domain in Deepwater Drilling: Applied Engineering and Organizational Impacts on Uncertainties and Risk
14
Second, the design itself (See Figure 3.2) must recognize the outer boundary of drilling margin uncertainty, which at its worst case scenario is equivalent to the overburden gradient itself. This can be either in pore pressure prediction or stress, which acts like pore pressure in that it requires mud weight to counter. Stress can be no greater than overburden itself. Recognizing the maximum outer boundary of the drilling margin relationship honors the greatest risk possible and that is where risk management begins.
Third, casing seats design must not be compromised in: 1) seat designs which honor the
maximum uncertainties and 2) casing string weights or grades, again just to accommodate an underrated rig.
Fourth, the Bureau of Ocean Energy Management, Regulation and Enforcement (BOEMRE)
could consider modifying lease expiration criteria to accommodate operator‟s sincere efforts to meet the terms of leases.
5. What Are the Options for the Rig Schedule Dilemma?
If the rig schedule cannot be met for the safe and necessary design, then the well should be moved off the schedule
without compromise. Failure to do so violates the essence of risk management. Another solution that might be considered is to batch-set all casing strings down to salt with rigs
of lesser capacity and completing the drilling operation by later moving in a large capacity rig as available.
In fact, this option could have an industry advantage as over time as it would optimize the
available fleet, especially since development drilling will become more common place. Rigs of lesser capacity can be used for shallower batch setting and the more capable rigs used for the deeper and more complex environments.
6. More On Casing Seat Depth Fundamentals
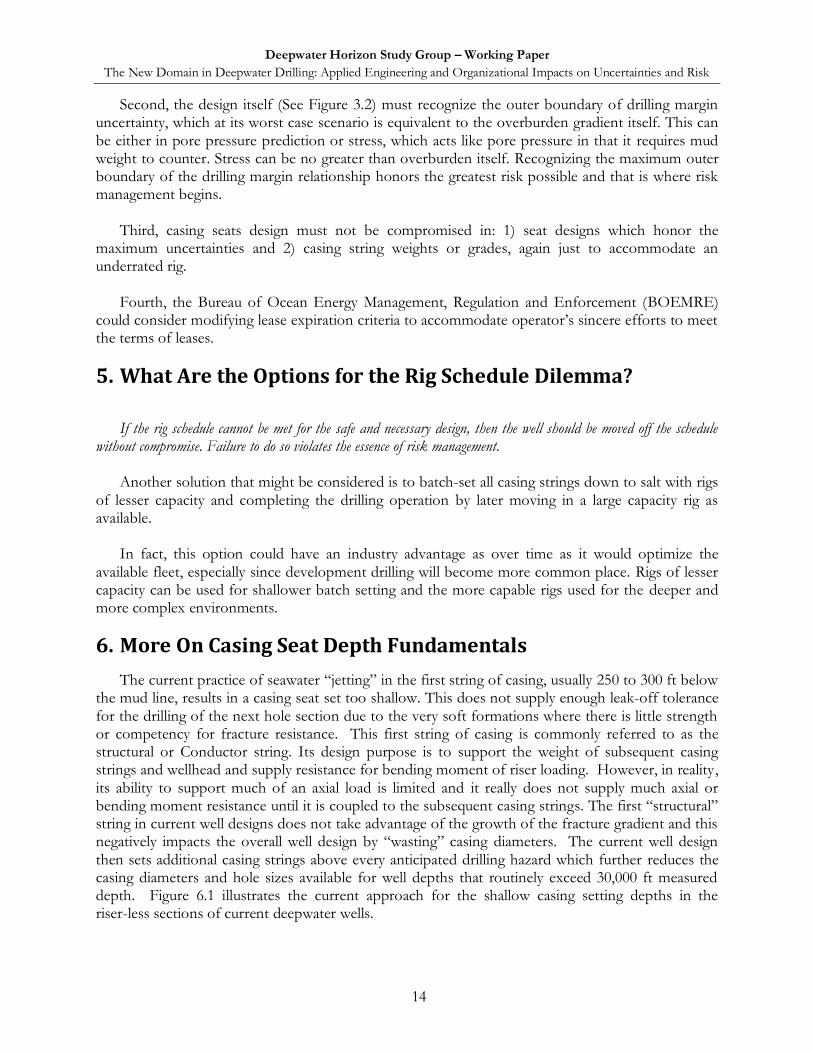
The current practice of seawater “jetting” in the first string of casing, usually 250 to 300 ft below the mud line, results in a casing seat set too shallow. This does not supply enough leak-off tolerance for the drilling of the next hole section due to the very soft formations where there is little strength or competency for fracture resistance. This first string of casing is commonly referred to as the structural or Conductor string. Its design purpose is to support the weight of subsequent casing strings and wellhead and supply resistance for bending moment of riser loading. However, in reality, its ability to support much of an axial load is limited and it really does not supply much axial or bending moment resistance until it is coupled to the subsequent casing strings. The first “structural” string in current well designs does not take advantage of the growth of the fracture gradient and this negatively impacts the overall well design by “wasting” casing diameters. The current well design then sets additional casing strings above every anticipated drilling hazard which further reduces the casing diameters and hole sizes available for well depths that routinely exceed 30,000 ft measured depth. Figure 6.1 illustrates the current approach for the shallow casing setting depths in the riser-less sections of current deepwater wells.
Deepwater Horizon Study Group – Working Paper
The New Domain in Deepwater Drilling: Applied Engineering and Organizational Impacts on Uncertainties and Risk
15
Figure 6.1 – Typical deepwater riserless casing seat rationale.
Casing seat optimization requires that the first string of casing to not only provide the structural
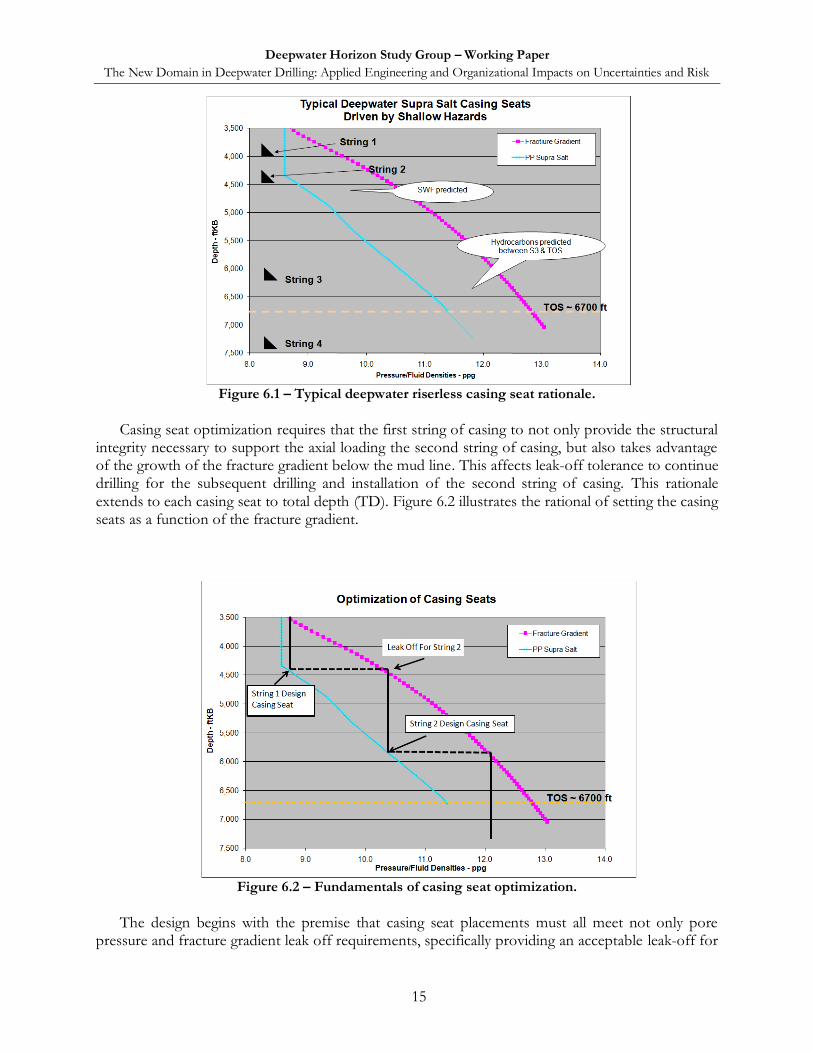
integrity necessary to support the axial loading the second string of casing, but also takes advantage of the growth of the fracture gradient below the mud line. This affects leak-off tolerance to continue drilling for the subsequent drilling and installation of the second string of casing. This rationale extends to each casing seat to total depth (TD). Figure 6.2 illustrates the rational of setting the casing seats as a function of the fracture gradient.
Figure 6.2 – Fundamentals of casing seat optimization.
The design begins with the premise that casing seat placements must all meet not only pore
pressure and fracture gradient leak off requirements, specifically providing an acceptable leak-off for
Deepwater Horizon Study Group – Working Paper
The New Domain in Deepwater Drilling: Applied Engineering and Organizational Impacts on Uncertainties and Risk
16
all subsequent casing string drilling operations, but must also meet structural requirements beginning with the first casing string.
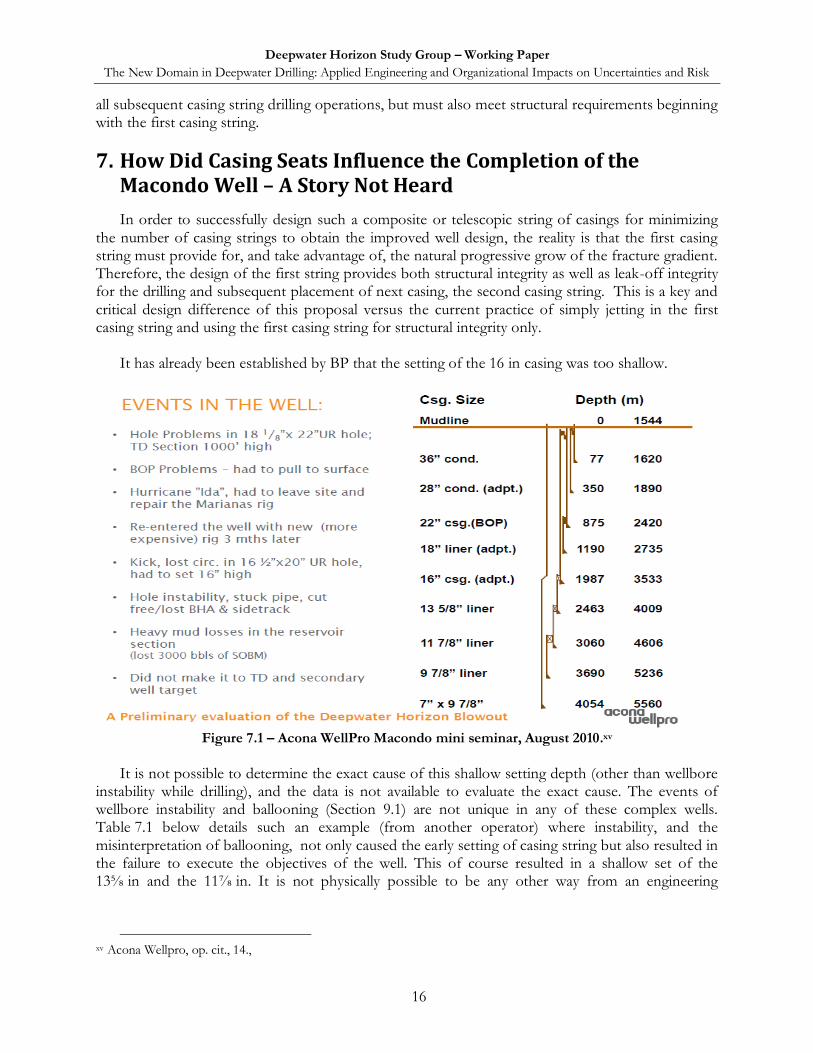
7. How Did Casing Seats Influence the Completion of the Macondo Well – A Story Not Heard
In order to successfully design such a composite or telescopic string of casings for minimizing the number of casing strings to obtain the improved well design, the reality is that the first casing string must provide for, and take advantage of, the natural progressive grow of the fracture gradient. Therefore, the design of the first string provides both structural integrity as well as leak-off integrity for the drilling and subsequent placement of next casing, the second casing string. This is a key and critical design difference of this proposal versus the current practice of simply jetting in the first casing string and using the first casing string for structural integrity only.
It has already been established by BP that the setting of the 16 in casing was too shallow.
Figure 7.1 – Acona WellPro Macondo mini seminar, August 2010.xv
It is not possible to determine the exact cause of this shallow setting depth (other than wellbore
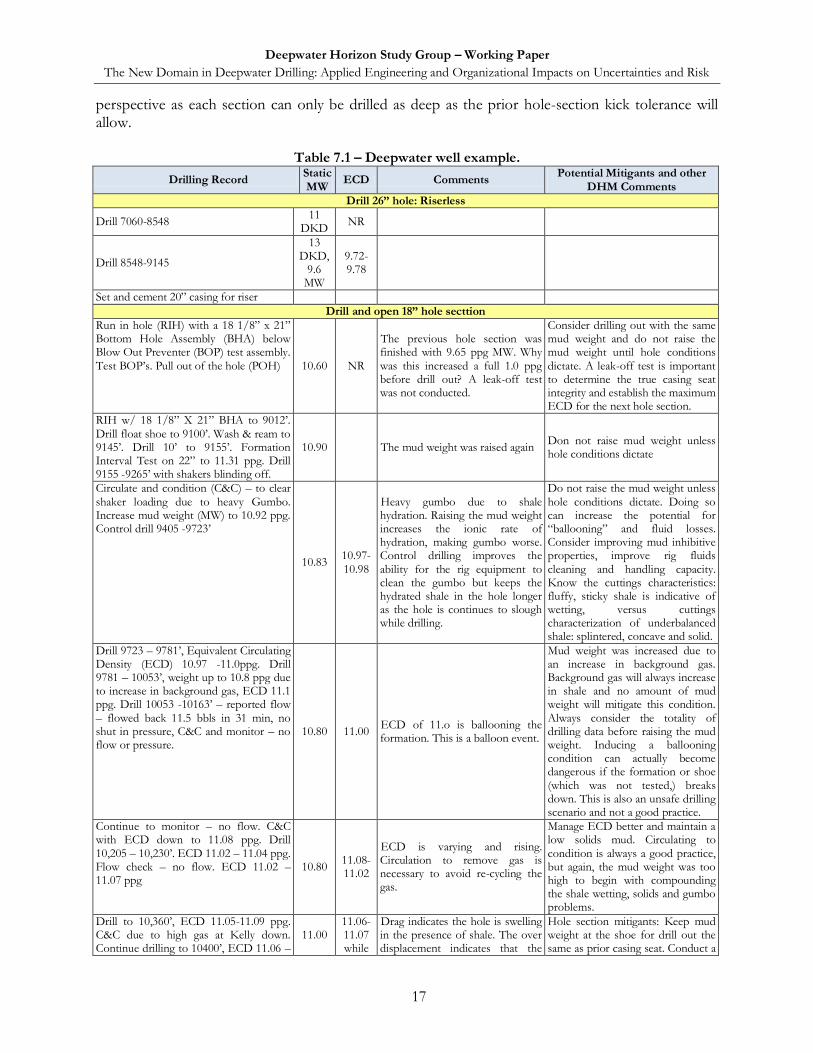
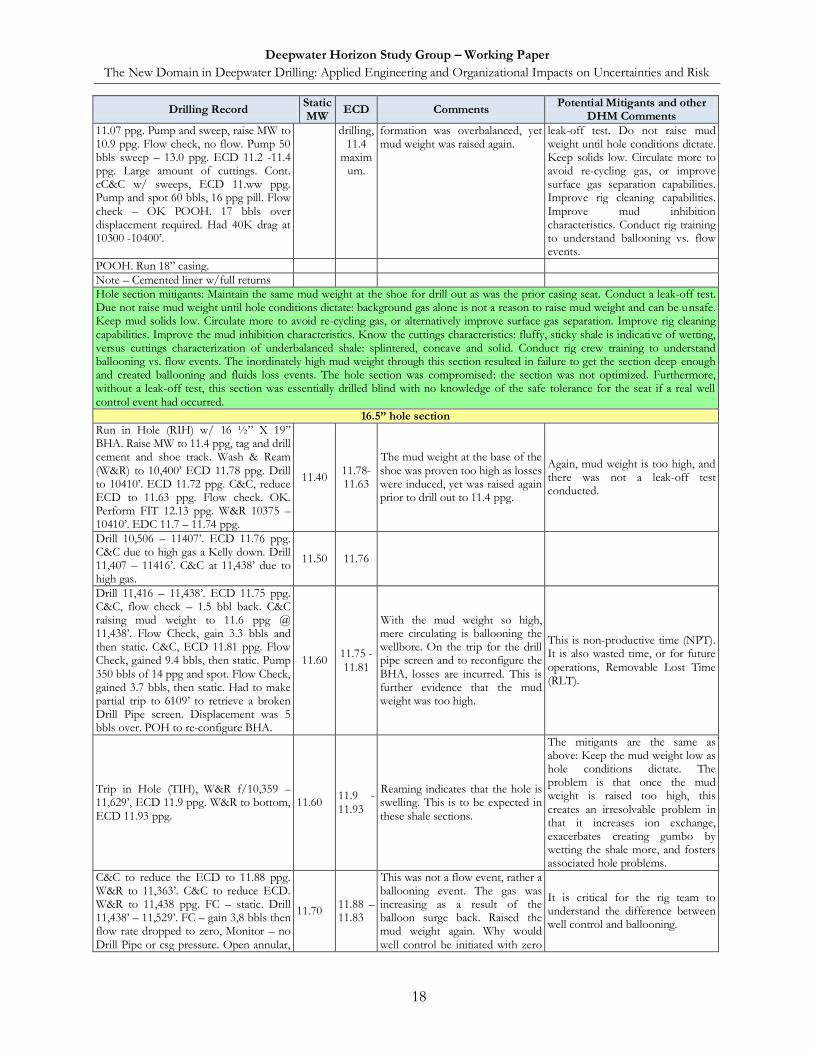
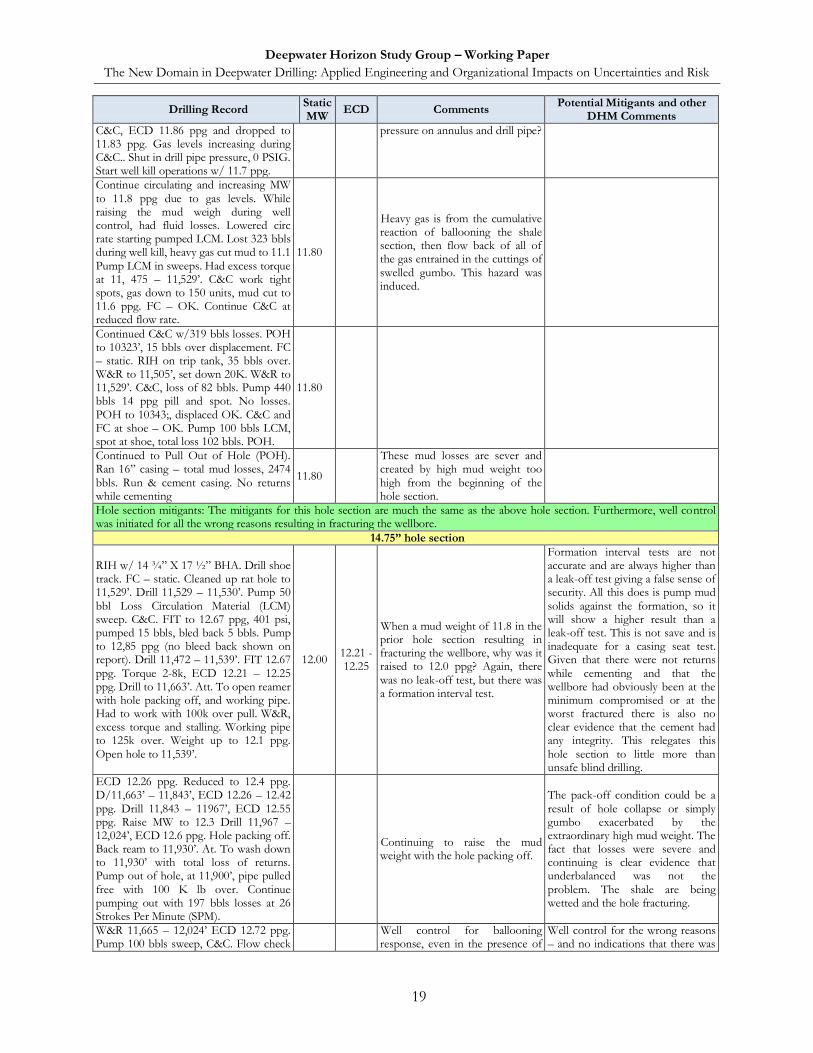
instability while drilling), and the data is not available to evaluate the exact cause. The events of wellbore instability and ballooning (Section 9.1) are not unique in any of these complex wells. Table 7.1 below details such an example (from another operator) where instability, and the misinterpretation of ballooning, not only caused the early setting of casing string but also resulted in the failure to execute the objectives of the well. This of course resulted in a shallow set of the 13⅝ in and the 11⅞ in. It is not physically possible to be any other way from an engineering
xv Acona Wellpro, op. cit., 14.,
Deepwater Horizon Study Group – Working Paper
The New Domain in Deepwater Drilling: Applied Engineering and Organizational Impacts on Uncertainties and Risk
17
perspective as each section can only be drilled as deep as the prior hole-section kick tolerance will allow.
Table 7.1 – Deepwater well example.
Drilling Record Static MW
ECD Comments Potential Mitigants and other
DHM Comments
Drill 26” hole: Riserless
Drill 7060-8548 11
DKD NR
Drill 8548-9145
13 DKD,
9.6 MW
9.72-9.78
Set and cement 20” casing for riser
Drill and open 18” hole secttion
Run in hole (RIH) with a 18 1/8” x 21” Bottom Hole Assembly (BHA) below Blow Out Preventer (BOP) test assembly. Test BOP‟s. Pull out of the hole (POH) 10.60 NR
The previous hole section was finished with 9.65 ppg MW. Why was this increased a full 1.0 ppg before drill out? A leak-off test was not conducted.
Consider drilling out with the same mud weight and do not raise the mud weight until hole conditions dictate. A leak-off test is important to determine the true casing seat integrity and establish the maximum ECD for the next hole section.
RIH w/ 18 1/8” X 21” BHA to 9012‟. Drill float shoe to 9100‟. Wash & ream to 9145‟. Drill 10‟ to 9155‟. Formation Interval Test on 22” to 11.31 ppg. Drill 9155 -9265‟ with shakers blinding off.
10.90 The mud weight was raised again Don not raise mud weight unless hole conditions dictate
Circulate and condition (C&C) – to clear shaker loading due to heavy Gumbo. Increase mud weight (MW) to 10.92 ppg. Control drill 9405 -9723‟
10.83 10.97-10.98
Heavy gumbo due to shale hydration. Raising the mud weight increases the ionic rate of hydration, making gumbo worse. Control drilling improves the ability for the rig equipment to clean the gumbo but keeps the hydrated shale in the hole longer as the hole is continues to slough while drilling.
Do not raise the mud weight unless hole conditions dictate. Doing so can increase the potential for “ballooning” and fluid losses. Consider improving mud inhibitive properties, improve rig fluids cleaning and handling capacity. Know the cuttings characteristics: fluffy, sticky shale is indicative of wetting, versus cuttings characterization of underbalanced shale: splintered, concave and solid.
Drill 9723 – 9781‟, Equivalent Circulating Density (ECD) 10.97 -11.0ppg. Drill 9781 – 10053‟, weight up to 10.8 ppg due to increase in background gas, ECD 11.1 ppg. Drill 10053 -10163‟ – reported flow – flowed back 11.5 bbls in 31 min, no shut in pressure, C&C and monitor – no flow or pressure.
10.80 11.00 ECD of 11.o is ballooning the formation. This is a balloon event.
Mud weight was increased due to an increase in background gas. Background gas will always increase in shale and no amount of mud weight will mitigate this condition. Always consider the totality of drilling data before raising the mud weight. Inducing a ballooning condition can actually become dangerous if the formation or shoe (which was not tested,) breaks down. This is also an unsafe drilling scenario and not a good practice.
Continue to monitor – no flow. C&C with ECD down to 11.08 ppg. Drill 10,205 – 10,230‟. ECD 11.02 – 11.04 ppg. Flow check – no flow. ECD 11.02 – 11.07 ppg
10.80 11.08-11.02
ECD is varying and rising. Circulation to remove gas is necessary to avoid re-cycling the gas.
Manage ECD better and maintain a low solids mud. Circulating to condition is always a good practice, but again, the mud weight was too high to begin with compounding the shale wetting, solids and gumbo problems.
Drill to 10,360‟, ECD 11.05-11.09 ppg. C&C due to high gas at Kelly down. Continue drilling to 10400‟, ECD 11.06 –
11.00 11.06-11.07 while
Drag indicates the hole is swelling in the presence of shale. The over displacement indicates that the
Hole section mitigants: Keep mud weight at the shoe for drill out the same as prior casing seat. Conduct a
Deepwater Horizon Study Group – Working Paper
The New Domain in Deepwater Drilling: Applied Engineering and Organizational Impacts on Uncertainties and Risk
18
Drilling Record Static MW
ECD Comments Potential Mitigants and other
DHM Comments
11.07 ppg. Pump and sweep, raise MW to 10.9 ppg. Flow check, no flow. Pump 50 bbls sweep – 13.0 ppg. ECD 11.2 -11.4 ppg. Large amount of cuttings. Cont. cC&C w/ sweeps, ECD 11.ww ppg. Pump and spot 60 bbls, 16 ppg pill. Flow check – OK POOH. 17 bbls over displacement required. Had 40K drag at 10300 -10400‟.
drilling, 11.4
maximum.
formation was overbalanced, yet mud weight was raised again.
leak-off test. Do not raise mud weight until hole conditions dictate. Keep solids low. Circulate more to avoid re-cycling gas, or improve surface gas separation capabilities. Improve rig cleaning capabilities. Improve mud inhibition characteristics. Conduct rig training to understand ballooning vs. flow events.
POOH. Run 18” casing.
Note – Cemented liner w/full returns
Hole section mitigants: Maintain the same mud weight at the shoe for drill out as was the prior casing seat. Conduct a leak-off test. Due not raise mud weight until hole conditions dictate: background gas alone is not a reason to raise mud weight and can be unsafe. Keep mud solids low. Circulate more to avoid re-cycling gas, or alternatively improve surface gas separation. Improve rig cleaning capabilities. Improve the mud inhibition characteristics. Know the cuttings characteristics: fluffy, sticky shale is indicative of wetting, versus cuttings characterization of underbalanced shale: splintered, concave and solid. Conduct rig crew training to understand ballooning vs. flow events. The inordinately high mud weight through this section resulted in failure to get the section deep enough and created ballooning and fluids loss events. The hole section was compromised: the section was not optimized. Furthermore, without a leak-off test, this section was essentially drilled blind with no knowledge of the safe tolerance for the seat if a real well control event had occurred.
16.5” hole section
Run in Hole (RIH) w/ 16 ½” X 19” BHA. Raise MW to 11.4 ppg, tag and drill cement and shoe track. Wash & Ream (W&R) to 10,400‟ ECD 11.78 ppg. Drill to 10410‟. ECD 11.72 ppg. C&C, reduce ECD to 11.63 ppg. Flow check. OK. Perform FIT 12.13 ppg. W&R 10375 – 10410‟. EDC 11.7 – 11.74 ppg.
11.40 11.78-11.63
The mud weight at the base of the shoe was proven too high as losses were induced, yet was raised again prior to drill out to 11.4 ppg.
Again, mud weight is too high, and there was not a leak-off test conducted.
Drill 10,506 – 11407‟. ECD 11.76 ppg. C&C due to high gas a Kelly down. Drill 11,407 – 11416‟. C&C at 11,438‟ due to high gas.
11.50 11.76
Drill 11,416 – 11,438‟. ECD 11.75 ppg. C&C, flow check – 1.5 bbl back. C&C raising mud weight to 11.6 ppg @ 11,438‟. Flow Check, gain 3.3 bbls and then static. C&C, ECD 11.81 ppg. Flow Check, gained 9.4 bbls, then static. Pump 350 bbls of 14 ppg and spot. Flow Check, gained 3.7 bbls, then static. Had to make partial trip to 6109‟ to retrieve a broken Drill Pipe screen. Displacement was 5 bbls over. POH to re-configure BHA.
11.60 11.75 -11.81
With the mud weight so high, mere circulating is ballooning the wellbore. On the trip for the drill pipe screen and to reconfigure the BHA, losses are incurred. This is further evidence that the mud weight was too high.
This is non-productive time (NPT). It is also wasted time, or for future operations, Removable Lost Time (RLT).
Trip in Hole (TIH), W&R f/10,359 – 11,629‟, ECD 11.9 ppg. W&R to bottom, ECD 11.93 ppg.
11.60 11.9 -11.93
Reaming indicates that the hole is swelling. This is to be expected in these shale sections.
The mitigants are the same as above: Keep the mud weight low as hole conditions dictate. The problem is that once the mud weight is raised too high, this creates an irresolvable problem in that it increases ion exchange, exacerbates creating gumbo by wetting the shale more, and fosters associated hole problems.
C&C to reduce the ECD to 11.88 ppg. W&R to 11,363‟. C&C to reduce ECD. W&R to 11,438 ppg. FC – static. Drill 11,438‟ – 11,529‟. FC – gain 3,8 bbls then flow rate dropped to zero, Monitor – no Drill Pipe or csg pressure. Open annular,
11.70 11.88 – 11.83
This was not a flow event, rather a ballooning event. The gas was increasing as a result of the balloon surge back. Raised the mud weight again. Why would well control be initiated with zero
It is critical for the rig team to understand the difference between well control and ballooning.
Deepwater Horizon Study Group – Working Paper
The New Domain in Deepwater Drilling: Applied Engineering and Organizational Impacts on Uncertainties and Risk
19
Drilling Record Static MW
ECD Comments Potential Mitigants and other
DHM Comments
C&C, ECD 11.86 ppg and dropped to 11.83 ppg. Gas levels increasing during C&C.. Shut in drill pipe pressure, 0 PSIG. Start well kill operations w/ 11.7 ppg.
pressure on annulus and drill pipe?
Continue circulating and increasing MW to 11.8 ppg due to gas levels. While raising the mud weigh during well control, had fluid losses. Lowered circ rate starting pumped LCM. Lost 323 bbls during well kill, heavy gas cut mud to 11.1 Pump LCM in sweeps. Had excess torque at 11, 475 – 11,529‟. C&C work tight spots, gas down to 150 units, mud cut to 11.6 ppg. FC – OK. Continue C&C at reduced flow rate.
11.80
Heavy gas is from the cumulative reaction of ballooning the shale section, then flow back of all of the gas entrained in the cuttings of swelled gumbo. This hazard was induced.
Continued C&C w/319 bbls losses. POH to 10323‟, 15 bbls over displacement. FC – static. RIH on trip tank, 35 bbls over. W&R to 11,505‟, set down 20K. W&R to 11,529‟. C&C, loss of 82 bbls. Pump 440 bbls 14 ppg pill and spot. No losses. POH to 10343;, displaced OK. C&C and FC at shoe – OK. Pump 100 bbls LCM, spot at shoe, total loss 102 bbls. POH.
11.80
Continued to Pull Out of Hole (POH). Ran 16” casing – total mud losses, 2474 bbls. Run & cement casing. No returns while cementing
11.80
These mud losses are sever and created by high mud weight too high from the beginning of the hole section.
Hole section mitigants: The mitigants for this hole section are much the same as the above hole section. Furthermore, well control was initiated for all the wrong reasons resulting in fracturing the wellbore.
14.75” hole section
RIH w/ 14 ¾” X 17 ½” BHA. Drill shoe track. FC – static. Cleaned up rat hole to 11,529‟. Drill 11,529 – 11,530‟. Pump 50 bbl Loss Circulation Material (LCM) sweep. C&C. FIT to 12.67 ppg, 401 psi, pumped 15 bbls, bled back 5 bbls. Pump to 12,85 ppg (no bleed back shown on report). Drill 11,472 – 11,539‟. FIT 12.67 ppg. Torque 2-8k, ECD 12.21 – 12.25 ppg. Drill to 11,663‟. Att. To open reamer with hole packing off, and working pipe. Had to work with 100k over pull. W&R, excess torque and stalling. Working pipe to 125k over. Weight up to 12.1 ppg. Open hole to 11,539‟.
12.00 12.21 - 12.25
When a mud weight of 11.8 in the prior hole section resulting in fracturing the wellbore, why was it raised to 12.0 ppg? Again, there was no leak-off test, but there was a formation interval test.
Formation interval tests are not accurate and are always higher than a leak-off test giving a false sense of security. All this does is pump mud solids against the formation, so it will show a higher result than a leak-off test. This is not save and is inadequate for a casing seat test. Given that there were not returns while cementing and that the wellbore had obviously been at the minimum compromised or at the worst fractured there is also no clear evidence that the cement had any integrity. This relegates this hole section to little more than unsafe blind drilling.
ECD 12.26 ppg. Reduced to 12.4 ppg. D/11,663‟ – 11,843‟, ECD 12.26 – 12.42 ppg. Drill 11,843 – 11967‟, ECD 12.55 ppg. Raise MW to 12.3 Drill 11,967 – 12,024‟, ECD 12.6 ppg. Hole packing off. Back ream to 11,930‟. At. To wash down to 11,930‟ with total loss of returns. Pump out of hole, at 11,900‟, pipe pulled free with 100 K lb over. Continue pumping out with 197 bbls losses at 26 Strokes Per Minute (SPM).
Continuing to raise the mud weight with the hole packing off.
The pack-off condition could be a result of hole collapse or simply gumbo exacerbated by the extraordinary high mud weight. The fact that losses were severe and continuing is clear evidence that underbalanced was not the problem. The shale are being wetted and the hole fracturing.
W&R 11,665 – 12,024‟ ECD 12.72 ppg. Pump 100 bbls sweep, C&C. Flow check
Well control for ballooning response, even in the presence of
Well control for the wrong reasons – and no indications that there was
Deepwater Horizon Study Group – Working Paper
The New Domain in Deepwater Drilling: Applied Engineering and Organizational Impacts on Uncertainties and Risk
20
Drilling Record Static MW
ECD Comments Potential Mitigants and other
DHM Comments
– no flow. Pump 100 bbls sweep, ECD 12.72 ppg. Drill 12,063 – 12,075‟, ECD 12.63 ppg. Stuck pipe. Work pipe 200klb over, had 10 bbl gain. Shut in., 0 on csg, DP – 58 psi bled DP to zero with no flow. Well control. Pump 12.3 ppg with LCM sweeps. Pumped 861 bbls, lost 506 bbls.
sever losses. a well control event.
Monitor. Pump 234 bbls. Well static, pipe stuck. Work stuck pipe on jars, 6 up, one down, with 315Klb over. Pulling to 11,470‟. Started well control and pumping into well. Shut in. Bled 1 bbl into tank. Boost riser cap w/ 235 bbls of 16 ppg to C&C to 12.3 ppg. Performed bleed backs
Continue well control procedures. Stabilized well, pull out of hole (POH) for BHA change 11,470 to 9470‟. Flow Check – bled 1 bbl. POH to 975‟. Fill up OK. Change BHA. RIH.
RIH w/ 14 ¾” X 17 ½” BHA to 11,504‟. Close annular and displace riser cap. Mud cut to 11.9 ppg+. Flow 9.6 bbls in 5 minutes. SI. With no pressure. C&C. W&R to 11,820‟. Mud cut to 11.9 ppg+, ECD 12.6 ppg. W&R at 11,880‟ and attempting to manage ECD.
12.30 12.65
W&R 11,820 – 11,924; Tight spots. Hole stated packing, pipe free w/110Klb over. W&R to 11,951‟. C&C to reduce ECD to 12.68 ppg. W&R to 12,075‟, ECD 12.65 ppg. Bit stalling and packing off. Had to jar up 3 times, free w/200 K lb over.
12.30 12.68
Pump 75 bbls 14.3 ppg sweep. C&C. W&R to 12,077‟ ECD 12.65 ppg. Packing off, pulled free w/ 138 Klb over. ECD 12.74 ppg. Pump 75 bbls sweep, W&R to bottom and packed off at 12,071‟
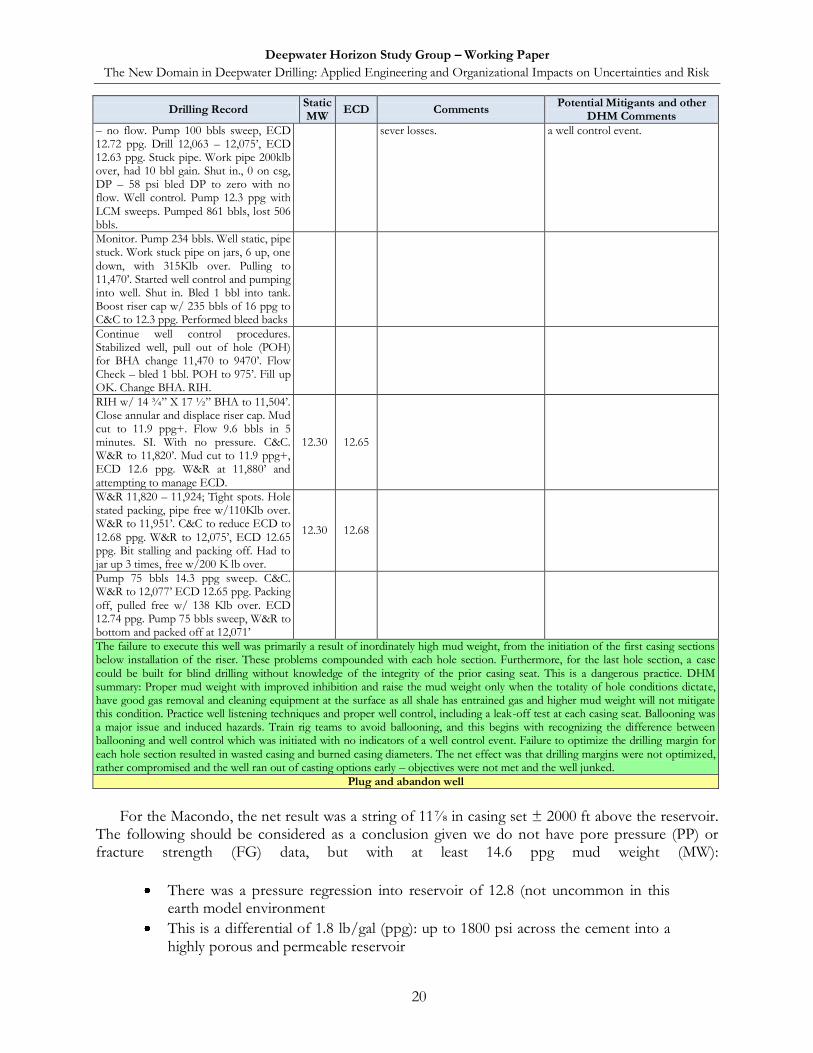
The failure to execute this well was primarily a result of inordinately high mud weight, from the initiation of the first casing sections below installation of the riser. These problems compounded with each hole section. Furthermore, for the last hole section, a case could be built for blind drilling without knowledge of the integrity of the prior casing seat. This is a dangerous practice. DHM summary: Proper mud weight with improved inhibition and raise the mud weight only when the totality of hole conditions dictate, have good gas removal and cleaning equipment at the surface as all shale has entrained gas and higher mud weight will not mitigate this condition. Practice well listening techniques and proper well control, including a leak-off test at each casing seat. Ballooning was a major issue and induced hazards. Train rig teams to avoid ballooning, and this begins with recognizing the difference between ballooning and well control which was initiated with no indicators of a well control event. Failure to optimize the drilling margin for each hole section resulted in wasted casing and burned casing diameters. The net effect was that drilling margins were not optimized, rather compromised and the well ran out of casting options early – objectives were not met and the well junked.
Plug and abandon well
For the Macondo, the net result was a string of 11⅞ in casing set ± 2000 ft above the reservoir.
The following should be considered as a conclusion given we do not have pore pressure (PP) or fracture strength (FG) data, but with at least 14.6 ppg mud weight (MW):
There was a pressure regression into reservoir of 12.8 (not uncommon in this earth model environment
This is a differential of 1.8 lb/gal (ppg): up to 1800 psi across the cement into a highly porous and permeable reservoir
Deepwater Horizon Study Group – Working Paper
The New Domain in Deepwater Drilling: Applied Engineering and Organizational Impacts on Uncertainties and Risk
21
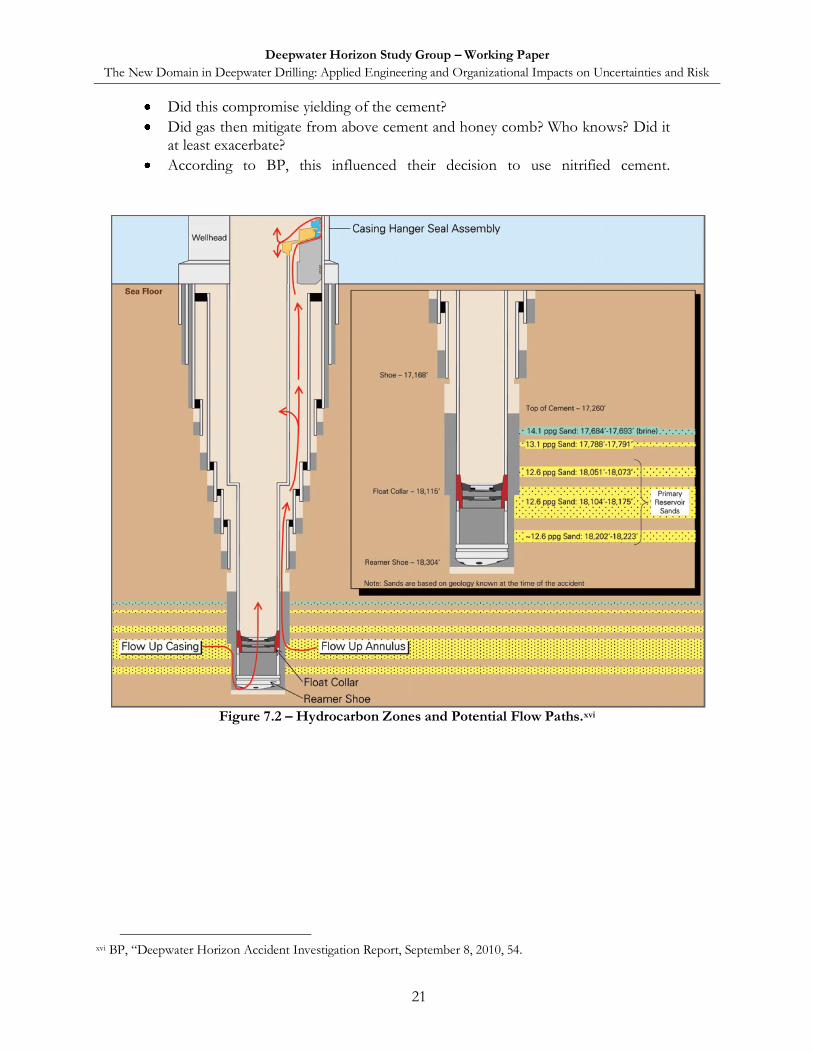
Did this compromise yielding of the cement?
Did gas then mitigate from above cement and honey comb? Who knows? Did it at least exacerbate?
According to BP, this influenced their decision to use nitrified cement.
Figure 7.2 – Hydrocarbon Zones and Potential Flow Paths.xvi
xvi BP, “Deepwater Horizon Accident Investigation Report, September 8, 2010, 54.
Deepwater Horizon Study Group – Working Paper
The New Domain in Deepwater Drilling: Applied Engineering and Organizational Impacts on Uncertainties and Risk
22
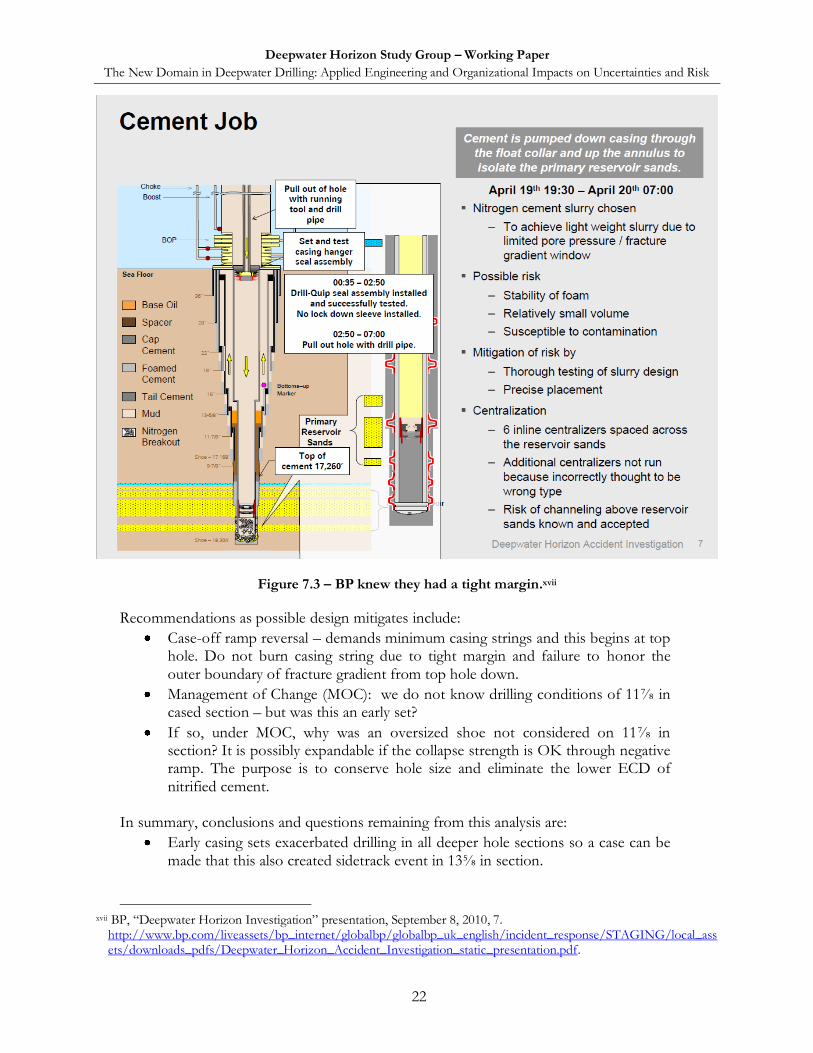
Figure 7.3 – BP knew they had a tight margin.xvii
Recommendations as possible design mitigates include:
Case-off ramp reversal – demands minimum casing strings and this begins at top hole. Do not burn casing string due to tight margin and failure to honor the outer boundary of fracture gradient from top hole down.
Management of Change (MOC): we do not know drilling conditions of 11⅞ in cased section – but was this an early set?
If so, under MOC, why was an oversized shoe not considered on 11⅞ in section? It is possibly expandable if the collapse strength is OK through negative ramp. The purpose is to conserve hole size and eliminate the lower ECD of nitrified cement.
In summary, conclusions and questions remaining from this analysis are:
Early casing sets exacerbated drilling in all deeper hole sections so a case can be made that this also created sidetrack event in 13⅝ in section.
xvii BP, “Deepwater Horizon Investigation” presentation, September 8, 2010, 7.
http://www.bp.com/liveassets/bp_internet/globalbp/globalbp_uk_english/incident_response/STAGING/local_assets/downloads_pdfs/Deepwater_Horizon_Accident_Investigation_static_presentation.pdf.
Deepwater Horizon Study Group – Working Paper
The New Domain in Deepwater Drilling: Applied Engineering and Organizational Impacts on Uncertainties and Risk
23
Early sets including 11⅞ in failed to protect up to 1.8 ppg of pressure ramp reversal into reservoir.
This also begs the question of what was the correct drill out weight below 11⅞ in. Was it 14.6 ppg? This was probably too high.
Other questions in the execution process remain as well. What was the stable mud weight immediately prior to setting the 11⅞ in casing? Was this 14.6 ppg applied mud weight an arbitrary weight? Why were drilling conditions not used to determine an at balance weight? Would a mitigating technology be Controlled Pressure Drilling on choke to enable correct mud weight applications?
The 14.6 ppg mud weight created unavoidable differential across the cement – a minimum of
1800 psi while curing. Consequently, we cannot discount that honey-combed cement exacerbated creating micro-annulus resulting in a flow path for nitrogen separation.
8. Understanding Wellbore Instability – Well Listening and the Rig Team Interactive Factors
Although not an exhaustive list of drilling hazards, the following discussion does represent a major portion of nonproductive time (NPT) in drilling operations.
Best practices used while drilling is a fundamental principle of ensuring wellbore stability. Some
drilling hazards can be induced by failure to recognize or misinterpreting the dynamics of the drilling margin.
Well listening engages the human factor and requires considerable skill and training to
understand what drilling operations related to the well conditions are communicating. Understanding these basic drilling conditions are critical to safe and successful operations.
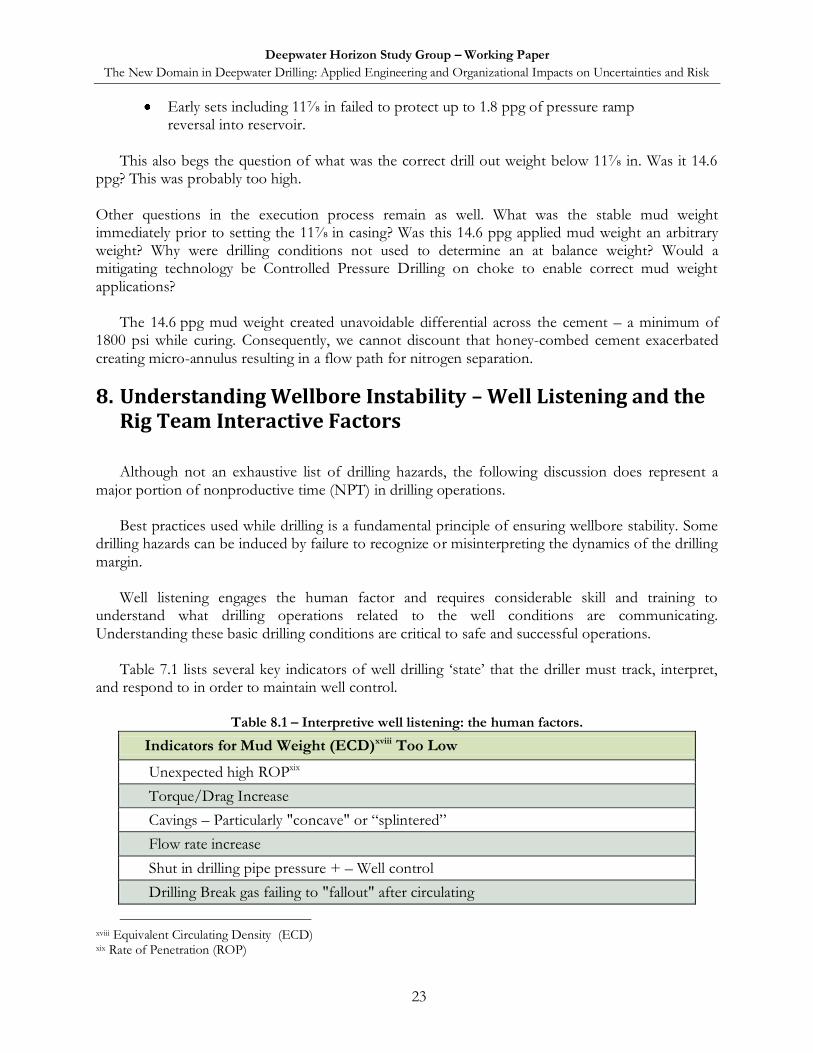
Table 7.1 lists several key indicators of well drilling „state‟ that the driller must track, interpret,
and respond to in order to maintain well control.
Table 8.1 – Interpretive well listening: the human factors.
Indicators for Mud Weight (ECD)xviii Too Low
Unexpected high ROPxix
Torque/Drag Increase
Cavings – Particularly "concave" or “splintered”
Flow rate increase
Shut in drilling pipe pressure + – Well control
Drilling Break gas failing to "fallout" after circulating
xviii Equivalent Circulating Density (ECD) xix Rate of Penetration (ROP)
Deepwater Horizon Study Group – Working Paper
The New Domain in Deepwater Drilling: Applied Engineering and Organizational Impacts on Uncertainties and Risk
24
BHA drift (principles stress vectors)
Hole fill-up (sloughing or collapsing hole)
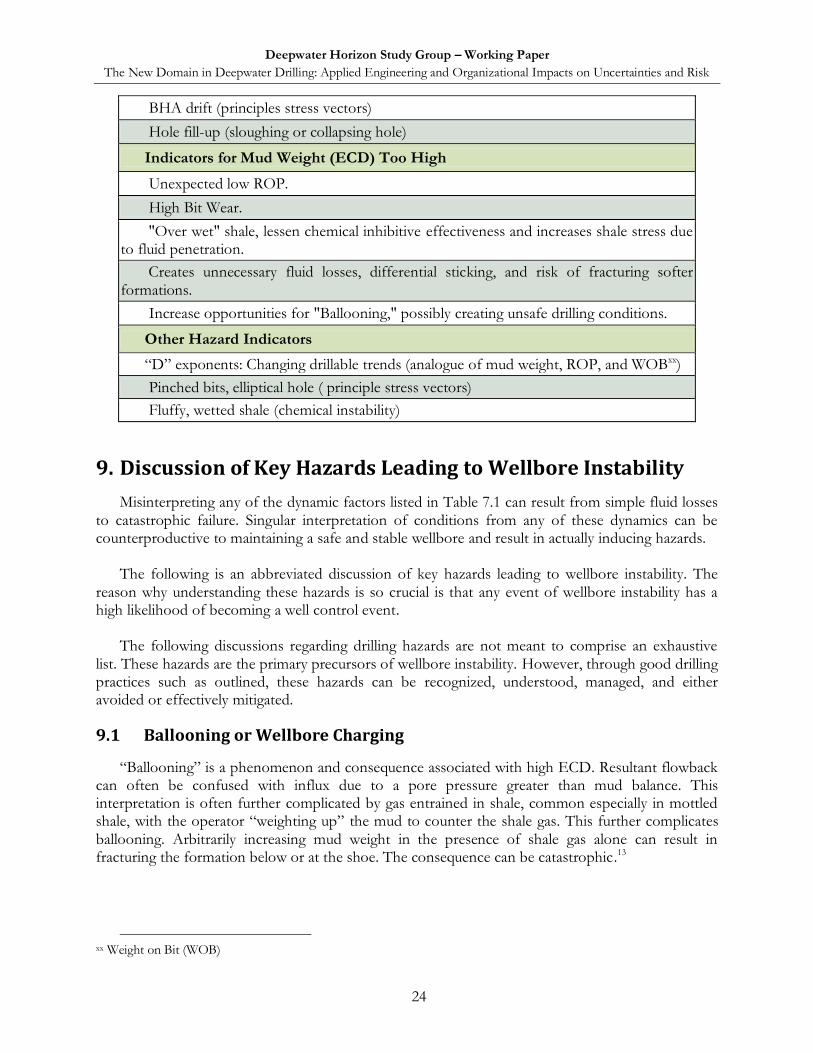
Indicators for Mud Weight (ECD) Too High
Unexpected low ROP.
High Bit Wear.
"Over wet" shale, lessen chemical inhibitive effectiveness and increases shale stress due to fluid penetration.
Creates unnecessary fluid losses, differential sticking, and risk of fracturing softer formations.
Increase opportunities for "Ballooning," possibly creating unsafe drilling conditions.
Other Hazard Indicators
“D” exponents: Changing drillable trends (analogue of mud weight, ROP, and WOBxx)
Pinched bits, elliptical hole ( principle stress vectors)
Fluffy, wetted shale (chemical instability)
9. Discussion of Key Hazards Leading to Wellbore Instability
Misinterpreting any of the dynamic factors listed in Table 7.1 can result from simple fluid losses to catastrophic failure. Singular interpretation of conditions from any of these dynamics can be counterproductive to maintaining a safe and stable wellbore and result in actually inducing hazards.
The following is an abbreviated discussion of key hazards leading to wellbore instability. The
reason why understanding these hazards is so crucial is that any event of wellbore instability has a high likelihood of becoming a well control event.
The following discussions regarding drilling hazards are not meant to comprise an exhaustive
list. These hazards are the primary precursors of wellbore instability. However, through good drilling practices such as outlined, these hazards can be recognized, understood, managed, and either avoided or effectively mitigated.
9.1 Ballooning or Wellbore Charging
“Ballooning” is a phenomenon and consequence associated with high ECD. Resultant flowback can often be confused with influx due to a pore pressure greater than mud balance. This interpretation is often further complicated by gas entrained in shale, common especially in mottled shale, with the operator “weighting up” the mud to counter the shale gas. This further complicates ballooning. Arbitrarily increasing mud weight in the presence of shale gas alone can result in fracturing the formation below or at the shoe. The consequence can be catastrophic.13
xx Weight on Bit (WOB)
Deepwater Horizon Study Group – Working Paper
The New Domain in Deepwater Drilling: Applied Engineering and Organizational Impacts on Uncertainties and Risk
25
Failure to recognize ballooning versus well control is a common mistake made in drilling operations. It is one of the leading causes of unnecessarily expending casing strings in narrow margin drilling operations.
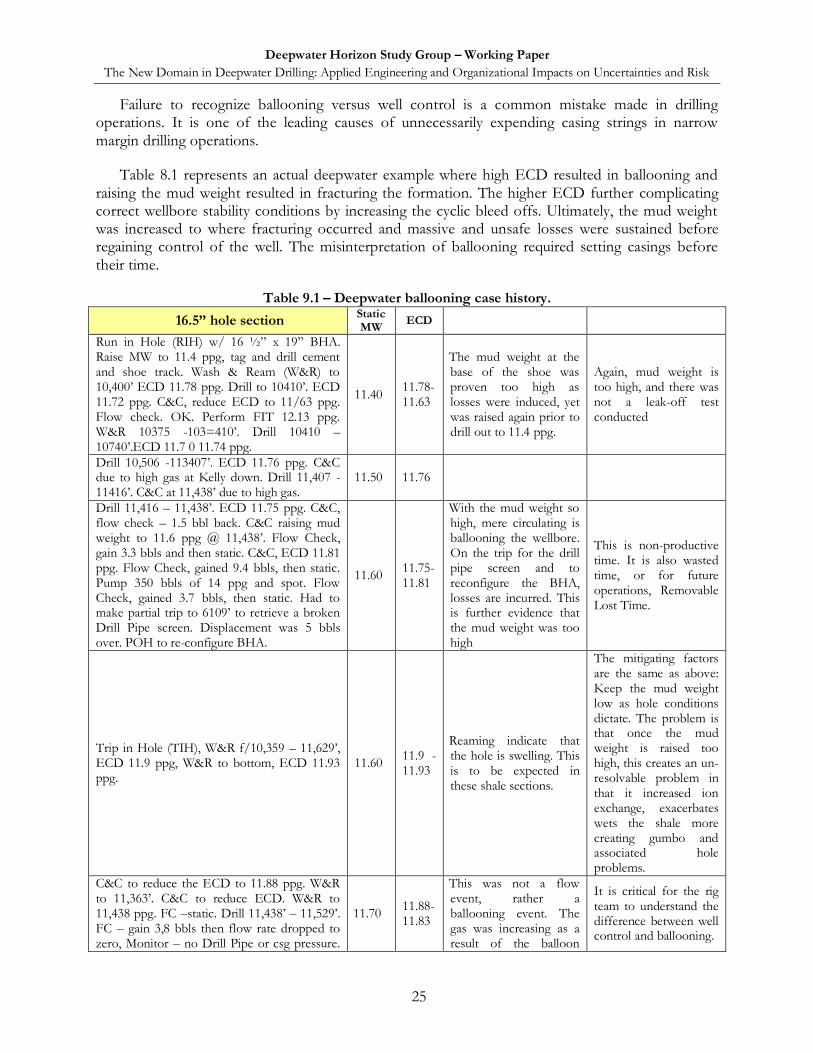
Table 8.1 represents an actual deepwater example where high ECD resulted in ballooning and raising the mud weight resulted in fracturing the formation. The higher ECD further complicating correct wellbore stability conditions by increasing the cyclic bleed offs. Ultimately, the mud weight was increased to where fracturing occurred and massive and unsafe losses were sustained before regaining control of the well. The misinterpretation of ballooning required setting casings before their time.
Table 9.1 – Deepwater ballooning case history.
16.5” hole section Static
MW ECD
Run in Hole (RIH) w/ 16 ½” x 19” BHA. Raise MW to 11.4 ppg, tag and drill cement and shoe track. Wash & Ream (W&R) to 10,400‟ ECD 11.78 ppg. Drill to 10410‟. ECD 11.72 ppg. C&C, reduce ECD to 11/63 ppg. Flow check. OK. Perform FIT 12.13 ppg. W&R 10375 -103=410‟. Drill 10410 – 10740‟.ECD 11.7 0 11.74 ppg.
11.40 11.78-11.63
The mud weight at the base of the shoe was proven too high as losses were induced, yet was raised again prior to drill out to 11.4 ppg.
Again, mud weight is too high, and there was not a leak-off test conducted
Drill 10,506 -113407‟. ECD 11.76 ppg. C&C due to high gas at Kelly down. Drill 11,407 -11416‟. C&C at 11,438‟ due to high gas.
11.50 11.76
Drill 11,416 – 11,438‟. ECD 11.75 ppg. C&C, flow check – 1.5 bbl back. C&C raising mud weight to 11.6 ppg @ 11,438‟. Flow Check, gain 3.3 bbls and then static. C&C, ECD 11.81 ppg. Flow Check, gained 9.4 bbls, then static. Pump 350 bbls of 14 ppg and spot. Flow Check, gained 3.7 bbls, then static. Had to make partial trip to 6109‟ to retrieve a broken Drill Pipe screen. Displacement was 5 bbls over. POH to re-configure BHA.
11.60 11.75- 11.81
With the mud weight so high, mere circulating is ballooning the wellbore. On the trip for the drill pipe screen and to reconfigure the BHA, losses are incurred. This is further evidence that the mud weight was too high
This is non-productive time. It is also wasted time, or for future operations, Removable Lost Time.
Trip in Hole (TIH), W&R f/10,359 – 11,629‟, ECD 11.9 ppg, W&R to bottom, ECD 11.93 ppg.
11.60 11.9 - 11.93
Reaming indicate that the hole is swelling. This is to be expected in these shale sections.
The mitigating factors are the same as above: Keep the mud weight low as hole conditions dictate. The problem is that once the mud weight is raised too high, this creates an un-resolvable problem in that it increased ion exchange, exacerbates wets the shale more creating gumbo and associated hole problems.
C&C to reduce the ECD to 11.88 ppg. W&R to 11,363‟. C&C to reduce ECD. W&R to 11,438 ppg. FC –static. Drill 11,438‟ – 11,529‟. FC – gain 3,8 bbls then flow rate dropped to zero, Monitor – no Drill Pipe or csg pressure.
11.70 11.88- 11.83
This was not a flow event, rather a ballooning event. The gas was increasing as a result of the balloon
It is critical for the rig team to understand the difference between well control and ballooning.
Deepwater Horizon Study Group – Working Paper
The New Domain in Deepwater Drilling: Applied Engineering and Organizational Impacts on Uncertainties and Risk
26
16.5” hole section Static
MW ECD
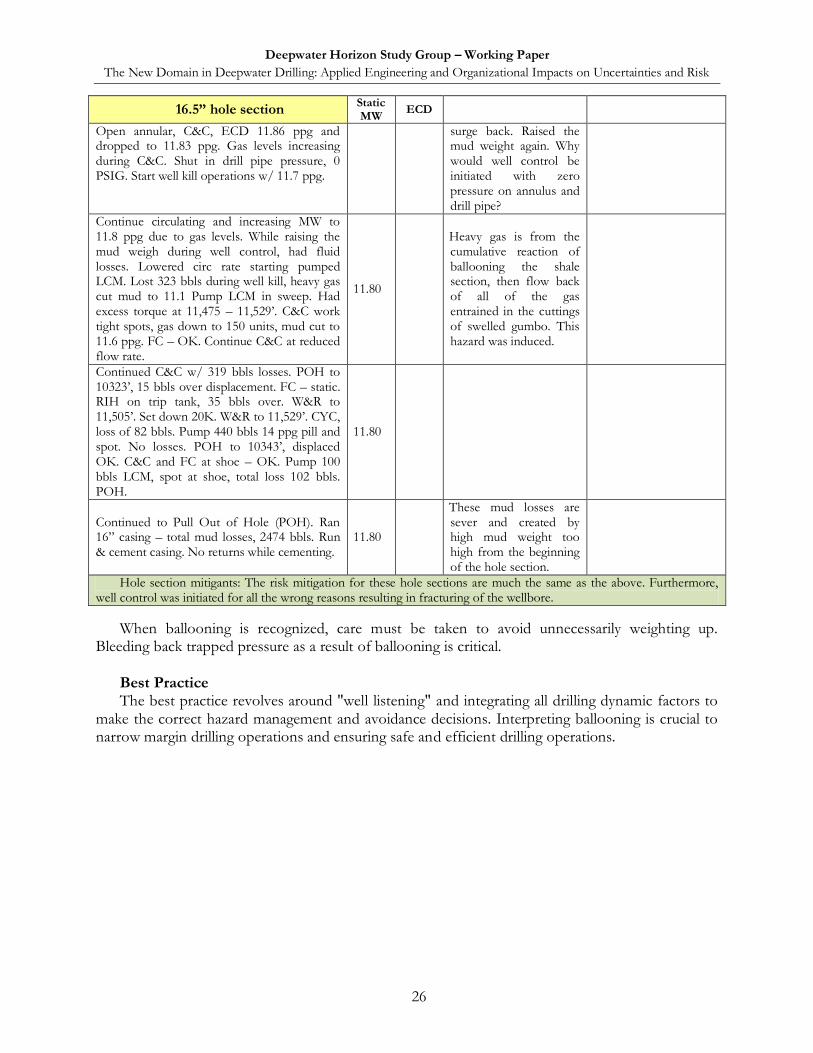
Open annular, C&C, ECD 11.86 ppg and dropped to 11.83 ppg. Gas levels increasing during C&C. Shut in drill pipe pressure, 0 PSIG. Start well kill operations w/ 11.7 ppg.
surge back. Raised the mud weight again. Why would well control be initiated with zero pressure on annulus and drill pipe?
Continue circulating and increasing MW to 11.8 ppg due to gas levels. While raising the mud weigh during well control, had fluid losses. Lowered circ rate starting pumped LCM. Lost 323 bbls during well kill, heavy gas cut mud to 11.1 Pump LCM in sweep. Had excess torque at 11,475 – 11,529‟. C&C work tight spots, gas down to 150 units, mud cut to 11.6 ppg. FC – OK. Continue C&C at reduced flow rate.
11.80
Heavy gas is from the cumulative reaction of ballooning the shale section, then flow back of all of the gas entrained in the cuttings of swelled gumbo. This hazard was induced.
Continued C&C w/ 319 bbls losses. POH to 10323‟, 15 bbls over displacement. FC – static. RIH on trip tank, 35 bbls over. W&R to 11,505‟. Set down 20K. W&R to 11,529‟. CYC, loss of 82 bbls. Pump 440 bbls 14 ppg pill and spot. No losses. POH to 10343‟, displaced OK. C&C and FC at shoe – OK. Pump 100 bbls LCM, spot at shoe, total loss 102 bbls. POH.
11.80
Continued to Pull Out of Hole (POH). Ran 16” casing – total mud losses, 2474 bbls. Run & cement casing. No returns while cementing.
11.80
These mud losses are sever and created by high mud weight too high from the beginning of the hole section.
Hole section mitigants: The risk mitigation for these hole sections are much the same as the above. Furthermore, well control was initiated for all the wrong reasons resulting in fracturing of the wellbore.
When ballooning is recognized, care must be taken to avoid unnecessarily weighting up. Bleeding back trapped pressure as a result of ballooning is critical.
Best Practice The best practice revolves around "well listening" and integrating all drilling dynamic factors to
make the correct hazard management and avoidance decisions. Interpreting ballooning is crucial to narrow margin drilling operations and ensuring safe and efficient drilling operations.
Deepwater Horizon Study Group – Working Paper
The New Domain in Deepwater Drilling: Applied Engineering and Organizational Impacts on Uncertainties and Risk
27
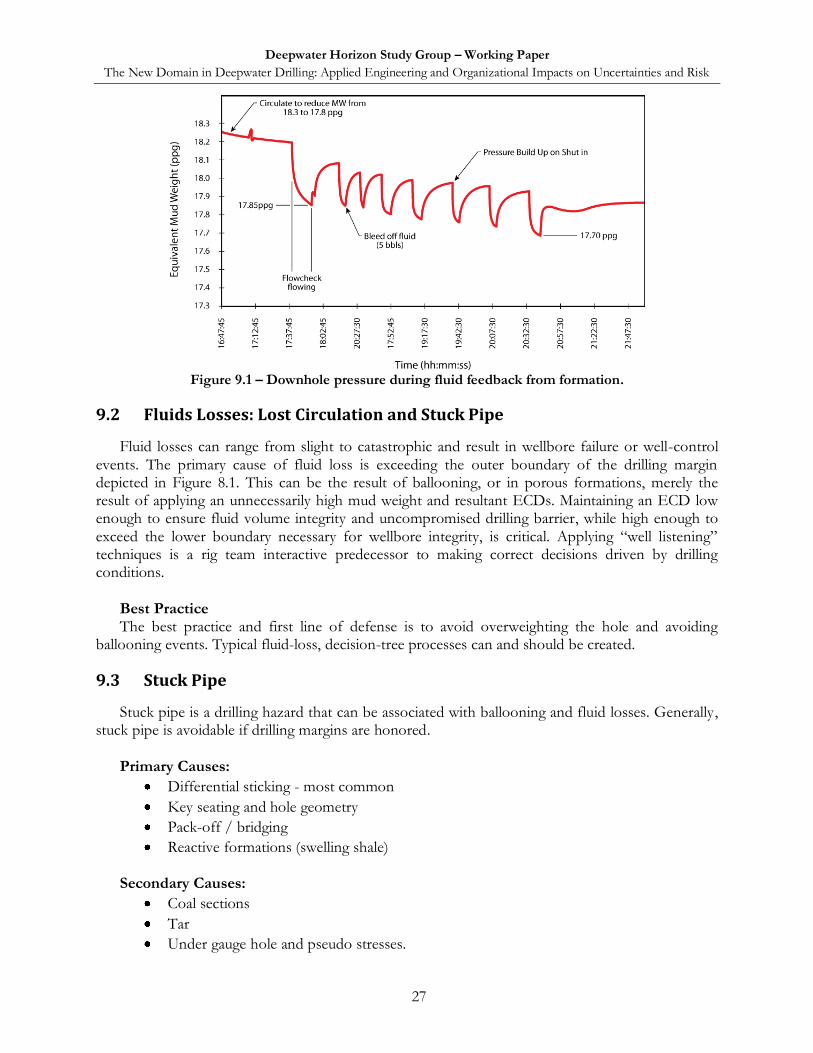
Figure 9.1 – Downhole pressure during fluid feedback from formation.
9.2 Fluids Losses: Lost Circulation and Stuck Pipe
Fluid losses can range from slight to catastrophic and result in wellbore failure or well-control events. The primary cause of fluid loss is exceeding the outer boundary of the drilling margin depicted in Figure 8.1. This can be the result of ballooning, or in porous formations, merely the result of applying an unnecessarily high mud weight and resultant ECDs. Maintaining an ECD low enough to ensure fluid volume integrity and uncompromised drilling barrier, while high enough to exceed the lower boundary necessary for wellbore integrity, is critical. Applying “well listening” techniques is a rig team interactive predecessor to making correct decisions driven by drilling conditions.
Best Practice The best practice and first line of defense is to avoid overweighting the hole and avoiding
ballooning events. Typical fluid-loss, decision-tree processes can and should be created.
9.3 Stuck Pipe
Stuck pipe is a drilling hazard that can be associated with ballooning and fluid losses. Generally, stuck pipe is avoidable if drilling margins are honored.
Primary Causes:
Differential sticking - most common
Key seating and hole geometry
Pack-off / bridging
Reactive formations (swelling shale)
Secondary Causes:
Coal sections
Tar
Under gauge hole and pseudo stresses.
Deepwater Horizon Study Group – Working Paper
The New Domain in Deepwater Drilling: Applied Engineering and Organizational Impacts on Uncertainties and Risk
28
Permeable sections, high fluid loss
Cuttings buildup
Salt creep
Collapsed casing
Junk
Green cement
Recognition and avoidance of stuck pipe requires some of the same “well listening‟ techniques:
Geometry or volume of shaker cuttings, trends in mud properties,
or drilling parameters
Out-of-balance mud weight or high ECD
Hole caving
Splintered cuttings
Concave-shaped cuttings
Sloughing shale, chemical shale wetting, and instability
Tectonic or pseudo-induced stresses
Best Practice The best practices to avoid stuck pipe are much the same as ballooning and fluids loss, that is,
recognizing the conditions within the drilling margins and events and reacting correctly. In addition, other factors such as Bottom Hole Assembly (BHA)xxi and drill string configuration and the inhibitive characteristics of the formations being drilled should be considered.
10. Analyzing the Risk of Deepwater Drilling – The Metrics of Wellbore Instability
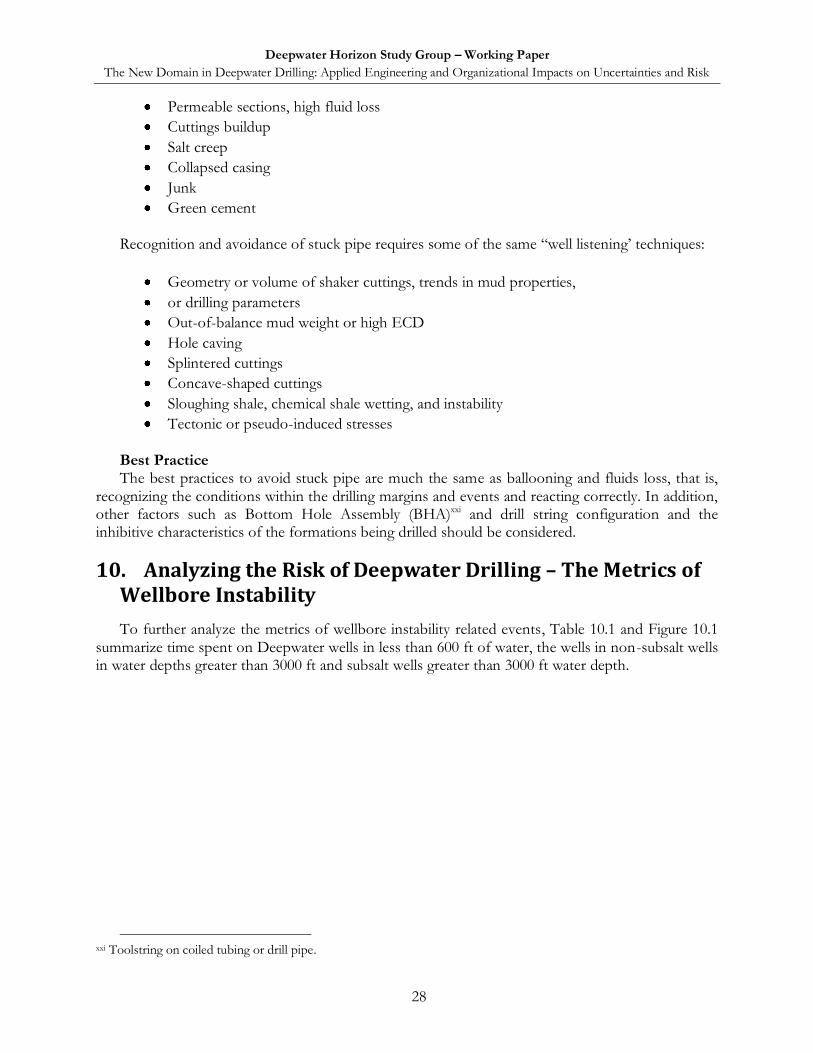
To further analyze the metrics of wellbore instability related events, Table 10.1 and Figure 10.1 summarize time spent on Deepwater wells in less than 600 ft of water, the wells in non-subsalt wells in water depths greater than 3000 ft and subsalt wells greater than 3000 ft water depth.
xxi Toolstring on coiled tubing or drill pipe.
Deepwater Horizon Study Group – Working Paper
The New Domain in Deepwater Drilling: Applied Engineering and Organizational Impacts on Uncertainties and Risk
29
Table 10.1 – Days of wellbore instability as a percent of total time (exclusive of weather).
Events related to Wellbore Instability
General Populations: 263 wellbores< 600 ft of water
65 subsalt wells: WD > 3000 ft
99 non subsalt wells WD > 3000 ft
Stuck pipe 2.20% 2.90% 0.70%
Wellbore stability 0.70% 2.90% 0.90%
Loss circulation 2.30% 2.40% 2.00%
Kick 1.20% 1.90% 0.80%
Total (%) 6.40% 10.10% 4.40%
Total Wellbore Instability (days)
2.24 days 9.797 days 2.376 days
Total NPT Days 4 29 9
Instability % of NPT Days 56.00% 33.78% 26.40%
Average Days to Drill 35 97 54
Kick Days 0.42 1.843 0.432
Figure 10.1 – Graphic of total days of wellbore instability.
Over four times as much time is spent on the more complex wells combating wellbore instability
events. Even more revealing is that over four times as much time is also spent on the blowout preventer (BOP) combating kicks.
Deepwater Horizon Study Group – Working Paper
The New Domain in Deepwater Drilling: Applied Engineering and Organizational Impacts on Uncertainties and Risk
30
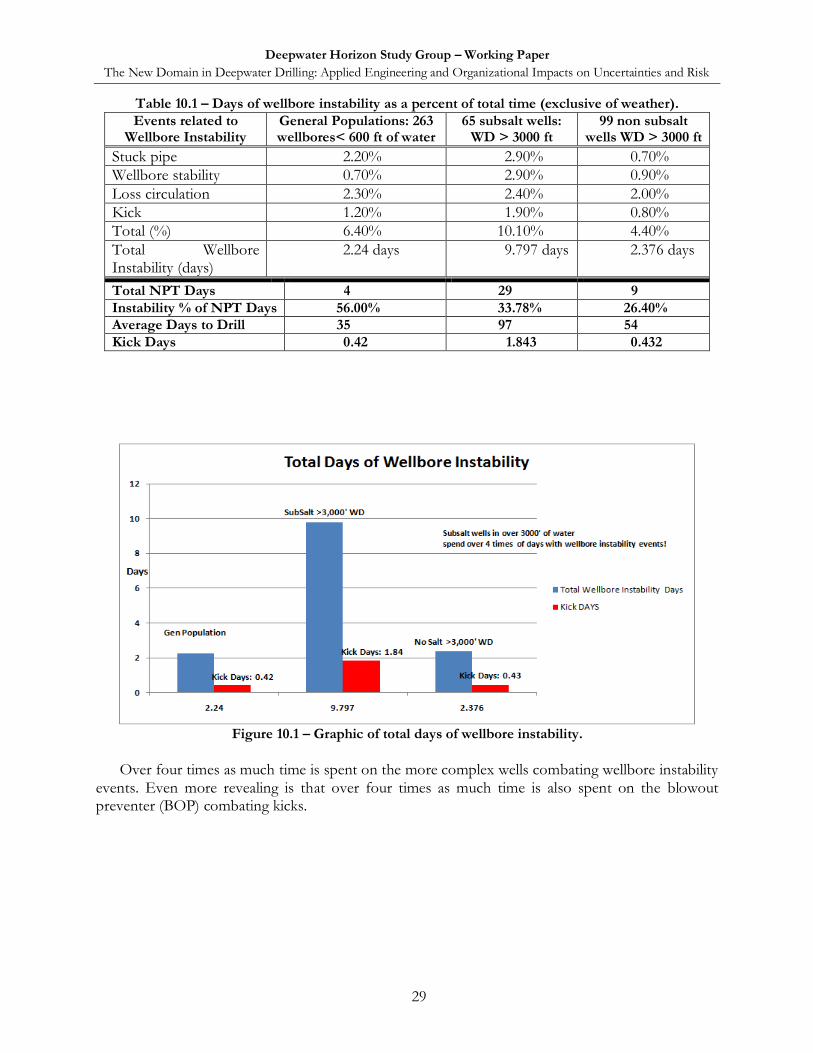
Figure 10.2 – NPT for 263 wells drilled in less than 600 ft of water.xxii
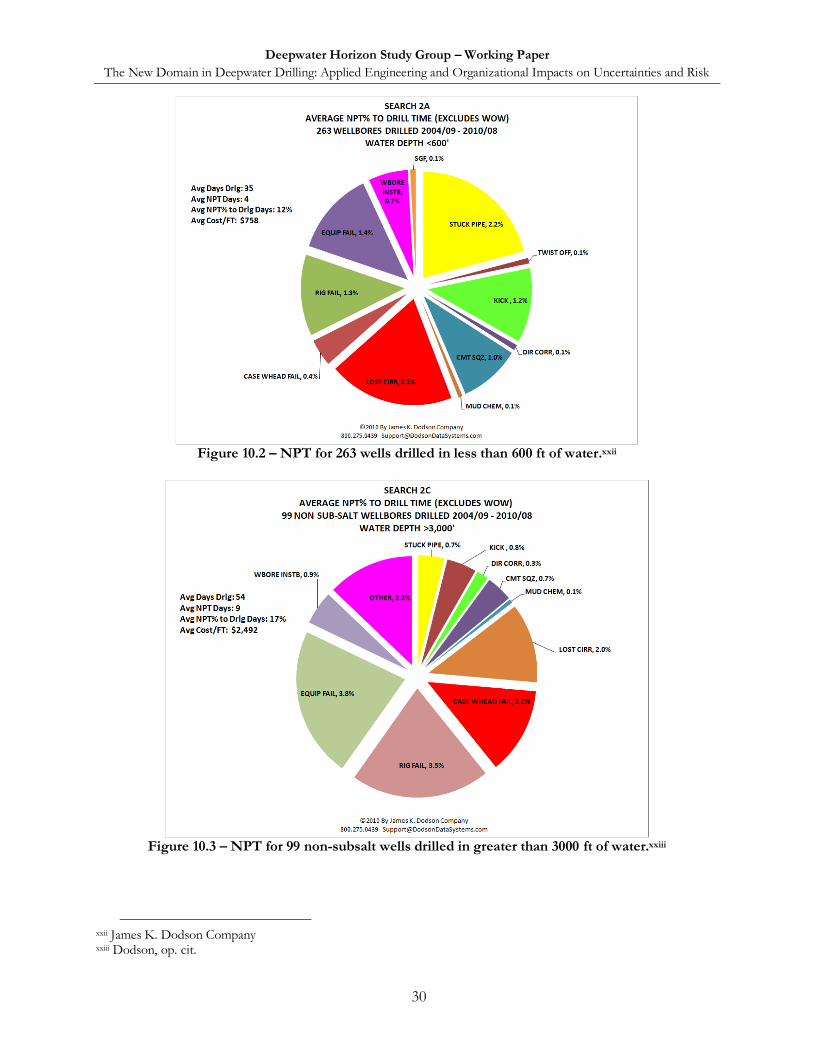
Figure 10.3 – NPT for 99 non-subsalt wells drilled in greater than 3000 ft of water.xxiii
xxii James K. Dodson Company xxiii Dodson, op. cit.
Deepwater Horizon Study Group – Working Paper
The New Domain in Deepwater Drilling: Applied Engineering and Organizational Impacts on Uncertainties and Risk
31
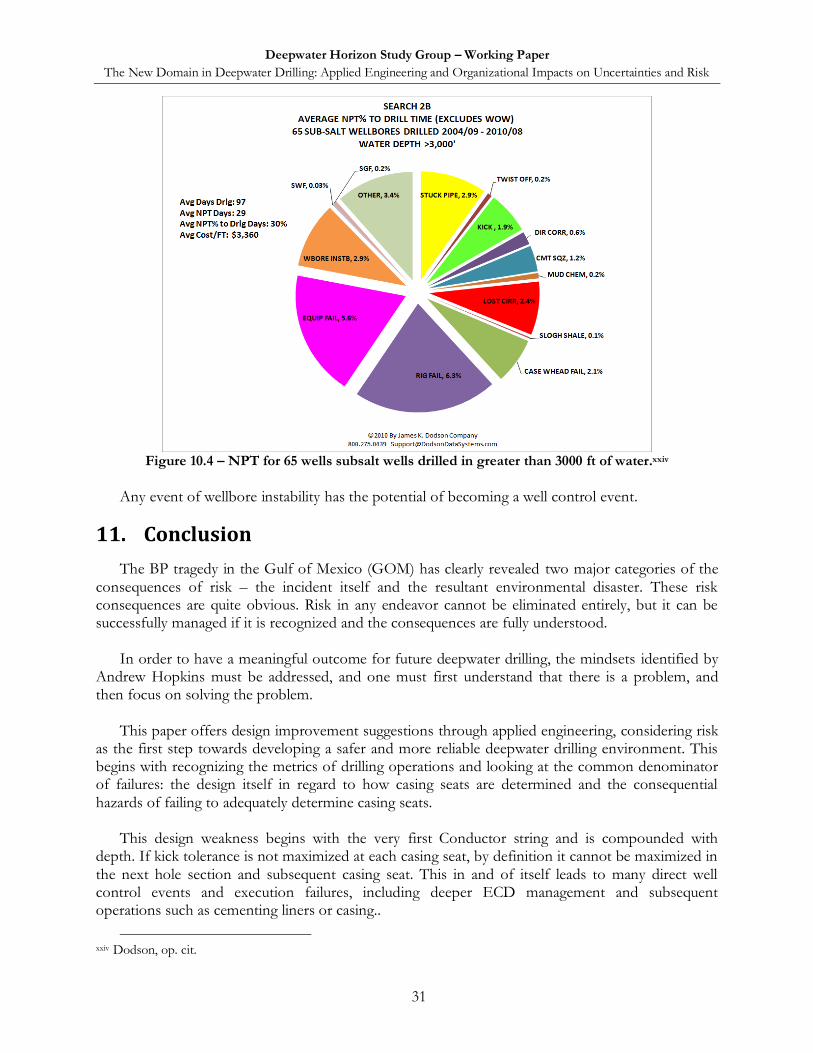
Figure 10.4 – NPT for 65 wells subsalt wells drilled in greater than 3000 ft of water.xxiv
Any event of wellbore instability has the potential of becoming a well control event.
11. Conclusion
The BP tragedy in the Gulf of Mexico (GOM) has clearly revealed two major categories of the consequences of risk – the incident itself and the resultant environmental disaster. These risk consequences are quite obvious. Risk in any endeavor cannot be eliminated entirely, but it can be successfully managed if it is recognized and the consequences are fully understood.
In order to have a meaningful outcome for future deepwater drilling, the mindsets identified by
Andrew Hopkins must be addressed, and one must first understand that there is a problem, and then focus on solving the problem.
This paper offers design improvement suggestions through applied engineering, considering risk
as the first step towards developing a safer and more reliable deepwater drilling environment. This begins with recognizing the metrics of drilling operations and looking at the common denominator of failures: the design itself in regard to how casing seats are determined and the consequential hazards of failing to adequately determine casing seats.
This design weakness begins with the very first Conductor string and is compounded with
depth. If kick tolerance is not maximized at each casing seat, by definition it cannot be maximized in the next hole section and subsequent casing seat. This in and of itself leads to many direct well control events and execution failures, including deeper ECD management and subsequent operations such as cementing liners or casing..
xxiv Dodson, op. cit.
Deepwater Horizon Study Group – Working Paper
The New Domain in Deepwater Drilling: Applied Engineering and Organizational Impacts on Uncertainties and Risk
32
Industry efforts to tweak execution systems include enlarging the well hole, fluids
improvements, and efforts to improve critical issues like ECD management in these difficult narrow margin drilling environments. Although some industry professionals will disagree with how risk should be managed, the failure to recognize the design as critical to the facts of the metrics denies what a high-performance, high-reliability organization should represent.
Avoiding a repeat of the current situation and changing the climate of denial can be achieved
with a dose of common sense. Solutions must consider and actively apply the following:
look at the facts of the metrics in context of well complexity,
work together and collaborate as an industry,
recognize where the problems really are and address them from a risk management perspective, and
focus on solving those problems and work with regulators to focus on the solutions.
The current design model must be challenged. Sound and unbiased engineering design is the
fundamental precursor to safety, sustained success and full life cycle reliability. If we solve the problem wells, then by definition of risk management, the rest of the well population is mitigated.
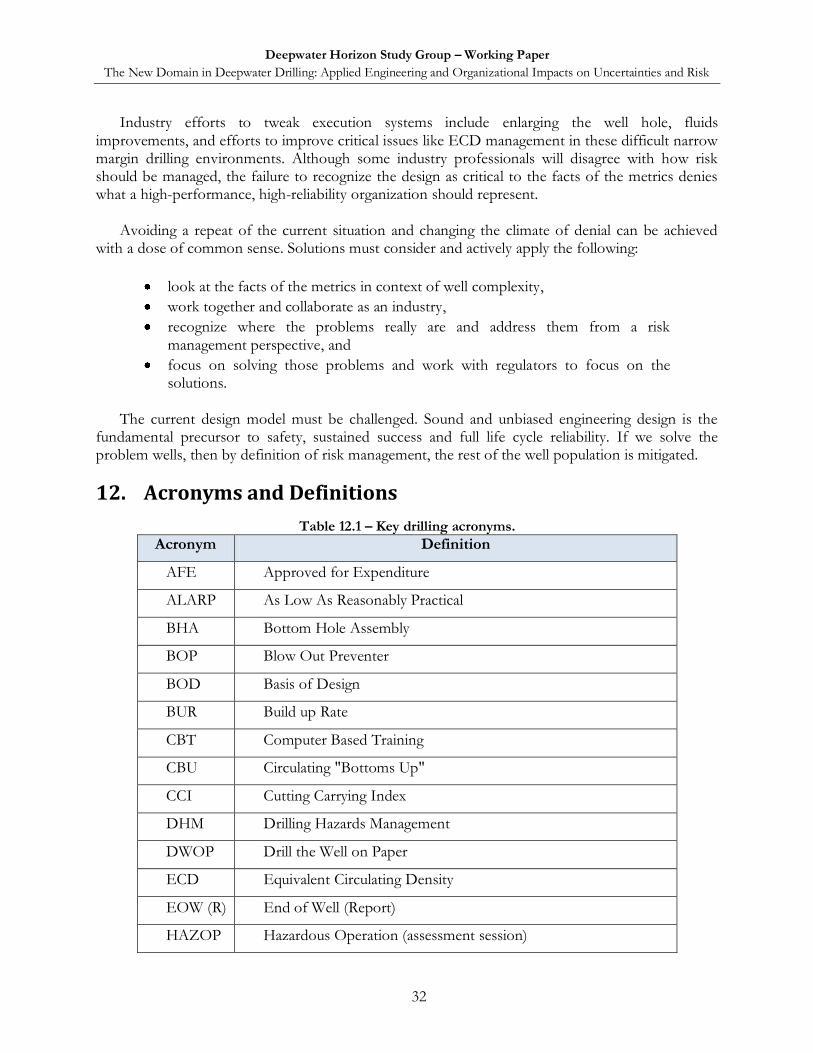
12. Acronyms and Definitions
Table 12.1 – Key drilling acronyms.
Acronym Definition
AFE Approved for Expenditure
ALARP As Low As Reasonably Practical
BHA Bottom Hole Assembly
BOP Blow Out Preventer
BOD Basis of Design
BUR Build up Rate
CBT Computer Based Training
CBU Circulating "Bottoms Up"
CCI Cutting Carrying Index
DHM Drilling Hazards Management
DWOP Drill the Well on Paper
ECD Equivalent Circulating Density
EOW (R) End of Well (Report)
HAZOP Hazardous Operation (assessment session)
Deepwater Horizon Study Group – Working Paper
The New Domain in Deepwater Drilling: Applied Engineering and Organizational Impacts on Uncertainties and Risk
33
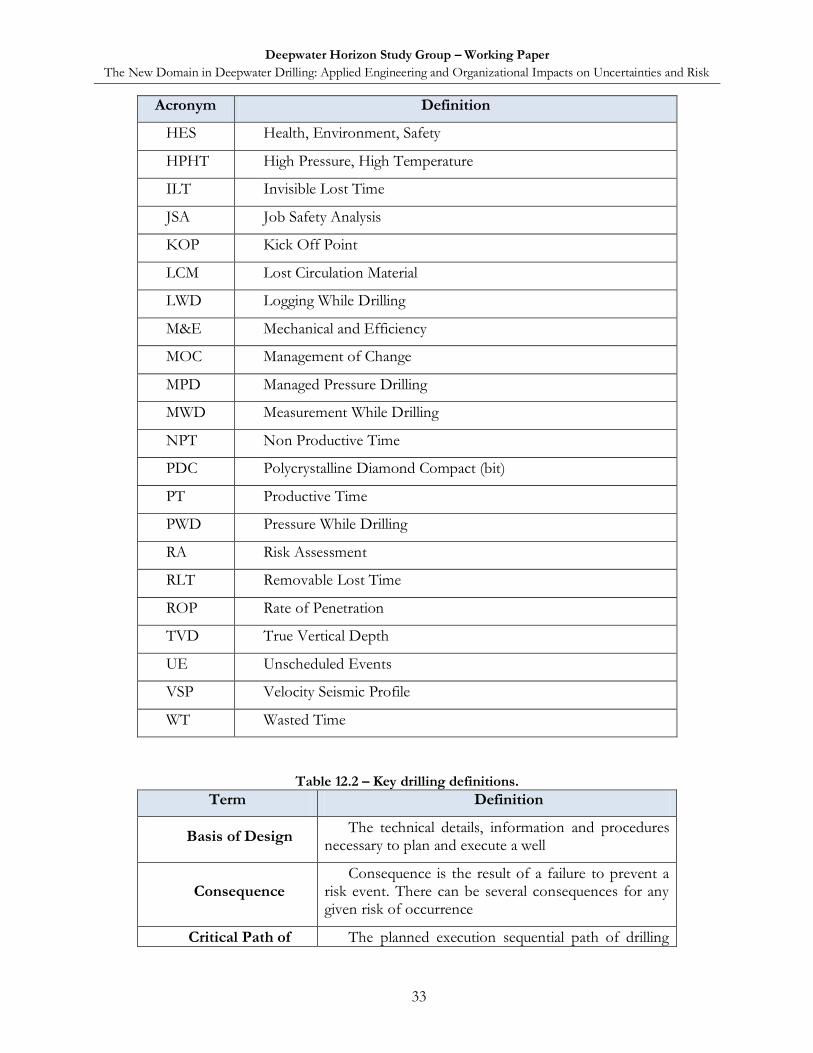
Acronym Definition
HES Health, Environment, Safety
HPHT High Pressure, High Temperature
ILT Invisible Lost Time
JSA Job Safety Analysis
KOP Kick Off Point
LCM Lost Circulation Material
LWD Logging While Drilling
M&E Mechanical and Efficiency
MOC Management of Change
MPD Managed Pressure Drilling
MWD Measurement While Drilling
NPT Non Productive Time
PDC Polycrystalline Diamond Compact (bit)
PT Productive Time
PWD Pressure While Drilling
RA Risk Assessment
RLT Removable Lost Time
ROP Rate of Penetration
TVD True Vertical Depth
UE Unscheduled Events
VSP Velocity Seismic Profile
WT Wasted Time
Table 12.2 – Key drilling definitions.
Term Definition
Basis of Design The technical details, information and procedures
necessary to plan and execute a well
Consequence Consequence is the result of a failure to prevent a
risk event. There can be several consequences for any given risk of occurrence
Critical Path of The planned execution sequential path of drilling
Deepwater Horizon Study Group – Working Paper
The New Domain in Deepwater Drilling: Applied Engineering and Organizational Impacts on Uncertainties and Risk
34
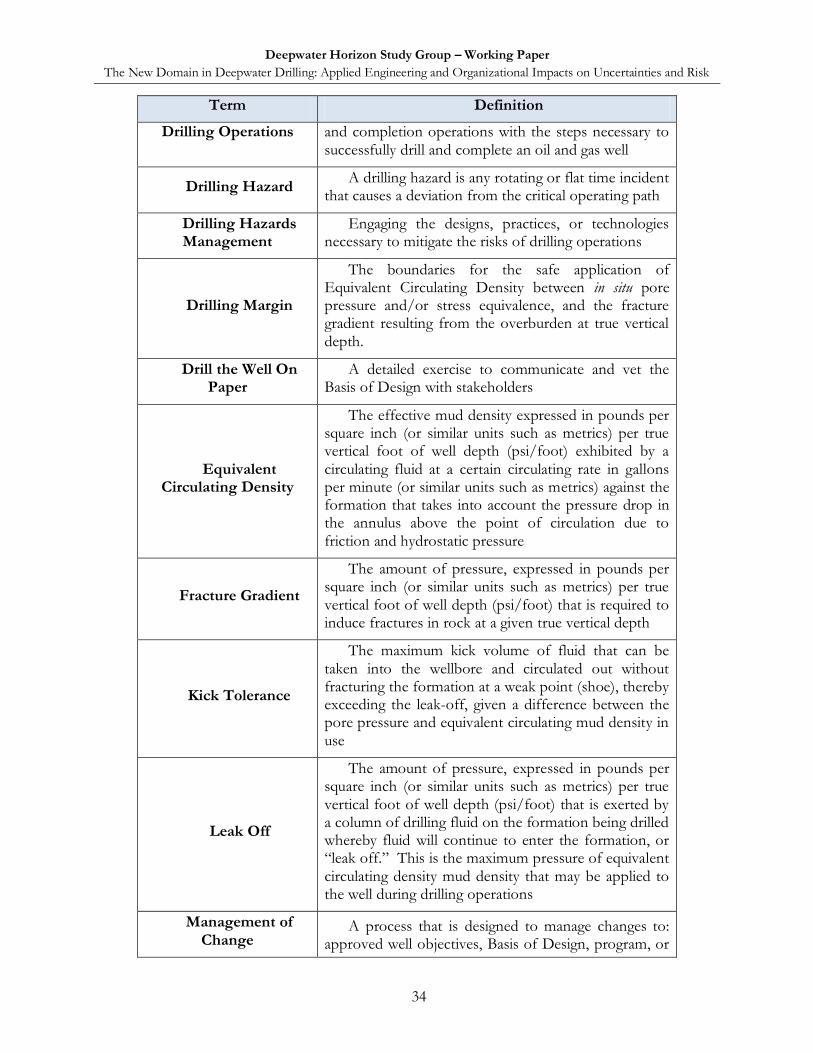
Term Definition
Drilling Operations and completion operations with the steps necessary to successfully drill and complete an oil and gas well
Drilling Hazard A drilling hazard is any rotating or flat time incident
that causes a deviation from the critical operating path
Drilling Hazards Management
Engaging the designs, practices, or technologies necessary to mitigate the risks of drilling operations
Drilling Margin
The boundaries for the safe application of Equivalent Circulating Density between in situ pore pressure and/or stress equivalence, and the fracture gradient resulting from the overburden at true vertical depth.
Drill the Well On Paper
A detailed exercise to communicate and vet the Basis of Design with stakeholders
Equivalent Circulating Density
The effective mud density expressed in pounds per square inch (or similar units such as metrics) per true vertical foot of well depth (psi/foot) exhibited by a circulating fluid at a certain circulating rate in gallons per minute (or similar units such as metrics) against the formation that takes into account the pressure drop in the annulus above the point of circulation due to friction and hydrostatic pressure
Fracture Gradient
The amount of pressure, expressed in pounds per square inch (or similar units such as metrics) per true vertical foot of well depth (psi/foot) that is required to induce fractures in rock at a given true vertical depth
Kick Tolerance
The maximum kick volume of fluid that can be taken into the wellbore and circulated out without fracturing the formation at a weak point (shoe), thereby exceeding the leak-off, given a difference between the pore pressure and equivalent circulating mud density in use
Leak Off
The amount of pressure, expressed in pounds per square inch (or similar units such as metrics) per true vertical foot of well depth (psi/foot) that is exerted by a column of drilling fluid on the formation being drilled whereby fluid will continue to enter the formation, or “leak off.” This is the maximum pressure of equivalent circulating density mud density that may be applied to the well during drilling operations
Management of Change
A process that is designed to manage changes to: approved well objectives, Basis of Design, program, or
Deepwater Horizon Study Group – Working Paper
The New Domain in Deepwater Drilling: Applied Engineering and Organizational Impacts on Uncertainties and Risk
35
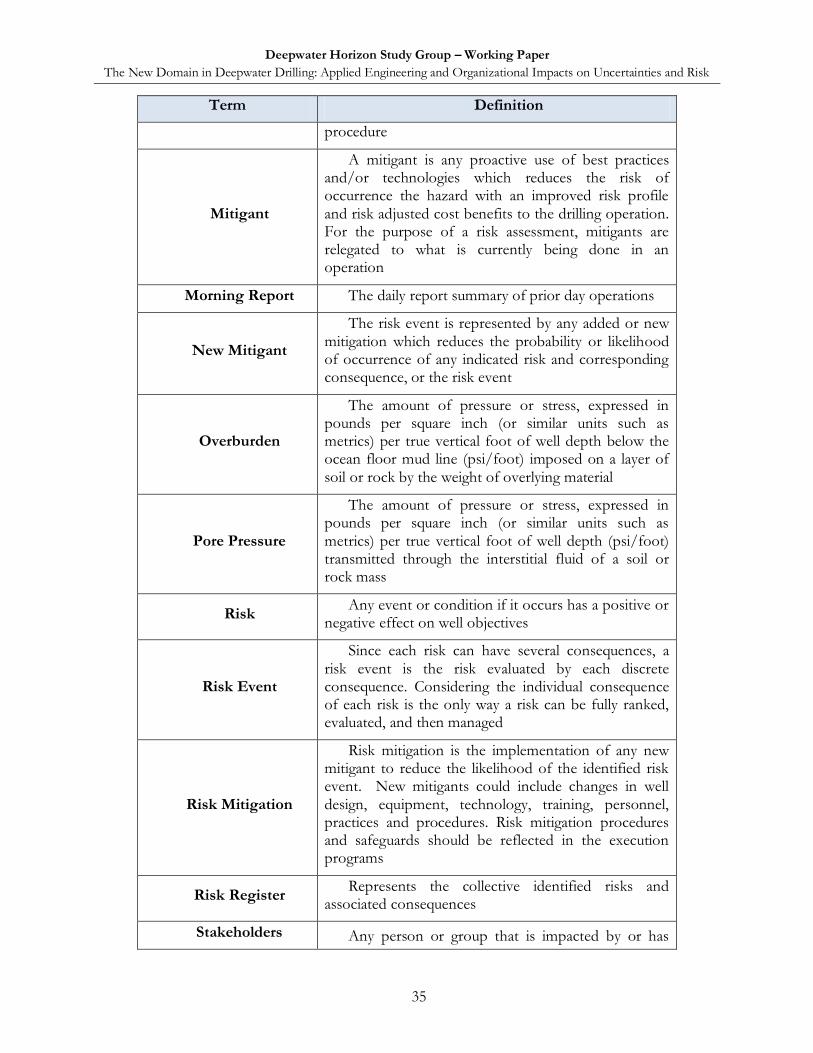
Term Definition
procedure
Mitigant
A mitigant is any proactive use of best practices and/or technologies which reduces the risk of occurrence the hazard with an improved risk profile and risk adjusted cost benefits to the drilling operation. For the purpose of a risk assessment, mitigants are relegated to what is currently being done in an operation
Morning Report The daily report summary of prior day operations
New Mitigant
The risk event is represented by any added or new mitigation which reduces the probability or likelihood of occurrence of any indicated risk and corresponding consequence, or the risk event
Overburden
The amount of pressure or stress, expressed in pounds per square inch (or similar units such as metrics) per true vertical foot of well depth below the ocean floor mud line (psi/foot) imposed on a layer of soil or rock by the weight of overlying material
Pore Pressure
The amount of pressure or stress, expressed in pounds per square inch (or similar units such as metrics) per true vertical foot of well depth (psi/foot) transmitted through the interstitial fluid of a soil or rock mass
Risk Any event or condition if it occurs has a positive or
negative effect on well objectives
Risk Event
Since each risk can have several consequences, a risk event is the risk evaluated by each discrete consequence. Considering the individual consequence of each risk is the only way a risk can be fully ranked, evaluated, and then managed
Risk Mitigation
Risk mitigation is the implementation of any new mitigant to reduce the likelihood of the identified risk event. New mitigants could include changes in well design, equipment, technology, training, personnel, practices and procedures. Risk mitigation procedures and safeguards should be reflected in the execution programs
Risk Register Represents the collective identified risks and
associated consequences
Stakeholders Any person or group that is impacted by or has
Deepwater Horizon Study Group – Working Paper
The New Domain in Deepwater Drilling: Applied Engineering and Organizational Impacts on Uncertainties and Risk
36
Term Definition
influence on an opportunity or decision
Sucrosic The pore spaces within sand grains – like “sugar”
as a comparison.
Toolbox Meeting Routine meetings with rig crews and service
provider t discuss forward activities.
Tripping The practice of removing drilling tools from the
hole to the surface and back
Uncertainty Any unknown as it relates to the well construction
process
Vuggy Large pore spaces in limestone typically leached
over time.
13. References
1. David Pritchard and Kenneth Kotow, “Deepwater Well Complexity: The New Domain,”
DHSG White Paper, Successful Energy Practices International, LLC, September 2010. 2. Andrew Hopkins, biography, http://www.professorandrewhopkins.com/biography. 3. J.C. Cunha, Drilling Management, Society of Petroleum Engineers, JPT, September 2010, 72., 4. David M. Pritchard, et al., “Drilling Hazard Management: Excellent performance begins with
planning,” World Oil, August 2010. 5. David Hammer, “5 key human errors, colossal mechanical failure led to fatal Gulf oil rig
blowout,” The Times Picayune, September 5, 2010. 6. Totte Lager and Terje Magnussen, “The Deepwater Horizon accident on well “Macondo #1,”
Acona Wellpro, Mini Seminar, August, 2010, http://www.aconawellpro.com/@api/deki/files/251/=MiniSeminar_Macondo_August_2010.pdf.
7. Wikipedia, “Deepwater Horizon Explosion,” http://en.wikipedia.org/wiki/Deepwater_Horizon_explosion.
8. Ben Casselman and Siobhan Hughes, “Contractor Accused of Flawed Job on Rig,” Wall Street Journal, October 29, 2010, http://online.wsj.com/article/SB10001424052702303362404575580420328930294.html?mod=ITP_pageone_0#project%3DOILRIGS1004%26articleTabs%3Darticle.
9. David Hammer, “6 Fateful Missteps,” The Times Picayune, New Orleans, LA, September 5, 2010.
10. Paul Parsons, “The Macondo Well,” Energy Training Resources, LLC, July 15, 2010, https://www.energytrainingresources.com/data/default/content/Macondo.pdf.
11. Pritchard, Kotow, op. cit. 12. Kenneth Kotow and David Pritchard, “Casing Optimization and Riserless Drilling,” OTC, May
2009. 13. B. W. Swanson, et al., “Measurement of Hydrostatic and Hydraulic Pressure Changes During
HPHT Drilling on Erskine Field,” Society of Petroleum Engineers, Offshore Europe, September 9-12, 1997.