Embed Size (px)
Citation preview
Category Report
CustomerRelationshipManagement
NUMBER OF REVIEWS
713NUMBER OF VENDORSEVALUATED
6REPORT GENERATED
March 2018
Metrix CRM
SNAP CRM
Power Sync CRM
Pederson Client Management
Solution
VineCRM
Cascade CRM
Customer Relationship Management Category Report
Table ofContentsData Quadrant.................................................................................................................. 4
Category Overview ......................................................................................................5
Vendor Capability Summary ................................................................................ 6
Vendor Capabilities.......................................................................................................7
Product Feature Summary ...................................................................................13
Product Features ..........................................................................................................14
Emotional Footprint Summary .......................................................................20
Emotional Footprint.................................................................................................. 21
How to Use the ReportInfo-Tech’s Category Reports provide a comprehensive evaluation of popular products in theCustomer Relationship Management market. This buyer’s guide is designed to help prospectivepurchasers make better decisions by leveraging the experiences of real users.
The data in this report is collected from real end users, meticulously verified for veracity,exhaustively analyzed, and visualized in easy to understand charts and graphs. Each product iscompared and contrasted with all other vendors in their category to create a holistic, unbiased viewof the product landscape.
Use this report to determine which product is right for your organization. For highly detailed reportson individual products, see Info-Tech’s Product Scorecard.
2
Category Report
SoftwareDirectoryCUSTOMER RELATIONSHIPMANAGEMENT SOFTWARE
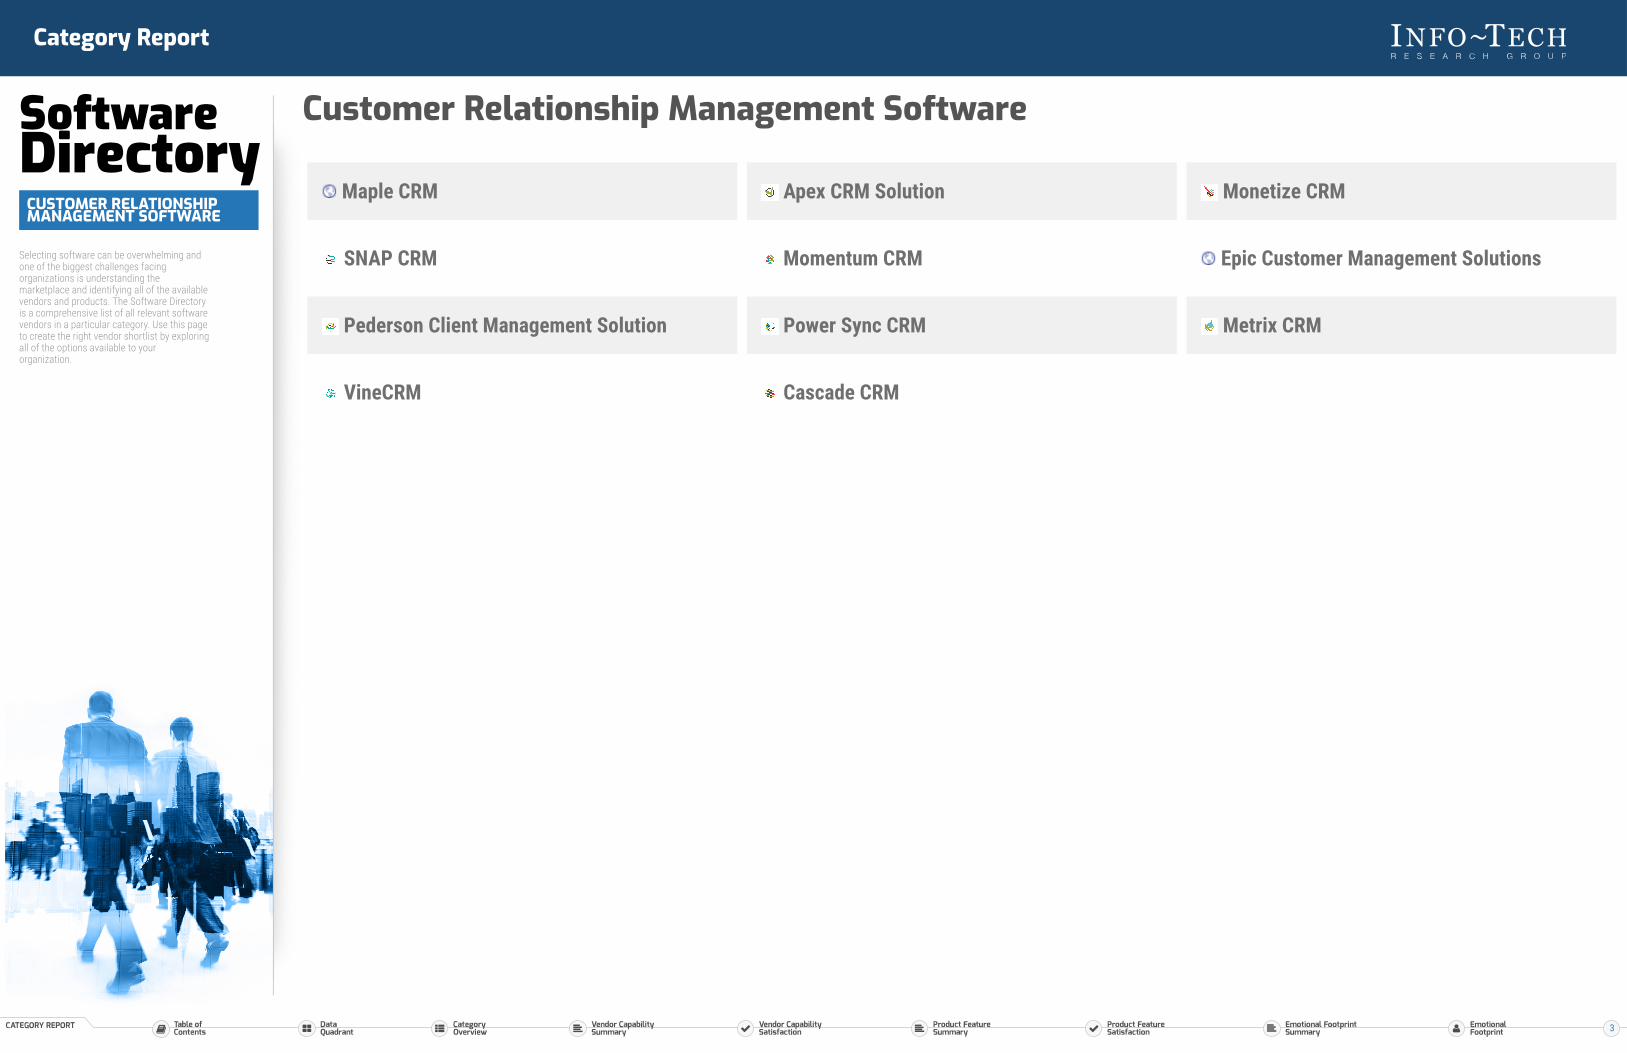
Selecting software can be overwhelming andone of the biggest challenges facingorganizations is understanding themarketplace and identifying all of the availablevendors and products. The Software Directoryis a comprehensive list of all relevant softwarevendors in a particular category. Use this pageto create the right vendor shortlist by exploringall of the options available to yourorganization.
Customer Relationship Management Software
Maple CRM Apex CRM Solution Monetize CRM
SNAP CRM Momentum CRM Epic Customer Management Solutions
Pederson Client Management Solution Power Sync CRM Metrix CRM
VineCRM Cascade CRM
3
Customer Relationship Management Category Report
SOFTWARE REVIEWS
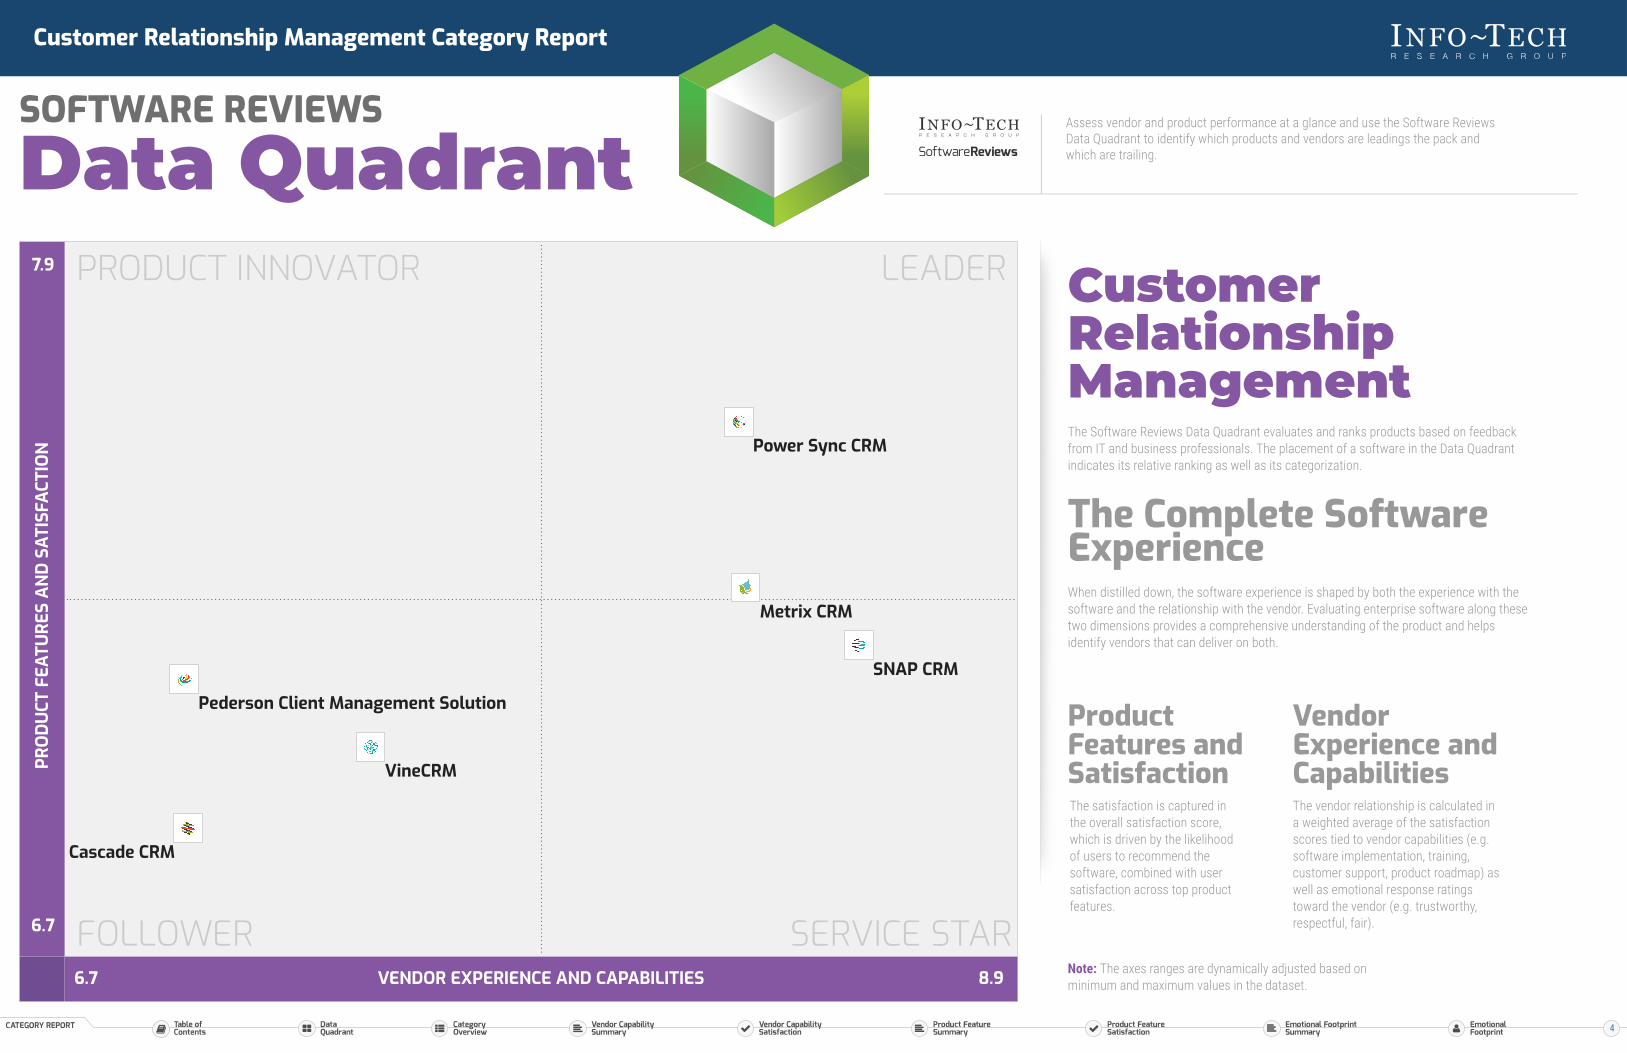
Data QuadrantAssess vendor and product performance at a glance and use the Software ReviewsData Quadrant to identify which products and vendors are leadings the pack andwhich are trailing.
PRO
DUCT
FEA
TURE
S AN
D SA
TISF
ACTI
ON
6.7
7.9
VENDOR EXPERIENCE AND CAPABILITIES6.7 8.9
PRODUCT INNOVATOR
FOLLOWER
LEADER
SERVICE STAR
SNAP CRM
Metrix CRM
Power Sync CRM
VineCRM
Cascade CRM
Pederson Client Management Solution
CustomerRelationshipManagementThe Software Reviews Data Quadrant evaluates and ranks products based on feedbackfrom IT and business professionals. The placement of a software in the Data Quadrantindicates its relative ranking as well as its categorization.
The Complete SoftwareExperienceWhen distilled down, the software experience is shaped by both the experience with thesoftware and the relationship with the vendor. Evaluating enterprise software along thesetwo dimensions provides a comprehensive understanding of the product and helpsidentify vendors that can deliver on both.
ProductFeatures andSatisfactionThe satisfaction is captured inthe overall satisfaction score,which is driven by the likelihoodof users to recommend thesoftware, combined with usersatisfaction across top productfeatures.
VendorExperience andCapabilitiesThe vendor relationship is calculated ina weighted average of the satisfactionscores tied to vendor capabilities (e.g.software implementation, training,customer support, product roadmap) aswell as emotional response ratingstoward the vendor (e.g. trustworthy,respectful, fair).
Note: The axes ranges are dynamically adjusted based onminimum and maximum values in the dataset.
4
Customer Relationship Management Category Report
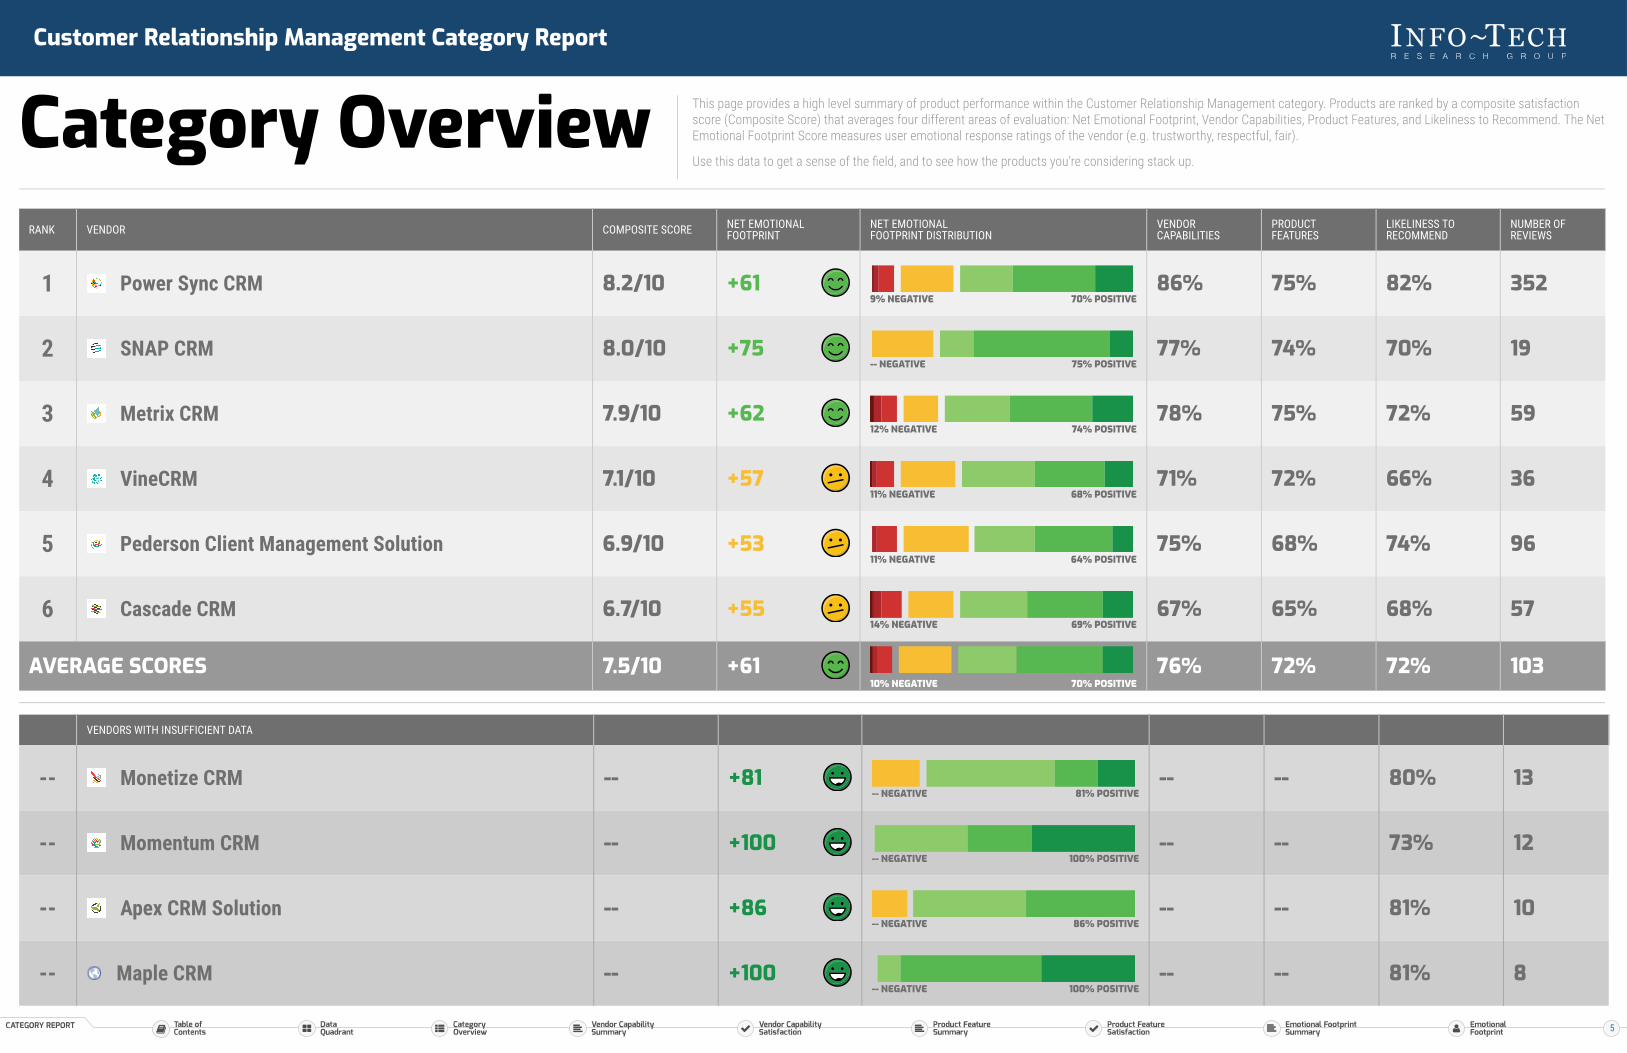
Category Overview This page provides a high level summary of product performance within the Customer Relationship Management category. Products are ranked by a composite satisfactionscore (Composite Score) that averages four different areas of evaluation: Net Emotional Footprint, Vendor Capabilities, Product Features, and Likeliness to Recommend. The NetEmotional Footprint Score measures user emotional response ratings of the vendor (e.g. trustworthy, respectful, fair).
Use this data to get a sense of the field, and to see how the products you’re considering stack up.
RANK VENDOR COMPOSITE SCORE NET EMOTIONALFOOTPRINT
NET EMOTIONALFOOTPRINT DISTRIBUTION
VENDORCAPABILITIES
PRODUCTFEATURES
LIKELINESS TORECOMMEND
NUMBER OFREVIEWS
1 Power Sync CRM 8.2/10 +619% NEGATIVE 70% POSITIVE
86% 75% 82% 352
2 SNAP CRM 8.0/10 +75-- NEGATIVE 75% POSITIVE
77% 74% 70% 19
3 Metrix CRM 7.9/10 +6212% NEGATIVE 74% POSITIVE
78% 75% 72% 59
4 VineCRM 7.1/10 +5711% NEGATIVE 68% POSITIVE
71% 72% 66% 36
5 Pederson Client Management Solution 6.9/10 +5311% NEGATIVE 64% POSITIVE
75% 68% 74% 96
6 Cascade CRM 6.7/10 +5514% NEGATIVE 69% POSITIVE
67% 65% 68% 57
AVERAGE SCORES 7.5/10 +6110% NEGATIVE 70% POSITIVE
76% 72% 72% 103
VENDORS WITH INSUFFICIENT DATA
-- Monetize CRM -- +81-- NEGATIVE 81% POSITIVE
-- -- 80% 13
-- Momentum CRM -- +100-- NEGATIVE 100% POSITIVE
-- -- 73% 12
-- Apex CRM Solution -- +86-- NEGATIVE 86% POSITIVE
-- -- 81% 10
-- Maple CRM -- +100-- NEGATIVE 100% POSITIVE
-- -- 81% 8
5
Customer Relationship Management Category Report
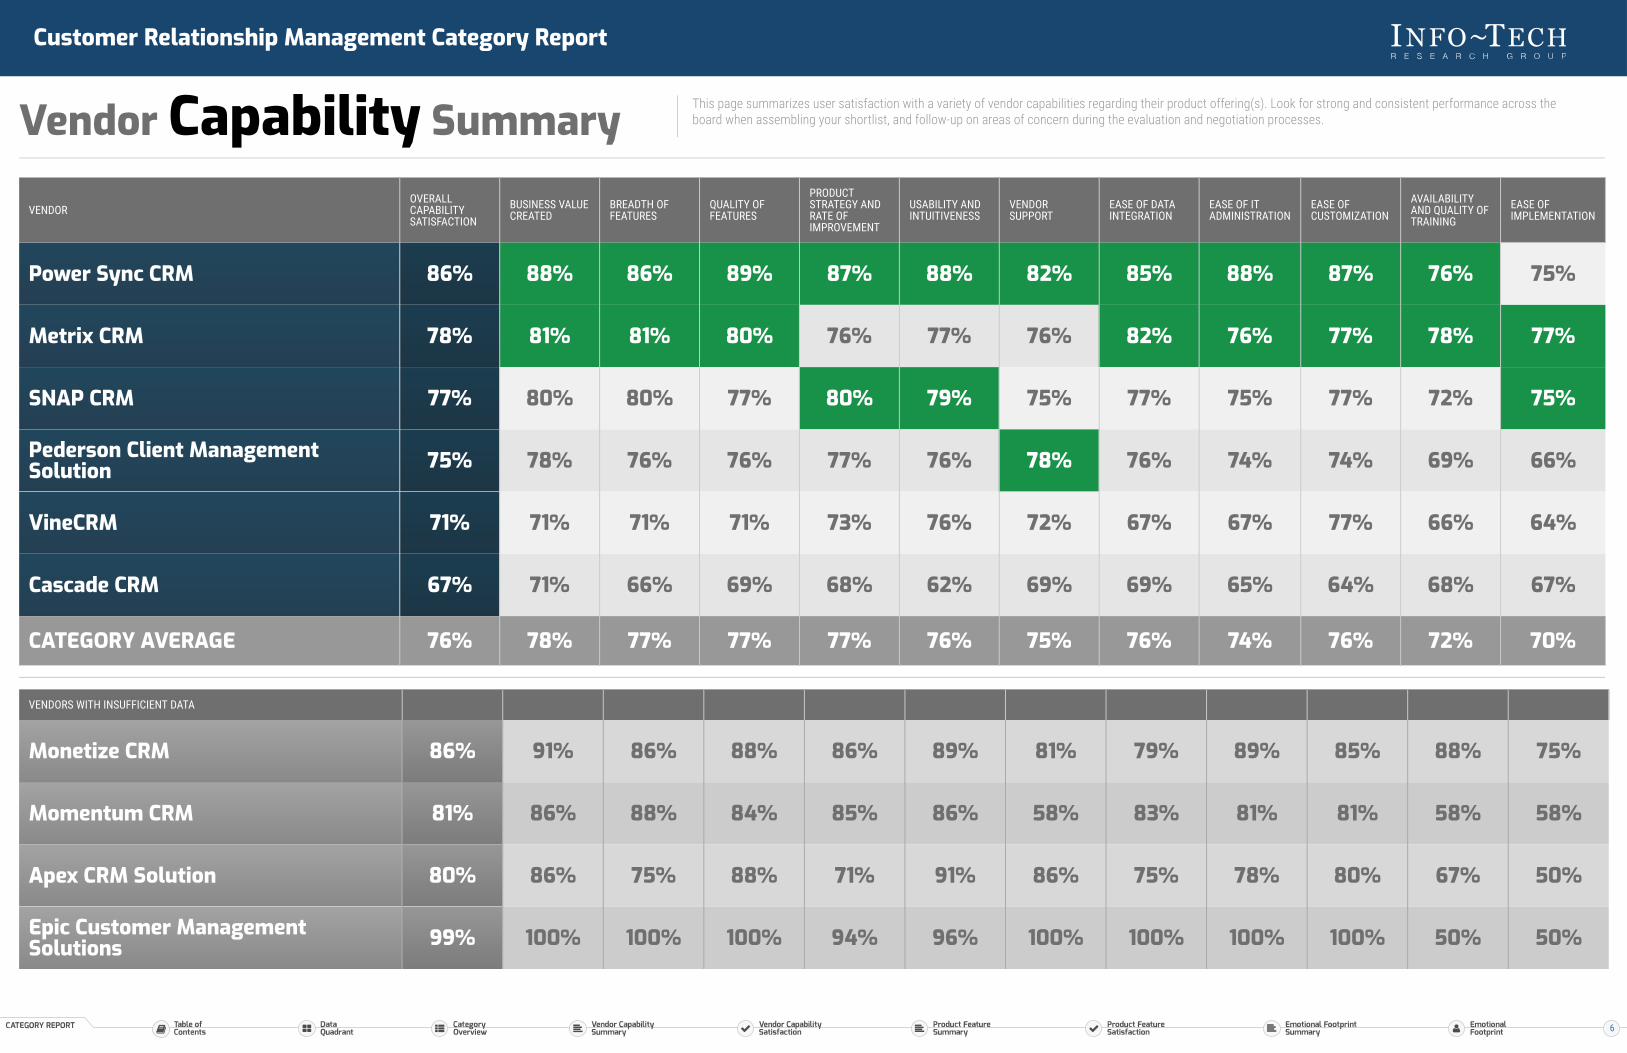
Vendor Capability Summary This page summarizes user satisfaction with a variety of vendor capabilities regarding their product offering(s). Look for strong and consistent performance across theboard when assembling your shortlist, and follow-up on areas of concern during the evaluation and negotiation processes.
VENDOROVERALLCAPABILITYSATISFACTION
BUSINESS VALUECREATED
BREADTH OFFEATURES
QUALITY OFFEATURES
PRODUCTSTRATEGY ANDRATE OFIMPROVEMENT
USABILITY ANDINTUITIVENESS
VENDORSUPPORT
EASE OF DATAINTEGRATION
EASE OF ITADMINISTRATION
EASE OFCUSTOMIZATION
AVAILABILITYAND QUALITY OFTRAINING
EASE OFIMPLEMENTATION
Power Sync CRM 86% 88% 86% 89% 87% 88% 82% 85% 88% 87% 76% 75%
Metrix CRM 78% 81% 81% 80% 76% 77% 76% 82% 76% 77% 78% 77%
SNAP CRM 77% 80% 80% 77% 80% 79% 75% 77% 75% 77% 72% 75%
Pederson Client ManagementSolution 75% 78% 76% 76% 77% 76% 78% 76% 74% 74% 69% 66%
VineCRM 71% 71% 71% 71% 73% 76% 72% 67% 67% 77% 66% 64%
Cascade CRM 67% 71% 66% 69% 68% 62% 69% 69% 65% 64% 68% 67%
CATEGORY AVERAGE 76% 78% 77% 77% 77% 76% 75% 76% 74% 76% 72% 70%
VENDORS WITH INSUFFICIENT DATA
Monetize CRM 86% 91% 86% 88% 86% 89% 81% 79% 89% 85% 88% 75%
Momentum CRM 81% 86% 88% 84% 85% 86% 58% 83% 81% 81% 58% 58%
Apex CRM Solution 80% 86% 75% 88% 71% 91% 86% 75% 78% 80% 67% 50%
Epic Customer ManagementSolutions 99% 100% 100% 100% 94% 96% 100% 100% 100% 100% 50% 50%
6
Customer Relationship Management Category Report
Vendor Capability Satisfaction This section provides detailed information on user satisfaction for each vendor capability regarding their product offering(s). Use these pages to digdeeper into areas of particular interest or concern.
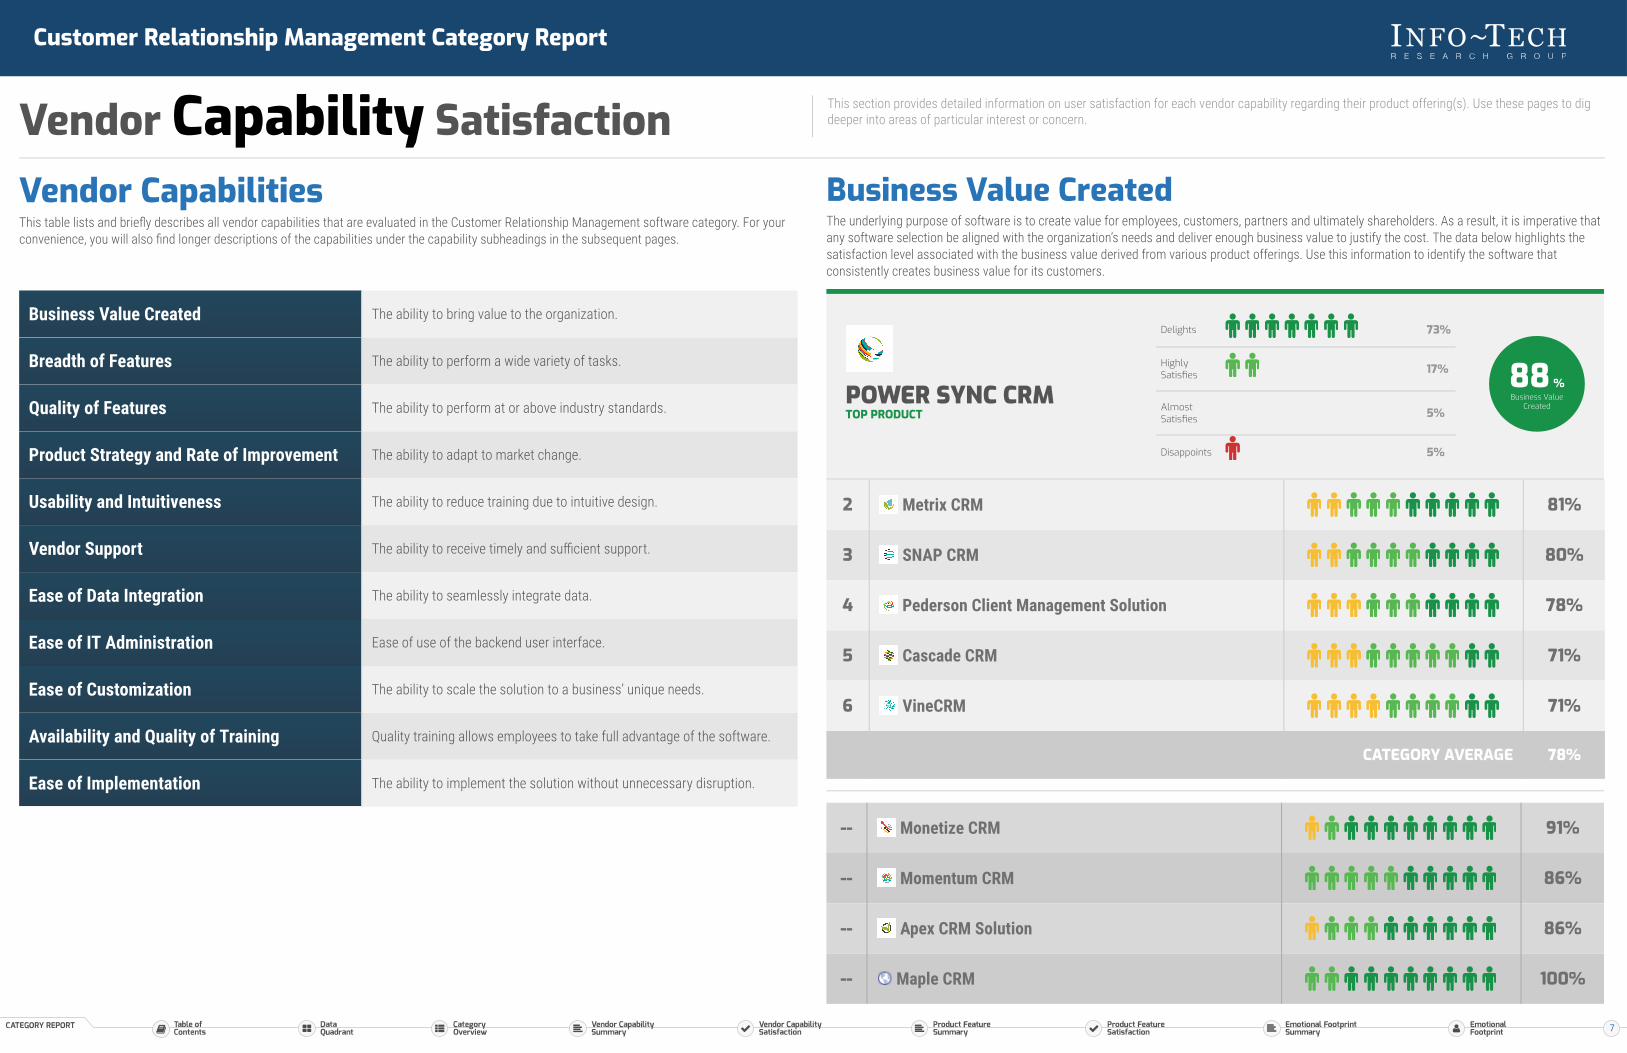
Vendor CapabilitiesThis table lists and briefly describes all vendor capabilities that are evaluated in the Customer Relationship Management software category. For yourconvenience, you will also find longer descriptions of the capabilities under the capability subheadings in the subsequent pages.
Business Value Created The ability to bring value to the organization.
Breadth of Features The ability to perform a wide variety of tasks.
Quality of Features The ability to perform at or above industry standards.
Product Strategy and Rate of Improvement The ability to adapt to market change.
Usability and Intuitiveness The ability to reduce training due to intuitive design.
Vendor Support The ability to receive timely and sufficient support.
Ease of Data Integration The ability to seamlessly integrate data.
Ease of IT Administration Ease of use of the backend user interface.
Ease of Customization The ability to scale the solution to a business’ unique needs.
Availability and Quality of Training Quality training allows employees to take full advantage of the software.
Ease of Implementation The ability to implement the solution without unnecessary disruption.
Business Value CreatedThe underlying purpose of software is to create value for employees, customers, partners and ultimately shareholders. As a result, it is imperative thatany software selection be aligned with the organization’s needs and deliver enough business value to justify the cost. The data below highlights thesatisfaction level associated with the business value derived from various product offerings. Use this information to identify the software thatconsistently creates business value for its customers.
POWER SYNC CRMTOP PRODUCT
Delights 73%
HighlySatisfies 17%
AlmostSatisfies 5%
Disappoints 5%
88 %Business Value
Created
2 Metrix CRM 81%
3 SNAP CRM 80%
4 Pederson Client Management Solution 78%
5 Cascade CRM 71%
6 VineCRM 71%
CATEGORY AVERAGE 78%
-- Monetize CRM 91%
-- Momentum CRM 86%
-- Apex CRM Solution 86%
-- Maple CRM 100%
7
Customer Relationship Management Category Report
Vendor Capability Satisfaction This section provides detailed information on user satisfaction for each vendor capability regarding their product offering(s). Use these pages to digdeeper into areas of particular interest or concern.
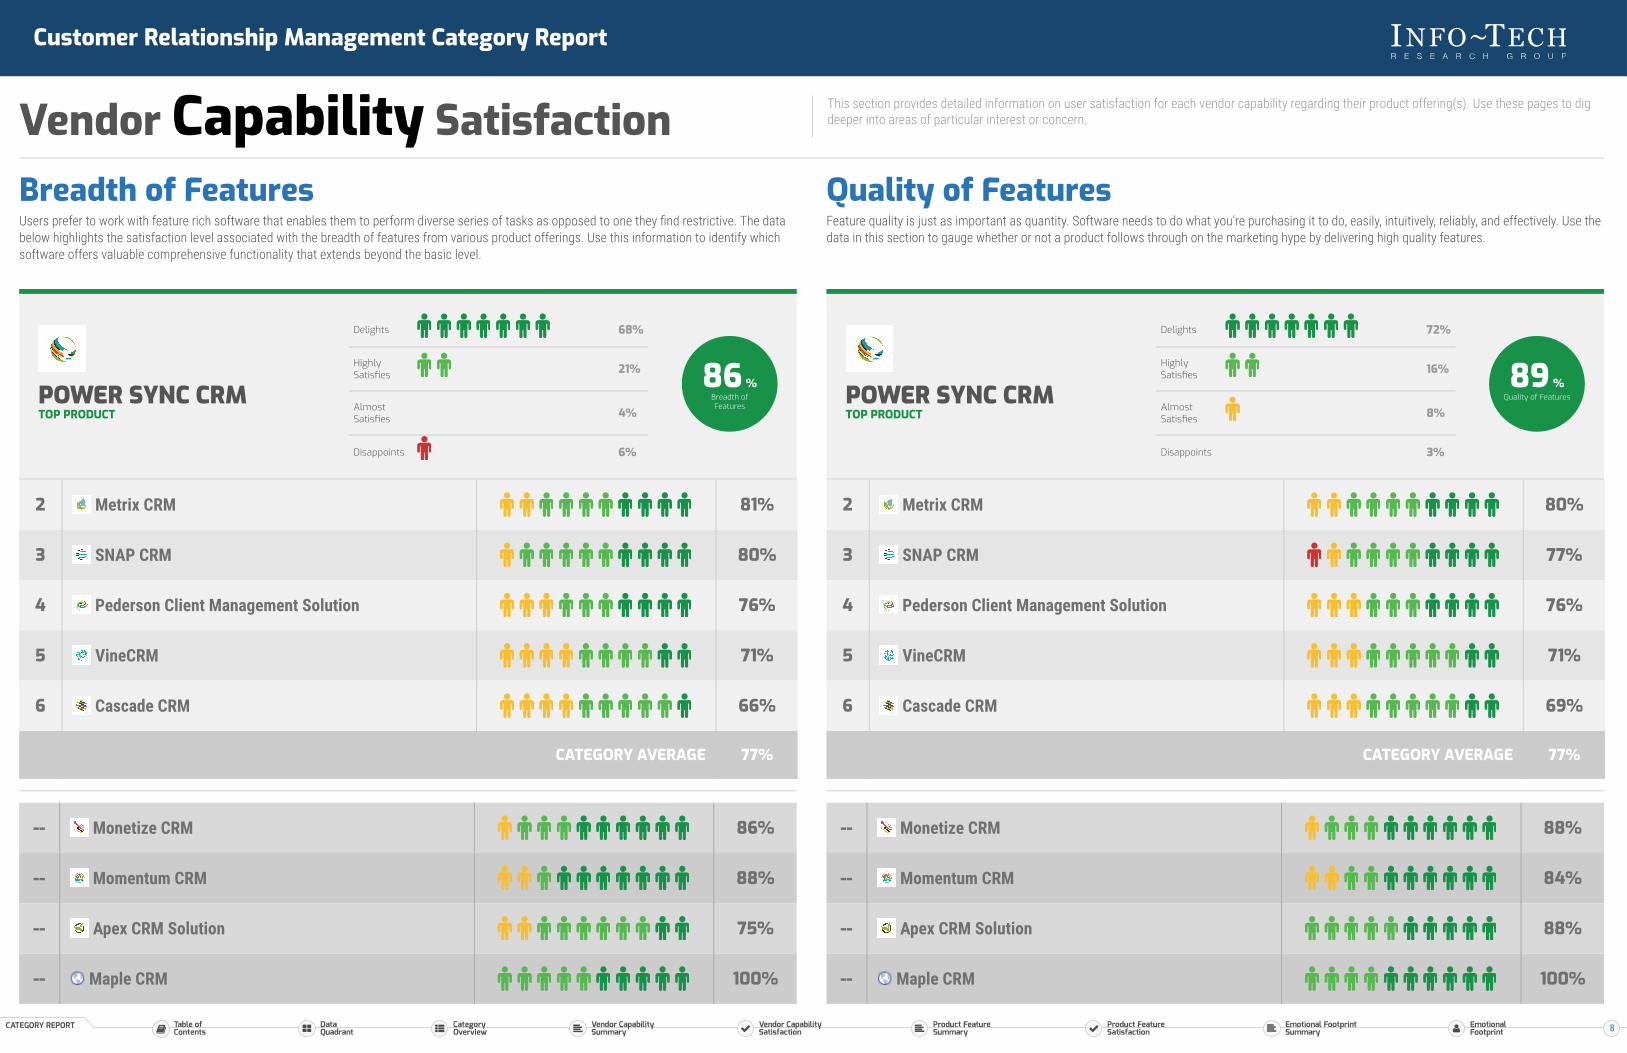
Breadth of FeaturesUsers prefer to work with feature rich software that enables them to perform diverse series of tasks as opposed to one they find restrictive. The databelow highlights the satisfaction level associated with the breadth of features from various product offerings. Use this information to identify whichsoftware offers valuable comprehensive functionality that extends beyond the basic level.
POWER SYNC CRMTOP PRODUCT
Delights 68%
HighlySatisfies 21%
AlmostSatisfies 4%
Disappoints 6%
86 %Breadth ofFeatures
2 Metrix CRM 81%
3 SNAP CRM 80%
4 Pederson Client Management Solution 76%
5 VineCRM 71%
6 Cascade CRM 66%
CATEGORY AVERAGE 77%
-- Monetize CRM 86%
-- Momentum CRM 88%
-- Apex CRM Solution 75%
-- Maple CRM 100%
Quality of FeaturesFeature quality is just as important as quantity. Software needs to do what you’re purchasing it to do, easily, intuitively, reliably, and effectively. Use thedata in this section to gauge whether or not a product follows through on the marketing hype by delivering high quality features.
POWER SYNC CRMTOP PRODUCT
Delights 72%
HighlySatisfies 16%
AlmostSatisfies 8%
Disappoints 3%
89 %Quality of Features
2 Metrix CRM 80%
3 SNAP CRM 77%
4 Pederson Client Management Solution 76%
5 VineCRM 71%
6 Cascade CRM 69%
CATEGORY AVERAGE 77%
-- Monetize CRM 88%
-- Momentum CRM 84%
-- Apex CRM Solution 88%
-- Maple CRM 100%
8
Customer Relationship Management Category Report
Vendor Capability Satisfaction This section provides detailed information on user satisfaction for each vendor capability regarding their product offering(s). Use these pages to digdeeper into areas of particular interest or concern.
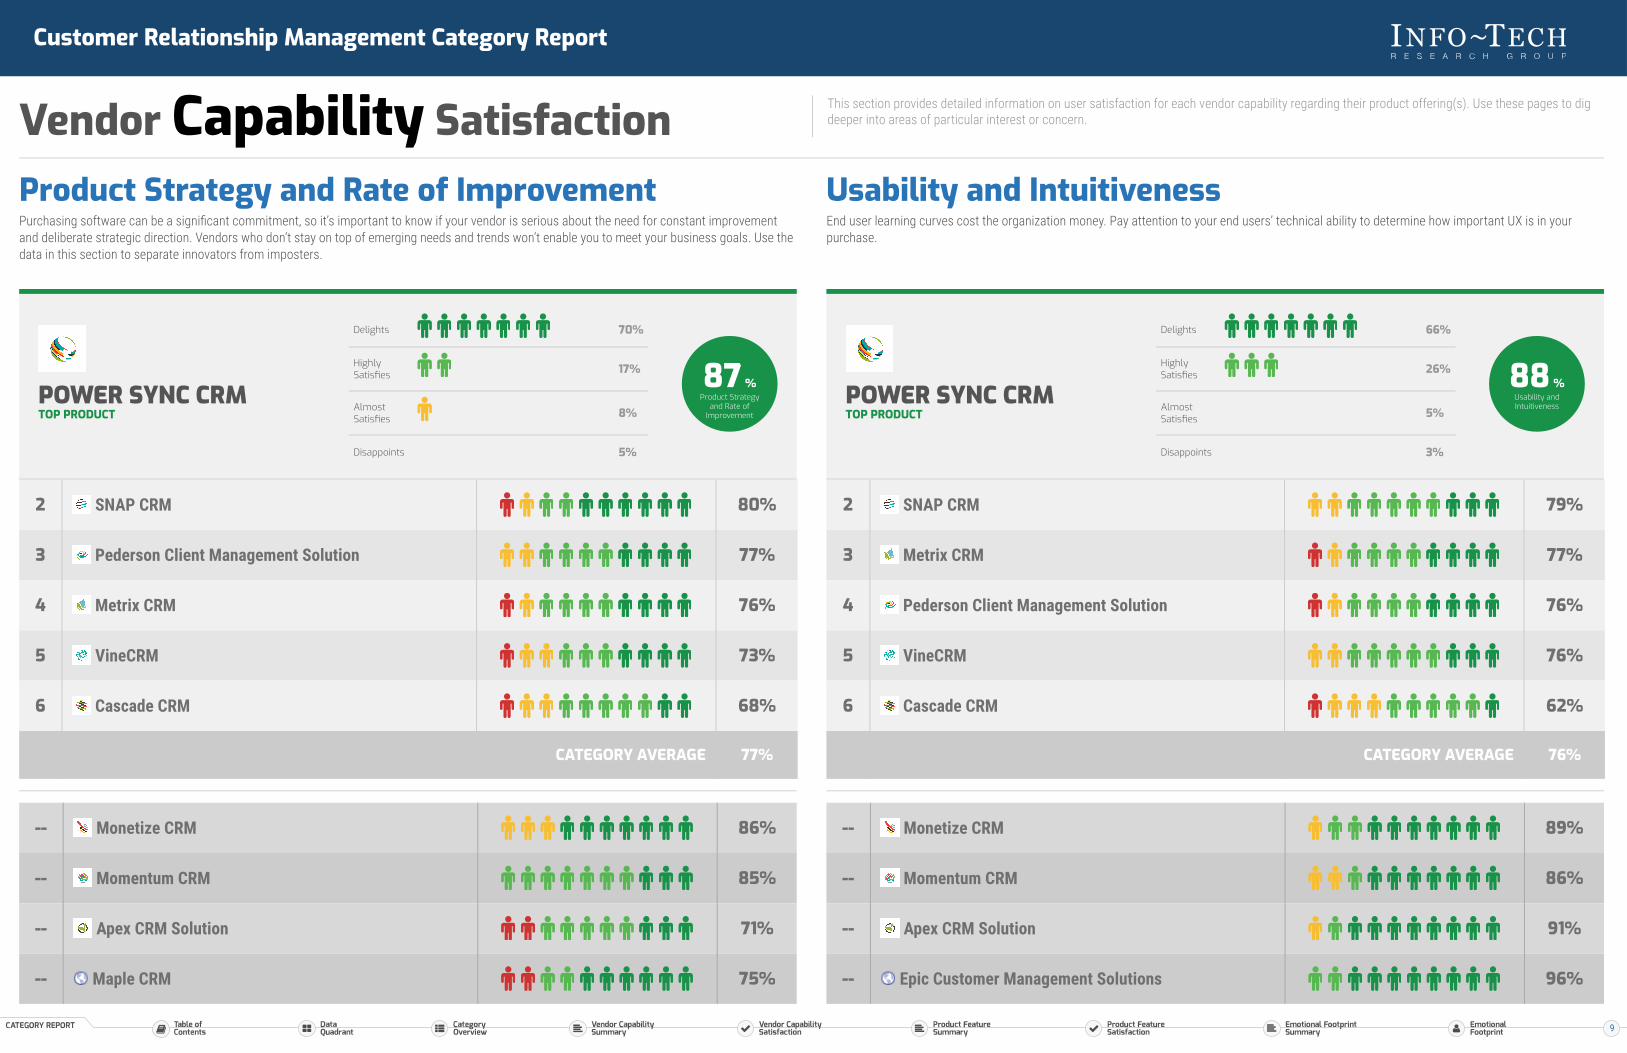
Product Strategy and Rate of ImprovementPurchasing software can be a significant commitment, so it’s important to know if your vendor is serious about the need for constant improvementand deliberate strategic direction. Vendors who don’t stay on top of emerging needs and trends won’t enable you to meet your business goals. Use thedata in this section to separate innovators from imposters.
POWER SYNC CRMTOP PRODUCT
Delights 70%
HighlySatisfies 17%
AlmostSatisfies 8%
Disappoints 5%
87 %Product Strategy
and Rate ofImprovement
2 SNAP CRM 80%
3 Pederson Client Management Solution 77%
4 Metrix CRM 76%
5 VineCRM 73%
6 Cascade CRM 68%
CATEGORY AVERAGE 77%
-- Monetize CRM 86%
-- Momentum CRM 85%
-- Apex CRM Solution 71%
-- Maple CRM 75%
Usability and IntuitivenessEnd user learning curves cost the organization money. Pay attention to your end users’ technical ability to determine how important UX is in yourpurchase.
POWER SYNC CRMTOP PRODUCT
Delights 66%
HighlySatisfies 26%
AlmostSatisfies 5%
Disappoints 3%
88 %Usability andIntuitiveness
2 SNAP CRM 79%
3 Metrix CRM 77%
4 Pederson Client Management Solution 76%
5 VineCRM 76%
6 Cascade CRM 62%
CATEGORY AVERAGE 76%
-- Monetize CRM 89%
-- Momentum CRM 86%
-- Apex CRM Solution 91%
-- Epic Customer Management Solutions 96%
9

Customer Relationship Management Category Report
Vendor Capability Satisfaction This section provides detailed information on user satisfaction for each vendor capability regarding their product offering(s). Use these pages to digdeeper into areas of particular interest or concern.
Vendor SupportThe importance of vendor support will vary for each organization depending on internal capabilities, but there will always be issues that only thevendor can resolve. Use the data in this section to see which vendors tend to under-service their product and which will offer quality support.
POWER SYNC CRMTOP PRODUCT
Delights 60%
HighlySatisfies 26%
AlmostSatisfies 5%
Disappoints 9%
82 %Vendor Support
2 Pederson Client Management Solution 78%
3 Metrix CRM 76%
4 SNAP CRM 75%
5 VineCRM 72%
6 Cascade CRM 69%
CATEGORY AVERAGE 75%
-- Monetize CRM 81%
-- Momentum CRM 58%
-- Apex CRM Solution 86%
-- Maple CRM 94%
Ease of Data IntegrationThe ability to integrate with other systems is increasingly important; without this, manual data loading and extraction can be time-consuming andprone to error. Use this section to see which vendors will cause headaches and which will make data integration easy.
POWER SYNC CRMTOP PRODUCT
Delights 67%
HighlySatisfies 21%
AlmostSatisfies 7%
Disappoints 6%
85 %Ease of DataIntegration
2 Metrix CRM 82%
3 SNAP CRM 77%
4 Pederson Client Management Solution 76%
5 Cascade CRM 69%
6 VineCRM 67%
CATEGORY AVERAGE 76%
-- Monetize CRM 79%
-- Momentum CRM 83%
-- Apex CRM Solution 75%
-- Epic Customer Management Solutions 100%
10
Customer Relationship Management Category Report
Vendor Capability Satisfaction This section provides detailed information on user satisfaction for each vendor capability regarding their product offering(s). Use these pages to digdeeper into areas of particular interest or concern.
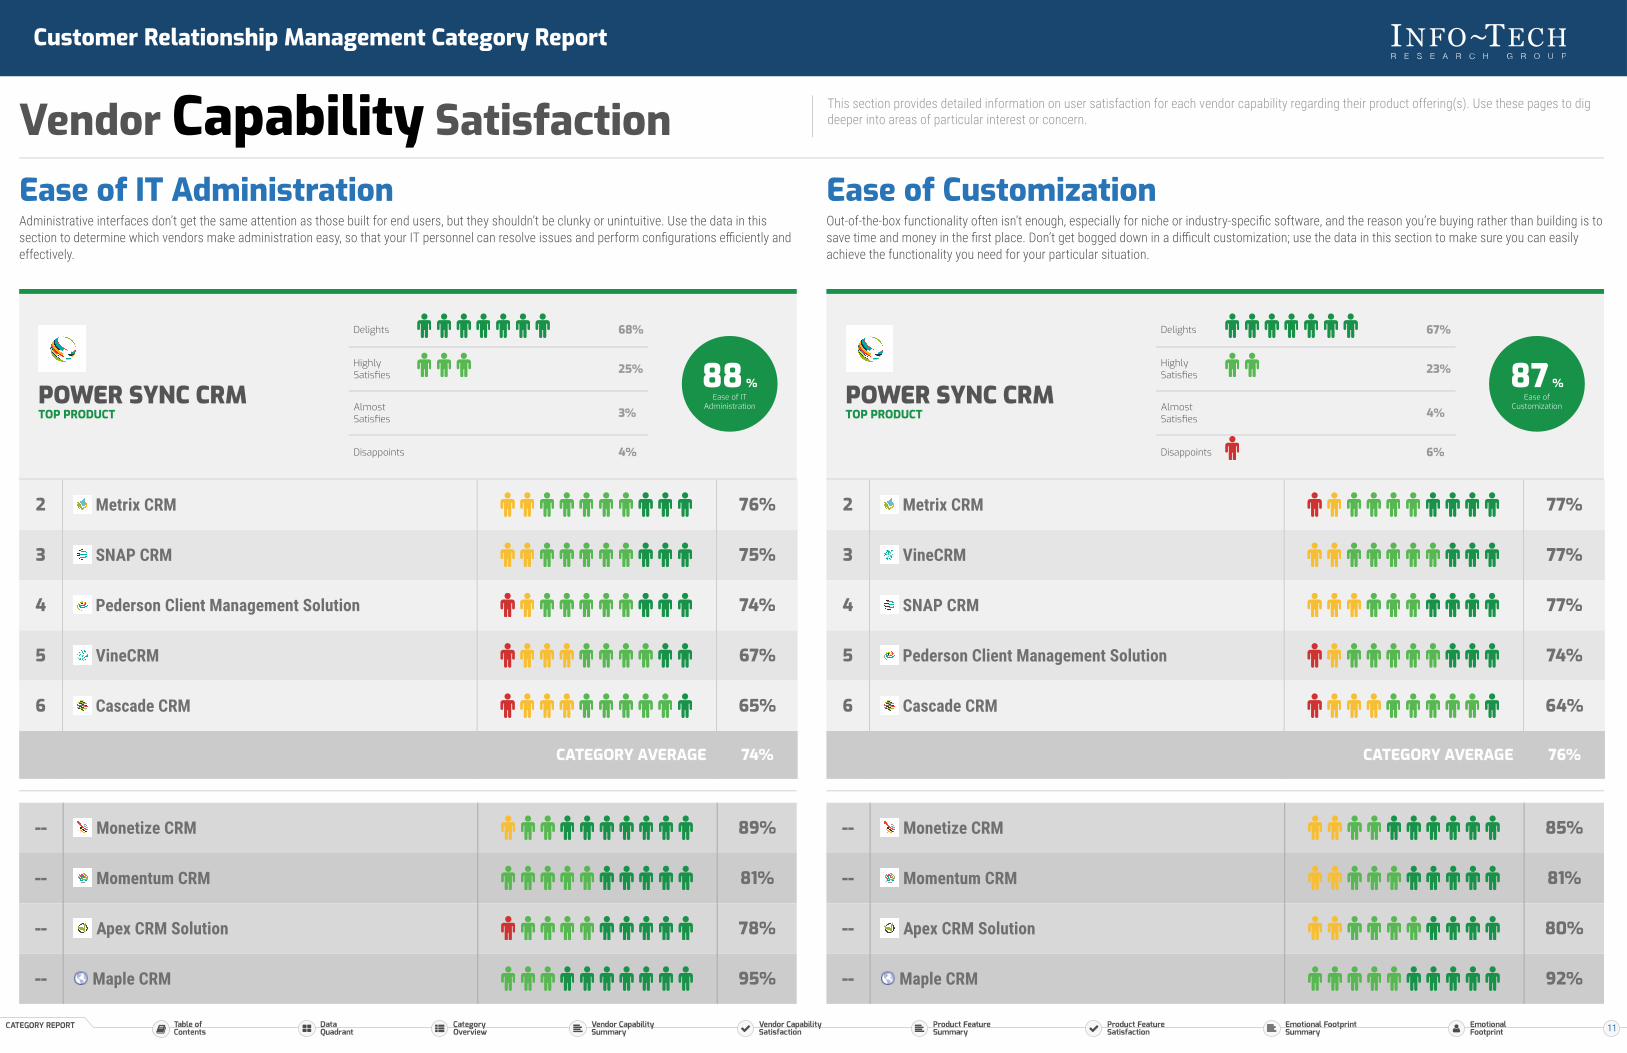
Ease of IT AdministrationAdministrative interfaces don’t get the same attention as those built for end users, but they shouldn’t be clunky or unintuitive. Use the data in thissection to determine which vendors make administration easy, so that your IT personnel can resolve issues and perform configurations efficiently andeffectively.
POWER SYNC CRMTOP PRODUCT
Delights 68%
HighlySatisfies 25%
AlmostSatisfies 3%
Disappoints 4%
88 %Ease of IT
Administration
2 Metrix CRM 76%
3 SNAP CRM 75%
4 Pederson Client Management Solution 74%
5 VineCRM 67%
6 Cascade CRM 65%
CATEGORY AVERAGE 74%
-- Monetize CRM 89%
-- Momentum CRM 81%
-- Apex CRM Solution 78%
-- Maple CRM 95%
Ease of CustomizationOut-of-the-box functionality often isn’t enough, especially for niche or industry-specific software, and the reason you’re buying rather than building is tosave time and money in the first place. Don’t get bogged down in a difficult customization; use the data in this section to make sure you can easilyachieve the functionality you need for your particular situation.
POWER SYNC CRMTOP PRODUCT
Delights 67%
HighlySatisfies 23%
AlmostSatisfies 4%
Disappoints 6%
87 %Ease of
Customization
2 Metrix CRM 77%
3 VineCRM 77%
4 SNAP CRM 77%
5 Pederson Client Management Solution 74%
6 Cascade CRM 64%
CATEGORY AVERAGE 76%
-- Monetize CRM 85%
-- Momentum CRM 81%
-- Apex CRM Solution 80%
-- Maple CRM 92%
11
Customer Relationship Management Category Report
Vendor Capability Satisfaction This section provides detailed information on user satisfaction for each vendor capability regarding their product offering(s). Use these pages to digdeeper into areas of particular interest or concern.
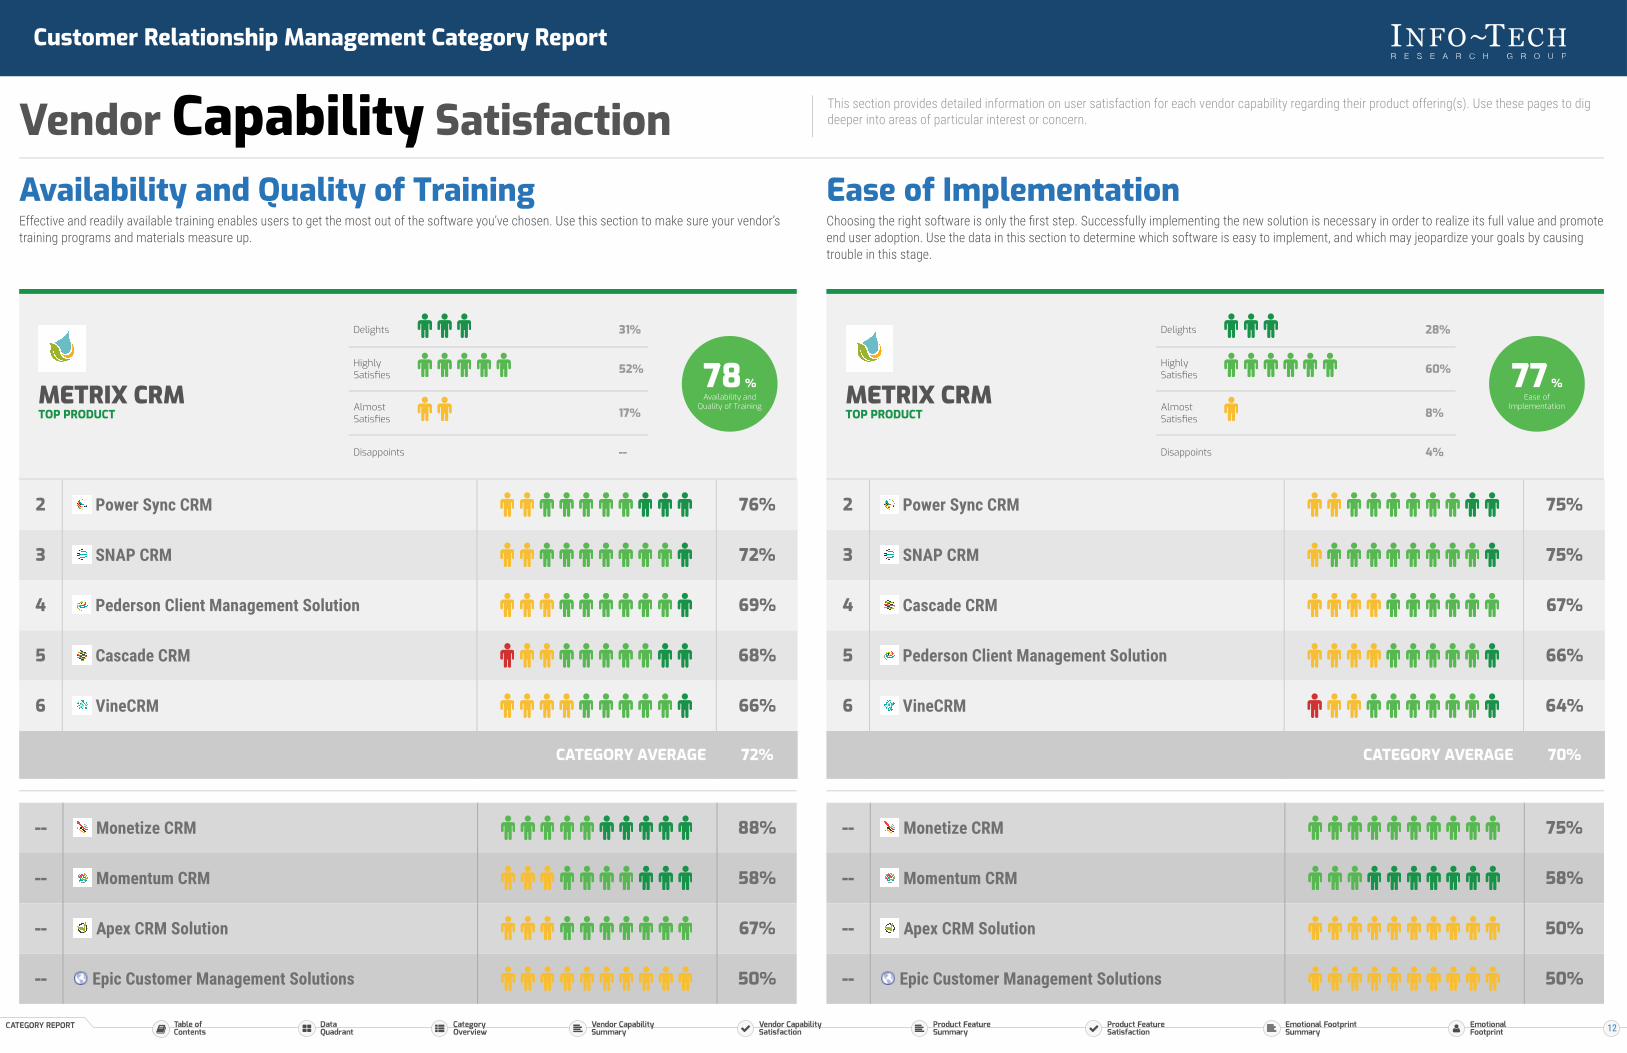
Availability and Quality of TrainingEffective and readily available training enables users to get the most out of the software you’ve chosen. Use this section to make sure your vendor’straining programs and materials measure up.
METRIX CRMTOP PRODUCT
Delights 31%
HighlySatisfies 52%
AlmostSatisfies 17%
Disappoints --
78 %Availability and
Quality of Training
2 Power Sync CRM 76%
3 SNAP CRM 72%
4 Pederson Client Management Solution 69%
5 Cascade CRM 68%
6 VineCRM 66%
CATEGORY AVERAGE 72%
-- Monetize CRM 88%
-- Momentum CRM 58%
-- Apex CRM Solution 67%
-- Epic Customer Management Solutions 50%
Ease of ImplementationChoosing the right software is only the first step. Successfully implementing the new solution is necessary in order to realize its full value and promoteend user adoption. Use the data in this section to determine which software is easy to implement, and which may jeopardize your goals by causingtrouble in this stage.
METRIX CRMTOP PRODUCT
Delights 28%
HighlySatisfies 60%
AlmostSatisfies 8%
Disappoints 4%
77 %Ease of
Implementation
2 Power Sync CRM 75%
3 SNAP CRM 75%
4 Cascade CRM 67%
5 Pederson Client Management Solution 66%
6 VineCRM 64%
CATEGORY AVERAGE 70%
-- Monetize CRM 75%
-- Momentum CRM 58%
-- Apex CRM Solution 50%
-- Epic Customer Management Solutions 50%
12
Customer Relationship Management Category Report
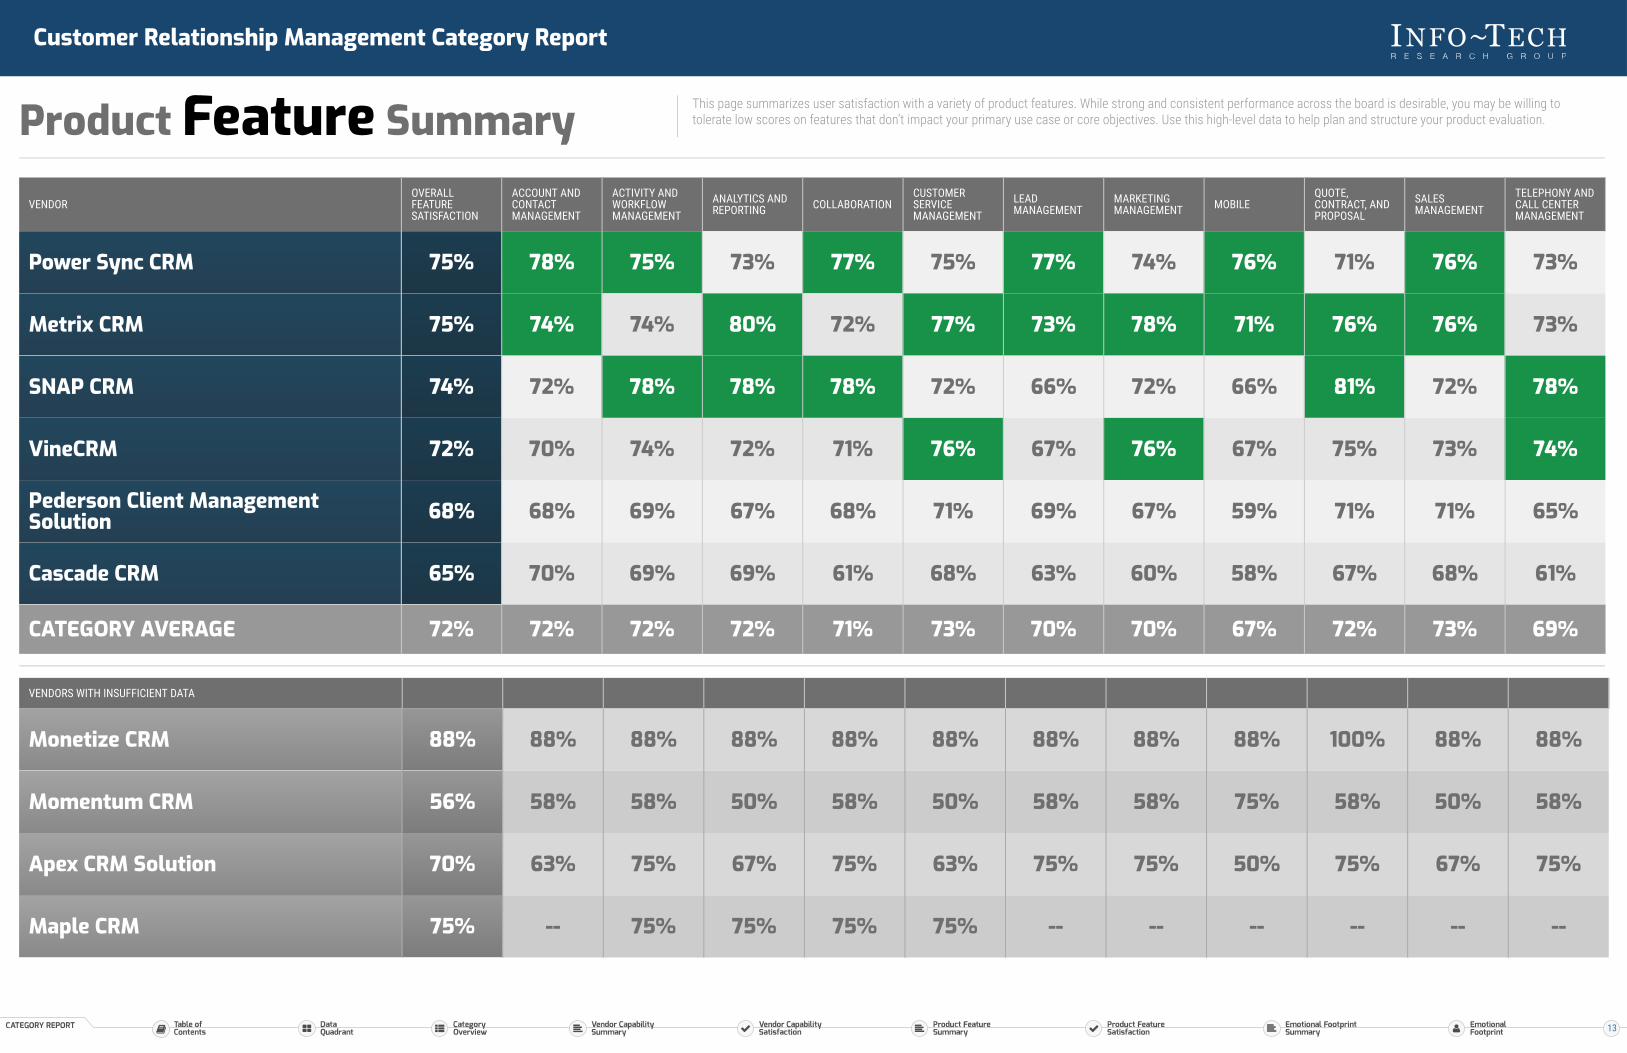
Product Feature Summary This page summarizes user satisfaction with a variety of product features. While strong and consistent performance across the board is desirable, you may be willing totolerate low scores on features that don’t impact your primary use case or core objectives. Use this high-level data to help plan and structure your product evaluation.
VENDOROVERALLFEATURESATISFACTION
ACCOUNT ANDCONTACTMANAGEMENT
ACTIVITY ANDWORKFLOWMANAGEMENT
ANALYTICS ANDREPORTING COLLABORATION
CUSTOMERSERVICEMANAGEMENT
LEADMANAGEMENT
MARKETINGMANAGEMENT MOBILE
QUOTE,CONTRACT, ANDPROPOSAL
SALESMANAGEMENT
TELEPHONY ANDCALL CENTERMANAGEMENT
Power Sync CRM 75% 78% 75% 73% 77% 75% 77% 74% 76% 71% 76% 73%
Metrix CRM 75% 74% 74% 80% 72% 77% 73% 78% 71% 76% 76% 73%
SNAP CRM 74% 72% 78% 78% 78% 72% 66% 72% 66% 81% 72% 78%
VineCRM 72% 70% 74% 72% 71% 76% 67% 76% 67% 75% 73% 74%
Pederson Client ManagementSolution 68% 68% 69% 67% 68% 71% 69% 67% 59% 71% 71% 65%
Cascade CRM 65% 70% 69% 69% 61% 68% 63% 60% 58% 67% 68% 61%
CATEGORY AVERAGE 72% 72% 72% 72% 71% 73% 70% 70% 67% 72% 73% 69%
VENDORS WITH INSUFFICIENT DATA
Monetize CRM 88% 88% 88% 88% 88% 88% 88% 88% 88% 100% 88% 88%
Momentum CRM 56% 58% 58% 50% 58% 50% 58% 58% 75% 58% 50% 58%
Apex CRM Solution 70% 63% 75% 67% 75% 63% 75% 75% 50% 75% 67% 75%
Maple CRM 75% -- 75% 75% 75% 75% -- -- -- -- -- --
13
Customer Relationship Management Category Report
Product Feature Satisfaction This section provides detailed information on user satisfaction for each product feature.Use these pages to dig deeper into areas of particular interest or concern.
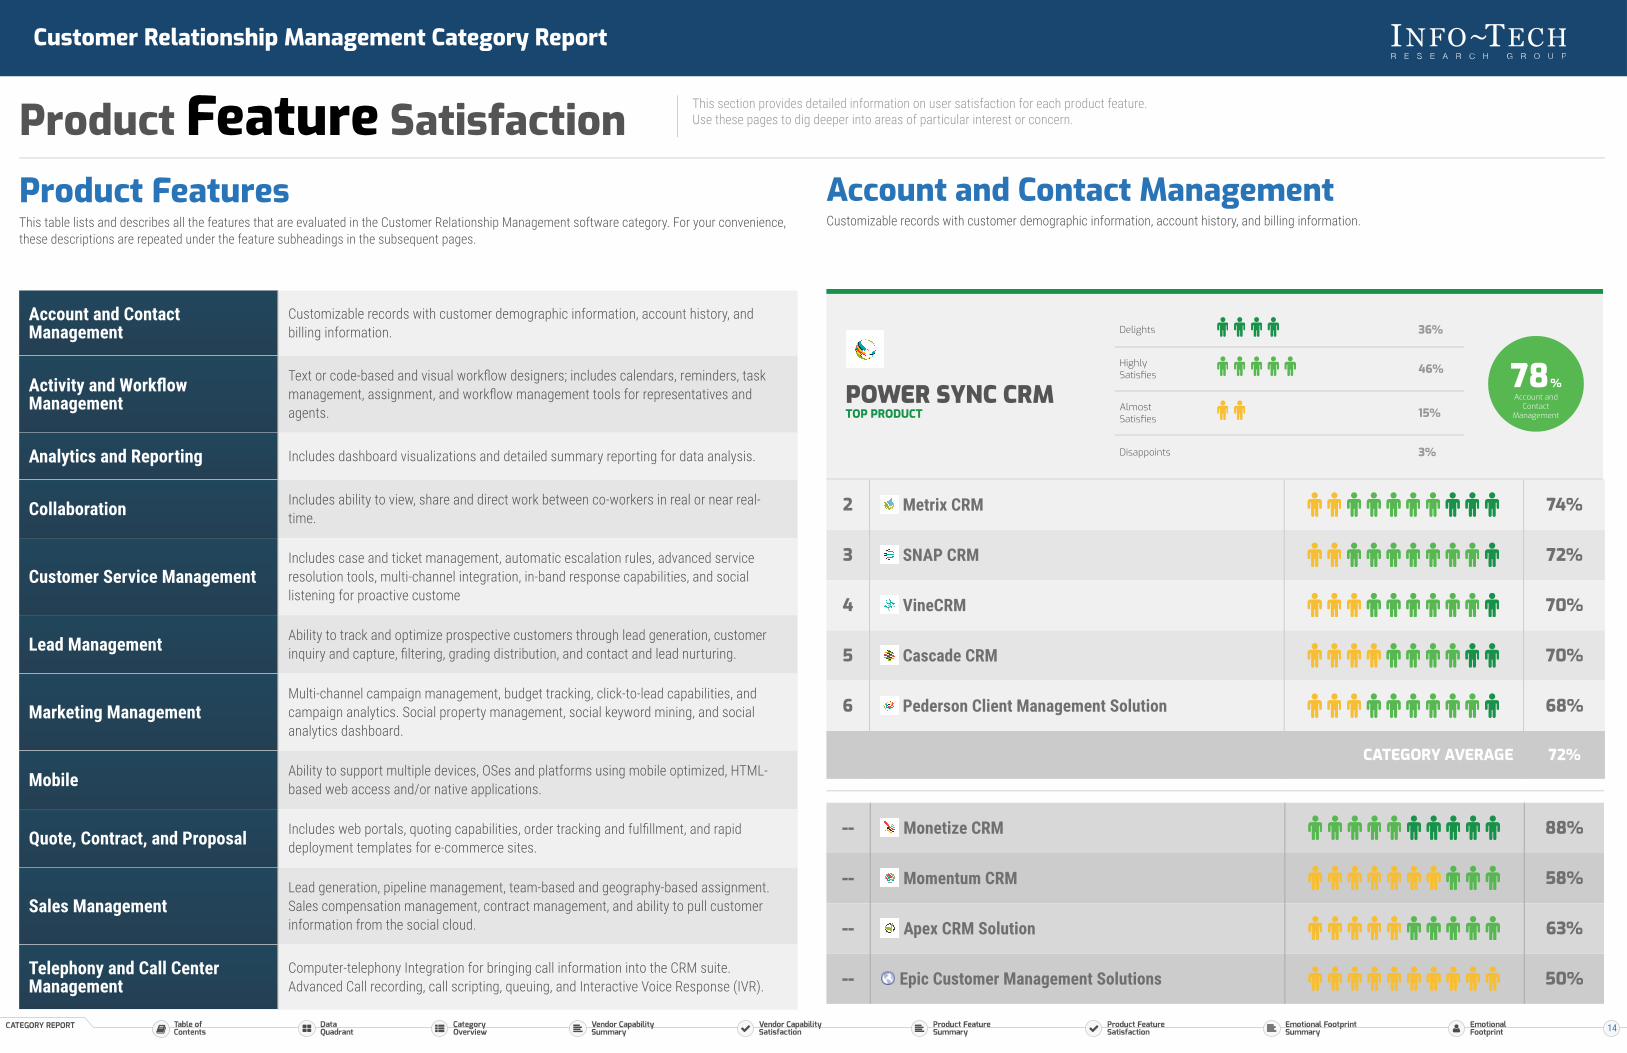
Product FeaturesThis table lists and describes all the features that are evaluated in the Customer Relationship Management software category. For your convenience,these descriptions are repeated under the feature subheadings in the subsequent pages.
Account and ContactManagement
Customizable records with customer demographic information, account history, andbilling information.
Activity and WorkflowManagement
Text or code-based and visual workflow designers; includes calendars, reminders, taskmanagement, assignment, and workflow management tools for representatives andagents.
Analytics and Reporting Includes dashboard visualizations and detailed summary reporting for data analysis.
Collaboration Includes ability to view, share and direct work between co-workers in real or near real-time.
Customer Service ManagementIncludes case and ticket management, automatic escalation rules, advanced serviceresolution tools, multi-channel integration, in-band response capabilities, and sociallistening for proactive custome
Lead Management Ability to track and optimize prospective customers through lead generation, customerinquiry and capture, filtering, grading distribution, and contact and lead nurturing.
Marketing ManagementMulti-channel campaign management, budget tracking, click-to-lead capabilities, andcampaign analytics. Social property management, social keyword mining, and socialanalytics dashboard.
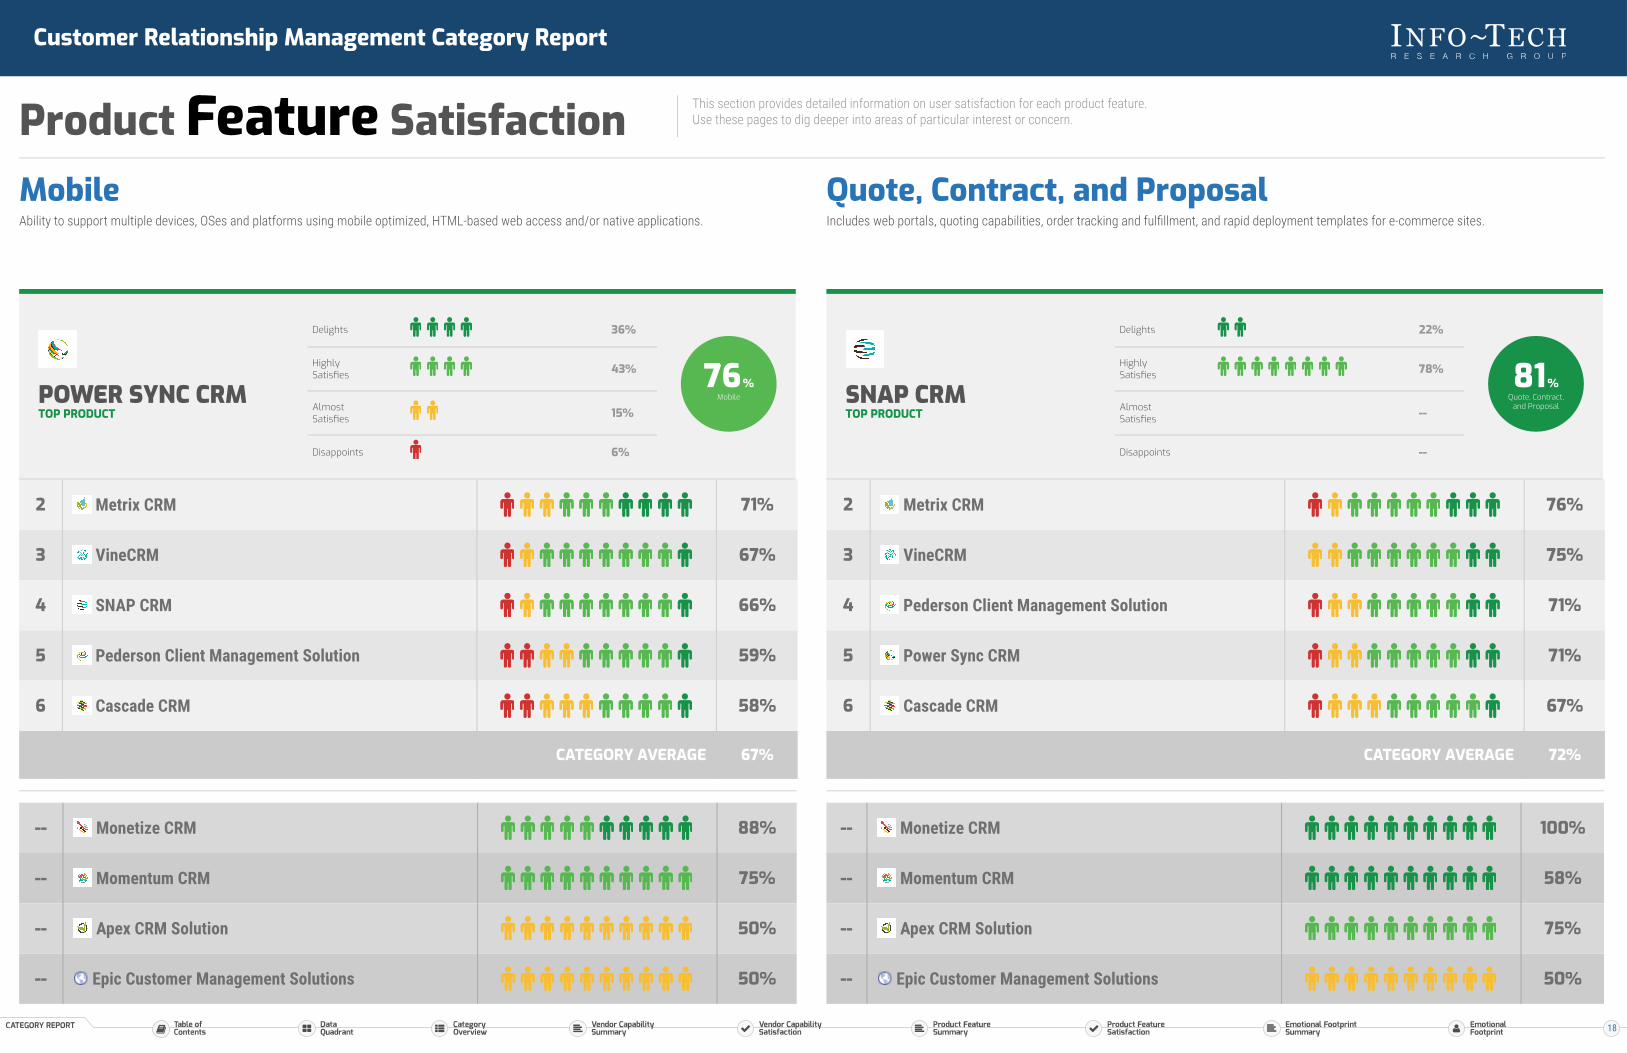
Mobile Ability to support multiple devices, OSes and platforms using mobile optimized, HTML-based web access and/or native applications.
Quote, Contract, and Proposal Includes web portals, quoting capabilities, order tracking and fulfillment, and rapiddeployment templates for e-commerce sites.
Sales ManagementLead generation, pipeline management, team-based and geography-based assignment.Sales compensation management, contract management, and ability to pull customerinformation from the social cloud.
Telephony and Call CenterManagement
Computer-telephony Integration for bringing call information into the CRM suite.Advanced Call recording, call scripting, queuing, and Interactive Voice Response (IVR).
Account and Contact ManagementCustomizable records with customer demographic information, account history, and billing information.
POWER SYNC CRMTOP PRODUCT
Delights 36%
HighlySatisfies 46%
AlmostSatisfies 15%
Disappoints 3%
78%Account and
ContactManagement
2 Metrix CRM 74%
3 SNAP CRM 72%
4 VineCRM 70%
5 Cascade CRM 70%
6 Pederson Client Management Solution 68%
CATEGORY AVERAGE 72%
-- Monetize CRM 88%
-- Momentum CRM 58%
-- Apex CRM Solution 63%
-- Epic Customer Management Solutions 50%
14
Customer Relationship Management Category Report
Product Feature Satisfaction This section provides detailed information on user satisfaction for each product feature.Use these pages to dig deeper into areas of particular interest or concern.
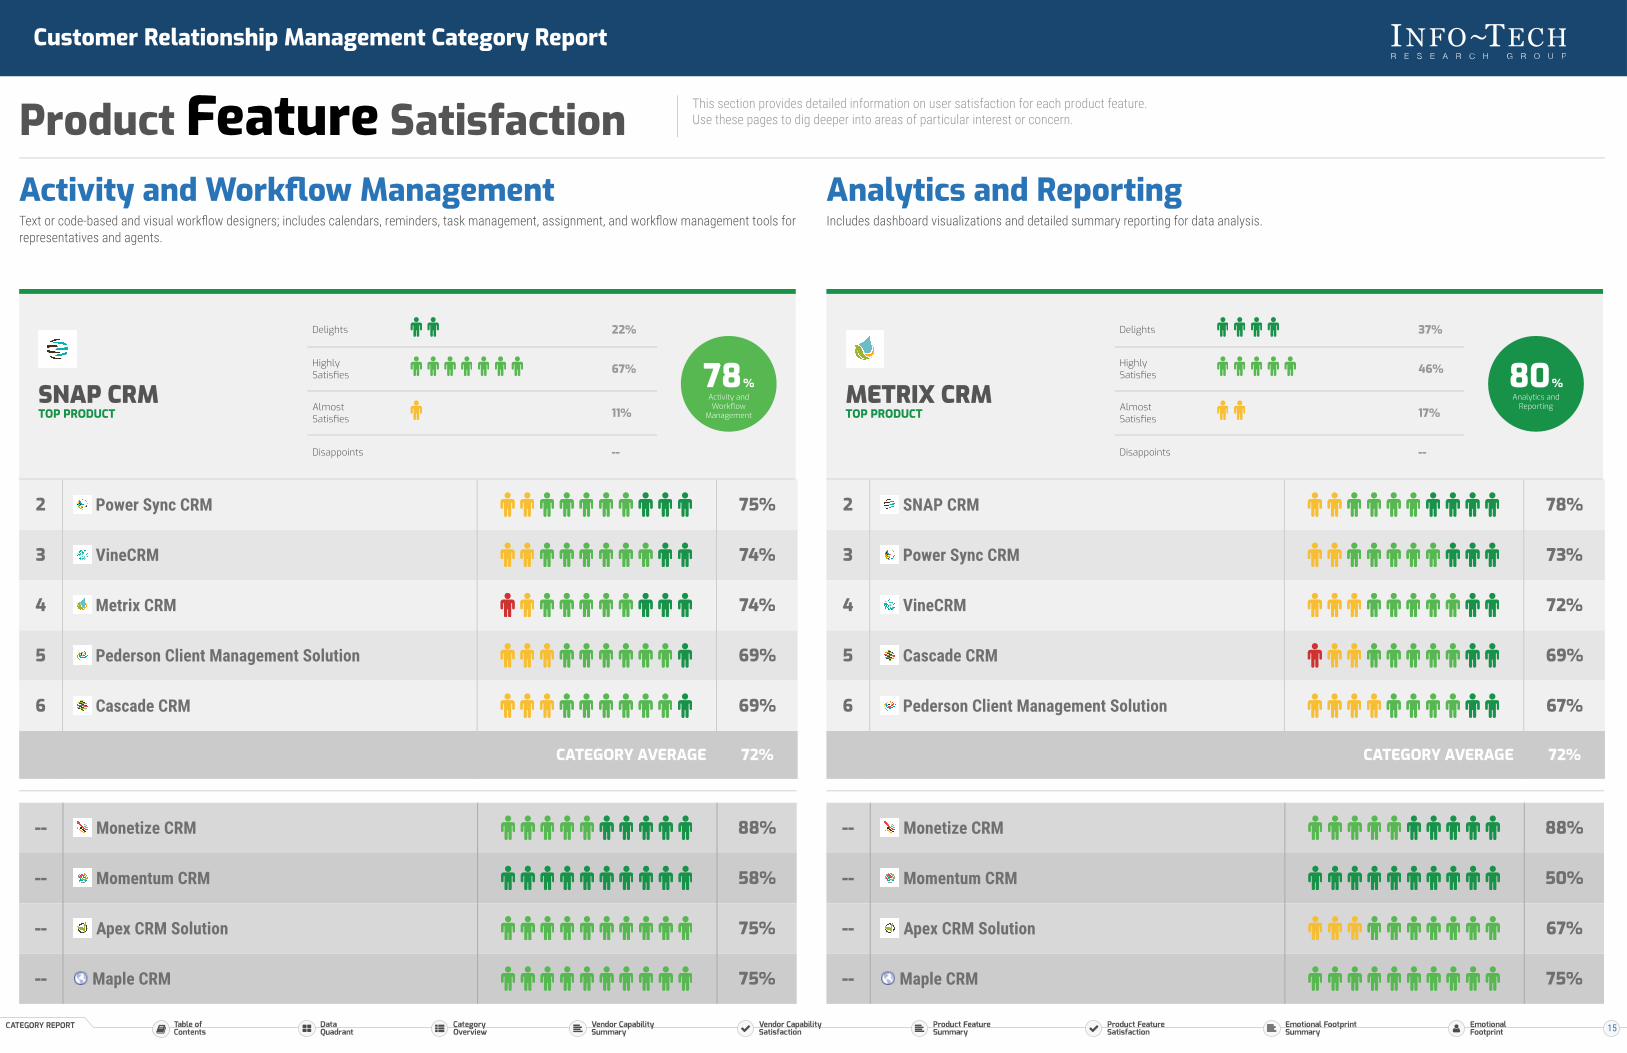
Activity and Workflow ManagementText or code-based and visual workflow designers; includes calendars, reminders, task management, assignment, and workflow management tools forrepresentatives and agents.
SNAP CRMTOP PRODUCT
Delights 22%
HighlySatisfies 67%
AlmostSatisfies 11%
Disappoints --
78%Activity andWorkflow
Management
2 Power Sync CRM 75%
3 VineCRM 74%
4 Metrix CRM 74%
5 Pederson Client Management Solution 69%
6 Cascade CRM 69%
CATEGORY AVERAGE 72%
-- Monetize CRM 88%
-- Momentum CRM 58%
-- Apex CRM Solution 75%
-- Maple CRM 75%
Analytics and ReportingIncludes dashboard visualizations and detailed summary reporting for data analysis.
METRIX CRMTOP PRODUCT
Delights 37%
HighlySatisfies 46%
AlmostSatisfies 17%
Disappoints --
80%Analytics and
Reporting
2 SNAP CRM 78%
3 Power Sync CRM 73%
4 VineCRM 72%
5 Cascade CRM 69%
6 Pederson Client Management Solution 67%
CATEGORY AVERAGE 72%
-- Monetize CRM 88%
-- Momentum CRM 50%
-- Apex CRM Solution 67%
-- Maple CRM 75%
15
Customer Relationship Management Category Report
Product Feature Satisfaction This section provides detailed information on user satisfaction for each product feature.Use these pages to dig deeper into areas of particular interest or concern.
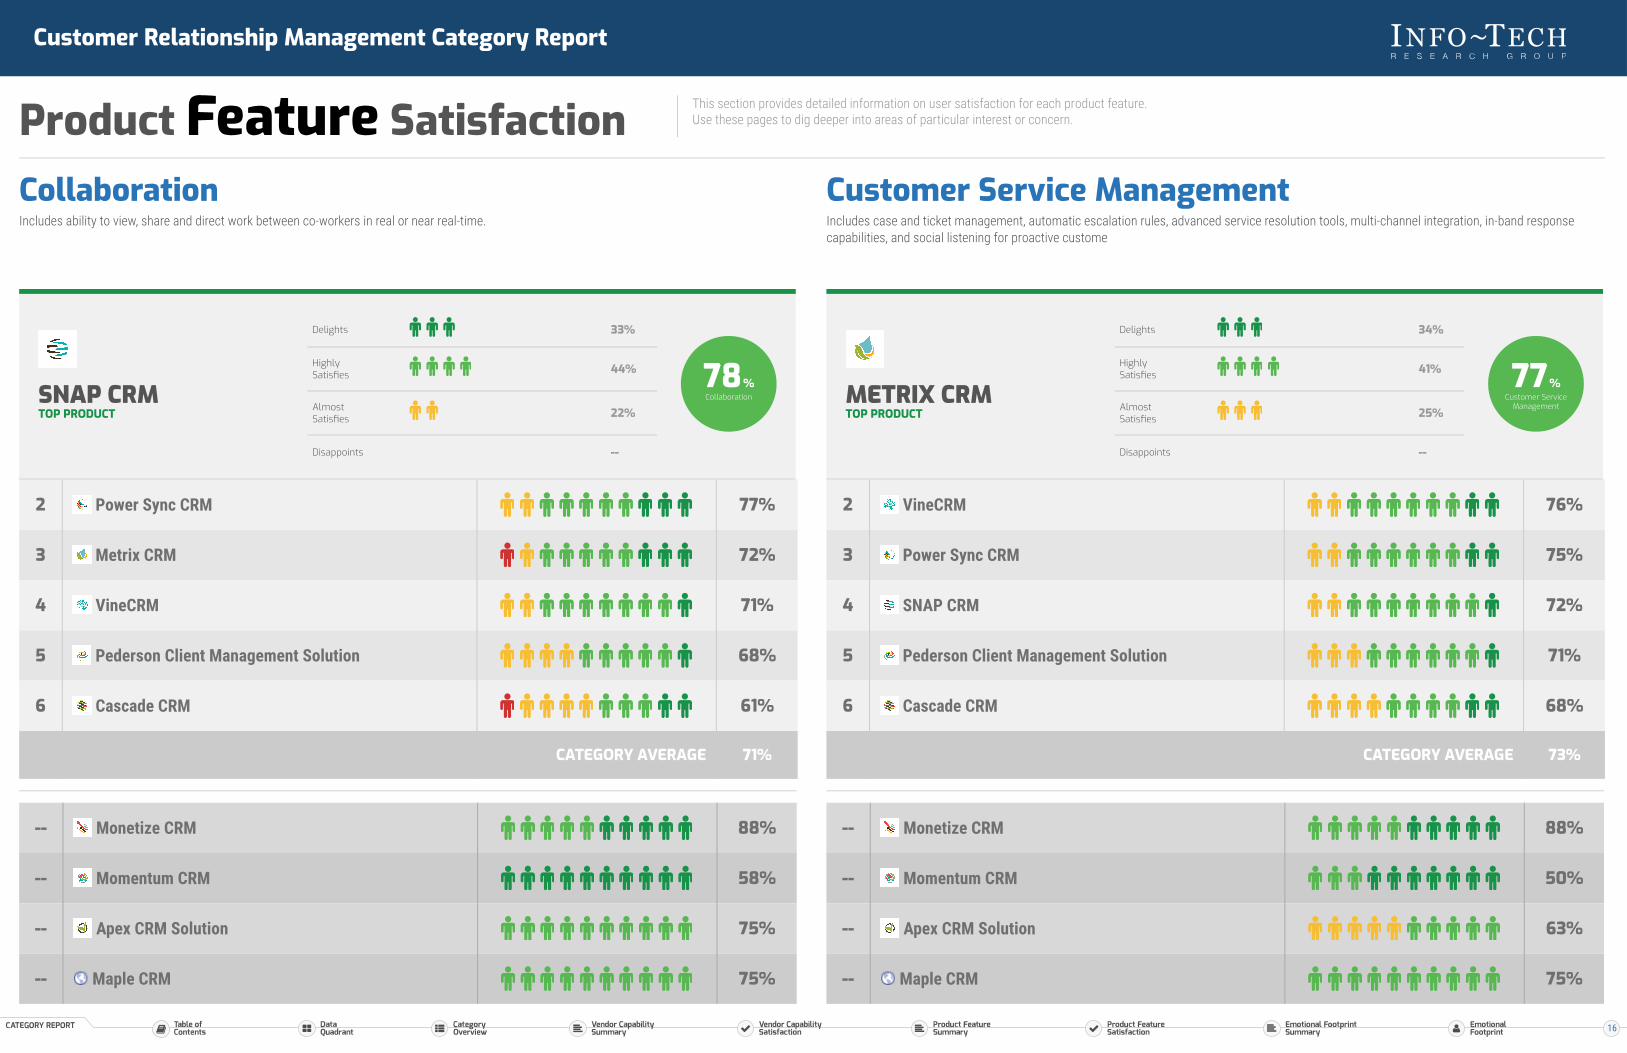
CollaborationIncludes ability to view, share and direct work between co-workers in real or near real-time.
SNAP CRMTOP PRODUCT
Delights 33%
HighlySatisfies 44%
AlmostSatisfies 22%
Disappoints --
78%Collaboration
2 Power Sync CRM 77%
3 Metrix CRM 72%
4 VineCRM 71%
5 Pederson Client Management Solution 68%
6 Cascade CRM 61%
CATEGORY AVERAGE 71%
-- Monetize CRM 88%
-- Momentum CRM 58%
-- Apex CRM Solution 75%
-- Maple CRM 75%
Customer Service ManagementIncludes case and ticket management, automatic escalation rules, advanced service resolution tools, multi-channel integration, in-band responsecapabilities, and social listening for proactive custome
METRIX CRMTOP PRODUCT
Delights 34%
HighlySatisfies 41%
AlmostSatisfies 25%
Disappoints --
77%Customer Service
Management
2 VineCRM 76%
3 Power Sync CRM 75%
4 SNAP CRM 72%
5 Pederson Client Management Solution 71%
6 Cascade CRM 68%
CATEGORY AVERAGE 73%
-- Monetize CRM 88%
-- Momentum CRM 50%
-- Apex CRM Solution 63%
-- Maple CRM 75%
16
Customer Relationship Management Category Report
Product Feature Satisfaction This section provides detailed information on user satisfaction for each product feature.Use these pages to dig deeper into areas of particular interest or concern.
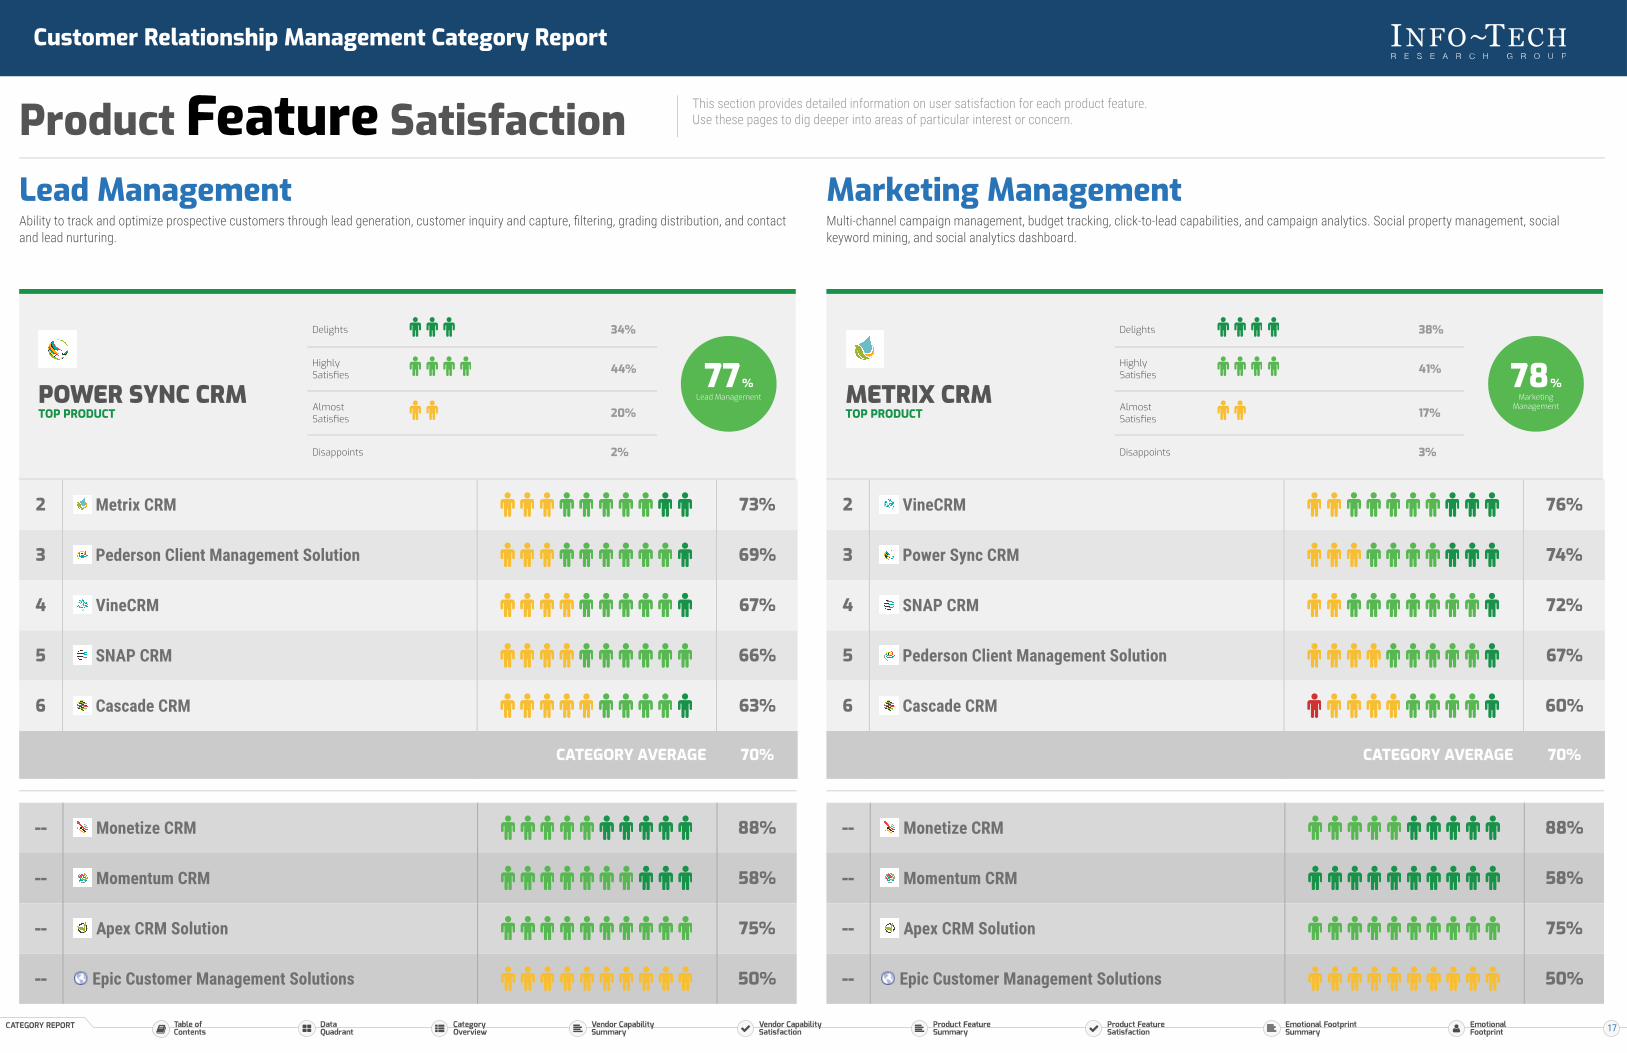
Lead ManagementAbility to track and optimize prospective customers through lead generation, customer inquiry and capture, filtering, grading distribution, and contactand lead nurturing.
POWER SYNC CRMTOP PRODUCT
Delights 34%
HighlySatisfies 44%
AlmostSatisfies 20%
Disappoints 2%
77%Lead Management
2 Metrix CRM 73%
3 Pederson Client Management Solution 69%
4 VineCRM 67%
5 SNAP CRM 66%
6 Cascade CRM 63%
CATEGORY AVERAGE 70%
-- Monetize CRM 88%
-- Momentum CRM 58%
-- Apex CRM Solution 75%
-- Epic Customer Management Solutions 50%
Marketing ManagementMulti-channel campaign management, budget tracking, click-to-lead capabilities, and campaign analytics. Social property management, socialkeyword mining, and social analytics dashboard.
METRIX CRMTOP PRODUCT
Delights 38%
HighlySatisfies 41%
AlmostSatisfies 17%
Disappoints 3%
78%Marketing
Management
2 VineCRM 76%
3 Power Sync CRM 74%
4 SNAP CRM 72%
5 Pederson Client Management Solution 67%
6 Cascade CRM 60%
CATEGORY AVERAGE 70%
-- Monetize CRM 88%
-- Momentum CRM 58%
-- Apex CRM Solution 75%
-- Epic Customer Management Solutions 50%
17
Customer Relationship Management Category Report
Product Feature Satisfaction This section provides detailed information on user satisfaction for each product feature.Use these pages to dig deeper into areas of particular interest or concern.
MobileAbility to support multiple devices, OSes and platforms using mobile optimized, HTML-based web access and/or native applications.
POWER SYNC CRMTOP PRODUCT
Delights 36%
HighlySatisfies 43%
AlmostSatisfies 15%
Disappoints 6%
76%Mobile
2 Metrix CRM 71%
3 VineCRM 67%
4 SNAP CRM 66%
5 Pederson Client Management Solution 59%
6 Cascade CRM 58%
CATEGORY AVERAGE 67%
-- Monetize CRM 88%
-- Momentum CRM 75%
-- Apex CRM Solution 50%
-- Epic Customer Management Solutions 50%
Quote, Contract, and ProposalIncludes web portals, quoting capabilities, order tracking and fulfillment, and rapid deployment templates for e-commerce sites.
SNAP CRMTOP PRODUCT
Delights 22%
HighlySatisfies 78%
AlmostSatisfies --
Disappoints --
81%Quote, Contract,
and Proposal
2 Metrix CRM 76%
3 VineCRM 75%
4 Pederson Client Management Solution 71%
5 Power Sync CRM 71%
6 Cascade CRM 67%
CATEGORY AVERAGE 72%
-- Monetize CRM 100%
-- Momentum CRM 58%
-- Apex CRM Solution 75%
-- Epic Customer Management Solutions 50%
18

Customer Relationship Management Category Report
Product Feature Satisfaction This section provides detailed information on user satisfaction for each product feature.Use these pages to dig deeper into areas of particular interest or concern.
Sales ManagementLead generation, pipeline management, team-based and geography-based assignment. Sales compensation management, contract management, andability to pull customer information from the social cloud.
POWER SYNC CRMTOP PRODUCT
Delights 28%
HighlySatisfies 50%
AlmostSatisfies 22%
Disappoints --
76%Sales
Management
2 Metrix CRM 76%
3 VineCRM 73%
4 SNAP CRM 72%
5 Pederson Client Management Solution 71%
6 Cascade CRM 68%
CATEGORY AVERAGE 73%
-- Monetize CRM 88%
-- Momentum CRM 50%
-- Apex CRM Solution 67%
-- Epic Customer Management Solutions 50%
Telephony and Call Center ManagementComputer-telephony Integration for bringing call information into the CRM suite. Advanced Call recording, call scripting, queuing, and Interactive VoiceResponse (IVR).
SNAP CRMTOP PRODUCT
Delights 22%
HighlySatisfies 67%
AlmostSatisfies 11%
Disappoints --
78%Telephony and Call
CenterManagement
2 VineCRM 74%
3 Metrix CRM 73%
4 Power Sync CRM 73%
5 Pederson Client Management Solution 65%
6 Cascade CRM 61%
CATEGORY AVERAGE 69%
-- Monetize CRM 88%
-- Momentum CRM 58%
-- Apex CRM Solution 75%
-- Epic Customer Management Solutions 50%
19
Customer Relationship Management Category Report
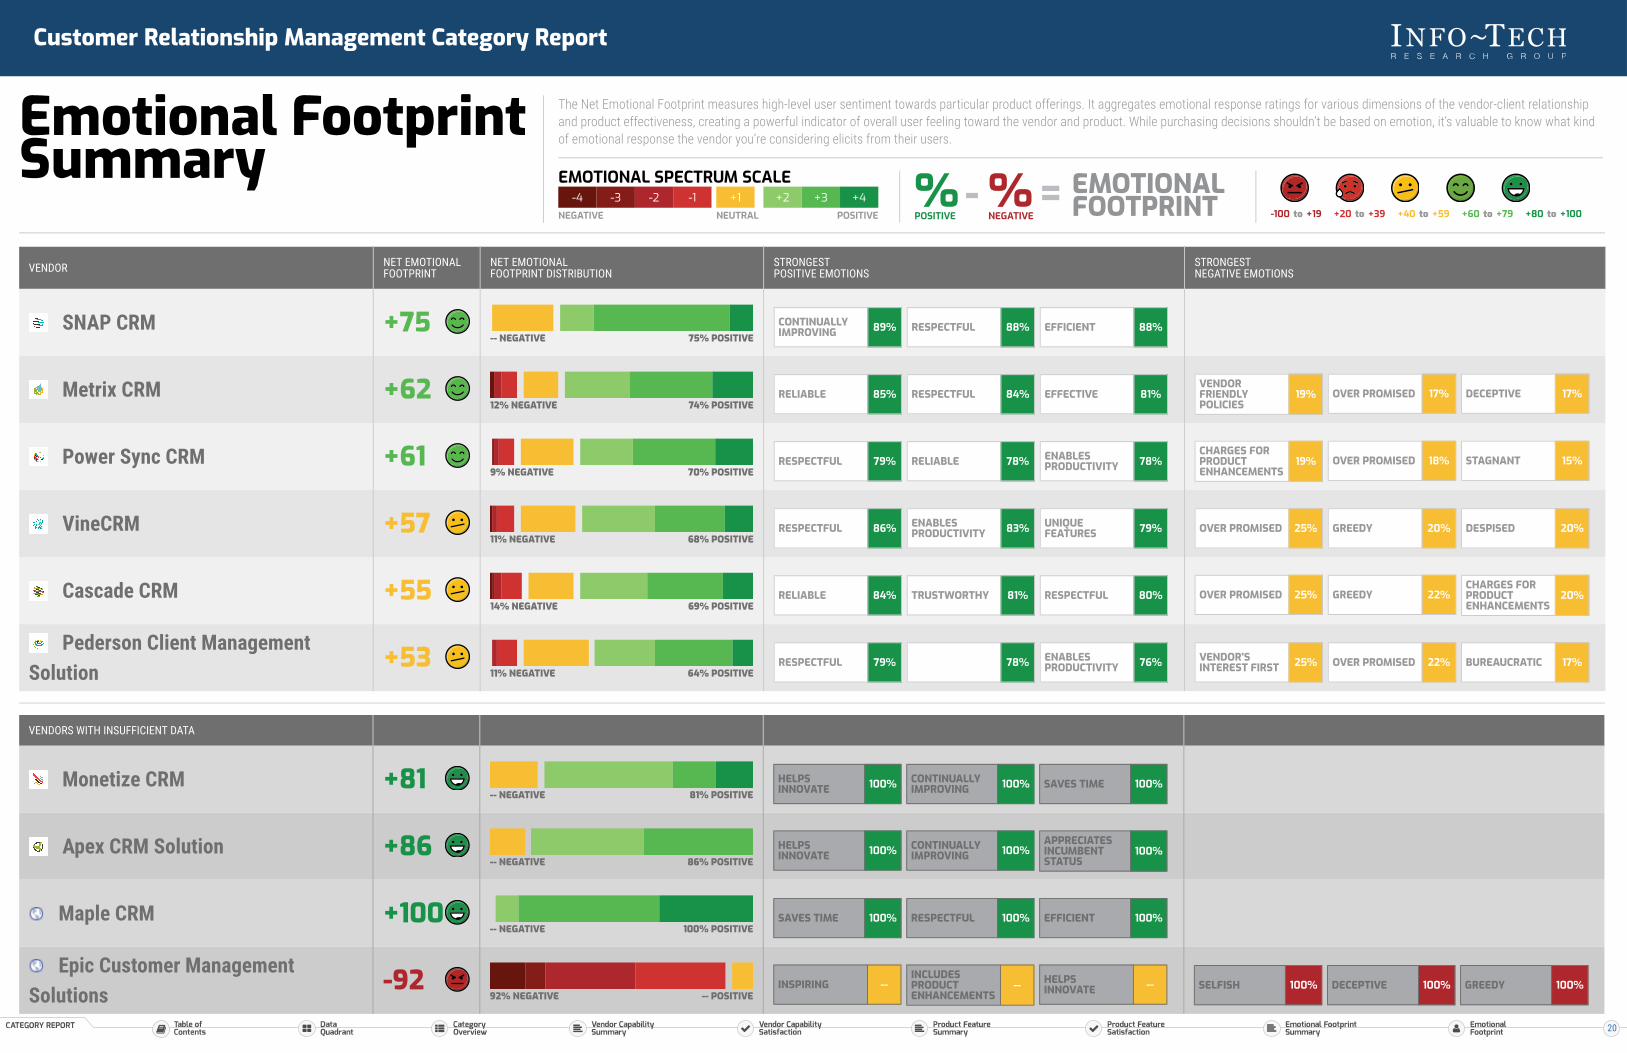
Emotional FootprintSummary
The Net Emotional Footprint measures high-level user sentiment towards particular product offerings. It aggregates emotional response ratings for various dimensions of the vendor-client relationshipand product effectiveness, creating a powerful indicator of overall user feeling toward the vendor and product. While purchasing decisions shouldn’t be based on emotion, it’s valuable to know what kindof emotional response the vendor you’re considering elicits from their users.
-4 -3 -2 -1NEGATIVE
+1NEUTRAL
+2 +3 +4POSITIVE
EMOTIONAL SPECTRUM SCALE %POSITIVE
%NEGATIVE
EMOTIONALFOOTPRINT- =
-100 to +19 +20 to +39 +40 to +59 +60 to +79 +80 to +100
CONTINUALLYIMPROVING 89% RESPECTFUL 88% EFFICIENT 88%
RELIABLE 85% RESPECTFUL 84% EFFECTIVE 81%VENDORFRIENDLYPOLICIES
19% OVER PROMISED 17% DECEPTIVE 17%
RESPECTFUL 79% RELIABLE 78% ENABLESPRODUCTIVITY 78%
CHARGES FORPRODUCTENHANCEMENTS
19% OVER PROMISED 18% STAGNANT 15%
RESPECTFUL 86% ENABLESPRODUCTIVITY 83% UNIQUE
FEATURES 79% OVER PROMISED 25% GREEDY 20% DESPISED 20%
RELIABLE 84% TRUSTWORTHY 81% RESPECTFUL 80% OVER PROMISED 25% GREEDY 22%CHARGES FORPRODUCTENHANCEMENTS
20%
RESPECTFUL 79% 78% ENABLESPRODUCTIVITY 76% VENDOR'S
INTEREST FIRST 25% OVER PROMISED 22% BUREAUCRATIC 17%
VENDOR NET EMOTIONALFOOTPRINT
NET EMOTIONALFOOTPRINT DISTRIBUTION
STRONGESTPOSITIVE EMOTIONS
STRONGESTNEGATIVE EMOTIONS
SNAP CRM +75-- NEGATIVE 75% POSITIVE
Metrix CRM +6212% NEGATIVE 74% POSITIVE
Power Sync CRM +619% NEGATIVE 70% POSITIVE
VineCRM +5711% NEGATIVE 68% POSITIVE
Cascade CRM +5514% NEGATIVE 69% POSITIVE
Pederson Client ManagementSolution
+5311% NEGATIVE 64% POSITIVE
HELPSINNOVATE 100% CONTINUALLY
IMPROVING 100% SAVES TIME 100%
HELPSINNOVATE 100% CONTINUALLY
IMPROVING 100%APPRECIATESINCUMBENTSTATUS
100%
SAVES TIME 100% RESPECTFUL 100% EFFICIENT 100%
INSPIRING --INCLUDESPRODUCTENHANCEMENTS
-- HELPSINNOVATE -- SELFISH 100% DECEPTIVE 100% GREEDY 100%
VENDORS WITH INSUFFICIENT DATA
Monetize CRM +81-- NEGATIVE 81% POSITIVE
Apex CRM Solution +86-- NEGATIVE 86% POSITIVE
Maple CRM +100-- NEGATIVE 100% POSITIVE
Epic Customer ManagementSolutions
-9292% NEGATIVE -- POSITIVE
20
Customer Relationship Management Category Report
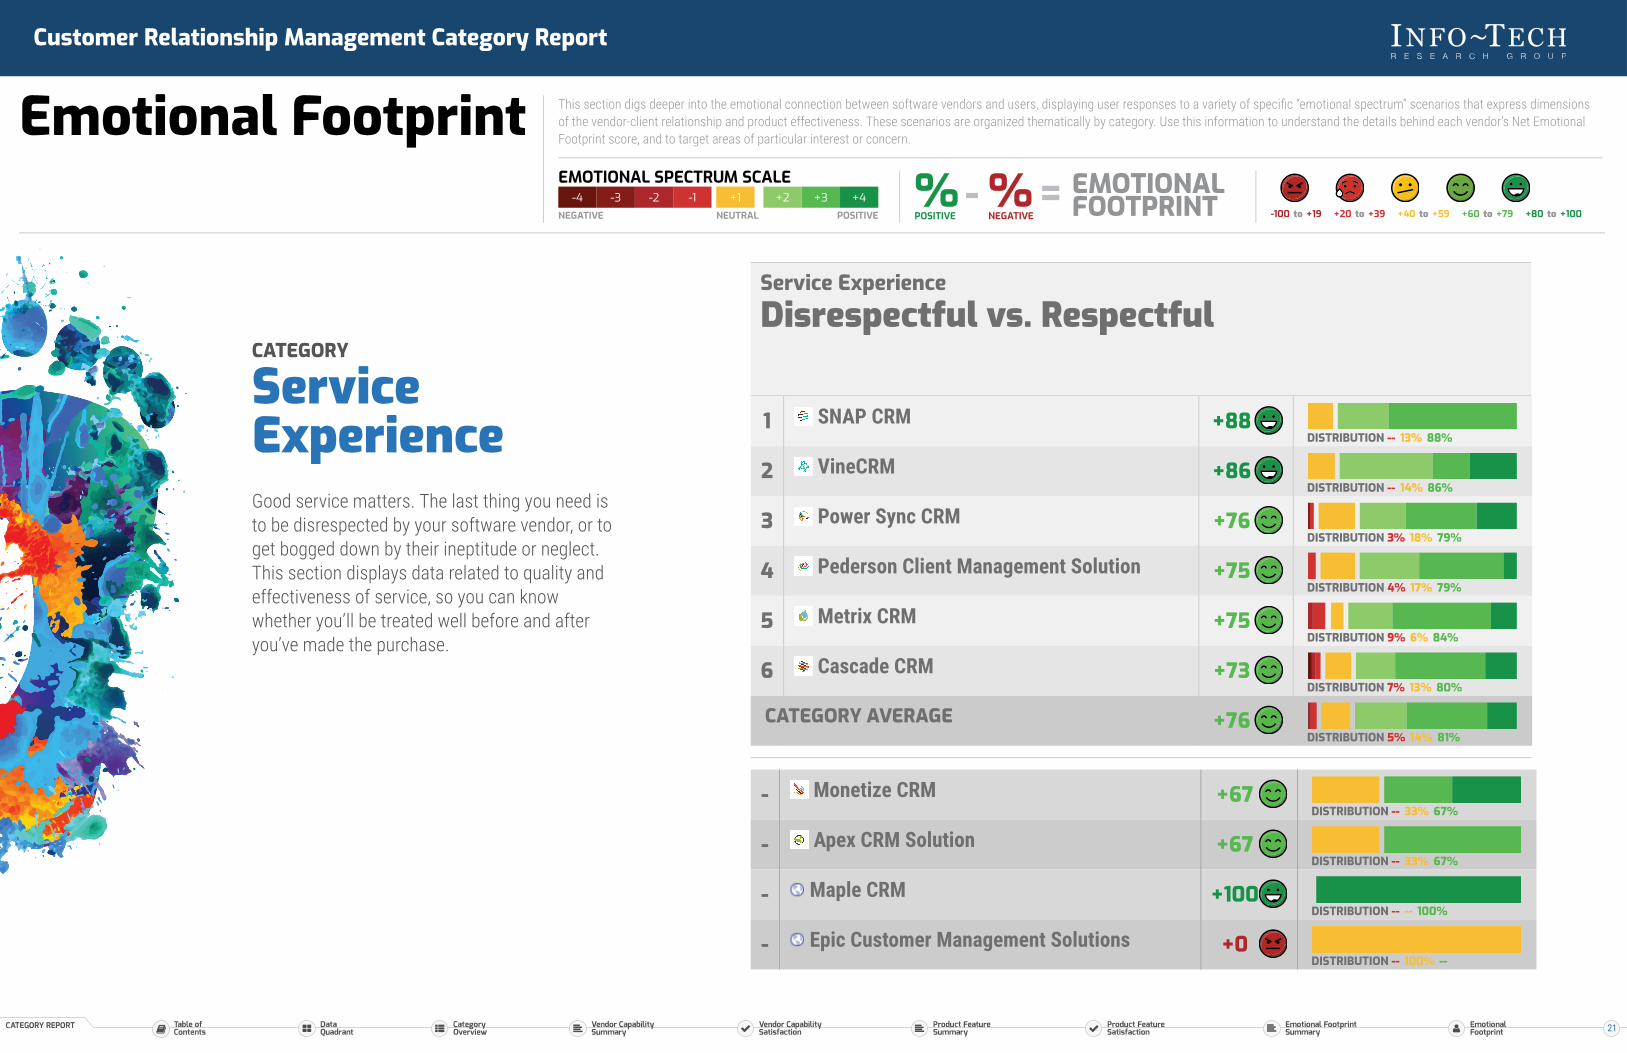
Emotional Footprint This section digs deeper into the emotional connection between software vendors and users, displaying user responses to a variety of specific “emotional spectrum” scenarios that express dimensionsof the vendor-client relationship and product effectiveness. These scenarios are organized thematically by category. Use this information to understand the details behind each vendor’s Net EmotionalFootprint score, and to target areas of particular interest or concern.
-4 -3 -2 -1NEGATIVE
+1NEUTRAL
+2 +3 +4POSITIVE
EMOTIONAL SPECTRUM SCALE %POSITIVE
%NEGATIVE
EMOTIONALFOOTPRINT- =
-100 to +19 +20 to +39 +40 to +59 +60 to +79 +80 to +100
CATEGORY
ServiceExperienceGood service matters. The last thing you need isto be disrespected by your software vendor, or toget bogged down by their ineptitude or neglect.This section displays data related to quality andeffectiveness of service, so you can knowwhether you’ll be treated well before and afteryou’ve made the purchase.
Service ExperienceDisrespectful vs. Respectful
DISTRIBUTION -- 13% 88%
DISTRIBUTION -- 14% 86%
DISTRIBUTION 3% 18% 79%
DISTRIBUTION 4% 17% 79%
DISTRIBUTION 9% 6% 84%
DISTRIBUTION 7% 13% 80%
DISTRIBUTION 5% 14% 81%
1 SNAP CRM +88
2 VineCRM +86
3 Power Sync CRM +76
4 Pederson Client Management Solution +75
5 Metrix CRM +75
6 Cascade CRM +73
CATEGORY AVERAGE +76
DISTRIBUTION -- 33% 67%
DISTRIBUTION -- 33% 67%
DISTRIBUTION -- -- 100%
DISTRIBUTION -- 100% --
- Monetize CRM +67
- Apex CRM Solution +67
- Maple CRM +100
- Epic Customer Management Solutions +0
21

Customer Relationship Management Category Report
Emotional Footprint This section digs deeper into the emotional connection between software vendors and users, displaying user responses to a variety of specific “emotional spectrum” scenarios that express dimensionsof the vendor-client relationship and product effectiveness. These scenarios are organized thematically by category. Use this information to understand the details behind each vendor’s Net EmotionalFootprint score, and to target areas of particular interest or concern.
-4 -3 -2 -1NEGATIVE
+1NEUTRAL
+2 +3 +4POSITIVE
EMOTIONAL SPECTRUM SCALE %POSITIVE
%NEGATIVE
EMOTIONALFOOTPRINT- =
-100 to +19 +20 to +39 +40 to +59 +60 to +79 +80 to +100
Service ExperienceBureaucratic vs. Efficient
DISTRIBUTION -- 13% 88%
DISTRIBUTION 13% 13% 75%
DISTRIBUTION 11% 18% 70%
DISTRIBUTION 15% 22% 63%
DISTRIBUTION 17% 23% 60%
DISTRIBUTION 14% 32% 55%
DISTRIBUTION 13% 20% 66%
1 SNAP CRM +88
2 Metrix CRM +62
3 Power Sync CRM +59
4 Cascade CRM +48
5 Pederson Client Management Solution +43
6 VineCRM +41
CATEGORY AVERAGE +53
DISTRIBUTION -- -- 100%
DISTRIBUTION -- 33% 67%
DISTRIBUTION -- -- 100%
DISTRIBUTION 100% -- --
- Monetize CRM +100
- Apex CRM Solution +67
- Maple CRM +100
- Epic Customer Management Solutions -100
Service ExperienceNeglectful vs. Caring
DISTRIBUTION -- 25% 75%
DISTRIBUTION 13% 9% 78%
DISTRIBUTION 8% 23% 69%
DISTRIBUTION 7% 30% 63%
DISTRIBUTION 9% 32% 59%
DISTRIBUTION 13% 26% 62%
DISTRIBUTION 9% 24% 67%
1 SNAP CRM +75
2 Metrix CRM +65
3 Power Sync CRM +61
4 Cascade CRM +56
5 VineCRM +50
6 Pederson Client Management Solution +49
CATEGORY AVERAGE +57
DISTRIBUTION -- 33% 67%
DISTRIBUTION -- 33% 67%
DISTRIBUTION -- -- 100%
DISTRIBUTION 100% -- --
- Monetize CRM +67
- Apex CRM Solution +67
- Maple CRM +100
- Epic Customer Management Solutions -100
22
Customer Relationship Management Category Report
Emotional Footprint This section digs deeper into the emotional connection between software vendors and users, displaying user responses to a variety of specific “emotional spectrum” scenarios that express dimensionsof the vendor-client relationship and product effectiveness. These scenarios are organized thematically by category. Use this information to understand the details behind each vendor’s Net EmotionalFootprint score, and to target areas of particular interest or concern.
-4 -3 -2 -1NEGATIVE
+1NEUTRAL
+2 +3 +4POSITIVE
EMOTIONAL SPECTRUM SCALE %POSITIVE
%NEGATIVE
EMOTIONALFOOTPRINT- =
-100 to +19 +20 to +39 +40 to +59 +60 to +79 +80 to +100
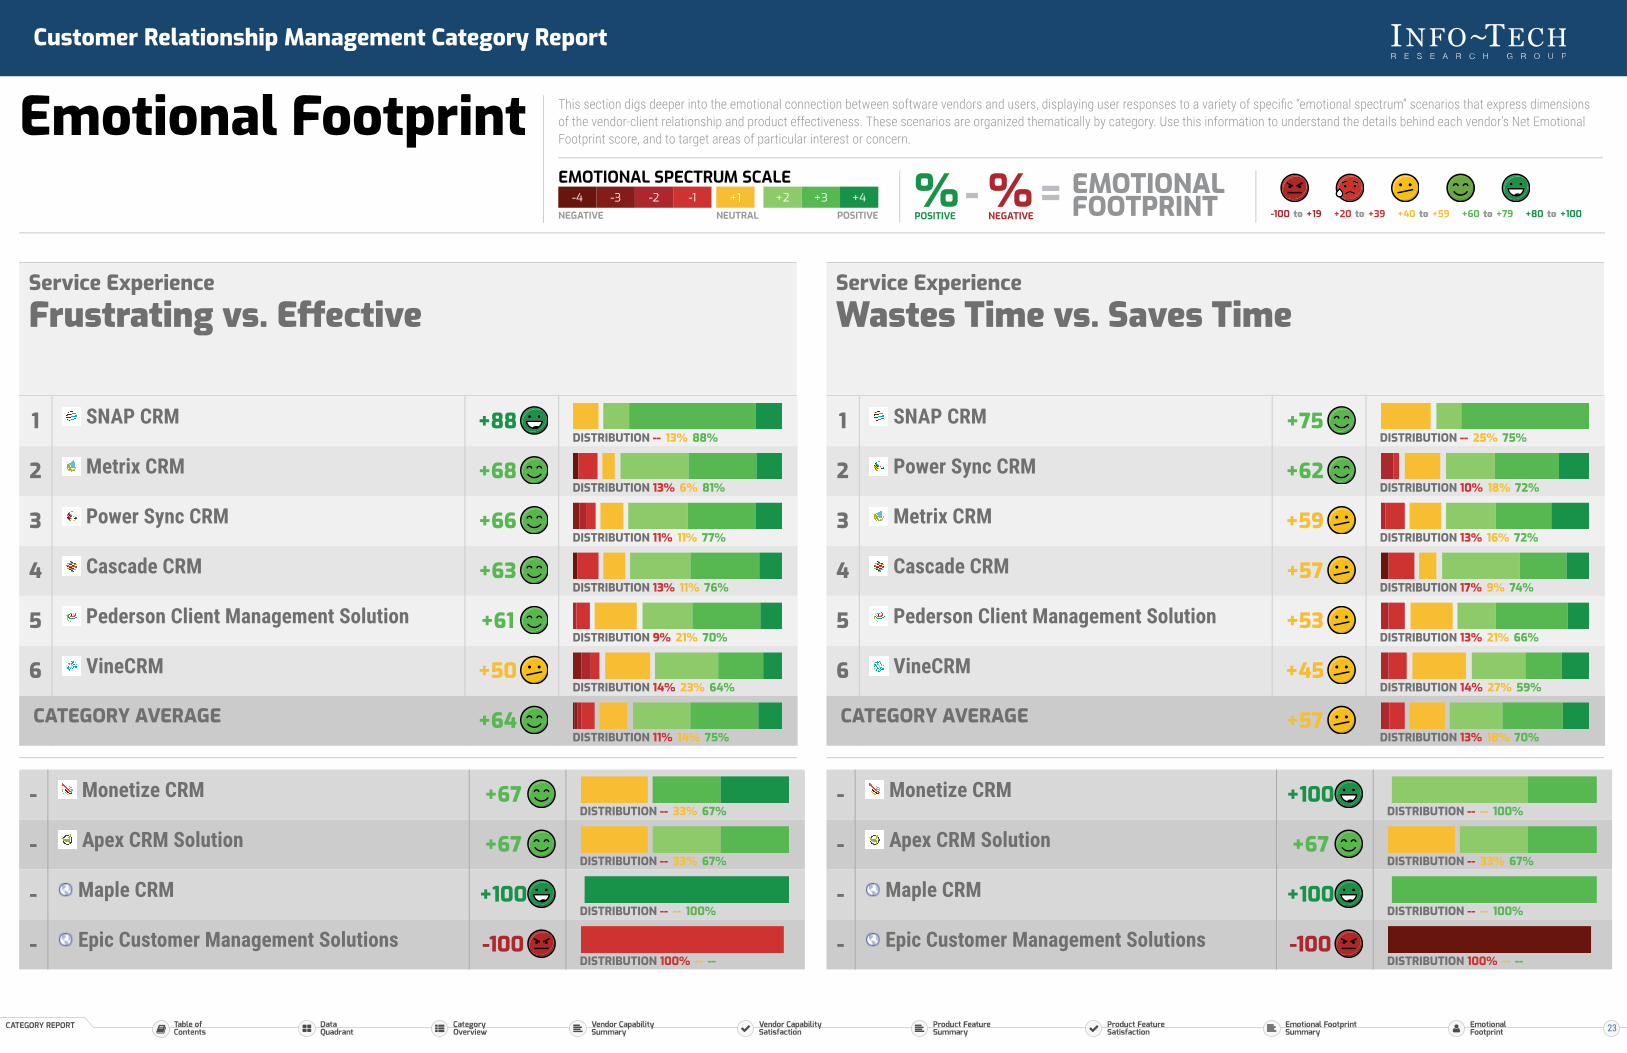
Service ExperienceFrustrating vs. Effective
DISTRIBUTION -- 13% 88%
DISTRIBUTION 13% 6% 81%
DISTRIBUTION 11% 11% 77%
DISTRIBUTION 13% 11% 76%
DISTRIBUTION 9% 21% 70%
DISTRIBUTION 14% 23% 64%
DISTRIBUTION 11% 14% 75%
1 SNAP CRM +88
2 Metrix CRM +68
3 Power Sync CRM +66
4 Cascade CRM +63
5 Pederson Client Management Solution +61
6 VineCRM +50
CATEGORY AVERAGE +64
DISTRIBUTION -- 33% 67%
DISTRIBUTION -- 33% 67%
DISTRIBUTION -- -- 100%
DISTRIBUTION 100% -- --
- Monetize CRM +67
- Apex CRM Solution +67
- Maple CRM +100
- Epic Customer Management Solutions -100
Service ExperienceWastes Time vs. Saves Time
DISTRIBUTION -- 25% 75%
DISTRIBUTION 10% 18% 72%
DISTRIBUTION 13% 16% 72%
DISTRIBUTION 17% 9% 74%
DISTRIBUTION 13% 21% 66%
DISTRIBUTION 14% 27% 59%
DISTRIBUTION 13% 18% 70%
1 SNAP CRM +75
2 Power Sync CRM +62
3 Metrix CRM +59
4 Cascade CRM +57
5 Pederson Client Management Solution +53
6 VineCRM +45
CATEGORY AVERAGE +57
DISTRIBUTION -- -- 100%
DISTRIBUTION -- 33% 67%
DISTRIBUTION -- -- 100%
DISTRIBUTION 100% -- --
- Monetize CRM +100
- Apex CRM Solution +67
- Maple CRM +100
- Epic Customer Management Solutions -100
23
Customer Relationship Management Category Report
Emotional Footprint This section digs deeper into the emotional connection between software vendors and users, displaying user responses to a variety of specific “emotional spectrum” scenarios that express dimensionsof the vendor-client relationship and product effectiveness. These scenarios are organized thematically by category. Use this information to understand the details behind each vendor’s Net EmotionalFootprint score, and to target areas of particular interest or concern.
-4 -3 -2 -1NEGATIVE
+1NEUTRAL
+2 +3 +4POSITIVE
EMOTIONAL SPECTRUM SCALE %POSITIVE
%NEGATIVE
EMOTIONALFOOTPRINT- =
-100 to +19 +20 to +39 +40 to +59 +60 to +79 +80 to +100
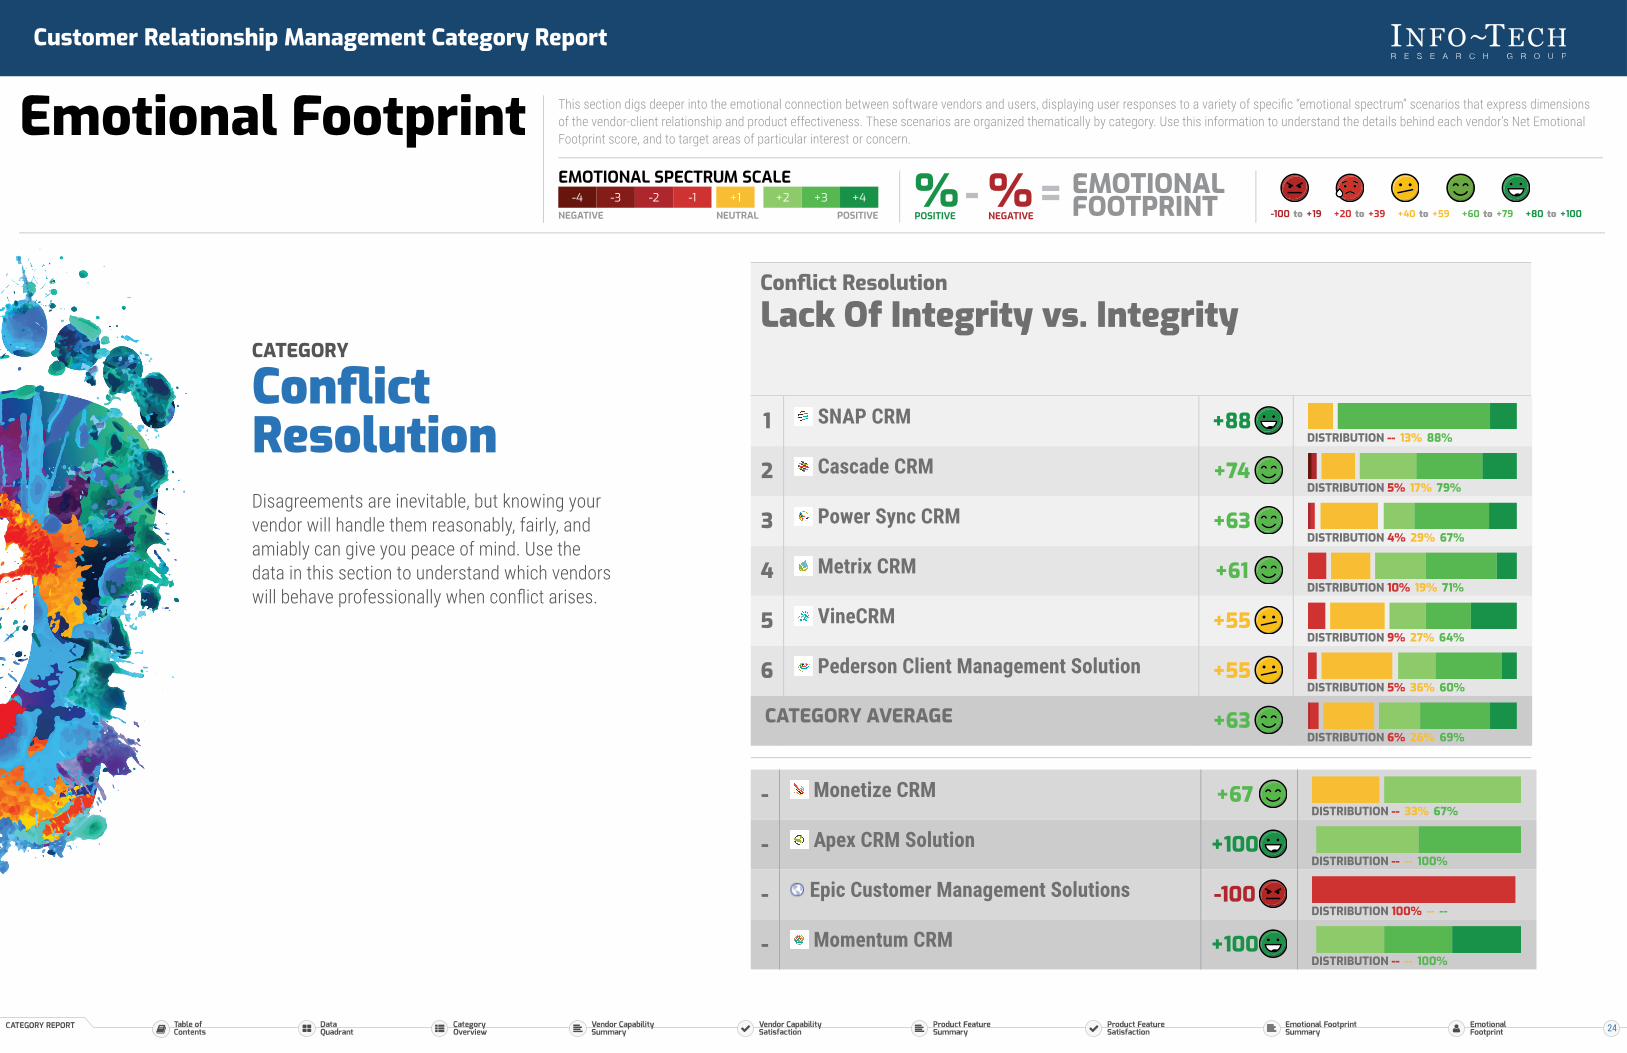
CATEGORY
ConflictResolutionDisagreements are inevitable, but knowing yourvendor will handle them reasonably, fairly, andamiably can give you peace of mind. Use thedata in this section to understand which vendorswill behave professionally when conflict arises.
Conflict ResolutionLack Of Integrity vs. Integrity
DISTRIBUTION -- 13% 88%
DISTRIBUTION 5% 17% 79%
DISTRIBUTION 4% 29% 67%
DISTRIBUTION 10% 19% 71%
DISTRIBUTION 9% 27% 64%
DISTRIBUTION 5% 36% 60%
DISTRIBUTION 6% 26% 69%
1 SNAP CRM +88
2 Cascade CRM +74
3 Power Sync CRM +63
4 Metrix CRM +61
5 VineCRM +55
6 Pederson Client Management Solution +55
CATEGORY AVERAGE +63
DISTRIBUTION -- 33% 67%
DISTRIBUTION -- -- 100%
DISTRIBUTION 100% -- --
DISTRIBUTION -- -- 100%
- Monetize CRM +67
- Apex CRM Solution +100
- Epic Customer Management Solutions -100
- Momentum CRM +100
24
Customer Relationship Management Category Report
Emotional Footprint This section digs deeper into the emotional connection between software vendors and users, displaying user responses to a variety of specific “emotional spectrum” scenarios that express dimensionsof the vendor-client relationship and product effectiveness. These scenarios are organized thematically by category. Use this information to understand the details behind each vendor’s Net EmotionalFootprint score, and to target areas of particular interest or concern.
-4 -3 -2 -1NEGATIVE
+1NEUTRAL
+2 +3 +4POSITIVE
EMOTIONAL SPECTRUM SCALE %POSITIVE
%NEGATIVE
EMOTIONALFOOTPRINT- =
-100 to +19 +20 to +39 +40 to +59 +60 to +79 +80 to +100
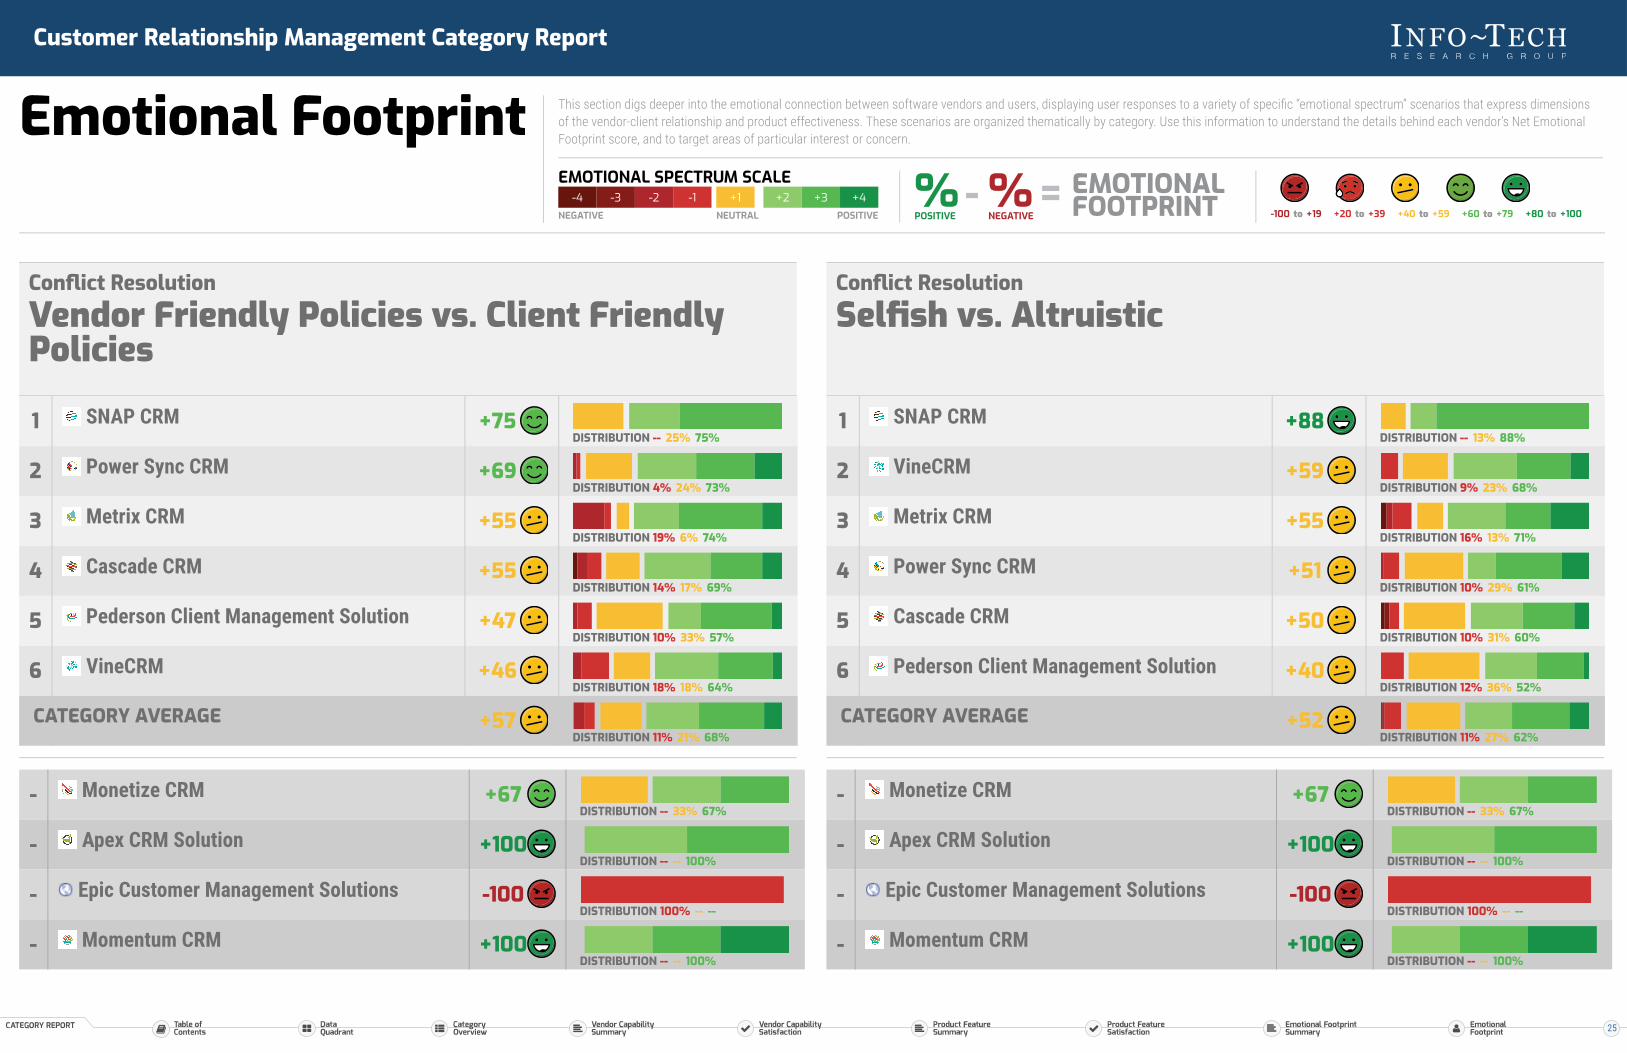
Conflict ResolutionVendor Friendly Policies vs. Client FriendlyPolicies
DISTRIBUTION -- 25% 75%
DISTRIBUTION 4% 24% 73%
DISTRIBUTION 19% 6% 74%
DISTRIBUTION 14% 17% 69%
DISTRIBUTION 10% 33% 57%
DISTRIBUTION 18% 18% 64%
DISTRIBUTION 11% 21% 68%
1 SNAP CRM +75
2 Power Sync CRM +69
3 Metrix CRM +55
4 Cascade CRM +55
5 Pederson Client Management Solution +47
6 VineCRM +46
CATEGORY AVERAGE +57
DISTRIBUTION -- 33% 67%
DISTRIBUTION -- -- 100%
DISTRIBUTION 100% -- --
DISTRIBUTION -- -- 100%
- Monetize CRM +67
- Apex CRM Solution +100
- Epic Customer Management Solutions -100
- Momentum CRM +100
Conflict ResolutionSelfish vs. Altruistic
DISTRIBUTION -- 13% 88%
DISTRIBUTION 9% 23% 68%
DISTRIBUTION 16% 13% 71%
DISTRIBUTION 10% 29% 61%
DISTRIBUTION 10% 31% 60%
DISTRIBUTION 12% 36% 52%
DISTRIBUTION 11% 27% 62%
1 SNAP CRM +88
2 VineCRM +59
3 Metrix CRM +55
4 Power Sync CRM +51
5 Cascade CRM +50
6 Pederson Client Management Solution +40
CATEGORY AVERAGE +52
DISTRIBUTION -- 33% 67%
DISTRIBUTION -- -- 100%
DISTRIBUTION 100% -- --
DISTRIBUTION -- -- 100%
- Monetize CRM +67
- Apex CRM Solution +100
- Epic Customer Management Solutions -100
- Momentum CRM +100
25
Customer Relationship Management Category Report
Emotional Footprint This section digs deeper into the emotional connection between software vendors and users, displaying user responses to a variety of specific “emotional spectrum” scenarios that express dimensionsof the vendor-client relationship and product effectiveness. These scenarios are organized thematically by category. Use this information to understand the details behind each vendor’s Net EmotionalFootprint score, and to target areas of particular interest or concern.
-4 -3 -2 -1NEGATIVE
+1NEUTRAL
+2 +3 +4POSITIVE
EMOTIONAL SPECTRUM SCALE %POSITIVE
%NEGATIVE
EMOTIONALFOOTPRINT- =
-100 to +19 +20 to +39 +40 to +59 +60 to +79 +80 to +100
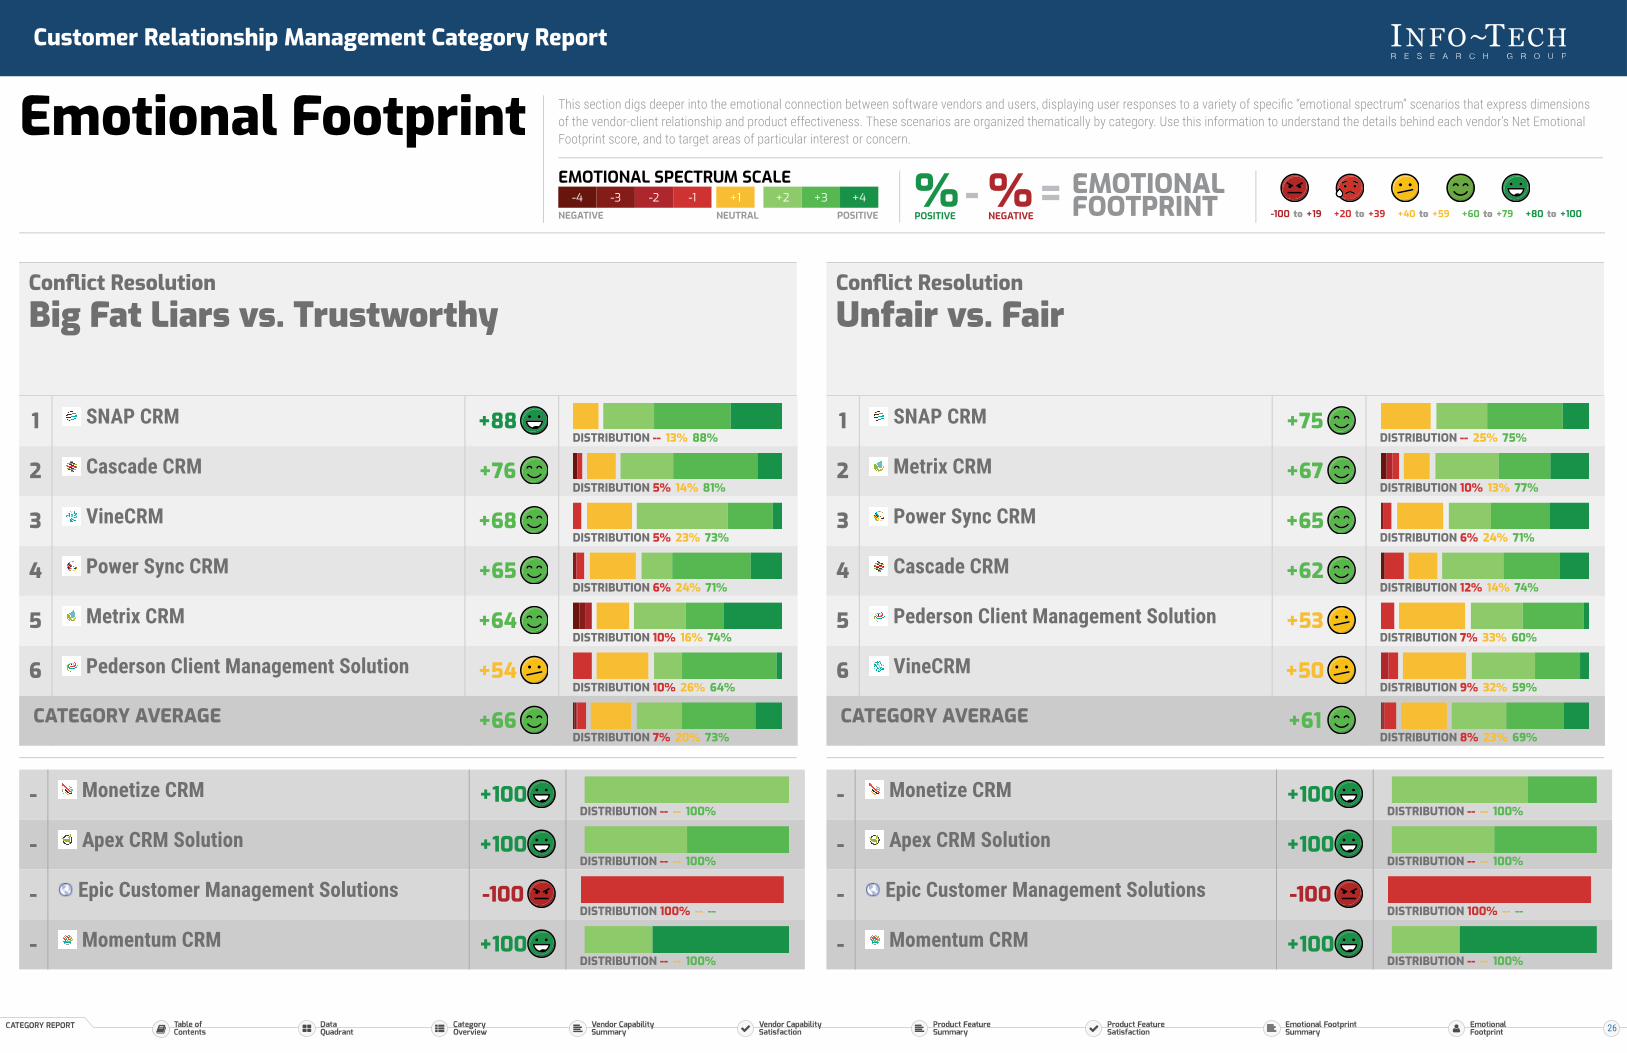
Conflict ResolutionBig Fat Liars vs. Trustworthy
DISTRIBUTION -- 13% 88%
DISTRIBUTION 5% 14% 81%
DISTRIBUTION 5% 23% 73%
DISTRIBUTION 6% 24% 71%
DISTRIBUTION 10% 16% 74%
DISTRIBUTION 10% 26% 64%
DISTRIBUTION 7% 20% 73%
1 SNAP CRM +88
2 Cascade CRM +76
3 VineCRM +68
4 Power Sync CRM +65
5 Metrix CRM +64
6 Pederson Client Management Solution +54
CATEGORY AVERAGE +66
DISTRIBUTION -- -- 100%
DISTRIBUTION -- -- 100%
DISTRIBUTION 100% -- --
DISTRIBUTION -- -- 100%
- Monetize CRM +100
- Apex CRM Solution +100
- Epic Customer Management Solutions -100
- Momentum CRM +100
Conflict ResolutionUnfair vs. Fair
DISTRIBUTION -- 25% 75%
DISTRIBUTION 10% 13% 77%
DISTRIBUTION 6% 24% 71%
DISTRIBUTION 12% 14% 74%
DISTRIBUTION 7% 33% 60%
DISTRIBUTION 9% 32% 59%
DISTRIBUTION 8% 23% 69%
1 SNAP CRM +75
2 Metrix CRM +67
3 Power Sync CRM +65
4 Cascade CRM +62
5 Pederson Client Management Solution +53
6 VineCRM +50
CATEGORY AVERAGE +61
DISTRIBUTION -- -- 100%
DISTRIBUTION -- -- 100%
DISTRIBUTION 100% -- --
DISTRIBUTION -- -- 100%
- Monetize CRM +100
- Apex CRM Solution +100
- Epic Customer Management Solutions -100
- Momentum CRM +100
26

Customer Relationship Management Category Report
Emotional Footprint This section digs deeper into the emotional connection between software vendors and users, displaying user responses to a variety of specific “emotional spectrum” scenarios that express dimensionsof the vendor-client relationship and product effectiveness. These scenarios are organized thematically by category. Use this information to understand the details behind each vendor’s Net EmotionalFootprint score, and to target areas of particular interest or concern.
-4 -3 -2 -1NEGATIVE
+1NEUTRAL
+2 +3 +4POSITIVE
EMOTIONAL SPECTRUM SCALE %POSITIVE
%NEGATIVE
EMOTIONALFOOTPRINT- =
-100 to +19 +20 to +39 +40 to +59 +60 to +79 +80 to +100
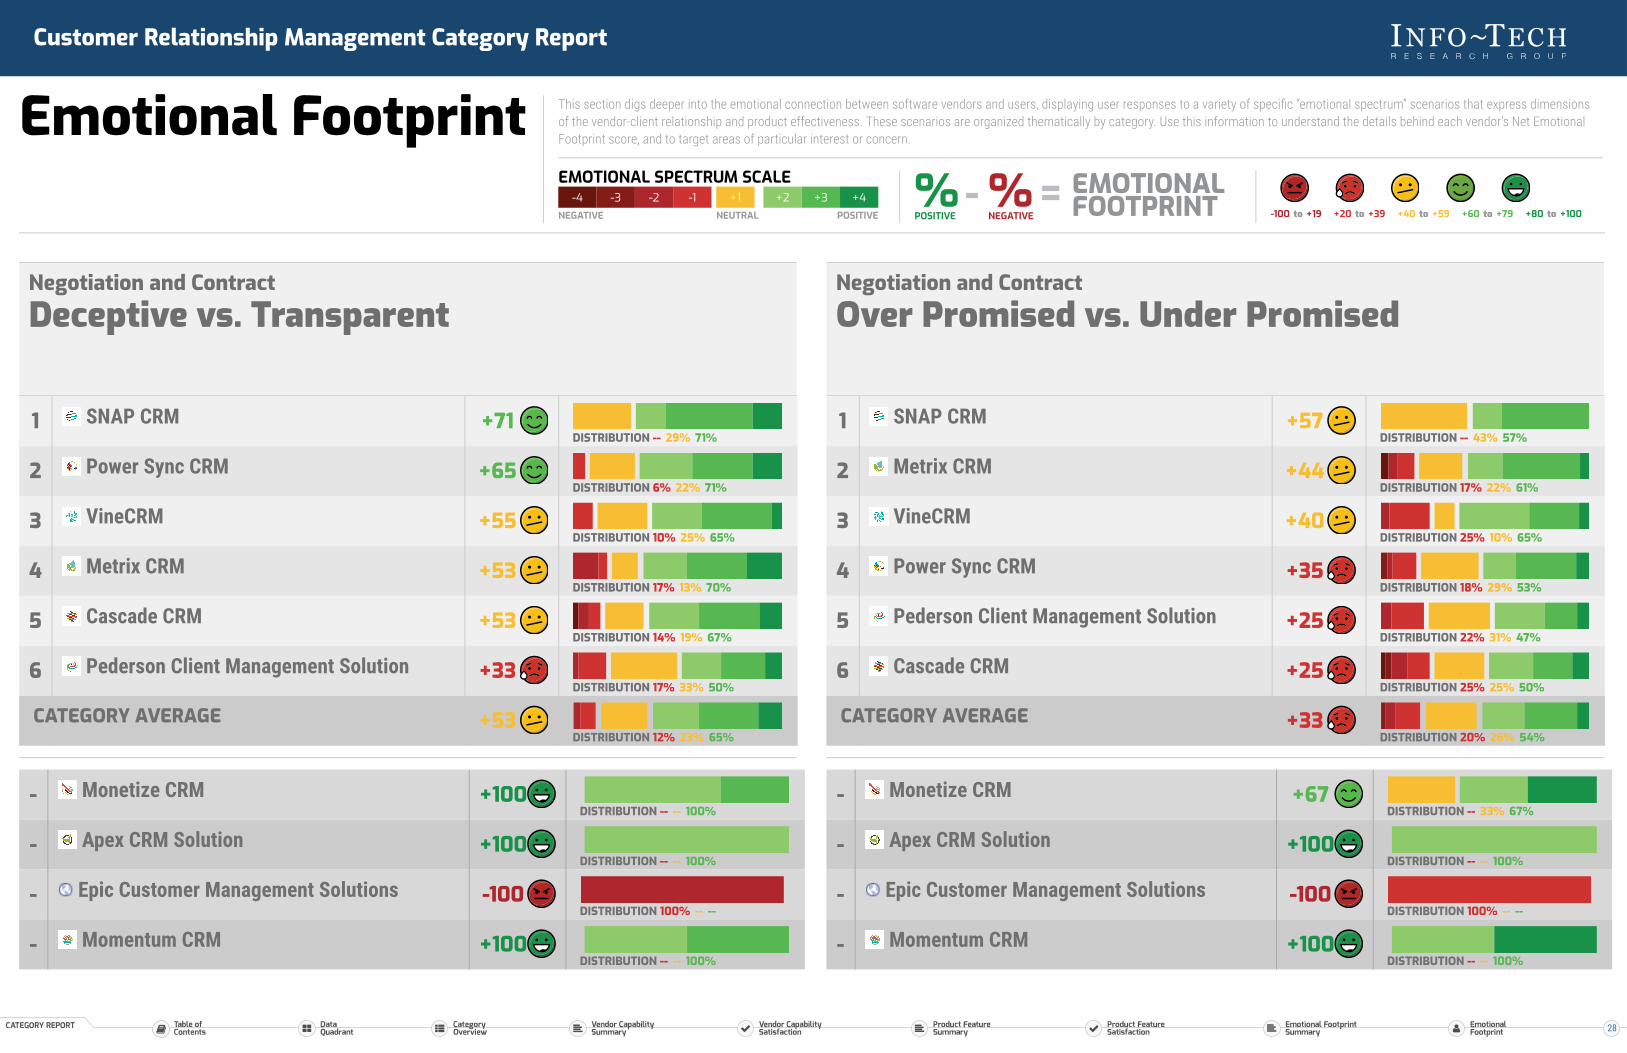
CATEGORY
Negotiation andContractNegotiation doesn’t have to be adversarial. Bothparties are always looking to get the best deal,but finding a vendor who will work with yourather than against makes it more likely you’llboth be happy with the results. Use the data inthis section to determine which vendors willnegotiate pleasantly and in good faith.
Negotiation and ContractGreedy vs. Generous
DISTRIBUTION -- 29% 71%
DISTRIBUTION 17% 17% 65%
DISTRIBUTION 10% 33% 57%
DISTRIBUTION 20% 15% 65%
DISTRIBUTION 17% 25% 58%
DISTRIBUTION 22% 19% 59%
DISTRIBUTION 16% 24% 60%
1 SNAP CRM +71
2 Metrix CRM +48
3 Power Sync CRM +47
4 VineCRM +45
5 Pederson Client Management Solution +41
6 Cascade CRM +37
CATEGORY AVERAGE +45
DISTRIBUTION -- 33% 67%
DISTRIBUTION -- -- 100%
DISTRIBUTION 100% -- --
DISTRIBUTION -- -- 100%
- Monetize CRM +67
- Apex CRM Solution +100
- Epic Customer Management Solutions -100
- Momentum CRM +100
27
Customer Relationship Management Category Report
Emotional Footprint This section digs deeper into the emotional connection between software vendors and users, displaying user responses to a variety of specific “emotional spectrum” scenarios that express dimensionsof the vendor-client relationship and product effectiveness. These scenarios are organized thematically by category. Use this information to understand the details behind each vendor’s Net EmotionalFootprint score, and to target areas of particular interest or concern.
-4 -3 -2 -1NEGATIVE
+1NEUTRAL
+2 +3 +4POSITIVE
EMOTIONAL SPECTRUM SCALE %POSITIVE
%NEGATIVE
EMOTIONALFOOTPRINT- =
-100 to +19 +20 to +39 +40 to +59 +60 to +79 +80 to +100
Negotiation and ContractDeceptive vs. Transparent
DISTRIBUTION -- 29% 71%
DISTRIBUTION 6% 22% 71%
DISTRIBUTION 10% 25% 65%
DISTRIBUTION 17% 13% 70%
DISTRIBUTION 14% 19% 67%
DISTRIBUTION 17% 33% 50%
DISTRIBUTION 12% 23% 65%
1 SNAP CRM +71
2 Power Sync CRM +65
3 VineCRM +55
4 Metrix CRM +53
5 Cascade CRM +53
6 Pederson Client Management Solution +33
CATEGORY AVERAGE +53
DISTRIBUTION -- -- 100%
DISTRIBUTION -- -- 100%
DISTRIBUTION 100% -- --
DISTRIBUTION -- -- 100%
- Monetize CRM +100
- Apex CRM Solution +100
- Epic Customer Management Solutions -100
- Momentum CRM +100
Negotiation and ContractOver Promised vs. Under Promised
DISTRIBUTION -- 43% 57%
DISTRIBUTION 17% 22% 61%
DISTRIBUTION 25% 10% 65%
DISTRIBUTION 18% 29% 53%
DISTRIBUTION 22% 31% 47%
DISTRIBUTION 25% 25% 50%
DISTRIBUTION 20% 26% 54%
1 SNAP CRM +57
2 Metrix CRM +44
3 VineCRM +40
4 Power Sync CRM +35
5 Pederson Client Management Solution +25
6 Cascade CRM +25
CATEGORY AVERAGE +33
DISTRIBUTION -- 33% 67%
DISTRIBUTION -- -- 100%
DISTRIBUTION 100% -- --
DISTRIBUTION -- -- 100%
- Monetize CRM +67
- Apex CRM Solution +100
- Epic Customer Management Solutions -100
- Momentum CRM +100
28
Customer Relationship Management Category Report
Emotional Footprint This section digs deeper into the emotional connection between software vendors and users, displaying user responses to a variety of specific “emotional spectrum” scenarios that express dimensionsof the vendor-client relationship and product effectiveness. These scenarios are organized thematically by category. Use this information to understand the details behind each vendor’s Net EmotionalFootprint score, and to target areas of particular interest or concern.
-4 -3 -2 -1NEGATIVE
+1NEUTRAL
+2 +3 +4POSITIVE
EMOTIONAL SPECTRUM SCALE %POSITIVE
%NEGATIVE
EMOTIONALFOOTPRINT- =
-100 to +19 +20 to +39 +40 to +59 +60 to +79 +80 to +100
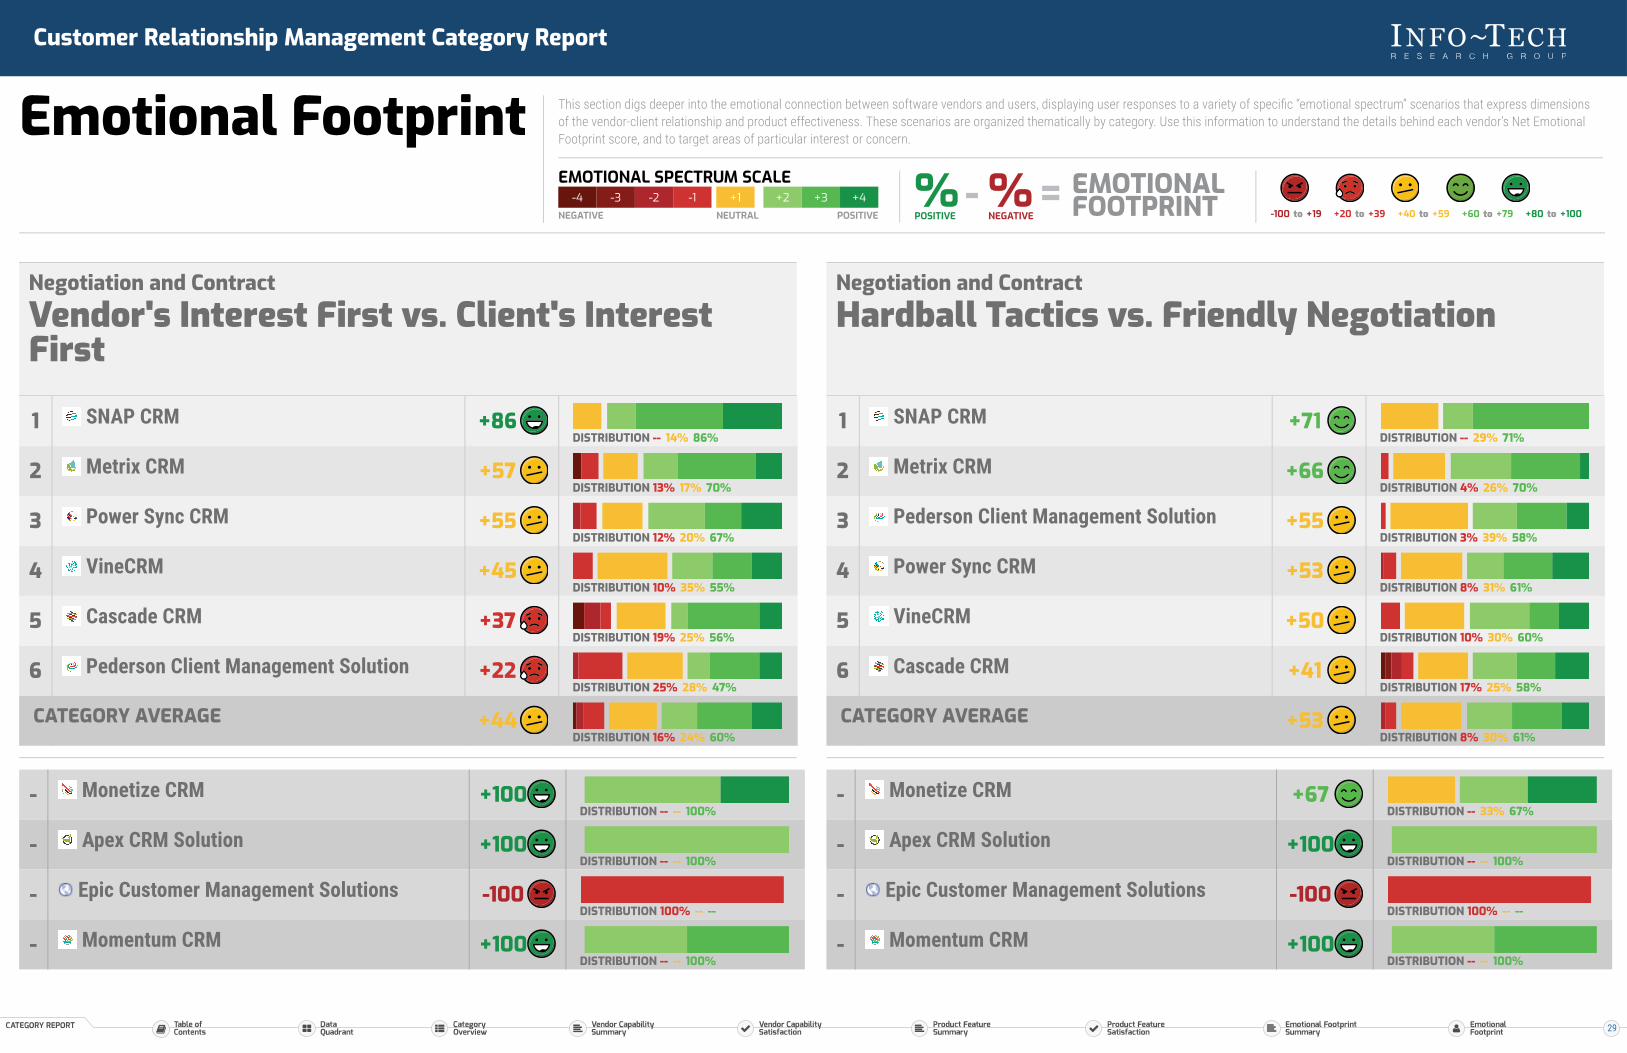
Negotiation and ContractVendor's Interest First vs. Client's InterestFirst
DISTRIBUTION -- 14% 86%
DISTRIBUTION 13% 17% 70%
DISTRIBUTION 12% 20% 67%
DISTRIBUTION 10% 35% 55%
DISTRIBUTION 19% 25% 56%
DISTRIBUTION 25% 28% 47%
DISTRIBUTION 16% 24% 60%
1 SNAP CRM +86
2 Metrix CRM +57
3 Power Sync CRM +55
4 VineCRM +45
5 Cascade CRM +37
6 Pederson Client Management Solution +22
CATEGORY AVERAGE +44
DISTRIBUTION -- -- 100%
DISTRIBUTION -- -- 100%
DISTRIBUTION 100% -- --
DISTRIBUTION -- -- 100%
- Monetize CRM +100
- Apex CRM Solution +100
- Epic Customer Management Solutions -100
- Momentum CRM +100
Negotiation and ContractHardball Tactics vs. Friendly Negotiation
DISTRIBUTION -- 29% 71%
DISTRIBUTION 4% 26% 70%
DISTRIBUTION 3% 39% 58%
DISTRIBUTION 8% 31% 61%
DISTRIBUTION 10% 30% 60%
DISTRIBUTION 17% 25% 58%
DISTRIBUTION 8% 30% 61%
1 SNAP CRM +71
2 Metrix CRM +66
3 Pederson Client Management Solution +55
4 Power Sync CRM +53
5 VineCRM +50
6 Cascade CRM +41
CATEGORY AVERAGE +53
DISTRIBUTION -- 33% 67%
DISTRIBUTION -- -- 100%
DISTRIBUTION 100% -- --
DISTRIBUTION -- -- 100%
- Monetize CRM +67
- Apex CRM Solution +100
- Epic Customer Management Solutions -100
- Momentum CRM +100
29
Customer Relationship Management Category Report
Emotional Footprint This section digs deeper into the emotional connection between software vendors and users, displaying user responses to a variety of specific “emotional spectrum” scenarios that express dimensionsof the vendor-client relationship and product effectiveness. These scenarios are organized thematically by category. Use this information to understand the details behind each vendor’s Net EmotionalFootprint score, and to target areas of particular interest or concern.
-4 -3 -2 -1NEGATIVE
+1NEUTRAL
+2 +3 +4POSITIVE
EMOTIONAL SPECTRUM SCALE %POSITIVE
%NEGATIVE
EMOTIONALFOOTPRINT- =
-100 to +19 +20 to +39 +40 to +59 +60 to +79 +80 to +100
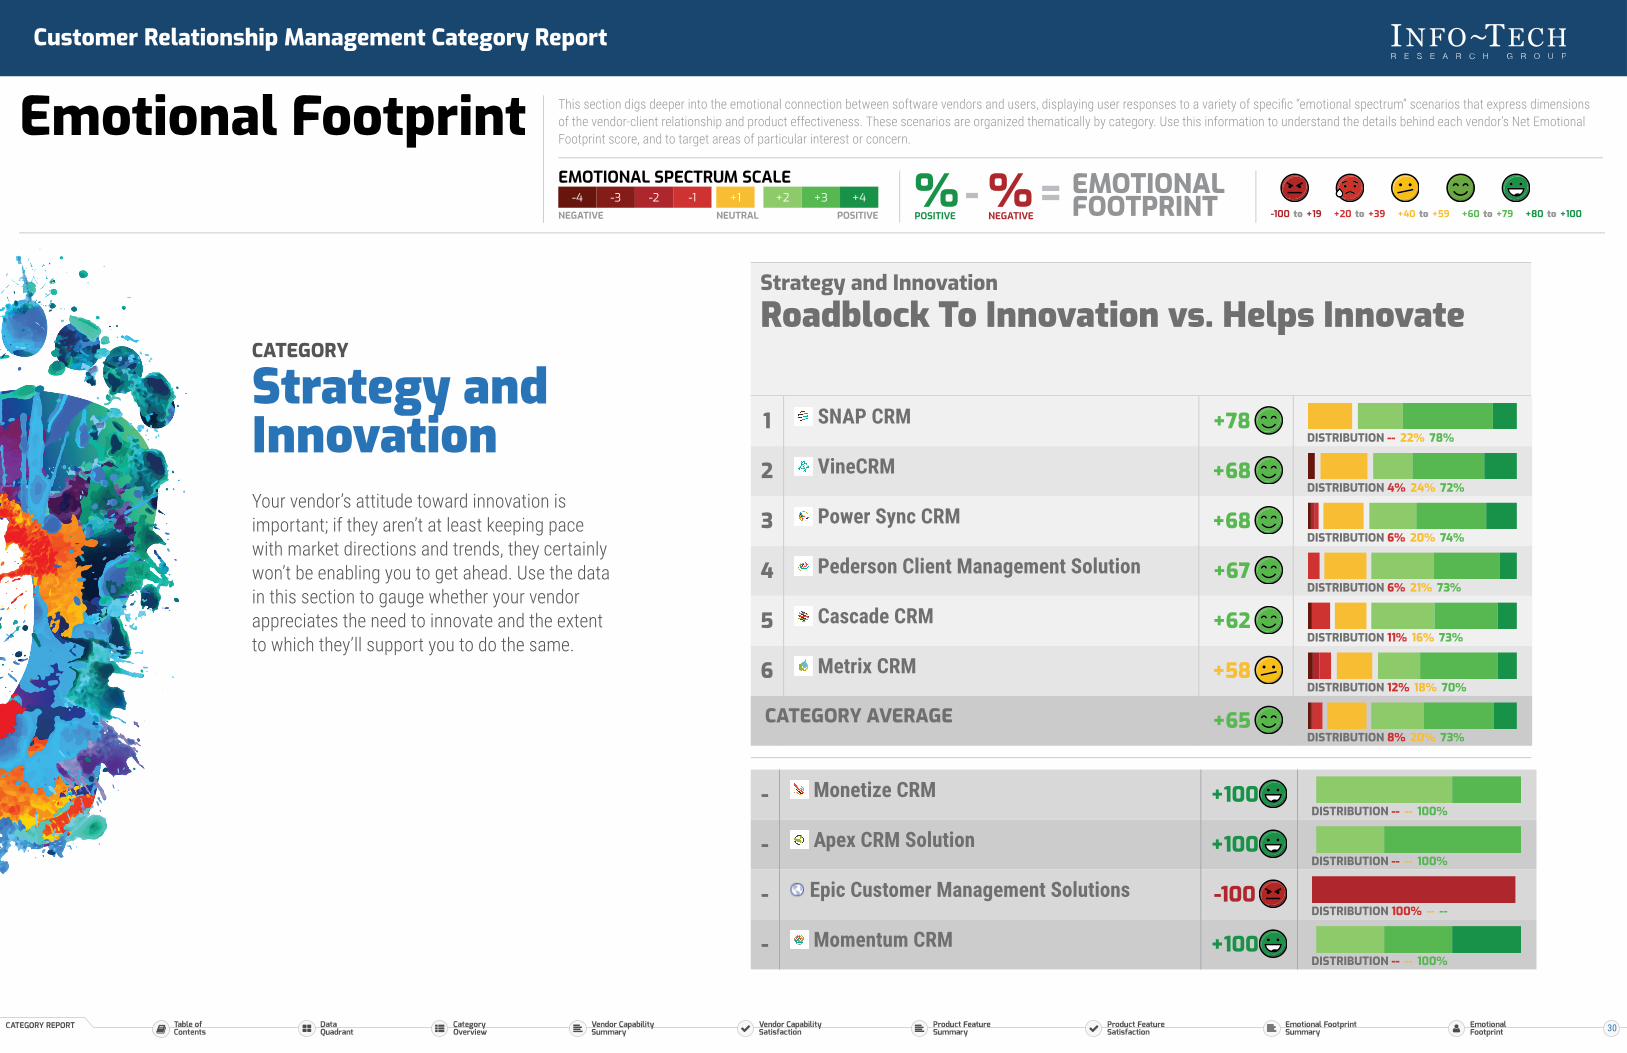
CATEGORY
Strategy andInnovationYour vendor’s attitude toward innovation isimportant; if they aren’t at least keeping pacewith market directions and trends, they certainlywon’t be enabling you to get ahead. Use the datain this section to gauge whether your vendorappreciates the need to innovate and the extentto which they’ll support you to do the same.
Strategy and InnovationRoadblock To Innovation vs. Helps Innovate
DISTRIBUTION -- 22% 78%
DISTRIBUTION 4% 24% 72%
DISTRIBUTION 6% 20% 74%
DISTRIBUTION 6% 21% 73%
DISTRIBUTION 11% 16% 73%
DISTRIBUTION 12% 18% 70%
DISTRIBUTION 8% 20% 73%
1 SNAP CRM +78
2 VineCRM +68
3 Power Sync CRM +68
4 Pederson Client Management Solution +67
5 Cascade CRM +62
6 Metrix CRM +58
CATEGORY AVERAGE +65
DISTRIBUTION -- -- 100%
DISTRIBUTION -- -- 100%
DISTRIBUTION 100% -- --
DISTRIBUTION -- -- 100%
- Monetize CRM +100
- Apex CRM Solution +100
- Epic Customer Management Solutions -100
- Momentum CRM +100
30
Customer Relationship Management Category Report
Emotional Footprint This section digs deeper into the emotional connection between software vendors and users, displaying user responses to a variety of specific “emotional spectrum” scenarios that express dimensionsof the vendor-client relationship and product effectiveness. These scenarios are organized thematically by category. Use this information to understand the details behind each vendor’s Net EmotionalFootprint score, and to target areas of particular interest or concern.
-4 -3 -2 -1NEGATIVE
+1NEUTRAL
+2 +3 +4POSITIVE
EMOTIONAL SPECTRUM SCALE %POSITIVE
%NEGATIVE
EMOTIONALFOOTPRINT- =
-100 to +19 +20 to +39 +40 to +59 +60 to +79 +80 to +100
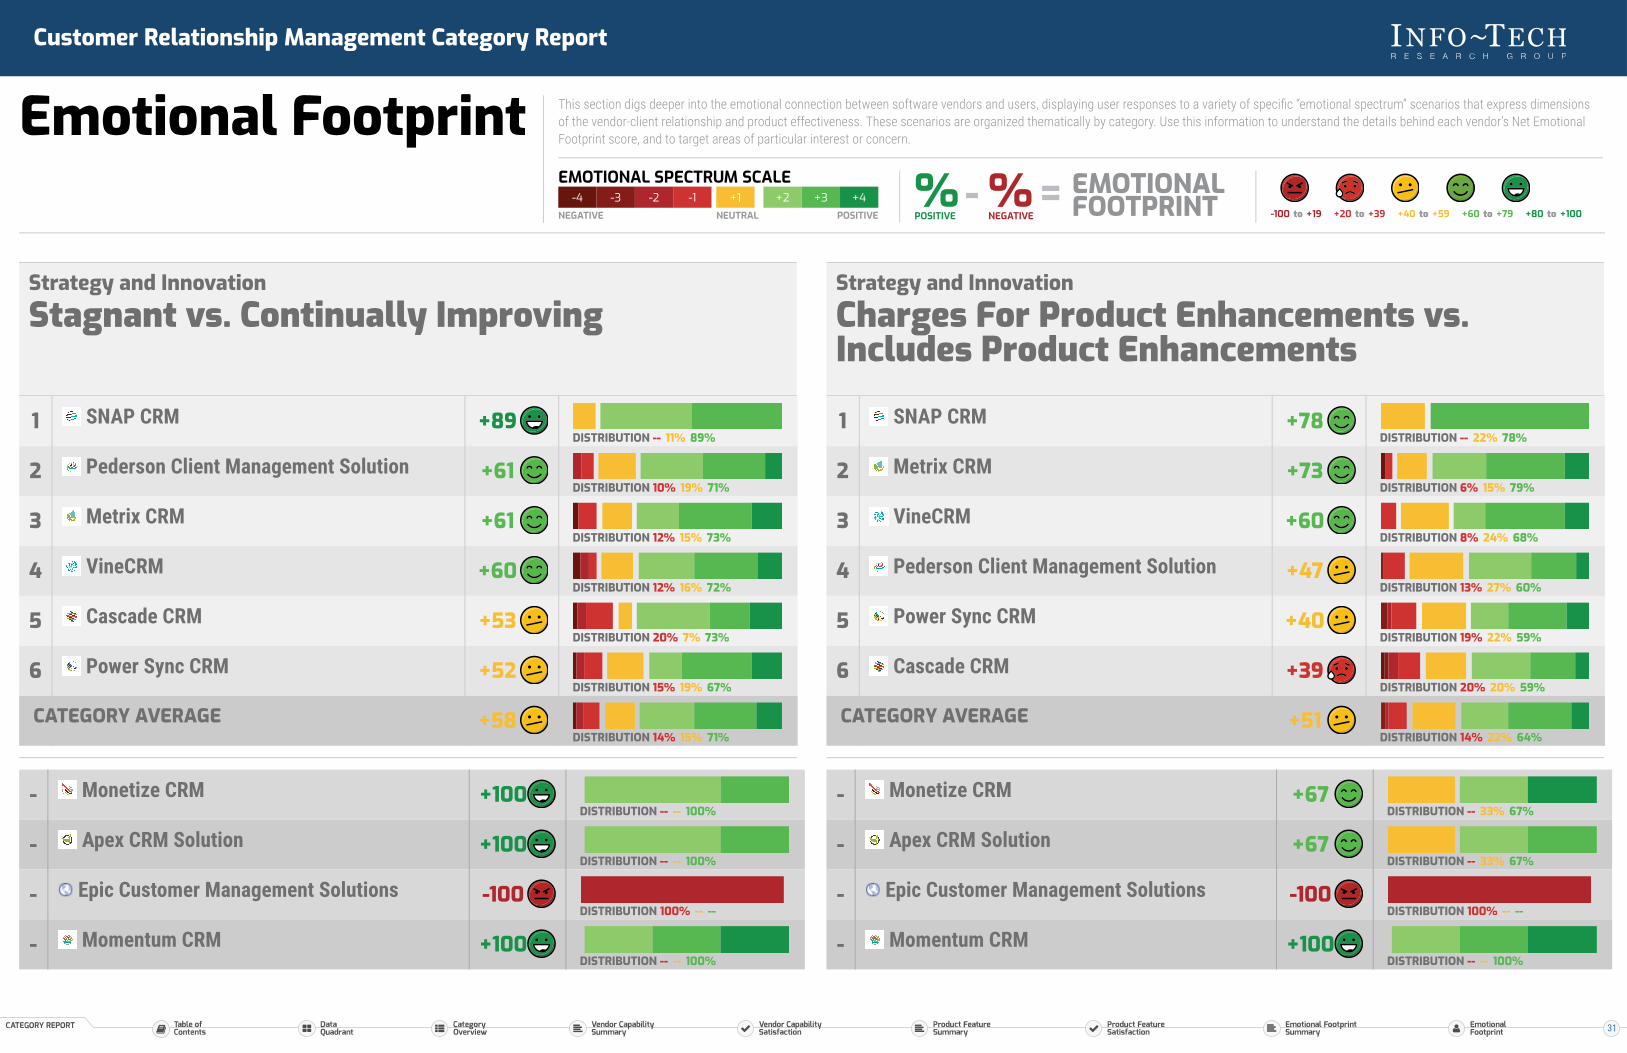
Strategy and InnovationStagnant vs. Continually Improving
DISTRIBUTION -- 11% 89%
DISTRIBUTION 10% 19% 71%
DISTRIBUTION 12% 15% 73%
DISTRIBUTION 12% 16% 72%
DISTRIBUTION 20% 7% 73%
DISTRIBUTION 15% 19% 67%
DISTRIBUTION 14% 15% 71%
1 SNAP CRM +89
2 Pederson Client Management Solution +61
3 Metrix CRM +61
4 VineCRM +60
5 Cascade CRM +53
6 Power Sync CRM +52
CATEGORY AVERAGE +58
DISTRIBUTION -- -- 100%
DISTRIBUTION -- -- 100%
DISTRIBUTION 100% -- --
DISTRIBUTION -- -- 100%
- Monetize CRM +100
- Apex CRM Solution +100
- Epic Customer Management Solutions -100
- Momentum CRM +100
Strategy and InnovationCharges For Product Enhancements vs.Includes Product Enhancements
DISTRIBUTION -- 22% 78%
DISTRIBUTION 6% 15% 79%
DISTRIBUTION 8% 24% 68%
DISTRIBUTION 13% 27% 60%
DISTRIBUTION 19% 22% 59%
DISTRIBUTION 20% 20% 59%
DISTRIBUTION 14% 22% 64%
1 SNAP CRM +78
2 Metrix CRM +73
3 VineCRM +60
4 Pederson Client Management Solution +47
5 Power Sync CRM +40
6 Cascade CRM +39
CATEGORY AVERAGE +51
DISTRIBUTION -- 33% 67%
DISTRIBUTION -- 33% 67%
DISTRIBUTION 100% -- --
DISTRIBUTION -- -- 100%
- Monetize CRM +67
- Apex CRM Solution +67
- Epic Customer Management Solutions -100
- Momentum CRM +100
31
Customer Relationship Management Category Report
Emotional Footprint This section digs deeper into the emotional connection between software vendors and users, displaying user responses to a variety of specific “emotional spectrum” scenarios that express dimensionsof the vendor-client relationship and product effectiveness. These scenarios are organized thematically by category. Use this information to understand the details behind each vendor’s Net EmotionalFootprint score, and to target areas of particular interest or concern.
-4 -3 -2 -1NEGATIVE
+1NEUTRAL
+2 +3 +4POSITIVE
EMOTIONAL SPECTRUM SCALE %POSITIVE
%NEGATIVE
EMOTIONALFOOTPRINT- =
-100 to +19 +20 to +39 +40 to +59 +60 to +79 +80 to +100
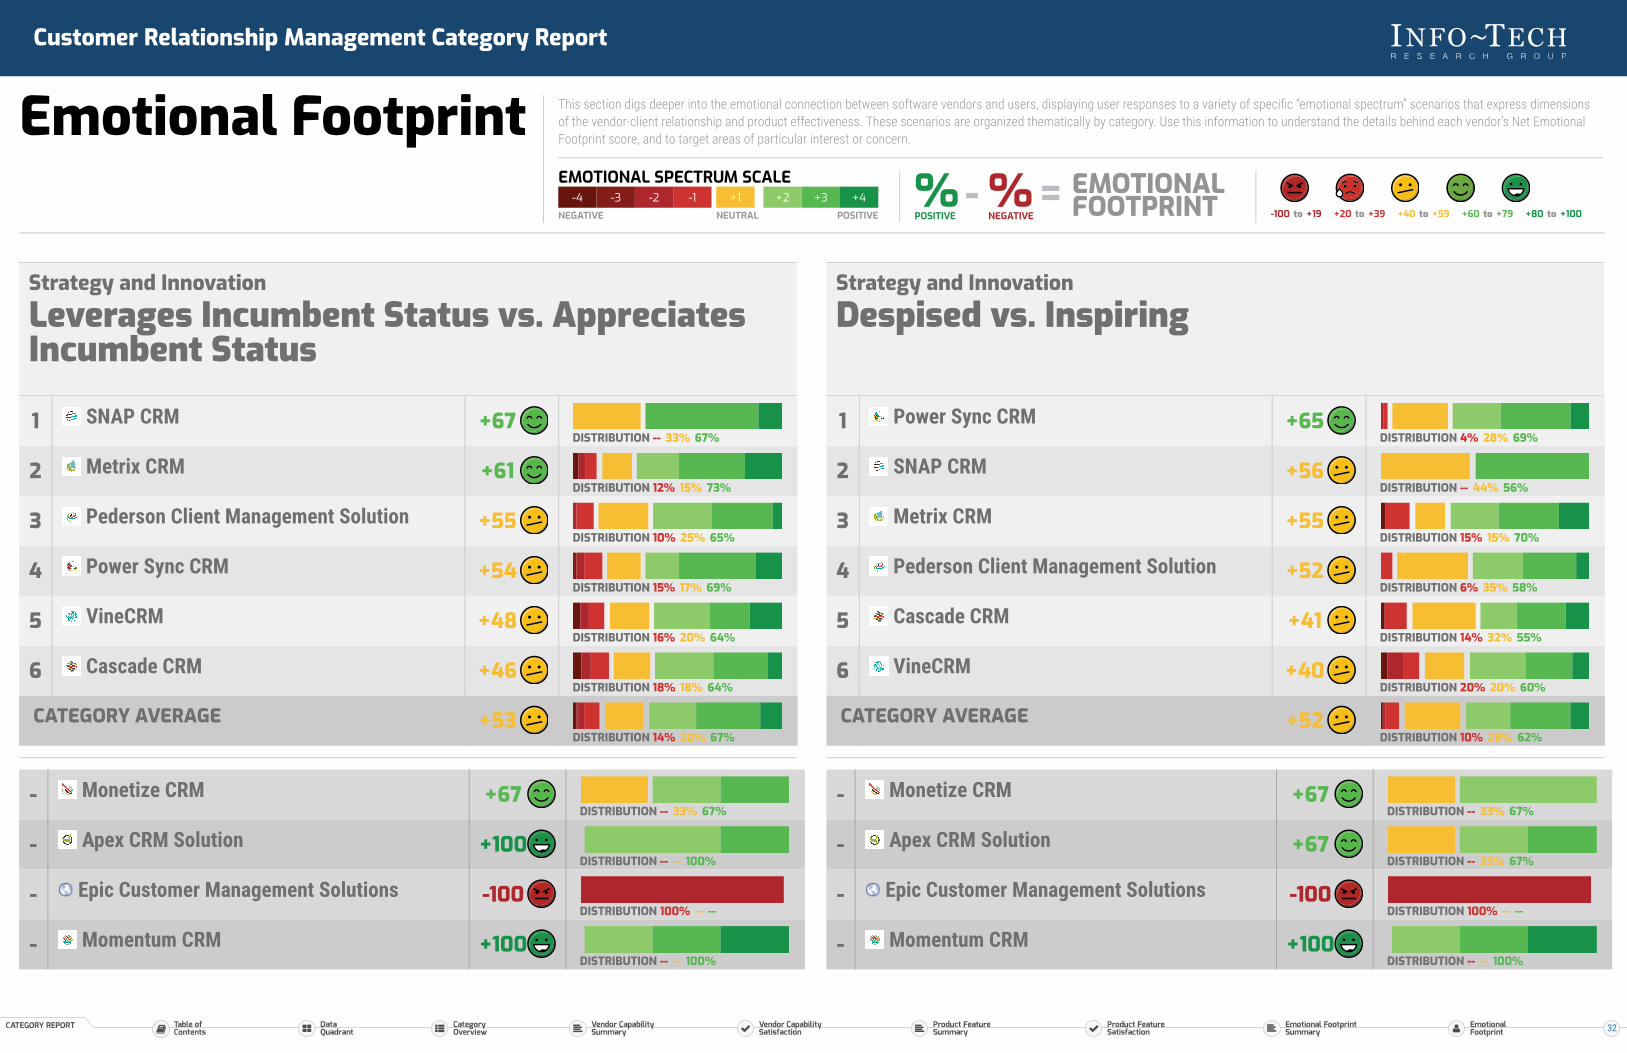
Strategy and InnovationLeverages Incumbent Status vs. AppreciatesIncumbent Status
DISTRIBUTION -- 33% 67%
DISTRIBUTION 12% 15% 73%
DISTRIBUTION 10% 25% 65%
DISTRIBUTION 15% 17% 69%
DISTRIBUTION 16% 20% 64%
DISTRIBUTION 18% 18% 64%
DISTRIBUTION 14% 20% 67%
1 SNAP CRM +67
2 Metrix CRM +61
3 Pederson Client Management Solution +55
4 Power Sync CRM +54
5 VineCRM +48
6 Cascade CRM +46
CATEGORY AVERAGE +53
DISTRIBUTION -- 33% 67%
DISTRIBUTION -- -- 100%
DISTRIBUTION 100% -- --
DISTRIBUTION -- -- 100%
- Monetize CRM +67
- Apex CRM Solution +100
- Epic Customer Management Solutions -100
- Momentum CRM +100
Strategy and InnovationDespised vs. Inspiring
DISTRIBUTION 4% 28% 69%
DISTRIBUTION -- 44% 56%
DISTRIBUTION 15% 15% 70%
DISTRIBUTION 6% 35% 58%
DISTRIBUTION 14% 32% 55%
DISTRIBUTION 20% 20% 60%
DISTRIBUTION 10% 28% 62%
1 Power Sync CRM +65
2 SNAP CRM +56
3 Metrix CRM +55
4 Pederson Client Management Solution +52
5 Cascade CRM +41
6 VineCRM +40
CATEGORY AVERAGE +52
DISTRIBUTION -- 33% 67%
DISTRIBUTION -- 33% 67%
DISTRIBUTION 100% -- --
DISTRIBUTION -- -- 100%
- Monetize CRM +67
- Apex CRM Solution +67
- Epic Customer Management Solutions -100
- Momentum CRM +100
32
Customer Relationship Management Category Report
Emotional Footprint This section digs deeper into the emotional connection between software vendors and users, displaying user responses to a variety of specific “emotional spectrum” scenarios that express dimensionsof the vendor-client relationship and product effectiveness. These scenarios are organized thematically by category. Use this information to understand the details behind each vendor’s Net EmotionalFootprint score, and to target areas of particular interest or concern.
-4 -3 -2 -1NEGATIVE
+1NEUTRAL
+2 +3 +4POSITIVE
EMOTIONAL SPECTRUM SCALE %POSITIVE
%NEGATIVE
EMOTIONALFOOTPRINT- =
-100 to +19 +20 to +39 +40 to +59 +60 to +79 +80 to +100
CATEGORY
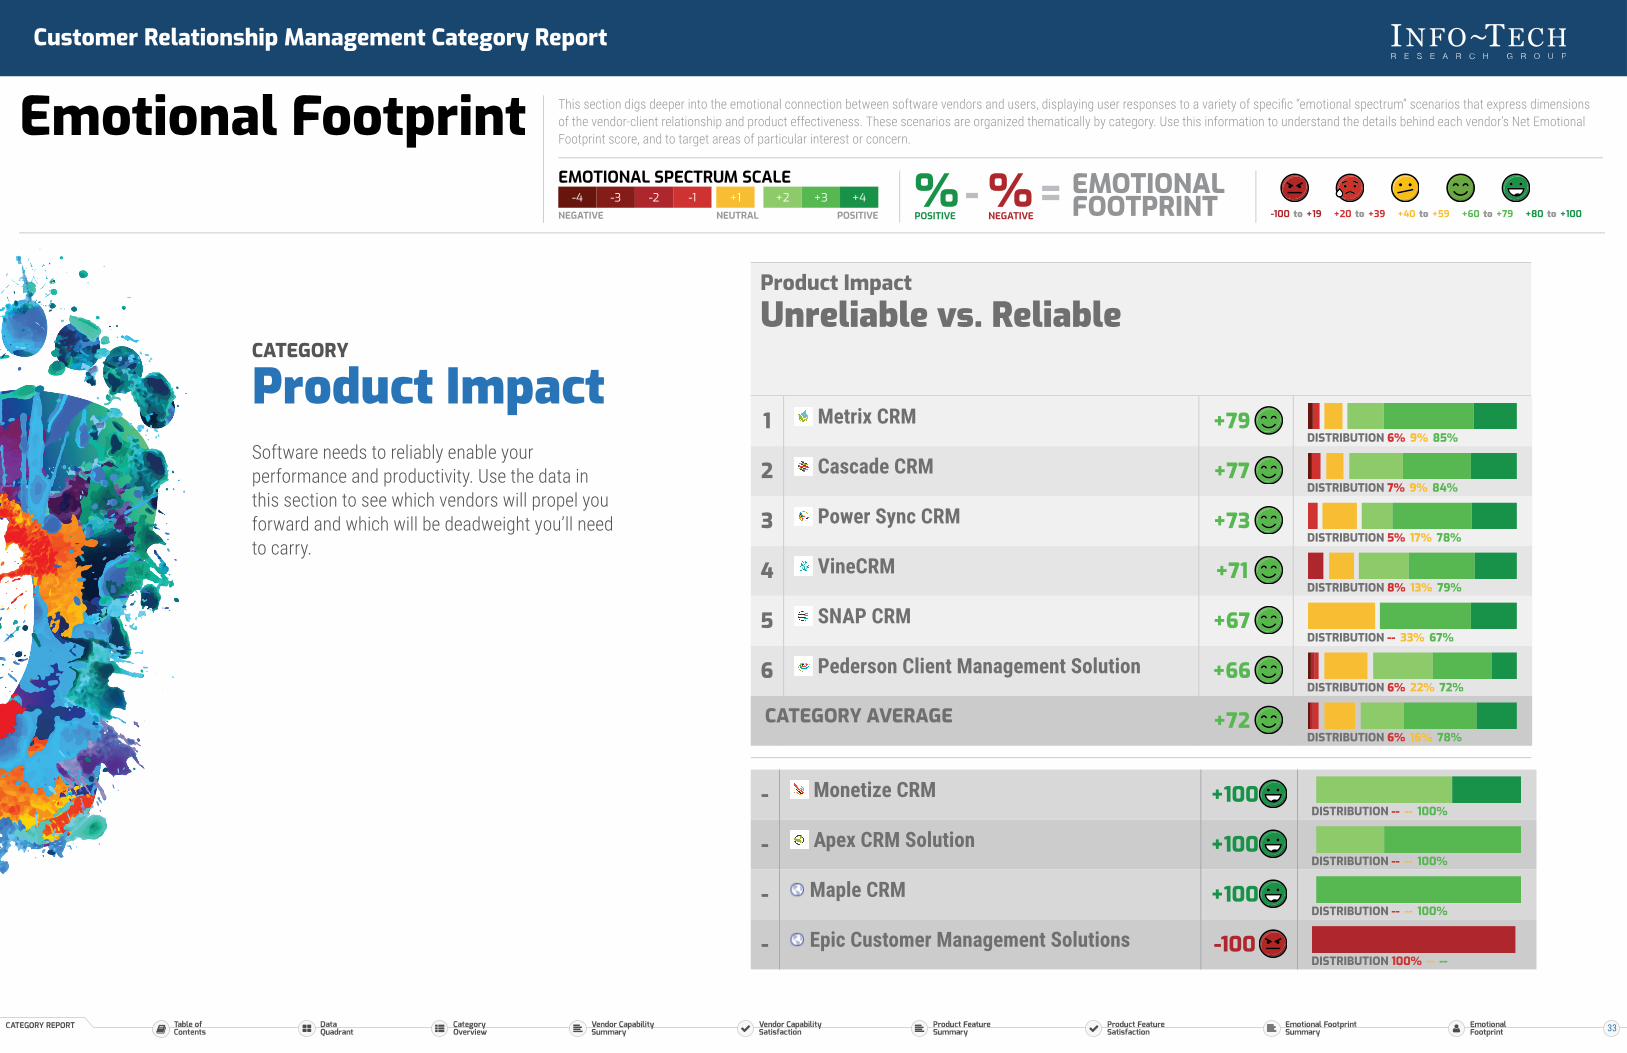
Product ImpactSoftware needs to reliably enable yourperformance and productivity. Use the data inthis section to see which vendors will propel youforward and which will be deadweight you’ll needto carry.
Product ImpactUnreliable vs. Reliable
DISTRIBUTION 6% 9% 85%
DISTRIBUTION 7% 9% 84%
DISTRIBUTION 5% 17% 78%
DISTRIBUTION 8% 13% 79%
DISTRIBUTION -- 33% 67%
DISTRIBUTION 6% 22% 72%
DISTRIBUTION 6% 16% 78%
1 Metrix CRM +79
2 Cascade CRM +77
3 Power Sync CRM +73
4 VineCRM +71
5 SNAP CRM +67
6 Pederson Client Management Solution +66
CATEGORY AVERAGE +72
DISTRIBUTION -- -- 100%
DISTRIBUTION -- -- 100%
DISTRIBUTION -- -- 100%
DISTRIBUTION 100% -- --
- Monetize CRM +100
- Apex CRM Solution +100
- Maple CRM +100
- Epic Customer Management Solutions -100
33
Customer Relationship Management Category Report
Emotional Footprint This section digs deeper into the emotional connection between software vendors and users, displaying user responses to a variety of specific “emotional spectrum” scenarios that express dimensionsof the vendor-client relationship and product effectiveness. These scenarios are organized thematically by category. Use this information to understand the details behind each vendor’s Net EmotionalFootprint score, and to target areas of particular interest or concern.
-4 -3 -2 -1NEGATIVE
+1NEUTRAL
+2 +3 +4POSITIVE
EMOTIONAL SPECTRUM SCALE %POSITIVE
%NEGATIVE
EMOTIONALFOOTPRINT- =
-100 to +19 +20 to +39 +40 to +59 +60 to +79 +80 to +100
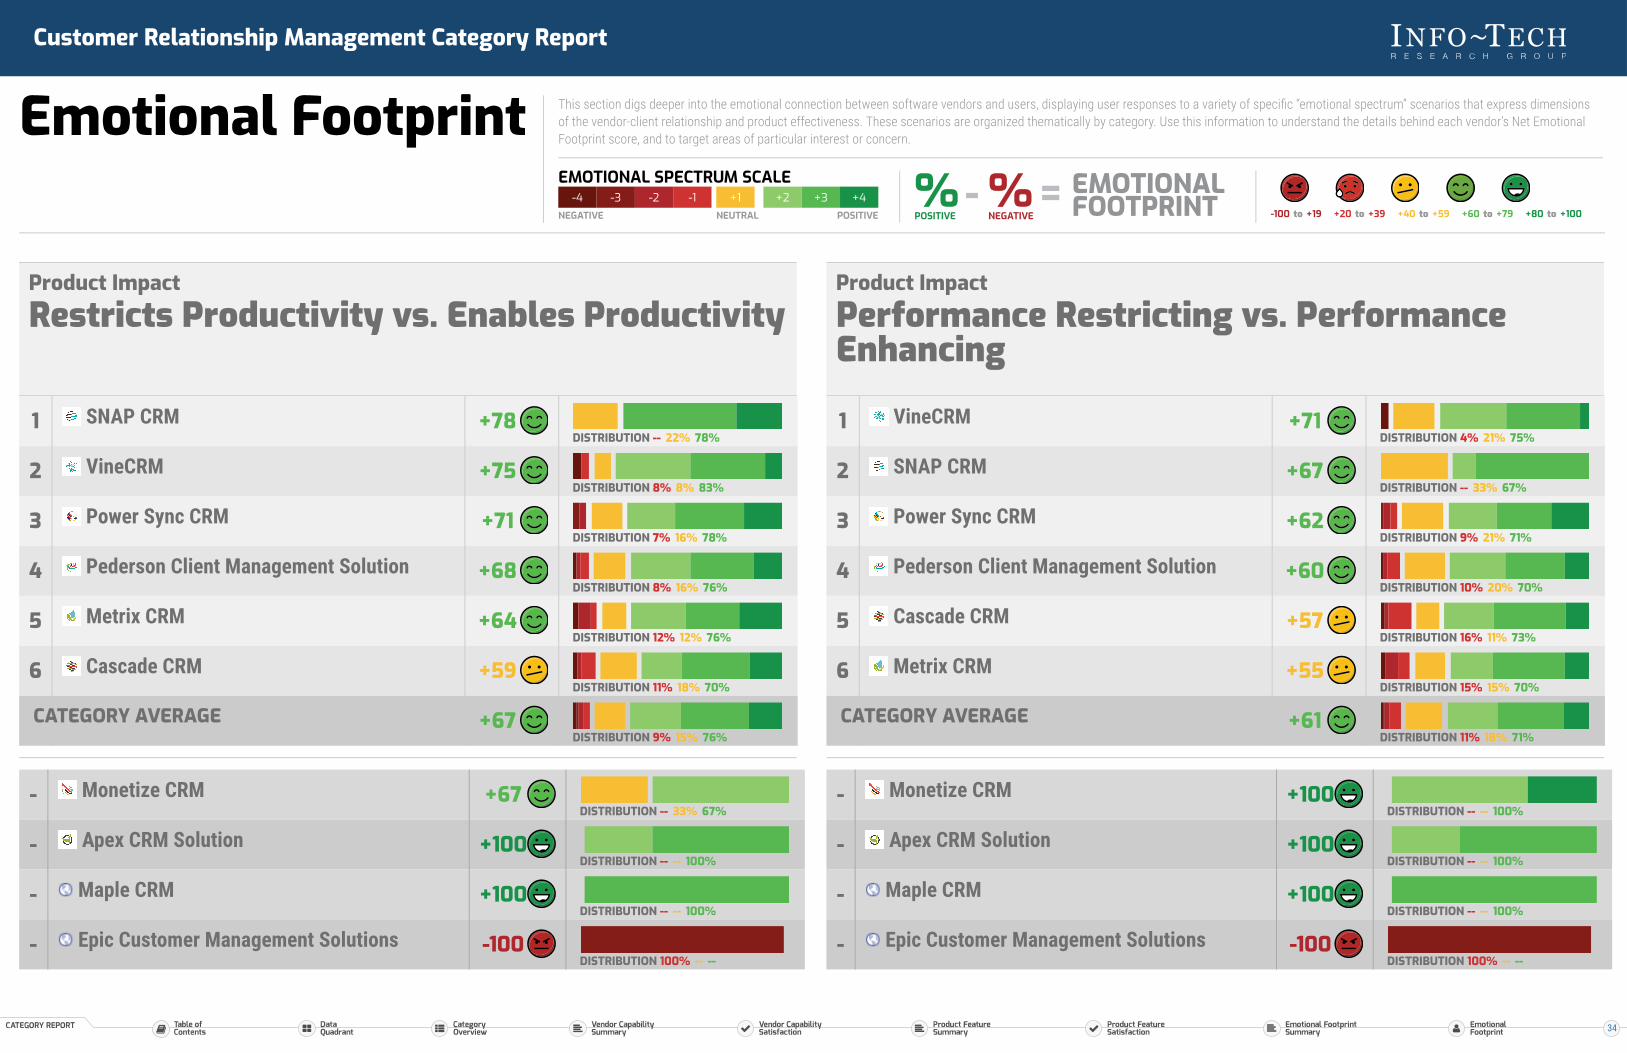
Product ImpactRestricts Productivity vs. Enables Productivity
DISTRIBUTION -- 22% 78%
DISTRIBUTION 8% 8% 83%
DISTRIBUTION 7% 16% 78%
DISTRIBUTION 8% 16% 76%
DISTRIBUTION 12% 12% 76%
DISTRIBUTION 11% 18% 70%
DISTRIBUTION 9% 15% 76%
1 SNAP CRM +78
2 VineCRM +75
3 Power Sync CRM +71
4 Pederson Client Management Solution +68
5 Metrix CRM +64
6 Cascade CRM +59
CATEGORY AVERAGE +67
DISTRIBUTION -- 33% 67%
DISTRIBUTION -- -- 100%
DISTRIBUTION -- -- 100%
DISTRIBUTION 100% -- --
- Monetize CRM +67
- Apex CRM Solution +100
- Maple CRM +100
- Epic Customer Management Solutions -100
Product ImpactPerformance Restricting vs. PerformanceEnhancing
DISTRIBUTION 4% 21% 75%
DISTRIBUTION -- 33% 67%
DISTRIBUTION 9% 21% 71%
DISTRIBUTION 10% 20% 70%
DISTRIBUTION 16% 11% 73%
DISTRIBUTION 15% 15% 70%
DISTRIBUTION 11% 18% 71%
1 VineCRM +71
2 SNAP CRM +67
3 Power Sync CRM +62
4 Pederson Client Management Solution +60
5 Cascade CRM +57
6 Metrix CRM +55
CATEGORY AVERAGE +61
DISTRIBUTION -- -- 100%
DISTRIBUTION -- -- 100%
DISTRIBUTION -- -- 100%
DISTRIBUTION 100% -- --
- Monetize CRM +100
- Apex CRM Solution +100
- Maple CRM +100
- Epic Customer Management Solutions -100
34
Customer Relationship Management Category Report
Emotional Footprint This section digs deeper into the emotional connection between software vendors and users, displaying user responses to a variety of specific “emotional spectrum” scenarios that express dimensionsof the vendor-client relationship and product effectiveness. These scenarios are organized thematically by category. Use this information to understand the details behind each vendor’s Net EmotionalFootprint score, and to target areas of particular interest or concern.
-4 -3 -2 -1NEGATIVE
+1NEUTRAL
+2 +3 +4POSITIVE
EMOTIONAL SPECTRUM SCALE %POSITIVE
%NEGATIVE
EMOTIONALFOOTPRINT- =
-100 to +19 +20 to +39 +40 to +59 +60 to +79 +80 to +100
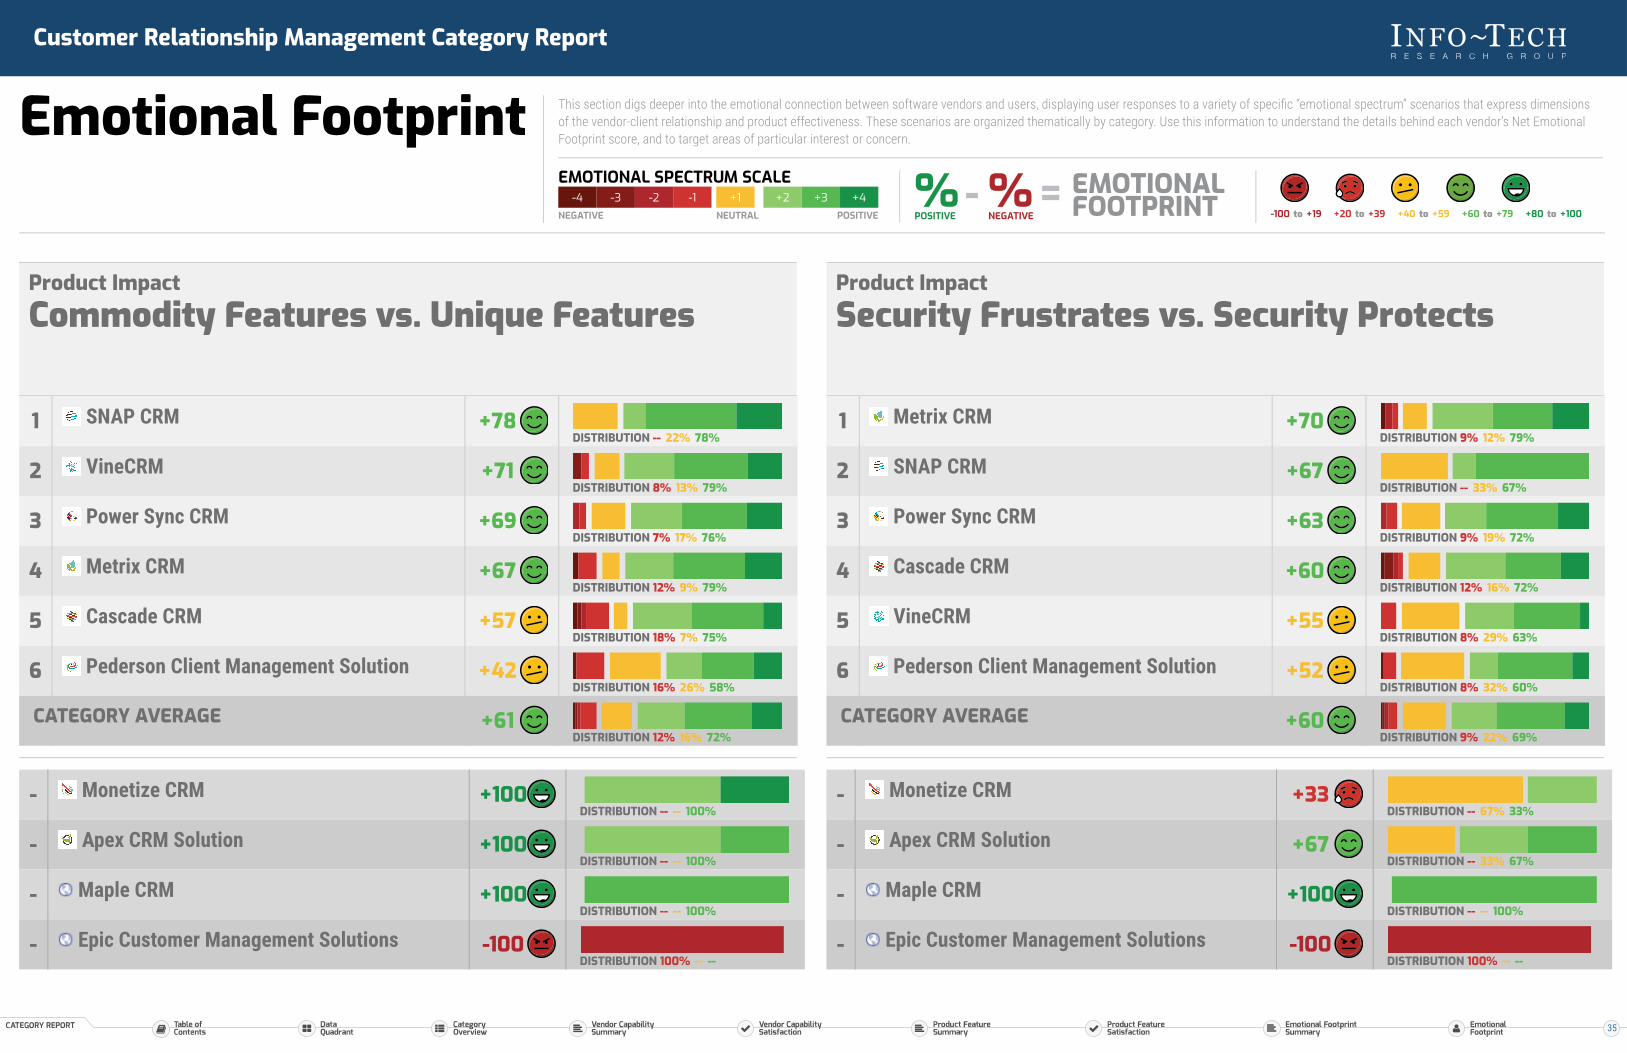
Product ImpactCommodity Features vs. Unique Features
DISTRIBUTION -- 22% 78%
DISTRIBUTION 8% 13% 79%
DISTRIBUTION 7% 17% 76%
DISTRIBUTION 12% 9% 79%
DISTRIBUTION 18% 7% 75%
DISTRIBUTION 16% 26% 58%
DISTRIBUTION 12% 16% 72%
1 SNAP CRM +78
2 VineCRM +71
3 Power Sync CRM +69
4 Metrix CRM +67
5 Cascade CRM +57
6 Pederson Client Management Solution +42
CATEGORY AVERAGE +61
DISTRIBUTION -- -- 100%
DISTRIBUTION -- -- 100%
DISTRIBUTION -- -- 100%
DISTRIBUTION 100% -- --
- Monetize CRM +100
- Apex CRM Solution +100
- Maple CRM +100
- Epic Customer Management Solutions -100
Product ImpactSecurity Frustrates vs. Security Protects
DISTRIBUTION 9% 12% 79%
DISTRIBUTION -- 33% 67%
DISTRIBUTION 9% 19% 72%
DISTRIBUTION 12% 16% 72%
DISTRIBUTION 8% 29% 63%
DISTRIBUTION 8% 32% 60%
DISTRIBUTION 9% 22% 69%
1 Metrix CRM +70
2 SNAP CRM +67
3 Power Sync CRM +63
4 Cascade CRM +60
5 VineCRM +55
6 Pederson Client Management Solution +52
CATEGORY AVERAGE +60
DISTRIBUTION -- 67% 33%
DISTRIBUTION -- 33% 67%
DISTRIBUTION -- -- 100%
DISTRIBUTION 100% -- --
- Monetize CRM +33
- Apex CRM Solution +67
- Maple CRM +100
- Epic Customer Management Solutions -100
35