Embed Size (px)
Citation preview

Cash Rental Rates and Land Values
Where from Here?
Craig Chase, Field SpecialistFarm & Ag Business Management

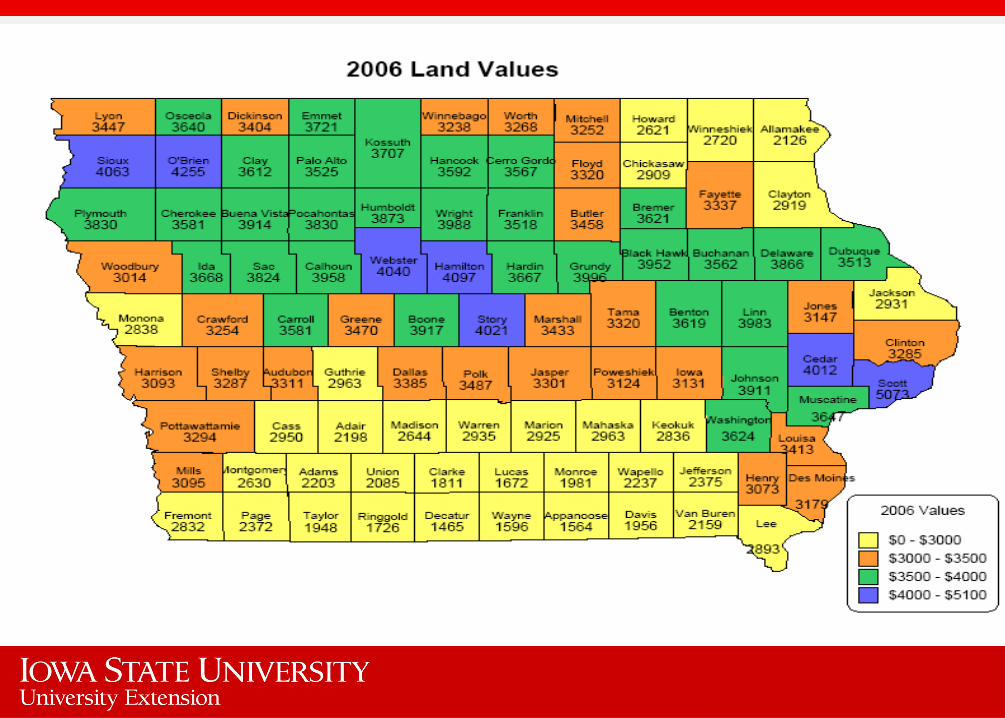
Iowa Average Land Values
$0
$500
$1,000
$1,500
$2,000
$2,500
$3,000
$3,500
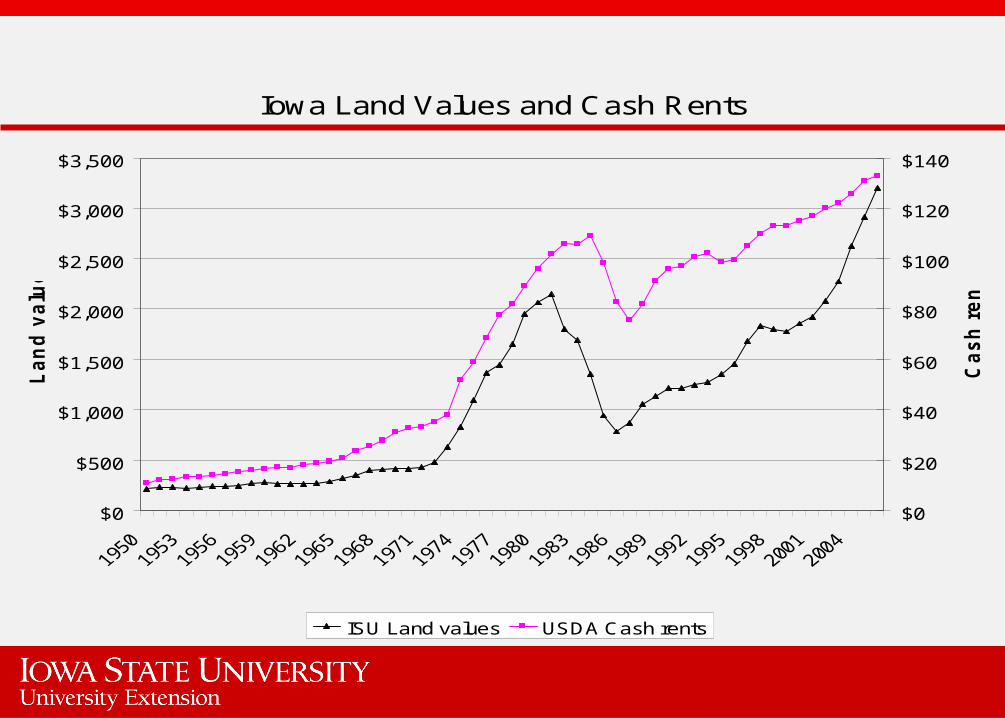
Iowa Land Values and Cash Rents
$0
$500
$1,000
$1,500
$2,000
$2,500
$3,000
$3,500
La
nd
va
lue
s
$0
$20
$40
$60
$80
$100
$120
$140
Ca
sh
re
nts
ISU Land values USDA Cash rents
Iowa Rent to Value
0%
2%
4%
6%
8%
10%
12%

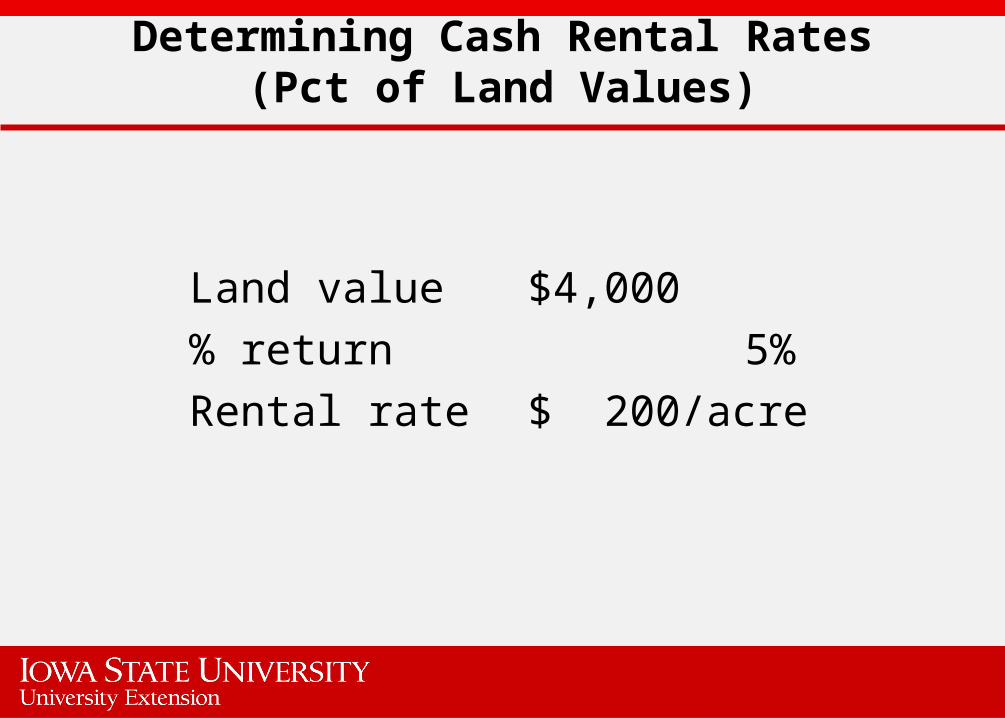
Determining Cash Rental Rates(Pct of Land Values)
Land value $4,000% return 5%Rental rate $ 200/acre

2006 Land Values by CSR Point
Adair
Adam s
A llam akee
Appanoose
Audubon
Benton
B lack H aw k
Boone
Brem er
Buchanan
Buena V ista Butler
C alhoun
C arro ll
C ass
C edar
C erro G ordo
C herokee
C hickasaw
C larke
C lay
C layton
C lin ton
C raw ford
D allas
D avisD ecatur
D elaw are
D es M oines
D ickinson
D ubuque
Em m et
Fayette
F loyd
Franklin
Frem ont
G reene
G rundy
G uthrie
H am ilton
H ancock
H ard in
H arrison
H enry
H ow ard
H um boldt
Ida
Iow a
Jackson
Jasper
Jefferson
Johnson
Jones
Keokuk
Kossuth
Lee
Linn
Louisa
Lucas
Lyon
M adison M ahaskaM arion
M arshall
M ills
M itchell
M onona
M onroeM ontgom ery
M uscatine
O 'B rien
O sceola
Page
Palo A lto
P lym outh Pocahontas
Polk
Pottaw attam ie
Pow eshiek
R inggold
Sac
ScottShelby
S ioux
S toryTam a
Taylor
U nion
Van Buren
W apello
W arren W ashington
W ayne
W ebster
W innebago
W innesh iek
W oodbury
W orth
W right
55.00
56.00
44.00
36.00
59.00
75.00
68.00
76.00
68.00
70.00
71.00 73.00
80.00
69.00
60.00
75.00
70.00
60.00
70.00
43.00
69.00
51.00
64.00
56.00
70.00
42.0040.00
63.00
66.00
65.00
52.00
64.00
62.00
68.00
76.00
61.00
75.00
85.00
61.00
77.00
72.00
79.00
50.00
64.00
66.00
73.00
53.00
58.00
45.00
66.00
55.00
61.00
61.00
66.00
73.00
47.00
63.00
62.00
46.00
59.00
58.00 60.0054.00
77.00
61.00
76.00
50.00
40.0067.00
70.00
68.00
69.00
64.00
68.00
52.00 75.00
73.00
62.50
64.00
47.00
70.00
73.0059.00
60.00
77.0081.00
60.00
51.00
38.00
56.00
54.00 70.00
42.00
74.00
72.0054.00
48.00
71.00
75.00
$39.97
$39.34
$48.31
$43.44
$56.12
$48.25
$58.11
$51.54
$53.25
$50.88
$55.12 $47.36
$49.48
$51.89
$49.16
$53.50
$50.96
$59.68
$41.56
$42.12
$52.35
$57.24
$51.33
$58.12
$48.36
$46.57$36.62
$61.36
$48.17
$52.38
$67.55
$58.14
$53.82
$48.83
$46.28
$46.43
$46.27
$47.02
$48.58
$53.21
$49.89
$46.41
$61.86
$48.01
$39.71
$53.05
$69.21
$53.99
$65.14
$50.01
$43.19
$64.11
$51.59
$42.97
$50.78
$61.56
$63.22
$55.05
$36.34
$58.43
$45.59 $49.39$54.17
$44.58
$50.74
$42.79
$56.77
$49.52$39.26
$52.10
$62.57
$52.76
$37.07
$51.83
$73.66 $51.07
$47.77
$52.70
$48.82
$36.72
$54.63
$69.50$55.72
$67.71
$52.22$40.99
$32.47
$40.88
$56.81
$39.94
$54.36 $51.77
$38.00
$54.60
$44.97$50.37
$62.78
$46.02
$53.17
Land Values by C SR point
32 - 45
45 - 50
50 - 55
55 - 75
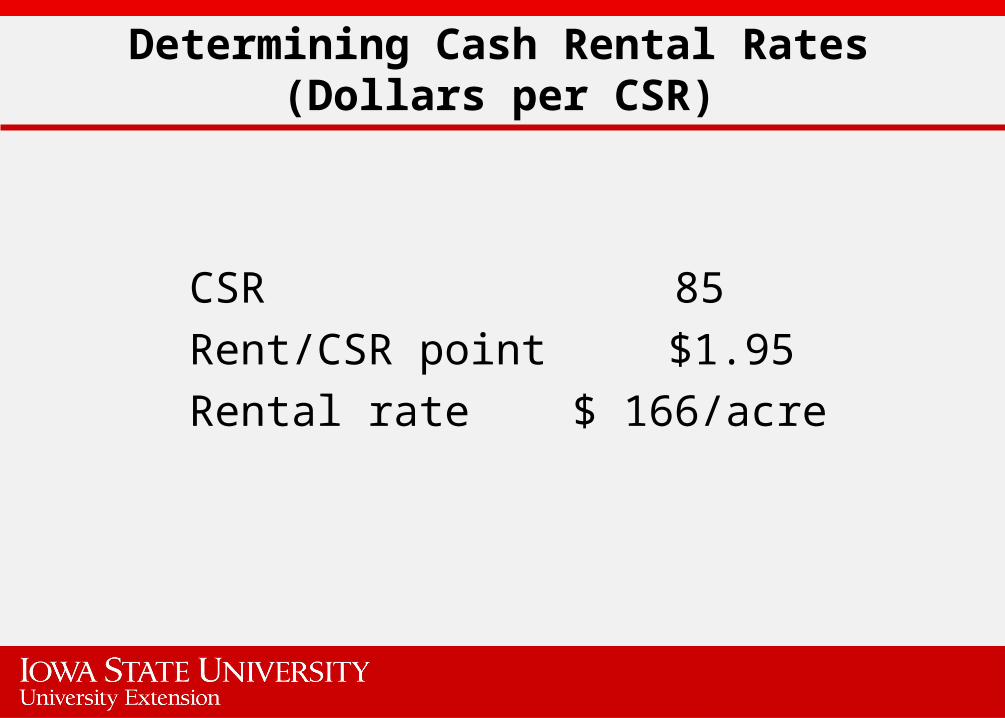
Determining Cash Rental Rates(Dollars per CSR)
CSR 85Rent/CSR point $1.95Rental rate $ 166/acre

Determining Cash Rental Rates(Dollars per corn yield)
Avg. corn yield 170Rent/bushel $1.05Rental rate $ 179/acre
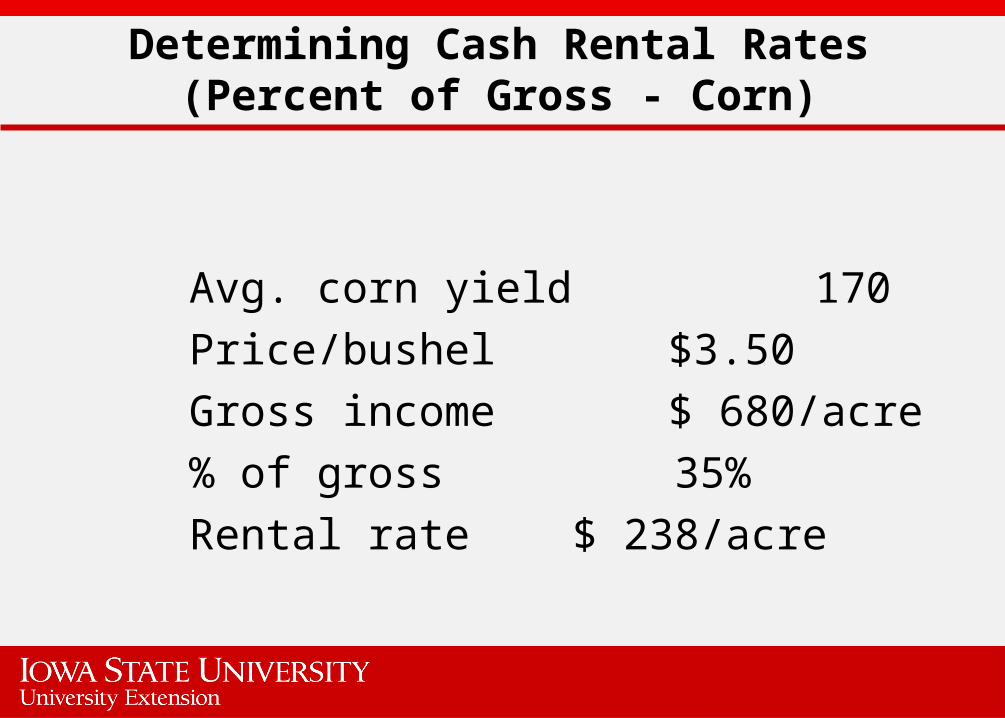
Determining Cash Rental Rates(Percent of Gross - Corn)
Avg. corn yield 170Price/bushel $3.50Gross income $ 680/acre% of gross 35%Rental rate $ 238/acre

Determining Cash Rental Rates(Summary)
Percent of land value $200/acreDollars/CSR $166/acreDollars/corn yield $179/acrePercent of gross $238/acre

Lease Arrangements
• Because of grain market uncertainty, may want to look at some type of flexible lease.• Be aware that flexible leases, however, are considered share-crop leases by FSA.

What’s Causing the Rise in Land Prices?

Who Purchased Iowa Farmland
0%
10%
20%
30%
40%
50%
60%
70%
80%
90%
1989 1990 1991 1992 1993 1994 1995 1996 1997 1998 1999 2000 2001 2002 2003 2004 2005 2006
Existing Farmers Investors New Farmers Other

Distribution of Iowa Farmland Purchases by Crop Reporting District, 2006
0%
10%
20%
30%
40%
50%
60%
70%
80%
Northwest NorthCentral
Northeast WestCentral
Central EastCentral
Southwest SouthCentral
Southeast State Avg.
Investors Existing Farmers

Positive Factors in the Iowa Land Market
0%
5%
10%
15%
20%
25%
30%
35%
40%
45%
50%
Low interestrates
InvestmentDemand
Good yields Limitedsupply
1031 Exch. Gvt. Pay. Prices
Perc
ent of R
espondents
2003 2004 2005 2006

Distribution of Iowa Farmland by Age of Owner
0%
5%
10%
15%
20%
25%
< 25 25 - 34 35 - 44 45 - 54 55 - 64 65 - 74 > 75
1982 1992 2002

Percent Distribution of Iowa Farmland by Residence of Owner
0%
10%
20%
30%
40%
50%
60%
70%
80%
90%
100%
1982 1992 2002
Iowa Non-Iowan

Distribution of Iowa Farmland by Tenure Type
0%
10%
20%
30%
40%
50%
60%
Owner operator Cash rent Crop share rent Government
1982 1992 2002
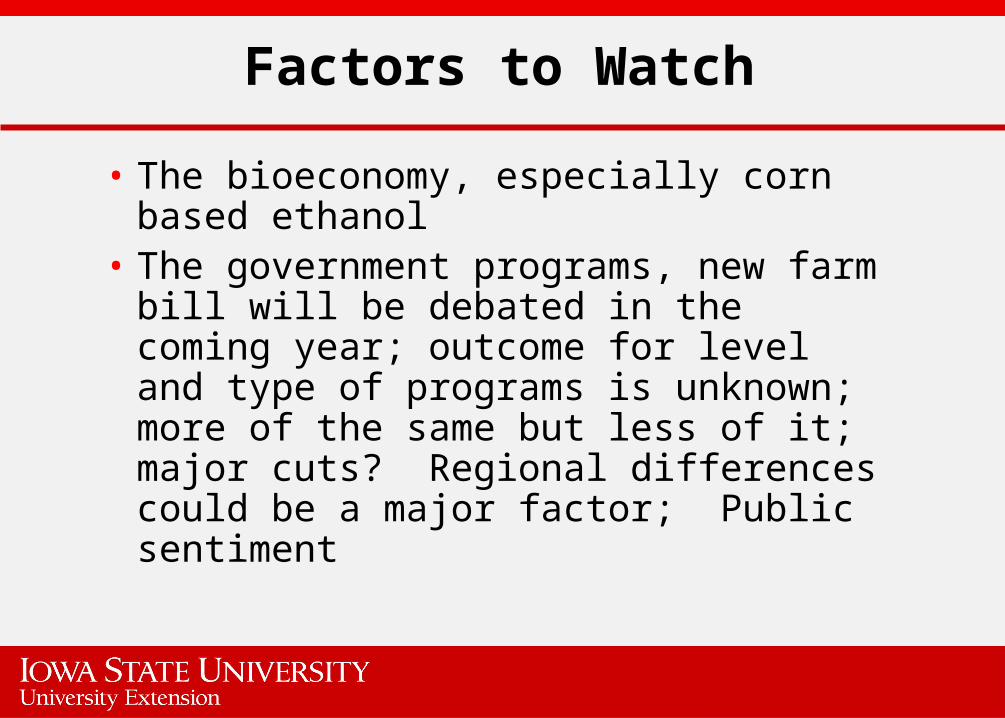
Factors to Watch
• The bioeconomy, especially corn based ethanol
• The government programs, new farm bill will be debated in the coming year; outcome for level and type of programs is unknown; more of the same but less of it; major cuts? Regional differences could be a major factor; Public sentiment
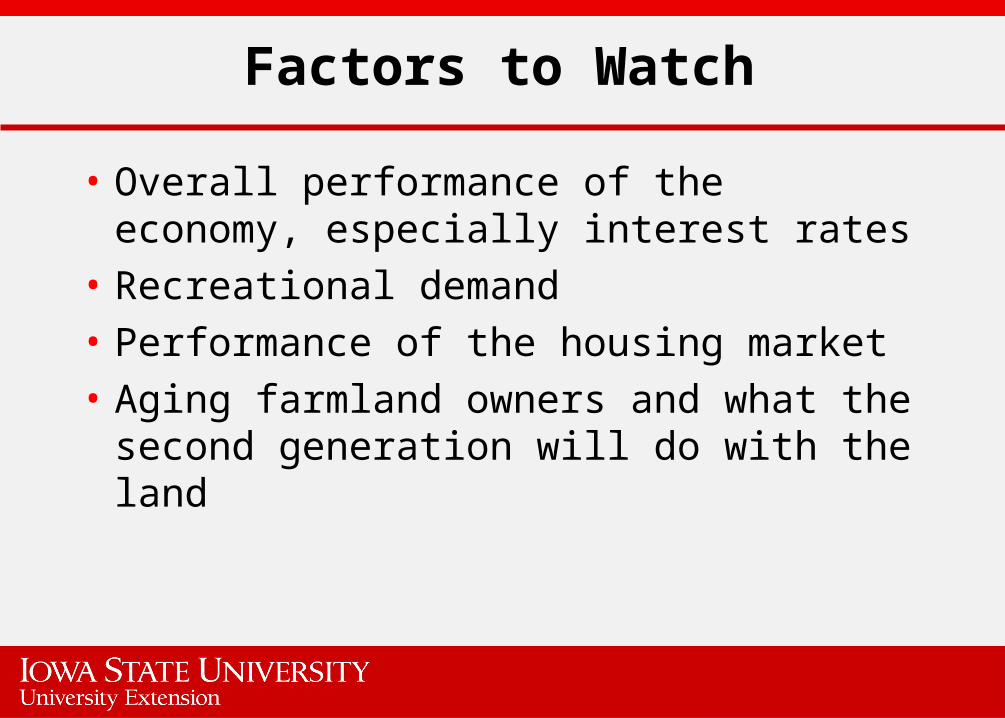
Factors to Watch
• Overall performance of the economy, especially interest rates
• Recreational demand• Performance of the housing market• Aging farmland owners and what the
second generation will do with the land

Factors to Watch
• We are entering into a period of major uncertainty. How the ethanol situation will play out no one knows for sure.
• Land values will move with higher income and anticipation
• Are we setting ourselves up for another fall or is this a new plateau?

Conclusions
• Iowa agriculture is undergoing some fundamental changes; the actions
and reactions in the corn market, other commodity markets (including
livestock) and export market will all be impacted
• Price volatility will increase as energy prices increase in importance

Choosing Crop Insurance for 2007
William EdwardsIowa State University
William Edwards, ISU Extension Economist

Indemnity Prices: Corn
2007 2006
• APH, GRP $3.50 $1.95
• CRC,RA,GRIP $4.00? $2.59
• FSA loan rate$1.90 $1.90
• CCP trigger $2.35 $2.35

Indemnity Prices: Soybeans
2007 2006• APH,GRP $7.00 $5.15
• CRC,RA,GRIP $8.00? $6.18
• FSA loan rate$4.93 $4.93
• CCP trigger $5.36 $5.36
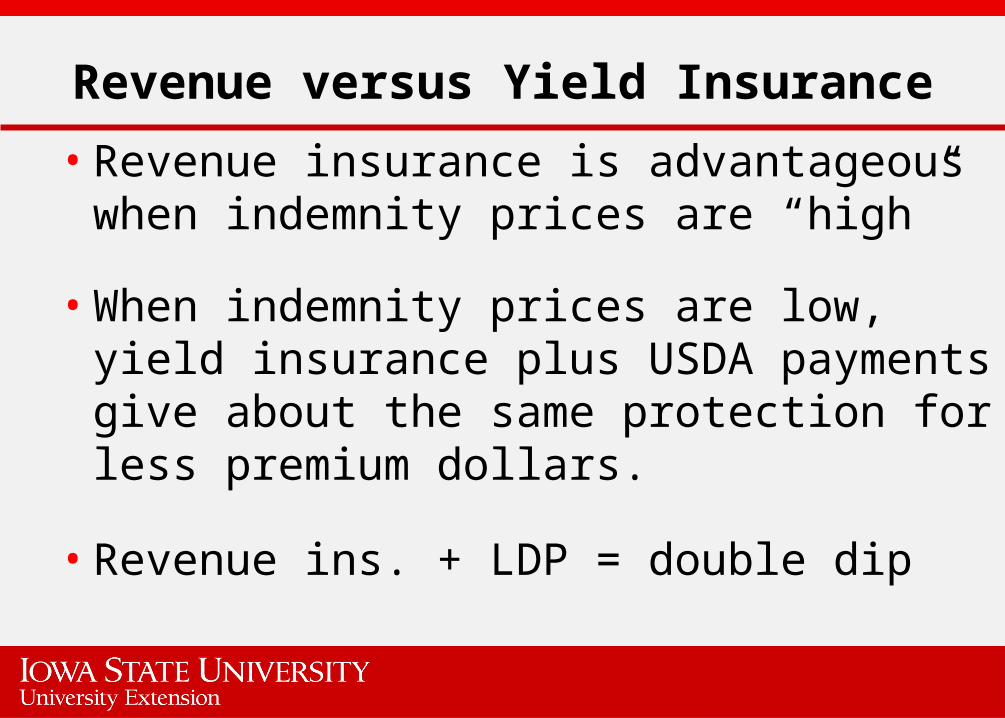
Revenue versus Yield Insurance
• Revenue insurance is advantageous when indemnity prices are “high”
• When indemnity prices are low, yield insurance plus USDA payments give about the same protection for less premium dollars.
• Revenue ins. + LDP = double dip

What is Your Marketing Pattern?
•If you price before harvest:–use CRC or RA-HPO to guarantee bushels
•If you only price after harvest:–use standard RA or APH
(lower premium)

What is Your Feed Balance?
Feed deficit (must buy feed if short)
–Buy CRC or Harvest Price RA to insure replacement bushels

GRIP (Group Revenue Ins.)
• Based on county yields, not farm
• Now available with harvest price option as well as standard price
• Indemnity prices were high in 2004, not so high in 2005 or 2006
• Same indemnity price as RA, CRC
• May show a “profit” in the long run

Group Insurance may be appropriate
When:
• Individual yields closely track county yields
• No production history is available or APH is low
• Can stand more risk
• Indemnity prices are “high” (a price decline affects everyone equally, unlike a yield loss)
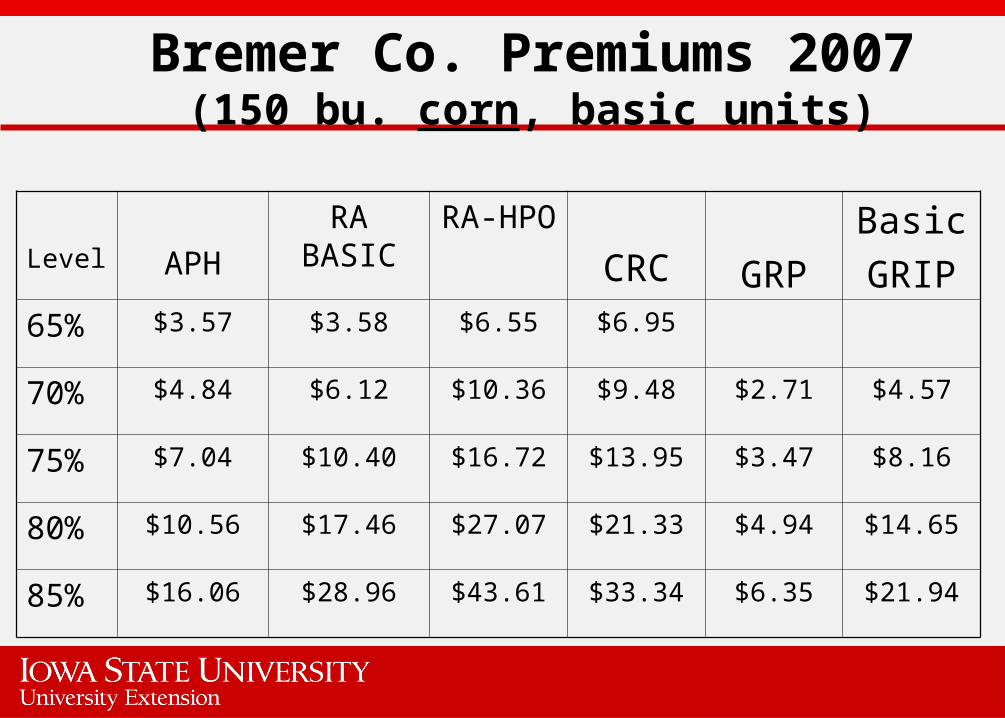
Bremer Co. Premiums 2007(150 bu. corn, basic units)
Level APHRA
BASICRA-HPO CRC GRP
BasicGRIP
65% $3.57 $3.58 $6.55 $6.95
70% $4.84 $6.12 $10.36 $9.48 $2.71 $4.57
75% $7.04 $10.40 $16.72 $13.95 $3.47 $8.16
80% $10.56 $17.46 $27.07 $21.33 $4.94 $14.65
85% $16.06 $28.96 $43.61 $33.34 $6.35 $21.94
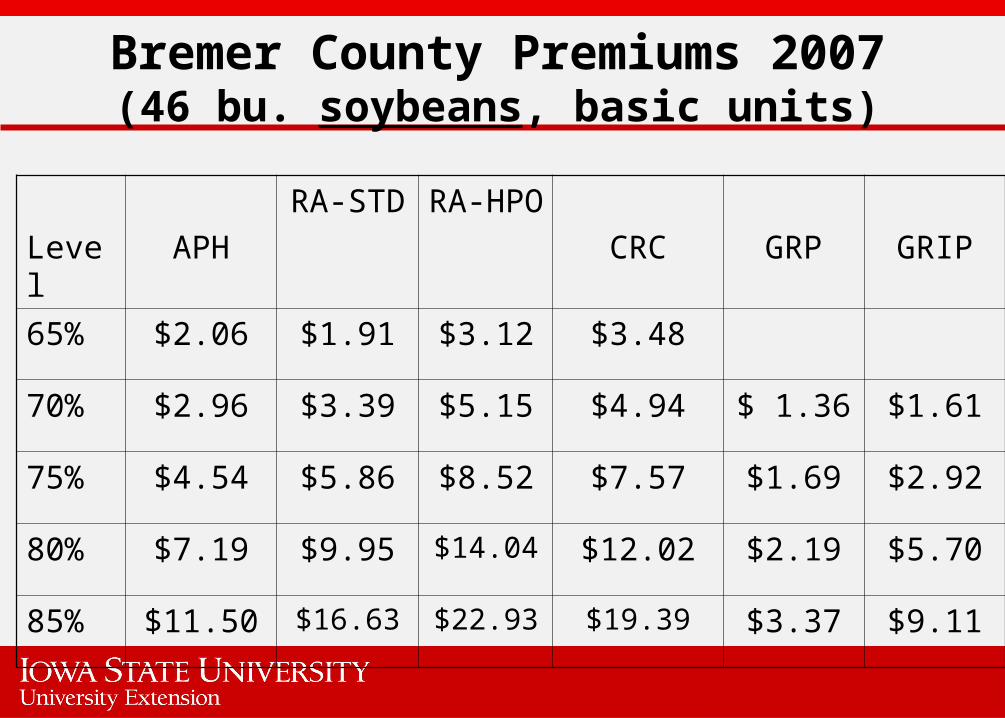
Bremer County Premiums 2007(46 bu. soybeans, basic units)
Level APHRA-STD RA-
HPO CRC GRP GRIP
65% $2.06 $1.91 $3.12 $3.48
70% $2.96 $3.39 $5.15 $4.94 $ 1.36 $1.61
75% $4.54 $5.86 $8.52 $7.57 $1.69 $2.92
80% $7.19 $9.95 $14.04 $12.02 $2.19 $5.70
85% $11.50 $16.63 $22.93 $19.39 $3.37 $9.11

Crop Insurance Premium Calculator
University of Illinois Extensionhttp://www.farmdoc.uiuc.edu/cropins

How Many $ to Insure?
•Consider cash flow needs–Seed, fertilizer, pesticides–Machinery and hired labor–Land rent or payments–Debt payments–Family living
•Subtract your “deductible”

Higher Proven Yields for 2007
Drop 1996 yields, add 2006.Corn Soybeans
1996 138 bu. 44 bu.2006 166 bu. 50 bu.APH yield+2.8bu. +0.6bu.
(Iowa average yields)

Higher Guarantees Available!
Corn example2006: 148 bu. x $2.59 x 75% = $2872007: 151 bu. x $4.00 x 75% = $453Soybeans example2006: 45 bu. x $6.18 x 75% = $2092007: 46 bu. x $8.00 x 75% = $276
Lower the % guarantee to get the same $ coverage and similar premiums as last year.

Warning!
• Revenue Insurance guarantees are based on futures prices.
• Deduct basis to estimate your actual guaranteed dollars.
• Your protection level is affected by basis risk.

What Units to Choose?
• Optional Units: Each farm is separate
• Basic Units: Combine owned and cash rented acres in same county
• Enterprise Units: Combine all acres of the same crop in same co.
• Whole Farm: Combine corn and beans
$

Insurance Units
• Generally, the more acres you combine into one unit, the lower the cost per acre.
• Probability of collecting a payment is lower, too.

Important Points for 2007
1. Proven yields for both corn and soybeans may increase.
2. Indemnity prices will be much higher. More downward price risk.
3. $ Coverage levels will be higher.4. Premiums will be higher.5. Use some form of revenue insurance to
guarantee higher gross revenues.6. GRIP may work for some people.

Crop Ins. Pubs / Ag Decision Makerwww.extension.iastate.edu/agdm/
• FM 1826 – Multiple Peril Crop Insurance
• FM 1850 – Group Risk Plan and Group Risk Income Protection
• FM 1852 – Catastrophic Crop Insurance
• FM-1850 -- Group Risk Plan and Group Risk Income Protection
• FM 1854 – Managing Risk with Crop Insurance
• FM 1858 – Important Dates for Multiple Peril Crop Insurance
• FM 1859 – Delayed and Prevented Planting Provisions for Multiple Peril Crop Insurance
• FM 1860 – Actual Production History and Insurance Units for Multiple Peril Crop Insurance