Embed Size (px)
Citation preview

Terumo Cardiovascular Systems:Oxygenator Production Improvement
University of Delaware’s Senior Design Team:Tom Craig
Mike GiulianoRonit Lilu
Chase RossKate Staley
Description of Project
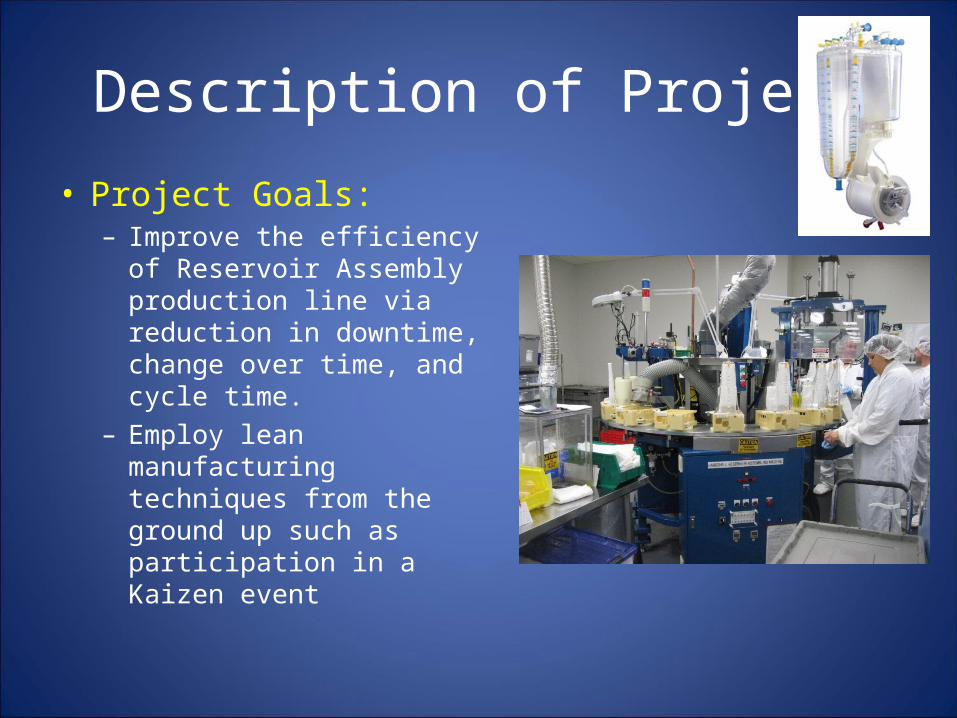
• Project Goals:– Improve the efficiency of
Reservoir Assembly production line via reduction in downtime, change over time, and cycle time.
– Employ lean manufacturing techniques from the ground up such as participation in a Kaizen event

Assembly Line
Lid Assembly VR Station CR StationReservoir Inspection
Leak Tester
Final Assembly
CR
VR
Lid
Jig
Lid Line

Current Floor Layout vs. Future Floor Layout
CR
Lid Line Assembly Table
Reservoir Assembly Table
VR
Product Flow

Lean Manufacturing Techniques
• The Kaizen event:• Attended a meeting with representation from operators,
manufacturing, production supervisors, engineering, and plant leadership to discuss improvements
• Time study• Spaghetti diagrams• Value Stream Mapping (VSM)
– Value Added, Non-Value Added Time

Customers & Wants• Customers: Terumo Management, Terumo’s Floor Staff, Surgeons, Hospitals,
Patients

Metrics and Target Values
Metrics Target ValuesAccuracy of Manufacturing/Error Proof 100%
Harmful Factors3 feet egress clearance, limit body rotation/twisting/reaching, adjustable table heights for ergonomics
Minimize Space VR Table 3 ft or less, CR Table 2’ x 2’
Waste of Time less than 20%, less than 1 mile/day walking
Cycle Time reduce by 4 sec (from 42 sec to 38)
Productivity Increase of 675 units of oxygenators/week
Risk Score below 25 RPN (no mitigating action required)

Current Floor Layout vs. Future Floor Layout
CR
Lid Line Assembly Table
Reservoir Assembly Table
6 Passes of 3 Steps Each
1 Pass of 3 Steps
VR
Product Flow
-VR walking distance/day ≈ 6.6 miles-CR walking distance/day ≈ 1.5 miles
-VR walking distance/day ≈ .5 miles-CR walking distance/day ≈ 0.3 miles

VR: Current State vs. Future
Current State Future State
Time Saved: mostly due to table redesign and offline productionWalking Time - 6.3 seconds

VR Concepts• Rotate lid assembly table and
align it with Chemical Table• Redesign Chemical Table and “L”
it with the assembly line• Design and manufacture
additional jig• Take wings off jigs on table• Sensors on bins to force order
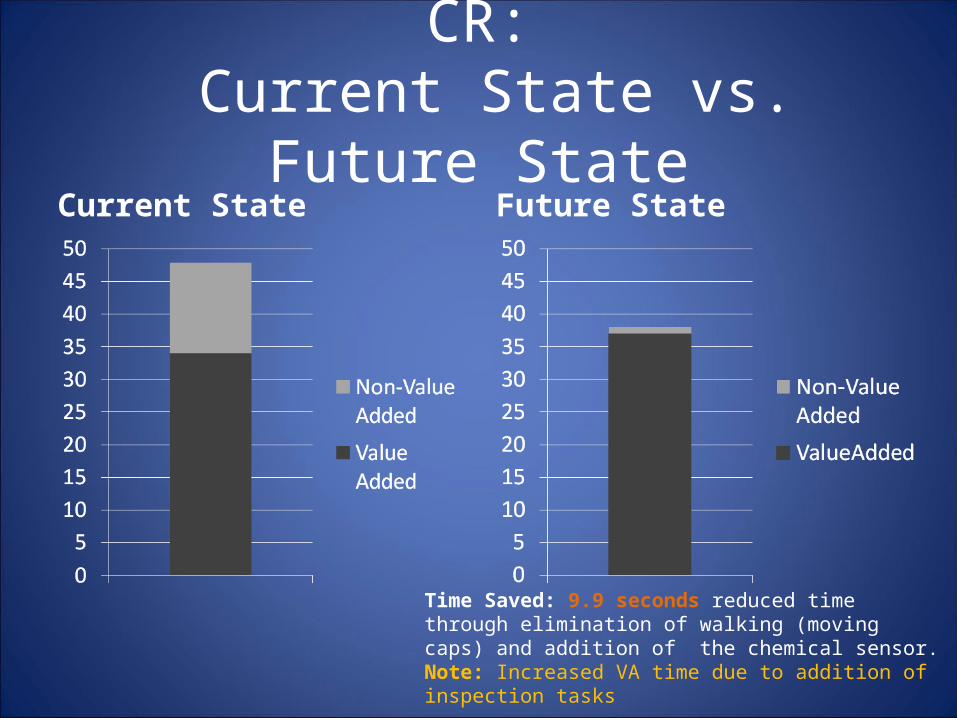
CR: Current State vs. Future State
Current State Future State
Time Saved: 9.9 seconds reduced time through elimination of walking (moving caps) and addition of the chemical sensor.Note: Increased VA time due to addition of inspection tasks

CR Concepts• Move caps down to reservoir
inspection• Time sensor for chemical
dipping• Move CR cart closer to
operator• Increase inspection duties
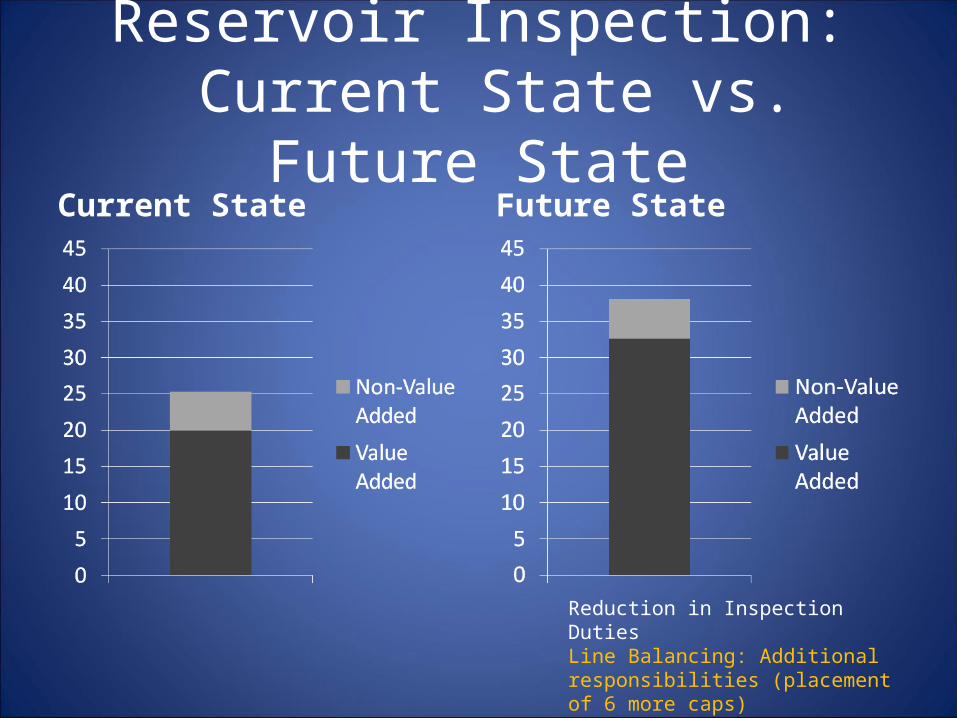
Reservoir Inspection: Current State vs. Future State
Current State Future State
Reduction in Inspection DutiesLine Balancing: Additional responsibilities (placement of 6 more caps)

Proposed Floor LayoutTable at VR StationTable at CR Station
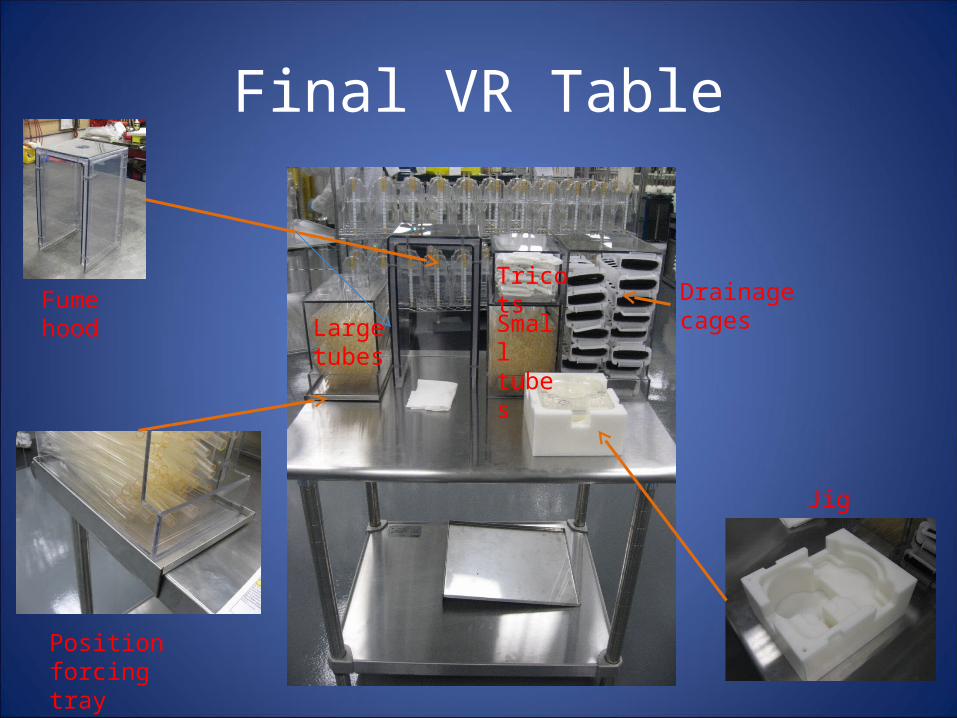
Final VR Table
Large tubes
Small tubes
Fume hood
TricotsDrainage cages
Jig
Position forcing tray

Preparation before Implementing
• Risk Analysis– Met with a team of Terumo associates including
engineering, upper management, quality manager, and manufacturing associates to assess risk via a Terumo Risk Analysis template.
– Given GREEN light to go ahead
• Update Standard Operating Procedures– Drafted changes to the SOP via text and pictures
which was then reviewed and approved by Terumo

Implementation/Testing
• Off-line implementation– Operator at Terumo
tested the new set-up of VR table on manufacturing floor to make sure everything easy to reach and functions well.
Implementation/Testing
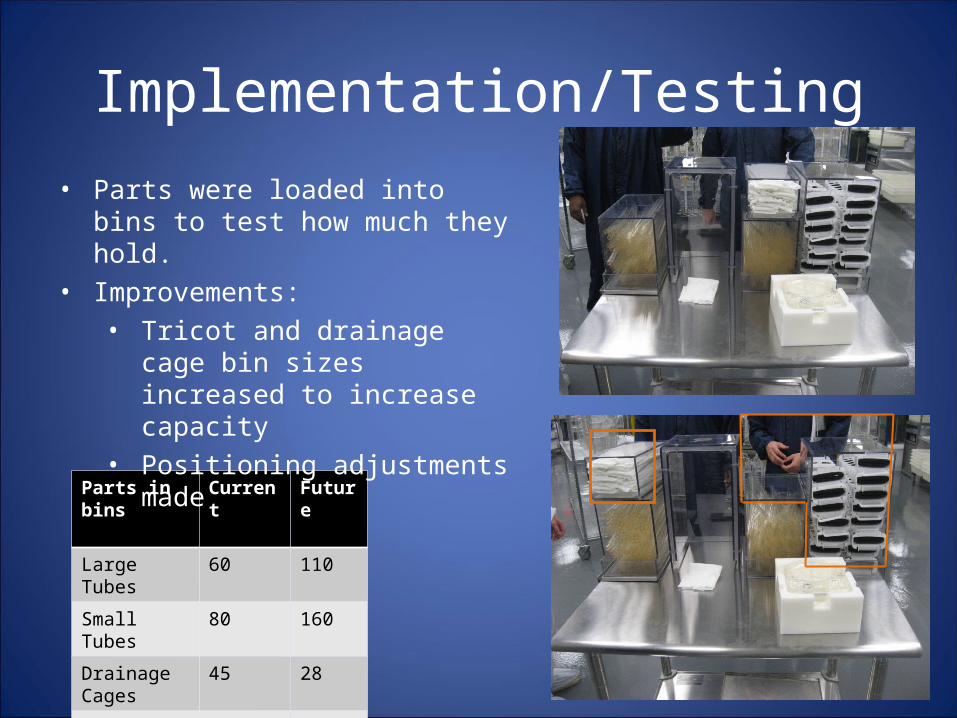
Parts in bins Current Future
Large Tubes 60 110
Small Tubes 80 160
Drainage Cages
45 28
Tricots 100 60
• Parts were loaded into bins to test how much they hold.
• Improvements:• Tricot and drainage cage bin
sizes increased to increase capacity
• Positioning adjustments made
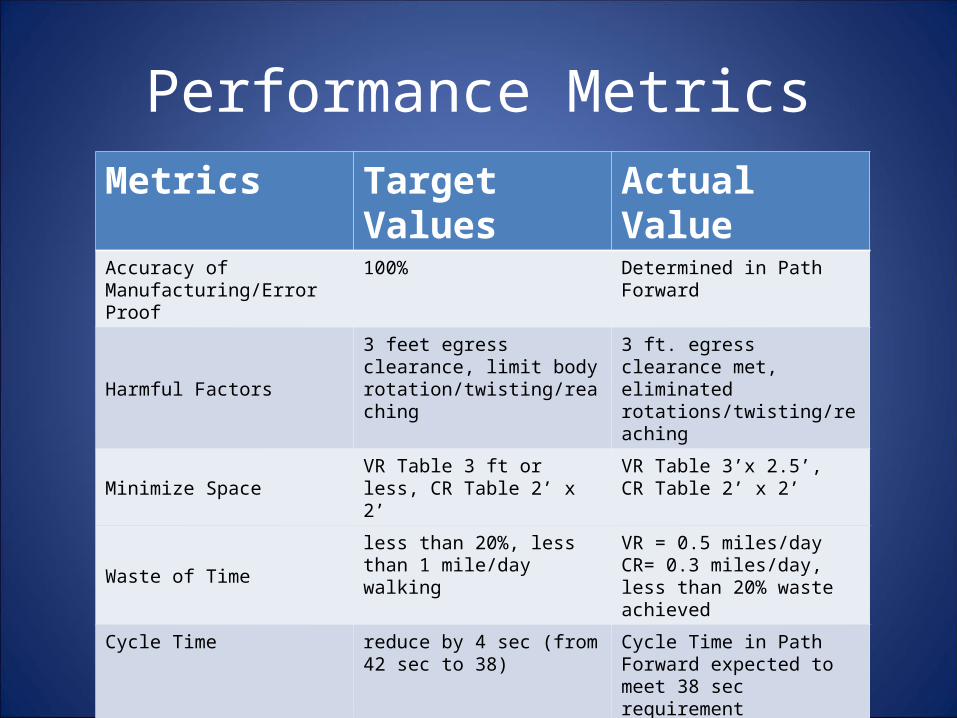
Performance MetricsMetrics Target Values Actual ValueAccuracy of Manufacturing/Error Proof
100% Determined in Path Forward
Harmful Factors3 feet egress clearance, limit body rotation/twisting/reaching
3 ft. egress clearance met, eliminated rotations/twisting/reaching
Minimize Space VR Table 3 ft or less, CR Table 2’ x 2’
VR Table 3’x 2.5’,CR Table 2’ x 2’
Waste of Timeless than 20%, less than 1 mile/day walking
VR = 0.5 miles/dayCR= 0.3 miles/day, less than 20% waste achieved
Cycle Time reduce by 4 sec (from 42 sec to 38)
Cycle Time in Path Forward expected to meet 38 sec requirement
Productivity Increase of 675 units of oxygenators/week
675 units of oxygenators/week expected to be met in Path Forward
Risk Score below 25 RPN (no mitigating action required)
Risk slightly increased but significantly under 25

Path Forward
• Terumo will manufacture the new bins for the increased capacity and new arrangement.
• Design can then be implemented on the line.• Additional time studies and spaghetti diagrams are
recommended once implemented on the line.• Sensors will be implemented at a later date by
Terumo.
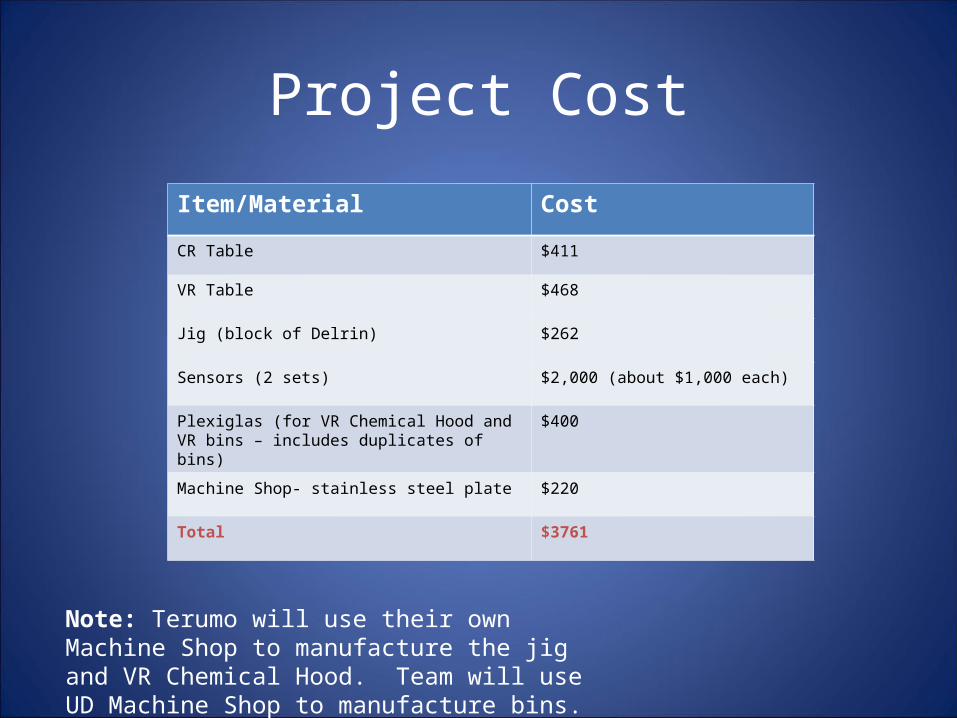
Project Cost
Item/Material Cost
CR Table $411
VR Table $468
Jig (block of Delrin) $262
Sensors (2 sets) $2,000 (about $1,000 each)
Plexiglas (for VR Chemical Hood and VR bins – includes duplicates of bins)
$400
Machine Shop- stainless steel plate $220
Total $3761
Note: Terumo will use their own Machine Shop to manufacture the jig and VR Chemical Hood. Team will use UD Machine Shop to manufacture bins.

Revenue Analysis
• 15 additional units/hour• 30,960 additional units/year• $12,384,000 additional revenue/year• $1,145,520 additional material cost/year
• $11,238,480 net gain/year

Project Summary
• Lean manufacturing techniques such as VSM used to increase efficiency of manufacturing process
• Improved ergonomics for operators• Maximized space used• Decreased cycle time• $11.2 million net gain/year

Questions?


![Oxygenator pressure drop - Scansectscansect.org/wp-content/uploads/2015/04/Pressure.pdf · Oxygenator pressure drop 0 50 100 150 200 250 300 350 Pressure drop [mmHg] 2 4 6 Blood flow](https://img.pdfslide.us/doc/110x75/5f0544937e708231d4121e39/oxygenator-pressure-drop-oxygenator-pressure-drop-0-50-100-150-200-250-300-350.jpg)