Embed Size (px)
Citation preview

PB 1
C L I M ATE C H A N G E F I N A N C I N G
F O R C I T I E S I N I N D O N E S I A
Case Study: Kupang

PB 2
This document is an output from a project commis-sioned through the Climate and Development Knowl-edge Network (CDKN). CDKN is a programme funded by the UK Department for International Development (DFID) and the Netherlands Directorate-General for In-ternational Cooperation (DGIS) for the benefit of devel-oping countries. The views expressed and information contained in it are not necessarily those of or endorsed by DFID, DGIS or the entities managing the delivery of the Climate and Development Knowledge Network, which can accept no responsibility or liability for such views, completeness or accuracy of the information or for any reliance placed on them.
The Climate and Development Knowledge Network (“CDKN”) is a project funded by the UK Department for International Development and the Netherlands Direc-torate-General for International Cooperation (DGIS) and is led and administered by PricewaterhouseCoopers LLP. Management of the delivery of CDKN is undertaken by PricewaterhouseCoopers LLP, and an alliance of organ-isations including Fundación Futuro Latinoamericano, LEAD Pakistan, the Overseas Development Institute, and SouthSouthNorth.
Author:Henriette ImeldaTorry KuswardonoFabby Tumiwa
Editor:Tracy Wright Webster
Design & illustrator:Martin Dima
C L I M ATE C H A N G E F I N A N C I N G
F O R C I T I E S I N I N D O N E S I A
Case Study: Kupang

PB 3
TABLE OF CONTENTS
1. INTRODUCTION 2
1.1. Cost of climate actions and the availability of funds 7
1.2. Financing in the Paris Agreement and its impact for Indonesia 10
1.3. Climate finance and its relevance for Indonesia 12
1.4. Indonesia’s readiness for climate finance 14
2. CITIES AND CLIMATE CHANGE 16
2.1. Climate change in the city of Kupang 18
2.1.1. Climate change adaptation and mitigation priorities in Kupang 20
3. CLIMATE FINANCE LANDSCAPE IN INDONESIA 30
3.1. Various climate finance identified 30
3.1.1. International climate funds 32
3.1.2. National climate funds 35
3.1.3. Local level 42
4. ALLOCATION OF CLIMATE FINANCE IN INDONESIA 48
5. CLIMATE FINANCE GAPS IN KUPANG 52
5.1. Governance 52
5.2. Adequacy 54
5.3. Effectiveness 55
6. CLOSING THE GAP 57
6.1. Access and mobilization of climate finance 57
6.2. Allocation of climate finance 57
6.3. Reporting and measuring the impacts of climate finance 58
7. CONCLUSIONS AND RECOMMENDATIONS 62
7.1. Conclusions 62
7.2. Recommendations 62
8. REFERENCES 64

PB 4
1. INTRODUCTION
C limate change is occurring and is worsening. Ex-treme weather, droughts and floods have resulted in economic losses that impact people and liveli-
hoods. The IPCC Fifth Assessment Report says that the impacts of recent climate-related extremes, such as heat waves, droughts, floods, cyclones, and wildfires, reveal significant vulnerabilities and the exposure of some eco-systems and human systems to current climate variability (very high confidence). It also elaborates that the im-pacts of such climate-related extremes include alteration of ecosystems, disruption of food production and water supply, damage to infrastructure and settlements, mor-bidity and mortality, and consequences for human mental health and well-being. For countries at all levels of de-velopment, these impacts are consistent with a signifi-cant lack of preparedness for current climate variability in some sectors.1
Although adapting to the impacts of climate change, for both rapid onset and slow onset change, is urgent, miti-gation of climate change is equally important. It cannot be avoided that failure to mitigate will worsen the impact of climate change. Therefore, both mitigation and adap-tation must be undertaken. Adaptation action should be in response to specific vulnerabilities and the impact of climate changes that threaten an area, while mitigation actions should cover activities to reduce greenhouse gas emissions (GHGs) from their source and slow the rate of GHG emissions in the future.
CLIMATE CHANGE FINANCINGIN INDONESIA:
STATUS, OPPORTUNITIES AND GAPS
1
1 IPCC. Fif th Assessment Report: Summary for policymakers onImpacts, Adaptation,and Vulnerability. 2014

PB 5
Figure 1 Diagram of cause and effects of climate change2
T he COP 21 Paris conducted at the end of 2015 pushes Parties to come to an agreement to engage in collective efforts to avoid incremental tempera-
ture increases beyond 1.5oC or 2oC. The SED3 report has stated that at 0.8oC warming, climate change poses severe challenges to populations, beyond the current adaptive capacities of many people.4 The SED report5 para 108 also says, “Experts emphasized the high likeli-hood of meaningful differences between 1.5oC and 2oC of warming regarding the level of risk from ocean acidi-fication and of extreme events or tipping points, because impacts are already occurring at the current levels of warming; risks will increase with further temperature rise.” The SED report also presents the impact of climate change experienced when the average temperature in-creases by 1.5oC and 2oC.
M I T I G AT I O N
A D A P TAT I O N
Impactson
humans
Climatechange
Globalwarming
Humanactivities
Anthropogenicemission
Earth’stemperature
2 IESR analysis3 SED is Structured Expert Dialogue, was established by the COP in 2012 and aims to support the work of a Joint Contact Group of SBSTA and SBI and to ensure the scientific integ-rity of the review through a focused exchange of views, information and ideas. SED held four sessions and completed its work in Feb-ruary 2015. (http://unfccc.int/science/workstreams/the_2013-2015_review/items/7521.php)4 Climate Analytics. 1.5oC risks and feasibility. 2015.5 Climate Analytics. 1.5oC risks and feasibility. 2015.

PB 6
AT 1.5OC AT 2.0OCIMPACTS
Most terrestrial and marine species would
be able to follow the speed of climate
change
Ocean acidification impacts would stayat moderate level
and up to half of coral reefs may remain
Sea level risemay remainbelow 1 m
Some Arctic sea ice may remain
More scope foradaptation would
exist, especially in the agricultural sector
The rate of climate change would
become too rapidfor some species to
move sufficiently fast
The risksfor mass coral
bleaching wouldbecome very high
Long-term sea level rise may exceed 1 m
Arctic summersea ice will be
further significantly reduced
Crop production would be at high risk with some potential
for adaptation
Figure 2 Key impacts for 1.5oC and 2oC temperature increases as identified in the SED6

PB 7
UNUSUAL SUMMER HEAT EXTREMES(Percentage of land that will experience)
1.5 C0
20-25%
45%2 C03 C0
70%
4 C0 85%GREATER
THAN
BLEACHING OF CORAL REEFS
2 C0 Virtually all coral reefs toexperience severe bleaching 4 C0 Host coral reefs are projected to be
extinct, with the loss of associatedfisheries and coastal protection.
CURRENT
EQUAL TO
EQUAL TO
2 C+ 0
4 C+ 0
20%
50%
DECLINE IN WATERAVAILABILITY
Source:World Bacnk, 2014,Turn Down the Heat,volume II
Figure 3Climate change impacts that are increasing rapidly with temperature change.7
7 Slide 13 of the presentation by Mr. Stephane Hallegatte (World Bank) presented in the SED 4. The presentation can be downloaded through unfccc.int/files/science/workstreams/systematic_observation/application/pdf/141203_sed4_hallegatte.pdf

PB 8
Figure 2 and Figure 3 affirm the urgency in implement-ing climate change mitigation measures if the world is to minimize the impact of climate change.
COP 19 in Warsaw introduced INDC (Intended Nation-ally Determined Contribution)8 that is applicable to all Parties. INDC is the intended contribution of the Par-ties to act to reduce greenhouse gas emissions beyond 2020. This implies that all Parties under The Convention shall engage in the intended climate actions to be con-ducted domestically, beyond 2020. At first, INDC was only intended for Parties to put forth their greenhouse gas emissions reduction actions. However, there were also Parties that included climate change adaptation as part of their INDC. For most developing countries, the inclusion of climate change adaptation actions in their INDC shows that they must cope with the impacts of climate change even in the absence of, or with limited support from, developed countries.
Figure 4 Emissions gaps9
Includes INDCssubmittedby Dec. 5th 2015
Glo
bal
gree
nhou
se g
as e
mis
sion
s (G
tCO
2e)
25
30
35
40
45
50
55
60
65
1990 1995 2000 2005 2010 2015 2020 2025 2030
Emissions gaps
2oC 1.5oC
20
30
: 2
1-2
3 G
tCO
2e
20
25
: 1
1-1
3 G
tCO
2e
20
30
: 1
5-1
7 G
tCO
2e
20
25
: 1
4-1
6 G
tCO
2e
© www.climateactiontracker.org/ Climate Analytics/Ecofys/ NewClimate/PIK
Historical emissionsincl. LULUCF
Current policy projections
Pledges and INDCs
20C consistent medianand range
1.50C consistent medianand range
8 When formulated INDC was intended to cover only climate action on mitiga-tion. However, COP 20 in Lima decided to welcome intended contributions for adaptation as well as the means of implementation.9 http://climateaction-tracker.org/global/173/CAT-Emissions-Gaps.html

PB 9
The UNFCCC Secretariat had produced a technical paper that consists of the aggregates of the collected INDCs, prior to COP 21. The paper represents emissions reduction pledg-es from 162 INDCs that are representative of 189 countries. The technical paper shows that in aggregate, the current INDCs will result in increasing temperatures of between 2.4oC – 3.4oC by 2100. This means that the collected INDCs are not suf-ficient to avoid an average temperature increase of 1.5oC or even 2oC. Therefore, a more ambitious target on reduction of greenhouse gas emissions needs to be applied. Having said that, it was expected that each Party review its INDCs to seek opportunities to increase its mitigation targets, which reflects its level of contribution to global greenhouse gas emissions, considering its national circumstances and respective capa-bilities. The reviewed INDCs shall then be submitted as the Party’s NDC.
© www.climateactiontracker.org/Climate Analytics/Ecofys/NewClimate/PIK
* 5%-95% percentile of ARS WGIII scenarios in concentration category 7, containing 64% of the baseline scenarios assessed by the IPCC
** Greater than 66% chance of staying within 20C in 2100. Median and 10th to 90th percentile range. Pathway range excludes delayed action scenarios and any that deviate more than 5% from historic emissions in 2010.
*** Greater than or equal to 50% chance of staying below 1.50C in 2100. Median and 10th to 90th percentile range. Pathway range excludes delayed action scenarios and any that deviate more than 5% from historic emissions in 2010.
Figure 5 Effect of current pledges and policies on global temperature10
Glo
bal
gree
nhou
se g
as e
mis
sion
s (G
tCO
2eq
.)
Warmingprojectedby 2100
Baselines:4.1-4.80C
CurrentPolicies:3.3-3.90C
Pledgesand INDCs:2.4-2.70C
Below 20C:1.5-1.70C
Below 1.50C:1.3-1.50C
200
150
100
50
0
-50
1990 2000 2010 2020 2030 2040 2050 2060 2070 2080 2090 2100
20C consistent medianand range**
1.50C consistent medianand range***
Pledges and INDCs
Current
Reference*
Historical emissionsincl. LULUCF
10 http://climateaction-tracker.org/global.html
PB 10
T he UNEP Emission Gap Report 2015 states that there is significant potential for ICIs (International Cooperative Initiatives) to close the emissions gap.
The Emission Gap Report states that by including those initiatives, around 2.5 - 4 Gton CO2-eq in 2020, if fully implemented.11 The Emission Gap Report in 2011 estimated that the emissions gap in 2020 will be around 11 Gton CO2-eq/year if the pledges are at low ambition, but can be narrowed down to 6 Gton CO2-eq/year12, if the pledges are at high ambition. This means that ICI can contribute to close the gap up to 30%.13 Some of the initiatives that the report examined were the initiatives conducted by cities, such as C40 Climate Cities Leadership Group and Com-pact Mayors. C40’s flagship research publication in 2016 estimated that there is a potential to expand C40 cities’ climate action to more than 26,000 specific activities, pro-grammes, procurements and policies. Among these, 2,300 were identified as high-impact, readily deliverable actions that could save a massive 450 Mton CO2-eq by 2020, this could be unlocked with USD 6.8 billion. The same publication also recognized the existence of 10,000 cli-mate actions already underway in C40 cities, which are potentially saving up to 645 Mton CO2-eq by 2020 and reducing the risks of climate change.14 Therefore, looking at climate actions at the cities level is crucial in order to achieve the target to reduce greenhouse gas emissions in a country.
1.1. COST OF CLIMATE ACTIONS ANDAVAILABILITY OF FUNDS
Financing holds an important role in the implementation of climate actions, especially for developing countries. Developing countries need to overcome their develop-ment challenges, such as with the issues of economic growth and poverty, which will be greater due to the im-pact of climate change. The impacts of climate change may destroy the facilities required to develop, and ne-cessitate greater need for investment.
There is various information on the financial needs for climate actions, both in terms of mitigation and adapta-tion. ODI and HBF15 have collected estimations of the incremental costs of adaptation and mitigation in de-veloping countries from various sources to determine
11 UNEP. Emission Gap Report 2015. 12 UNEP. Emission Gap Report 2011. 13 IESR’s estimation.14 C40 cities climateleadership group.Unlocking climate actionin megacities. 2016.15 http://www.climatefund-supdate.org/resources/esti-mated-costs-climate-change

PB 11
the estimated financial requirements as well as the availability of funds. The World Bank, for instance, has estimated that the incremental costs for adap-tation in developing countries between 2010 and 2050 will reach USD 70-100 billion per annum, while for mitigation will be around USD 265-565 billion per annum by 2030.
Table 1 Estimated incremental costs of adaptation in developing countries (USD billion per annum)16
S T U D Y 2 0 1 0 -2 0 1 5
2 0 1 0 -2 0 2 0
2 0 3 0 2 0 1 0 - 2 0 5 0 M E T H O D
30-100
70-100
13-38
26-67
WorldDevelpmentReport(2010)
World BankEACC (2010)
ProjectCatalyst (2009)
UNFCCC(2009)
Oxfam(2007)
UNDP HDR(2007)
World Bank(2006)
Stern Review(2006)
>50
86-109
9-41
4-37
Compiled several estimations of adaptation costs (including others in this list) with scenarios of 450 ppm, 2005 USD
Average annual adaptation costs from 2010 to 2050 in the agriculture, forestry, fisheries, infrastructure, water resource management, and coastal zone sectors, including impacts on health, ecosys-tem services, and the effects of extreme weather events. In 2005, USD
Estimates only public needs in vulner-able countries using costs from NAPAs, increased funding of public goods and disaster support. Assumes 450 stabiliza-tion, USD 1.25 to EUR 1 exchange rate
Including: agriculture, forestry and fisheries, water supply, human health, coastal zones, infrastructure, and eco-systems. In 2005, USD, between 450 and 550 ppm.
Based on World Bank (2006), plus extrapolation of costs from NAPAs and NGO projects
Builds on World Bank (2006), plus cost of adapting Poverty Reduction Strategy Papers and strengthening disaster response
Cost of climate proofing ODA, foreign and domestic investment
Aiming for 450 ppm stabilisation
16 http://www.climatefund-supdate.org/resources/esti-mated-costs-climate-change

PB 12
T he first Biennial Assessment Report of Stand-ing Committee on Finance in 2014 recorded that financial flow in 2010-2012 for climate
change adaptation was much lower (around 11–24%) compared to climate change mitigation.18 However, there is also evidence that adaptation finance has been increasing, but remains a small share of the estimates done by the SCF. The fif th assessment report of IPCC estimated that total climate finance for mitigation and adaptation is estimated at between USD 343 to 385 billion per year,19 almost evenly being invested in developed and develop-ing countries (medium confidence). IPCC (2014)20 also estimated the total climate finance that flows to developing countries was between USD 39–120 billion per year.21
Table 2 Estimation of the incremental investments of mitigation in developing countries (USD billion per annum)17
Compiled several estimates of incremental investment (including others in this list) with scenarios of 450 ppm, 2005, USD
The report estimates incremental costs, but is considered investment as the transaction costs and associated technology costs are added to cost estimates 450 stabilisation, USD 1.25 to EUR 1 exchange rate
All mitigation options, 450 ppm, 2005 USD (converted at USD 1.5: EUR 1). Based on statement that 60% investment is required in developing countries (report figures not split by developed/developing countries)
Brief report, 2005 USD
An update on the UNFCCC (2007) report adds “170%” to miti-gation investment, although no breakdown of the figure is given
All mitigation options, including REDD, in 2005 USD be-tween 450 and 550 ppm
S T U D Y 2 0 1 0 -2 0 2 0
2 0 3 0 M E T H O D
World Bank(2010)
ProjectCatalyst (2009)
McKinsey &Co. (2009)
UNFCCC(2008)
UNFCCC(2007)
Haites(2008)
69-100
212
265-565
324
80
156-165
92-97
17 http://www.climatefundsup-date.org/resources/estimated-costs-climate-change18 UNFCCC Standing Commit-tee on Finance. 2014 Biennial Assessment and Overview of Climate Finance Flows Report. UNFCCC. 19 Using a mix of 2010, 2011 and 2012 data.20 IPCC. Fif th Assessment Re-port Chapter 16 Working Group III on Cross-cutting Investment and Finance Issues. 2014.21 Using a mix of 2009, 2010, 2011 and 2012 data (medium confidence).

PB 13
According to the data provided by ODI and HBF in Figure 7, although the pledge funding reached almost USD 40 billion, the approval (the money that can be used as of today) is only around USD 15 billion.
OECD has indicated that in order to meet the increasing demand to expand and renew urban infrastructure, physical capital investment of over USD 20 trillion by 2025 will be required mostly in emerging economies.22
By looking at the total aggregate financial needs as stated in Table 1 and Table 2, and comparing it with the available funding in Figure 6, a huge funding gap is evident.
Measure Names
Pledge (USD mn)
Deposit (USD mn)
Approval (USD mn)
Other Sources of Income - This includes funds received from Certified Emission Reductions, investment and the Private Sector. These composition differs for each fund however, more information can be found on each of the individual fund pages.
https://www.climatefundsupdate.org/the-funds
The data in this chart is based on information received from the 26 multilateral, bilateral, regional and national climate funds regularly monitored by CFU. The data, for most funds,is up to date as of end of May 2016.
Figure 6 Status of the funds (updated as of end of May 2016)23
Pledge (USD mn)
Valu
e
10K
20K
30K
0K
Status of the funds Fund All
Deposit (USD mn) Approval (USD mn)
22 OECD. Cities and Climate Change: Policy Perspectives National governments enabling local action. September 2014.23 http://www.climatefundsup-date.org/data

PB 14
1.2. FINANCING IN THE PARIS AGREEMENT AND ITS IMPACT ON INDONESIA
P aris Agreement is an important milestone for all Parties under UNFCCC to work together to achieve the ultimate goal of the Convention, where
finance becomes an important part of the Agreement. Parties have agreed to the two parts in COP 21 Paris: the 2016-2020 part (pre-2020) and the after the year 2020 (post-2020) part; and both parts are inseparable. In the pre-2020 part, parties agreed on:
( i ) Allocation of the financial resources for adaptation and mitigation (para 52).This para emphasizes that the use of financial resources provided to developing country Parties should enhance the implementation of developing countries’ policies, strategies, regulations and action plans which integrate climate actions with respect to both mitigation and adaptation. This implies that climate finance should be allocated for both mitigation and adaptation, with activities that will enable Parties to implement their policies, strategies, and regulations, as well as a climate change related action plan. However, this para also recognizes the importance of Parties to have climate change related policies, strategies, regulations and action plans. In the Indonesian context, this should not only be available at the national level, but also at the local level. This also should not only be applied to government bodies, but also to civil society organizations and the private sector.
( i i ) Mobilization of climate finance (para 53).This para recalls the willingness of developed countries to mobilize USD 100 billion by 2025, with a minimal increase of USD 100 billion per year thereafter. This, however, should also be driven by the needs and priorities of developing countries. This para implies that funding will only be granted to developing countries that have already indicated their needs and priorities. Indonesia will need to encourage not only the national government, but also sub-national levels of government, to indicate their clear climate related needs and priorities in order to make use of the available funds as stated in this para.

PB 15
( i i i ) MRV of support, including on how developed countries shall provide adequate and predictable financial sources.MRV (Monitoring, Reporting, and Verifying) of sup-port to be developed and implemented means that all Parties need to establish a robust mechanism to enable the process of conducting MRV in tracking the funding; both as financial contributor or recipi-ent. The Paris Agreement also acknowledges the role of non-state actors (NSA) in conducting climate ac-tions, both for adaptation and mitigation. However, in order to include their actions as a contribution to the achievement of the national target, Parties need to have a robust MRV mechanism, which can in-clude the work of local governments, CSOs, and the private sector. This is a big challenge for Indonesia, where the existing MRV mechanism applies only to activities conducted by the central government.24
( iv) Delivery channel for climate finance.The Paris Agreement endorses all operating entities of the financial mechanism under Article 11 of the Convention, to serve the implementation of Paris Agreement to deliver the available funds to recipient countries. The mentioned operating entities are Global Environmental Facility (GEF) and Green Climate Fund (GCF). Indonesia can make use of GEF funding, as it is still considered a developing country and is therefore eligible to receive a STAR allocation. If a country is entitled to a STAR allocation it does not have to compete with other countries to get funding, unless it is among those countries at the top of the STAR allocation. However, it should be noted that the amount of funding through GEF for climate change is currently decreasing. Another operating entity is Green Climate Fund (GCF) which will disburse funding through implementing entities that are accredited by the Fund. It is important for Indonesia to have accredited national implementing entities that are eligible to access the Fund directly, in order to make use of the Fund. However, having accredited national implementing entities, is not
24 http://iesr.or.id/2016/05/semiloka-memperkuat-kontribusi-non-state-actors-nsa-untuk-percepatan-im-plementasi-aksi-perubahan-iklim-di-indonesia/

PB 16
easy. IESR, in their discussion report25 on accessing GCF, states that there are many hurdles that need to be overcome for an entity to be accredited. In the Indonesian context, these hurdles include language and procurement procedures, among others. Efforts to gain accreditation have resulted in increased costs to the interested entities in terms of financial expenditure, energy, and time. Unless Indonesia puts greater effort into encouraging more accredited national implementing entities, the likelihood that Indonesia will be able to access the Green Climate Fund will be low. Moreover, the GCF’s policy of locking 50% of funding for adaptation to LDCs and SIDS, has led many international entities to access the fund by conducting projects to support LDCs and SIDS, rather than developing countries like Indonesia, which are considered emerging developing countries. Nevertheless, the potential for Indonesia to access the fund remains, through accredited national implementing entities.
In the light of the Paris Agreement, where it is expected that Parties will have a Nationally Determined Contribution (NDC) to be implemented by 2020, Indonesia needs to start thinking about how to mobilize financing beyond the national budget and even beyond international and bilateral financing schemes. Although Indonesia is eligible to access the funds available at the international level, it still needs to consider how to mobilize domestic climate finance to ensure the achievement of sustainable low emissions and climate resilient development, which shall be achieved by engaging other stakeholders such as Civil Society Organizations (CSOs) and the private sector.
UNLESS INDONESIA PUTS GREATER
EFFORT INTOENCOURAGING
MORE ACCREDITEDNATIONAL IMPLE-
MENTING ENTITIES, THE LIKELIHOOD THAT INDONESIA WILL BE ABLE TO
ACCESS THE GREEN CLIMATE FUNDWILL BE LOW.”
25 Imelda, H., Tumiwa, F. Strengthening Direct Access to Green Climate Fund by Indonesia’s Entities. IESR. November, 2015.

PB 17
1.3. CLIMATE FINANCE ANDITS RELEVANCE TO INDONESIA
A f ter Indonesia announced its commitment in 2009 to reduce greenhouse gas emissions by 26% by 2020, the Ministry of Finance
developed a mitigation fiscal framework to see whether Indonesia’s public financing can support the achievement of the 26% target, what can be done to identify the possible gap, and any further actions required to close the gap.
The Ministry of Finance estimated that the indicative costs for mitigation action as listed in the national ac-tion plan for greenhouse gas emissions (RAN-GRK) is around IDR 225.525,47 trillion for core actions and IDR 18.492,52 trillion for supporting actions.
In the mitigation fiscal framework, it is indicated that more investment and funding are required to achieve the climate action targets to enable Indonesia not only to meeting its emissions reductions target by 2020, but also to continue reducing its emissions beyond 2020. This implies that Indonesia needs to continue to allocate budget funding for climate ac-tions over the longer term.
Table 3 Indicative costs for mitigation actions listed in RAN GRK (2010-2020)26
Forestry and peat-land
Energy and transportation
Agriculture
Industry
Waste
Others
TOTAL
94.654,18
48.357,89
36.804,07
1.000,00
44.709,33
-
225.525,47
6.955,54
2.286,10
882,10
1.290,00
4.949,52
2.129,26
18.492,52
S E C T O R C O R E A C T I O N S * S U P P O R T I N G A C T I O N S *
26 Syurkani Ishak Kasim, Ph.D. Climate Finance: Experience from Indonesia. Fiscal Policy Agency, Min-istry of Finance, Indonesia, presentation delivered on March 31st 2016.
PB 18
25
20
15
10
5
0
Exp
endi
ture
(ID
R t
r)
RA
N G
RK
Dat
e
160
140
120
100
80
60
40
20
0
20
10
20
11
20
12
20
13
20
14
20
15
20
16
20
17
20
18
20
19
20
20
20
21
20
22
20
23
20
24
20
25
20
26
20
27
20
28
20
29
Em
issi
ons
redu
ctio
n (m
ttC
O2e)
Frontloadedexpenditure
Emission reduction (frontloaded)
Expenditure in budget+ 7%/yr
Emission reduction (budget)
Emission reduction (budget stopped)
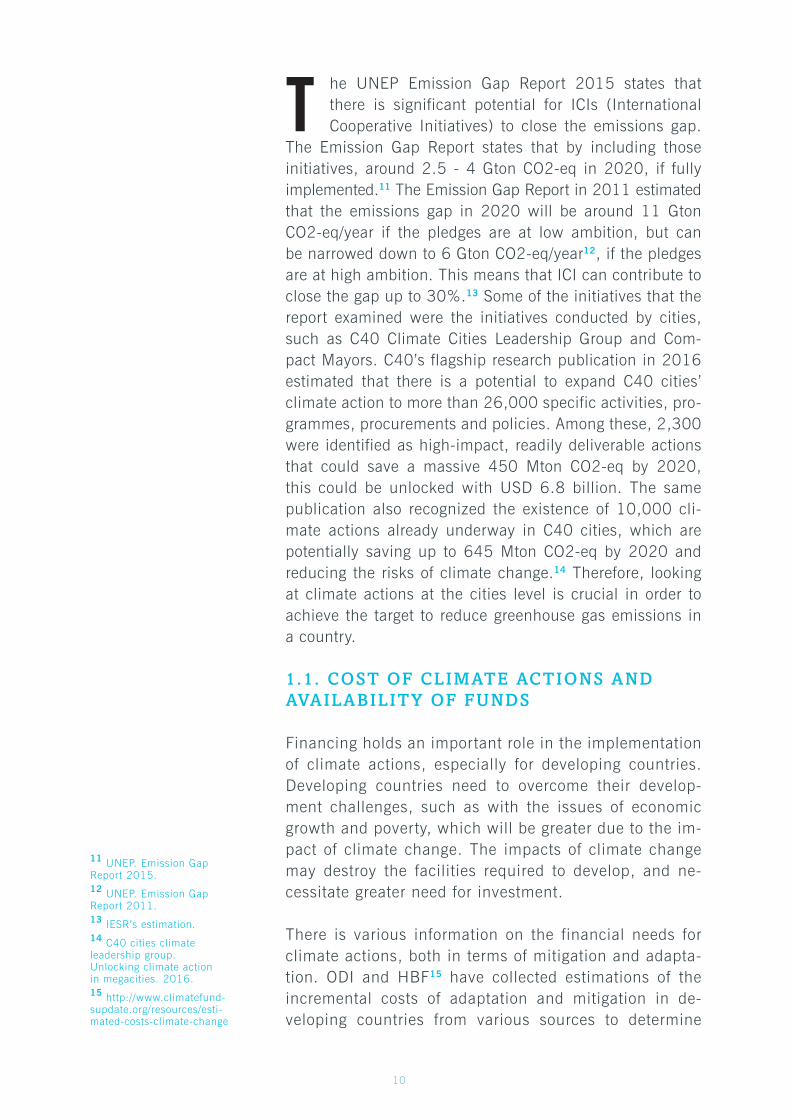
Figure 7 Emission reduction streams with front-loaded and growing expenditure27
The mitigation fiscal framework shows that Indone-sia’s current expenditure will only bring about a re-duction of around 116 million ton CO2-eq by 2020, which is equivalent to 15% of the total emissions reductions target. Indonesia needs to work more to achieve its 26% reduction target, but also to develop an effective enabling environment to engage more stakeholders, such as from the private sector, in or-der to reduce greenhouse gas emissions.
On adaptation, Bappenas has indicated the financial cost of implementing Indonesia’s national action plan on climate change adaptation is IDR 840.312 billion in total until 2020. Bappenas indicated that the source of finance for the implementation of the plan will come from national budget, as a national adaptation plan is already integrated in the national medium-term development plan.28 However, other sources of financing such as public–private–partnerships and international supports are also included in the financing scenario of the national adaptation plan.29
26 Ministry of Finance. Indonesia’s First Mitigation Fiscal Framework. 2012.28 Endah Murniningtyas. Presenta-tion: Adaptasi Perubahan Iklim dan Pengurangan Risiko Bencana dalam Tujuan Pembangunan Berkelanjutan (SDGs). 2015. Delivered at Nation-al DRR Month in 2015, Surakarta, 17 October, 2015.29 Bappenas. Indonesia’s National Action Plan on Climate Change Adaptation. 2014.

PB 19
Table 4 Total financial needs for the National Adaptation Plan of Indonesia30
1.4. INDONESIA’S READINESSFOR CLIMATE FINANCE
T he scale of financing needed to conduct mitigation and adaptation requires a country to be able to access the financial resources available, combined
with the public finance availability, and channel these resources into climate mitigation and adaptation actions. Readiness for climate finance is defined as the capacities of countries to plan for, access, deliver, monitor, and report on climate finance, both international and domestic, in ways that are catalytic and fully integrated with national development priorities and achievement of MDGs (UNDP, 2012).31
Tanzler and Maulidia (2013),32 examined Indonesia’s readiness to absorb the existing climate finance potential as well as its capacity to spend it solely on climate activities, especially after the Copenhagen Accord where mobilization of USD 100 billion of new and additional public and private finance by 2020 was agreed to be used to support climate change actions in developing countries. In light of the Paris Agreement, the potential funding has been escalated to be USD 100 billion floor per year after 2025. This is a good opportunity for Indonesia; its readiness, however, remains questionable.
1. Economy resiliance, including food security and energy self sufficient
2. Livelihood system resiliance, including health, residential, infrastructure
3. Ecosystem resilience
4. Special area resilience, including urban, coastal and small islands
5. Supporting system
TOTAL
S E C T O R / S U B - S E C T O R B U D G E T ( I D R B I L L I O N )
176.600,1
193.764,2
428.124,8
40.290,9
1.532,0
840.312,0
30 Bappenas. Institusi Pendanaan dan Strategi Pendanaan Kegiatan Adaptasi Perubahan Iklim di Indonesia. Delivered at IESR’s FGD on July 26th 2013. Excerpt from http://www.iesr.or.id/wp-content/uploads/Institusi-dan-Strate-gi-Pendanaan-API_final.pdf31 UNDP (2012). Readi-ness for Climate Finance, accessed from https://miti-gationpartnership.net/sites/default/files/undp_readiness_for_climate_finance.pdf32 Dennis Tanzler and Martha Maulidia. Status of Climate Finance in Indone-sia. GIZ. August 2013.

PB 20
Tanzler and Maulidia (2013) observed four aspects which define Indonesia’s readiness: planning capacity, access-ing finance, good financial governance, and private sec-tor engagement. In terms of planning capacity, although Indonesia is quite advanced in mitigation planning, it lags behind in adaptation planning. Indonesia is perceived to focus more on mitigation, this leads to the necessity for adaptation planning to catch up with mitigation. In terms of planning capacity, there is no donor coordina-tion mechanism in place. Capacity at the local level also needs to be addressed through strengthening the capaci-ties of stakeholders in delivering climate change plans and financing at the sub-national and sectoral levels.
Four pillars were then suggested by Tanzler and Maulidia (2013) to improve Indonesia’s readiness to absorb international climate finance: (i) supporting capacities for multi-level planning, programming and coordination; (ii) institutional strengthening to meet financial access requirements; (iii) providing good financial governance, including sound MRV systems; and (iv) increasing efforts to engage the private sector.
On accessing finance, PT Sarana Multi Infrastruktur (PT SMI), a government-owned financial company, is currently undergoing the process of accreditation as a national implementing entity of the Green Climate Fund. While on the Adaptation Fund, the Partnership for Governance Reform/Kemitraan, an NGO’s donor, has been accredited as the national implementing entities.
Tanzler and Maulidia (2013) also identified the need to improve access to funding at the sub-national level. It was indicated that current policies and the legal frame-work at the sub-national level are not adequate to fa-cilitate climate finance delivery and management. Spe-cific purpose grants (DAK), for instance, can be one of the instruments with which to access funding available for climate action activities. However, this should be supported by the amendment on the intergovernmental fiscal transfer via DAK regulation, in order for climate change aspects to be reflected.
TANZLER AND
MAULIDIA (2013)
OBSERVED FOUR
ASPECTS WHICH
DEFINE INDONE-
SIA’S READINESS:
PLANNING CAPAC-
ITY, ACCESSING
FINANCE, GOOD
FINANCIAL GOV-
ERNANCE, AND
PRIVATE SECTOR
ENGAGEMENT.

PB 21
In relation to good financial governance, the Indo-nesian government has been trying to introduce per-formance based budgeting since 2005, in order to improve the efficiency of use of all funds channeled through the annual national budget.33 A systematic MRV of finance is also needed, which requires that the Ministry of Finance and Bappenas put in place a sys-tematic monitoring and evaluation system for track-ing national and international climate finance flows, for adaptation as well as mitigation activity. This also implies that the MRV mechanism should be integrated into national and local climate planning.34
O n private sector engagement, Tanzler and Maulidia (2013) highlight the importance of having innovative policy approaches to improve
private sector engagement. These approaches can be in terms of having a favorable market situation and related policies and programmes (e.g. tax incentives, low cost debt financing, R&D support) set up by the government which could place the right triggers in place for more private investment in low carbon growth. To increase the involvement of the private sector, it is also suggested that Indonesia needs to reform its domestic policy. Its energy pricing policy must reflect market reality and incentives should be given in terms of carbon pricing.35
Based on their observations, Tanzler and Maulidia (2013) recommended several improvements to Indonesia to support access to and allocation of climate finance. The recommendations are as follows: (i) Indonesia needs to improve its adaptation and mitigation planning; (ii) Indonesia needs to strengthen its capacity for direct access to global financing sources; (iii) Indonesia needs to support climate finance delivery and absorption at the sub-national level; (iv) Indonesia needs to develop the MRV system for national climate finance management; (v) Indonesia needs to improve stakeholder coordination on climate finance; and (vi) Indonesia needs to step up private sector engagement, in order to increase national level readiness in receiving and managing climate finance.
33 Dennis Tanzler, Martha Maulidia. Status of Climate Finance in Indonesia. GIZ. August 2013.34 Dennis Tanzler, Martha Maulidia. Status of Climate Finance in Indonesia. GIZ. August 2013.35 Dennis Tanzler, Martha Maulidia. Status of Climate Finance in Indonesia. GIZ. August 2013.

PB 22
B ig cities are alluring. People migrating to cities are attracted by more advanced public services such as schools, health services,
higher education facilities, as well as greater employment and economic opportunities. The phenomenon of urbanization has resulted in the growth of urban populations. In Asia, urbanization is a mega-trend, in which capital cities and other big cities are the focus. With a total population of more than 630 million in 2015, ASEAN countries are growing fast, and it is expected that the ASEAN population will grow to 660 million in 2020 and to more than 720 million by 2030.36
CITIES AND CLIMATE CHANGE
2
C I T Y C O U N T R Y P O P U L A T I O N I N M I L L I O N SO F I N H A B I T A N T S ( 2 0 1 5 )
MANILA
JAKARTA
BANGKOK
HO CHI MINH CITY
KUALA LUMPUR
SINGAPORE
YANGON
Philippines
Indonesia
Thailand
Vietnam
Malaysia
Singapore
Myanmar
12.9
10.3
9.3
7.3
6.8
5.6
4.8
Table 5 Number of inhabitants in most populated metropolis cities in Southeast Asia
36 Population growth and rural exodus in Southeast Asia, excerpt from: http://aseanup.com/infographic-top-cit-ies-urbanization-asean/

PB 23
This implies, however, that cities face obligations in meeting the basic needs of the population, as well as in delivering public services. This obligation becomes more challenging as the impacts of climate change are increasingly threatening cities. As their populations grow, cities need to expand their residential areas, including supporting facilities such as transportation facilities, roads, and other public services; providing reliable and accessible services such as electricity and water, also becomes a challenge. This means that if cities do not have strategies in place to cope with the above impacts, they will be more vulnerable.
Percentage of population residing in major urban areas
Urbanization
Figure 8 Urbanization percentage in Southeast Asia countries37
100%
80%
60%
40%
20%2015 2020 2025 2030 2035 2040 2045 2050
37 Infographic: top cities and urbanization in ASEAN, excerpt from: http://ase-anup.com/infographic-top-cities-urbanization-asean/

PB 24
OECD states that cities are home to more than half of the world’s population and much of the world’s indus-try. By 2050, OECD predicted that more than 70% of the population – 6.4 billion people – will be living in urban areas.38 OECD also states that most of the absolute growth in population is projected to occur in emerging Asia, although developing non-Asian coun-tries are estimated to make significant and increasing contributions over time.39
C ities are crucial for climate change, both in terms of mitigation and adaptation, which must each be uniquely addressed. For instance, OECD states
that cities are nowadays vulnerable to extreme weath-er events, storm surges and rising sea levels. Extreme weather events in cities can be especially disruptive to complex urban systems, particularly in Asia. OECD also indicated that the vulnerabilities of cities to storm surges and rising sea levels will increase rapidly over the coming decades as urban growth is concentrated in Asia.40
Despite the risks of climate change, many cities have not yet addressed climate change or prepared themselves to cope with its impact. Cities do not have climate change strategies and action plans, urban planning is outdated and less responsive to climate proofing, and regulatory frameworks that support city development do not reflect the need to address climate change risks. To help cities cope with climate change, a low carbon and resilient livelihood development strategy needs to be developed and implemented. This strategy needs to address how a city can develop in a low carbon manner and at the same time ensure the livelihood of its residents and their resilience to the impacts of climate change. Developing in a low carbon manner can be done by applying energy efficiency in buildings and residential planning, an integrated transportation system, as well as low carbon power generation that is reliable with the electricity accessible at all times. A resilient livelihood development strategy framed to provide reliable essential services to meet the daily needs of the population, such as for energy (both electricity and for cooking) and water, needs to be developed.
37 OECD. Cities and Climate Change: Policy Per-spectives National govern-ments enabling local action. September 2014.39 OECD. Cities and Climate Change: Policy Per-spectives National govern-ments enabling local action. September 2014.40 OECD. Cities and Climate Change: Policy Per-spectives National govern-ments enabling local action. September 2014.

PB 25
Another strategy that needs to be developed is the mobilization of financing required to achieve the above conceptual targets, which may need a sustainable source of finance to fund the re-quired public services, on top of meeting the ba-sic needs of the people. Big cities in Indonesia like Jakarta, Semarang, and Surabaya, may find it easier to access funding for climate change, because these cities have better access to infor-mation on funding, and local governments have better capacities to co-finance projects. How-ever, small cities located more distally from the center of the economy may not have access to information on possible funding.
This study focuses on the city of Kupang, the capital of East Nusa Tenggara province, in the eastern part of Indonesia. East Nusa Tenggara is the third poorest province in Indonesia41 with 1,149 million poor people or 22,19% of the to-tal population. By focusing on one of the poorest provinces in Indonesia, this study is expected to identify the existing financing sources that can potentially finance local climate actions, identify the gaps, and offer recommendations on strate-gies to close the gaps.
2.1. CLIMATE CHANGE INTHE CITY OF KUPANG
K upang, located at 123.51 east longitude and 10.6 south latitude, is on the island of Timor and has a semi-arid climate. The
precipitation of the city of Kupang is around 1000-1500 mm/year, with around 100 rainy days per year, which is less than in the other areas of the islands of Java, Sumatera, Kalimantan, and Sulawesi. The total area of the city of Kurang is 16,534 hectares (180.27 km2). This area sustains a population of 556,773 people, with a population growth of 10.59% per year (Profil Kota Kupang, 2015) with most migrants to Kupang coming from villages.42
EAST NUSA
TENGGARA IS
THE THIRDPOOREST
PROVINCE IN
INDONESIA WITH
1,149 MILLION
POOR PEOPLE OR
22,19% OF
THE TOTAL
POPULATION.”
41 https://m.tempo.co/read/news/2016/07/19/058788624/nusa-tenggara-timur-provinsi-ketiga-termiskin-indonesia42 Adiningtyas, W., Kuswardono, T., Heo, M., Messakh, O.,Migran Miskin Tak Ber-aset di Kota Ku-pang. Perkumpulan Pikul. 2010.

PB 26
Kupang’s economic growth is among the highest of the Indonesian cities. Between 2010-2014 the economy of Kupang grew 6.5-8.3% per year. The total Gross Domestic Product (Produk Domestik Bruto, PDB) of Kupang reached IDR 12.167,335 billion. There are five major economic contribu-tors to Kupang’s GDP: construction, vehicle repair and retail trades, information and communication, education, and public services.
Figure 9 GDP proportions of Kupang City in 201443 2014**)
GDP Proportions of Kupang City
Construction
Vehicles repairand retail trades
Information andCommunication
Education
Public Services
Transportationand storage
Insurance andFinancial services
Health andSocial Services
Other services
Real estate
Agriculture, Forestry,and Fisheries
Accomodation, food,and beverages
Manufacture
Corporate services
Water, waste-water,and waste management
Electricity and Gas
Mining and Quarrying
Million IDR
2014
0 500.000 1.000.000 1.500.000 2.000.000
43 BPS, Kupang dalam Angka, 2014.

PB 27
Although Kupang is among the cities with the high-est economy growth in Indonesia, this does not imply that Kupang has overcome its social and urban problems. According to the Municipality of Kupang Statistic Report (2014), there are around 33.8 thousand people (around less than 10% of total population) still living in poverty.44 The poor-est and most vulnerable people in Kupang are farmers, fishermen, informal workers including small vendors, women, people with disabilities, and children. These poor people are more vulner-able than other groups due to their poverty and lack of access to public services, and thus, they will have more difficulty coping with the impacts of climate change.45
Figure 10 Percentage of poor people in Kupang46
18.00%
16.00%
14.00%
12.00%
10.00%
8.00%
6.00%
4.00%
2.00%
0.00%
2008 2009 2010 2011 2012 2013
44 BPS, Kupang dalam Angka, 2014.45 Kota Kita. RAD API-PRB: Rencana Aksi Daerah untuk Adaptasi Perubahan Iklim dan Pengurangan Risiko Bencana Kota Kupang. UNDP. August 2015.46 BPS, Kupang dalam Angka 2014.

PB 28
2.1.1. CLIMATE CHANGE ADAPTATION AND MITIGATION PRIORITIESOF KUPANG
In relation to extreme climate change events, Kupang often experiences extreme weather, such as rainfall beyond the normal frequency, or a shorter rainy season (Faqih, D. J, & Geru, 2015).. Extreme rainfall in several areas has caused floods, while short rainy seasons cause streams to dry up and well levels to drop (Kota Kita & UNDP-SCDRR, 2015). Overall, it is projected that Kupang will experience less extreme dry seasons, as other places in East Nusa Tenggara will also experience. The extreme wet seasons will increase, from once every 20 years, to once in 10 years (Boer, Faqih, Perdinan & Situmorang, 2015). The tropical cyclones that have threatened Kupang city will lessen in frequency, but increase in intensity.
A ccording to the Climate Change Vulnerability Study of Kupang city,47 there are various hy-drometeorological events that threaten Kupang,
such as strong whirlwinds, storms, coastal abrasion, floods, and landslides. Aside from that, the study also states that Kupang is vulnerable to slow onset disasters such as droughts.
The projected vulnerability of Kupang to drought is high. The high vulnerability of Kupang is caused by low access to drinking water. Less than 38% of the Kupang population have access to piped water. Nevertheless, available water distribution is considered unreliable as people can only access water services once every two or three days. As a result, most households in Kupang have a water tank to collect water in when the water is flowing. Around 2% of the population has access to drinking water through bottled water companies, while around 24% of the population accesses water from private wells. There are also people who buy water from companies with water tanks, at a cost of around IDR 80.000 to IDR 250.000 per 5 liters. Taking into account the minimum water consumption
47 UNDP. Rencana Aksi Daerah untuk Adaptasi Pe-rubahan Iklim dan Pengu-rangan Risiko Bencana Kota Kupang. August 2015.

PB 29
for cities with less than 1 million inhabitants is 150 Liter/day, then, buying water at the rate of IDR 80.000 – IDR 250.000/5 liter, is quite a burden. Kota Kita (2015) has estimated that poor people spend around 20%–50% of their income meeting their need for water. In response to the incremental population increases and greater levels of economy activity, the demand for water is also increasing. Kota Kita (2015) has recommended that Kupang improve its water resources management through: (i) controlling private sector ground water utilization; (ii) improving the quality of service of PDAM (locally-owned company for drinking water); (iii) conserving the city’s drainage basin; and (iv) developing the master plan on the city’s drainage.48
Projected Water Availability in Kupang
Total domestic needs (L/s) Total water availability (L/s)
2500
2000
1500
1000
500
0
2016 2016 2016 2016 2016 2016 2016 2016 2016 2016
Wat
er d
ebit
(L/s
)
Year
Figure 11 Projected water availability in Kupang49
47 Kota Kita. Kajian Kerentanan Perubahan Iklim di Kota Kupang. Juni 2015. UNDP.49 Bureau of Statistics, Kupang. This is only a pro-jection of water demand. However, this projection has not yet taken into ac-count water consumption by industries.

PB 30
K upang has two main sources of GHG emissions: energy (including transportation and electricity) and waste. Energy consumption in Kupang is increasing
annually, alongside population and economy activities, which rely on energy. Most of the energy sources in Kupang come from fossil fuels such as diesel and coal in the generation of electricity, and gasoline for transportation. Kerosene is still the main fuel used for cooking other than wood. Kupang is highly dependent on fossil fuels.
The National Bureau of Statistics (Badan Pusat Statistik) states that the number of motor vehicles in Kupang doubled between 2009 to 2011 from 6000 to 12.000 vehicles, thereby increasing dependence on fossil fuels. This has also lead to more traffic congestion in the last five years,50 and increased greenhouse gas emissions. The existing public transportation system has not yet accommodated all residential areas, especially the new areas. Therefore, people tend to buy private vehicles, which leads to further increases in greenhouse gas emissions.
In relation to electricity generation, Kupang is highly depen-dent on diesel and coal for power. The total installed elec-tricity capacity of Kupang is 55 MW, however, in peak hours (usually at 6 PM - 10 PM), the electricity demand in Kupang can hit 60 MW. Another problem with the power plant in Kupang is the unreliable electricity quality and the frequent power outages (of around 6-8 hours per day in 2014-2015). At the end of 2015, a diesel-based floating power plant was installed to supply electricity for Kupang and although Ku-pang no longer experiences power shortages, there is high probability that Kupang’s greenhouse gas emissions from fossil fuel based power generation will increase.
Domestic waste is also a source of greenhouse gas emis-sions in Kupang. Kupang still uses an open dumping meth-od for waste treatment. Kupang’s domestic waste reaches 382 m3/day, of which only 268 m3 can be transferred to landfill.51 In order to manage its waste, Kupang needs to reduce the amount of waste from ineffective sources, as well as improve existing waste management systems to reduce greenhouse gas emissions.
50 This information was collected in the FGD that was conducted in Kupang on 12-13 November 2015.51 Kupang’s Municipal and Drinking Water and Envi-ronmental Health working group, 2014 (Pemerintah Kota Kupang and Kelom-pok Kerja Air Minum dan Penyehatan Lingkungan)

PB 31
Energy Industrial Processes and Product Use (IPPU) Agriculture Waste Land-based
Tota
l E
mis
i S
emua
Sek
tor
(ton
CO
2)
2000 2001 2002 2003 2004 2005 2006 2007 2008 2009 2010 2011 2012 2013 2014
100K
80K
60K
40K
20K
0K
Figure 12 Kupang’s greenhouse gas emissions from waste52
T he government of Indonesia has developed a national action plan to reduce greenhouse gas emissions (RAN-GRK) as well as a national ac-
tion plan on climate change adaptation (RAN-API). RAN-GRK was formalized through Presidential De-cree No. 61/2011, which elaborates the emissions reduction pledge announced by President Susilo Bambang Yudhoyono at the G20 meeting in Pittsburg in 2009. However, RAN API remains an open docu-ment, and it is being mainstreamed in Indonesia’s national medium term development plan (RPJMN) 2015-2019. This was done with the expectation that ministries, agencies, and local governments formu-late workplans based on the national medium term development plan, thus incorporating climate change adaptation into their workplans.
52 Data was taken from SIGN Smart, http://signsmart.menlhk.go.id

PB 32
RAN GRK has attached a list of activities that will be carried out at the national level through ministries and agencies. It also mandates all provincial govern-ments in Indonesia to develop their own provincial action plans to reduce greenhouse gas emissions no more than one year after RAN GRK was adopted. All provincial governments were required to then de-velop their provincial action plans to reduce green-house gas emissions, which is called RAD-GRK, and it is formalized in the Governor ’s Decree of each of the provinces.
U nfortunately, in many provinces, RAD-GRK ends at the provincial level, and discontinues at the district/cities planning level. Thus,
few Indonesian cities have an action plan to reduce greenhouse gas emissions. This disadvantages development activities related to climate change, both in terms of prevention actions and adaptation actions, as Indonesia’s national transfer mechanism follows the program developed by the relevant district/city. Therefore, if the programs are developed and planned with no consideration of projected climate change phenomenon, then the transfer mechanism will fund activities that are not climate change related. Having said that, the district/city will face difficulties when the impacts of climate change degrade the quality of the existing infrastructure or lower the quality of existing natural resources. Kupang is an example of a city that has neither a plan of action to cope with the impact of climate change nor strategies to reduce greenhouse gas emissions.
For instance, in the provincial medium term development plan of East Nusa Tenggara province for 2013-2018, climate change is explicitly stated as the 8th strategic issue and translated as follows: “Improving the environmental quality and avoiding environmental degradation as well as climate change security based on the understanding that East Nusa
KUPANG IS AN EX-AMPLE OF A CITY
THAT HAS NEI-THER A PLAN OF
ACTION TO COPE WITH THE
IMPACT OF CLI-MATE CHANGE
NOR STRATE-GIES TO REDUCE
GREENHOUSE GASEMISSIONS.

PB 33
Tenggara is an archipelago area that relies on primary sector, vulnerable to natural resources exploitation, vulnerable to the threat of coastal and maritime damages, as well as the agriculture sector, plantation, farming, and fisheries that are not supported with new ways.”53 This means that although the activities of the province are the same, the way activities are designed should be based on the understanding that climate change will impact and threaten Nusa Tenggara Province.
A lthough the province of East Nusa Tenggara has already considered the issue of climate change in their development plan, the medium term de-
velopment plan does not acknowledge the needs of the cities in relation to climate change. For instance, the medium term development plan clearly gives more attention to land use issues, rather than energy and waste; while in reality, both energy planning and waste management are crucial for Kupang.
Kupang has not yet incorporated climate change analysis in their medium term development plan for 2012-2017. The only aspect that can be considered to be related to climate change is in reference to how to establish a sustainable spatial plan and develop and maintain the city’s infrastructure in a sustainable manner. However, although Kupang has not yet ac-commodated climate change explicitly in their medi-um-term development plan, there are programmes of activities that are related and that can be considered as climate actions for both mitigation and adaptation in the city of Kupang.
KUPANG HAS NOT
YET INCORPO-
RATED CLIMATE
CHANGE ANALYSIS
IN THEIR MEDIUM
TERM DEVELOP-
MENT PLAN FOR
2012-2017.
53 The original line is the following, “Peningkatan kualitas dan pencegahan degradasi lingkungan hidup serta ketahanan peruba-han iklim dengan dasar pemikiran bahwa NTT adalah wilayah kepulauan yang bergantung pada sek-tor primer, rentan terhadap eksploitasi sumber daya alam, rentan terhadap ancaman kerusakan pesisir dan laut, serta sektor pertanian, perkebunan, peternakan, dan perikanan yang tidak didukung dengan cara-cara baru.”
PB 34
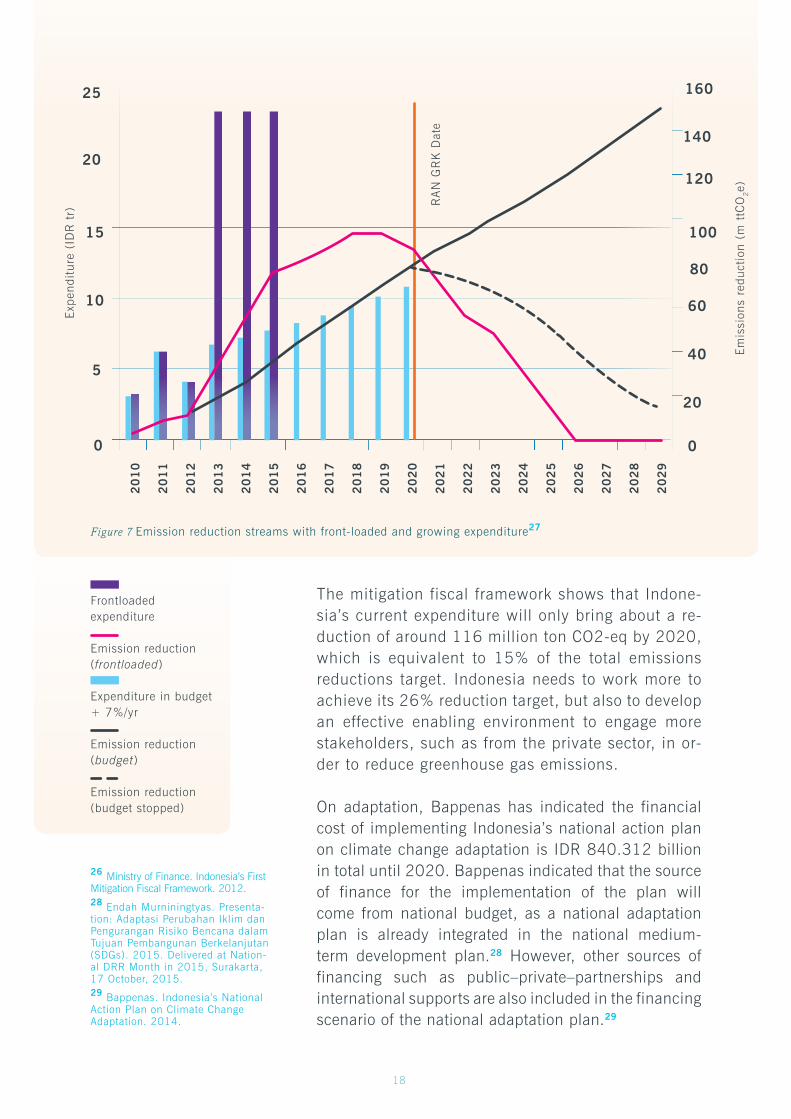
Table 6 Kupang’s development activities that can be considered climate change mitigation action54
In this study, two focus group discussions and a workshop were conducted in Kupang to determine what kind of climate change activities are possible in Kupang, related to both mitigation and adapta-tion. It was expected that this research would help to enable the local government and other relevant stakeholders in identifying the potential mitigation and adaptation actions needed in Kupang, for both the present and also the future.
This activity resulted from partnership be-tween Environmental Agency of East Nusa Tenggara province, Regional Environmen-tal Agency of Kupang city, Department of Transportation of Kupang. This activity was conducted from 2011-2016, though the monitoring part is incomplete.
This activity was done through pasrtner-ship with Geng Motor Imut (a local NGO) which produces biomass stoves and has run consecutively for three years.
The challange in conducting this activ-ity lies in the limited amount od state-owned land that is under the authority of Kupang city.
Expanding opengreen spaces(Ruang TerbukaHijau, RTH)
Waste management through waste bank and recycling
Replacing public street lightingwith on-gridmetered publicstreet lighting
Distribution ofefficient biomasscook-stoves (around 1500 cook-stoves)
Air quality andvehicle pollutionmonitoring
G O V E R N M E N T S ’D E V E L O P M E N T A C T I V I T I E S
This activity was expected to result in basic greenhouse gas emission data, as well as air quality data in Kupang.
No greenhouse gas emissions reduction target was set forthis activity.
There is no greenhouse gas emissions reduction target for this activity. However, this ac-tivity has a target to change the lamps of around 4000 public street lights in Kupang.
There is a pilot projects in two urban communities (kelurahan) of one district (kecamatan) torecycle plastics. There is no greenhouse gas emissions reduc-tion target linked to this activity.
There is no greenhouse gas emissions reduction targetaswell as the increasing carbon stock target.
G O V E R N M E N T S T A R G E T N O T E S
54 Compiled from Kupang’s mid-term development plan (2012-2017) and through group discussion with local government on September 9th 2015.

PB 35
This study also identifies climate change activities that can be conducted by stakeholders other than the local govern-ment; such as by civil society organizations. Although most CSOs have limited capacity, they can identify the needs of the city and implement measures to meet these needs. Most of the activities are related to energy and domestic waste management. While the activities of the CSOs were probably initiated without an understanding of climate change their activities are highly related and provide a positive contribu-tion for the city in relation to climate change.
Table 7 Kupang’s data availability to develop climate change mitigation plan55
E X I S T S D O E S N O TE X I S T
N O T E S
Only part of the information can beaccessed through SIGN-SMART data-base, which is from the waste sector
E L E M E N T
Sectoral greenhouse gasesemission inventory
Total greenhouse gases emission inventory
Greenhouse gas emission in the busi-ness as usual scenario (baseline)
Greenhouse gas emissions reduction target
Sectoral greenhouse gas emissionpriorities in the city of Kupang
Kupang’s strategy to reduce greenhouse gas emissions
v
v
v
v
v
v
Table 8 Activities of Kupang’s CSOs that are considered to be climate change mitigation actions56
There was a partnership between the municipal government in the biomass cook-stoves distribution program where GMI acted as vendor/supplier of the cook-stoves
Geng MotorImut (NGO)
Geng MotorImut (NGO)
ImmanuelWaste Bank
Biomass cook-stoves production
Biogasdigester
Portable solar water desalinator
Solar Home System
Private waste bank
Produce 200 (max) cook-stoves per month
Depends on market demand. However, this technology has been installed at around 50 sites throughout East Nusa Tenggara
Pilot project
Just started
Has engaged more than 200 clients
Has challanges especially related to price fluctuations of plastic and iron waste
A C T O R S A C T I V I T I E S T A R G E T N O T E S
55 Extracted from several FGDs and workshop in Kupang from 2015-2016.56 These activities were identified through focus group discussions with CSOs on September 9th 2015.

PB 36
K upang also has several activities in its de-velopment plan which can be considered as climate change adaptations. The listed
activities in the development plans show that in Kupang climate change adaptation activities might be more readily incorporated than climate change mitigation activities.
Table 9 Kupang’s development activities that are considered as climate change adaptation activities57
A C T I V I T I E S / P R O G R A M S
Waste management atthe household level,recycling, composting
Urban farming programat household level
Flood control infrastructure, land-slides
Mangrove rehabilitation and conservation
Water catchment area conservationand rehabilitation
Ground water utilization control through monitoring and permit issuance
Clean water distribution in dry season
Fire prevention
Local economy empowerment
Coastal economy empowerment
Disaster area mapping and fire contigency plan
Poor people empowerment programme
C U R R E N T S T A T U S O F A C T I V I T I E S
There are pilots at several houses and urban communities (kelurahan)
Pilot in 25 households
Currently ongoing in several urban communities that are vulnerable to land-slides and floods
ongoing particularly in areas that have and previously had mangrove vegetation
Ongoing
The authority to manage water will be shifted from the local to the provincial level. This leads to concerns about the effectiveness of monitoring and control
Ongoing
Ongoing (routine basis)
Applies for all district and urban communities. Around IDR 500 million per urban community was allocated to be accessed by the people
Specifically in coastal urban communities
Ongoing
C A T E G O R Y O F A C T I V I T I E S
Vulnerability reduction
Capacity building
Vulnerability reduction
Vulnerability reduction
Vulnerability reduction
Vulnerability reduction
Vulnerability reduction
Vulnerability reduction
Drought emergency response
Capacity building
Capacity building
To increase the capacities of poor people
57 Kupang’s medium term development plan (RPJMD) 2012-2017 combined with the FGD results with local govern-ment in September 9th 2015.

PB 37
Aside from the development activities of local government, there are also activities conducted by civil society organizations that can be considered as climate change adaptations.
Table 10 Kupang’s data availability to develop climate change adaptation plan
D O E S N O TE X I S T
E X I S T S
v
v
v
v
E L E M E N T S
Vulnerability Assessment and climate change risk studies
Climate changeadaptation priority
Climate changeadaptation strategy
Climate change adaptation activities
N O T E S
Local action plan on climate change adaptation and di-saster risk reduction (RAD-API PRB) exists, however, the document cannot be formal reference for city development planning as climate change is not throughly discussed. For instance, scenario options if the average temperature increases to 10C, 1.50C, and 20C in the next 50 years, are not included.
Already included in the local action plan on climate change adaptation and disaster risk reduction (RAD-API PRB)
Already included in the local action plan on climate change adaptation and disaster risk reduction (RAD-API PRB)
Already included in the local action plan on climate change adaptation and disaster risk reduction (RAD-API PRB), but limited to activities that have been approved in the local medium-term development plan (RPJMD) and the strategic plans of the local working agency (Satuan Kerja Perangkat Daerah, SKPD)
Table 11 Activities of Kupang’s CSOs regarding climate change adaptation58
A C T O R
Pikul, CIS Timor
ImmanuelWaste Bank
Pikul
A C T I V I T I E S
Rain-water harvesting
Small industry plastic waste recycling
Disseminationof informationon weather and seasons forcoastal people
C U R R E N T S T A T U S
Pilot project
Still at the business development stage
Pilot scale
N O T E S
Collecting rain-water to meet the water needsof families, households, and for agriculture in the rural areas
The chalenge to be overcome by the waste bank is the long waste management chain (Kupang-Surabaya)
In 2014, Pikul did a pilot project on this through SMS getaway. The information was disseminated and reached around 50% of the total fisherman households in kupang city.
58 Source of informa-tion was the focus group discussion on September 13th 2015.

PB 38
T he 2014 Climate Policy Initiative (CPI) publi-cation indicated that in Indonesia around USD 678 million of climate finance comes from pub-
lic sources. CPI indicated that around 97% of the fi-nance was disbursed through ministries and agencies, while only a very small proportion was issued to local governments in the form of grants. The same report also mentioned that in terms of information practices in Indonesia there are blockages in the flow of domes-tic climate finance to local governments. In order to overcome the blockages, CPI (2014) recommends that urgent work be done to understand how to support the timely, efficient and effective scale up of climate fi-nance at the provincial and district levels.
CPI provided two high-level recommendations related to en-suring climate finance at the provincial and district levels:
( i ) Opportunities to increase the flow of climate fi-nance into projects, which can be done through design-ing a dedicated instrument to link national government cli-mate plans and sub-national expenditures and to establish Indonesia’s public financial management framework;
( i i ) Opportunities to improve climate finance tracking, which can be done through developing detailed guid-ance on how to determine which activities are climate specific, particularly in relation to adaptation; building a single national system or database for systematically collating comparable information from the full spec-trum of actors; and to develop clearer, more detailed, and more readily accessible guidelines to explain exist-ing and emerging reporting requirements.
CLIMATE FINANCE LANDSCAPEIN INDONESIA
3

PB 39
3.1. VARIOUS CLIMATE FINANCEIDENTIFIED
T here are various climate funds that exist and that can be accessed by developing countries to finance climate actions. These
funds are available at the international, national, and local levels. However, to access the available funds, knowing the information on what funds are available is not enough. Meeting the require-ments by the project proponent, in this case cit-ies, for eligibility to access the funds, is another challenge to be overcome. This part of the paper will elaborate some of the funding available at the international, national, and local levels, in-cluding the requirements that need to be met to be eligible to access the funds.
3.1.1. INTERNATIONAL CLIMATE FUNDS
There are a number of multilateral funds in re-cent decades with the specific objective of assist-ing developing countries in meeting the financial needs of pursuing low-carbon and climate resil-ient development pathways. The funds are re-corded to have approved over USD 9 billion since 1994 for projects specifically targeting climate mitigation and adaptation in developing coun-tries (Nakhooda, Norman et al., 2014).60 Cur-rent climate funds that are increasingly targeting cities are Global Environment Facility (GEF) and Green Climate Fund (GCF).
59 Climate Policy Initia-tive and Fiscal Policy Agency. The landscape of public climate finance in Indonesia. July 2014.60 Barnard, Sam. Climate finance for cities. ODI Working Paper 419. June 2015.

PB 40
Source: Study team analysis of budget data and international development partner surveyNote: Flows are expressed in IDR billions and are rounded to produce whole numbers, and as such may not add up. We exclude movements of financebetween actors which ded not result in disbursements to projects.
International Public Climate Finance
Budget expenditure(from intl. loans) 464
Concessionalloans 1,024Intl. Grant 1,327
StateOwnedEnterprises998
CentralGovernment933
InternationalDevelopment
Partner253
Private 165Waste and waste water 197
Transport 204
Other 264Forestry andland use 481Energy 1,211Other 279
NGO 160Local Government 49
Non-structural agency 14
Infrastructure andcoastal protection 275
Disaster risk management 195Agriculture 21
Industrial process emissions 3
The green hashes above represent the volume of finance in each sector that is sourced from international development partners but ultimately spent via the Indonesian Government.
Budget pxpenditure(from intl. grants) 15
Others 12Equity 9
INSTRUMENTS DISBURSEMENT CHANNELS SECTORS
Budget expenditure 5,496Ministries andCentral Gov. 5,333
Non-structural
agency 163
Waste and waste water 424
Energy 413
Forestry andland use 2,986
Transport 515
Revolving Fund 30 Local. Gov. 1
Private 30
Agriculture 796Disaster risk management 178
Other 140Industrial process emissions 60
Infrastructure and coastal protection 14
Domestic Public Climate FinanceINSTRUMENTS DISBURSEMENT CHANNELS SECTORS
BilateralDevelopment
Partners2.576
State budget5.526
Revolving Fund 30
Others 12
Equity 9
LocalGovernment
50
NGO160 Non-
structuralagency177 Private 195
InternationalDevelopment
Partner253
Other279
Industrialprocess
emissions63
Infrastructure and coastal production 288
Disaster riskmanagement
374 Other 404
Waste andwaste water621
Forestryandland use3,467
Energy 1,623
Agriculture817
Transport719
StateOwnedEnterprises 998
Ministriesand Central Gov.Agencies 6,265
Budget expenditure 5,975Intl. Grant 1,327
Concessional loans 1,024
Other 170Intl. Climate Funds 68
National Climate Funds 21Multilaterals 16
PUBLIC CLIMATE FINANCE FLOWS IN INDONESIA IN 2011 ALL FIGURES IN BILLIONS OFINDONESIAN RUPIAH (IDR)
INSTRUMENTS DISBURSEMENT CHANNELS SECTORSSOURCES
Figure 13 Public climate finance flows in Indonesia in 201159

PB 41
3.1.1.1. GLOBAL ENVIRONMENTFACILITY (GEF)
G lobal Environment Facility (GEF) was estab-lished in October 1991 as a pilot program of the World Bank with a value of USD 1
billion. It was established to provide assistance to developing countries to meet the goals of addressing global environmental issues while supporting na-tional sustainable development initiatives. In order to do so, GEF provides a mechanism for interna-tional cooperation for the purpose of providing new, and additional, grant and concessional funding to meet the agreed incremental costs of measuring how to achieve agreed global environmental benefits. In 1994, GEF evolved in its structure and was separat-ed from the World Bank to establish as a permanent institution. As a result, it became an operating entity for both UNCBD and UNFCCC.
GEF can finance through several schemes: (i) full-sized project, where the investment value is more than USD 2 million, which is usually accessed by governments, however, CSOs can also apply for the funding with the approval of the national focal point; (ii) medium-sized project, where the GEF grant is equal to or less than USD 2 million, which can be accessed by governments and CSOs; (iii) for enabling activities, where the GEF grant is capped by the re-spective focal area threshold; (iv) programmatic ap-proach; and (v) through the Small Grants Program at the maximum investment of USD 50,000. In Indo-nesia, the national focal point for the Small Grants Program is held by the non-government organization YBUL (Yayasan Bina Usaha Lingkungan).
GEF also has a resource allocation system for biodiversity, climate change and land degradation focal areas called STAR (System for Transparent Allocation of Resources). Countries with STAR allocations of less than USD 7 million, will have full flexibility to program the allocation across the three

PB 42
focal areas. In GEF 6, there are 49 countries that will benefit from this flexibility. STAR allocation is fixed, thus ensuring countries receive their allocation and do not need to compete with other countries.61 In its 6th replenishment, Indonesia was placed as the third biggest GEF STAR allocation recipient. Of a total of USD 83.92 million, USD 21.91 million is for climate change, USD 57.84 million is for biodiversity, and USD 4.16 million is for land degradation.
GEF has several project requirements that need to be met by the project proponents. All proposals to be funded by GEF must be: country-driven; within GEF focal area strategies, and the project can also point to global benefits; built upon participation processes; and must be consistent with global conventions. GEF 6 has added another requirement that an integrated approach is expected to be included in each proposal. It also needs to span multi-focal areas, and be synergized, complex, and plan for cross-sectoral activities.
T here are several cities in Indonesia that have already accessed GEF, the first was Surabaya and the second was Jakarta. Surabaya
accessed GEF funding with the concept of building a bike-lane that is combined with bus-lane, and Jakarta also applied for a similar project. However, up until the time of writing this report no Indonesian city has applied for GEF 6.
GEF has launched an Integrated Program on Sustain-able Cities, where USD 100 million was committed to this initiative, including global coordination support, resources from countries interested in utilizing GEF allocations for this effort, and an incentive mecha-nism to match country allocations. The program is expected to provide a safe and supported space for cities to experiment, reflect, share, and establish a sensible and rigorous framework of analysis.62
IN GEF 6 , THERE
ARE 49 COUN-
TRIES THAT WILL
BENEFIT FROM
THIS FLEXIBILITY.
STAR ALLOCATION
IS FIXED, THUS
ENSURING COUN-
TRIES RECEIVE
THEIR ALLOCA-
TION AND DO NOT
NEED TO COM-
PETE WITH OTHER
COUNTRIES.
61 System for Transparent Allocation of Resources (STAR), excerpt from: https://www.thegef.org/gef/policies_guidelines/STAR62 The GEF commits USD 100 million for an innova-tive integrated program on sustainable cities, except from: https://www.thegef.org/gef/node/10826

PB 43
3.1.1.2 GREEN CLIMATE FUND (GCF)
G reen Climate Fund (GCF) was established through COP 17 Decision in Durban. The Fund is designed to finance climate change
projects/programmes with high risks, which no other funds nor investors would finance due to the risks. GCF is in favor of a direct access mechanism, introduced by the Adaptation Fund, in order to accelerate developing countries to directly access the Fund. However, the Fund also provides access to international organizations that have been working throughout the world to access the Fund. GCF also tries to encourage country ownership, therefore National Designated Authority (NDA) or focal point is required to be established in eligible countries (developing countries). This role of NDA is very important, since they are the Party that will endorse a proposal to the GCF Secretariat, and it is their role to review the proposal before it is submitted to align with the national strategy and the country’s framework on climate change. For a national or local entity to be accredited, they must receive a No Objection Letter (NOL), issued by the NDA, to then be forwarded to the GCF Secretariat and the Board for approval.
GCF operates through two big windows: activities that are reducing emissions (climate change miti-gation) and activities that are increasing resilience (climate change adaptation). Green Climate Fund has five investment frameworks which accommo-date eight results areas, as shown in Figure 14 be-low. Investment framework and the results areas are the guidance by which GCF approves any pro-posals submitted.

PB 44
Health,food and
watersecurity
Increasedresilience
of
Livelihoodsof people andcommunities
Ecosystemsand
ecosystemservices
Infrastructureand built
environment
Energygenerationand access
Reducedemissions
from
Transport
Forestand
land use
Buildings,cities,
industriesand
appliances
Climate-compatible cities
Sustainablelow-emission climate-resilient agriculture
Scaling up finance for for-est and climate change
Enhancingresilience in small island developing States (SIDs)
Transforming en-ergy generation and access
Figure 14 GCF’s results areas and investment framework63 63 Green Climate Fund

PB 45
U nder the investment framework of climate compatible cities, there are several results areas that can be funded by the GCF. On activities to
reduce emissions, creation of climate compatible cities can be achieved in three ways: ( i ) energy generation and access; ( i i ) transport; and ( i i i ) buildings, cities, industries and appliances. Activities that increase resilience, in the planning of climate compatible cities, can be achieved through activities that are related to livelihoods of people and communities, as well as infrastructure and the built environment. Having said that, it is possible for municipalities in developing countries to access the Green Climate Fund, as long as they can meet the requirement to be an accredited entity to the GCF.
To access GCF, an entity firstly has to be accredited. There are two types of accreditation: direct access or international access. Direct access entities are entities that are working and based at the sub-national, na-tional and regional levels (GCF Governing Instrument para 47); while the international access relates to in-ternational entities, including United Nations agen-cies, multilateral development banks, international financial institutions and regional institutions (GCF Governing Instrument para 48).
To be accredited, candidates have to be assessed on whether they have the ability to manage GCF’s re-sources in accordance with the Fund’s fiduciary stan-dards for the scale and type of funding sought, as well as the ability to manage environmental and social risks that may arise at the project level. Entities seek-ing accreditation to access GCF resources will also be assessed against the Fund’s gender policy.64
In the context of Indonesia, IESR (2015) has indicat-ed that there are difficulties for Indonesian entities in gaining accreditation, thus the accreditation process takes longer. IESR (2015) has drawn lessons learned from the accreditation process that was undergone by two accredited candidates from Indonesia:
IN THE CONTEXT
OF INDONESIA,
IESR (2015)
HAS INDICATED
THAT THERE ARE
DIFFICULTIES
FOR INDONESIAN
ENTITIES IN GAIN-
ING ACCREDITA-
TION, THUS THE
ACCREDITATION
PROCESS TAKES
LONGER.
64 Excerpt from GCF website: http://www.greenclimate.fund/part-ners/accredited-entities/accreditation

PB 46
( i ) The importance of having documents in at least one of the UN’s six official languages is high. For In-donesian entities, most operational procedures are in Bahasa Indonesia, thus translation costs can be high;
( i i ) Standard Environmental and Social Safeguard (ESS) of GCF is based on the principle of fit for purpose. However, until the report was published, apparently the GCF Secretariat does not yet have a standard on how to assess an ESS;
( i i i ) GCF Secretariat in assessing an entity candidate, pays high attention to the SOP that is implemented in the daily operations of accredited entity candidates, especially those related to avoiding fraud, corruption, and money laundering;
( iv) There are standards and default practices for pri-vate sector institutions, such as in banking, that are not easily met by non-profit entities or non-government organizations. For instance, the requirement to have a ‘Know Your Customer (KYC)’ procedure. The accredited entity candidates need to have a mechanism by which they know their clients and/or customers, in order to avoid issues of fraud and corruption. Many non-profit entities or non-governmental-organizations do not have this kind of mechanism. However, this needs to be cre-ated, in order for them to be accredited.
Since GCF is a new fund, although it is clear that GCF can be used to fund climate actions at the city level, there are no case studies on this to date.
STANDARDENVI-
RONMENTAL AND
SOCIAL SAFE-
GUARD (ESS) OF
GCF IS BASED ON
THE PRINCIPLE OF
FIT FOR PURPOSE.
HOWEVER, UNTIL
THE REPORT WAS
PUBLISHED, AP-
PARENTLY THE
GCF SECRETARIAT
DOES NOT YET
HAVE A STANDARD
ON HOW TO AS-
SESS AN ESS
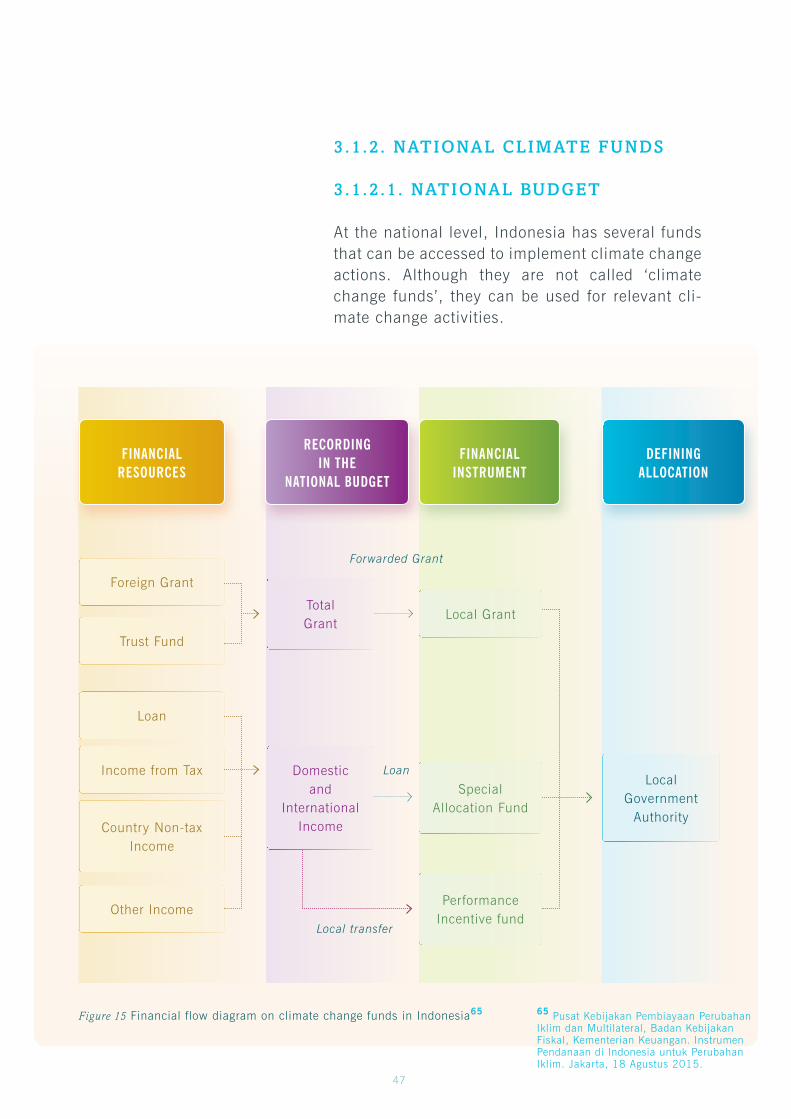
PB 47
3.1.2. NATIONAL CLIMATE FUNDS
3.1.2.1. NATIONAL BUDGET
At the national level, Indonesia has several funds that can be accessed to implement climate change actions. Although they are not called ‘climate change funds’, they can be used for relevant cli-mate change activities.
Figure 15 Financial flow diagram on climate change funds in Indonesia65
TotalGrant
FINANCIALRESOURCES
Local transfer
LocalGovernment
Authority
RECORDINGIN THE
NATIONAL BUDGET
FINANCIALINSTRUMENT
DEFININGALLOCATION
Trust Fund
Loan
Income from Tax
Country Non-taxIncome
Other Income
Domesticand
InternationalIncome
Loan
Forwarded Grant
Local Grant
SpecialAllocation Fund
PerformanceIncentive fund
Foreign Grant
65 Pusat Kebijakan Pembiayaan Perubahan Iklim dan Multilateral, Badan Kebijakan Fiskal, Kementerian Keuangan. Instrumen Pendanaan di Indonesia untuk Perubahan Iklim. Jakarta, 18 Agustus 2015.

PB 48
Figure 15 shows there are three sources of funds from the national government to the local government: the Local Grant (Hibah Daerah), the Specific Purpose Fund (Dana Alokasi Khusus), and the Performance Incentive Fund (Dana Insentif Kinerja). A lLocal Grant is a grant that is transferred from the central govern-ment to the local government; or a local grant can be a foreign grant channeled through a trust fund. Specific Purpose Funds can also be accessed by lo-cal governments in order to get additional funding for specific activities. For cities, the relevant specific pur-pose fund that can be accessed is the Specific Pur-pose Fund for forestry and environment. However, the local government needs to submit a request to the respective ministries for the fund.
The Performance Incentive Fund is disbursed to the local government when the local government has achieved a certain goal or target that has been set as a criteria for local government to access the fund. The Ministry of Finance is currently exploring the possibility of using the Performance Incentive Fund to incentivize emissions reductions at the local government level. The Ministry of Finance (MoF) put reduction of greenhouse gas emissions as an indicator for local government to be eligible to receive the fund.
T here are several other activities66 that will be conducted by the Ministry of Finance to mobilize funding for climate change through the issuance
of green bonds and the utilization of village funds.67 In the context of the village fund, even though the fund exists and will be allocated, villages still need to have a development plan to access the fund, thereby increasing the capacity of villages in designing climate compatible development plans relevant to their local area.
Among the other forms of national transfers to the local government, the DID (Performance Incentive Fund) is the simplest transfer instrument provided by the government to be adopted as a financial instrument for climate action at the city or provincial levels. However, DID is not ideal for short-term activities; it is more suitable for
THE PERFORMANCE
INCENTIVE FUND
IS DISBURSED TO
THE LOCAL GOV-
ERNMENT WHEN
THE LOCAL GOV-
ERNMENT HAS
ACHIEVED A CER-
TAIN GOAL OR
TARGET THAT HAS
BEEN SET AS A CRI-
TERIA FOR LOCAL
GOVERNMENT TO
ACCESS THE FUND.
66 Center of Climate Change and Multilat-eral Financing Policies. Instrumen Pendanaan di Indonesia untuk Perubahan Iklim. Ministry of Finance. Delivered at IESR’s kickoff workshop on Financing for Cities, 18 August 2015.67 Village fund is estab-lished through Law No. 6/2014 on Village which then derived to Presidential Regulation No. 66/2014 which then improved through Presidential Regula-tion No. 22/2015

PB 49
medium-term activities.68 Instruments such as DAK can be adopted to fund climate mitigation actions, and it is not necessary to create another DAK on climate change mitigation. Financing climate change mitigation actions can simply use current DAK, since there are activities that can be considered as climate change mitigation actions that can be financed through DAK. Improvement on the indicators may help in order to justify that climate change mitigation actions funded through DAK can be claimed as such. Nevertheless, it is important to note that among the many DAKs that exist, only the DAK on the environment can be accessed by cities in regard to waste management.69 Other potential DAK, such as small scale energy and forestry, can only be accessed by the provinces. This shows that the level of authority in Indonesia will also determine how much money can be spent or accessed by the municipal government in regard to climate change activities.
3.1.2.2. INDONESIA CLIMATE CHANGETRUST FUND
T he Indonesia Climate Change Trust Fund (ICCTF) was established through the Minister of Na-tional Development Planning Decree No. 44/M.
PPN/HK/09/2009 and was amended by the Minister of National Development Planning Decree No. 59/M.PPN/HK/09/2010. ICCTF has operated since 2010 and has mandated to mobilize finance and to allocate it to activities that support the achievement of Indone-sia’s emission reductions targets (RAN GRK) as well as the implementation of the national action plan on climate change adaptation (RAN API).70 ICCTF may also help local governments to plan and implement their local climate action strategies, on a project by project basis, through civil society organizations, the private sector, or academia.
As the ICCTF is a working unit (satuan kerja, or satker) under the Ministry of National Development Planning (Bappenas), in accordance with the Minister of Finance Decree No. 188/2012, ICCTF does not
68 Fiscal Policy Agency, Ministry of Finance. Design Instrumen Transfer Fiskal untuk Pendanaan Rencana Aksi Daerah Pernurunan Emisi Gas Rumah Kaca (RAD-GRK). 2012 69 Minister of Environment and Forestry Decree No. P.69/Menlhk-Setjen/2015 Article 3.2.70 http://icctf.or.id/bground-ext-p-3641-en/

PB 50
allow any funding to be granted to ministries or government agencies, nor to local governments. Therefore, ICCTF can only be accessed by civil society organizations, academia, and the private sector. However, as the mandate of ICCTF is to support the achievement of national and local action plans to reduce greenhouse gas emissions and to implement adaptation plans, any proposals submitted to ICCTF should include an endorsement letter from the relevant local government where the project will be implemented, indicating that the project does contribute to the achievement of the local development plans/targets.
Figure 16 ICCTF funding disbursement mechanism71
ImplementingCSO / University / Private*
Beneficiaries:Local Govt
Beneficiaries:Line Ministries
Beneficiaries:Local Community
Fund Transfer
Agreement Register /
Open Account
ICCTF(BAPPENAS)
MINISTRYOF
FINANCEDONORS
BANK MANDIRI(Fund Manager) Fund Transfer
Execution
Gol MECHANISM
71 Derry Wanta. Informasi Pendanaan Kegiatan ICCTF 2015-2016. Delivered at FGD ‘Peluang Kota untuk Mengakses Pendanaan Pe-rubahan Iklim di Indonesia’ July 18th 2016.

PB 51
The proposal selection is conducted in accordance with the procedure set by the government of Indone-sia, which will be treated as a national budget fund-ed project. In its operational, ICCTF receives funding allocated under the national budget and from donors in the form of grants.
160.0
140.0
120.0
100.0
80.0
60.0
40.0
20.02016
2015
TOTAL
In billion rupiah
GOI DANIDA USAID UKCCU(PLEDGE)
TOTAL
2015
2016
TOTAL
15.3
15.3
30.6
0.7
2.2
2.9
70.0
-
70.0
-
55.5
55.5
85.99
73.00
158.99
Figure 17 ICCTF total funding received 2015-2016 per June 30th 201672
I CCTF has three funding windows: land-based mitigation, mitigation, and adaptation. The land-based mitigation has the focus areas: foresta-
tion and forest rehabilitation, critical land restora-tion to be community forest, and forest management towards sustainable areas. On mitigation, the focus area is energy. All proposals around energy supply and demand, energy efficiency and conservation, en-ergy development, and low carbon energy generation, are included under this focus area. The third window, adaptation, consists of the following focus areas: in-creasing community resilience through development of adaptation strategies as well as the development of technologies for relevant adaptation measures.
72 Derry Wanta. Informasi Pendanaan Kegiatan ICCTF 2015-2016. Delivered at FGD ‘Peluang Kota untuk Mengakses Pendanaan Pe-rubahan Iklim di Indonesia’ July 18th 2016.

PB 52
Figure 19 ICCTF funded programs (2016-2018) per June 201674
21 November –24 December 2015
ProposalSubmission
24 December –13 January 2016
PipelineProposals
In-depthProposal
Assessment
Proposals are assessedby Selection Panel to
produce short-listproposal
(21 January –8 February 2016)
Consultationmeeting with
relevant Unit inBappenas
9 – 17 Feb 2016
Fund approvalMWA select
proposals fromshortlist to be
funded
ICCTF secrea-tariat
assists theselected
proponent (s) todevelop logframetable and annual
workplan
Figure 18 Proposal selection process73
F O C U S A R E A –L A N D B A S E D M I T I G A T I O N
F O C U S A R E A – E N E R G Y F O C U S A R E A –A D A P T A T I O N A N D R E S I L I E N C E
STIK Yayasan TeungkuChik Pante Kulu
Yayorin
Javiec
Perkumpulan Sesami
Univ. MuhammadiyahPalangkaraya
Walestra
Yayasan PengembanganAkhlaq Mulia (YPAM)
Lembaga Olah Hidup (LOH)
1
2
3
4
5
6
7
8
Fakultas Teknik Pertanian UGM
Pusat Perubahan Iklim ITB
Pusat Kajian Antropologi UI
FMIPA IPB
Yayasan Lingkungan Hidup Seloliman
YAKKUM Emergency Unit (YEU)
Yayasan TransformasiKebijakan Publik Indonesia
7
6
5
4
3
2
1
2
1
3
4
RCCC UI, TREC,PT Potenza Putra Makara,LPU An Naba’
Jurusan Teknik ElektroUniversitas JenderalSoedirman
Yayasan Energi BersihIndonesia (EnerBi)
Universitas Mataram
74 Derry Wanta. Informasi PendanaanKegiatan ICCTF 2015-2016. ICCTF. Delivered at FGD ‘Peluang Kota untuk Mengakses Pendanaan Perubahan Iklim di Indonesia’ July 18th 2016.
73 Derry Wanta. Informasi Pendanaan Kegiatan ICCTF 2015-2016. Delivered at FGD ‘Peluang Kota untuk Mengakses Pendanaan Perubahan Iklim di Indonesia’ July 18th 2016.

PB 53
3.1.2.3. PT SMI(SARANA MULTI INFRASTRUKTUR)
P T SMI is a state owned enterprise with 100% of its shares belonging to the Ministry of Fi-nance of the government of Indonesia. PT
SMI was established in 2009 with the mandate to be a catalyst in Indonesia’s infrastructure development. It is estimated that Indonesia will require around IDR 6,000 trillion to meet the basic infrastructure requirements for 2015-201975 in accordance with the national mid-term development plan.
In building infrastructure there are several development phases: tendering phase, construction, and operational and maintenance (O&M). Many funding sources can be used during the development phases. However, many developers do not want to contribute in the project preparation stage due to the high risks involved, especially in projects related to climate change adaptation and mitigation. Nevertheless, the crucial point of infrastructure development lies in the project preparation and tendering processes. In terms of the financing gap in the project preparation stage, PT SMI is then given the mandate to also work on the project preparation phase in order to minimize the risk and to allocate the risk to the appropriate party, thus inviting more investment.
To support the local government, PT SMI plays the role to increase the credit worthiness of the local government related to infrastructure projects at the local level. Aside from that, PT SMI also provides advisory services on investment and finance. From their experience working with the local government, they have identified difficulties in multi-stakeholder engagements due to the high numbers of stakehold-ers that have an important role at the local level. Thus, they need to consult with each of the stake-holders in order to implement the activities.76
75 Gan Gan Dirgantara. Pendanaan Perubahan Iklim untuk Perkotaan. PT SMI. De-livered at FGD ‘Peluang Kota untuk Mengakses Pendaaan Perubahan Iklim di Indonesia’ July 18th 2016.76 The statement was de-livered in the FGD “Peluang Kota untuk Mengakses Pen-danaan Perubahan Iklim di Indonesia’, July 18th 2016.

PB 54
LOCAL GOVERNMENT NEEDS ON INFRASRUCTURE
‘FINANCING FOR LOCAL GOVERNMENT’ (financial closing)
LOCAL GOVERNMENT FINANCING Direct financing to local government in accordance to the priority infrastrucutre project at the local level
INCREASING THE CREDIT WORTHINESS OF LOCAL INFRASTRUCTURE PROJECT
SERVICES FOR LOCALINFRASTRUCTUREDEVELOPMENT
Technical assistance and support to the local govern-ment to increase their capacity and the project readi-ness including through training, capacity building, project selection and prioritization, developing the financing modalities
• Supporttothelocalgovernmentindevelopinginvest-ment plan/project financing
• IntermsofPPPproject,PTSMIprovidessupportsinthe project preparation and assistance in the invest-ment auction process
ASSISTANCE TO ACCELERATE LOCAL INFRASTRUCTUREDEVELOPMENT
Figure 20 The role of PT SMI to increase the creditworthiness of local government and urban development77
PT SMI provides several financial schemes and is also working together with international institutions to finance and develop renewable energy projects. Thus, PT SMI can help local governments to pro-vide financing as well as advise on matters related to financing climate actions. At present, PT SMI is applying for accreditation to the GCF as national implementing entities.
77 Gan Gan Dirgantara. Pendanaan Perubahan Iklim untuk Perkotaan. PT SMI. De-livered at FGD ‘Peluang Kota untuk Mengakses Pendaaan Perubahan Iklim di Indonesia’ July 18th 2016.

PB 55
Figure 21 Various financial schemes that are provided by
PT SMI for renewable energy projects78
RE fund/Donor
PTSMI
Structurethe project& manageTA Grant
TrainingCoordinator
PTSMI
Special/Esc.
Account
RE fund/Donor
CO-FINANCINGMODEL
INTERMEDIARY
RE fund/Donor
FUNDMANAGEMENT
CAPACITYBUILDING
PROGRAMME/PDF
ReProjects
REProjects
REProjects
Assign forfund manager
Funddisbursement
Fundmanagement
Loan Loan/GrantLoanrevolving
Loan/TALoanrepayment
Co-financing
Loanrepayment
Loanrepayment
Fund
PTSMI
78 Gan Gan Dirgantara. Pendanaan Perubahan Iklim untuk Perkotaan. PT SMI. Delivered at FGD ‘Peluang Kota untuk Mengakses Pendaaan Perubahan Iklim di Indonesia’ July 18th 2016.

PB 56
3.1.3. LOCAL LEVEL
T his study identified other local financing resources that can be accessed to finance local climate actions. The study finds that mobilizing climate
finance at the local level beyond the local government budget is possible, however, it requires strong political will and strong administrative structures in order to ensure the appropriate use of the finance. The following are various possible financial sources for local climate action. However, at this stage, the identified sources of funding do not yet allocate for specific activities such as climate change actions.
Figure 22 Climate change financing in Kupang79
Cooperative
Self funded
CSR
Bank loan
Financing from Civil
Society
Privatesector
Others
APBDof
Kupang city
(Local budget)
APBN(National Budget)
(70%)
Local revenue(27%)
FINANCINGCLIMATECHANGEACTIONS
INKUPANG
CITY
Technical AssistanceCrowd funding
79 IESR’s analysis

PB 57
Table 12 Possible funds at the local level that can be utilized for local climate actions80
3.1.3.1 LOCAL BUDGET
From 2011 to 2015, the local government budget of Kupang doubled from IDR 592 billion in 2012 to IDR 1,176 billion in 2016. The increase comes mainly from local revenue sources, which consist of local taxes, user fees (retribution fees), revenue from local asset management, and other local revenue. How-ever, of the total income of Kupang, national transfer still dominates the composition of the local treasury (kas daerah).
Table 13 Kupang’s development budget81
Credit forvarious small scale activities
Educationand health
Allocation to achieve thetarget of 30% open green space
Credit to buycook-stoves
Waste bank
Financial institutions (local banks or national bank branches
Private sector (including banks)
Localgovernment
Cooperative
Individual
E X I S T I N GI N S T I T U T I O N
Loans, etc.
CorporateSocialResponsibility
Local budget
Credit scheme
Investment
N A M EF I N A N C I N G
OJKsSustainable Finance
Internal policies of companies
Localdevelopment strategy
Shareholder meetings
Market trend
R E L E V A N TP O L I C I E S
Not yet implented. However, the sustainable Finance scenario aims to finance clean energy, which is a means to contribute to reducing greenhouse gas emissions
Diverse, depends on the companies. Usually for education and health
At present the priority sectors for Kupang are education, health and infrastructure
Depends on the cooperative. Most of the existing, allocate for SMEs
Various, depends on the investor
C U R R E N T A L L O C A T I O N E X A M P L E S
Total incomeLocal revenueLocal taxLocal retributionRevenue from localasset managementOthersFiscal balancetransfer
( I N M I L L I O N R U P I A H )
596,82252,63221,92213,620
7,382
9,708525,552
2 0 1 2 2 0 1 3
827,42872,09236,32118,716
9,229
7,826622,249
2 0 1 4
926,70986,53046,89221,67310,550
7,415680,540
2 0 1 5
990,481110,746
54,62722,99314,550
18,575706,899
2 0 1 6
1,176,441141,027
67,36031,09518,605
23,968854,947
80 Extracted from two focus discussions that were under-taken in 2015 in Kupang81 Directorate General on Fiscal Balance, Ministry of Finance

PB 58
Figure 23 Kupang’s development budget82
F or the last five years, the city of Kupang has set its main development focus on education, health and infrastructure. This can be seen
from the last five year budget allocation, where health, education and infrastructure gained the highest portion of the budget, while financing for climate change related activities is considered to be low in comparison to these three priorities.
Kupang’s Development Budget
1.200.000
1.000.000
800.000
600.000
400.000
200.000
0
Rupi
ah
2012 2013 2014 2015 2016
Year
Fiscal balance transfer Others Revenue from localasset management
Local retribution Local tax
82 General Directorate of Fiscal Balance, Ministry of Finance

PB 59
General Governance
Education
Health
Public Works
Environment
Energy and Mineral Resources
National Unity and Politics
Transportation
Agriculture
Development Planning
Marine and Fisheries
Housing
Family Planning
Trades
Informatics and Communications
Population and Civil Administration Community Empowerement
Small and Medium Business and Cooperatives
Social Welfare
Land Administration
Culture
Investments
Forestry
Work Force
Spatial Planning
Food Resilience
Library
Tourism
Archive
Youth and Sports
Kupang City Budget Proportion by Affairs2011 – 2015
100%
90%
80%
70%
60%
50%
40%
30%
20%
10%
0%
perc
enta
ge
year
2010 2011 2012 2013 2014 2015
Figure 24 Kupang’s city budget proportion by Affairs in 2011-20158383 General Directorate of Fiscal Balance, Ministry of Finance

PB 60
Based on the Pikul and IESR analyses, around IDR 63 trillion is allocated for climate change-adaptation related activities, including those related to health, water security, disaster risk reduction, land use, en-vironment destruction control, capacity building, re-silience, food security, agriculture, and others. On mitigation, a budget of IDR 24 trillion is allocated for transportation, land use, waste, and energy.
A side from using the local budget, the city of Kupang is also involved in international part-nerships, for instance with IFAD (International
Fund for Agricultural Development) on a Coastal Com-munity Development Program, which is hosted by the Ministry of Fisheries and Maritime. This program works to empower coastal communities to increase their economy, manage coastal natural resources, as well as developing coastal infrastructure. This pro-gram is implemented in 12 sub-districts and 180 coastal villages, with a total project value of USD 43 billion over 5 years until 2017.
Another source for Kupang’s local treasury fund comes from local revenue, such as tax and retribution. According to Law No. 28/2009, local government can collect revenue from local taxes, which are then used to improve the related taxed services. For instance, in Kupang, there is a street lighting tax, which is collected from residents. In accordance to the Law No. 28/2009 article 56, part of the collected tax shall be allocated for the street lighting provision. Kupang has taken this opportunity to install solar-powered street lighting and change the existing street lamps to be more energy efficient. All other taxes, however, are collected into the local treasury fund, to be allocated in accordance to the development programmes of the Local Government Workplan (Rencana Kerja Pemerintah Daerah, RKPD) or Local Medium-term Development Plan (Rencana Pembangunan Jangka Menengah Daerah, RPJMD).
ACCORDING
TO LAW NO. 28/2009, LOCAL
GOVERNMENT
CAN COLLECT
REVENUE FROM
LOCAL TAXES,
WHICH ARE THEN
USED TO IMPROVE
THE RELATED
TAXED SERVICES.

PB 61
3.1.3.2. CIVIL SOCIETY ORGANIZATIONSAND THE LOCAL COMMUNITY
C ivil Society Organizations (CSOs) often fund their climate actions through donor funding, however, there are also other actions that are self-funded.
In Kupang, for instance, there is a business scheme that was developed to fund innovative programs selling self-made products. The non-governmental organization Geng Motor Imut (GMI) is one example. GMI produces several applicable low carbon technologies that it has developed, such as biogas installation, efficient cook-stoves, and salt water desalination equipment, and sell to the public. The revenue from the sales are used to fund development programs for their research and innovation. To facilitate the business, GMI established a cooperative, called Tapaleuk Cooperative (Kotak Cooperative), that manages the marketing and sales
* This number is the expected income for 2016
Table 14 Kupang’s local retribution and local tax as well as the use of fund84
At the moment, these collected taxes are not used to improve the related service’s quality.The revenue from the taxes goes to the local treasury fund
U S E O F F U N D
According to local decree,85 most retribution in Kupang, were decided through local regula-tions, to be transferred to the local treasury fund
Since 2012 this fund has been allocated to install solar powered street lighting and to changethe lamps of street lights tomore efficient ones
Property tax
L O C A L T A X A N D R E T R I B U T I O N
Ground water tax
Category C mining materials(sands, rocks, and small rocks)
Retribution (parking services, waste services, motor-vehicle testing, septic tank services, etc.)
Street lighting tax
T O T A L ( I D R )
IDR 6,5 billion (2016*)
IDR 120 billion (2016*)
IDR 915 billion (2016*)
IDR 7,523 billion (2015)
IDR 18 billion/year
84 Various sources85 Kupang local decree no. 15/2011 (Parking services retribution), Kupang local decree No. 4/2011 (waste services retribution), Kupang local decree No. 16/2011

PB 62
of their products. Kotak Cooperative sells around 60 stoves every month with the price of IDR 450.000 per stove. To date, Kotak Cooperative has been able to sell around 400 stoves.86
A nother social enterprise that was developed by a civil society organization to address the waste problem in the City of Kupang
is the Immanuel Waste Bank. The waste bank has a scheme of collecting recyclable waste from waste pickers/collectors which are then sold as production materials for industries in Surabaya. Immanuel waste bank also composts the organic waste they receive and sell the compost to the public. They have gathered many waste-collectors and provide them with wages and insurance, as well as loans for education and livelihood.
Other related climate activities conducted by civil society organizations can be seen in Table 15.
Another financial source identified in one focus group discussion was crowd funding. In Kupang, the potential of crowd funding is high, as long as the program is related to people’s develop-ment and is well targeted in terms of the issues and the beneficiaries.
Table 15 Activities of Civil Society Organizations in Kupang and their financial sources (based on FGD November 13th 2015)
A C T I V I T I E S / P R O G R A M S A C T O R S
Civil Society Organizations
Civil Society Organizations
Community Donor (this activity isno longer funded)
F I N A N C I A L S O U R C E S
Donor
Self-funded
Rain-water harvesting
Recycling plastic waste and small industries
Information dissemination on weather and seasons for coastal communities
86 Direct interview with per-sonel from Kotak Cooperative.

PB 63
3.1.3.3. CSR FROM LOCALDEVELOPMENT BANK
I n Kupang, the local bank, Bank NTT, has a Corporate Social Responsibility (CSR) fund to be disbursed of the amount of IDR 4.82
billion in 2015, which is significantly higher than their 2014 amount of IDR 1.22 billion.87 There are six focus areas of Bank NTT’s CSR: economic empowerment, education, health, sports, culture, and social. However, due to the lack of information on potential actions that can be funded by CSR, the fund remains idle or disbursed at a very low level. In order to use the fund, the local bank also looks for proposals to implement. Relevant climate action may be a good option for the disbursement of CSR. Thus, the project developer (which can be local government, CSOs, academia, or smaller industries) needs to submit proposals to access the fund. During this study, through one of the workshops conducted, a collaboration on climate action was identified by Bank NTT and Geng Motor Imut (GMI) – to work together in applying for funding through the bank’s CSR fund. One of the potential climate actions is the scaling up of sea-water desalination equipment to provide clean water to more communities.
It was then identified that an information platform which provides information on lists of climate actions that can be implemented, as well as the costs of these actions, the various finance options available and how to access funds is highly needed for the city of Kupang.
ONE OF THEPOTENTIAL CLI-
MATE ACTIONS IS THE SCALING
UP OF SEA-WATER DESALINATION
EQUIPMENT TO PROVIDE CLEAN
WATER TO MORE COMMUNITIES.
87 http://bali.bisnis.com/read/20160803/3/60942/bank-ntt-memanfaatkan-csr-guna-memberdayakan-masyarakat

PB 64
ALLOCATION OF CLIMATEFINANCE IN INDONESIA
4
A fter President Susilo Bambang Yudhoyono’s 2009 pledge to reduce Indonesia’s greenhouse gas emissions by 26% voluntarily by 2020,
several domestic policy programs have been undertaken in Indonesia. The first was the issuance of the Presidential Regulation No. 61/2011, which consists of activities that will contribute to emissions reductions, and the second, conducted by the Ministry of Finance, was identification of the financial needs for Indonesia to meet the 26% reductions target by 2020 through public finance. The Ministry of Finance came up with Indonesia’s First Mitigation Fiscal Framework (MFF), to see how far the national budget can finance the targeted emissions reductions. However, the first MFF only considered forests, peat-land, energy and the transportation sectors. Other sectors, such as agriculture, and industrial and wastewater treatment, will be assessed in the MFF’s next study.
The first MFF, published in 2012, noted that tracking of how much national budget is being allocated for mitigation is easier because the mitigation activities are already included in the ministries work programme. However, the first MFF only considered domestic financial flows. Figure 25 below shows the trends in total mitigation expenditure for the central government, both on and off budget, and for local government, expressed in real terms, based on 2010 prices. For the central government, the spending is tracked from budget lines that relate to listed actions in Indonesia’s Action Plan to Reduce Greenhouse Gas Emissions (Rencana Aksi Nasional Penurunan Emisi Gas Rumah Kaca, RAN-GRK), excluding expenditure on road improvements and irrigation repairs.88
88 Ministry of Finance. Indonesia’s First Mitigation Fiscal Framework: In Sup-port of the National Action Plan to Reduce Greenhouse Gases Emissions. Ministry of Finance. December 2012

PB 65
Figure 25 Mitigation budgeted expenditure for the central government89
Notes: Figures are presented in real 2010 IDR. Mitigation excludes roads and irrigation.
Source: CPEIR team calculation basedon MOF data
Central Govt expenditure on RAN GRK actions
Investment Financing
Kerosene Conversion
Tax Subsidy
Local Govt
Total as % of Central Govt Budget
1.0%
0.9%
0.8%
0.7%
0.6%
0.5%
0.4%
0.3%
0.2%
0.1%
0.0%
2008 2009 2010 2011 2012
9.000
8.000
7.000
6.000
5.000
4.000
3.000
2.000
1.000
0
% o
f C
entr
al G
over
nmen
t R
even
ue
IDR
Bil
lion
F igure 25 shows that there was an increase in budget allocation for mitigation from 2009 to 2012 from around 0.3% to around 0.9%. The
allocation for mitigation action at the local level also increased from 2008 to 2012, from around 0.1% to 0.3% of total central government spending.90 This trend shows that the national planning system has been able to respond to the increased priority that has resulted from required mitigation actions as list-ed in RAN GRK and thus is able to make a substan-tial change in budget allocation.91
89 Ministry of Finance. Indone-sia’s First Mitigation Fiscal Frame-work: In Support of the National Action Plan to Reduce Greenhouse Gases Emissions. Ministry of Finance. December 201290 Ministry of Finance. Indone-sia’s First Mitigation Fiscal Frame-work: In Support of the National Action Plan to Reduce Greenhouse Gases Emissions. Ministry of Finance. December 201291 Ministry of Finance. Indone-sia’s First Mitigation Fiscal Frame-work: In Support of the National Action Plan to Reduce Greenhouse Gases Emissions. Ministry of Finance. December 2012

PB 66
Figure 26 Expenditure on RAN GRK actions by Ministries, excluding roads and irrigation92
Source: CPEIR team calculation based on MOF data
100%
90%
80%
70%
60%
50%
40%
30%
20%
10%
0%
2008 2009 2010 2011
Improvement of waste management
Low Emission Transport
Renewable Energies
Clean Fuel and Technology
Energy Efficiency
Ecosystem Management and Forest Protection
Institutional Development for Sustainable Forest Management
Sustainable Wood and Non Wood Commodities Production
Increasing Sink Capacity through forest rehabilitation & tree planting
Improved Forest Security from fire and illegal logging
Water level elevation stabilization and better water circulation
Low emission agricultural practices
Optimization of land and water resources
The Climate Policy Initiative publication on the climate finance landscape in Indonesia has considered climate finance from the international flows, but only for public finance and not private finance. The Global Landscape of Climate Finance reports have acknowledged the majority contribution
92 Ministry of Finance. Indonesia’s First Mitigation Fiscal Framework: In Sup-port of the National Action Plan to Reduce Greenhouse Gases Emissions. Ministry of Finance. December 2012

PB 67
of private finance in climate finance flows, thus the same may occur in Indonesia. As the coverage of climate finance landscape in Indonesia report does not include private finance, the actual amount of total climate finance flows may be higher. The report showed that at least IDR 8.377 billion (USD 951 million) of climate finance from public sources was disbursed in Indonesia in 2011.
T he domestic climate finance that was dis-bursed through government budget trans-fer instruments in Indonesia is at least IDR
5.526 billion (USD 627 million) or 66% of public climate finance. The bulk of domestic climate fi-nance (almost 75%) are allocated to support es-sential “indirect” activities, such as policy develop-ment, research and development, establishment of measuring, reporting and verification systems, and other enabling environment.
The supported “indirect” activities mostly target the forestry sector, at around 73%, while 10% target agriculture and 7% focused on energy. This aligns with the fact that the largest source of emissions in Indonesia came from the land sector. Finance for direct mitigation actions also targeted sectors that produce high emissions, including transporta-tion (35%), waste and waste-water (26%), agricul-ture and livestock management (27%) and energy (10%). CPI (2014) also indicated that little finance directly flowed to forestry and land use. While fi-nance for adaptation mostly went directly to disas-ter risk management.93
However, in its report CPI states that despite that most of the climate actions will need to be implemented at the local level, there are blockages to the smooth flow of domestic climate finance to local government. Thus, CPI suggests that urgent work is needed to un-derstand how to support timely, efficient and effec-tive scale up of climate finance at the provincial and district levels.94
THE SUPPORTED
“INDIRECT”
ACTIVITIES MOST-
LY TARGET THE
FORESTRY SEC-
TOR, AT AROUND
73%, WHILE
10% TARGET
AGRICULTURE AND
7% FOCUSED
ON ENERGY.
93 Climate Policy Initiative and Fiscal Policy Agency. The landscape of public cli-mate finance in Indonesia. July 2014.94 Climate Policy Initiative and Fiscal Policy Agency. The landscape of public cli-mate finance in Indonesia. July 2014.

PB 68
Figure 27 The landscape of public climate finance in Indonesia in 201195
Notes: Figures are indicative estimates of annual flows for 2011. All data pre-sented relates to transfers or disbursements during in 2011. Flows are expressed in IDR billions and rounded to produce whole numbers, and as such due to rounding for presentation displayed values might not add up. We show finance that we could identify clearly as climate spesific as “solid” flows. The diagram captures upfront capital investment costs for low carbon and climate reslient activities, plus activities that indirectly support mitigation or adaptation, such as policy development, capacity building, setup of MRV systems or research and development. We only track upfront investments and not lifetime inflows. There is significant uncertainty around how much climate specific finance is being disbursed from the state budget to support indirect activities in general, and adaptation activities in particular. We represent the full range, including the band of uncertainty (up to an additional IDR 10.008 billion), in the diagram as a “shadow”, reflecting the scale of climate specific finance and portion of poten-tially relevant finance that we could not verify.
* We included trans-fers where we know they happened (ICCTF, Geothermal Risk Mitigation Fund, Exim-bank), although there were not disbursement to projects in 2011.
** Equity participation is comparable to what we call balance sheet financing in the global landscape.
95 Climate Policy Initiative and Fiscal Policy Agency. The landscape of public cli-mate finance in Indonesia. July 2014.

PB 69
CLIMATE FINANCE GAPSIN KUPANG
5
A lthough there are various financial sources that can be used for climate actions, there are gaps that need to be closed. This report
identifies aspects on governance, adequacy, and effectiveness of climate finance in Indonesia and the existing gaps. This chapter will discuss climate finance gaps in cities, particularly in Kupang.
5.1. GOVERNANCE
Accessing climate finance from various sources can be done through intermediaries. In Indo-nesia, for cities or provinces to access climate finance, they must go through technical minis-tries (central government), the Indonesia Climate Change Trust Fund, or PT SMI. However, each intermediary has their own fund recipients and funding sources. For instance, technical minis-tries can only receive funding from the Ministry of Finance, in accordance with the ministries’ annual workplan, which is developed under the guidance of the medium term development plan. However, technical ministries can also receive funds through bilateral cooperation. ICCTF cur-rently receives funding from the national budget and bilateral donors; while PT SMI receives fund-ing from the national budget, and through inter-national as well as bilateral cooperation.

PB 70
Figure 28 Simplified diagram on accessing climate finance96
T echnical ministries can only provide funds for local government; ICCTF can only pro-vide funding for CSOs, the private sector, and
universities/think tanks, while PT SMI can provide funding for both local government and the local pri-vate sector. To ensure good governance of climate finance at the city level, strong coordination of the intermediaries is required to ensure funds flow to the right activities, and which ideally support the imple-mentation of the low carbon and resilient develop-
LocalGovernment/
Agencies
Civil SocietyOrganizations
SmallMedium
Enterprises
Universities/Think tanks
Source of fund Intermediaries Cities level
SUPPLYOF
FUNDS
Internationallevel,
nationallevel,
local level
TechnicalMinistries
PT SMI
LocalTrustFund
ICCTF
96 IESR’s analysis

PB 71
ment plan developed by the local government. The coordination should be led by development agencies or planning commissions, which exist at the local level. For the local government to access internation-al funding, establishing a body with proven financial management capacity is an option. However, this body must be given a mandate and needs to have the capacity to manage and coordinate climate invest-ment in the area.
T here are two possible approaches to governing climate related activities: ( i ) through institu-tional arrangements and budget and planning
systems that are set out for regular development plan-ning; and ( i i ) to have a climate change trust fund. At the local level, option ( i ) leads to mainstreaming climate change in local development plans, which secures climate change funding from the local bud-get. Option ( i i ) will be financed by the non-develop-ment budget and other possible sources. However, as for the institutional arrangements, since the climate change fund is not necessarily under governmental jurisdiction, it has to be managed by a secretariat with a board of trustees and a technical committee. A trust fund may finance various stakeholders, such as government agencies, non-governmental organi-zations, universities and research organizations.
The study in Kupang shows that there is currently no regulatory framework on climate change, or climate change action plan or strategy, at the city level, to help the effectiveness of climate finance disburse-ment. CPI (2014)97 acknowledges that the inclusion of climate action plans such as the RAN-GRK, RAD-GRK and RAN API in the broader national and local planning process, as integrated in the medium term development plan (2015-2019), will help to effec-tively link plans to budgets and accelerate the imple-mentation of climate activities. However, CPI (2014) also acknowledges that there is a need to assess the existing mechanisms that can be used or adopted, in order to channel finance to the local level at the scale and pace required, or if a new instruments or mechanisms are needed.
THE STUDY IN KU-
PANG SHOWS THAT
THERE IS CUR-
RENTLY NO REGU-
LATORY FRAME-
WORK ON CLIMATE
CHANGE, OR CLI-
MATE CHANGE
ACTION PLAN OR
STRATEGY, AT
THE CITY LEVEL,
TO HELP THE EF-
FECTIVENESS OF
CLIMATE FINANCE
DISBURSEMENT.
97 Climate Policy Initiative and Fiscal Policy Agency. The landscape of public cli-mate finance in Indonesia. July 2014.

PB 72
Indonesia, with the National Action Plan to reduce Greenhouse Gas Emissions (RAN GRK) and the National Action Plan for Climate Change Adaptation (RAN API) integrated in the National Medium Term Development Plan (RPJMN) 2015-2019, has provided guidance for agencies and ministries to take climate action into consideration in developing their work plans. At the same rate, the National Medium Term Development Plan (RPJMN) should also be the guidance by which local government develop their medium term development plan, which should ideally be channeled into concrete programmes at the local level. However, based on the research that was done, it appears that not all cities in Indonesia have the capacity to design a set of programmes in which climate change is well integrated. Having said that, ensuring good climate change governance at the city level remains a challenge.
The coordination between local agencies in Kupang regarding climate change, also needs to be strength-ened. Currently, due to the absence of a low carbon and resilient development plan in Kupang, there is no clear division of responsibilities among ministries (national level) and agencies at the local level. The absence of coordination among stakeholders will also affect the disbursement of the fund to implementing entities. Coordination at the local level must also be synchronized with the national level.
In order to achieve good governance, local government needs to build its capacities through increasing their understanding of climate change (both adaptation and mitigation), disaster risk reduction, and climate finance; (ii) to develop climate change and disaster-smart local development strategic planning at the local level; (iii) to establish a public financial management system in order to prioritize actions and identify costs and sources of funding; and (iv) to ensure that they have proper monitoring and evaluation systems in place.98
THE ABSENCE OF
COORDINATION
AMONG STAKE-
HOLDERS WILL
ALSO AFFECT THE
DISBURSEMENT
OF THE FUND TO
IMPLEMENTING
ENTITIES. CO-
ORDINATION AT
THE LOCAL LEVEL
MUST ALSO BE
SYNCHRONIZED
WITH THE NA-
TIONAL LEVEL.
98 IIED. Briefing Paper: Cli-mate Finance Governance in Bangladesh: Synergies in the Financial Landscape. IIED. April 2014.

PB 73
5.2. ADEQUACY
Although various instruments are provided by the central government for local government to access, the amount of funding that can be accessed at the city level, is still limited. In Kupang for instance, there is a financial need to fund waste-water management, waste, and drainage in the city. Kupang has estimated the financial needs to be IDR 276.967 million in the period 2015-2019. However, in the planning for the local budget, the available funding is only IDR 53.47 million, which results in a gap of IDR 223.497 million. Clearly, financing climate actions through public finance is not enough. More funding sources are needed in order to close the gap. This may be able to be solved through cooperation with the private sector, accessing other central government transfer instruments (such as DAK), or other possible resources.
Waste watertreatment
WasteDrainage
N O . A C T I V I T I E S F I S C A L Y E A R T O T A LB U D G E T
(IDR MILLION)
1.
2.3.Total
2 0 1 5
534
8160
1.350
2 0 1 6
15.032
8.5679.213
32.812
2 0 1 7
28.577
19.4368.752
56.765
2 0 1 8
50.131
42.6378.302
101.070
2 0 1 9
55.485
21.2648.221
84.970
149.759
92.72034.488
276.967
Table 16 Budget recapitulation99
Table 17 Financial gap for sanitation100
Financial needs
Indicatedavailable fund(solely throughlocal budget)
Funding gap(IDR)
Gap (%)
N O . N O T E S F I S C A L Y E A R T O T A LB U D G E T
(IDR MILLION)
1.
2.
3.
4.
2 0 1 5
1.350
6.994
-5.644
N/A
2 0 1 6
32.812
7.394
27.218
21,36
2 0 1 7
56.765
12.394
43.571
22,15
2 0 1 8
101.070
12.994
87.076
12,98
2 0 1 9
84.970
13.694
71.276
16,12
276.967
53.470
223.497
19,31
99 Drinking Water and En-vironmental Health Working Group of Kupang Municipal Government. 2014100 Drinking Water and En-vironmental Health Working Group of Kupang Municipal Government. 2014

PB 74
5.3. EFFECTIVENESS
E ffectiveness of climate finance at the city level can be achieved through climate change policy at the city level and sectoral levels. At the city
level, it is important for the city government to have a regulatory framework that integrates climate change in its medium-term development planning, which also acknowledges existing administrative boundar-ies. The idea of deriving the provincial action plan to reduce greenhouse gas emissions from the national action plan is to ensure the effectiveness of climate finance disbursement from the central government to the provincial government. However, a derivation from the provincial action plan to city action plan, is also needed in order to ensure that cities can perform in accordance with its role and function, to achieve climate actions targets.
Different levels of authorities can also affect the effectiveness of climate finance. CPI (2014) has taken a lesson from Central Kalimantan province, where the study identified that levels of authority in deciding how and what activities that can be implemented by the provincial government can affect the effectiveness of climate finance. For instance, Central Kalimantan province, in accordance to the Governor ’s Decree on Provincial Action Plan to reduce greenhouse gas emissions, has identified its levels of authority, and divided them into three categories.101
(i) Isolated sectors, such as waste management, where the provincial government has full responsibil-ity including in developing a business-as-usual (BAU) baseline, and implementing mitigation options.
(ii) Open sectors (e.g., industry and transportation), where the provincial government has limited respon-sibility to set the BAU and select mitigation options (as these have been set by the central government). In this case, provincial government must provide baseline data, implement mitigation activities, and report.
101 Climate Policy Initia-tive. Landscape of Climate Finance in Indonesia. 2014

PB 75
(iii) Mixed sectors (i.e. agriculture, and forestry and peat lands), where it is difficult to delineate provincial and central government authority or responsibility, so that close coordination between the two levels of government is required during implementation.
Based on the above divisions, it is obvious that a clear division of authority will determine how much finance can be accessed and managed by the local government, in this case, the city. While in principle, devolving managing authority to the local level may be more effective than managing it at the higher level, especially in regard to monitoring.
The implementation of climate actions are ideally located at the local level, in cities and provinces. Importantly, however, more instruments to access finance need to be provided for the cities and provinces in order to implement relevant climate actions. This is due to the fact that the local government has limited options in generating local revenue and also has limited access to other resources. Therefore, to open more options for local government to access other resources, various financing mechanisms should be developed in such a way that the local government can access the funds without solely relying on transfers from the central government. Although there are various central transfers available, most are not yet dedicated to nor designed to help the local government in achieving local climate change targets.
THE IMPLEMENTA-
TION OF CLIMATE
ACTIONS ARE
IDEALLY LOCATED
AT THE LOCAL
LEVEL, IN CITIES
AND PROVINCES.

PB 76
CLOSING THE GAP
6
To close the climate finance gaps in cities there are several aspects that need to be addressed: (i) Access and mobilization of climate finance; (ii) Allocation of climate finance; (iii) Reporting; (iv) Measuring the impact of climate finance.
6.1. ACCESS AND MOBILIZATIONOF CLIMATE FINANCE
A nother finding from the study is the fact that there are possible financial sources that can be utilized to finance climate actions at the city
level. From several focus group discussions that were conducted in this study, a discussion on idle funds in state-owned companies emerged. For instance, it is a mandatory for state-owned companies to fund PKBL (Program Kemitraan dan Program Bina Lingkungan or partnership program and environmental management program),102 where the amount will be determined by Ministry in the case of a Public Corporation (Pe-rum) or shareholders meeting for government owned operating companies (Persero).103 In Article 8 of the decree, it is said that the state-owned enterprise can collaborate with other state-owned enterprises that can channel the fund, or even other entities, to chan-nel the fund. Other possible sources include national transfers, such as from the Specific Purpose Fund (DAK). Other sources available are from the interna-tional level, such as from the Global Environmental Facilities (GEF) and Green Climate Fund (GCF).
However, specific requirements must be met in order to access the available fund.
102 Ministry of State-Owned Enterprises Decree No. PER-07/MBU/05/2015 Article 2 (1).103 Ministry of State-Owned Enterprises Decree No. PER-07/MBU/05/2015 Article 9 (5).

PB 77
(i) A concrete proposal that can be implemented and that supports the local development plan that aims for low carbon and resilient livelihoods. The proposal must be developed based on the needs assessment of the area. For instance, a proposal to build a sea-water desalinator must be supported with information on water demand in the area, the number of households that can access the clean water produced by the desalinator, as well as the required capacity of the sea-water desalinator.
(ii) To access the international level fund, an entity that has a robust fiduciary standard and environmental and social safeguards as part of the institutional modalities needs to be established. Funds can only be accessed by an organization that is accountable in managing the funds; not only to ensure the flow of income, but also to allocate the fund in a way that is concrete, measurable, reportable and verifiable. For a Fund to disburse the money, it will need assurance that the entities can manage the fund in an accountable manner, as well as be able to allocate the Fund to activities that do not violate the environmental standards, as well as human rights.
6.2. ALLOCATION OF CLIMATE FINANCE
T his study also looked at possible funding that can be used to finance climate change actions towards low carbon and resilient livelihood development
for cities in Indonesia; Kupang was chosen to be the case study city. This study finds that a clear definition of ‘financing cities’ is required to understand which financing is dedicated to climate change, and which financing is solely for non-climate change actions. This definition should be applied for financing that can be accessed only by the municipalities, or for financing that can be accessed by various stakeholders to conduct climate actions at the city level. It is obvious that there are many actors at the city level (local government, private sector, civil society organizations, and academia) that can play a role in climate change actions, both for mitigation and adaptation. Thus, providing a space for each stakeholders to play a role in the achievement of the local low emission

PB 78
and resilient livelihood development plan, may help the local government to accelerate the achievement of its climate actions targets. Incentives may be required to stimulate other stakeholders to contribute.
H owever, what is missing in Kupang is a low car-bon and resilient livelihood development plan at the city level. Kupang needs to develop a base-
line for both mitigation and adaptation actions, which includes the projected climate change impacts for the city of Kupang with the current development scenario. The baseline will help Kupang identify vulnerable sec-tors that will be highly impacted by climate change, thus Kupang can identify what kind of preventive and respon-sive actions to take in order to reduce or minimize the impact. The city of Kupang is currently lacking a green-house gas emissions reduction strategy, however, they do have an action plan for adaptation and disaster risk reduction which was developed recently with the sup-port of the UNDP. In the end, clear objectives for low carbon and resilient livelihood development should be set by the city government of Kupang.
In most cases, greenhouse gas emissions are produced by industries, including power plants and transporta-tion. Thus, in order to develop greenhouse gas emis-sions reduction strategies, engaging the private sector is crucial. It is similar with the adaptation strategy, where communities will also be impacted. Thus, multi-stake-holder engagement in developing low emissions and re-silient livelihood programmes is crucial. Aside from that, Kupang needs to identify their financial needs in order to implement their low emission and resilient livelihood development strategy, and to identify the financial gaps and the means by which to close the gaps.
Another capacity building need that was identified is the need to develop feasibility studies and conduct vulner-ability assessments. This may not have to be done by the municipal government, but the government needs to come up with such analyses in order to lay a foundation upon which to build their development strategies.
THE CITY OFKUPANG IS CUR-
RENTLY LACKING A GREENHOUSE GAS
EMISSIONS RE-DUCTION STRAT-
EGY, HOWEVER, THEY DO HAVE AN ACTION PLAN FOR ADAPTATION AND
DISASTER RISK RE-DUCTION WHICH WAS DEVELOPED RECENTLY WITH
THE SUPPORT OF THE UNDP.

PB 79
6.3. REPORTING AND MEASURINGTHE IMPACTS OF CLIMATE FINANCE
With various funds and climate actions, a system of MRV (Monitoring, Reporting, and Verifying) is need-ed. As such, engagement with multi-stakeholders will be required which will lessen the burden on the local government. However, to be able to do MRV, it has to be clear which programmes and activities need to be MRV-ed.
A nother issue affecting the MRV system is the definition of climate finance. Having a clear definition of climate finance is important
to distinguish it from ODA (Official Development Assistance). Developed countries may use criteria developed by the Organization for Economic Co-operation and Development (OECD)’s Development Assistance Committee, which has developed indicators for climate change mitigation and adaptation, or a definition used by the Multilateral Development Banks (MDBs) including the African Development Bank, the Asian Development Bank, the European Bank for Reconstruction and Development, the European Investment Bank, the Inter-American Development Bank, the World Bank, and the International Finance Corporation. Indonesia, in this case, does not yet have a clear definition of climate finance.
Setting a classification system to define climate actions in Indonesia will help to measure the impact of climate finance as well as in doing the reporting. The level of detail for the classification system can be developed through several levels. For instance, the first level indicates types of activities, whether it is climate change adaptation or climate change mitigation. The second level indicates activities by sector. For instance, sectors under climate change mitigation can cover: energy, forestry, transportation, and manufacturing. The third level may indicate the technology used in each sector. For instance, under the energy-sector activities, related technologies

PB 80
include wind technology, solar, geothermal, and so on. However, countries need to determine a level of detail that is practical and that meets their internal policy needs.
S ufficient institutional arrangements, including clear roles and responsibilities for different actors, is very important for effectively managing,
monitoring, and coordinating climate finance. Having this kind of institutional arrangement will help countries to determine where climate finance is flowing to, and whether it is being used in line with its intended purpose. WRI, in its workshop report,104 has indicated that difficulties arise in ensuring effective coordination and information sharing. Integrating climate change into development planning at national, sectoral, and subnational levels was also noted as a key challenge.
Another challenge relates to non-state actors, including non-governmental actors and private sector actors who may have invested climate finance for climate actions, however their investment is untraceable.
An option of having a local trust fund, where all possible funds can be pooled in the trust fund and the trust fund itself can allocate the fund to appropriate climate actions in accordance with the needs of the city, was offered. The trust fund shall be able to be accessed by local governments, CSOs, the private sector, and academia, which will implement the climate change framework of actions developed and agreed upon through multi-stakeholder consultation. Not only may it conduct the available projects or programmes, but this entity can also do the monitoring and verification, as long as the projects are not conducted by the entity or entity members themselves. This entity will do the monitoring and reporting on the source of climate finance, as well as the impact. Having one entity will reduce the difficulties in managing, monitoring and coordinating the existing climate finance from all actors.
ANOTHER
CHALLENGE RE-
LATES TO NON-
STATE ACTORS,
INCLUDING NON-
GOVERNMENTAL
ACTORS AND
PRIVATE SECTOR
ACTORS WHO MAY
HAVE INVESTED
CLIMATE FINANCE
FOR CLIMATE
ACTIONS,
HOWEVER THEIR
INVESTMENT IS
UNTRACEABLE.
104 Tirpak, et.al. Working Paper: Monitoring Climate Finance in Developing Countries: Challenges and Next Steps. World Resource Institute. March 2014.

PB 81
P residential Decree No. 80/2011 has intro-duced the trust fund to be a financial instru-ment that can be established to meet certain
needs. It is likely that a trust fund will help the city overcome any limitations that currently exist in rela-tion to the local treasury fund (APBD). The trust fund also ensures transparency and accountability, while at the same time the process will be faster than going through bureaucracy.
Trust fund is a financial asset management, which can be in the form of property, money, or security. Usually, if a donor would like to disburse a fund, a trustee is required. The fund can only be used for the particular purposes and objectives set by the do-nor. In order to ensure its use, a board of trustees is needed, to oversee the disbursed of the fund. Those to whom the fund is disbursed, need to have good credibility and be reputatable.
TRUST
FUND
DELIVERY
MECHANISM
Figure 29 Scheme of the proposed local trust fund105
Int’l ClimateFunds
APBD
Donoragency
CSR
105 IESR’s analysis

PB 82
KUPANG CLIMATE CHANGE TRUST FUND
Adaptation/ResilienceWindow (30%)
Mitigation Window(40%)
Project Development(30%)
Sm
all
Gra
nt
Cap
acit
yB
uild
ing
Sm
all
Gra
nt
Cap
acit
yB
uild
ing
Sm
all
Gra
nt
Small scale renewable electricity, Clean cooking
fuel & technology,Energy efficiency,Urban land use,
waste management
Pre-FS, FS,Technical studies
NGO Community Private LGUs
Increase local resiliency on CC, CC adaptation
on food & water,Climate related disaster
prevention
Figure 30 Kupang climate change trust fund, a proposed scheme106
A side from providing funding, the trust fund can also provide technical assistance to local government or others developing feasibility
studies for any climate projects and/or programmes usually needed by the local government. For instance, technical assistance to develop a suitable proposal for local government to access the specific purpose fund that is available through the related ministry. The technical assistance can also be in the form of developing a needs assessment of the city on climate change adaptation and mitigation measures to comply with climate compatible development. This component can be referred to as the project development windows.
106 Fabby Tumiwa. Institutsi PendanaanAksiPerubahan-IklimPerkotaan. Delivered at workshop on ‘Diseminasi-hasilstudipendanaanperuba-haniklimkotaKupang’ 11 May 2016 in Kupang.

PB 83
Figure 31 Proposed ways of work of the local trust fund107
T he technical assistance facility that is pro-posed to be a part of the project develop-ment windows will provide required sup-
porting information or research needed to propose a project. It allows more time for the government to design a project proposal to be submitted to the central government for funding.
Project ProposalBankable Project
Proposal
DAK APBD APBN Bank
Rev
olvi
ng F
und
Study/Pre FS FS Detail FS
TECHNICAL ASSISTANCE FACILITY
107 Fabby Tumiwa. In-stitutsi Pendanaan Aksi Perubahan Iklim Perkotaan. Delivered at workshop on ‘Diseminasi hasil studi pendanaan perubahan iklim kota Kupang’ 11 May 2016 in Kupang.

PB 84
CONCLUSIONSAND RECOMMENDATIONS
7
7.1. CONCLUSIONS
There are several conclusions that can be drawn from this study:
1. Apart from international sources, there are a va-riety of public and private sector funding sources available domestically through.
2. Although the financial sources exist, there are no indicators available to ensure the adequacy and effectiveness of the funds. Therefore, a set of cli-mate actions indicators is needed to monitor the adequacy and effectiveness of the funds.
3. Currently, the transfer mechanism from the central to the local government will follow the programme that has been set by the local govern-ment, in accordance with the Government Work-Plan (Rencana Kerja Pemerintah, RKP), as well as their medium-term development plan (Rencana Pembangunan Jangka Menengah Daerah, RPJMD). Therefore, unless the local government develops their programs of priority in relation to climate change, including the non-physical needs such as enabling environment policies and capacities, no direct transfer from central to local government can be utilized. In the program of activities, develop-ing a local vulnerability assessment, a feasibility study, and other enabling environment tools and/or instruments to support development planning and implementation must be included.

PB 85
7.2. RECOMMENDATIONS
There are several recommendations that can be suggested through this study:
1. Cities need to have their own climate action plans both for mitigation and adaptation, which are developed in accordance with scientific evidence. The action plan needs to have a legal status in order to be sustainably implemented. In developing the action plan, multi-stakeholder participation is required, thus effort-shar-ing among stakeholders can be applied to achieve a low carbon and resilient cities development plan.
2. Establishment of a platform of information for cities on available funding and the means to access it, specifically on climate change.
3. A local trust fund can be established to collect and manage the available funding, and to access the available international funds, thus ensuring the effectiveness of the fund. The local trust fund should have a multi-stakeholder committee to define, approve and perform the overseer function of the proposed climate action. Fur-ther advocacy work needs to be done to establish the local trust fund, which needs to engage local government, both at the munici-pal and provincial levels, as well as relevant private sector parties and civil society organizations. The advocacy work includes the le-gal status of the local trust fund, convening the steering committee of the fund, identifying financial resources, modalities of the fund, selecting the trustees of the fund, and developing the strategic plan and the work plan of the fund.
4. Further scoping study work needs to be done to define the kinds of projects eligible to be funded by the local trust fund. This work shall feed into recommendation point (3) at the part of developing the modalities. Aside from the type of project, an early study on the legal status of the local trust fund should also be conducted.
5. This study also affirms the need for detailed guidance on how to determine which activities are climate specific, especially in rela-tion to adaptation. A single national system or database is essen-tial to systematically collating comparable information from the full spectrum of actors, and to provide accessible guidelines.

PB 86
Adiningtyas, W., Kuswardono, T., Heo, M., Messakh, O. Migran Miskin Tak Ber-aset di Kota Kupang. Perkum-pulan Pikul. 2010.
Bappenas. Indonesia’s National Action Plan on Climate Change Adaptation. 2014.
Bappenas. Institusi Pendanaan dan Strategi Pendan-aan Kegiatan Adaptasi Perubahan Iklim di Indonesia. Delivered at IESR’s FGD on July 26th 2013. Excerpt from http://www.iesr.or.id/wp-content/uploads/Institusi-dan-Strategi-Pendanaan-API_final.pdfBarnard, Sam. Climate finance for cities. ODI Working Paper 419. June 2015.
BPS, Kupang dalam Angka 2014.C40 cities climate leadership group. Unlocking cli-mate action in megacities. 2016.
Climate Analytics. 1.5oC risks and feasibility. 2015.
Climate Analytics. Briefing Note on the Report on the Structured Expert Dialogue on the 2013-2015 Re-view. 2015.
Climate Policy Initiative and Fiscal Policy Agency. The land-scape of public climate finance in Indonesia. July 2014.
Derry Wanta. Informasi Pendanaan Kegiatan ICCTF 2015-2016. Delivered at FGD ‘Peluang Kota untuk Mengakses Pendanaan Perubahan Iklim di Indonesia’ July 18th 2016.
Emissions gap, http://climateactiontracker.org/global/173/CAT-Emissions-Gaps.html
REFERENCES
6

PB 87
Endah Murniningtyas. Presentation: Adaptasi Perubahan Iklim dan Pengurangan Risiko Bencana dalam Tujuan Pem-bangunan Berkelanjutan (SDGs). 2015. Delivered at Na-tional DRR Month in 2015, Surakarta, 17 October 2015.
Estimated costs climate change, http://www.climatefund-supdate.org/resources/estimated-costs-climate-change
Fabby Tumiwa. Institutsi Pendanaan Aksi Perubahan Iklim Perkotaan. Delivered at workshop on ‘Diseminasi hasil studi pendanaan perubahan iklim kota Kupang’, 11 May 2016, Kupang.
Gan Gan Dirgantara. Pendanaan Perubahan Iklim untuk Perkotaan. PT SMI. Delivered at FGD ‘Peluang Kota un-tuk Mengakses Pendaaan Perubahan Iklim di Indone-sia’, July 18th 2016.
IEA. World Energy Outlook Special Report: Energy and Climate Change. 2015.
Imelda, H., Tumiwa, F. Strengthening Direct Access to Green Climate Fund by Indonesia’s Entities. IESR. No-vember 2015.
Infographic: top cities and urbanization in ASEAN, ex-cerpt from: http://aseanup.com/infographic-top-cities-urbanization-asean/
IPCC. Fif th Assessment Report Chapter 16 Working Group III on Cross-cutting Investment and Finance Is-sues. 2014.
Kota Kita. RAD API-PRB: Rencana Aksi Daerah untuk Adaptasi Perubahan Iklim dan Pengurangan Risiko Ben-cana Kota Kupang. UNDP. Agustus 2015.
Memperkuat akses langsung entitas Indonesia pada GCF, http://iesr.or.id/2016/06/publikasi-memperkuat-akses-langsung-entitas-indonesia-pada-green-climate-fund/

PB 88
Memperkuat kontribusi NSA untuk percepatan imple-mentasi aksi perubahan iklim di Indonesia, http://iesr.or.id/2016/05/semiloka-memperkuat-kontribusi-non-state-actors-nsa-untuk-percepatan-implementasi-ak-si-perubahan-iklim-di-indonesia/
Ministry of Finance. Indonesia’s First Mitigation Fiscal Framework. 2012.
Population growth and rural exodus in Southeast Asia, excerpt from: http://aseanup.com/infographic-top-cit-ies-urbanization-asean/Pusat Kebijakan Pembiayaan Perubahan Iklim dan Multilateral, Badan Kebijakan Fiskal, Kementerian Keuangan. Instrumen Pendan-aan di Indonesia untuk Perubahan Iklim. Jakarta, 18 Agustus 2015.
Status of climate funds, http://www.climatefundsup-date.org/data
Syurkani Ishak Kasim, Ph.D. Climate Finance: Experi-ence from Indonesia. Fiscal Policy Agency, Ministry of Finance, Indonesia, presentation delivered on March 31st 2016.
UNDP (2012). Readiness for Climate Finance, accessed from https://mitigationpartnership.net/sites/default/files/undp_readiness_for_climate_finance.pdf
UNDP. Rencana Aksi Daerah untuk Adaptasi Perubahan Iklim dan Pengurangan Risiko Bencana Kota Kupang. August 2015.
UNEP. Emission Gap Report 2015.
UNEP. Emission Gap Report 2011.
UNFCCC Standing Committee on Finance. 2014 Biennial Assessment and Overview of Climate Finance Flows Report.

PB 89
Institute for Essential Services Reform(IESR)
Mampang Prapatan VIII.Komplek Bappenas No R-13Jakarta, 12790, IndonesiaTel. +62-21-7992945Fax +62-21-7996160Facebook: IESR IndonesiaTwitter: @IESRe-mail: [email protected]: www.iesr.or.id


![INDEX [reliefweb.int]reliefweb.int/sites/reliefweb.int/files/resources/maps_index.pdf · INDEX Index Health facility name Functional Status Health facility type Structure Type 0 1000](https://img.pdfslide.us/doc/110x75/5e89a2a5e988f11bf13a6b08/index-index-index-health-facility-name-functional-status-health-facility-type.jpg)