Embed Size (px)
Citation preview
Regional RepoRt on nutRitionSecuRity in aSeanVolume 1

Regional RepoRt on nutRition SecuRity in aSean
Volume 1This work is a product of ASEAN and UNICEF with support from EU/UNICEF Maternal and Young Child Nutrition Security Initiative in Asia (MYCNSIA)
aSean Socio-cultural community Department
uniceF eapRo (east asia and the pacific Regional office)
Regional RepoRt on nutRition SecuRity in aSean Volume 1ii
the association of Southeast asian nations (aSean) was established on 8 august 1967. the Member States of the association are Brunei Darussalam, cambodia, indonesia, lao pDR, Malaysia, Myanmar, philippines, Singapore, thailand and Viet nam. the aSean Secretariat is based in Jakarta, indonesia.
For inquiries, contact: the aSean Secretariat public outreach and civil Society Division 70a Jalan Sisingamangaraja Jakarta 12110 indonesia phone : (62 21) 724-3372, 726-2991 Fax : (62 21) 739-8234, 724-3504 e-mail : [email protected]
catalogue-in-publication Data
Regional Report on nutrition Security in aSean – Volume 1 Jakarta: aSean Secretariat, March 2016
the text of this publication may be freely quoted or reprinted, provided proper acknowledgement is given and a copy containing the reprinted material is sent to the public outreach and civil Society Division of the aSean Secretariat, Jakarta.
general information on aSean appears online at the aSean Website: www.asean.org
copyright association of Southeast asian nations (aSean) 2016 all rights reserved
this publication is supported by:
aSean or uniceF does not guarantee the accuracy of the data included in this work.
the boundaries, colours, denominations, and other information shown on any map in this work do not imply any judgment on the part of aSean or uniceF concerning the legal status of any territory or the endorsement or acceptance of such boundaries.
united nations children’s Fund uniceF east asia and Regional office (eapRo) 19 phra atit Road Bangkok 10200 thailand Website: www.unicef.org/eapro e-mail: [email protected]
Regional RepoRt on nutRition SecuRity in aSean Volume 1 iii
Acknowledgement
this work is a product of aSean and uniceF with support from the eu/uniceF Maternal and young child nutrition Security initiative in asia (MycnSia).
this report (Volume 1) was endorsed and launched at the 12th aSean Health Ministers Meeting in September 2014. Data contained herein may, in some cases, be updated in the companion Volume 2 (2016).
this work is a product of aSean and uniceF with external contributions from the Food and agriculture organization of the united nations (Fao), the World Food programme (WFp), and the World Health organization (WHo).
the e-version of this document was produced with financial assistance of the european union and uniceF. the views expressed herein can in no way be taken to reflect the official opinion of the european union or uniceF.
this printed version was produced with the support of funds from the aSean Secretariat and the european union.
the material in this work is subject to copyright. Because aSean and uniceF encourage dissemination of its knowledge, this work may be freely quoted or reprinted, in whole or in part, for non-commercial purposes as long as full attribution to this work is given. any queries on rights and licenses, including subsidiary rights, should be addressed to aSean or uniceF eapRo.
photo credits, cover (from top left, clockwise).
© uniceF lao pDR/2007/Holmes © uniceF eapRo/2014/Foote © uniceF indonesia/2015/Sukotjo © Samantoniophotography | Dreamstime.com
Regional RepoRt on nutRition SecuRity in aSean Volume 1iv
Message from theSecretary-General of ASEAN
Since 2002, aSean has emphasized the promotion of healthy lifestyles in the region, of which nutrition is one of the critical factors. Regional strategies in promoting Healthy aSean lifestyles — including those relevant to nutrition — have been incorporated into
the national plans and implemented by aSean Member States. these efforts were further strengthened by the adoption of the Bandar Seri Begawan Declaration on noncommunicable Diseases in aSean in october 2013.
aligned with the goals of the aSean Strategic Framework on Health Development for 2010 to 2015, aSean is committed to achieving a Healthy aSean community by 2015. By promoting healthy lifestyles, addressing food and nutrition security among various strategies, aSean is integrating all these actions into a comprehensive action plan with the ultimate goal of improving health outcomes in the region.
as aSean seeks to further enhance its monitoring and evaluation capabilities, the publication of this evidence-based Joint Regional Report on nutrition Security in aSean, Volume 1, will be a useful document for aSean officials and policy-makers to track the progress of food and nutrition security at regional and national levels.
By achieving food and nutrition security necessary for healthy lifestyles, aSean is ensuring the wellbeing of our peoples and the continued prosperity of the aSean community.
Le Luong MinhSecretary-general of aSean
Regional RepoRt on nutRition SecuRity in aSean Volume 1 v
Message from the Regional Director, UNICEF EAPRO
the asia and pacific region has made considerable economic gains over the past several decades, but not all people have benefited from this growth. although the region has also seen notable improvements in food security and in nutrition, that progress has not been
equitable for all countries and also not been uniformly distributed through the different groups within the countries.
problems of undernutrition, vitamin and mineral deficiencies, obesity and diet-related chronic diseases increasingly exist side by side across many countries. those who do not get enough energy or key nutrients cannot sustain healthy, active lives. the result is poor physical and mental development, devastating illness and death, as well as incalculable loss of human potential and social and economic development. at the same time, hundreds of millions of people suffer from diseases caused by excessive or unbalanced diets and many developing nations are now dealing with severe health issues at both ends of the nutritional spectrum. countries still struggling to feed their people face the costs of preventing obesity and treating diet-related non-communicable illness. this is the “double burden” of malnutrition.
a joint activity of the aSean taskforce on Maternal and child Health and the uniceF east asia and the pacific Regional office, in collaboration with Fao, WFp and WHo, has been developed to signal those inequities in food and security and nutrition. the production of a series of Food and nutrition Security (FnS) country profiles for each of the countries in the aSean community is aimed to generate awareness on sensitive issues related to the gaps in achieving the best results in food security and nutrition.
Daniel tooleRegional DirectoruniceF east asia and the pacific Regional office (eapRo)

Regional RepoRt on nutRition SecuRity in aSean Volume 1 vii
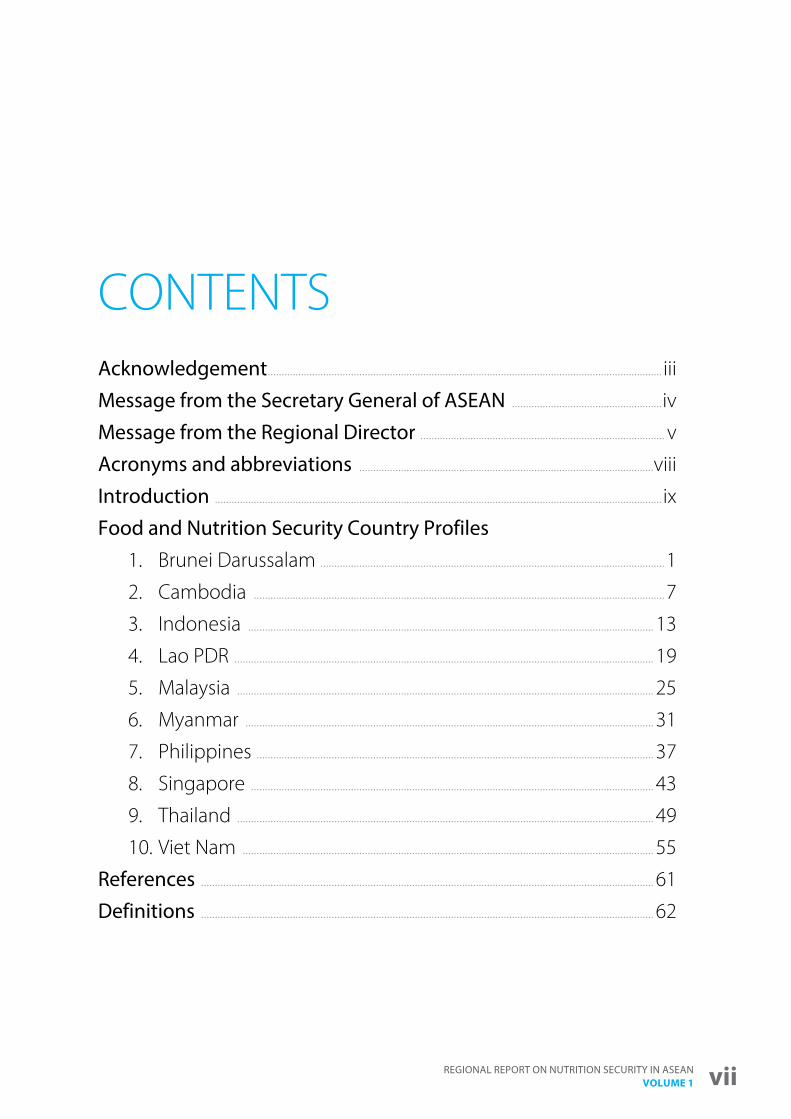
CONTENTSacknowledgement .............................................................................................................................................. iii
Message from the Secretary general of aSean ......................................................iv
Message from the Regional Director ........................................................................................ v
acronyms and abbreviations ..........................................................................................................viii
introduction ................................................................................................................................................................. ix
Food and nutrition Security country profiles1. Brunei Darussalam ............................................................................................................................1
2. Cambodia ....................................................................................................................................................7
3. Indonesia .................................................................................................................................................. 13
4. Lao PDR ....................................................................................................................................................... 19
5. Malaysia ...................................................................................................................................................... 25
6. Myanmar ................................................................................................................................................... 31
7. Philippines ............................................................................................................................................... 37
8. Singapore ................................................................................................................................................. 43
9. Thailand ...................................................................................................................................................... 49
10. Viet Nam .................................................................................................................................................... 55
References ................................................................................................................................................................... 61
Definitions ................................................................................................................................................................... 62
Regional RepoRt on nutRition SecuRity in aSean Volume 1viii
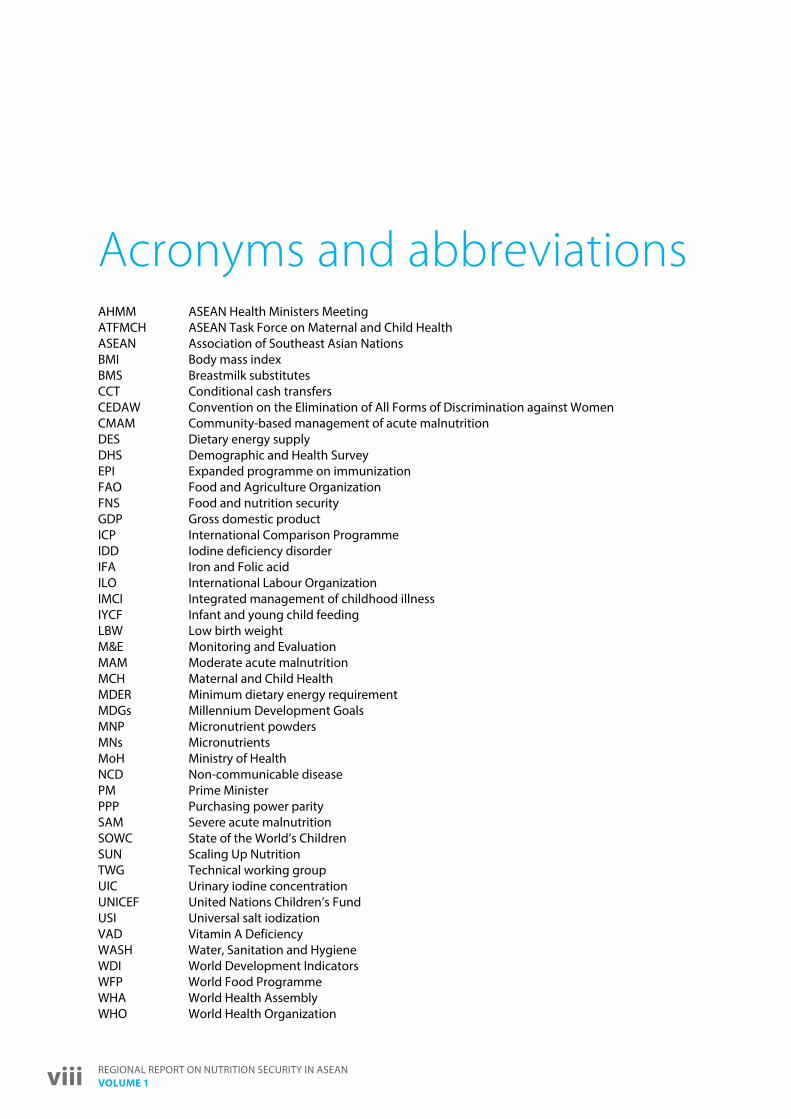
Acronyms and abbreviations aHMM aSean Health Ministers MeetingatFMcH aSean task Force on Maternal and child HealthaSean association of Southeast asian nations BMi Body mass indexBMS Breastmilk substitutescct conditional cash transfersceDaW convention on the elimination of all Forms of Discrimination against WomencMaM community-based management of acute malnutritionDeS Dietary energy supplyDHS Demographic and Health Surveyepi expanded programme on immunizationFao Food and agriculture organizationFnS Food and nutrition securitygDp gross domestic producticp international comparison programmeiDD iodine deficiency disorderiFa iron and Folic acidilo international labour organizationiMci integrated management of childhood illnessiycF infant and young child feedinglBW low birth weightM&e Monitoring and evaluationMaM Moderate acute malnutritionMcH Maternal and child HealthMDeR Minimum dietary energy requirementMDgs Millennium Development goalsMnp Micronutrient powdersMns MicronutrientsMoH Ministry of HealthncD non-communicable diseasepM prime Ministerppp purchasing power paritySaM Severe acute malnutritionSoWc State of the World’s childrenSun Scaling up nutritiontWg technical working groupuic urinary iodine concentrationuniceF united nations children’s FunduSi universal salt iodizationVaD Vitamin a DeficiencyWaSH Water, Sanitation and Hygiene WDi World Development indicatorsWFp World Food programmeWHa World Health assemblyWHo World Health organization
Regional RepoRt on nutRition SecuRity in aSean Volume 1 ix
Introduction the association of Southeast asian nations, or aSean, aims to accelerate economic growth and social progress by promoting active collaboration and mutual assistance on matters of common interest. Food and nutrition security is of particular concern to aSean countries, as it brings a wide range of benefits for the region’s children and families, communities and economies.
Food and nutrition security exists when all people at all times have physical, social and economic access to food, which is consumed in sufficient quantity and quality to meet their dietary needs and food preferences, and is supported by an environment of adequate sanitation, health services and optimal feeding and care practices, allowing for a healthy and active life.
immediate causes of undernutrition are an inadequate dietary intake and frequent disease exposure. this can by brought about by underlying factors, such as household food insecurity (lack of availability of, access to, and/or utilization of a diverse diet), inadequate care and feeding practices for children, unhealthy household and surrounding environments, and a lack of access to adequate health care. Social, economic, and political factors can also have a long-term influence on maternal and childhood undernutrition. Structures and processes which undermine human rights and perpetuate poverty may result in poor nutrition by limiting or denying vulnerable populations access to essential resources. Moreover, chronic undernutrition can lead to poverty, creating a vicious cycle.
in aSean countries, the latest available data indicate that an average of 31.5% of children under 5 years of age are affected by stunting. this amounts to a staggering 17.7 million children. these children are more susceptible to illness, facing greater threats to their survival in their early years when they are most vulnerable. Stunting and other forms of undernutrition are associated with sub-optimal brain development, which can have long-term consequences for cognitive ability, school performance and future earnings. at the same time, a stunted child enters adulthood with a greater propensity for developing obesity and chronic diseases.
also of concern in the region is the 5.4 million children who are wasted. these children face a nine times greater risk of dying. a child can be affected by both stunting and wasting and recent analysis has shown that wasting, especially repeated episodes, negatively affects linear growth. Similarly, maternal under and over nutrition poses serious health and economic challenges for the region, with an estimated 36% of pregnant women affected by anaemia. in aSean countries, 38% of children under five (21.4 million) suffer from anaemia, making it a serious public health issue in the region. nevertheless, several countries are making positive progress in controlling anaemia through various strategies.

Regional RepoRt on nutRition SecuRity in aSean Volume 1x
evidence shows that children who experience faltered growth during the first 1,000 days of life tend to lay down fat in later childhood and adulthood due to their early life “programming.” this phenomenon is exacerbated by exposure to “obesity prone” environments characterized by consumption of energy-dense, processed foods in place of traditional cereals, animal foods, fruits and vegetables and an increasingly sedentary lifestyle. in aSean countries, an estimated 4.5 million children under five are currently overweight or obese.
the “double burden” of malnutrition poses a threat both to maternal and child health, and a burden to health care systems in the region. overnutrition and undernutrition increasingly co-exist in the same communities, families, and even at an individual level (e.g. an overweight yet anaemic woman). the looming costs of non-communicable diseases (ncDs) can and must be curtailed through the prevention of under- and over-nutrition. this will require healthier diets and appropriate levels of physical activity, particularly for more sedentary sub-groups of the population.
international consensus supports multisectoral approaches which combine proven nutrition-specific and nutrition-sensitive interventions to effect a more holistic sustainable response to improve child and maternal nutrition, while also bringing dividends to each of these sectors. Nutrition-specific interventions, if scaled up and utilized, can significantly reduce stunting, micronutrient deficiencies and wasting as well as the risk of overweight and obesity. these interventions largely focus on women, in particular pregnant and lactating women, and children under 2 years of age, particularly in the most disadvantaged populations. they include support for exclusive breastfeeding up to 6 months of age and continued breastfeeding, together with appropriate and nutritious complementary food, up to 2 years of age; fortification of foods; micronutrient supplementation; treatment of acute undernutrition and energy and protein supplementation. Nutrition-sensitive approaches address the underlying determinants of undernutrition and future overweight and obesity, and warrant scale-up in their own right. these include health services strengthening, agricultural diversification, social transfers, early childhood development, education and provision/promotion of clean water, sanitation and hygiene (WaSH).
the aSean task Force on Maternal and child Health (atFMcH) with uniceF have developed a Joint Regional Report on nutrition Security as an advocacy tool on nutrition, with an emphasis on child nutrition. the activity stems from the atFMcH Workplan 2011-2015, activity 2.1.2 on the “Development of evidence-based advocacy tools for selected issues, including maternal, infant and young child nutrition”. the Joint Regional Report on nutrition Security is a two volume publication.
Volume 1 presents the compilation of the Food and nutrition Security (FnS) profiles for the 10 aSean nations. the FnS profiles were produced and finalized in consultation with the Ministries of Health and Ministries of agriculture of the respective countries.
Regional RepoRt on nutRition SecuRity in aSean Volume 1 xi
the preparation of each of the Food and nutrition Security country profiles has followed a thorough process of development and validation. First, a database on food security and nutrition indicators was compiled using the latest available information from national level publications and/or qualified global databases (Fao, uniceF, WHo, World Bank, and others). Second, the profiles were generated in a 6-page (per country) format, including graphs and figures of the selected indicators, narratives for the figures which were prepared by the un technical staff and professionally edited, and a list of relevant laws, policies, strategies, and action plans which create the enabling environment for nutrition security at country level. third, the profiles were circulated to health and agriculture authorities and un partners at country level for validation and input. Suggested amendments during the validation phase were incorporated with the same criteria of qualified, published sources. the information included is backed by recognized, validated and properly published information available until June 2014. the profiles appear in alphabetical order in Volume 1.
Volume 2 of the report will be a more in-depth synthesis of the nutrition situation in the aSean region and the determinants of malnutrition, based on the data in the profiles. this will include an overview of the post-2015 sustainable development goals and the World Health assembly nutrition targets in the context of aSean, the socio-economic costs and implications of the current burden of malnutrition and the economic rationale for investing in nutrition, case studies and evidence on effective interventions and approaches in multiple sectors to improve nutrition, policy and financing mechanisms, and identified challenges.
the Regional Report on nutrition Security in aSean (Volumes 1 and 2) therefore aims to strengthen and facilitate evidence-based planning and decision making to achieve optimal results in nutrition security through multi-sectoral strategies. the target audience of the publication is principally policy makers. While this effort serves as an advocacy tool, it also serves to facilitate comprehensive understanding of food and nutrition security issues at national level by policy makers and other key stakeholders. as such, the Report provides an excellent opportunity to exchange views on the progress made by member countries on food and nutrition security as well as addressing the remaining challenges.

Regional RepoRt on nutRition SecuRity in aSean Volume 1 1
Brunei Darussalam - Food and Nutrition Security Profiles
Source:
-
-
2010
-
-
10.8%Proportion of infants with low birth weight
Brunei Darussalam Vital Statistics 2010, Department of Statistic, JPKE, Prime Minister's Office
Key Indicators
Anthropometry (Table 1.1)
Underweight women (BMI < 18.5 kg/m2)
Overweight adults (BMI >= 25 kg/m2)
76448
71080
5 5
0
2
4
6
8
10
67000
69000
71000
73000
75000
77000
79000
1990
1992
1994
1996
1998
2000
2002
2004
2006
2008
2010
2012
GDP per person, PPP (constant 2011 dollars)Undernourished in total population
9
20
10
3
2012
Overweight StuntingUnderweight Wasting
Source: 2012 2nd National Health and Nutritional Survey NHANSS
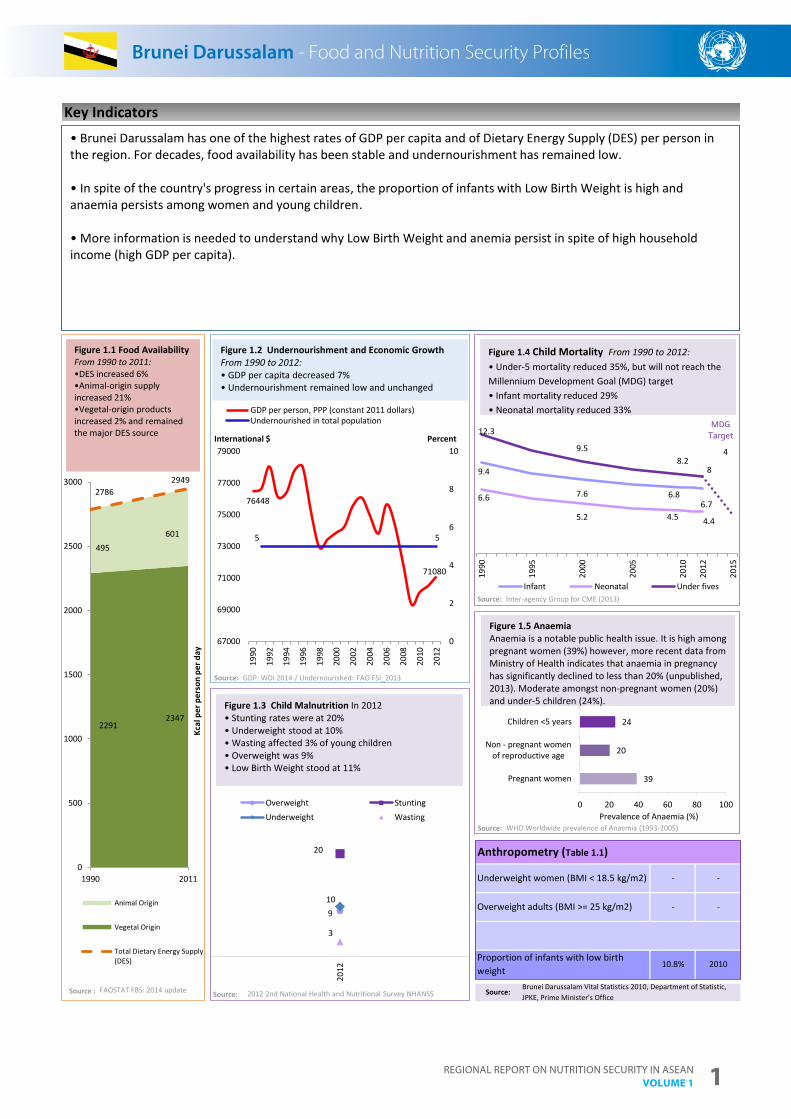
Figure 1.3 Child Malnutrition In 2012• Stunting rates were at 20% • Underweight stood at 10%• Wasting affected 3% of young children • Overweight was 9%• Low Birth Weight stood at 11%
• Brunei Darussalam has one of the highest rates of GDP per capita and of Dietary Energy Supply (DES) per person in the region. For decades, food availability has been stable and undernourishment has remained low.
• In spite of the country's progress in certain areas, the proportion of infants with Low Birth Weight is high and anaemia persists among women and young children.
• More information is needed to understand why Low Birth Weight and anemia persist in spite of high household income (high GDP per capita).
39
20
24
0 20 40 60 80 100
Pregnant women
Non - pregnant womenof reproductive age
Children <5 years
Total <2 yr
Prevalence of Anaemia (%)
22912347
495601
27862949
0
500
1000
1500
2000
2500
3000
1990 2011
Kcal
per
per
son
per d
ay
Animal Origin
Vegetal Origin
Total Dietary Energy Supply(DES)
Figure 1.1 Food AvailabilityFrom 1990 to 2011: •DES increased 6% •Animal-origin supply increased 21% •Vegetal-origin products increased 2% and remained the major DES source
9.4
7.6 6.86.7
6.6
5.2 4.5 4.4
12.3
9.58.2
8
4
1990
1995
2000
2005
2010
2012
2015
Infant Neonatal Under fives
Brunei Darussalam - Food and Nutrition Security Profiles
Figure 1.5 Anaemia Anaemia is a notable public health issue. It is high among pregnant women (39%) however, more recent data from Ministry of Health indicates that anaemia in pregnancy has significantly declined to less than 20% (unpublished, 2013). Moderate amongst non-pregnant women (20%) and under-5 children (24%).
Figure 1.4 Child Mortality From 1990 to 2012:• Under-5 mortality reduced 35%, but will not reach the Millennium Development Goal (MDG) target• Infant mortality reduced 29%• Neonatal mortality reduced 33%
Figure 1.2 Undernourishment and Economic Growth From 1990 to 2012: • GDP per capita decreased 7%• Undernourishment remained low and unchanged
MDGTargetPercentInternational $
Source:
Source:
Source:
Source : FAOSTAT FBS: 2014 update
GDP: WDI 2014 / Undernourished: FAO FSI_2013
Inter-agency Group for CME (2013)
WHO Worldwide prevalence of Anaemia (1993-2005)
Regional RepoRt on nutRition SecuRity in aSean Volume 12
Brunei Darussalam - Food and Nutrition Security Profiles
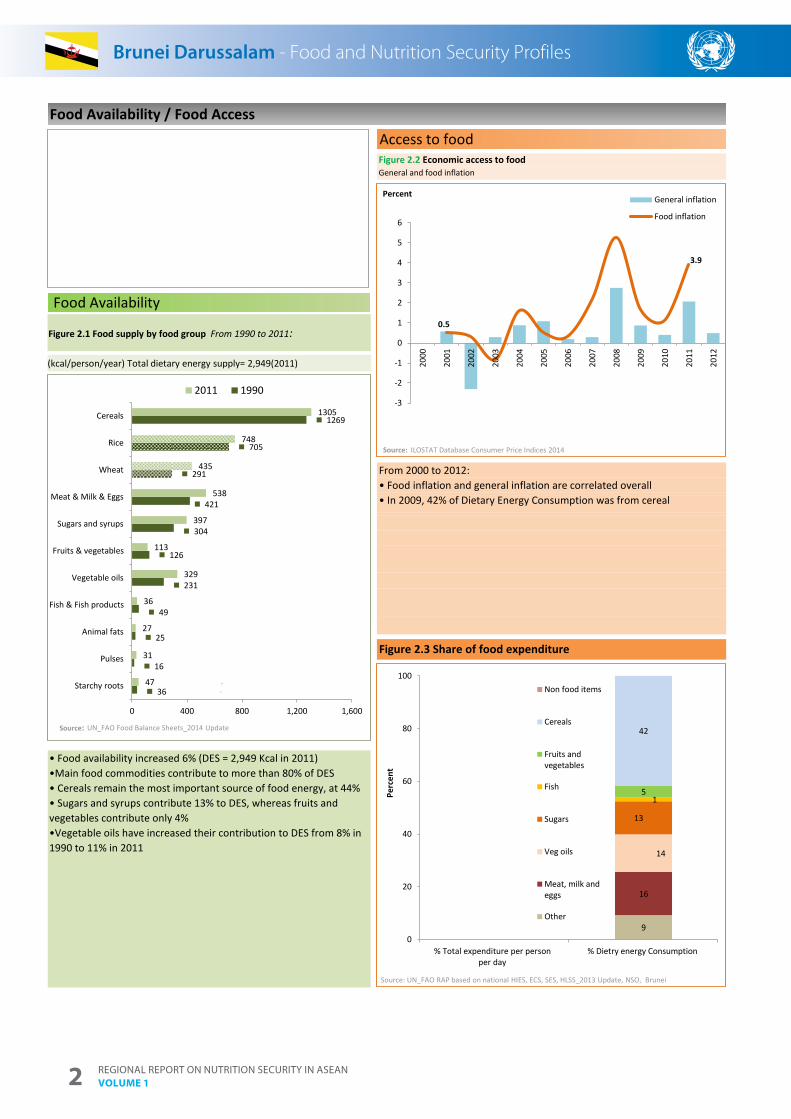
• Food availability increased 6% (DES = 2,949 Kcal in 2011) •Main food commodities contribute to more than 80% of DES• Cereals remain the most important source of food energy, at 44%• Sugars and syrups contribute 13% to DES, whereas fruits and vegetables contribute only 4% •Vegetable oils have increased their contribution to DES from 8% in 1990 to 11% in 2011
Access to foodFigure 2.2 Economic access to foodGeneral and food inflation
Figure 2.3 Share of food expenditure
Food Availability
From 2000 to 2012:• Food inflation and general inflation are correlated overall • In 2009, 42% of Dietary Energy Consumption was from cereal
Food Availability / Food Access
36
16
25
49
231
126
304
421
291
705
1269
47
31
27
36
329
113
397
538
435
748
1305
Starchy roots
Pulses
Animal fats
Fish & Fish products
Vegetable oils
Fruits & vegetables
Sugars and syrups
Meat & Milk & Eggs
Wheat
Rice
Cereals
0 400 800 1,200 1,600
2011 1990
Source:
(kcal/person/year) Total dietary energy supply= 2,949(2011)
Brunei Darussalam - Food and Nutrition Security Profiles
Figure 2.1 Food supply by food group From 1990 to 2011:0.5
3.9
-3
-2
-1
0
1
2
3
4
5
6
2000
2001
2002
2003
2004
2005
2006
2007
2008
2009
2010
2011
2012
General inflation
Food inflation
Source:
9
16
14
13
15
42
0
20
40
60
80
100
% Total expenditure per personper day
% Dietry energy Consumption
Perc
ent
Non food items
Cereals
Fruits andvegetables
Fish
Sugars
Veg oils
Meat, milk andeggs
Other
Percent
ILOSTAT Database Consumer Price Indices 2014
UN_FAO Food Balance Sheets_2014 Update
Source: UN_FAO RAP based on national HIES, ECS, SES, HLSS_2013 Update, NSO, Brunei
Regional RepoRt on nutRition SecuRity in aSean Volume 1 3
Brunei Darussalam - Food and Nutrition Security Profiles
-Share of children under age 5 with diarrhoea receiving zinc treatment
Food Safety
Water and Sanitation
Food Utilization
Zinc
Existing policy frameworkZinc Supplementation and Reformulated Oral Rehydration Salt in the Management of Diarrhea
Source:
Management of Diarrhoea (Table 3.1)
No Data
No DataNo Data No Data
Brunei Darussalam - Food and Nutrition Security Profiles
Figure 3.1 Access to Improved Sanitation
Figure 3.4 Diarrhoea
Figure 3.2 Open Defecation Figure 3.3 Access to Improved Water Sources
Regional RepoRt on nutRition SecuRity in aSean Volume 14
Brunei Darussalam - Food and Nutrition Security Profiles
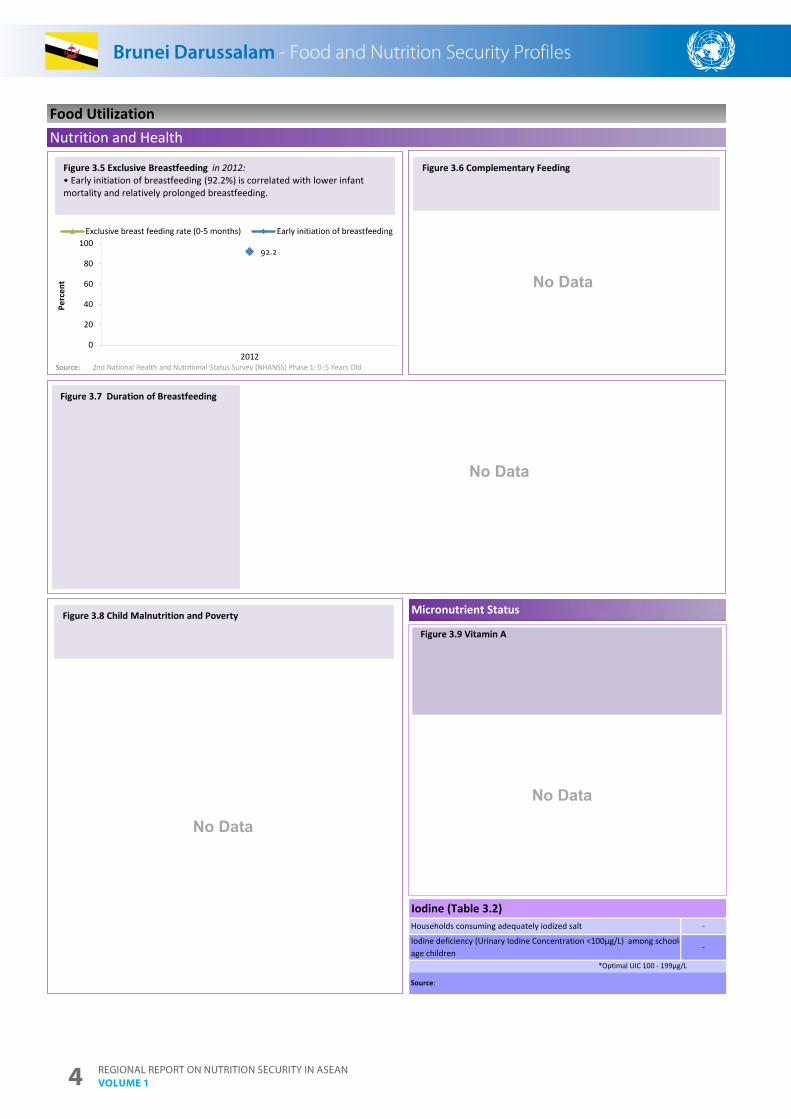
*Optimal UIC 100 - 199µg/L
Source:
-
Nutrition and Health
-Households consuming adequately iodized salt
Iodine deficiency (Urinary Iodine Concentration <100µg/L) among school-age children
Micronutrient Status
Iodine (Table 3.2)
Food Utilization
No Data
Figure 3.6 Complementary Feeding
No Data
92.2
0
20
40
60
80
100
2012
Perc
ent
Exclusive breast feeding rate (0-5 months) Early initiation of breastfeeding
Figure 3.5 Exclusive Breastfeeding
Source:
Figure 3.5 Exclusive Breastfeeding in 2012:• Early initiation of breastfeeding (92.2%) is correlated with lower infant mortality and relatively prolonged breastfeeding.
2nd National Health and Nutritional Status Survey (NHANSS) Phase 1: 0 -5 Years Old
Figure 3.7 Duration of Breastfeeding
No Data
Brunei Darussalam - Food and Nutrition Security Profiles
Figure 3.8 Child Malnutrition and Poverty
Figure 3.9 Vitamin A
No Data
Regional RepoRt on nutRition SecuRity in aSean Volume 1 5
Brunei Darussalam - Food and Nutrition Security Profiles
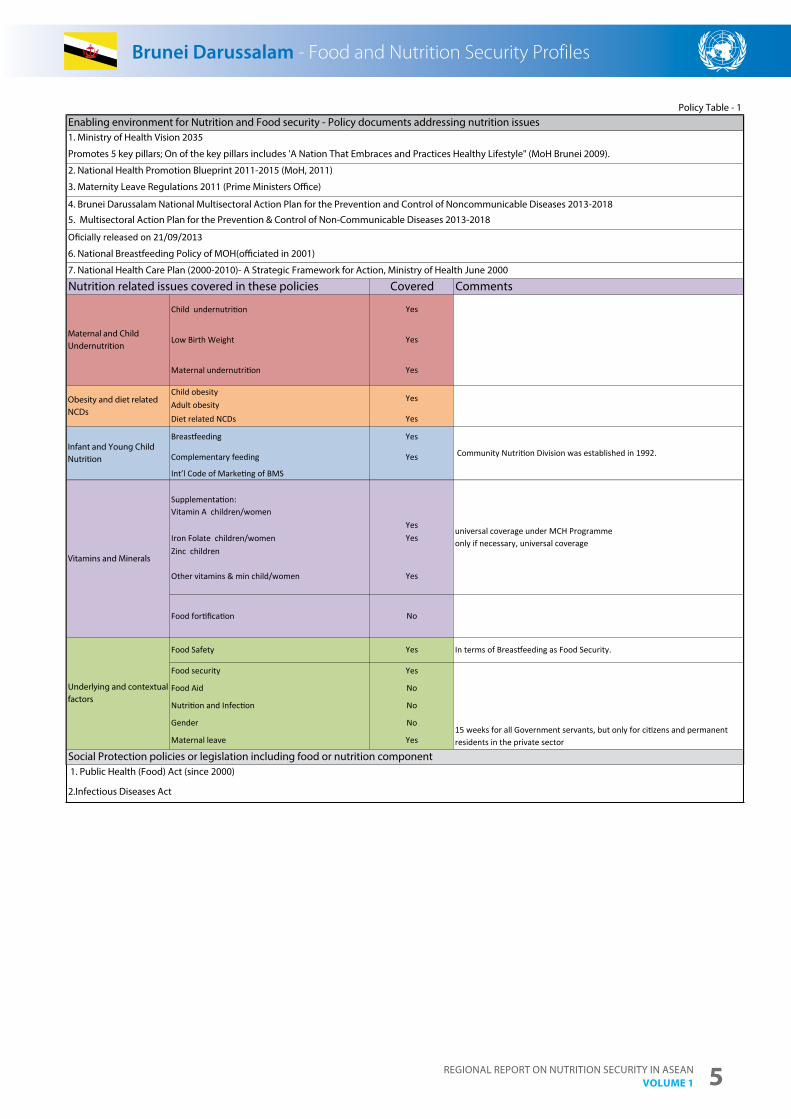
Social Protection policies or legislation including food or nutrition component 1. Public Health (Food) Act (since 2000)
2.Infectious Diseases Act
Underlying and contextual factors
Food Safety Yes In terms of Breastfeeding as Food Security.
Food security Yes
15 weeks for all Government servants, but only for citizens and permanent residents in the private sector
Food Aid No
Nutrition and Infection No
Gender No
Maternal leave Yes
Vitamins and Minerals
Supplementation:Vitamin A children/women
Yesuniversal coverage under MCH Programme only if necessary, universal coverageIron Folate children/women Yes
Zinc children
Other vitamins & min child/women Yes
Food fortification No
Maternal and Child Undernutrition
Child undernutrition Yes
Low Birth Weight Yes
Maternal undernutrition Yes
Obesity and diet related NCDs
Child obesityYes
Adult obesityDiet related NCDs Yes
Infant and Young Child Nutrition
Breastfeeding Yes
Community Nutrition Division was established in 1992.Complementary feeding Yes
Int’l Code of Marketing of BMS
Enabling environment for Nutrition and Food security - Policy documents addressing nutrition issues 1. Ministry of Health Vision 2035
Promotes 5 key pillars; On of the key pillars includes 'A Nation That Embraces and Practices Healthy Lifestyle" (MoH Brunei 2009).
2. National Health Promotion Blueprint 2011-2015 (MoH, 2011)
3. Maternity Leave Regulations 2011 (Prime Ministers O�ce)
4. Brunei Darussalam National Multisectoral Action Plan for the Prevention and Control of Noncommunicable Diseases 2013-2018
5. Multisectoral Action Plan for the Prevention & Control of Non-Communicable Diseases 2013-2018
Oficially released on 21/09/2013
6. National Breastfeeding Policy of MOH(o�ciated in 2001)
7. National Health Care Plan (2000-2010)- A Strategic Framework for Action, Ministry of Health June 2000
Nutrition related issues covered in these policies Covered Comments
Policy Table - 1
Brunei Darussalam - Food and Nutrition Security Pro�les
Regional RepoRt on nutRition SecuRity in aSean Volume 16
Brunei Darussalam - Food and Nutrition Security Profiles
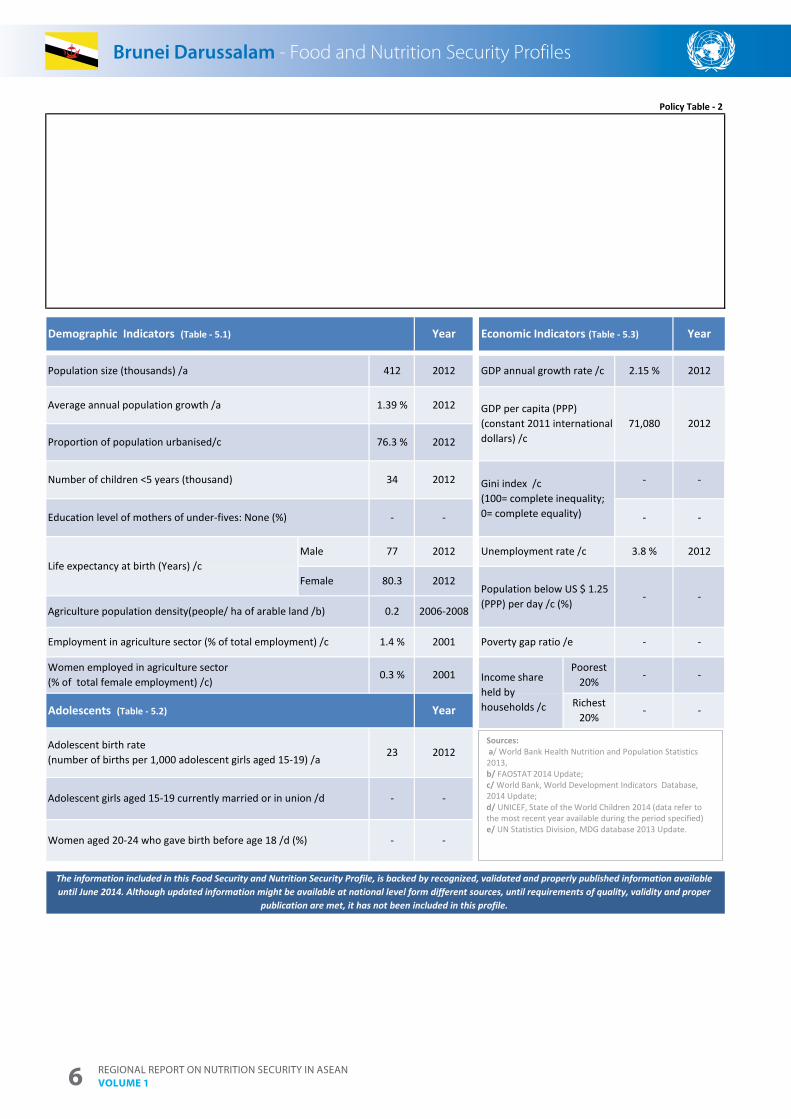
-
GDP per capita (PPP) (constant 2011 international dollars) /c
- -
Income share held by households /c
Unemployment rate /c 3.8 % 2012
Poverty gap ratio /e - -
Poorest 20%
-
The information included in this Food Security and Nutrition Security Profile, is backed by recognized, validated and properly published information available until June 2014. Although updated information might be available at national level form different sources, until requirements of quality, validity and proper
publication are met, it has not been included in this profile.
Demographic Indicators (Table - 5.1)
Population size (thousands) /a
Economic Indicators (Table - 5.3)Year
34 2012
76.3 % 2012
Year
412 2012
Richest 20%
-
- -
Gini index /c(100= complete inequality; 0= complete equality)
0.2
71,080 2012
Population below US $ 1.25 (PPP) per day /c (%)
- -
2012
Women aged 20-24 who gave birth before age 18 /d (%) - -
Male 77 2012
Adolescent birth rate (number of births per 1,000 adolescent girls aged 15-19) /a
23 2012
Adolescent girls aged 15-19 currently married or in union /d - -
Female
Adolescents (Table - 5.2)
1.4 % 2001
80.3 2012
Agriculture population density(people/ ha of arable land /b)
Employment in agriculture sector (% of total employment) /c
Women employed in agriculture sector (% of total female employment) /c)
Year
2012
2006-2008
Number of children <5 years (thousand)
GDP annual growth rate /c 2.15 %
Proportion of population urbanised/c
-
Education level of mothers of under-fives: None (%) - -
0.3 % 2001
Policy Table - 2
Life expectancy at birth (Years) /c
Average annual population growth /a 1.39 %
Brunei Darussalam - Food and Nutrition Security Profiles
Sources:a/ World Bank Health Nutrition and Population Statistics
2013,b/ FAOSTAT 2014 Update; c/ World Bank, World Development Indicators Database, 2014 Update; d/ UNICEF, State of the World Children 2014 (data refer to the most recent year available during the period specified) e/ UN Statistics Division, MDG database 2013 Update.
Regional RepoRt on nutRition SecuRity in aSean Volume 1 7
Cambodia - Food and Nutrition Security Profiles
* BMI values calculated using adult cut off points, population < 20 should be analyzed using WHO growth reference for school aged children and adolescents
Key Indicators
Anthropometry (Table 1.1)
Underweight women (BMI < 18.5 kg/m2)
Overweight adults (BMI >= 25 kg/m2)
Source: DHS 2010
2010
2010
2010
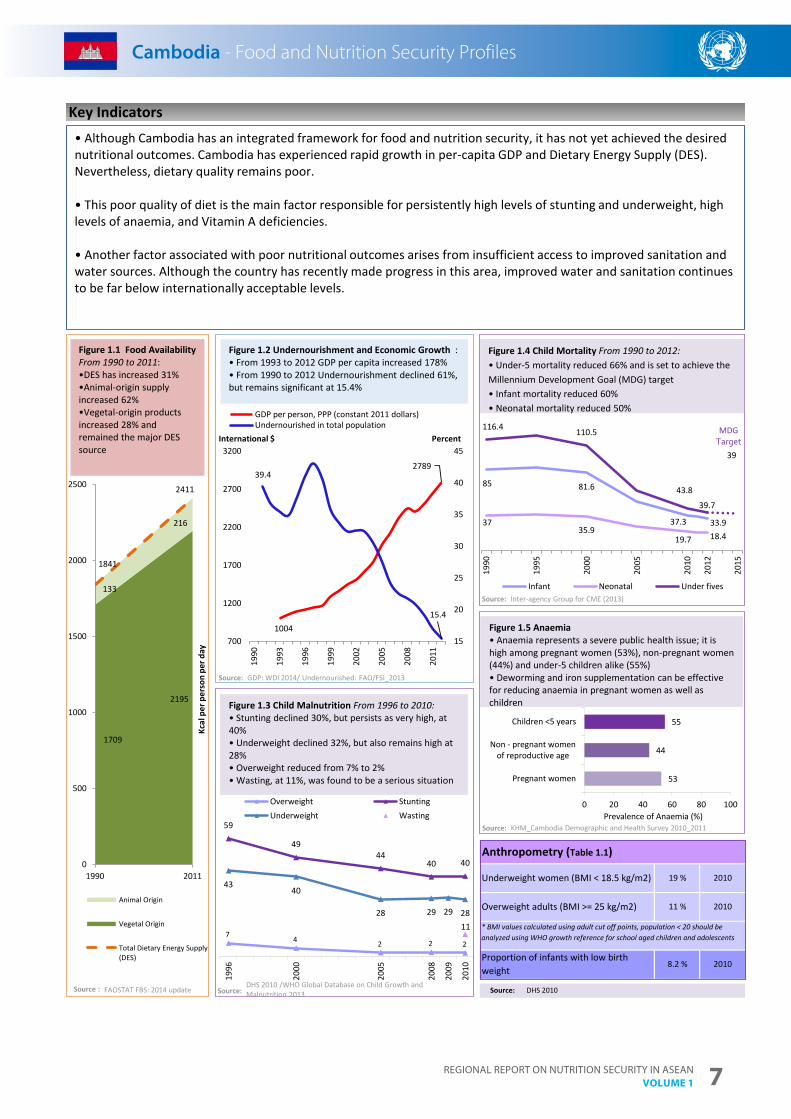
19 %
11 %
8.2 %Proportion of infants with low birth weight
1004
278939.4
15.4
15
20
25
30
35
40
45
700
1200
1700
2200
2700
3200
1990
1993
1996
1999
2002
2005
2008
2011
GDP per person, PPP (constant 2011 dollars)Undernourished in total population
7 4 2 2 2
59
4944
40 40
4340
28 29 29 2811
1996
2000
2005
2008
2009
2010
Overweight StuntingUnderweight Wasting
Source:
Figure 1.3 Child Malnutrition From 1996 to 2010:• Stunting declined 30%, but persists as very high, at 40% • Underweight declined 32%, but also remains high at 28%• Overweight reduced from 7% to 2%• Wasting, at 11%, was found to be a serious situation
• Although Cambodia has an integrated framework for food and nutrition security, it has not yet achieved the desired nutritional outcomes. Cambodia has experienced rapid growth in per-capita GDP and Dietary Energy Supply (DES). Nevertheless, dietary quality remains poor.
• This poor quality of diet is the main factor responsible for persistently high levels of stunting and underweight, high levels of anaemia, and Vitamin A deficiencies.
• Another factor associated with poor nutritional outcomes arises from insufficient access to improved sanitation and water sources. Although the country has recently made progress in this area, improved water and sanitation continues to be far below internationally acceptable levels.
53
44
55
0 20 40 60 80 100
Pregnant women
Non - pregnant womenof reproductive age
Children <5 years
Total <2 yr
Prevalence of Anaemia (%)
1709
2195
133
216
1841
2411
0
500
1000
1500
2000
2500
1990 2011
Kcal
per
per
son
per d
ay
Animal Origin
Vegetal Origin
Total Dietary Energy Supply(DES)
Figure 1.1 Food Availability From 1990 to 2011: •DES has increased 31% •Animal-origin supply increased 62% •Vegetal-origin products increased 28% and remained the major DES source
85 81.6
37.3 33.93735.9
19.7 18.4
116.4 110.5
43.8
39.7
39
1990
1995
2000
2005
2010
2012
2015
Infant Neonatal Under fives
Cambodia - Food and Nutrition Security Profiles
Figure 1.5 Anaemia • Anaemia represents a severe public health issue; it is high among pregnant women (53%), non-pregnant women (44%) and under-5 children alike (55%)• Deworming and iron supplementation can be effective for reducing anaemia in pregnant women as well as children
Figure 1.4 Child Mortality From 1990 to 2012:• Under-5 mortality reduced 66% and is set to achieve the Millennium Development Goal (MDG) target• Infant mortality reduced 60%• Neonatal mortality reduced 50%
Figure 1.2 Undernourishment and Economic Growth :• From 1993 to 2012 GDP per capita increased 178%• From 1990 to 2012 Undernourishment declined 61%, but remains significant at 15.4%
MDGTargetPercentInternational $
Source:
Source:
Source:
Source : FAOSTAT FBS: 2014 updateDHS 2010 /WHO Global Database on Child Growth and Malnutrition 2013
GDP: WDI 2014/ Undernourished: FAO/FSI_2013
Inter-agency Group for CME (2013)
KHM_Cambodia Demographic and Health Survey 2010_2011

Regional RepoRt on nutRition SecuRity in aSean Volume 18
Cambodia - Food and Nutrition Security Profiles
• Although inflation was significant in 2008, food prices dropped that year. However, by 2009 food prices had returned to the usual trend, which follows the general rate of inflation. • Families spend more than 70% of their income on food. While cereals contribute 63% of daily food intake; they only comprise 16% of food expenditures at household level
Food Availability / Food Access
Food Availability
Figure 2.3 Share of food expenditure
•The main food commodities contributed to more than 80% of DES• DES = 2,411 Kcal in 2011• Cereals remained the most important source of food energy (68%), with rice comprising 63%• Sugars and syrups expanded 733%, vegetable oils increased 350%, pulses increased 380%, and starchy roots rose 214% ; dietary diversity remains a challenge • A lack of fat in the diet contributes to poor absorption of Vitamin A and other fat-soluble micronutrients
Access to foodFigure 2.2 Economic access to foodGeneral and food inflation
(2009)
28
10
13
22
30
58
21
98
0
1461
1527
88
48
17
74
135
57
175
124
19
1520
1644
Starchy roots
Pulses
Animal fats
Fish & Fish products
Vegetable oils
Fruits & vegetables
Sugars and syrups
Meat & Milk & Eggs
Wheat
Rice
Cereals
0 400 800 1,200 1,600 2,000
2011 1990
Source:
(kcal/person/year) Total dietary energy supply= 2,411 (2011)
Cambodia - Food and Nutrition Security Profiles
Figure 2.1 Food supply by food group From 1990 to 2011:
03
-40
-30
-20
-10
0
10
20
30
2000
2001
2002
2003
2004
2005
2006
2007
2008
2009
2010
2011
2012
General inflation
Food inflation
Source:
14 11
15
6
0
2
1
4
16
3
9
2
16 71
29
0
20
40
60
80
100
% Total expenditure per personper day
% Dietry energy Consumption
Perc
ent
Non food items
Cereals
Fruits andvegetables
Fish
Sugars
Veg oils
Meat, milk andeggs
Other
Sources:
Percent
ILOSTAT Database Consumer Price Indices 2014
UN_FAO Food Balance Sheets_2014 Update
UN_FAO RAP based on national HIES, ECS, SES, HLSS_2013 Update, Cambodia
Regional RepoRt on nutRition SecuRity in aSean Volume 1 9
Cambodia - Food and Nutrition Security Profiles
Management of Diarrhoea (Table 3.1)
Water and Sanitation
Food Utilization
Zinc
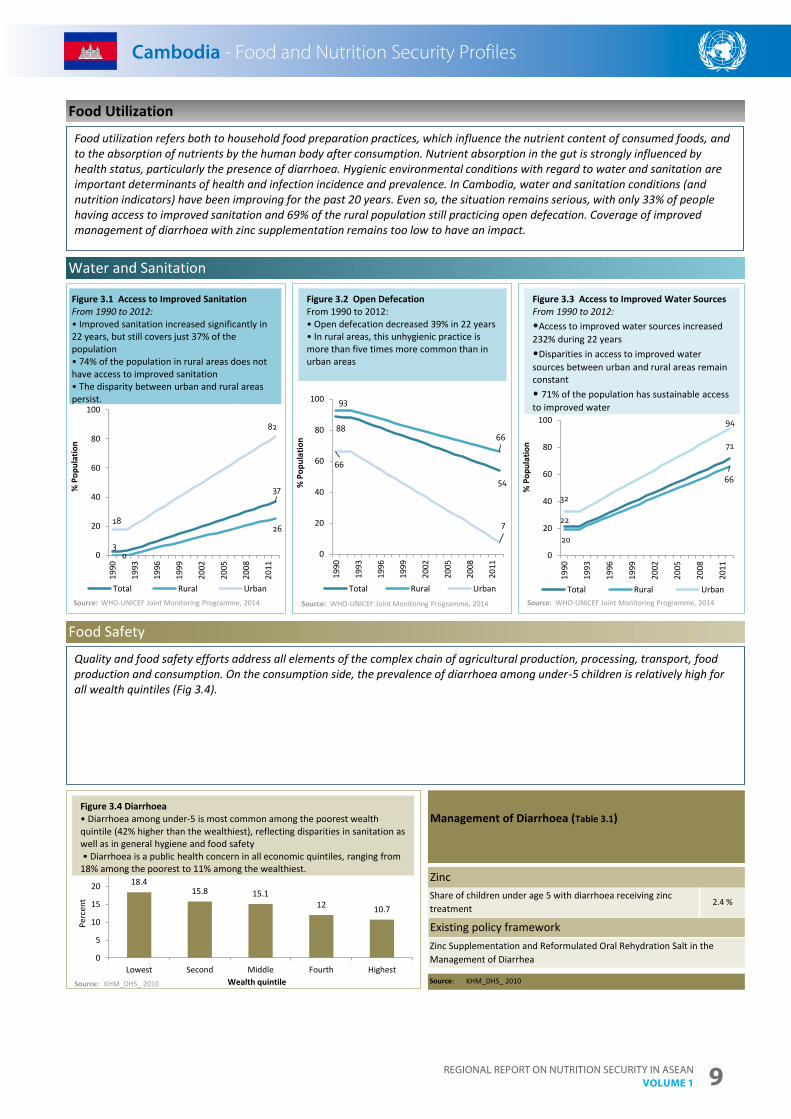
Existing policy frameworkZinc Supplementation and Reformulated Oral Rehydration Salt in the Management of Diarrhea
Source:
2.4 %Share of children under age 5 with diarrhoea receiving zinc treatment
Food Safety
88
54
93
66
66
7
0
20
40
60
80
100
1990
1993
1996
1999
2002
2005
2008
2011
% P
opul
atio
n
Total Rural Urban
3
37
0
2618
82
0
20
40
60
80
100
1990
1993
1996
1999
2002
2005
2008
2011
% P
opul
atio
n
Total Rural Urban
18.415.8 15.1
12 10.7
0
5
10
15
20
25
Lowest Second Middle Fourth Highest
Perc
ent
Wealth quintileSource: KHM_DHS_ 2010
22
71
20
66
32
94
0
20
40
60
80
100
1990
1993
1996
1999
2002
2005
2008
2011
% P
opul
atio
n
Total Rural UrbanSource:
Cambodia - Food and Nutrition Security Profiles
Figure 3.1 Access to Improved SanitationFrom 1990 to 2012:• Improved sanitation increased significantly in 22 years, but still covers just 37% of the population• 74% of the population in rural areas does not have access to improved sanitation • The disparity between urban and rural areas persist.
Source: Source:
Food utilization refers both to household food preparation practices, which influence the nutrient content of consumed foods, and to the absorption of nutrients by the human body after consumption. Nutrient absorption in the gut is strongly influenced by health status, particularly the presence of diarrhoea. Hygienic environmental conditions with regard to water and sanitation areimportant determinants of health and infection incidence and prevalence. In Cambodia, water and sanitation conditions (and nutrition indicators) have been improving for the past 20 years. Even so, the situation remains serious, with only 33% of peoplehaving access to improved sanitation and 69% of the rural population still practicing open defecation. Coverage of improved management of diarrhoea with zinc supplementation remains too low to have an impact.
Figure 3.4 Diarrhoea• Diarrhoea among under-5 is most common among the poorest wealth quintile (42% higher than the wealthiest), reflecting disparities in sanitation as well as in general hygiene and food safety• Diarrhoea is a public health concern in all economic quintiles, ranging from
18% among the poorest to 11% among the wealthiest.
Figure 3.2 Open DefecationFrom 1990 to 2012:• Open defecation decreased 39% in 22 years• In rural areas, this unhygienic practice is more than five times more common than in urban areas
Figure 3.3 Access to Improved Water Sources From 1990 to 2012:•Access to improved water sources increased 232% during 22 years•Disparities in access to improved water sources between urban and rural areas remain constant • 71% of the population has sustainable access to improved water
Quality and food safety efforts address all elements of the complex chain of agricultural production, processing, transport, food production and consumption. On the consumption side, the prevalence of diarrhoea among under-5 children is relatively high for all wealth quintiles (Fig 3.4).
WHO-UNICEF Joint Monitoring Programme, 2014 WHO-UNICEF Joint Monitoring Programme, 2014 WHO-UNICEF Joint Monitoring Programme, 2014
KHM_DHS_ 2010
Regional RepoRt on nutRition SecuRity in aSean Volume 110
Cambodia - Food and Nutrition Security Profiles
*Optimal UIC 100 - 199µg/L
Micronutrient Status
Iodine (Table 3.2)
Food Utilization
82.7 %Households consuming adequately iodized salt (2010)/a
Iodine deficiency (Urinary Iodine Concentration <100µg/L) among school-age children
-
Nutrition and Health
Source: a/KHM_Cambodia Demographic Health Survey 2010
98
22.30
25
50
75
100
Perc
ent
Vitamin A Supplementation Coverage - full – children 6-59 months /a
Vitamin A Deficiency (Pre-School Aged Children)<0.7umoL /b
28
79
34
88
0 20 40 60 80 100
Minimum acceptable diet
Minimum meal frequency
Minimum dietary diversity
Introduction of solid, semi-solid or softfood
Percent
Source:
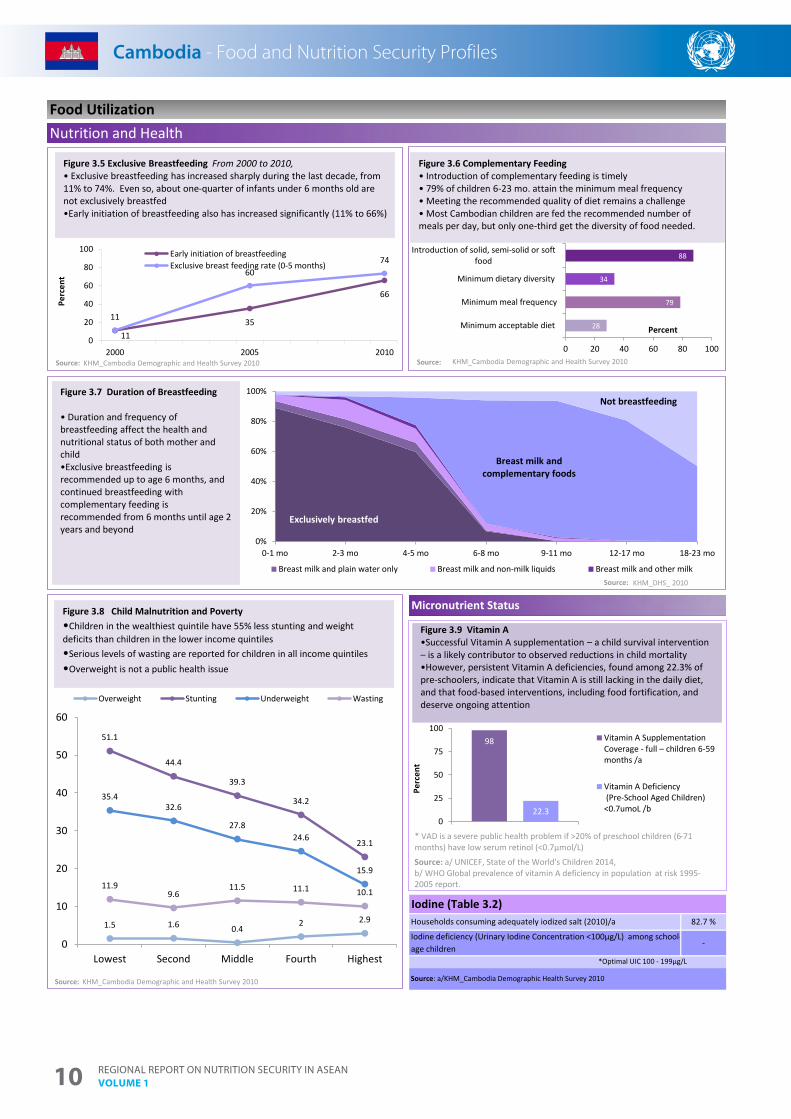
Figure 3.6 Complementary Feeding • Introduction of complementary feeding is timely• 79% of children 6-23 mo. attain the minimum meal frequency• Meeting the recommended quality of diet remains a challenge• Most Cambodian children are fed the recommended number of meals per day, but only one-third get the diversity of food needed.
1135
66
11
6074
0
20
40
60
80
100
2000 2005 2010
Perc
ent
Early initiation of breastfeedingExclusive breast feeding rate (0-5 months)
Source:
Figure 3.5 Exclusive Breastfeeding From 2000 to 2010, • Exclusive breastfeeding has increased sharply during the last decade, from 11% to 74%. Even so, about one-quarter of infants under 6 months old are not exclusively breastfed•Early initiation of breastfeeding also has increased significantly (11% to 66%)
Exclusively breastfed
Breast milk and complementary foods
Not breastfeeding
0%
20%
40%
60%
80%
100%
0-1 mo 2-3 mo 4-5 mo 6-8 mo 9-11 mo 12-17 mo 18-23 mo
Breast milk and plain water only Breast milk and non-milk liquids Breast milk and other milk
Figure 3.7 Duration of Breastfeeding
• Duration and frequency of breastfeeding affect the health and nutritional status of both mother and child •Exclusive breastfeeding is recommended up to age 6 months, and continued breastfeeding with complementary feeding is recommended from 6 months until age 2 years and beyond
Source:
Cambodia - Food and Nutrition Security Profiles
Figure 3.8 Child Malnutrition and Poverty •Children in the wealthiest quintile have 55% less stunting and weight deficits than children in the lower income quintiles•Serious levels of wasting are reported for children in all income quintiles •Overweight is not a public health issue
Figure 3.9 Vitamin A•Successful Vitamin A supplementation – a child survival intervention – is a likely contributor to observed reductions in child mortality •However, persistent Vitamin A deficiencies, found among 22.3% of pre-schoolers, indicate that Vitamin A is still lacking in the daily diet, and that food-based interventions, including food fortification, and deserve ongoing attention
Source: a/ UNICEF, State of the World's Children 2014,b/ WHO Global prevalence of vitamin A deficiency in population at risk 1995-2005 report.
* VAD is a severe public health problem if >20% of preschool children (6-71 months) have low serum retinol (<0.7µmol/L)
1.5 1.6 0.42 2.9
51.1
44.4
39.3
34.2
23.1
35.432.6
27.824.6
15.9
11.99.6
11.5 11.1 10.1
0
10
20
30
40
50
60
Lowest Second Middle Fourth Highest
Overweight Stunting Underweight Wasting
KHM_Cambodia Demographic and Health Survey 2010 KHM_Cambodia Demographic and Health Survey 2010
KHM_DHS_ 2010
Source: KHM_Cambodia Demographic and Health Survey 2010

Regional RepoRt on nutRition SecuRity in aSean Volume 1 11
Cambodia - Food and Nutrition Security Profiles
Policy Table - 1Enabling environment for Nutrition and Food security - Policy documents addressing nutrition issues 1. Prime Minister Circular on Food Security and Nutrition (1999, 2003)
2. Cambodia Nutrition Investment Plan 20053. Strategic Framework for Food Security and Nutrition in Cambodia 2008-2012, Council for Agricultural and Rural Development (CARD) of Council of Ministers 2008CARD given the mandate to develop implementable strategy by Prime Minister at 2012 National Seminar on Nutrition.http://www.foodsecurity.gov.kh/otherdocs/SFrameworkFSN-Eng.pdf4. National Policy on Infant and Young Child Feeding, Ministry of Health 2008 (National Nutrition Programme)
5. National Nutrition Strategy 2009-2015, Ministry of Health 2009 Overall goal of reducing maternal and child morbidity and mortality by improving nutritional status of women and children; one of the key results is increased allocation of resources in the area of food security and nutrition
6. Health Strategic Plan II 2008-2015, Ministry of Health 2008
7. Cambodia Child Survival Strategy 2006-2015, Ministry of Health 2006 M&E by Ministry of Health
8. National Policy and Guidelines for Micronutrient Supplementation to Prevent and Control Deficiencies, Ministry of Health 2011 Updates and replaces previous policies and guidelines on Vitamin A and anaemia
9. Sub-Decree on the Management of Iodized Salt Exploitation 2003; Prakas Iodized Salt 2004; Joint Prakas on Iodized Salt 2004
M&E by National Subcommittee on Food Fortification
10. National Vitamin A Policy Guidelines, Ministry of Health 2007 M&E by National Nutrition Programme, Ministry of Health
11. Joint Prakas on Implementation of Sub-Decree on Marketing of Products for Infant and Young Child Feeding -, Ministry of Health 2007; Sub-Decree on Marketing of Products for Infant and Young Child Feeding, Ministry of Health 2005; MoH Circular on Infant and Young Child Feeding 2007 Adopted by Ministry of Health, Ministry of Commerce, Ministry of Information and Ministry of Industry, Mines and Energy, 2007. M&E by The four line ministries 12. IYCF Communication Strategy 2005, Vitamin A Communication Strategy 2008, Complementary Feeding Communication Strategy 2011, IFA Communication Strategy 2010, Salt Iodization Advocacy Plan 2008 13. National Interim Guidelines for the Management of Acute Malnutrition 2011
14. Baby Friendly Community Initiative Implementation Guidelines 2009
15. National Policy on the Control of Acute Respiratory Infection and Diarrheal Disease, 2012
Nutrition related issues covered in these policies Covered Comments
Maternal and Child Undernutrition
Child undernutrition yes
Covers stunting, wasting and underweight.Low Birth Weight yes
Maternal undernutrition yes
Obesity and diet related NCDs
Child obesity bothAdult obesityDiet related NCDs yes
Infant and Young Child Nutrition
Breastfeeding yesInfant and Young Child Feeding (IYCF)policy 2008 includes IYCF in emergencies Adoption of many provisions of Int’l Code on BMS; cover ban on marketing for children up to 24 months old Campaign to promote Complementary Feeding in Cambodia 2011-13Complementary feeding yes
Int’l Code of Marketing of BMS yes
Vitamins and Minerals
Supplementation:Vitamin A children/women
yes
Vitamin A Supplementation guidelines for children 6-59 mo. and postpartum women updated in 2007; nationwide Vitamin A campaigns Deworming for children 12-59 mo. twice a year; nationwide Gov. services delivery at community level – outpatient. Deworming for pregnant and lactating women under iron folic acid (IFA) guidelinesAdoption of policy to use zinc with Oral Rehydration Salts in management of diarrhoea (2011)MN supplementation guidelines for children and women part of the national policy and guidelines (2011)IFA supplementation policy 2007 – health-facility based: 90 IFA tablets (pregnancy) and 42 tablets (postpartum) Recommendation for weekly IF A to women of reproductive age
Iron Folate children/women yes
Zinc children yes
Other vitamins & min child/women yes
Food fortification yes Mandatory: Salt; Voluntary: Flour, Fish & Soy sauce;
Underlying and contextual factors
Food Safety yes Policies promote a multisectoral approach to nutritionAgriculture, food aid, and public works are how food security is primarily addressed Updated Integrated Management of Childhood Illness (IMCI) guidelines integrating malnutrition up to standardPolicy exists for universal access to safe drinking water and strategy for improved sanitation Maternity leave paid by employer at 50% of wages Provisions for nursing breaks after return to work are paid, but rarely occur in practice
Food security yes
Food Aid yes
Nutrition and Infection yes
Gender yes
Maternal leave 12 weeks
Cambodia - Food and Nutrition Security Profiles
Regional RepoRt on nutRition SecuRity in aSean Volume 112
Cambodia - Food and Nutrition Security Profiles
The information included in this Food Security and Nutrition Security Profile is backed by recognized, validated and properly published information available until June 2014. Although updated information might be available at national level form different sources, until requirements of quality, validity and proper
publication are met, it has not been included in this profile.
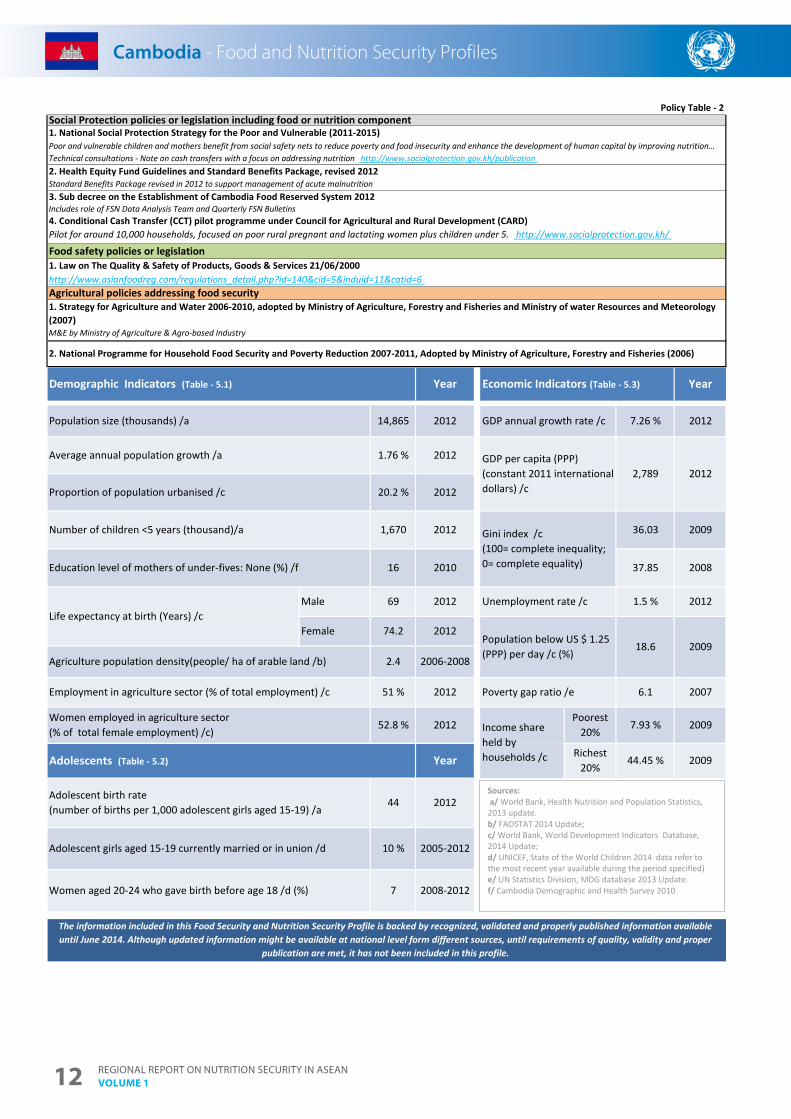
Education level of mothers of under-fives: None (%) /f 16 2010
52.8 % 2012
Policy Table - 2
Life expectancy at birth (Years) /c
Average annual population growth /a 1.76 % 2012
Proportion of population urbanised /c
Year
2.4 2006-2008
Number of children <5 years (thousand)/a
Women aged 20-24 who gave birth before age 18 /d (%) 7 2008-2012
Male 69 2012
Adolescent birth rate (number of births per 1,000 adolescent girls aged 15-19) /a
44 2012
Adolescent girls aged 15-19 currently married or in union /d 10 % 2005-2012
Female
Adolescents (Table - 5.2)
51 % 2012
74.2 2012
Agriculture population density(people/ ha of arable land /b)
Employment in agriculture sector (% of total employment) /c
Women employed in agriculture sector (% of total female employment) /c)
2008
Gini index /c(100= complete inequality; 0= complete equality)
GDP per capita (PPP) (constant 2011 international dollars) /c
2,789 2012
Richest 20%
44.45 % 2009
Income share held by households /c
Unemployment rate /c 1.5 % 2012
Population below US $ 1.25 (PPP) per day /c (%)
18.6 2009
Poverty gap ratio /e 6.1 2007
Poorest 20%
7.93 % 2009
GDP annual growth rate /c 7.26 % 2012
36.03 2009
37.85
Demographic Indicators (Table - 5.1)
Population size (thousands) /a
Economic Indicators (Table - 5.3)Year
1,670 2012
20.2 % 2012
Year
14,865 2012
Food safety policies or legislation1. Law on The Quality & Safety of Products, Goods & Services 21/06/2000 http://www.asianfoodreg.com/regulations_detail.php?id=140&cid=5&induid=11&catid=6 Agricultural policies addressing food security1. Strategy for Agriculture and Water 2006-2010, adopted by Ministry of Agriculture, Forestry and Fisheries and Ministry of water Resources and Meteorology (2007)M&E by Ministry of Agriculture & Agro-based Industry
2. National Programme for Household Food Security and Poverty Reduction 2007-2011, Adopted by Ministry of Agriculture, Forestry and Fisheries (2006)
Social Protection policies or legislation including food or nutrition component1. National Social Protection Strategy for the Poor and Vulnerable (2011-2015) Poor and vulnerable children and mothers benefit from social safety nets to reduce poverty and food insecurity and enhance the development of human capital by improving nutrition… Technical consultations - Note on cash transfers with a focus on addressing nutrition http://www.socialprotection.gov.kh/publication 2. Health Equity Fund Guidelines and Standard Benefits Package, revised 2012Standard Benefits Package revised in 2012 to support management of acute malnutrition3. Sub decree on the Establishment of Cambodia Food Reserved System 2012Includes role of FSN Data Analysis Team and Quarterly FSN Bulletins4. Conditional Cash Transfer (CCT) pilot programme under Council for Agricultural and Rural Development (CARD) Pilot for around 10,000 households, focused on poor rural pregnant and lactating women plus children under 5. http://www.socialprotection.gov.kh/
Cambodia - Food and Nutrition Security Profiles
Sources:a/ World Bank, Health Nutrition and Population Statistics,
2013 update.b/ FAOSTAT 2014 Update; c/ World Bank, World Development Indicators Database, 2014 Update; d/ UNICEF, State of the World Children 2014 data refer to the most recent year available during the period specified) e/ UN Statistics Division, MDG database 2013 Update.f/ Cambodia Demographic and Health Survey 2010
Regional RepoRt on nutRition SecuRity in aSean Volume 1 13
Indonesia - Food and Nutrition Security Profiles
Key Indicators
Anthropometry (Table 1.1)
Underweight women (BMI < 18.5 kg/m2)
Overweight adults (BMI >= 25 kg/m2)
* BMI values calculated using adult cut off points, population < 20 should be analyzed using WHO growth reference for school aged children and adolescents
Source: WHO BMI Database/ LBW DHS 2007 re-analyzed by UNICEF 2009
-
2001
2007
-
13.4 %
9 %Proportion of infants with low birth weight
4297
8856
22.2
9.1
5
10
15
20
25
4000
4500
5000
5500
6000
6500
7000
7500
8000
8500
9000
1990
1992
1994
1996
1998
2000
2002
2004
2006
2008
2010
2012
GDP per person, PPP (constant 2011 dollars)Undernourished in total population
2 25 11 12 12
4229 40
36 37
3027
26
23
25
2323
23
20
24
20
18 20
13 12
1992
1995
1998
1999
2000
2001
2002
2003
2004
2005
2007
2010
2013
Overweight StuntingUnderweight Wasting
Source:
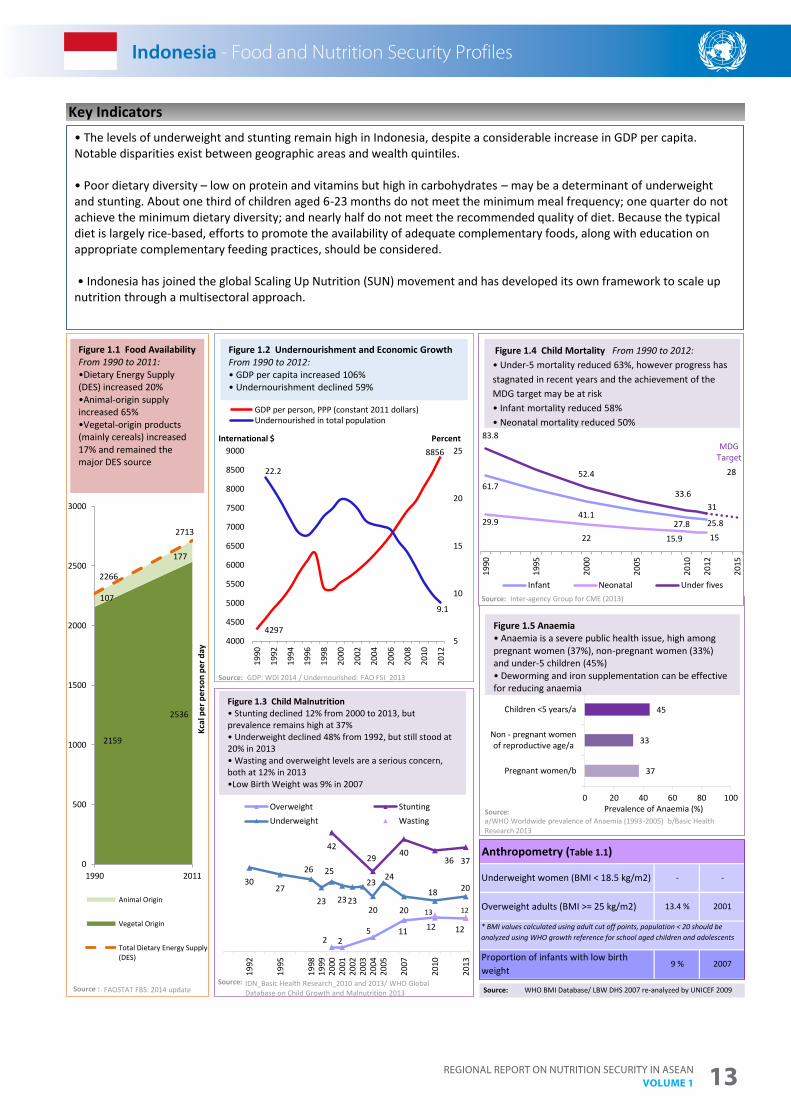
Figure 1.3 Child Malnutrition • Stunting declined 12% from 2000 to 2013, but prevalence remains high at 37%• Underweight declined 48% from 1992, but still stood at 20% in 2013• Wasting and overweight levels are a serious concern, both at 12% in 2013•Low Birth Weight was 9% in 2007
• The levels of underweight and stunting remain high in Indonesia, despite a considerable increase in GDP per capita. Notable disparities exist between geographic areas and wealth quintiles.
• Poor dietary diversity – low on protein and vitamins but high in carbohydrates – may be a determinant of underweight and stunting. About one third of children aged 6-23 months do not meet the minimum meal frequency; one quarter do not achieve the minimum dietary diversity; and nearly half do not meet the recommended quality of diet. Because the typical diet is largely rice-based, efforts to promote the availability of adequate complementary foods, along with education on appropriate complementary feeding practices, should be considered.
• Indonesia has joined the global Scaling Up Nutrition (SUN) movement and has developed its own framework to scale up nutrition through a multisectoral approach.
37
33
45
0 20 40 60 80 100
Pregnant women/b
Non - pregnant womenof reproductive age/a
Children <5 years/a
Total <2 yr
Prevalence of Anaemia (%)
2159
2536
107
177
2266
2713
0
500
1000
1500
2000
2500
3000
1990 2011
Kcal
per
per
son
per d
ay
Animal Origin
Vegetal Origin
Total Dietary Energy Supply(DES)
Figure 1.1 Food AvailabilityFrom 1990 to 2011: •Dietary Energy Supply (DES) increased 20% •Animal-origin supply increased 65% •Vegetal-origin products (mainly cereals) increased 17% and remained the major DES source
61.7
41.127.8 25.829.9
22 15.9 15
83.8
52.4
33.631
2819
90
1995
2000
2005
2010
2012
2015
Infant Neonatal Under fives
Indonesia - Food and Nutrition Security Profiles
Figure 1.5 Anaemia • Anaemia is a severe public health issue, high among pregnant women (37%), non-pregnant women (33%) and under-5 children (45%) • Deworming and iron supplementation can be effective for reducing anaemia
Figure 1.4 Child Mortality From 1990 to 2012:• Under-5 mortality reduced 63%, however progress has stagnated in recent years and the achievement of the MDG target may be at risk• Infant mortality reduced 58%• Neonatal mortality reduced 50%
Figure 1.2 Undernourishment and Economic Growth From 1990 to 2012: • GDP per capita increased 106%• Undernourishment declined 59%
MDGTarget
PercentInternational $
Source:
Source:
Source:
Source : FAOSTAT FBS: 2014 updateIDN_Basic Health Research_2010 and 2013/ WHO Global Database on Child Growth and Malnutrition 2013
GDP: WDI 2014 / Undernourished: FAO FSI_2013
Inter-agency Group for CME (2013)
a/WHO Worldwide prevalence of Anaemia (1993-2005) b/Basic Health Research 2013
Regional RepoRt on nutRition SecuRity in aSean Volume 114
Indonesia - Food and Nutrition Security Profiles
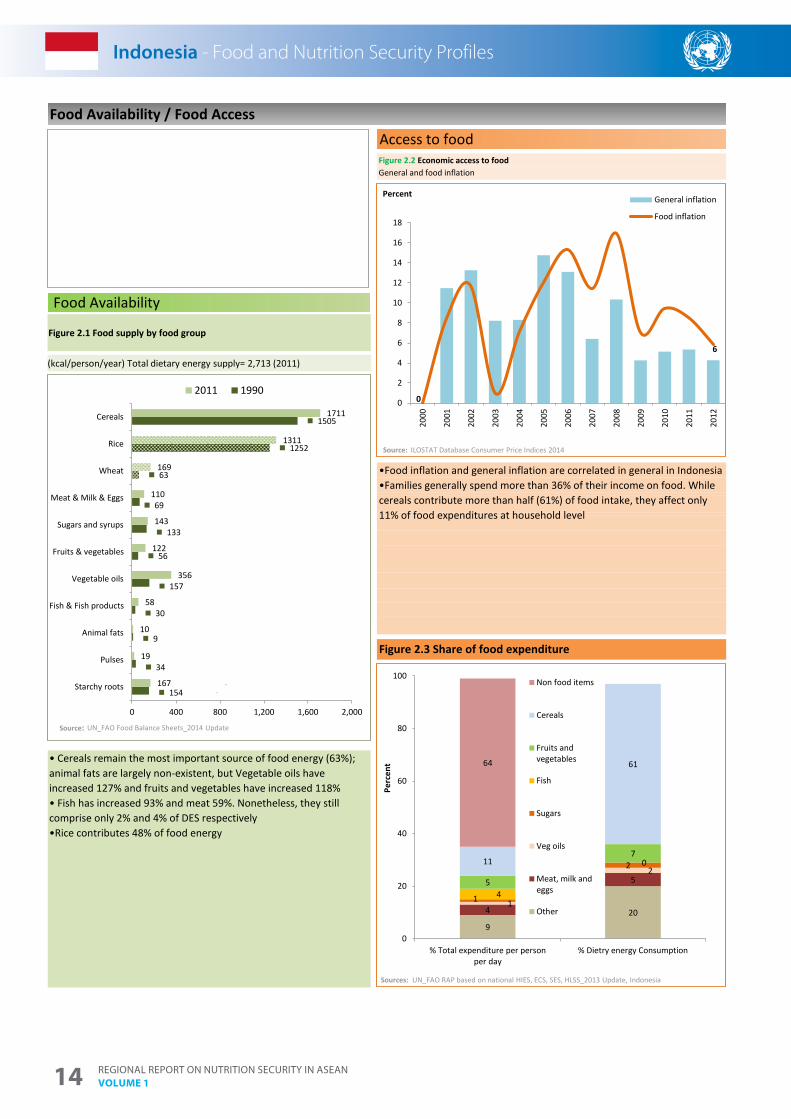
•Food inflation and general inflation are correlated in general in Indonesia •Families generally spend more than 36% of their income on food. While cereals contribute more than half (61%) of food intake, they affect only 11% of food expenditures at household level
Food Availability / Food Access
Food Availability
• Cereals remain the most important source of food energy (63%); animal fats are largely non-existent, but Vegetable oils have increased 127% and fruits and vegetables have increased 118%• Fish has increased 93% and meat 59%. Nonetheless, they still comprise only 2% and 4% of DES respectively •Rice contributes 48% of food energy
Access to foodFigure 2.2 Economic access to foodGeneral and food inflation
Figure 2.3 Share of food expenditure
154
34
9
30
157
56
133
69
63
1252
1505
167
19
10
58
356
122
143
110
169
1311
1711
Starchy roots
Pulses
Animal fats
Fish & Fish products
Vegetable oils
Fruits & vegetables
Sugars and syrups
Meat & Milk & Eggs
Wheat
Rice
Cereals
0 400 800 1,200 1,600 2,000
2011 1990
Source:
(kcal/person/year) Total dietary energy supply= 2,713 (2011)
Indonesia - Food and Nutrition Security Profiles
Figure 2.1 Food supply by food group
0
6
0
2
4
6
8
10
12
14
16
18
2000
2001
2002
2003
2004
2005
2006
2007
2008
2009
2010
2011
2012
General inflation
Food inflation
Source:
9204
5
1
2
1
2
4
0
5
711
6164
0
20
40
60
80
100
% Total expenditure per personper day
% Dietry energy Consumption
Perc
ent
Non food items
Cereals
Fruits andvegetables
Fish
Sugars
Veg oils
Meat, milk andeggs
Other
Sources:
Percent
ILOSTAT Database Consumer Price Indices 2014
UN_FAO Food Balance Sheets_2014 Update
UN_FAO RAP based on national HIES, ECS, SES, HLSS_2013 Update, Indonesia
Regional RepoRt on nutRition SecuRity in aSean Volume 1 15
Indonesia - Food and Nutrition Security Profiles
Management of Diarrhoea (Table 3.1) • No data are available on whether children receive zinc supplementation following an episode of diarrhoea
Water and Sanitation
Food Utilization
Zinc Supplementation and Reformulated Oral Rehydration Salt in the Management of Diarrhea
Source: IDN_Indonesia Demographic and Health Survey 2012
1.1 %Share of children under age 5 with diarrhoea receiving zinc treatment
Food Safety
Zinc
Existing policy framework
40
22
50
31
19
140
20
40
60
80
100
1990
1993
1996
1999
2002
2005
2008
2011
% P
opul
atio
n
Total Rural Urban
35
59
24
46
61
71
0
20
40
60
80
100
1990
1993
1996
1999
2002
2005
2008
2011
% P
opul
atio
n
Total Rural Urban
16.9 15.5 15 13.410.4
05
10152025
Lowest Second Middle Fourth Highest
Perc
ent
Wealth quintile
Source: IDN_Indonesia Demographic and Health Survey 2012
7085
61
76
9093
0
20
40
60
80
100
1990
1993
1996
1999
2002
2005
2008
2011
% P
opul
atio
n
Total Rural UrbanSource:
Indonesia - Food and Nutrition Security Profiles
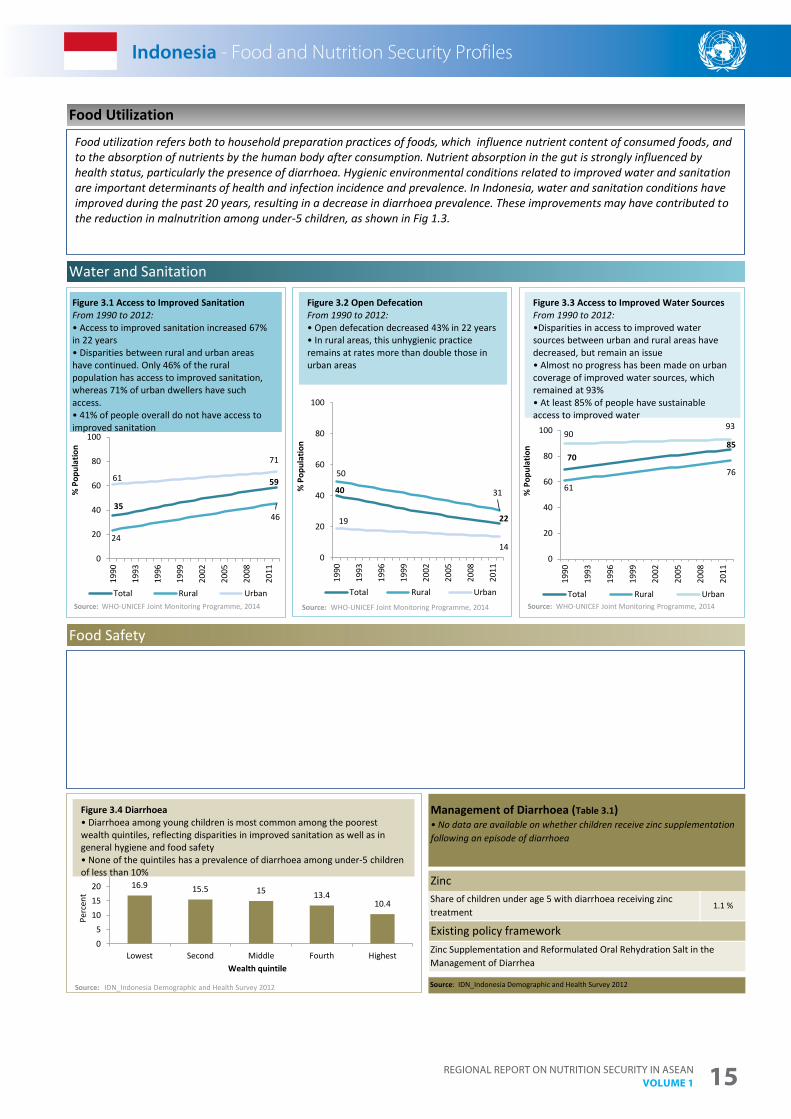
Figure 3.1 Access to Improved Sanitation From 1990 to 2012:• Access to improved sanitation increased 67% in 22 years• Disparities between rural and urban areas have continued. Only 46% of the rural population has access to improved sanitation, whereas 71% of urban dwellers have such access. • 41% of people overall do not have access to improved sanitation
Source: Source:
Food utilization refers both to household preparation practices of foods, which influence nutrient content of consumed foods, and to the absorption of nutrients by the human body after consumption. Nutrient absorption in the gut is strongly influenced by health status, particularly the presence of diarrhoea. Hygienic environmental conditions related to improved water and sanitation are important determinants of health and infection incidence and prevalence. In Indonesia, water and sanitation conditions have improved during the past 20 years, resulting in a decrease in diarrhoea prevalence. These improvements may have contributed to the reduction in malnutrition among under-5 children, as shown in Fig 1.3.
Figure 3.4 Diarrhoea• Diarrhoea among young children is most common among the poorest wealth quintiles, reflecting disparities in improved sanitation as well as in general hygiene and food safety• None of the quintiles has a prevalence of diarrhoea among under-5 children of less than 10%
Figure 3.2 Open DefecationFrom 1990 to 2012:• Open defecation decreased 43% in 22 years• In rural areas, this unhygienic practice remains at rates more than double those in urban areas
Figure 3.3 Access to Improved Water Sources From 1990 to 2012:•Disparities in access to improved water sources between urban and rural areas have decreased, but remain an issue • Almost no progress has been made on urban coverage of improved water sources, which remained at 93%• At least 85% of people have sustainable access to improved water
WHO-UNICEF Joint Monitoring Programme, 2014 WHO-UNICEF Joint Monitoring Programme, 2014 WHO-UNICEF Joint Monitoring Programme, 2014
Regional RepoRt on nutRition SecuRity in aSean Volume 116
Indonesia - Food and Nutrition Security Profiles
*Optimal UIC 100 - 199µg/L
Micronutrient Status
Iodine (Table 3.2)
Food Utilization
77.1 %Households consuming adequately iodized salt (2013)
Iodine deficiency (Urinary Iodine Concentration <100µg/L) among school-age children (2013)
14.9 %
Nutrition and Health
Source: IDN Basic Health Research 2013
75.5
19.60
25
50
75
100
Perc
ent
Vitamin A Supplementation Coverage - full – children 6-59 months /a
Vitamin A Deficiency (Pre-School Aged Children)<0.7umoL /b
37
58
66
91
0 20 40 60 80 100
Minimum acceptable diet
Minimum dietary diversity
Minimum meal frequency
Introduction of solid, semi-solid or …
PercentSource:
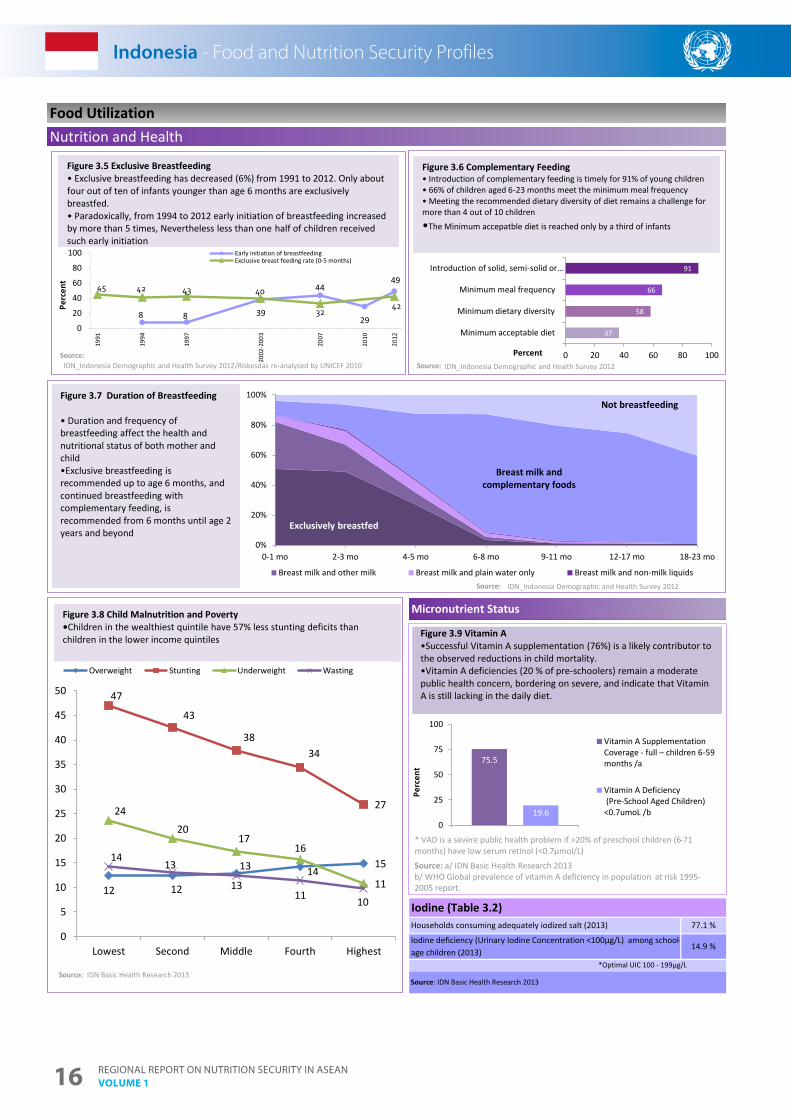
Figure 3.6 Complementary Feeding • Introduction of complementary feeding is timely for 91% of young children• 66% of children aged 6-23 months meet the minimum meal frequency• Meeting the recommended dietary diversity of diet remains a challenge for more than 4 out of 10 children•The Minimum accepatble diet is reached only by a third of infants
8 8 39
44
29
4945 42 43 40
3242
0
20
40
60
80
100
1991
1994
1997
2002
-200
3
2007
2010
2012
Perc
ent
Early initiation of breastfeedingExclusive breast feeding rate (0-5 months)
Source:
Figure 3.5 Exclusive Breastfeeding • Exclusive breastfeeding has decreased (6%) from 1991 to 2012. Only about four out of ten of infants younger than age 6 months are exclusively breastfed.• Paradoxically, from 1994 to 2012 early initiation of breastfeeding increased by more than 5 times, Nevertheless less than one half of children received such early initiation
Exclusively breastfed
Breast milk and complementary foods
Not breastfeeding
0%
20%
40%
60%
80%
100%
0-1 mo 2-3 mo 4-5 mo 6-8 mo 9-11 mo 12-17 mo 18-23 mo
Breast milk and other milk Breast milk and plain water only Breast milk and non-milk liquids
Figure 3.7 Duration of Breastfeeding
• Duration and frequency of breastfeeding affect the health and nutritional status of both mother and child •Exclusive breastfeeding is recommended up to age 6 months, and continued breastfeeding with complementary feeding, is recommended from 6 months until age 2 years and beyond
Source:
Indonesia - Food and Nutrition Security Profiles
Figure 3.8 Child Malnutrition and Poverty •Children in the wealthiest quintile have 57% less stunting deficits than children in the lower income quintiles Figure 3.9 Vitamin A
•Successful Vitamin A supplementation (76%) is a likely contributor to the observed reductions in child mortality. •Vitamin A deficiencies (20 % of pre-schoolers) remain a moderate public health concern, bordering on severe, and indicate that Vitamin A is still lacking in the daily diet.
Source: a/ IDN Basic Health Research 2013b/ WHO Global prevalence of vitamin A deficiency in population at risk 1995-2005 report.
* VAD is a severe public health problem if >20% of preschool children (6-71 months) have low serum retinol (<0.7µmol/L)
12 12
13 1415
47
43
3834
2724
2017
16
11
1413
1311 10
0
5
10
15
20
25
30
35
40
45
50
Lowest Second Middle Fourth Highest
Overweight Stunting Underweight Wasting
Source: IDN Basic Health Research 2013
IDN_Indonesia Demographic and Health Survey 2012/Riskesdas re-analyzed by UNICEF 2010 IDN_Indonesia Demographic and Health Survey 2012
IDN_Indonesia Demographic and Health Survey 2012
Regional RepoRt on nutRition SecuRity in aSean Volume 1 17
Indonesia - Food and Nutrition Security Profiles
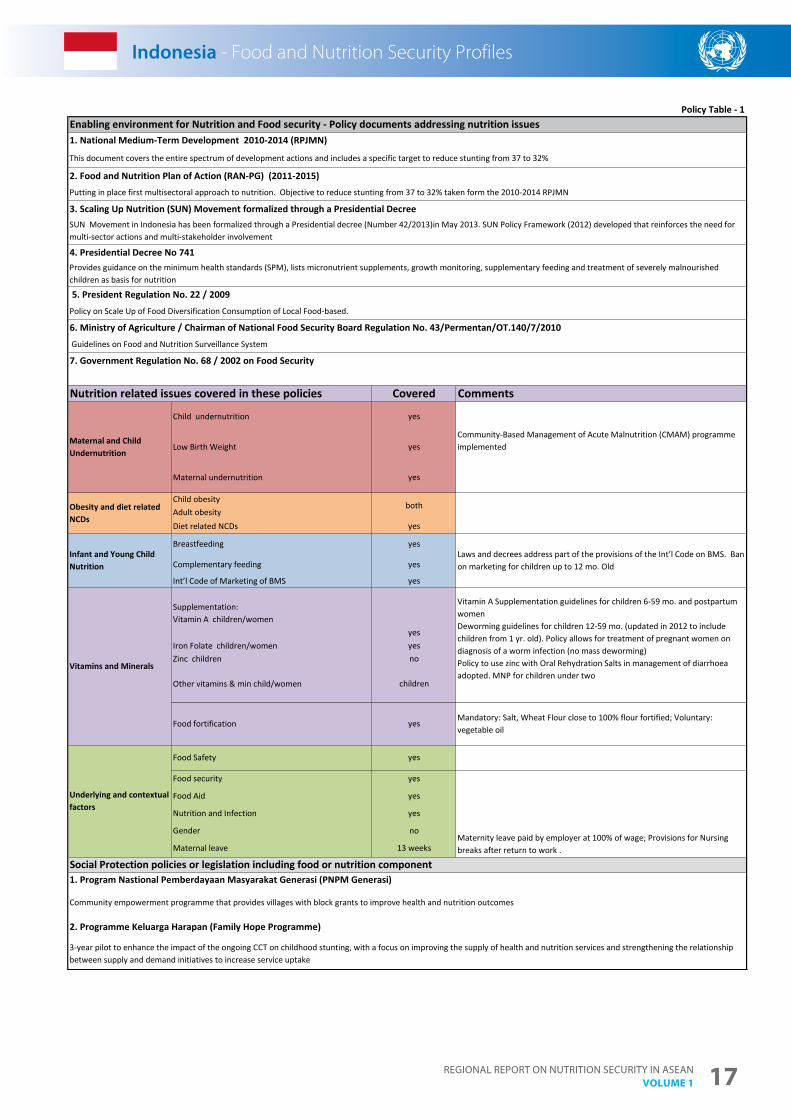
5. President Regulation No. 22 / 2009 Policy on Scale Up of Food Diversification Consumption of Local Food-based.
6. Ministry of Agriculture / Chairman of National Food Security Board Regulation No. 43/Permentan/OT.140/7/2010 Guidelines on Food and Nutrition Surveillance System
Social Protection policies or legislation including food or nutrition component1. Program Nastional Pemberdayaan Masyarakat Generasi (PNPM Generasi)
Community empowerment programme that provides villages with block grants to improve health and nutrition outcomes
Vitamins and Minerals
Supplementation:Vitamin A children/women
yes
Vitamin A Supplementation guidelines for children 6-59 mo. and postpartum women Deworming guidelines for children 12-59 mo. (updated in 2012 to include children from 1 yr. old). Policy allows for treatment of pregnant women on diagnosis of a worm infection (no mass deworming) Policy to use zinc with Oral Rehydration Salts in management of diarrhoea adopted. MNP for children under two
Iron Folate children/women yesZinc children no
Other vitamins & min child/women children
Underlying and contextual factors
Food Safety yes
Food security yes
Maternity leave paid by employer at 100% of wage; Provisions for Nursing breaks after return to work .
Food Aid yes
Nutrition and Infection yes
Gender no
Maternal leave 13 weeks
2. Programme Keluarga Harapan (Family Hope Programme)
3-year pilot to enhance the impact of the ongoing CCT on childhood stunting, with a focus on improving the supply of health and nutrition services and strengthening the relationship between supply and demand initiatives to increase service uptake
Food fortification yesMandatory: Salt, Wheat Flour close to 100% flour fortified; Voluntary: vegetable oil
Obesity and diet related NCDs
Child obesityAdult obesityDiet related NCDs yes
Infant and Young Child Nutrition
Breastfeeding yesLaws and decrees address part of the provisions of the Int’l Code on BMS. Ban on marketing for children up to 12 mo. OldComplementary feeding yes
Int’l Code of Marketing of BMS yes
both
Nutrition related issues covered in these policies Covered Comments
Maternal and Child Undernutrition
Child undernutrition yes
Community-Based Management of Acute Malnutrition (CMAM) programme implementedLow Birth Weight yes
Maternal undernutrition yes
Policy Table - 1
Provides guidance on the minimum health standards (SPM), lists micronutrient supplements, growth monitoring, supplementary feeding and treatment of severely malnourished children as basis for nutrition
Enabling environment for Nutrition and Food security - Policy documents addressing nutrition issues 1. National Medium-Term Development 2010-2014 (RPJMN)
This document covers the entire spectrum of development actions and includes a specific target to reduce stunting from 37 to 32%
2. Food and Nutrition Plan of Action (RAN-PG) (2011-2015) Putting in place first multisectoral approach to nutrition. Objective to reduce stunting from 37 to 32% taken form the 2010-2014 RPJMN
3. Scaling Up Nutrition (SUN) Movement formalized through a Presidential DecreeSUN Movement in Indonesia has been formalized through a Presidential decree (Number 42/2013)in May 2013. SUN Policy Framework (2012) developed that reinforces the need for multi-sector actions and multi-stakeholder involvement
4. Presidential Decree No 741
7. Government Regulation No. 68 / 2002 on Food Security
Indonesia - Food and Nutrition Security Profiles
Regional RepoRt on nutRition SecuRity in aSean Volume 118
Indonesia - Food and Nutrition Security Profiles
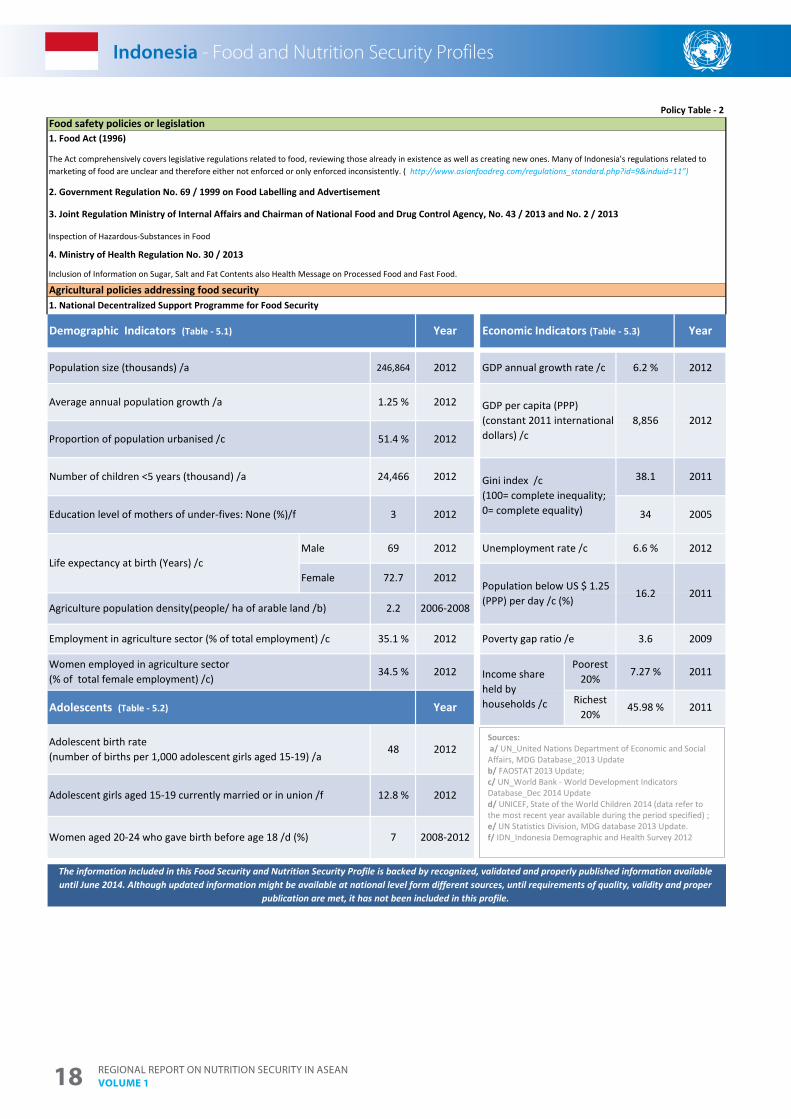
1. Food Act (1996)
The Act comprehensively covers legislative regulations related to food, reviewing those already in existence as well as creating new ones. Many of Indonesia's regulations related to marketing of food are unclear and therefore either not enforced or only enforced inconsistently. ( http://www.asianfoodreg.com/regulations_standard.php?id=9&induid=11”)
4. Ministry of Health Regulation No. 30 / 2013
3. Joint Regulation Ministry of Internal Affairs and Chairman of National Food and Drug Control Agency, No. 43 / 2013 and No. 2 / 2013
Inspection of Hazardous-Substances in Food
Food safety policies or legislation
2. Government Regulation No. 69 / 1999 on Food Labelling and Advertisement
Inclusion of Information on Sugar, Salt and Fat Contents also Health Message on Processed Food and Fast Food.
Agricultural policies addressing food security1. National Decentralized Support Programme for Food Security
2012
Policy Table - 2
Life expectancy at birth (Years) /c
Women aged 20-24 who gave birth before age 18 /d (%) 7 2008-2012
Male 69 2012
Adolescent birth rate (number of births per 1,000 adolescent girls aged 15-19) /a
48 2012
Adolescent girls aged 15-19 currently married or in union /f 12.8 % 2012
Female
Adolescents (Table - 5.2)
35.1 % 2012
72.7 2012
Agriculture population density(people/ ha of arable land /b)
Employment in agriculture sector (% of total employment) /c
Women employed in agriculture sector (% of total female employment) /c)
Year
2.2
34.5 %
2006-2008
38.1
2012
Population below US $ 1.25 (PPP) per day /c (%)
16.2 2011
Poverty gap ratio /e 3.6 2009
Poorest 20%
7.27 % 2011
The information included in this Food Security and Nutrition Security Profile is backed by recognized, validated and properly published information available until June 2014. Although updated information might be available at national level form different sources, until requirements of quality, validity and proper
publication are met, it has not been included in this profile.
Demographic Indicators (Table - 5.1)
Population size (thousands) /a
Economic Indicators (Table - 5.3)Year Year
246,864 2012 6.2 % 2012GDP annual growth rate /c
Richest 20%
45.98 % 2011
Income share held by households /c
Unemployment rate /c 6.6 %
2011
34 2005
Gini index /c(100= complete inequality; 0= complete equality)
GDP per capita (PPP) (constant 2011 international dollars) /c
8,856 2012
Education level of mothers of under-fives: None (%)/f 3 2012
Average annual population growth /a 1.25 % 2012
Proportion of population urbanised /c 51.4 % 2012
Number of children <5 years (thousand) /a 24,466 2012
Indonesia - Food and Nutrition Security Profiles
Sources:a/ UN_United Nations Department of Economic and Social
Affairs, MDG Database_2013 Updateb/ FAOSTAT 2013 Update; c/ UN_World Bank - World Development Indicators Database_Dec 2014 Updated/ UNICEF, State of the World Children 2014 (data refer to the most recent year available during the period specified) ;e/ UN Statistics Division, MDG database 2013 Update.f/ IDN_Indonesia Demographic and Health Survey 2012
Regional RepoRt on nutRition SecuRity in aSean Volume 1 19
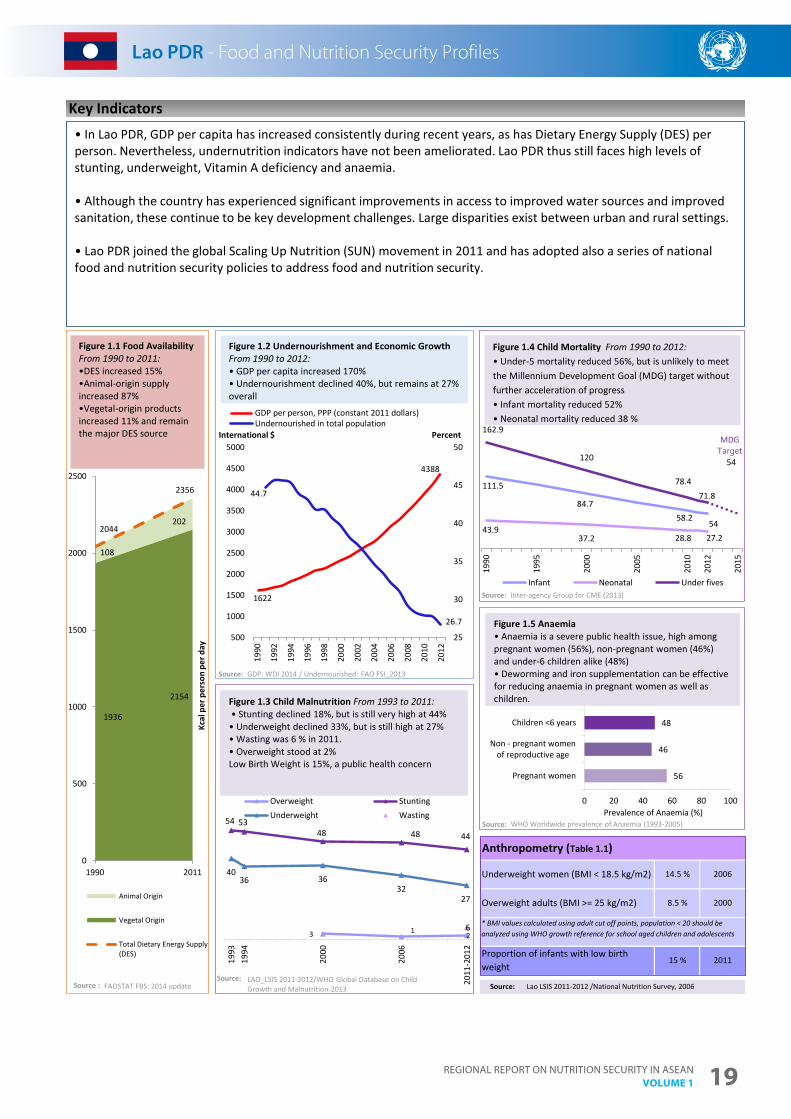
Lao PDR - Food and Nutrition Security Profiles
* BMI values calculated using adult cut off points, population < 20 should be analyzed using WHO growth reference for school aged children and adolescents
2006
2000
2011
14.5 %
8.5 %
15 %Proportion of infants with low birth weight
Source: Lao LSIS 2011-2012 /National Nutrition Survey, 2006
Key Indicators
Anthropometry (Table 1.1)
Underweight women (BMI < 18.5 kg/m2)
Overweight adults (BMI >= 25 kg/m2)
1622
4388
44.7
26.7
25
30
35
40
45
50
500
1000
1500
2000
2500
3000
3500
4000
4500
5000
1990
1992
1994
1996
1998
2000
2002
2004
2006
2008
2010
2012
GDP per person, PPP (constant 2011 dollars)Undernourished in total population
3 12
54 5348 48 44
4036 36
3227
6
1993
1994
2000
2006
2011
-201
2
Overweight StuntingUnderweight Wasting
Source:
Figure 1.3 Child Malnutrition From 1993 to 2011:• Stunting declined 18%, but is still very high at 44%
• Underweight declined 33%, but is still high at 27%• Wasting was 6 % in 2011. • Overweight stood at 2% Low Birth Weight is 15%, a public health concern
• In Lao PDR, GDP per capita has increased consistently during recent years, as has Dietary Energy Supply (DES) per person. Nevertheless, undernutrition indicators have not been ameliorated. Lao PDR thus still faces high levels of stunting, underweight, Vitamin A deficiency and anaemia.
• Although the country has experienced significant improvements in access to improved water sources and improved sanitation, these continue to be key development challenges. Large disparities exist between urban and rural settings.
• Lao PDR joined the global Scaling Up Nutrition (SUN) movement in 2011 and has adopted also a series of national food and nutrition security policies to address food and nutrition security.
56
46
48
0 20 40 60 80 100
Pregnant women
Non - pregnant womenof reproductive age
Children <6 years
Total <2 yr
Prevalence of Anaemia (%)
1936
2154
108
2022044
2356
0
500
1000
1500
2000
2500
1990 2011
Kcal
per
per
son
per d
ay
Animal Origin
Vegetal Origin
Total Dietary Energy Supply(DES)
Figure 1.1 Food Availability From 1990 to 2011: •DES increased 15% •Animal-origin supply increased 87% •Vegetal-origin products increased 11% and remain the major DES source
111.5
84.758.2
5443.9
37.2 28.8 27.2
162.9
120
78.471.8
54
1990
1995
2000
2005
2010
2012
2015
Infant Neonatal Under fives
Laos - Food and Nutrition Security Profiles
Figure 1.5 Anaemia • Anaemia is a severe public health issue, high among pregnant women (56%), non-pregnant women (46%) and under-6 children alike (48%)• Deworming and iron supplementation can be effective for reducing anaemia in pregnant women as well as children.
Figure 1.4 Child Mortality From 1990 to 2012:• Under-5 mortality reduced 56%, but is unlikely to meet the Millennium Development Goal (MDG) target without further acceleration of progress• Infant mortality reduced 52%• Neonatal mortality reduced 38 %
Figure 1.2 Undernourishment and Economic Growth From 1990 to 2012: • GDP per capita increased 170%• Undernourishment declined 40%, but remains at 27% overall
MDGTarget
PercentInternational $
Source:
Source:
Source:
Source : FAOSTAT FBS: 2014 updateLAO_LSIS 2011-2012/WHO Global Database on Child Growth and Malnutrition 2013
GDP: WDI 2014 / Undernourished: FAO FSI_2013
Inter-agency Group for CME (2013)
WHO Worldwide prevalence of Anaemia (1993-2005)
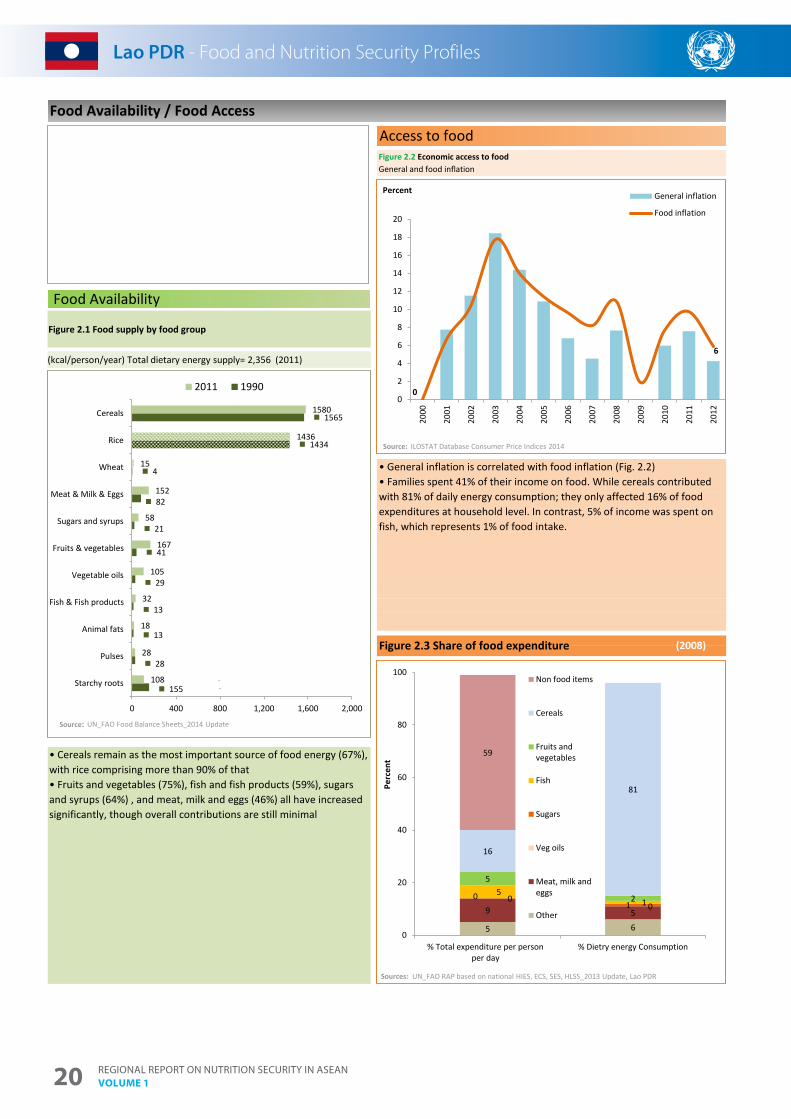
Regional RepoRt on nutRition SecuRity in aSean Volume 120
Lao PDR - Food and Nutrition Security Profiles
• Cereals remain as the most important source of food energy (67%), with rice comprising more than 90% of that • Fruits and vegetables (75%), fish and fish products (59%), sugars and syrups (64%) , and meat, milk and eggs (46%) all have increased significantly, though overall contributions are still minimal
Access to foodFigure 2.2 Economic access to foodGeneral and food inflation
(2008)Figure 2.3 Share of food expenditure
Food Availability
• General inflation is correlated with food inflation (Fig. 2.2) • Families spent 41% of their income on food. While cereals contributed with 81% of daily energy consumption; they only affected 16% of food expenditures at household level. In contrast, 5% of income was spent on fish, which represents 1% of food intake.
Food Availability / Food Access
155
28
13
13
29
41
21
82
4
1434
1565
108
28
18
32
105
167
58
152
15
1436
1580
Starchy roots
Pulses
Animal fats
Fish & Fish products
Vegetable oils
Fruits & vegetables
Sugars and syrups
Meat & Milk & Eggs
Wheat
Rice
Cereals
0 400 800 1,200 1,600 2,000
2011 1990
Source:
(kcal/person/year) Total dietary energy supply= 2,356 (2011)
Laos - Food and Nutrition Security Profiles
Figure 2.1 Food supply by food group
0
6
0
2
4
6
8
10
12
14
16
18
20
2000
2001
2002
2003
2004
2005
2006
2007
2008
2009
2010
2011
2012
General inflation
Food inflation
Source:
5 6
9 50
00
15
1
5
2
16
81
59
0
20
40
60
80
100
% Total expenditure per personper day
% Dietry energy Consumption
Perc
ent
Non food items
Cereals
Fruits andvegetables
Fish
Sugars
Veg oils
Meat, milk andeggs
Other
Sources:
Percent
ILOSTAT Database Consumer Price Indices 2014
UN_FAO Food Balance Sheets_2014 Update
UN_FAO RAP based on national HIES, ECS, SES, HLSS_2013 Update, Laos
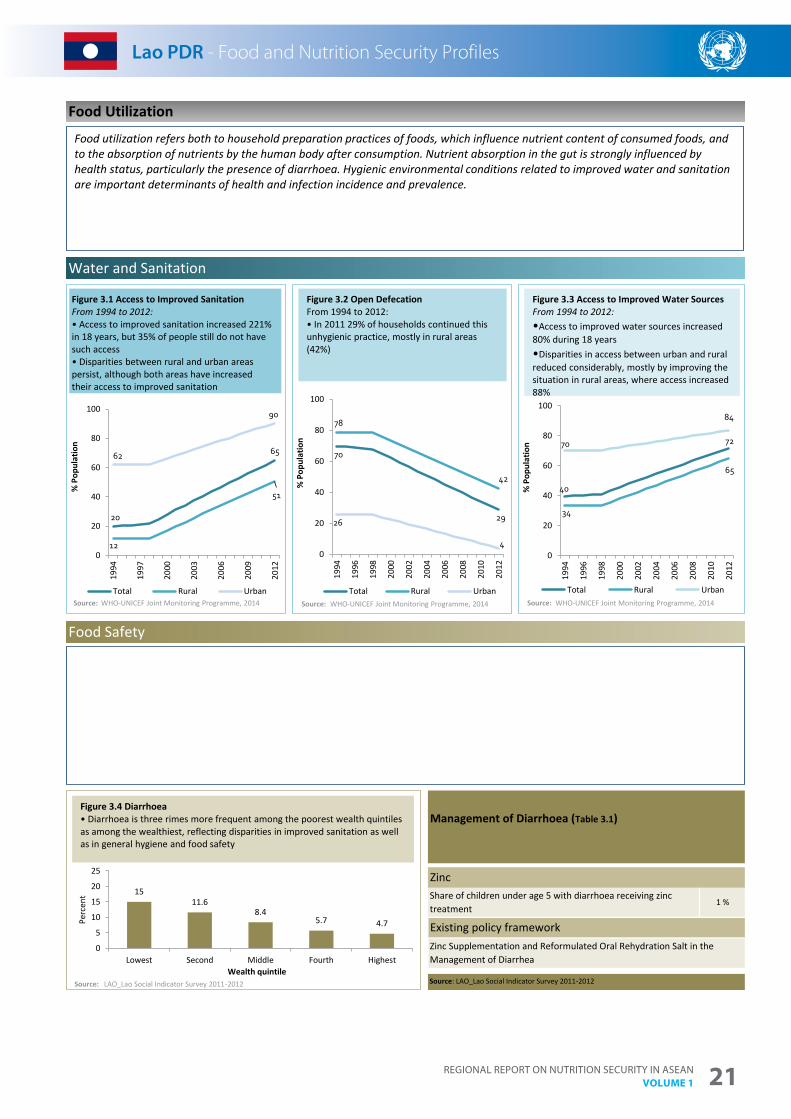
Regional RepoRt on nutRition SecuRity in aSean Volume 1 21
Lao PDR - Food and Nutrition Security Profiles
1 %Share of children under age 5 with diarrhoea receiving zinc treatment
Food Safety
Water and Sanitation
Food Utilization
Zinc
Existing policy frameworkZinc Supplementation and Reformulated Oral Rehydration Salt in the Management of Diarrhea
Source: LAO_Lao Social Indicator Survey 2011-2012
Management of Diarrhoea (Table 3.1)
70
29
78
42
26
40
20
40
60
80
100
1994
1996
1998
2000
2002
2004
2006
2008
2010
2012
% P
opul
atio
n
Total Rural Urban
20
65
12
51
62
90
0
20
40
60
80
100
1994
1997
2000
2003
2006
2009
2012
% P
opul
atio
n
Total Rural Urban
1511.6
8.45.7 4.7
0
5
10
15
20
25
Lowest Second Middle Fourth Highest
Perc
ent
Wealth quintileSource: LAO_Lao Social Indicator Survey 2011-2012
40
72
34
65
70
84
0
20
40
60
80
100
1994
1996
1998
2000
2002
2004
2006
2008
2010
2012
% P
opul
atio
n
Total Rural UrbanSource:
Laos - Food and Nutrition Security Profiles
Figure 3.1 Access to Improved SanitationFrom 1994 to 2012:• Access to improved sanitation increased 221% in 18 years, but 35% of people still do not have such access• Disparities between rural and urban areas persist, although both areas have increased their access to improved sanitation
Source: Source:
Food utilization refers both to household preparation practices of foods, which influence nutrient content of consumed foods, and to the absorption of nutrients by the human body after consumption. Nutrient absorption in the gut is strongly influenced by health status, particularly the presence of diarrhoea. Hygienic environmental conditions related to improved water and sanitation are important determinants of health and infection incidence and prevalence.
Figure 3.4 Diarrhoea • Diarrhoea is three rimes more frequent among the poorest wealth quintiles as among the wealthiest, reflecting disparities in improved sanitation as well as in general hygiene and food safety
Figure 3.2 Open Defecation From 1994 to 2012:• In 2011 29% of households continued this unhygienic practice, mostly in rural areas (42%)
Figure 3.3 Access to Improved Water Sources From 1994 to 2012:•Access to improved water sources increased 80% during 18 years•Disparities in access between urban and rural reduced considerably, mostly by improving the situation in rural areas, where access increased 88%
WHO-UNICEF Joint Monitoring Programme, 2014 WHO-UNICEF Joint Monitoring Programme, 2014 WHO-UNICEF Joint Monitoring Programme, 2014

Regional RepoRt on nutRition SecuRity in aSean Volume 122
Lao PDR - Food and Nutrition Security Profiles
*Optimal UIC 100 - 199µg/LSource: a/ LAO_Lao Social Indicator Survey 2011-2012 b/WHO Global database on idodine deficiency
26.9 %
Nutrition and Health
79.5 %Households consuming adequately iodized salt /a
Iodine deficiency (Urinary Iodine Concentration <100µg/L) among school-age children (2003) /b
Micronutrient Status
Iodine (Table 3.2)
Food Utilization
59.144.7
0
25
50
75
100
Perc
ent
Vitamin A Supplementation Coverage - full – children 6-59 months /a
Vitamin A Deficiency (Pre-School Aged Children)<0.7umoL /b
43
50
20 40 60
Minimum acceptable diet
Minimum meal frequency
Minimum dietary diversity
Introduction of solid, semi-solid or softfood
Percent
Source:
Figure 3.6 Complementary Feeding • Introduction of complementary feeding is timely for 50% of children• Only 43% of children aged 6-23 months meet the minimum meal frequency
32 30
3926
40
0
20
40
60
80
100
2000 2006 2011-2012
Perc
ent
Early initiation of breastfeedingExclusive breast feeding rate (0-5 months)
Source:
Figure 3.5 Exclusive Breastfeeding •Early initiation of breastfeeding increased from (32% to 39%) from 2000 to 2011• Exclusive breastfeeding have increased significantly, but still more than half of children don't exclusively breast fed from 0-5 months.
Exclusively breastfed
Breast milk and complementary foods
Not breastfeeding
0%
20%
40%
60%
80%
100%
0-1mo
2-3mo
4-5mo
6-7 mo 8-9 mo 10-11mo
12-13mo
14-15mo
16-17mo
18-19mo
20-21mo
22-23mo
Breast milk and other milk Breast milk and plain water only Breast milk and non-milk liquids
Figure 3.7 Duration of Breastfeeding • More than 50% of children continued to breastfed after age 2 years• Complementary feeding begins prior to age 6 months for a significant proportion of breastfed children
Source:
Laos - Food and Nutrition Security Profiles
Figure 3.8 Child Malnutrition and Poverty •Children in the poorest quintile have 3 times higher stunting and weight deficits than children in the waelthier quintile•Overweight is not a public health issue
Figure 3.9 Vitamin A • Vitamin A supplementation of 59% is not satisfactory and may be related to high vitamin A deficiency levels.• Vitamin A deficiencies still represent a severe public health concern at 45%, indicating that Vitamin A remains lacking in the daily diet, and that food-based interventions, including food fortification, deserve ongoing attention.
Source: a/ LAO_Lao Social Indicator Survey 2011-2012 b/ WHO Global prevalence of vitamin A deficiency in population at risk 1995-2005 report.
* VAD is a severe public health problem if >20% of preschool children (6-71 months) have low serum retinol (<0.7µmol/L)
2 2.5 1.7 2 2.1
60.6
50.2
41.9
31.7
19.7
36.5
29.6
25.2
19.4
12.1
6.4 6.4 5.8 5.2 5.1
0
10
20
30
40
50
60
70
Lowest Second Middle Fourth Highest
Overweight Stunting Underweight Wasting
LAO_Lao Social Indicator Survey 2011-2012 LAO_Lao Social Indicator Survey 2011-2012
LAO_Lao Social Indicator Survey 2011-2012
Source: LAO_Lao Social Indicator Survey 2011-2012
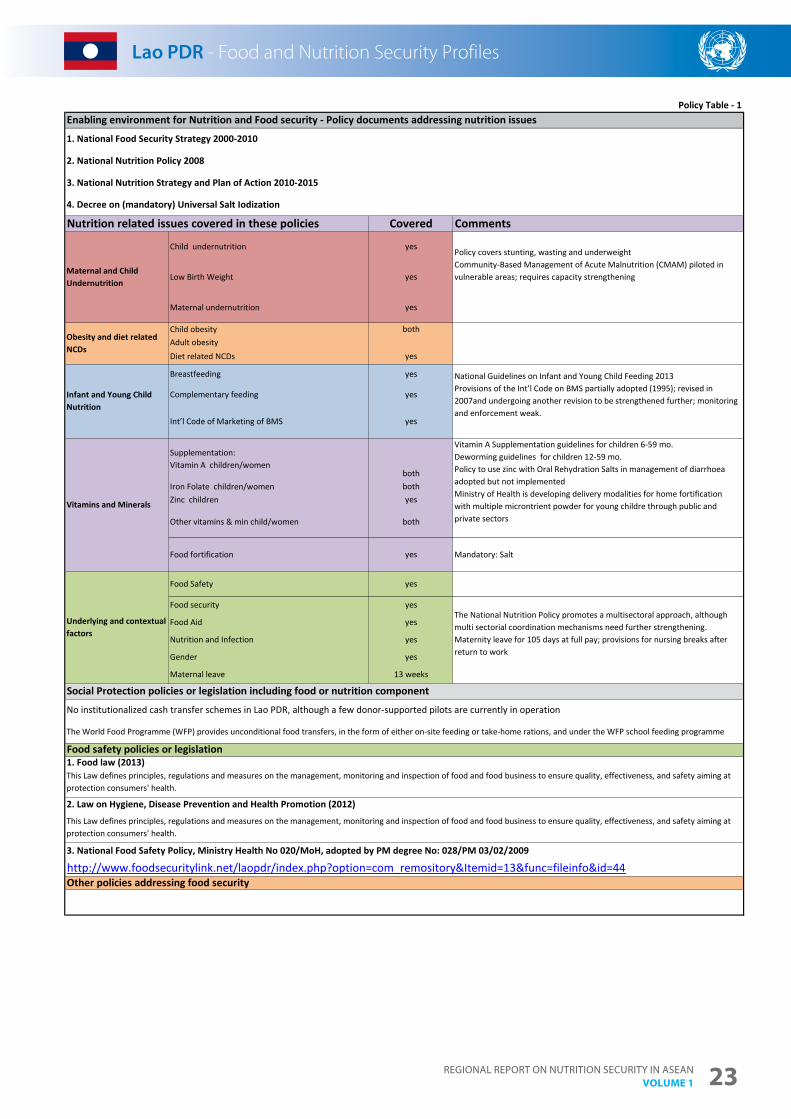
Regional RepoRt on nutRition SecuRity in aSean Volume 1 23
Lao PDR - Food and Nutrition Security Profiles
Enabling environment for Nutrition and Food security - Policy documents addressing nutrition issues
1. National Food Security Strategy 2000-2010
2. National Nutrition Policy 2008
3. National Nutrition Strategy and Plan of Action 2010-2015
4. Decree on (mandatory) Universal Salt Iodization
Nutrition related issues covered in these policies Covered Comments
yesPolicy covers stunting, wasting and underweightCommunity-Based Management of Acute Malnutrition (CMAM) piloted in vulnerable areas; requires capacity strengtheningLow Birth Weight yes
Policy Table - 1
Maternal undernutrition yes
Obesity and diet related NCDs
Child obesity bothAdult obesityDiet related NCDs yes
Maternal and Child Undernutrition
Child undernutrition
Social Protection policies or legislation including food or nutrition component
No institutionalized cash transfer schemes in Lao PDR, although a few donor-supported pilots are currently in operation
The World Food Programme (WFP) provides unconditional food transfers, in the form of either on-site feeding or take-home rations, and under the WFP school feeding programme
Infant and Young Child Nutrition
Breastfeeding yes National Guidelines on Infant and Young Child Feeding 2013Provisions of the Int’l Code on BMS partially adopted (1995); revised in 2007and undergoing another revision to be strengthened further; monitoring and enforcement weak.
Complementary feeding yes
Int’l Code of Marketing of BMS yes
Vitamins and Minerals
Supplementation:Vitamin A children/women
both
Vitamin A Supplementation guidelines for children 6-59 mo. Deworming guidelines for children 12-59 mo. Policy to use zinc with Oral Rehydration Salts in management of diarrhoea adopted but not implementedMinistry of Health is developing delivery modalities for home fortification with multiple microntrient powder for young childre through public and private sectors
Iron Folate children/women bothZinc children yes
Other vitamins & min child/women both
Food fortification yes Mandatory: Salt
Food safety policies or legislation
3. National Food Safety Policy, Ministry Health No 020/MoH, adopted by PM degree No: 028/PM 03/02/2009
http://www.foodsecuritylink.net/laopdr/index.php?option=com_remository&Itemid=13&func=fileinfo&id=44Other policies addressing food security
Underlying and contextual factors
Food Safety yes
Food security yesThe National Nutrition Policy promotes a multisectoral approach, although multi sectorial coordination mechanisms need further strengthening.Maternity leave for 105 days at full pay; provisions for nursing breaks after return to work
Food Aid yes
Nutrition and Infection yes
Gender yes
Maternal leave 13 weeks
1. Food law (2013) This Law defines principles, regulations and measures on the management, monitoring and inspection of food and food business to ensure quality, effectiveness, and safety aiming at protection consumers' health.
2. Law on Hygiene, Disease Prevention and Health Promotion (2012)
This Law defines principles, regulations and measures on the management, monitoring and inspection of food and food business to ensure quality, effectiveness, and safety aiming at protection consumers' health.
Laos - Food and Nutrition Security Profiles
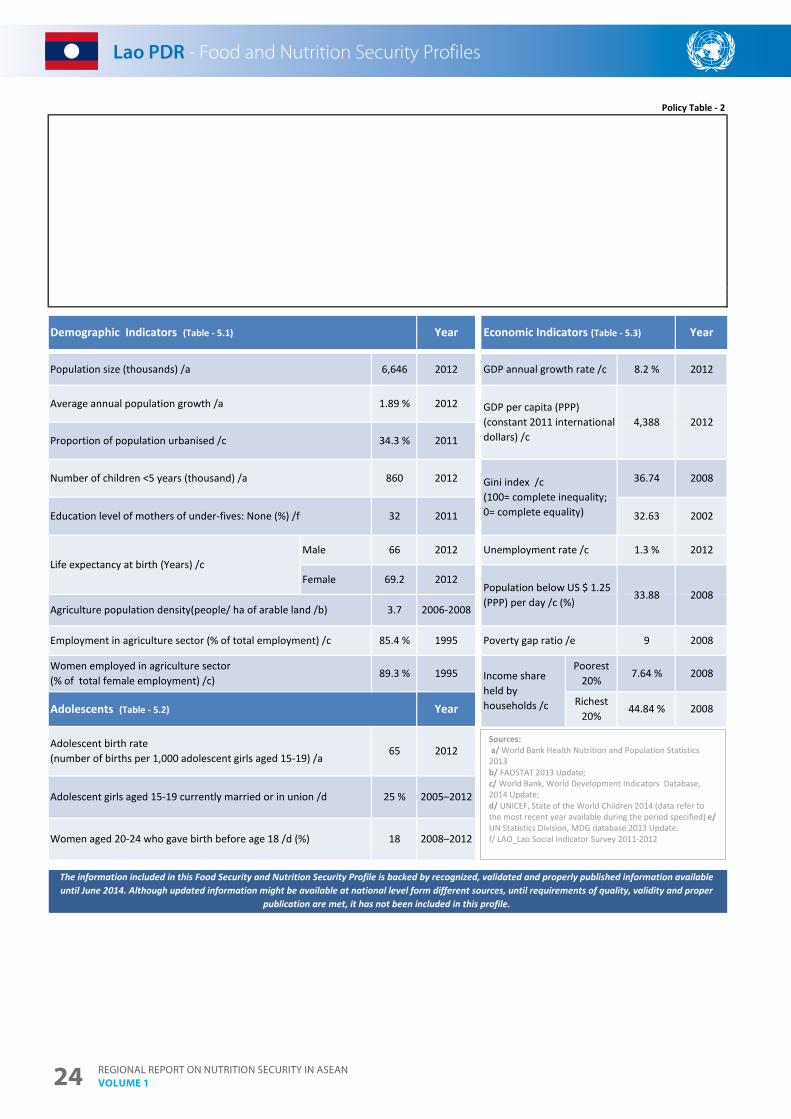
Regional RepoRt on nutRition SecuRity in aSean Volume 124
Lao PDR - Food and Nutrition Security Profiles
The information included in this Food Security and Nutrition Security Profile is backed by recognized, validated and properly published information available until June 2014. Although updated information might be available at national level form different sources, until requirements of quality, validity and proper
publication are met, it has not been included in this profile.
Demographic Indicators (Table - 5.1)
Population size (thousands) /a
Economic Indicators (Table - 5.3)Year
860 2012
34.3 % 2011
Year
6,646 2012
Richest 20%
44.84 % 2008
Income share held by households /c
Unemployment rate /c 1.3 % 2012
Population below US $ 1.25 (PPP) per day /c (%)
33.88 2008
Poverty gap ratio /e 9 2008
Poorest 20%
7.64 % 2008
GDP annual growth rate /c 8.2 % 2012
36.74 2008
32.63 2002
Gini index /c(100= complete inequality; 0= complete equality)
GDP per capita (PPP) (constant 2011 international dollars) /c
4,388 2012
Women aged 20-24 who gave birth before age 18 /d (%) 18 2008–2012
Male 66 2012
Adolescent birth rate (number of births per 1,000 adolescent girls aged 15-19) /a
65 2012
Adolescent girls aged 15-19 currently married or in union /d 25 % 2005–2012
Female
Adolescents (Table - 5.2)
85.4 % 1995
69.2 2012
Agriculture population density(people/ ha of arable land /b)
Employment in agriculture sector (% of total employment) /c
Women employed in agriculture sector (% of total female employment) /c)
Year
3.7 2006-2008
Number of children <5 years (thousand) /a
Education level of mothers of under-fives: None (%) /f 32 2011
89.3 % 1995
Policy Table - 2
Life expectancy at birth (Years) /c
Average annual population growth /a 1.89 % 2012
Proportion of population urbanised /c
Laos - Food and Nutrition Security Profiles
Sources:a/ World Bank Health Nutrition and Population Statistics
2013b/ FAOSTAT 2013 Update; c/ World Bank, World Development Indicators Database, 2014 Update; d/ UNICEF, State of the World Children 2014 (data refer to the most recent year available during the period specified) e/UN Statistics Division, MDG database 2013 Update.f/ LAO_Lao Social Indicator Survey 2011-2012
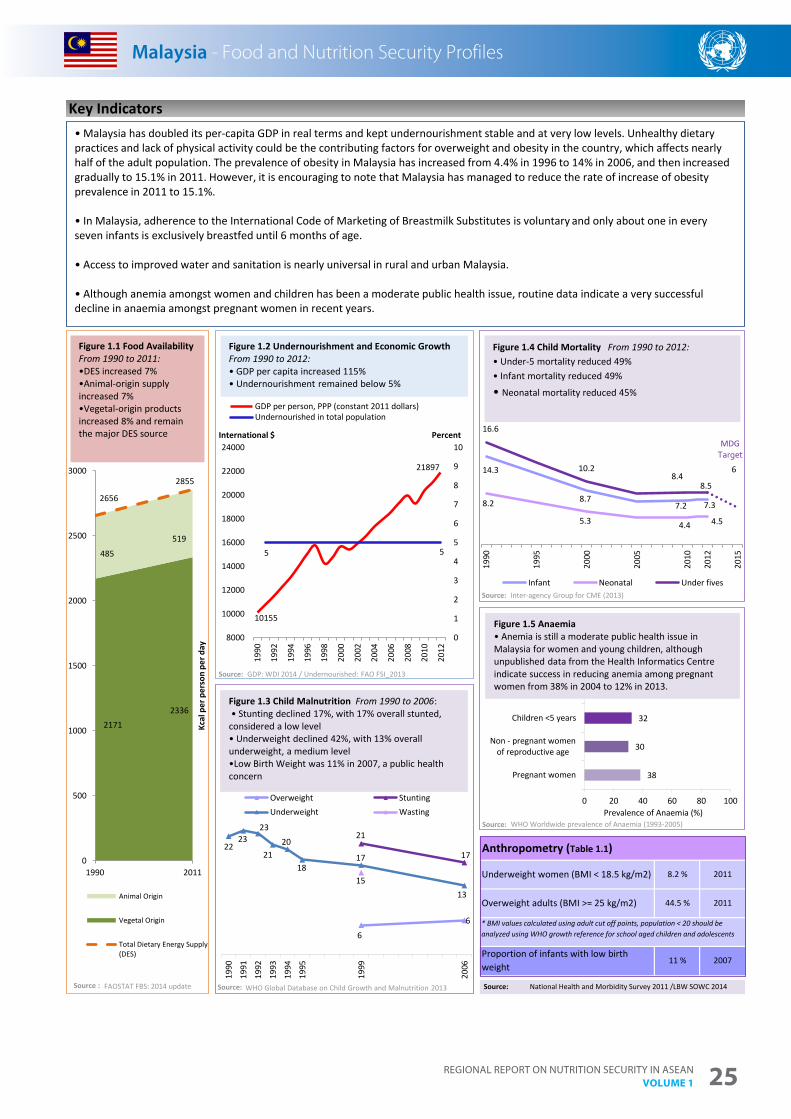
Regional RepoRt on nutRition SecuRity in aSean Volume 1 25
Malaysia - Food and Nutrition Security Profiles
2011
2011
2007
8.2 %
44.5 %
11 %Proportion of infants with low birth weight
Anthropometry (Table 1.1)
Underweight women (BMI < 18.5 kg/m2)
Overweight adults (BMI >= 25 kg/m2)
* BMI values calculated using adult cut off points, population < 20 should be analyzed using WHO growth reference for school aged children and adolescents
Source: National Health and Morbidity Survey 2011 /LBW SOWC 2014
Key Indicators
10155
21897
5 5
0
1
2
3
4
5
6
7
8
9
10
8000
10000
12000
14000
16000
18000
20000
22000
24000
1990
1992
1994
1996
1998
2000
2002
2004
2006
2008
2010
2012
GDP per person, PPP (constant 2011 dollars)Undernourished in total population
6
6
21
1722
2323
2120
1817
1315
1990
1991
1992
1993
1994
1995
1999
2006
Overweight StuntingUnderweight Wasting
Source:
Figure 1.3 Child Malnutrition From 1990 to 2006:• Stunting declined 17%, with 17% overall stunted,
considered a low level • Underweight declined 42%, with 13% overall underweight, a medium level•Low Birth Weight was 11% in 2007, a public health concern
• Malaysia has doubled its per-capita GDP in real terms and kept undernourishment stable and at very low levels. Unhealthy dietarypractices and lack of physical activity could be the contributing factors for overweight and obesity in the country, which affects nearly half of the adult population. The prevalence of obesity in Malaysia has increased from 4.4% in 1996 to 14% in 2006, and then increased gradually to 15.1% in 2011. However, it is encouraging to note that Malaysia has managed to reduce the rate of increase of obesity prevalence in 2011 to 15.1%.
• In Malaysia, adherence to the International Code of Marketing of Breastmilk Substitutes is voluntary and only about one in every seven infants is exclusively breastfed until 6 months of age.
• Access to improved water and sanitation is nearly universal in rural and urban Malaysia.
• Although anemia amongst women and children has been a moderate public health issue, routine data indicate a very successfuldecline in anaemia amongst pregnant women in recent years.
38
30
32
0 20 40 60 80 100
Pregnant women
Non - pregnant womenof reproductive age
Children <5 years
Total <2 yr
Prevalence of Anaemia (%)
21712336
485
519
2656
2855
0
500
1000
1500
2000
2500
3000
1990 2011
Kcal
per
per
son
per d
ay
Animal Origin
Vegetal Origin
Total Dietary Energy Supply(DES)
Figure 1.1 Food Availability From 1990 to 2011: •DES increased 7% •Animal-origin supply increased 7% •Vegetal-origin products increased 8% and remain the major DES source
14.3
8.77.2 7.38.2
5.3 4.4 4.5
16.6
10.28.4
8.5
6
1990
1995
2000
2005
2010
2012
2015
Infant Neonatal Under fives
Malaysia - Food and Nutrition Security Profiles
Figure 1.5 Anaemia • Anemia is still a moderate public health issue in Malaysia for women and young children, although unpublished data from the Health Informatics Centre indicate success in reducing anemia among pregnant women from 38% in 2004 to 12% in 2013.
Figure 1.4 Child Mortality From 1990 to 2012:• Under-5 mortality reduced 49%• Infant mortality reduced 49%
• Neonatal mortality reduced 45%
Figure 1.2 Undernourishment and Economic Growth From 1990 to 2012: • GDP per capita increased 115%• Undernourishment remained below 5%
MDGTarget
PercentInternational $
Source:
Source:
Source:
Source : FAOSTAT FBS: 2014 update WHO Global Database on Child Growth and Malnutrition 2013
GDP: WDI 2014 / Undernourished: FAO FSI_2013
Inter-agency Group for CME (2013)
WHO Worldwide prevalence of Anaemia (1993-2005)
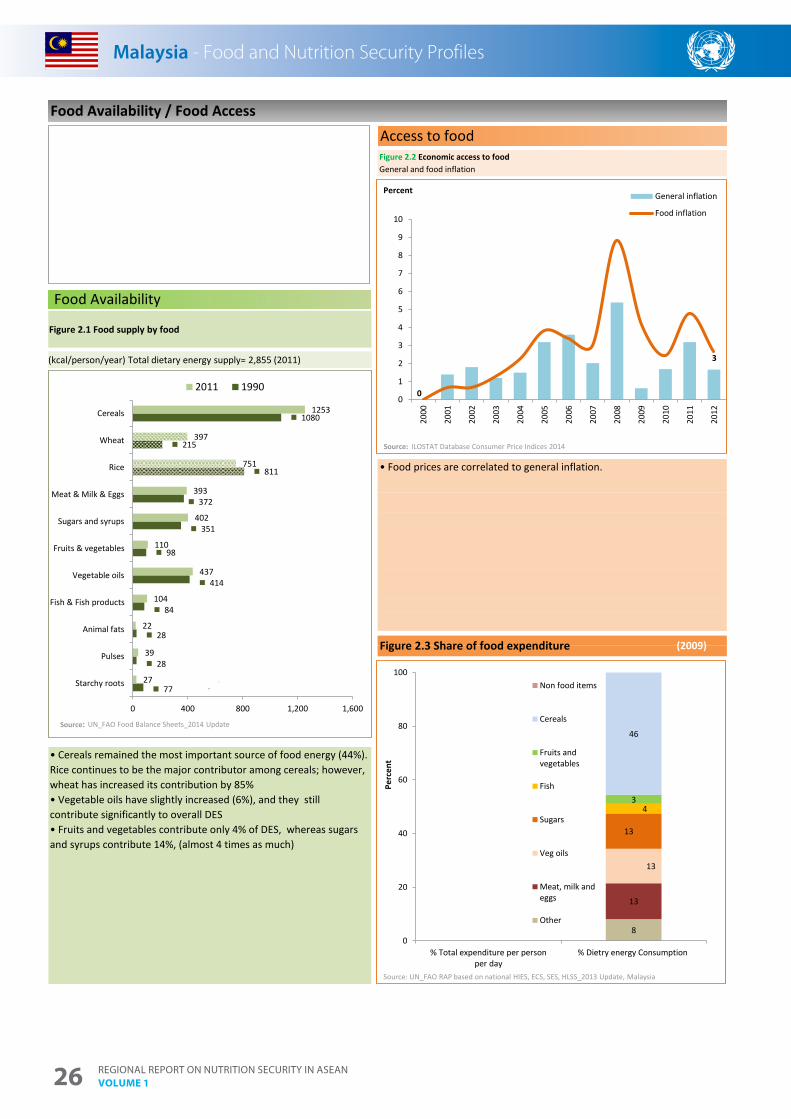
Regional RepoRt on nutRition SecuRity in aSean Volume 126
Malaysia - Food and Nutrition Security Profiles
• Cereals remained the most important source of food energy (44%). Rice continues to be the major contributor among cereals; however, wheat has increased its contribution by 85% • Vegetable oils have slightly increased (6%), and they still contribute significantly to overall DES• Fruits and vegetables contribute only 4% of DES, whereas sugars and syrups contribute 14%, (almost 4 times as much)
Access to foodFigure 2.2 Economic access to foodGeneral and food inflation
(2009)Figure 2.3 Share of food expenditure
• Food prices are correlated to general inflation.
Food Availability / Food Access
Food Availability
77
28
28
84
414
98
351
372
811
215
1080
27
39
22
104
437
110
402
393
751
397
1253
Starchy roots
Pulses
Animal fats
Fish & Fish products
Vegetable oils
Fruits & vegetables
Sugars and syrups
Meat & Milk & Eggs
Rice
Wheat
Cereals
0 400 800 1,200 1,600
2011 1990
Source:
(kcal/person/year) Total dietary energy supply= 2,855 (2011)
Malaysia - Food and Nutrition Security Profiles
Figure 2.1 Food supply by food
0
3
0
1
2
3
4
5
6
7
8
9
10
2000
2001
2002
2003
2004
2005
2006
2007
2008
2009
2010
2011
2012
General inflation
Food inflation
Source:
8
13
13
13
43
46
0
20
40
60
80
100
% Total expenditure per personper day
% Dietry energy Consumption
Perc
ent
Non food items
Cereals
Fruits andvegetables
Fish
Sugars
Veg oils
Meat, milk andeggs
Other
Percent
ILOSTAT Database Consumer Price Indices 2014
UN_FAO Food Balance Sheets_2014 Update
Source: UN_FAO RAP based on national HIES, ECS, SES, HLSS_2013 Update, Malaysia
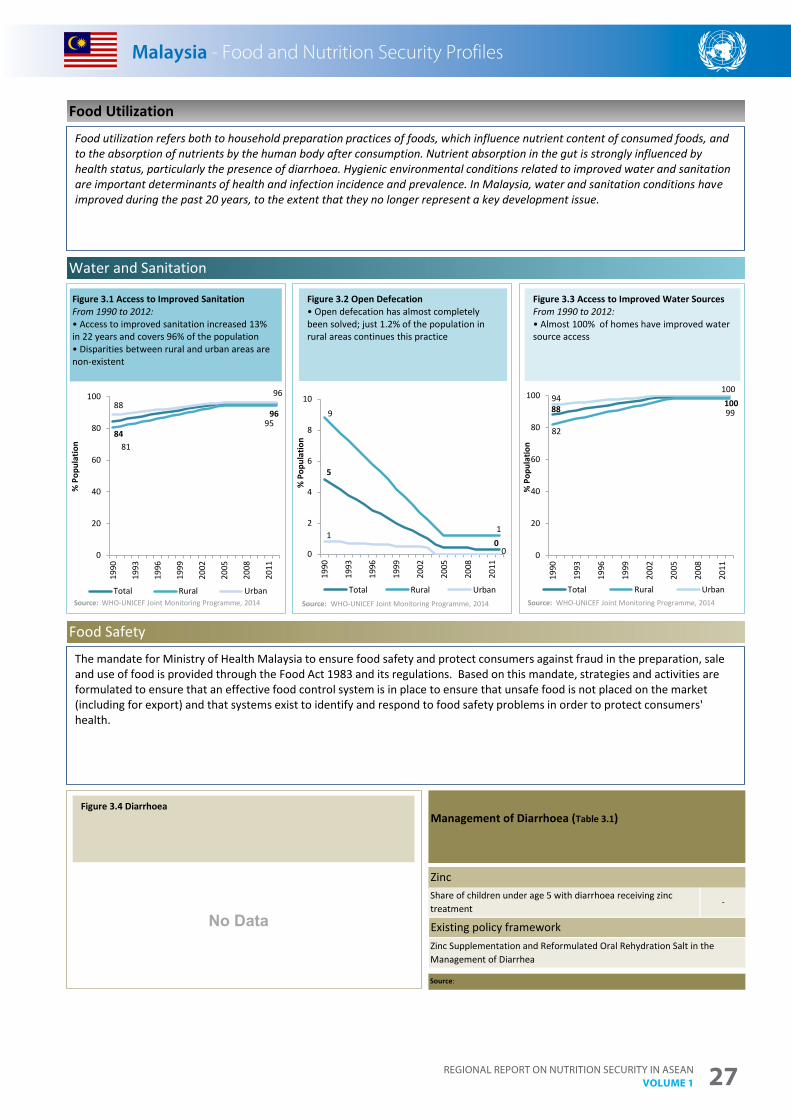
Regional RepoRt on nutRition SecuRity in aSean Volume 1 27
Malaysia - Food and Nutrition Security Profiles
-Share of children under age 5 with diarrhoea receiving zinc treatment
Food Safety
Existing policy frameworkZinc Supplementation and Reformulated Oral Rehydration Salt in the Management of Diarrhea
Source:
Management of Diarrhoea (Table 3.1)
Water and Sanitation
Food Utilization
Zinc
5
0
9
11
00
2
4
6
8
10
1990
1993
1996
1999
2002
2005
2008
2011
% P
opul
atio
n
Total Rural Urban
84
96
81
95
8896
0
20
40
60
80
100
1990
1993
1996
1999
2002
2005
2008
2011
% P
opul
atio
n
Total Rural Urban
No Data
88100
82
99
94100
0
20
40
60
80
100
1990
1993
1996
1999
2002
2005
2008
2011
% P
opul
atio
n
Total Rural UrbanSource:
Malaysia - Food and Nutrition Security Profiles
Figure 3.1 Access to Improved SanitationFrom 1990 to 2012:• Access to improved sanitation increased 13% in 22 years and covers 96% of the population• Disparities between rural and urban areas are non-existent
Source: Source:
Food utilization refers both to household preparation practices of foods, which influence nutrient content of consumed foods, and to the absorption of nutrients by the human body after consumption. Nutrient absorption in the gut is strongly influenced by health status, particularly the presence of diarrhoea. Hygienic environmental conditions related to improved water and sanitation are important determinants of health and infection incidence and prevalence. In Malaysia, water and sanitation conditions have improved during the past 20 years, to the extent that they no longer represent a key development issue.
Figure 3.4 Diarrhoea
Figure 3.2 Open Defecation • Open defecation has almost completely been solved; just 1.2% of the population in rural areas continues this practice
Figure 3.3 Access to Improved Water Sources From 1990 to 2012:• Almost 100% of homes have improved water source access
The mandate for Ministry of Health Malaysia to ensure food safety and protect consumers against fraud in the preparation, sale and use of food is provided through the Food Act 1983 and its regulations. Based on this mandate, strategies and activities areformulated to ensure that an effective food control system is in place to ensure that unsafe food is not placed on the market(including for export) and that systems exist to identify and respond to food safety problems in order to protect consumers' health.
WHO-UNICEF Joint Monitoring Programme, 2014 WHO-UNICEF Joint Monitoring Programme, 2014 WHO-UNICEF Joint Monitoring Programme, 2014
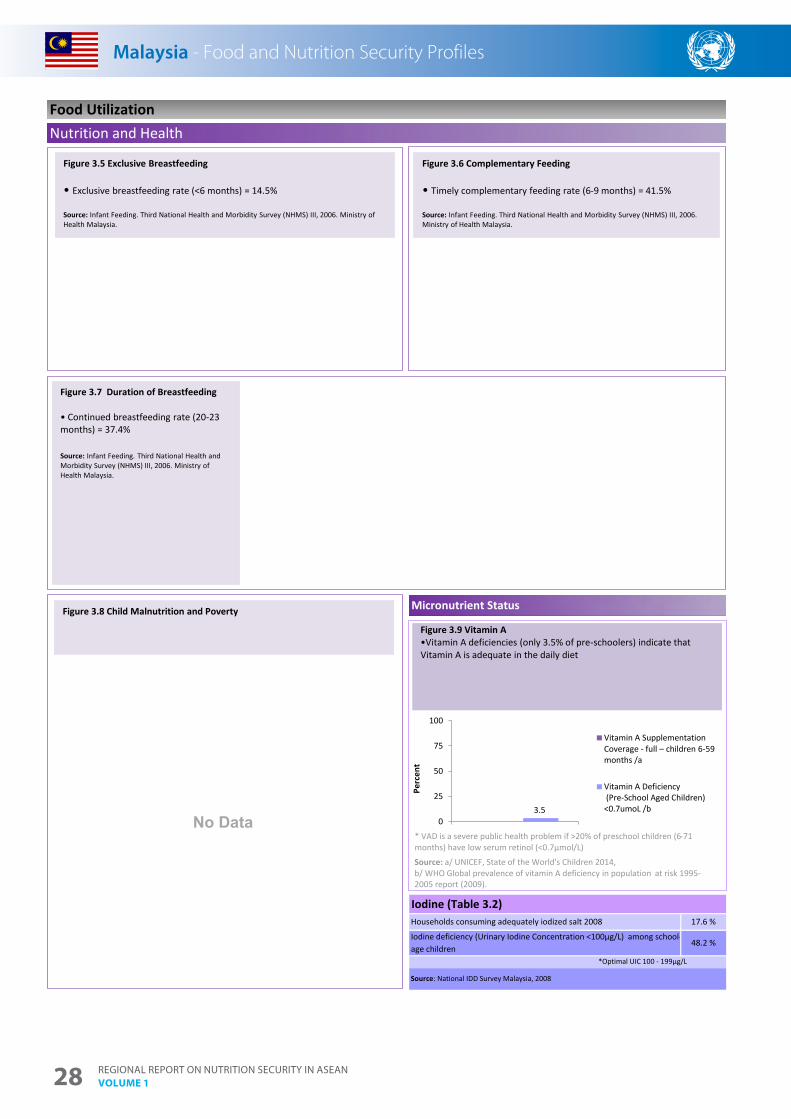
Regional RepoRt on nutRition SecuRity in aSean Volume 128
Malaysia - Food and Nutrition Security Profiles
*Optimal UIC 100 - 199µg/L
Source: National IDD Survey Malaysia, 2008
48.2 %
Nutrition and Health
Households consuming adequately iodized salt 2008
Iodine deficiency (Urinary Iodine Concentration <100µg/L) among school-age children
Micronutrient Status
Iodine (Table 3.2)
Food Utilization
17.6 %
0 3.50
25
50
75
100
Perc
ent
Vitamin A Supplementation Coverage - full – children 6-59 months /a
Vitamin A Deficiency (Pre-School Aged Children)<0.7umoL /b
Figure 3.6 Complementary Feeding
• Timely complementary feeding rate (6-9 months) = 41.5%
Source: Infant Feeding. Third National Health and Morbidity Survey (NHMS) III, 2006. Ministry of Health Malaysia.
Figure 3.5 Exclusive Breastfeeding
• Exclusive breastfeeding rate (<6 months) = 14.5%
Source: Infant Feeding. Third National Health and Morbidity Survey (NHMS) III, 2006. Ministry of Health Malaysia.
Figure 3.7 Duration of Breastfeeding
• Continued breastfeeding rate (20-23 months) = 37.4%
Source: Infant Feeding. Third National Health and Morbidity Survey (NHMS) III, 2006. Ministry of Health Malaysia.
Malaysia - Food and Nutrition Security Profiles
Figure 3.8 Child Malnutrition and Poverty
Figure 3.9 Vitamin A •Vitamin A deficiencies (only 3.5% of pre-schoolers) indicate that Vitamin A is adequate in the daily diet
Source: a/ UNICEF, State of the World's Children 2014,b/ WHO Global prevalence of vitamin A deficiency in population at risk 1995-2005 report (2009).
* VAD is a severe public health problem if >20% of preschool children (6-71 months) have low serum retinol (<0.7µmol/L)
No Data
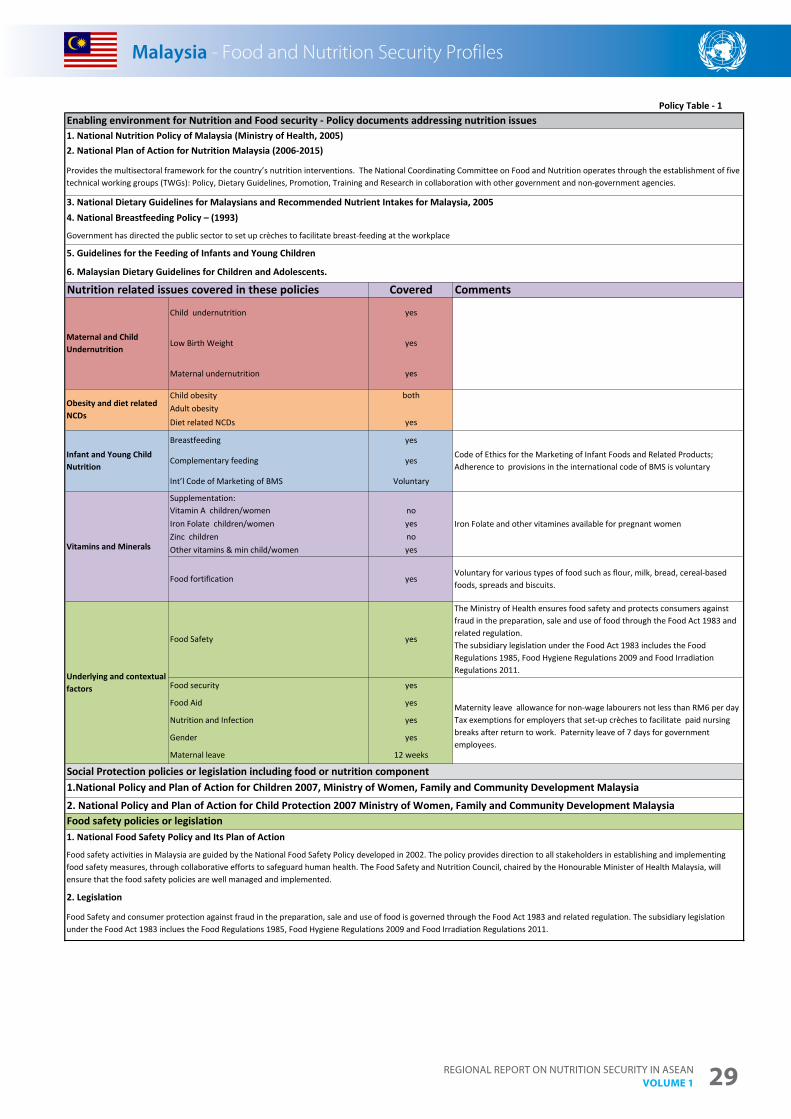
Regional RepoRt on nutRition SecuRity in aSean Volume 1 29
Malaysia - Food and Nutrition Security Profiles
2. Legislation
Food Safety and consumer protection against fraud in the preparation, sale and use of food is governed through the Food Act 1983 and related regulation. The subsidiary legislation under the Food Act 1983 inclues the Food Regulations 1985, Food Hygiene Regulations 2009 and Food Irradiation Regulations 2011.
Policy Table - 1
Social Protection policies or legislation including food or nutrition component
Food safety policies or legislation1. National Food Safety Policy and Its Plan of Action
Food safety activities in Malaysia are guided by the National Food Safety Policy developed in 2002. The policy provides direction to all stakeholders in establishing and implementing food safety measures, through collaborative efforts to safeguard human health. The Food Safety and Nutrition Council, chaired by the Honourable Minister of Health Malaysia, will ensure that the food safety policies are well managed and implemented.
Underlying and contextual factors
Food Safety yes
The Ministry of Health ensures food safety and protects consumers against fraud in the preparation, sale and use of food through the Food Act 1983 and related regulation. The subsidiary legislation under the Food Act 1983 includes the Food Regulations 1985, Food Hygiene Regulations 2009 and Food Irradiation Regulations 2011.
Food security yes
Maternity leave allowance for non-wage labourers not less than RM6 per dayTax exemptions for employers that set-up crèches to facilitate paid nursing breaks after return to work. Paternity leave of 7 days for government employees.
Gender yes
Infant and Young Child Nutrition
Breastfeeding yes
4. National Breastfeeding Policy – (1993)
Government has directed the public sector to set up crèches to facilitate breast-feeding at the workplace
1.National Policy and Plan of Action for Children 2007, Ministry of Women, Family and Community Development Malaysia2. National Policy and Plan of Action for Child Protection 2007 Ministry of Women, Family and Community Development Malaysia
Code of Ethics for the Marketing of Infant Foods and Related Products; Adherence to provisions in the international code of BMS is voluntary
Complementary feeding yes
Int’l Code of Marketing of BMS Voluntary
Maternal leave 12 weeks
Vitamins and Minerals
Supplementation:Vitamin A children/women no
Iron Folate and other vitamines available for pregnant womenIron Folate children/women yesZinc children noOther vitamins & min child/women yes
Food fortification yesVoluntary for various types of food such as flour, milk, bread, cereal-based foods, spreads and biscuits.
Food Aid yes
Nutrition and Infection yes
Maternal and Child Undernutrition
Child undernutrition yes
Low Birth Weight yes
Maternal undernutrition yes
Obesity and diet related NCDs
Child obesity bothAdult obesityDiet related NCDs yes
Enabling environment for Nutrition and Food security - Policy documents addressing nutrition issues 1. National Nutrition Policy of Malaysia (Ministry of Health, 2005)2. National Plan of Action for Nutrition Malaysia (2006-2015)
Provides the multisectoral framework for the country’s nutrition interventions. The National Coordinating Committee on Food and Nutrition operates through the establishment of five technical working groups (TWGs): Policy, Dietary Guidelines, Promotion, Training and Research in collaboration with other government and non-government agencies.
3. National Dietary Guidelines for Malaysians and Recommended Nutrient Intakes for Malaysia, 2005
5. Guidelines for the Feeding of Infants and Young Children
6. Malaysian Dietary Guidelines for Children and Adolescents.
Nutrition related issues covered in these policies Covered Comments
Malaysia - Food and Nutrition Security Profiles
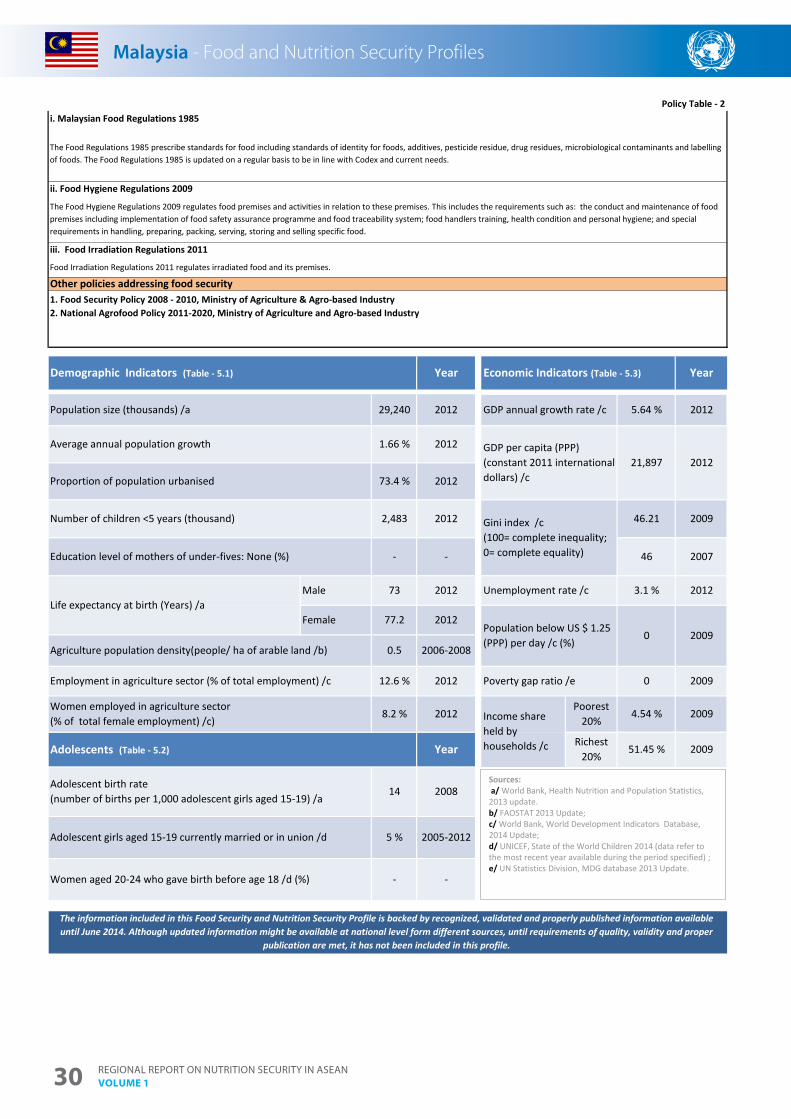
Regional RepoRt on nutRition SecuRity in aSean Volume 130
Malaysia - Food and Nutrition Security Profiles
Policy Table - 2
1. Food Security Policy 2008 - 2010, Ministry of Agriculture & Agro-based Industry2. National Agrofood Policy 2011-2020, Ministry of Agriculture and Agro-based Industry
i. Malaysian Food Regulations 1985
The Food Regulations 1985 prescribe standards for food including standards of identity for foods, additives, pesticide residue, drug residues, microbiological contaminants and labelling of foods. The Food Regulations 1985 is updated on a regular basis to be in line with Codex and current needs.
iii. Food Irradiation Regulations 2011
Food Irradiation Regulations 2011 regulates irradiated food and its premises.
Other policies addressing food security
ii. Food Hygiene Regulations 2009
The Food Hygiene Regulations 2009 regulates food premises and activities in relation to these premises. This includes the requirements such as: the conduct and maintenance of food premises including implementation of food safety assurance programme and food traceability system; food handlers training, health condition and personal hygiene; and special requirements in handling, preparing, packing, serving, storing and selling specific food.
Demographic Indicators (Table - 5.1)
Population size (thousands) /a
Economic Indicators (Table - 5.3)Year Year
29,240 2012 5.64 % 2012GDP annual growth rate /c
GDP per capita (PPP) (constant 2011 international dollars) /c
21,897 2012
2006-2008
Richest 20%
51.45 % 2009
Income share held by households /c
Unemployment rate /c 3.1 % 2012
Population below US $ 1.25 (PPP) per day /c (%)
0 2009
Poverty gap ratio /e 0 2009
Poorest 20%
4.54 % 2009
Adolescent girls aged 15-19 currently married or in union /d 5 % 2005-2012
Female
Adolescents (Table - 5.2)
12.6 % 2012
77.2 2012
Agriculture population density(people/ ha of arable land /b)
Employment in agriculture sector (% of total employment) /c
Women employed in agriculture sector (% of total female employment) /c)
Year
0.5
8.2 %
46.21 2009
46 2007
Gini index /c(100= complete inequality; 0= complete equality)
The information included in this Food Security and Nutrition Security Profile is backed by recognized, validated and properly published information available until June 2014. Although updated information might be available at national level form different sources, until requirements of quality, validity and proper
publication are met, it has not been included in this profile.
Education level of mothers of under-fives: None (%) - -
Average annual population growth 1.66 % 2012
Proportion of population urbanised 73.4 % 2012
Number of children <5 years (thousand) 2,483 2012
2012
Life expectancy at birth (Years) /a
Women aged 20-24 who gave birth before age 18 /d (%) - -
Male 73 2012
Adolescent birth rate (number of births per 1,000 adolescent girls aged 15-19) /a
14 2008
Malaysia - Food and Nutrition Security Profiles
Sources:a/ World Bank, Health Nutrition and Population Statistics, 2013 update.b/ FAOSTAT 2013 Update; c/ World Bank, World Development Indicators Database, 2014 Update; d/ UNICEF, State of the World Children 2014 (data refer to the most recent year available during the period specified) ;e/ UN Statistics Division, MDG database 2013 Update.
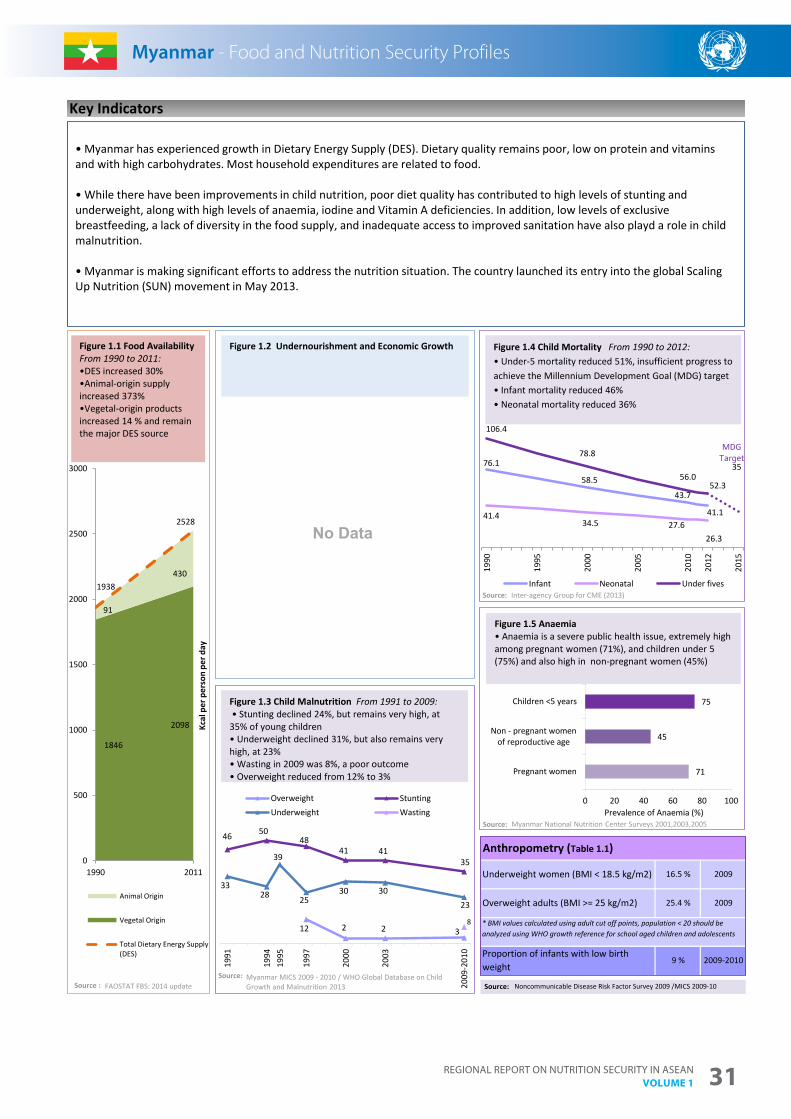
Regional RepoRt on nutRition SecuRity in aSean Volume 1 31
Myanmar - Food and Nutrition Security Profiles
* BMI values calculated using adult cut off points, population < 20 should be analyzed using WHO growth reference for school aged children and adolescents
2009
2009
2009-2010
16.5 %
25.4 %
9 %Proportion of infants with low birth weight
Key Indicators
Anthropometry (Table 1.1)
Underweight women (BMI < 18.5 kg/m2)
Overweight adults (BMI >= 25 kg/m2)
Source: Noncommunicable Disease Risk Factor Survey 2009 /MICS 2009-10
No Data
12 2 2 3
46 5048
41 4135
3328
39
2530 30
23
8
1991
1994
1995
1997
2000
2003
2009
-201
0
Overweight StuntingUnderweight Wasting
Source:
Figure 1.3 Child Malnutrition From 1991 to 2009:• Stunting declined 24%, but remains very high, at
35% of young children • Underweight declined 31%, but also remains very high, at 23%• Wasting in 2009 was 8%, a poor outcome • Overweight reduced from 12% to 3%
• Myanmar has experienced growth in Dietary Energy Supply (DES). Dietary quality remains poor, low on protein and vitamins and with high carbohydrates. Most household expenditures are related to food.
• While there have been improvements in child nutrition, poor diet quality has contributed to high levels of stunting and underweight, along with high levels of anaemia, iodine and Vitamin A deficiencies. In addition, low levels of exclusive breastfeeding, a lack of diversity in the food supply, and inadequate access to improved sanitation have also playd a role in child malnutrition.
• Myanmar is making significant efforts to address the nutrition situation. The country launched its entry into the global Scaling Up Nutrition (SUN) movement in May 2013.
71
45
75
0 20 40 60 80 100
Pregnant women
Non - pregnant womenof reproductive age
Children <5 years
Total <2 yr
Prevalence of Anaemia (%)
1846
2098
91
4301938
2528
0
500
1000
1500
2000
2500
3000
1990 2011
Kcal
per
per
son
per d
ay
Animal Origin
Vegetal Origin
Total Dietary Energy Supply(DES)
Figure 1.1 Food Availability From 1990 to 2011: •DES increased 30% •Animal-origin supply increased 373% •Vegetal-origin products increased 14 % and remain the major DES source
76.1
58.5
43.7
41.141.434.5 27.6
26.3
106.4
78.8
56.052.3
35
1990
1995
2000
2005
2010
2012
2015
Infant Neonatal Under fives
Myanmar - Food and Nutrition Security Profiles
Figure 1.5 Anaemia • Anaemia is a severe public health issue, extremely high among pregnant women (71%), and children under 5 (75%) and also high in non-pregnant women (45%)
Figure 1.4 Child Mortality From 1990 to 2012:• Under-5 mortality reduced 51%, insufficient progress to achieve the Millennium Development Goal (MDG) target• Infant mortality reduced 46%• Neonatal mortality reduced 36%
Figure 1.2 Undernourishment and Economic Growth
MDGTarget
Source:
Source:
Source : FAOSTAT FBS: 2014 updateMyanmar MICS 2009 - 2010 / WHO Global Database on Child Growth and Malnutrition 2013
Inter-agency Group for CME (2013)
Myanmar National Nutrition Center Surveys 2001,2003,2005
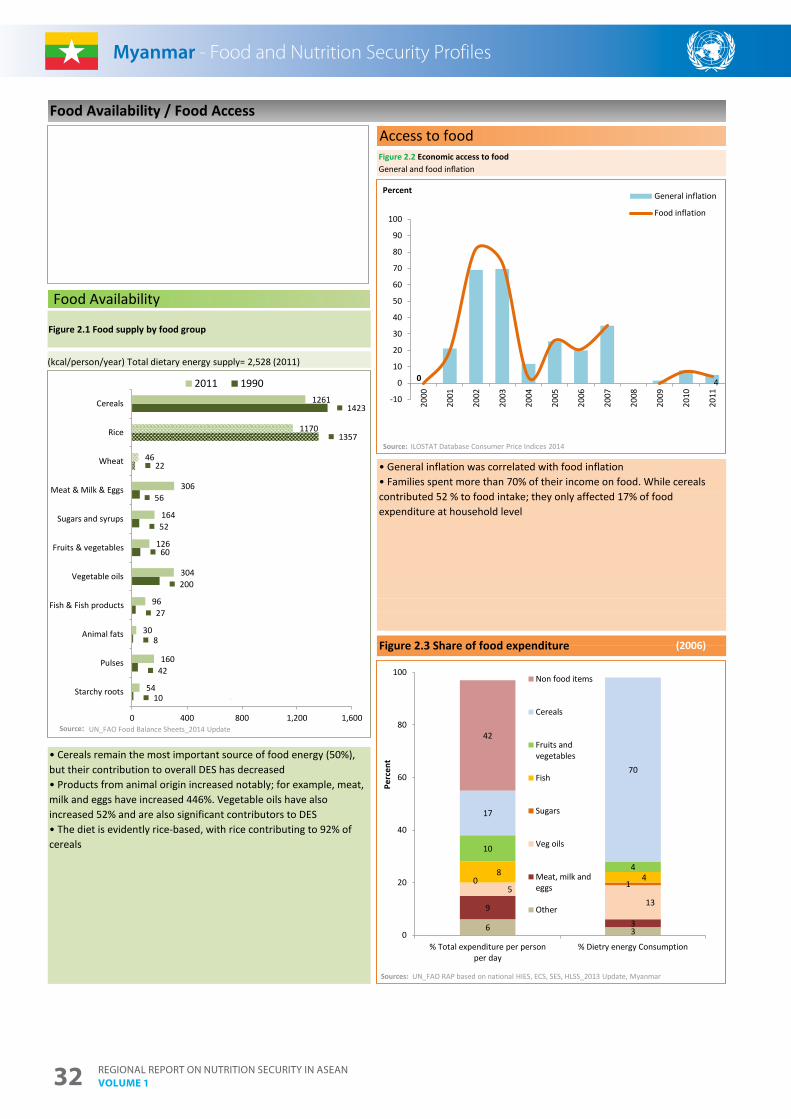
Regional RepoRt on nutRition SecuRity in aSean Volume 132
Myanmar - Food and Nutrition Security Profiles
• Cereals remain the most important source of food energy (50%), but their contribution to overall DES has decreased• Products from animal origin increased notably; for example, meat, milk and eggs have increased 446%. Vegetable oils have also increased 52% and are also significant contributors to DES• The diet is evidently rice-based, with rice contributing to 92% of cereals
Access to foodFigure 2.2 Economic access to foodGeneral and food inflation
(2006)Figure 2.3 Share of food expenditure
Food Availability
• General inflation was correlated with food inflation • Families spent more than 70% of their income on food. While cereals contributed 52 % to food intake; they only affected 17% of food expenditure at household level
Food Availability / Food Access
10
42
8
27
200
60
52
56
22
1357
1423
54
160
30
96
304
126
164
306
46
1170
1261
Starchy roots
Pulses
Animal fats
Fish & Fish products
Vegetable oils
Fruits & vegetables
Sugars and syrups
Meat & Milk & Eggs
Wheat
Rice
Cereals
0 400 800 1,200 1,600
2011 1990
Source:
(kcal/person/year) Total dietary energy supply= 2,528 (2011)
Myanmar - Food and Nutrition Security Profiles
Figure 2.1 Food supply by food group
0 4
-10
0
10
20
30
40
50
60
70
80
90
100
2000
2001
2002
2003
2004
2005
2006
2007
2008
2009
2010
2011
General inflation
Food inflation
Source:
6 3
9
3
513
0 18 4
10
4
17
70
42
0
20
40
60
80
100
% Total expenditure per personper day
% Dietry energy Consumption
Perc
ent
Non food items
Cereals
Fruits andvegetables
Fish
Sugars
Veg oils
Meat, milk andeggs
Other
Sources:
Percent
ILOSTAT Database Consumer Price Indices 2014
UN_FAO Food Balance Sheets_2014 Update
UN_FAO RAP based on national HIES, ECS, SES, HLSS_2013 Update, Myanmar
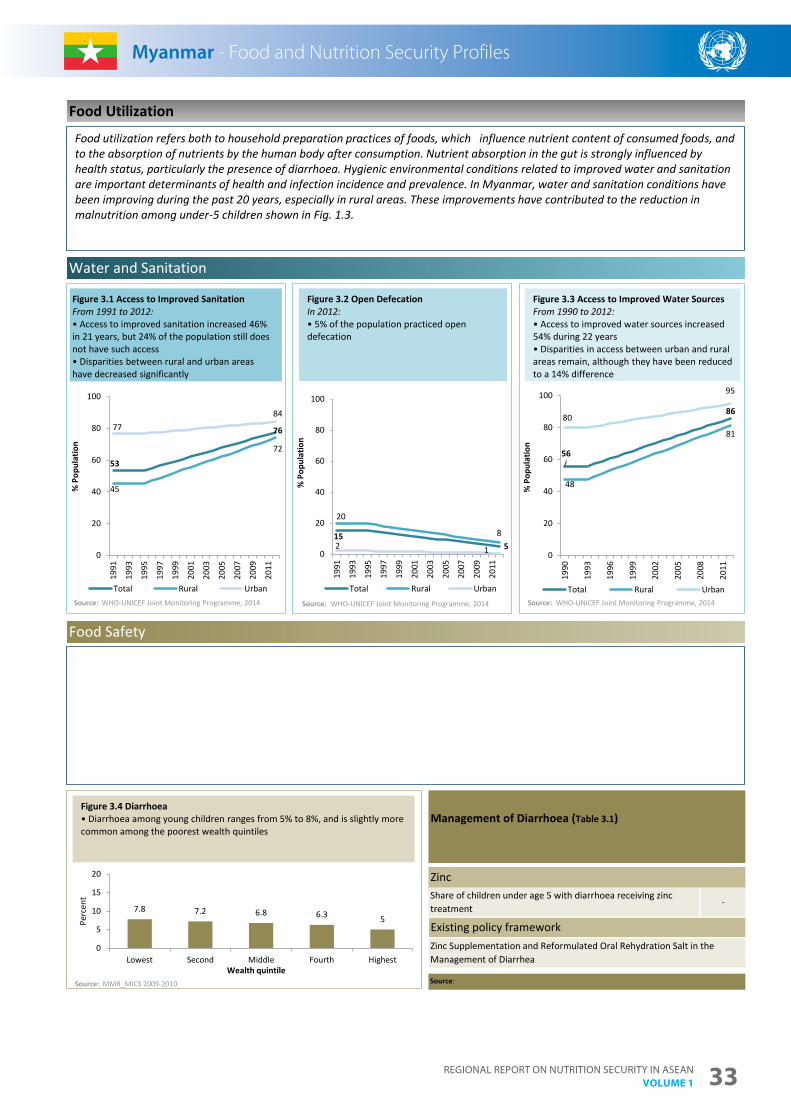
Regional RepoRt on nutRition SecuRity in aSean Volume 1 33
Myanmar - Food and Nutrition Security Profiles
-Share of children under age 5 with diarrhoea receiving zinc treatment
Food Safety
Water and Sanitation
Food Utilization
Zinc
Existing policy frameworkZinc Supplementation and Reformulated Oral Rehydration Salt in the Management of Diarrhea
Source:
Management of Diarrhoea (Table 3.1)
155
20
82 10
20
40
60
80
100
1991
1993
1995
1997
1999
2001
2003
2005
2007
2009
2011
% P
opul
atio
n
Total Rural Urban
53
76
45
72
7784
0
20
40
60
80
100
1991
1993
1995
1997
1999
2001
2003
2005
2007
2009
2011
% P
opul
atio
n
Total Rural Urban
7.8 7.2 6.8 6.3 5
0
5
10
15
20
Lowest Second Middle Fourth Highest
Perc
ent
Wealth quintileSource: MMR_MICS 2009-2010
56
86
48
81
80
95
0
20
40
60
80
100
1990
1993
1996
1999
2002
2005
2008
2011
% P
opul
atio
n
Total Rural UrbanSource:
Myanmar - Food and Nutrition Security Profiles
Figure 3.1 Access to Improved Sanitation From 1991 to 2012:• Access to improved sanitation increased 46% in 21 years, but 24% of the population still does not have such access • Disparities between rural and urban areas have decreased significantly
Source: Source:
Food utilization refers both to household preparation practices of foods, which influence nutrient content of consumed foods, and to the absorption of nutrients by the human body after consumption. Nutrient absorption in the gut is strongly influenced by health status, particularly the presence of diarrhoea. Hygienic environmental conditions related to improved water and sanitation are important determinants of health and infection incidence and prevalence. In Myanmar, water and sanitation conditions havebeen improving during the past 20 years, especially in rural areas. These improvements have contributed to the reduction in malnutrition among under-5 children shown in Fig. 1.3.
Figure 3.4 Diarrhoea • Diarrhoea among young children ranges from 5% to 8%, and is slightly more common among the poorest wealth quintiles
Figure 3.2 Open Defecation In 2012:• 5% of the population practiced open defecation
Figure 3.3 Access to Improved Water Sources From 1990 to 2012:• Access to improved water sources increased 54% during 22 years• Disparities in access between urban and rural areas remain, although they have been reduced to a 14% difference
WHO-UNICEF Joint Monitoring Programme, 2014 WHO-UNICEF Joint Monitoring Programme, 2014 WHO-UNICEF Joint Monitoring Programme, 2014
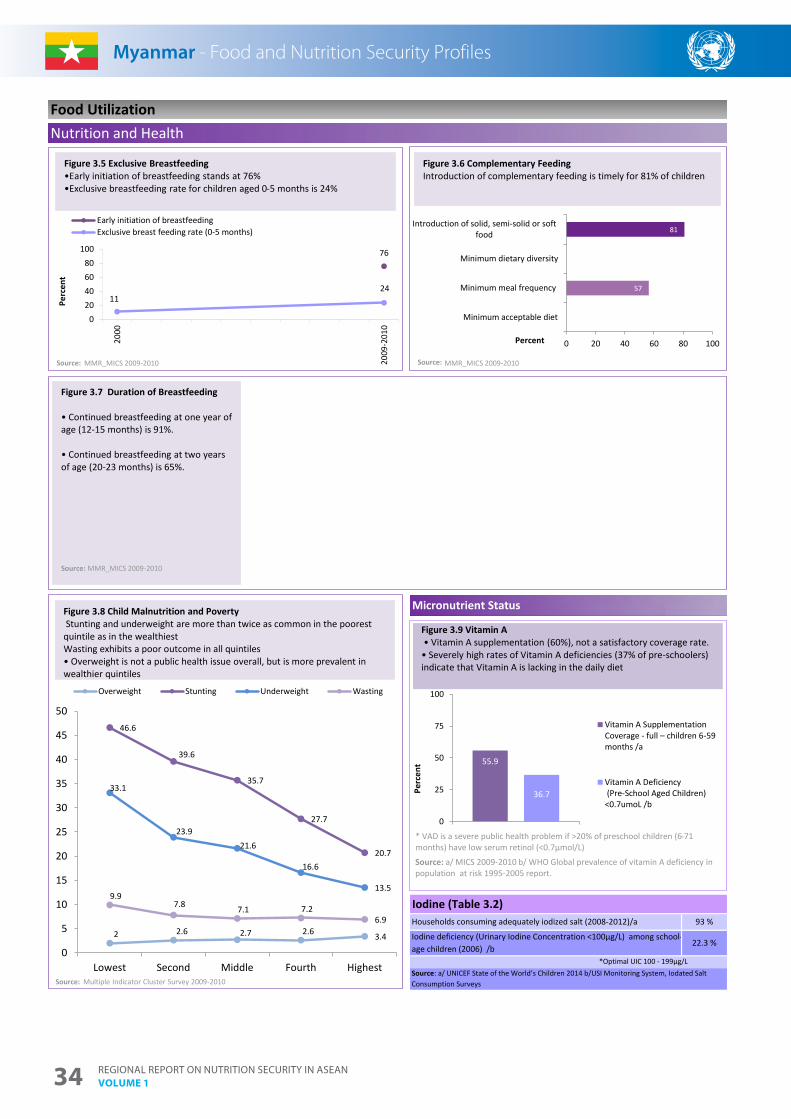
Regional RepoRt on nutRition SecuRity in aSean Volume 134
Myanmar - Food and Nutrition Security Profiles
*Optimal UIC 100 - 199µg/LSource: a/ UNICEF State of the World’s Children 2014 b/USI Monitoring System, Iodated Salt Consumption Surveys
Nutrition and Health
22.3 %
93 %Households consuming adequately iodized salt (2008-2012)/a
Iodine deficiency (Urinary Iodine Concentration <100µg/L) among school-age children (2006) /b
Micronutrient Status
Iodine (Table 3.2)
Food Utilization
55.9
36.7
0
25
50
75
100
Perc
ent
Vitamin A Supplementation Coverage - full – children 6-59 months /a
Vitamin A Deficiency (Pre-School Aged Children)<0.7umoL /b
57
81
0 20 40 60 80 100
Minimum acceptable diet
Minimum meal frequency
Minimum dietary diversity
Introduction of solid, semi-solid or softfood
Percent
Source:
Figure 3.6 Complementary Feeding Introduction of complementary feeding is timely for 81% of children
76
1124
020406080
100
2000
2009
-201
0
Perc
ent
Early initiation of breastfeedingExclusive breast feeding rate (0-5 months)
Source:
Figure 3.5 Exclusive Breastfeeding •Early initiation of breastfeeding stands at 76% •Exclusive breastfeeding rate for children aged 0-5 months is 24%
Figure 3.7 Duration of Breastfeeding
• Continued breastfeeding at one year of age (12-15 months) is 91%.
• Continued breastfeeding at two years of age (20-23 months) is 65%.
Source: MMR_MICS 2009-2010
Myanmar - Food and Nutrition Security Profiles
Figure 3.8 Child Malnutrition and Poverty Stunting and underweight are more than twice as common in the poorest
quintile as in the wealthiest Wasting exhibits a poor outcome in all quintiles • Overweight is not a public health issue overall, but is more prevalent in wealthier quintiles
Figure 3.9 Vitamin A • Vitamin A supplementation (60%), not a satisfactory coverage rate.
• Severely high rates of Vitamin A deficiencies (37% of pre-schoolers) indicate that Vitamin A is lacking in the daily diet
Source: a/ MICS 2009-2010 b/ WHO Global prevalence of vitamin A deficiency in population at risk 1995-2005 report.
* VAD is a severe public health problem if >20% of preschool children (6-71 months) have low serum retinol (<0.7µmol/L)
2 2.6 2.7 2.6 3.4
46.6
39.6
35.7
27.7
20.7
33.1
23.921.6
16.6
13.59.9
7.8 7.1 7.26.9
0
5
10
15
20
25
30
35
40
45
50
Lowest Second Middle Fourth Highest
Overweight Stunting Underweight Wasting
MMR_MICS 2009-2010 MMR_MICS 2009-2010
Source: Multiple Indicator Cluster Survey 2009-2010
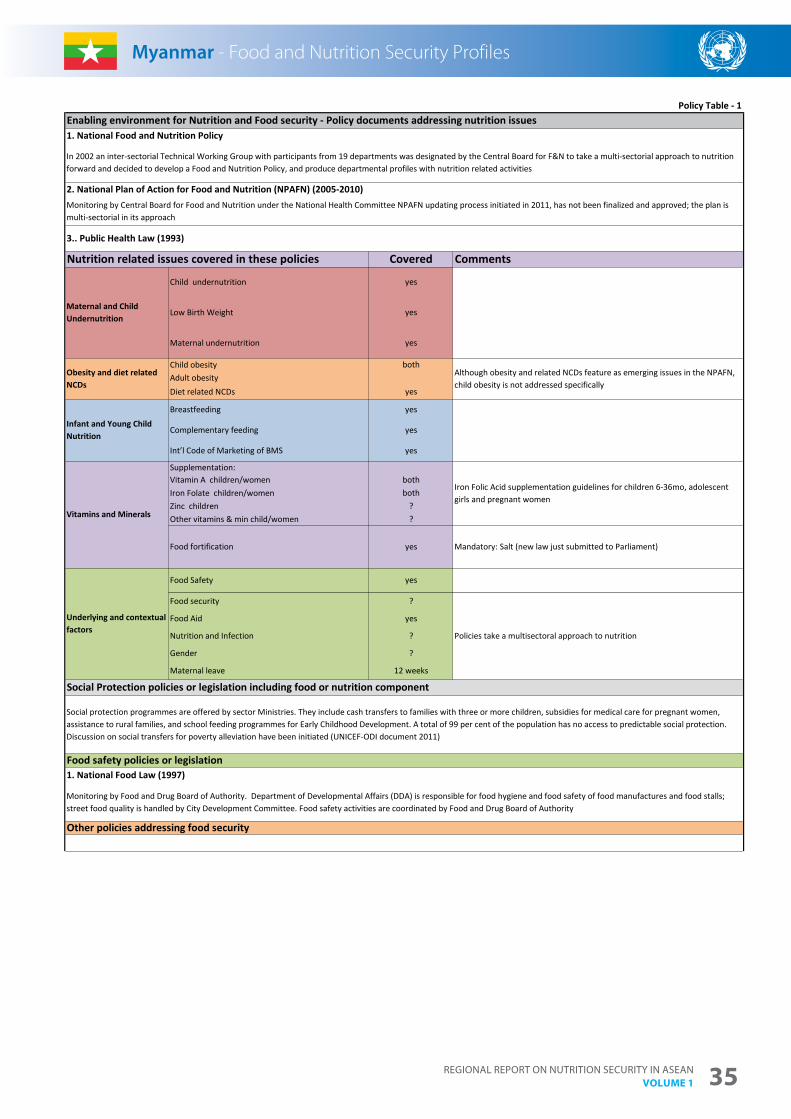
Regional RepoRt on nutRition SecuRity in aSean Volume 1 35
Myanmar - Food and Nutrition Security Profiles
Enabling environment for Nutrition and Food security - Policy documents addressing nutrition issues 1. National Food and Nutrition Policy
In 2002 an inter-sectorial Technical Working Group with participants from 19 departments was designated by the Central Board for F&N to take a multi-sectorial approach to nutrition forward and decided to develop a Food and Nutrition Policy, and produce departmental profiles with nutrition related activities
2. National Plan of Action for Food and Nutrition (NPAFN) (2005-2010) Monitoring by Central Board for Food and Nutrition under the National Health Committee NPAFN updating process initiated in 2011, has not been finalized and approved; the plan is multi-sectorial in its approach
3.. Public Health Law (1993)
Nutrition related issues covered in these policies Covered Comments
yes
Low Birth Weight yes
Maternal undernutrition
Policy Table - 1
yes
Obesity and diet related NCDs
Child obesity bothAlthough obesity and related NCDs feature as emerging issues in the NPAFN, child obesity is not addressed specifically
Adult obesityDiet related NCDs yes
Maternal and Child Undernutrition
Child undernutrition
Infant and Young Child Nutrition
Breastfeeding yes
Complementary feeding yes
Int’l Code of Marketing of BMS yes
Vitamins and Minerals
Supplementation:Vitamin A children/women both
Iron Folic Acid supplementation guidelines for children 6-36mo, adolescent girls and pregnant women
Iron Folate children/women bothZinc children ?Other vitamins & min child/women ?
Food fortification yes Mandatory: Salt (new law just submitted to Parliament)
Social Protection policies or legislation including food or nutrition component
Social protection programmes are offered by sector Ministries. They include cash transfers to families with three or more children, subsidies for medical care for pregnant women, assistance to rural families, and school feeding programmes for Early Childhood Development. A total of 99 per cent of the population has no access to predictable social protection. Discussion on social transfers for poverty alleviation have been initiated (UNICEF-ODI document 2011)
Food safety policies or legislation1. National Food Law (1997)
Monitoring by Food and Drug Board of Authority. Department of Developmental Affairs (DDA) is responsible for food hygiene and food safety of food manufactures and food stalls; street food quality is handled by City Development Committee. Food safety activities are coordinated by Food and Drug Board of Authority
Other policies addressing food security
Underlying and contextual factors
Food Safety yes
Food security ?
Policies take a multisectoral approach to nutrition
Food Aid yes
Nutrition and Infection ?
Gender ?
Maternal leave 12 weeks
Myanmar - Food and Nutrition Security Profiles

Regional RepoRt on nutRition SecuRity in aSean Volume 136
Myanmar - Food and Nutrition Security Profiles
The information included in this Food Security and Nutrition Security Profile is backed by recognized, validated and properly published information available until June 2014. Although updated information might be available at national level form different sources, until requirements of quality, validity and proper
publication are met, it has not been included in this profile.
Demographic Indicators (Table - 5.1)
Population size (thousands) /a
Economic Indicators (Table - 5.3)Year
4,393 2012
33.2 % 2012
Year
52,797 2012
Richest 20%
- -
Income share held by households /c
Unemployment rate /c 6 % 1990
Population below US $ 1.25 (PPP) per day /c (%)
- -
Poverty gap ratio /e - -
Poorest 20%
- -
GDP annual growth rate /c 2.8 % 1990
- -
- -
Gini index /c(100= complete inequality; 0= complete equality)
GDP per capita (PPP) (constant 2011 international dollars) /c
- -
Number of children <5 years (thousand)
Women aged 20-24 who gave birth before age 18 /d (%) 13 2000-2007
Male 63 2012
Adolescent birth rate (number of births per 1,000 adolescent girls aged 15-19) /a
12 2012
Adolescent girls aged 15-19 currently married or in union /d 7.4 % 2009-2010
Female
Adolescents (Table - 5.2)
62.7 % 1998
67.1 2012
Agriculture population density(people/ ha of arable land /b)
Employment in agriculture sector (% of total employment) /c
Women employed in agriculture sector (% of total female employment) /c)
Year
2.9 2006-2008
Education level of mothers of under-fives: None (%) 10 2009-2010
- -
Policy Table - 2
Life expectancy at birth (Years) /a
Average annual population growth 0.85 % 2012
Proportion of population urbanised
Myanmar - Food and Nutrition Security Profiles
Sources:a/ World Bank Health Nutrition and Population Statistics 2013b/ FAOSTAT 2013 Update; c/ World Bank, World Development Indicators Database, 2014 Update; d/ UNICEF, State of the World Children 2014 (data refer to the most recent year available during the period specified) e/ UN Statistics Division, MDG database 2013 Update.f/ Myanmar Multiple Indicator Cluster Survey 2009 - 2010
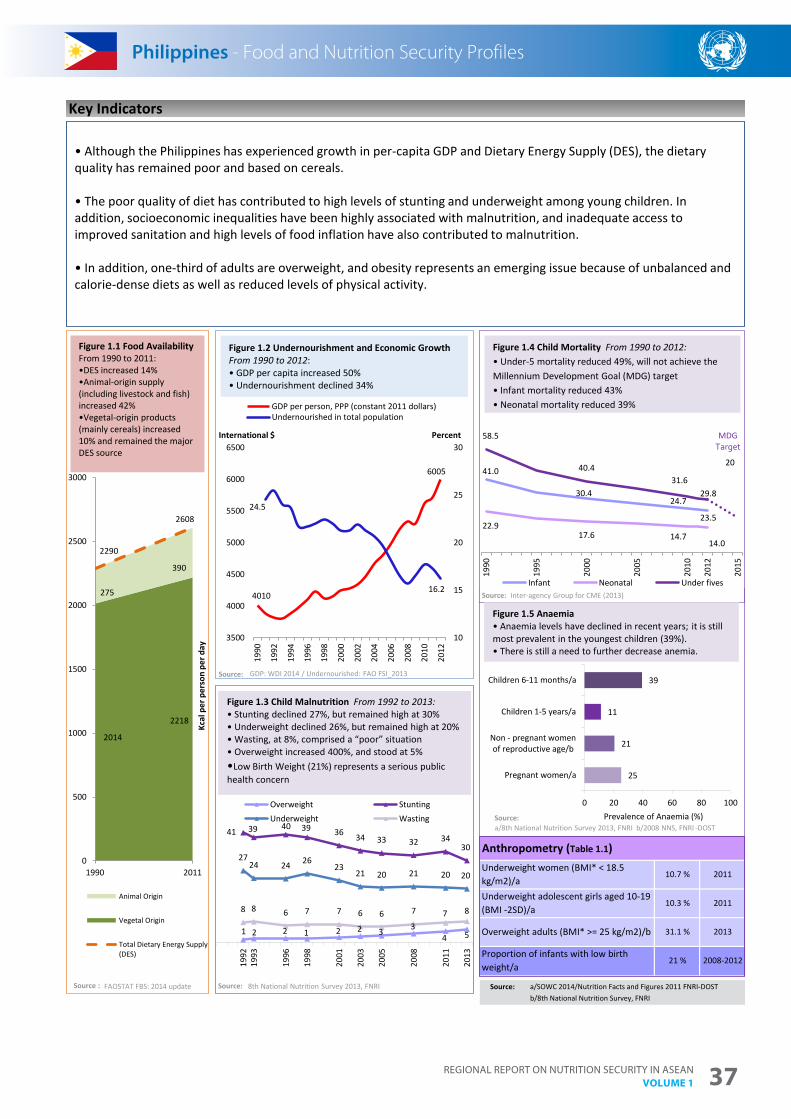
Regional RepoRt on nutRition SecuRity in aSean Volume 1 37
Philippines - Food and Nutrition Security Profiles
Overweight adults (BMI* >= 25 kg/m2)/b 31.1 % 2013
Key Indicators
Anthropometry (Table 1.1)Underweight women (BMI* < 18.5 kg/m2)/aUnderweight adolescent girls aged 10-19 (BMI -2SD)/a
2011
2011
2008-2012
10.7 %
10.3 %
Proportion of infants with low birth weight/a
21 %
b/8th National Nutrition Survey, FNRISource: a/SOWC 2014/Nutrition Facts and Figures 2011 FNRI-DOST
4010
6005
24.5
16.2
10
15
20
25
30
3500
4000
4500
5000
5500
6000
6500
1990
1992
1994
1996
1998
2000
2002
2004
2006
2008
2010
2012
GDP per person, PPP (constant 2011 dollars)Undernourished in total population
1 2 2 1 2 2 3 34 5
41 39 40 39 36 34 33 32 3430
2724 24 26
2321 20 21 20 20
8 8 6 7 7 6 6 7 7 8
1992
1993
1996
1998
2001
2003
2005
2008
2011
2013
Overweight StuntingUnderweight Wasting
Source:
Figure 1.3 Child Malnutrition From 1992 to 2013: • Stunting declined 27%, but remained high at 30% • Underweight declined 26%, but remained high at 20%• Wasting, at 8%, comprised a “poor” situation • Overweight increased 400%, and stood at 5%•Low Birth Weight (21%) represents a serious public health concern
• Although the Philippines has experienced growth in per-capita GDP and Dietary Energy Supply (DES), the dietary quality has remained poor and based on cereals.
• The poor quality of diet has contributed to high levels of stunting and underweight among young children. In addition, socioeconomic inequalities have been highly associated with malnutrition, and inadequate access to improved sanitation and high levels of food inflation have also contributed to malnutrition.
• In addition, one-third of adults are overweight, and obesity represents an emerging issue because of unbalanced and calorie-dense diets as well as reduced levels of physical activity.
25
21
11
39
0 20 40 60 80 100
Pregnant women/a
Non - pregnant womenof reproductive age/b
Children 1-5 years/a
Children 6-11 months/a
Prevalence of Anaemia (%)
2014
2218
275
390
2290
2608
0
500
1000
1500
2000
2500
3000
1990 2011
Kcal
per
per
son
per d
ay
Animal Origin
Vegetal Origin
Total Dietary Energy Supply(DES)
Figure 1.1 Food Availability From 1990 to 2011: •DES increased 14% •Animal-origin supply (including livestock and fish) increased 42% •Vegetal-origin products (mainly cereals) increased 10% and remained the major DES source
41.0
30.424.7
23.522.9
17.6 14.714.0
58.5
40.431.6
29.8
20
1990
1995
2000
2005
2010
2012
2015
Infant Neonatal Under fives
Philippines - Food and Nutrition Security Profiles
Figure 1.5 Anaemia • Anaemia levels have declined in recent years; it is still most prevalent in the youngest children (39%).• There is still a need to further decrease anemia.
Figure 1.4 Child Mortality From 1990 to 2012:• Under-5 mortality reduced 49%, will not achieve the Millennium Development Goal (MDG) target• Infant mortality reduced 43%• Neonatal mortality reduced 39%
Figure 1.2 Undernourishment and Economic Growth From 1990 to 2012: • GDP per capita increased 50%• Undernourishment declined 34%
MDGTarget
PercentInternational $
Source:
Source:
Source:
Source : FAOSTAT FBS: 2014 update 8th National Nutrition Survey 2013, FNRI
GDP: WDI 2014 / Undernourished: FAO FSI_2013
Inter-agency Group for CME (2013)
a/8th National Nutrition Survey 2013, FNRI b/2008 NNS, FNRI -DOST
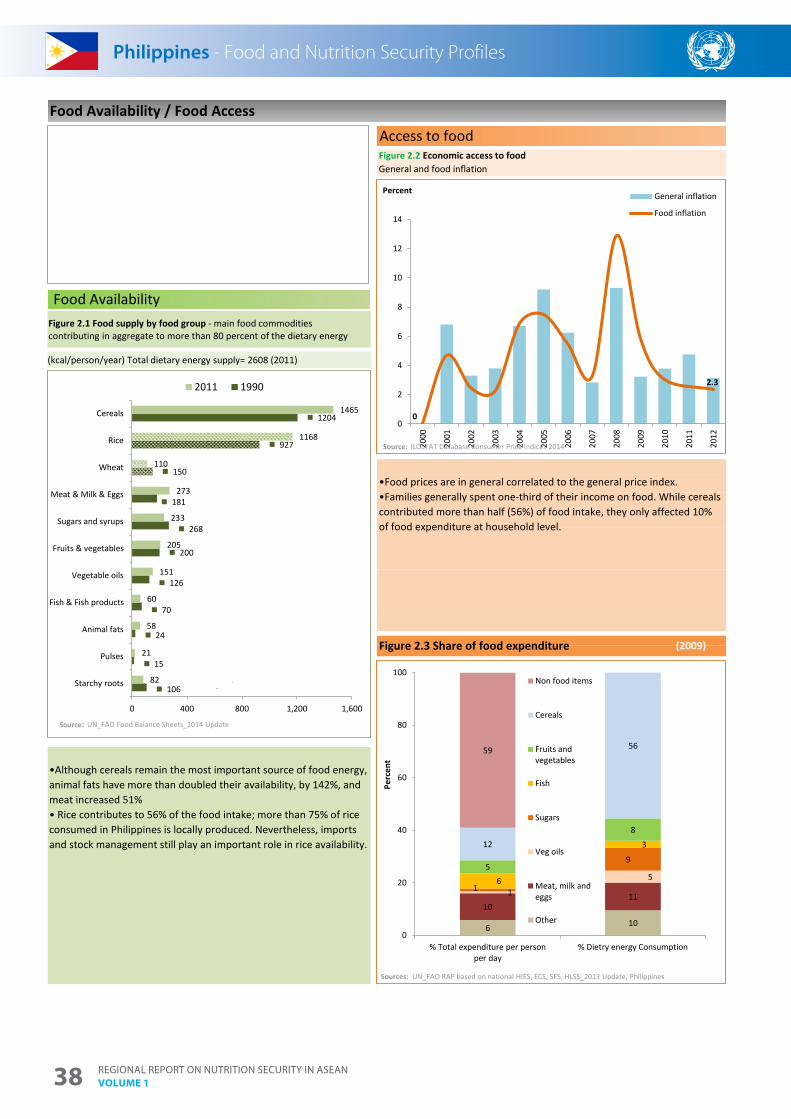
Regional RepoRt on nutRition SecuRity in aSean Volume 138
Philippines - Food and Nutrition Security Profiles
•Although cereals remain the most important source of food energy, animal fats have more than doubled their availability, by 142%, and meat increased 51%• Rice contributes to 56% of the food intake; more than 75% of rice consumed in Philippines is locally produced. Nevertheless, imports and stock management still play an important role in rice availability.
Access to food
•Food prices are in general correlated to the general price index. •Families generally spent one-third of their income on food. While cereals contributed more than half (56%) of food intake, they only affected 10% of food expenditure at household level.
Food Availability / Food Access
Food Availability
Figure 2.2 Economic access to foodGeneral and food inflation
(2009)Figure 2.3 Share of food expenditure
106
15
24
70
126
200
268
181
150
927
1204
82
21
58
60
151
205
233
273
110
1168
1465
Starchy roots
Pulses
Animal fats
Fish & Fish products
Vegetable oils
Fruits & vegetables
Sugars and syrups
Meat & Milk & Eggs
Wheat
Rice
Cereals
0 400 800 1,200 1,600
2011 1990
Source:
(kcal/person/year) Total dietary energy supply= 2608 (2011)
Philippines - Food and Nutrition Security Profiles
Figure 2.1 Food supply by food group - main food commodities contributing in aggregate to more than 80 percent of the dietary energy
0
2.3
0
2
4
6
8
10
12
14
2000
2001
2002
2003
2004
2005
2006
2007
2008
2009
2010
2011
2012
General inflation
Food inflation
Source:
6 10
10111
51
9
6
3
5
812
5659
0
20
40
60
80
100
% Total expenditure per personper day
% Dietry energy Consumption
Perc
ent
Non food items
Cereals
Fruits andvegetables
Fish
Sugars
Veg oils
Meat, milk andeggs
Other
Sources:
Percent
ILOSTAT Database Consumer Price Indices 2014
UN_FAO Food Balance Sheets_2014 Update
UN_FAO RAP based on national HIES, ECS, SES, HLSS_2013 Update, Philippines
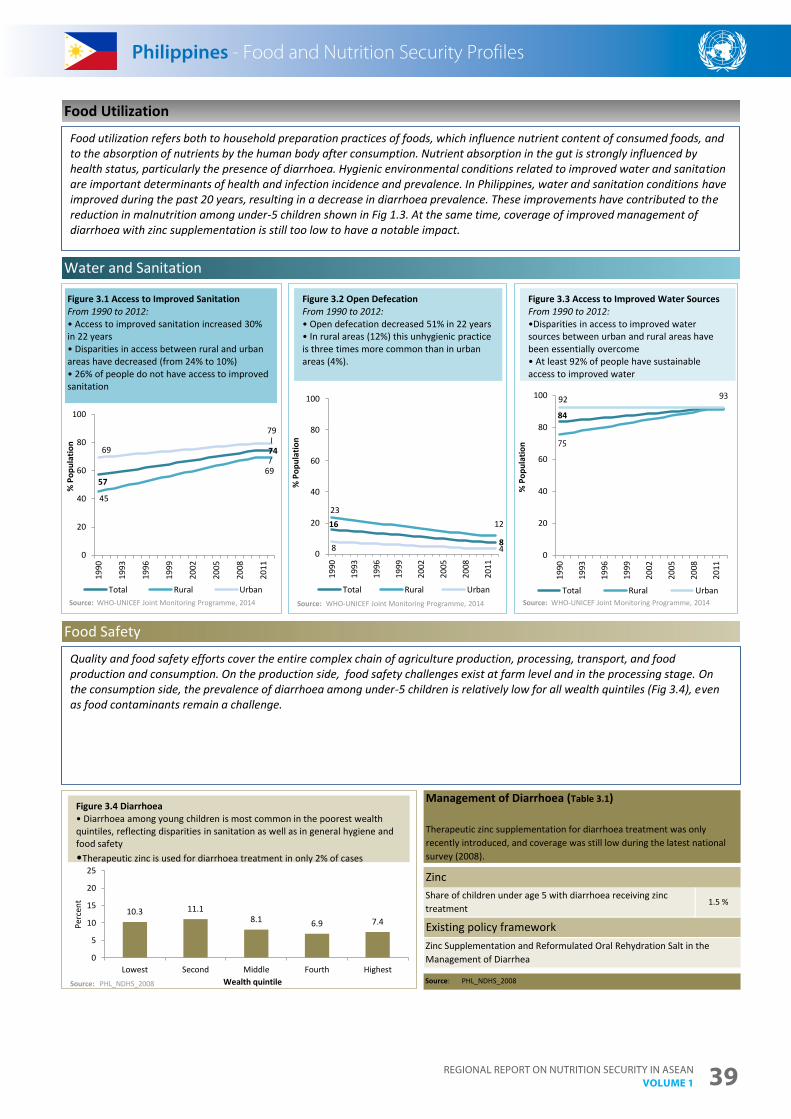
Regional RepoRt on nutRition SecuRity in aSean Volume 1 39
Philippines - Food and Nutrition Security Profiles
Food Safety
Management of Diarrhoea (Table 3.1)
Therapeutic zinc supplementation for diarrhoea treatment was only recently introduced, and coverage was still low during the latest national survey (2008).
1.5 %
Water and Sanitation
Food Utilization
Zinc
Existing policy frameworkZinc Supplementation and Reformulated Oral Rehydration Salt in the Management of Diarrhea
Source:
Share of children under age 5 with diarrhoea receiving zinc treatment
16
8
2312
8 40
20
40
60
80
100
1990
1993
1996
1999
2002
2005
2008
2011
% P
opul
atio
n
Total Rural Urban
57
74
45
69
69
79
0
20
40
60
80
100
1990
1993
1996
1999
2002
2005
2008
2011
% P
opul
atio
n
Total Rural Urban
10.3 11.18.1 6.9 7.4
0
5
10
15
20
25
Lowest Second Middle Fourth Highest
Perc
ent
Wealth quintileSource: PHL_NDHS_2008
84
75
92 93
0
20
40
60
80
100
1990
1993
1996
1999
2002
2005
2008
2011
% P
opul
atio
n
Total Rural UrbanSource:
Philippines - Food and Nutrition Security Profiles
Figure 3.1 Access to Improved Sanitation From 1990 to 2012:• Access to improved sanitation increased 30% in 22 years• Disparities in access between rural and urban areas have decreased (from 24% to 10%) • 26% of people do not have access to improved sanitation
Source: Source:
Food utilization refers both to household preparation practices of foods, which influence nutrient content of consumed foods, and to the absorption of nutrients by the human body after consumption. Nutrient absorption in the gut is strongly influenced by health status, particularly the presence of diarrhoea. Hygienic environmental conditions related to improved water and sanitation are important determinants of health and infection incidence and prevalence. In Philippines, water and sanitation conditions have improved during the past 20 years, resulting in a decrease in diarrhoea prevalence. These improvements have contributed to the reduction in malnutrition among under-5 children shown in Fig 1.3. At the same time, coverage of improved management of diarrhoea with zinc supplementation is still too low to have a notable impact.
Figure 3.4 Diarrhoea • Diarrhoea among young children is most common in the poorest wealth quintiles, reflecting disparities in sanitation as well as in general hygiene and food safety •Therapeutic zinc is used for diarrhoea treatment in only 2% of cases
Figure 3.2 Open Defecation From 1990 to 2012:• Open defecation decreased 51% in 22 years• In rural areas (12%) this unhygienic practice is three times more common than in urban areas (4%).
Figure 3.3 Access to Improved Water Sources From 1990 to 2012:•Disparities in access to improved water sources between urban and rural areas have been essentially overcome • At least 92% of people have sustainable access to improved water
Quality and food safety efforts cover the entire complex chain of agriculture production, processing, transport, and food production and consumption. On the production side, food safety challenges exist at farm level and in the processing stage. On the consumption side, the prevalence of diarrhoea among under-5 children is relatively low for all wealth quintiles (Fig 3.4), even as food contaminants remain a challenge.
WHO-UNICEF Joint Monitoring Programme, 2014 WHO-UNICEF Joint Monitoring Programme, 2014 WHO-UNICEF Joint Monitoring Programme, 2014
PHL_NDHS_2008
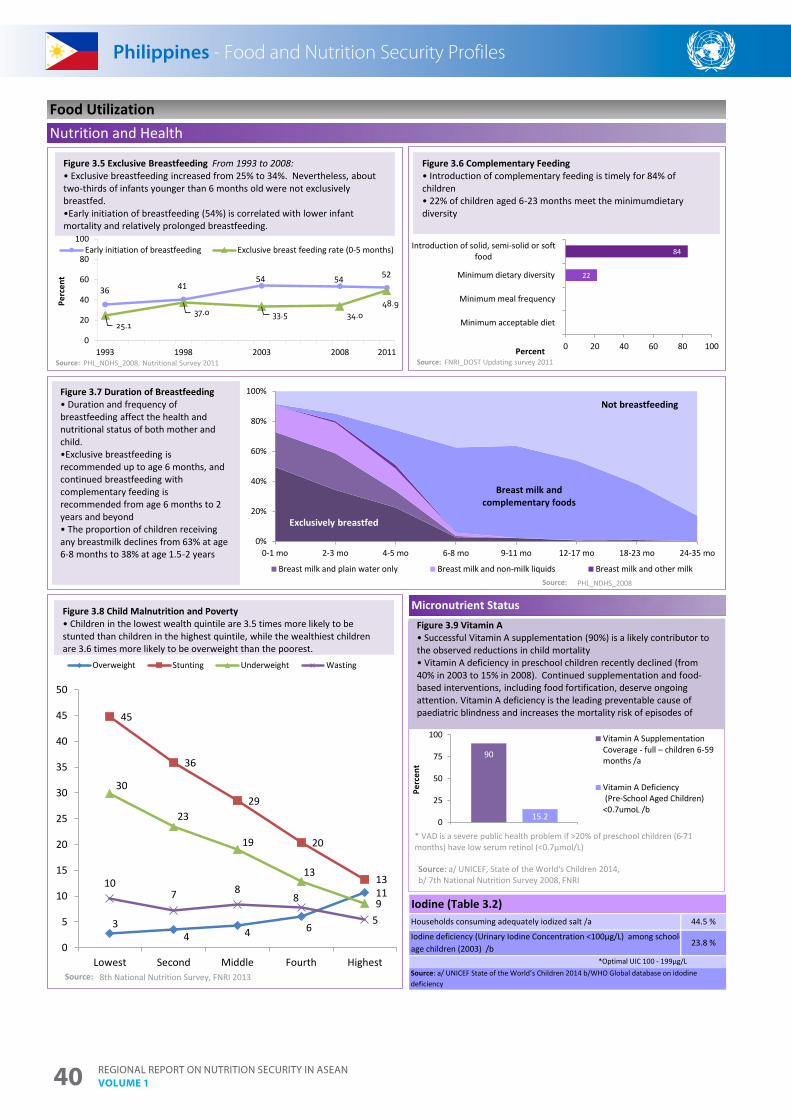
Regional RepoRt on nutRition SecuRity in aSean Volume 140
Philippines - Food and Nutrition Security Profiles
*Optimal UIC 100 - 199µg/L
44.5 %Households consuming adequately iodized salt /a
Micronutrient Status
Iodine (Table 3.2)
Food Utilization
Iodine deficiency (Urinary Iodine Concentration <100µg/L) among school-age children (2003) /b
Source: a/ UNICEF State of the World’s Children 2014 b/WHO Global database on idodine deficiency
23.8 %
Nutrition and Health
90
15.20
25
50
75
100
Perc
ent
Vitamin A Supplementation Coverage - full – children 6-59 months /a
Vitamin A Deficiency (Pre-School Aged Children)<0.7umoL /b
22
84
0 20 40 60 80 100
Minimum acceptable diet
Minimum meal frequency
Minimum dietary diversity
Introduction of solid, semi-solid or softfood
PercentSource:
Figure 3.6 Complementary Feeding • Introduction of complementary feeding is timely for 84% of children• 22% of children aged 6-23 months meet the minimumdietary diversity
36 4154 54 52
25.137.0 33.5 34.0
48.9
0
20
40
60
80
100
1993 1998 2003 2008 2011
Perc
ent
Early initiation of breastfeeding Exclusive breast feeding rate (0-5 months)
Source:
Figure 3.5 Exclusive Breastfeeding From 1993 to 2008: • Exclusive breastfeeding increased from 25% to 34%. Nevertheless, about two-thirds of infants younger than 6 months old were not exclusively breastfed.•Early initiation of breastfeeding (54%) is correlated with lower infant mortality and relatively prolonged breastfeeding.
Exclusively breastfed
Breast milk and complementary foods
Not breastfeeding
0%
20%
40%
60%
80%
100%
0-1 mo 2-3 mo 4-5 mo 6-8 mo 9-11 mo 12-17 mo 18-23 mo 24-35 mo
Breast milk and plain water only Breast milk and non-milk liquids Breast milk and other milk
Figure 3.7 Duration of Breastfeeding• Duration and frequency of breastfeeding affect the health and nutritional status of both mother and child. •Exclusive breastfeeding is recommended up to age 6 months, and continued breastfeeding with complementary feeding is recommended from age 6 months to 2 years and beyond • The proportion of children receiving any breastmilk declines from 63% at age 6-8 months to 38% at age 1.5-2 years
Source:
Philippines - Food and Nutrition Security Profiles
Figure 3.8 Child Malnutrition and Poverty • Children in the lowest wealth quintile are 3.5 times more likely to be stunted than children in the highest quintile, while the wealthiest children are 3.6 times more likely to be overweight than the poorest.
Figure 3.9 Vitamin A • Successful Vitamin A supplementation (90%) is a likely contributor to the observed reductions in child mortality • Vitamin A deficiency in preschool children recently declined (from 40% in 2003 to 15% in 2008). Continued supplementation and food-based interventions, including food fortification, deserve ongoing attention. Vitamin A deficiency is the leading preventable cause of paediatric blindness and increases the mortality risk of episodes of
Source: a/ UNICEF, State of the World's Children 2014,b/ 7th National Nutrition Survey 2008, FNRI
* VAD is a severe public health problem if >20% of preschool children (6-71 months) have low serum retinol (<0.7µmol/L)
34 4 6
11
45
36
29
20
13
30
23
19
13
9
107 8
8
5
0
5
10
15
20
25
30
35
40
45
50
Lowest Second Middle Fourth Highest
Overweight Stunting Underweight Wasting
Source: 8th National Nutrition Survey, FNRI 2013
PHL_NDHS_2008, Nutritional Survey 2011 FNRI_DOST Updating survey 2011
PHL_NDHS_2008
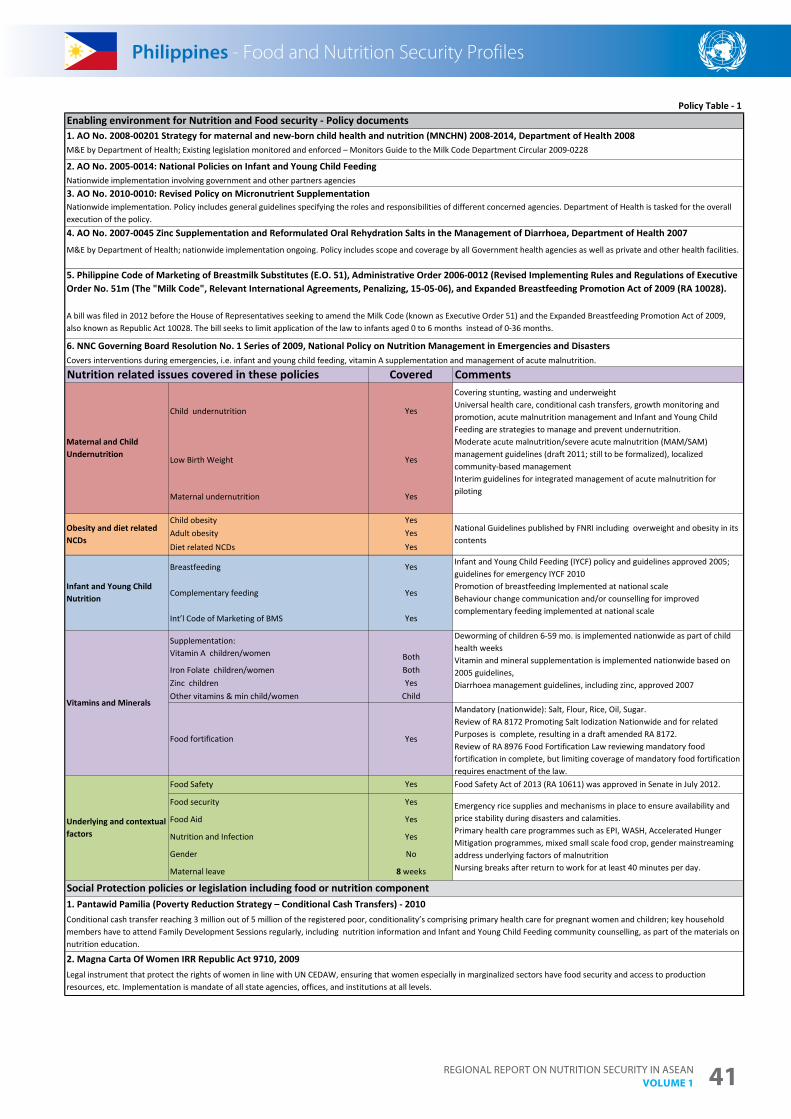
Regional RepoRt on nutRition SecuRity in aSean Volume 1 41
Philippines - Food and Nutrition Security Profiles
Complementary feeding Yes
Yes
Yes
Child
Iron Folate children/women
Covering stunting, wasting and underweight Universal health care, conditional cash transfers, growth monitoring and promotion, acute malnutrition management and Infant and Young Child Feeding are strategies to manage and prevent undernutrition.Moderate acute malnutrition/severe acute malnutrition (MAM/SAM) management guidelines (draft 2011; still to be formalized), localized community-based managementInterim guidelines for integrated management of acute malnutrition for piloting
Obesity and diet related NCDs
Child undernutrition
Low Birth Weight
Social Protection policies or legislation including food or nutrition component
Infant and Young Child Feeding (IYCF) policy and guidelines approved 2005; guidelines for emergency IYCF 2010 Promotion of breastfeeding Implemented at national scale Behaviour change communication and/or counselling for improved complementary feeding implemented at national scale
Adult obesity YesDiet related NCDs Yes
Infant and Young Child Nutrition
Breastfeeding Yes
Yes
Yes
Both
Deworming of children 6-59 mo. is implemented nationwide as part of child health weeks Vitamin and mineral supplementation is implemented nationwide based on 2005 guidelines,Diarrhoea management guidelines, including zinc, approved 2007
Maternal undernutrition
Child obesity
Gender No
Emergency rice supplies and mechanisms in place to ensure availability and price stability during disasters and calamities.Primary health care programmes such as EPI, WASH, Accelerated Hunger Mitigation programmes, mixed small scale food crop, gender mainstreaming address underlying factors of malnutritionNursing breaks after return to work for at least 40 minutes per day.
Underlying and contextual factors
Food Safety
Int’l Code of Marketing of BMS
Policy Table - 1
CommentsCovered
YesBoth
M&E by Department of Health; nationwide implementation ongoing. Policy includes scope and coverage by all Government health agencies as well as private and other health facilities.
Nutrition and Infection
Yes
Yes
Zinc childrenOther vitamins & min child/women
Maternal and Child Undernutrition
National Guidelines published by FNRI including overweight and obesity in its contents
Enabling environment for Nutrition and Food security - Policy documents 1. AO No. 2008-00201 Strategy for maternal and new-born child health and nutrition (MNCHN) 2008-2014, Department of Health 2008 M&E by Department of Health; Existing legislation monitored and enforced – Monitors Guide to the Milk Code Department Circular 2009-0228
2. AO No. 2005-0014: National Policies on Infant and Young Child FeedingNationwide implementation involving government and other partners agencies3. AO No. 2010-0010: Revised Policy on Micronutrient SupplementationNationwide implementation. Policy includes general guidelines specifying the roles and responsibilities of different concerned agencies. Department of Health is tasked for the overall execution of the policy. 4. AO No. 2007-0045 Zinc Supplementation and Reformulated Oral Rehydration Salts in the Management of Diarrhoea, Department of Health 2007
5. Philippine Code of Marketing of Breastmilk Substitutes (E.O. 51), Administrative Order 2006-0012 (Revised Implementing Rules and Regulations of Executive Order No. 51m (The "Milk Code", Relevant International Agreements, Penalizing, 15-05-06), and Expanded Breastfeeding Promotion Act of 2009 (RA 10028).
A bill was filed in 2012 before the House of Representatives seeking to amend the Milk Code (known as Executive Order 51) and the Expanded Breastfeeding Promotion Act of 2009, also known as Republic Act 10028. The bill seeks to limit application of the law to infants aged 0 to 6 months instead of 0-36 months.
Nutrition related issues covered in these policies
2. Magna Carta Of Women IRR Republic Act 9710, 2009Legal instrument that protect the rights of women in line with UN CEDAW, ensuring that women especially in marginalized sectors have food security and access to production resources, etc. Implementation is mandate of all state agencies, offices, and institutions at all levels.
6. NNC Governing Board Resolution No. 1 Series of 2009, National Policy on Nutrition Management in Emergencies and DisastersCovers interventions during emergencies, i.e. infant and young child feeding, vitamin A supplementation and management of acute malnutrition.
Food fortification Yes
Mandatory (nationwide): Salt, Flour, Rice, Oil, Sugar.Review of RA 8172 Promoting Salt Iodization Nationwide and for related Purposes is complete, resulting in a draft amended RA 8172.Review of RA 8976 Food Fortification Law reviewing mandatory food fortification in complete, but limiting coverage of mandatory food fortification requires enactment of the law.
Vitamins and Minerals
Supplementation:Vitamin A children/women
Yes
Food security Yes
Maternal leave 8 weeks
Food Safety Act of 2013 (RA 10611) was approved in Senate in July 2012.
Food Aid
1. Pantawid Pamilia (Poverty Reduction Strategy – Conditional Cash Transfers) - 2010Conditional cash transfer reaching 3 million out of 5 million of the registered poor, conditionality’s comprising primary health care for pregnant women and children; key household members have to attend Family Development Sessions regularly, including nutrition information and Infant and Young Child Feeding community counselling, as part of the materials on nutrition education.
Yes
Philippines - Food and Nutrition Security Profiles
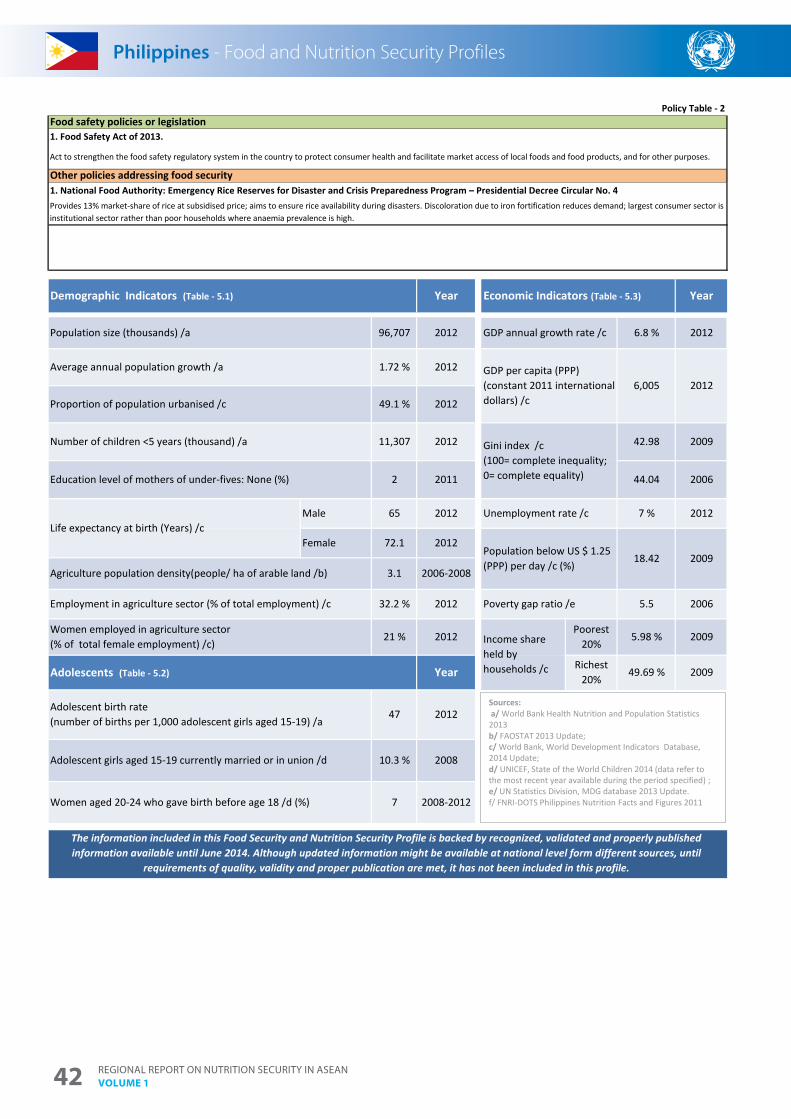
Regional RepoRt on nutRition SecuRity in aSean Volume 142
Philippines - Food and Nutrition Security Profiles
47
2008-2012
Male 65 2012
Adolescent birth rate (number of births per 1,000 adolescent girls aged 15-19) /a
The information included in this Food Security and Nutrition Security Profile is backed by recognized, validated and properly published information available until June 2014. Although updated information might be available at national level form different sources, until
requirements of quality, validity and proper publication are met, it has not been included in this profile.
Life expectancy at birth (Years) /c
Average annual population growth /a 1.72 % 2012
Proportion of population urbanised /c 49.1 % 2012
Number of children <5 years (thousand) /a 11,307 2012
Education level of mothers of under-fives: None (%) 2 2011
21 % 2012
Women aged 20-24 who gave birth before age 18 /d (%) 7
2012
Adolescent girls aged 15-19 currently married or in union /d 10.3 % 2008
Female
Adolescents (Table - 5.2)
32.2 % 2012
72.1 2012
Agriculture population density(people/ ha of arable land /b)
Employment in agriculture sector (% of total employment) /c
Women employed in agriculture sector (% of total female employment) /c)
Year
3.1 2006-2008
42.98 2009
Policy Table - 2
Population size (thousands) /a
Economic Indicators (Table - 5.3)Year Year
96,707 2012 GDP annual growth rate /c 6.8 % 2012
Food safety policies or legislation1. Food Safety Act of 2013.
Act to strengthen the food safety regulatory system in the country to protect consumer health and facilitate market access of local foods and food products, and for other purposes.
Other policies addressing food security1. National Food Authority: Emergency Rice Reserves for Disaster and Crisis Preparedness Program – Presidential Decree Circular No. 4Provides 13% market-share of rice at subsidised price; aims to ensure rice availability during disasters. Discoloration due to iron fortification reduces demand; largest consumer sector is institutional sector rather than poor households where anaemia prevalence is high.
Richest 20%
49.69 % 2009
Income share held by households /c
Unemployment rate /c 7 % 2012
Population below US $ 1.25 (PPP) per day /c (%)
18.42 2009
Poverty gap ratio /e 5.5 2006
Poorest 20%
5.98 % 2009
44.04 2006
Gini index /c(100= complete inequality; 0= complete equality)
GDP per capita (PPP) (constant 2011 international dollars) /c
6,005 2012
Demographic Indicators (Table - 5.1)
Philippines - Food and Nutrition Security Profiles
Sources:a/ World Bank Health Nutrition and Population Statistics
2013b/ FAOSTAT 2013 Update; c/ World Bank, World Development Indicators Database, 2014 Update; d/ UNICEF, State of the World Children 2014 (data refer to the most recent year available during the period specified) ;e/ UN Statistics Division, MDG database 2013 Update.f/ FNRI-DOTS Philippines Nutrition Facts and Figures 2011
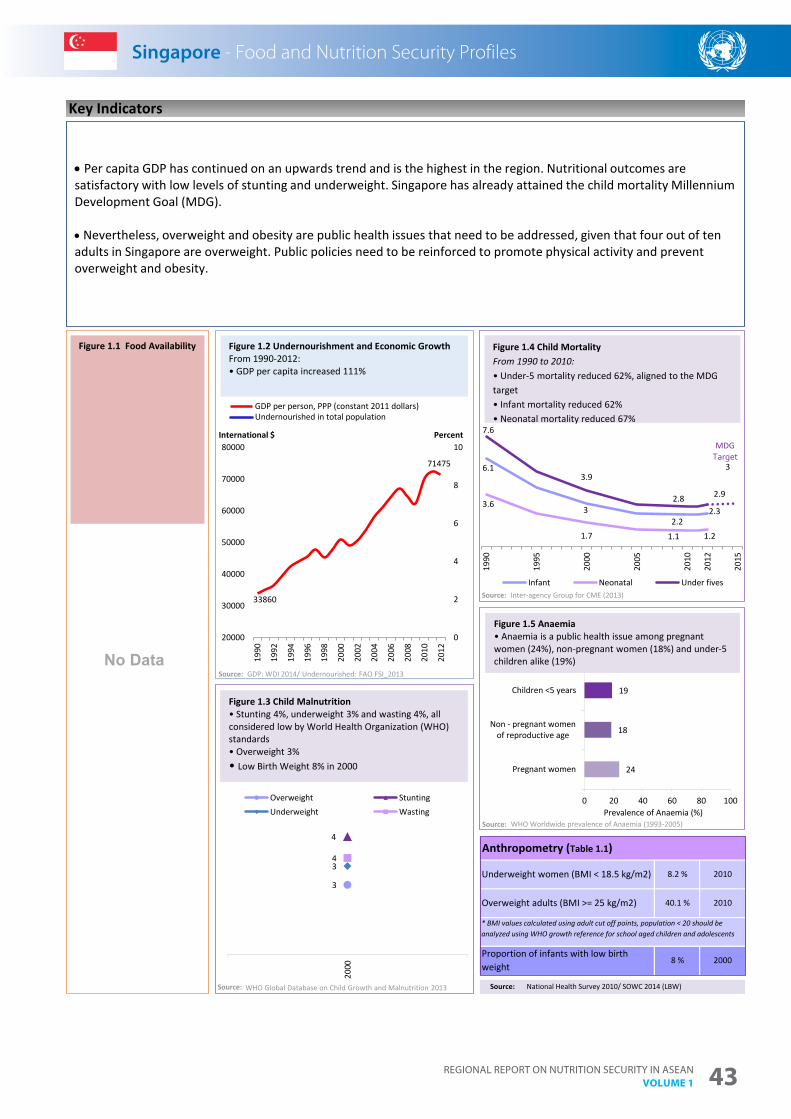
Regional RepoRt on nutRition SecuRity in aSean Volume 1 43
Singapore - Food and Nutrition Security Profiles
* BMI values calculated using adult cut off points, population < 20 should be analyzed using WHO growth reference for school aged children and adolescents
2010
2010
2000
8.2 %
40.1 %
8 %Proportion of infants with low birth weight
Source: National Health Survey 2010/ SOWC 2014 (LBW)
Key Indicators
Anthropometry (Table 1.1)
Underweight women (BMI < 18.5 kg/m2)
Overweight adults (BMI >= 25 kg/m2)
33860
71475
0
2
4
6
8
10
20000
30000
40000
50000
60000
70000
80000
1990
1992
1994
1996
1998
2000
2002
2004
2006
2008
2010
2012
GDP per person, PPP (constant 2011 dollars)Undernourished in total population
3
4
34
2000
Overweight StuntingUnderweight Wasting
Source:
Figure 1.3 Child Malnutrition • Stunting 4%, underweight 3% and wasting 4%, all considered low by World Health Organization (WHO) standards • Overweight 3%• Low Birth Weight 8% in 2000
Per capita GDP has continued on an upwards trend and is the highest in the region. Nutritional outcomes are satisfactory with low levels of stunting and underweight. Singapore has already attained the child mortality Millennium Development Goal (MDG).
Nevertheless, overweight and obesity are public health issues that need to be addressed, given that four out of ten adults in Singapore are overweight. Public policies need to be reinforced to promote physical activity and prevent overweight and obesity.
24
18
19
0 20 40 60 80 100
Pregnant women
Non - pregnant womenof reproductive age
Children <5 years
Total <2 yr
Prevalence of Anaemia (%)
Figure 1.1 Food Availability
No Data
6.1
32.2
2.33.6
1.7 1.1 1.2
7.6
3.9
2.8 2.9
3
1990
1995
2000
2005
2010
2012
2015
Infant Neonatal Under fives
Singapore - Food and Nutrition Security Profiles
Figure 1.5 Anaemia • Anaemia is a public health issue among pregnant women (24%), non-pregnant women (18%) and under-5 children alike (19%)
Figure 1.4 Child MortalityFrom 1990 to 2010:• Under-5 mortality reduced 62%, aligned to the MDG target • Infant mortality reduced 62%• Neonatal mortality reduced 67%
Figure 1.2 Undernourishment and Economic Growth From 1990-2012: • GDP per capita increased 111%
MDGTarget
International $
Source:
Source:
Source:
WHO Global Database on Child Growth and Malnutrition 2013
GDP: WDI 2014/ Undernourished: FAO FSI_2013
Inter-agency Group for CME (2013)
WHO Worldwide prevalence of Anaemia (1993-2005)
Percent
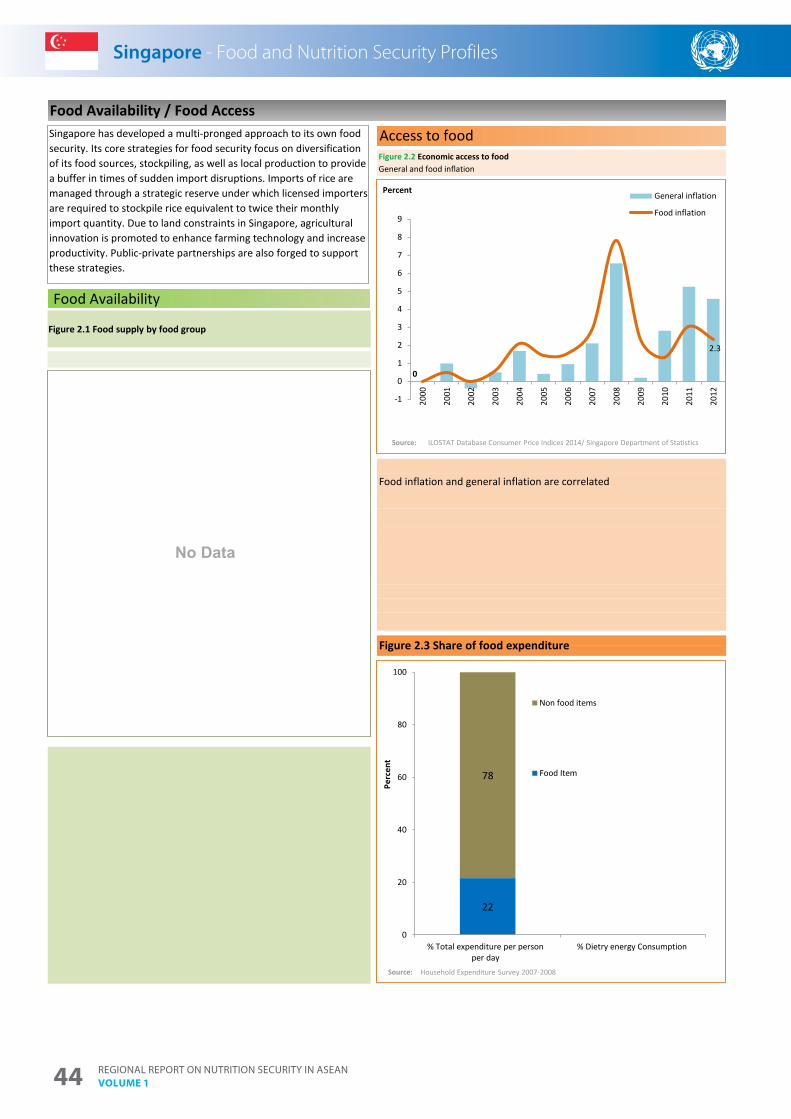
Regional RepoRt on nutRition SecuRity in aSean Volume 144
Singapore - Food and Nutrition Security Profiles
Singapore has developed a multi-pronged approach to its own food security. Its core strategies for food security focus on diversification of its food sources, stockpiling, as well as local production to provide a buffer in times of sudden import disruptions. Imports of rice are managed through a strategic reserve under which licensed importers are required to stockpile rice equivalent to twice their monthly import quantity. Due to land constraints in Singapore, agricultural innovation is promoted to enhance farming technology and increase productivity. Public-private partnerships are also forged to support these strategies.
Access to foodFigure 2.2 Economic access to foodGeneral and food inflation
Figure 2.3 Share of food expenditure
Food Availability
Food inflation and general inflation are correlated
Food Availability / Food Access
No Data
Singapore - Food and Nutrition Security Profiles
Figure 2.1 Food supply by food group
0
2.3
-1
0
1
2
3
4
5
6
7
8
9
2000
2001
2002
2003
2004
2005
2006
2007
2008
2009
2010
2011
2012
General inflation
Food inflation
ILOSTAT Database Consumer Price Indices 2014/ Singapore Department of StatisticsSource:
22
78
0
20
40
60
80
100
% Total expenditure per personper day
% Dietry energy Consumption
Perc
ent
Non food items
Food Item
Source: Household Expenditure Survey 2007-2008
Percent
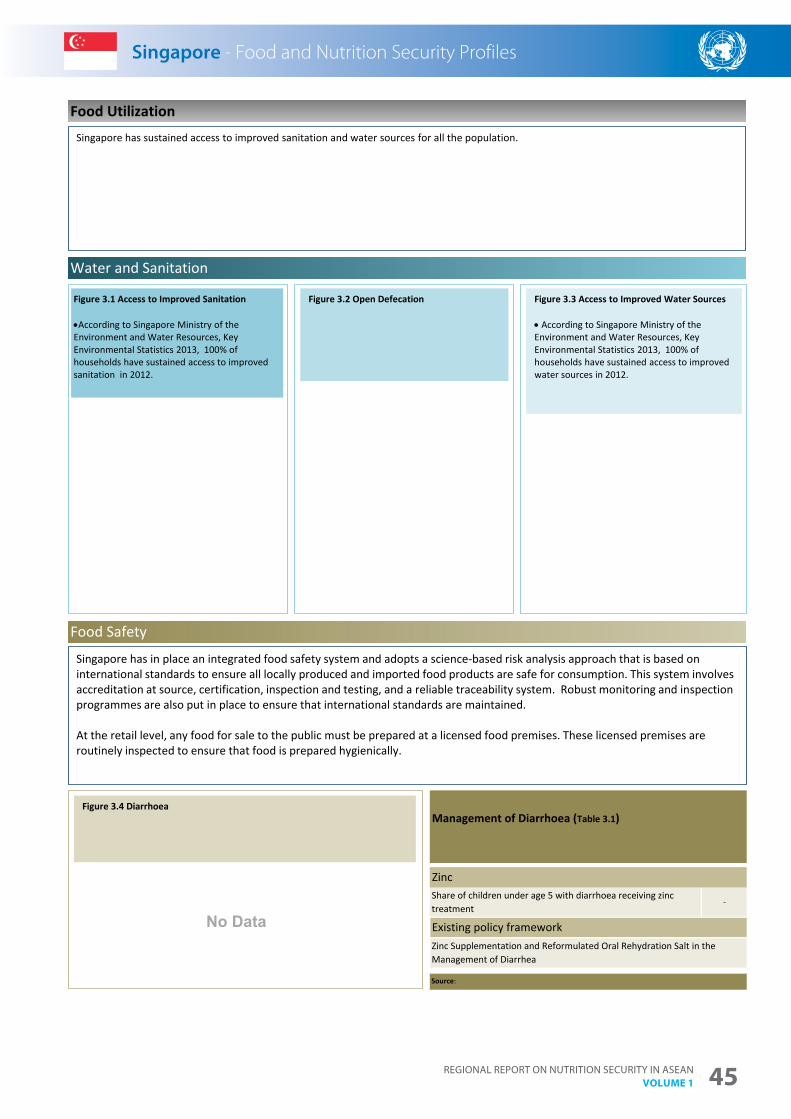
Regional RepoRt on nutRition SecuRity in aSean Volume 1 45
Singapore - Food and Nutrition Security Profiles
-Share of children under age 5 with diarrhoea receiving zinc treatment
Food Safety
Water and Sanitation
Food Utilization
Zinc
Existing policy frameworkZinc Supplementation and Reformulated Oral Rehydration Salt in the Management of Diarrhea
Source:
Management of Diarrhoea (Table 3.1)
No Data
Singapore - Food and Nutrition Security Profiles
Figure 3.1 Access to Improved Sanitation
According to Singapore Ministry of the Environment and Water Resources, Key Environmental Statistics 2013, 100% of households have sustained access to improved sanitation in 2012.
Singapore has sustained access to improved sanitation and water sources for all the population.
Figure 3.4 Diarrhoea
Figure 3.2 Open Defecation Figure 3.3 Access to Improved Water Sources
According to Singapore Ministry of the Environment and Water Resources, Key Environmental Statistics 2013, 100% of households have sustained access to improved water sources in 2012.
Singapore has in place an integrated food safety system and adopts a science-based risk analysis approach that is based on international standards to ensure all locally produced and imported food products are safe for consumption. This system involvesaccreditation at source, certification, inspection and testing, and a reliable traceability system. Robust monitoring and inspection programmes are also put in place to ensure that international standards are maintained.
At the retail level, any food for sale to the public must be prepared at a licensed food premises. These licensed premises are routinely inspected to ensure that food is prepared hygienically.
Regional RepoRt on nutRition SecuRity in aSean Volume 146
Singapore - Food and Nutrition Security Profiles
*Optimal UIC 100 - 199µg/L
Source:
-
Nutrition and Health
-Households consuming adequately iodized salt
Iodine deficiency (Urinary Iodine Concentration <100µg/L) among school-age children
Micronutrient Status
Iodine (Table 3.2)
Food Utilization
No Data
Figure 3.6 Complementary Feeding Figure 3.5 Exclusive Breastfeeding
Figure 3.7 Duration of Breastfeeding
Health Promotion Board (HPB) in Singapore recommends that infants should be exclusively breastfed (i.e. the infant is given only breast milk with no other food or fluids, even water) during the first six months of life. Solid food can be introduced at seven months of age, and breastfeeding should continue till the child is 12 months old and thereafter as long as mutually desired.
No Data
Singapore - Food and Nutrition Security Profiles
Figure 3.8 Child Malnutrition and Poverty
Figure 3.9 Vitamin A
No Data
No DataNo Data
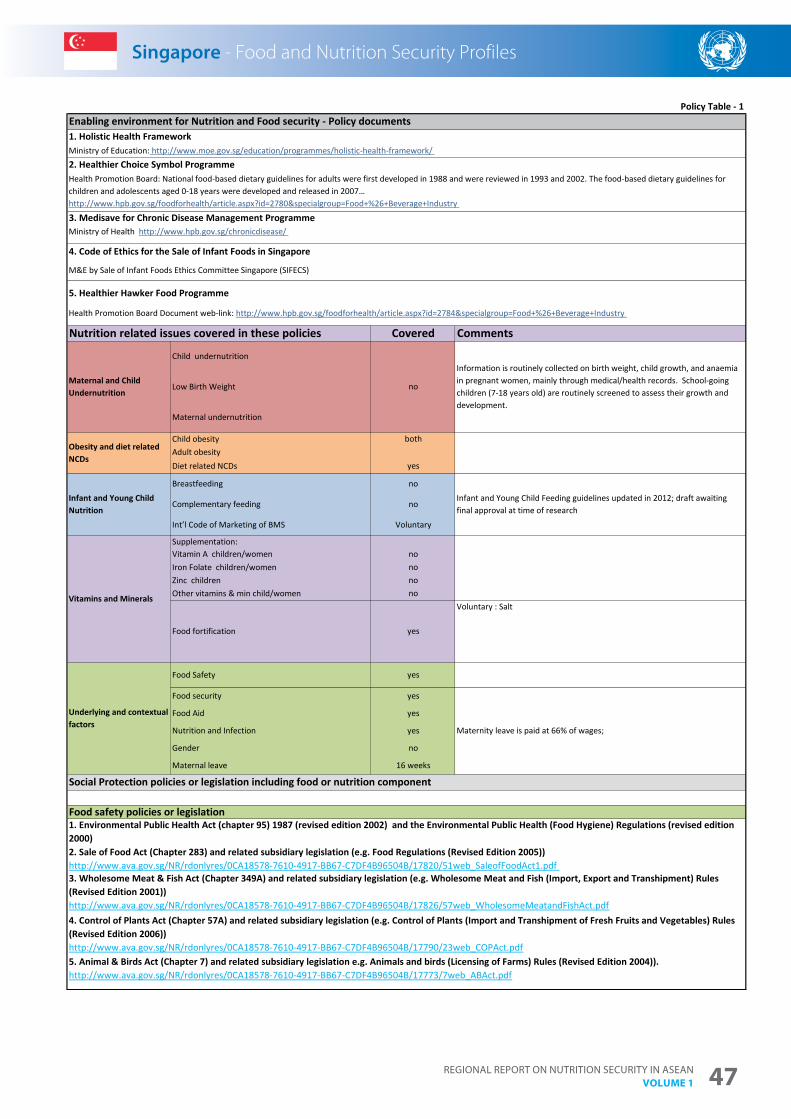
Regional RepoRt on nutRition SecuRity in aSean Volume 1 47
Singapore - Food and Nutrition Security Profiles
Enabling environment for Nutrition and Food security - Policy documents 1. Holistic Health Framework Ministry of Education: http://www.moe.gov.sg/education/programmes/holistic-health-framework/ 2. Healthier Choice Symbol Programme Health Promotion Board: National food-based dietary guidelines for adults were first developed in 1988 and were reviewed in 1993 and 2002. The food-based dietary guidelines for children and adolescents aged 0-18 years were developed and released in 2007…http://www.hpb.gov.sg/foodforhealth/article.aspx?id=2780&specialgroup=Food+%26+Beverage+Industry
3. Medisave for Chronic Disease Management Programme Ministry of Health http://www.hpb.gov.sg/chronicdisease/
4. Code of Ethics for the Sale of Infant Foods in Singapore
M&E by Sale of Infant Foods Ethics Committee Singapore (SIFECS)
5. Healthier Hawker Food Programme
Health Promotion Board Document web-link: http://www.hpb.gov.sg/foodforhealth/article.aspx?id=2784&specialgroup=Food+%26+Beverage+Industry
Policy Table - 1
Nutrition related issues covered in these policies Covered Comments
Maternal and Child Undernutrition
Child undernutritionInformation is routinely collected on birth weight, child growth, and anaemia in pregnant women, mainly through medical/health records. School-going children (7-18 years old) are routinely screened to assess their growth and development.
Low Birth Weight no
Maternal undernutrition
Obesity and diet related NCDs
Child obesity bothAdult obesityDiet related NCDs yes
Infant and Young Child Nutrition
Breastfeeding noInfant and Young Child Feeding guidelines updated in 2012; draft awaiting final approval at time of research
Complementary feeding no
Int’l Code of Marketing of BMS Voluntary
4. Control of Plants Act (Chapter 57A) and related subsidiary legislation (e.g. Control of Plants (Import and Transhipment of Fresh Fruits and Vegetables) Rules (Revised Edition 2006))http://www.ava.gov.sg/NR/rdonlyres/0CA18578-7610-4917-BB67-C7DF4B96504B/17790/23web_COPAct.pdf
Vitamins and Minerals
Supplementation:Vitamin A children/women noIron Folate children/women noZinc children noOther vitamins & min child/women no
Food fortification yes
Voluntary : Salt
Social Protection policies or legislation including food or nutrition component
Food safety policies or legislation1. Environmental Public Health Act (chapter 95) 1987 (revised edition 2002) and the Environmental Public Health (Food Hygiene) Regulations (revised edition 2000)
5. Animal & Birds Act (Chapter 7) and related subsidiary legislation e.g. Animals and birds (Licensing of Farms) Rules (Revised Edition 2004)). http://www.ava.gov.sg/NR/rdonlyres/0CA18578-7610-4917-BB67-C7DF4B96504B/17773/7web_ABAct.pdf
Underlying and contextual factors
Food Safety yes
Food security yes
Maternity leave is paid at 66% of wages;
Food Aid yes
Nutrition and Infection yes
Gender no
Maternal leave 16 weeks
2. Sale of Food Act (Chapter 283) and related subsidiary legislation (e.g. Food Regulations (Revised Edition 2005))http://www.ava.gov.sg/NR/rdonlyres/0CA18578-7610-4917-BB67-C7DF4B96504B/17820/51web_SaleofFoodAct1.pdf 3. Wholesome Meat & Fish Act (Chapter 349A) and related subsidiary legislation (e.g. Wholesome Meat and Fish (Import, Export and Transhipment) Rules (Revised Edition 2001))http://www.ava.gov.sg/NR/rdonlyres/0CA18578-7610-4917-BB67-C7DF4B96504B/17826/57web_WholesomeMeatandFishAct.pdf
Singapore - Food and Nutrition Security Profiles
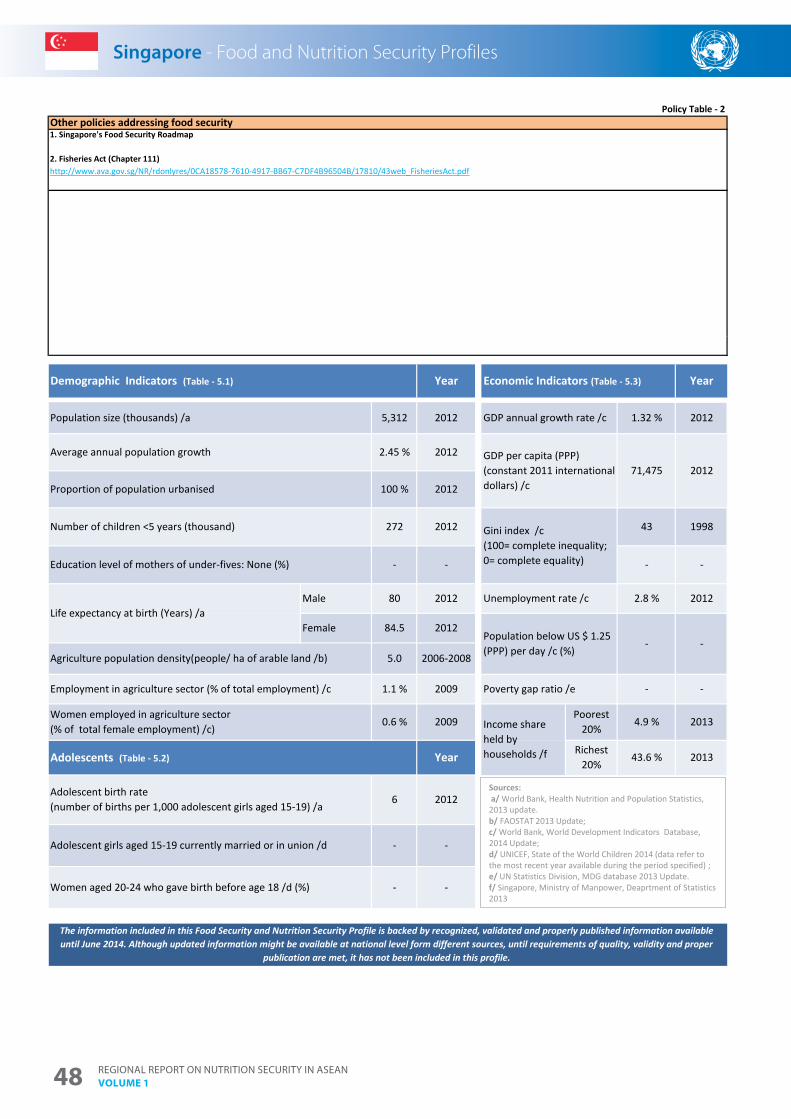
Regional RepoRt on nutRition SecuRity in aSean Volume 148
Singapore - Food and Nutrition Security Profiles
The information included in this Food Security and Nutrition Security Profile is backed by recognized, validated and properly published information available until June 2014. Although updated information might be available at national level form different sources, until requirements of quality, validity and proper
publication are met, it has not been included in this profile.
Demographic Indicators (Table - 5.1)
Population size (thousands) /a
Economic Indicators (Table - 5.3)Year
272 2012
100 % 2012
Year
5,312 2012
Richest 20%
43.6 % 2013
Income share held by households /f
Unemployment rate /c 2.8 % 2012
Population below US $ 1.25 (PPP) per day /c (%)
- -
Poverty gap ratio /e - -
Poorest 20%
4.9 % 2013
GDP annual growth rate /c 1.32 % 2012
43 1998
- -
Gini index /c(100= complete inequality; 0= complete equality)
GDP per capita (PPP) (constant 2011 international dollars) /c
71,475 2012
Women aged 20-24 who gave birth before age 18 /d (%) - -
Male 80 2012
Adolescent birth rate (number of births per 1,000 adolescent girls aged 15-19) /a
6 2012
Adolescent girls aged 15-19 currently married or in union /d - -
Female
Adolescents (Table - 5.2)
1.1 % 2009
84.5 2012
Agriculture population density(people/ ha of arable land /b)
Employment in agriculture sector (% of total employment) /c
Women employed in agriculture sector (% of total female employment) /c)
Year
5.0 2006-2008
Number of children <5 years (thousand)
Education level of mothers of under-fives: None (%) - -
0.6 % 2009
Policy Table - 2
Life expectancy at birth (Years) /a
Average annual population growth 2.45 % 2012
Proportion of population urbanised
2. Fisheries Act (Chapter 111)http://www.ava.gov.sg/NR/rdonlyres/0CA18578-7610-4917-BB67-C7DF4B96504B/17810/43web_FisheriesAct.pdf
Other policies addressing food security1. Singapore's Food Security Roadmap
Singapore - Food and Nutrition Security Profiles
Sources:a/ World Bank, Health Nutrition and Population Statistics,
2013 update.b/ FAOSTAT 2013 Update; c/ World Bank, World Development Indicators Database, 2014 Update; d/ UNICEF, State of the World Children 2014 (data refer to the most recent year available during the period specified) ;e/ UN Statistics Division, MDG database 2013 Update.f/ Singapore, Ministry of Manpower, Deaprtment of Statistics 2013
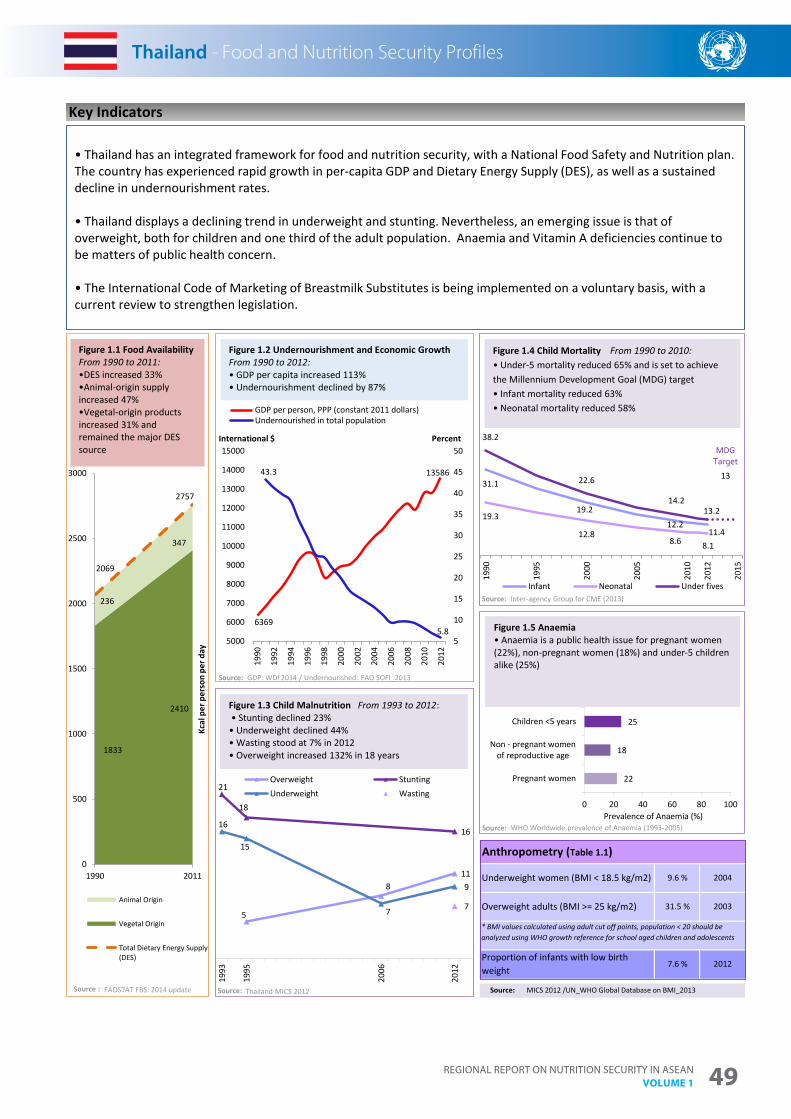
Regional RepoRt on nutRition SecuRity in aSean Volume 1 49
Thailand - Food and Nutrition Security Profiles
* BMI values calculated using adult cut off points, population < 20 should be analyzed using WHO growth reference for school aged children and adolescents
2004
2003
2012
9.6 %
31.5 %
7.6 %Proportion of infants with low birth weight
Source: MICS 2012 /UN_WHO Global Database on BMI_2013
Key Indicators
Anthropometry (Table 1.1)
Underweight women (BMI < 18.5 kg/m2)
Overweight adults (BMI >= 25 kg/m2)
6369
1358643.3
5.85
10
15
20
25
30
35
40
45
50
5000
6000
7000
8000
9000
10000
11000
12000
13000
14000
15000
1990
1992
1994
1996
1998
2000
2002
2004
2006
2008
2010
2012
GDP per person, PPP (constant 2011 dollars)Undernourished in total population
5
811
21
18
1616
15
7
9
7
1993
1995
2006
2012
Overweight StuntingUnderweight Wasting
Source:
Figure 1.3 Child Malnutrition From 1993 to 2012:• Stunting declined 23%
• Underweight declined 44%• Wasting stood at 7% in 2012 • Overweight increased 132% in 18 years
• Thailand has an integrated framework for food and nutrition security, with a National Food Safety and Nutrition plan. The country has experienced rapid growth in per-capita GDP and Dietary Energy Supply (DES), as well as a sustained decline in undernourishment rates.
• Thailand displays a declining trend in underweight and stunting. Nevertheless, an emerging issue is that of overweight, both for children and one third of the adult population. Anaemia and Vitamin A deficiencies continue to be matters of public health concern.
• The International Code of Marketing of Breastmilk Substitutes is being implemented on a voluntary basis, with a current review to strengthen legislation.
22
18
25
0 20 40 60 80 100
Pregnant women
Non - pregnant womenof reproductive age
Children <5 years
Total <2 yr
Prevalence of Anaemia (%)
1833
2410
236
347
2069
2757
0
500
1000
1500
2000
2500
3000
1990 2011
Kcal
per
per
son
per d
ay
Animal Origin
Vegetal Origin
Total Dietary Energy Supply(DES)
Figure 1.1 Food Availability From 1990 to 2011: •DES increased 33% •Animal-origin supply increased 47% •Vegetal-origin products increased 31% and remained the major DES source
31.1
19.2
12.211.4
19.3
12.88.6 8.1
38.2
22.6
14.213.2
1319
90
1995
2000
2005
2010
2012
2015
Infant Neonatal Under fives
Thailand - Food and Nutrition Security Profiles
Figure 1.5 Anaemia • Anaemia is a public health issue for pregnant women (22%), non-pregnant women (18%) and under-5 children alike (25%)
Figure 1.4 Child Mortality From 1990 to 2010:• Under-5 mortality reduced 65% and is set to achieve the Millennium Development Goal (MDG) target• Infant mortality reduced 63%• Neonatal mortality reduced 58%
Figure 1.2 Undernourishment and Economic Growth From 1990 to 2012: • GDP per capita increased 113%• Undernourishment declined by 87%
MDGTarget
PercentInternational $
Source:
Source:
Source:
Source : FAOSTAT FBS: 2014 update Thailand MICS 2012
GDP: WDI 2014 / Undernourished: FAO SOFI_2013
Inter-agency Group for CME (2013)
WHO Worldwide prevalence of Anaemia (1993-2005)
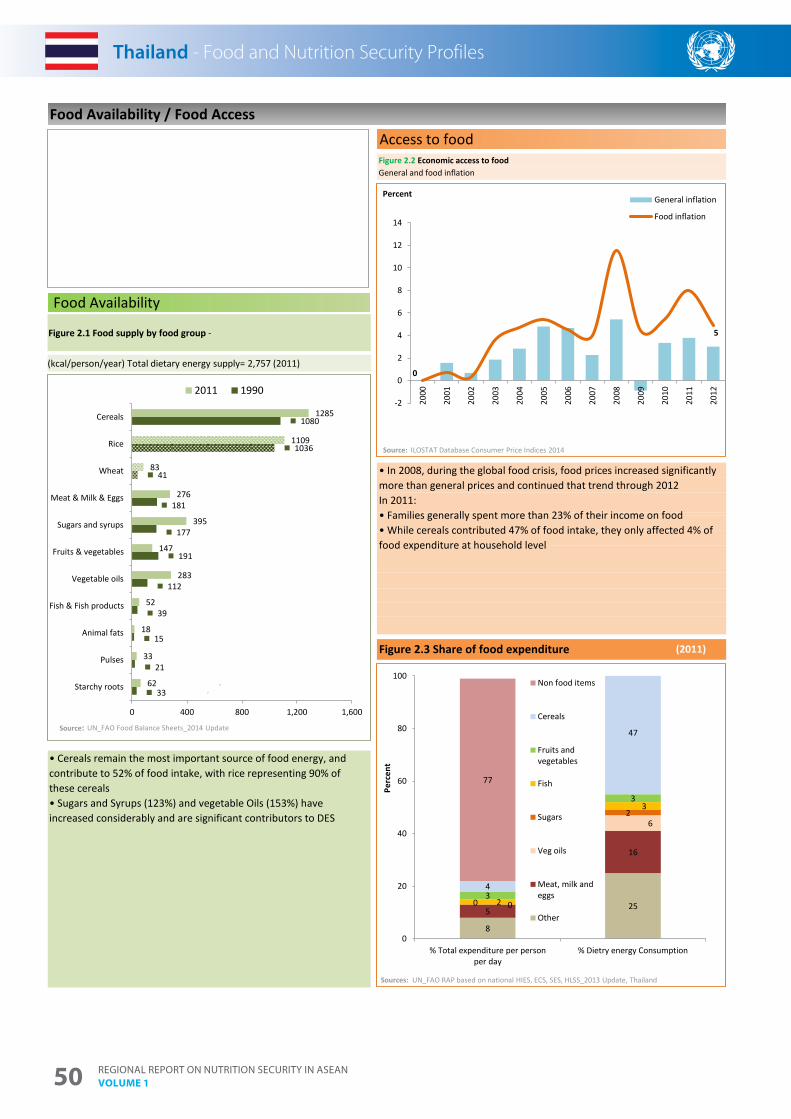
Regional RepoRt on nutRition SecuRity in aSean Volume 150
Thailand - Food and Nutrition Security Profiles
• Cereals remain the most important source of food energy, and contribute to 52% of food intake, with rice representing 90% of these cereals • Sugars and Syrups (123%) and vegetable Oils (153%) have increased considerably and are significant contributors to DES
Access to foodFigure 2.2 Economic access to foodGeneral and food inflation
(2011)Figure 2.3 Share of food expenditure
Food Availability
• In 2008, during the global food crisis, food prices increased significantly more than general prices and continued that trend through 2012 In 2011: • Families generally spent more than 23% of their income on food • While cereals contributed 47% of food intake, they only affected 4% of food expenditure at household level
Food Availability / Food Access
33
21
15
39
112
191
177
181
41
1036
1080
62
33
18
52
283
147
395
276
83
1109
1285
Starchy roots
Pulses
Animal fats
Fish & Fish products
Vegetable oils
Fruits & vegetables
Sugars and syrups
Meat & Milk & Eggs
Wheat
Rice
Cereals
0 400 800 1,200 1,600
2011 1990
Source:
(kcal/person/year) Total dietary energy supply= 2,757 (2011)
Thailand - Food and Nutrition Security Profiles
Figure 2.1 Food supply by food group -
0
5
-2
0
2
4
6
8
10
12
14
2000
2001
2002
2003
2004
2005
2006
2007
2008
2009
2010
2011
2012
General inflation
Food inflation
Source:
8
255
16
0
6
0
2
2
3
3
3
4
47
77
0
20
40
60
80
100
% Total expenditure per personper day
% Dietry energy Consumption
Perc
ent
Non food items
Cereals
Fruits andvegetables
Fish
Sugars
Veg oils
Meat, milk andeggs
Other
Sources:
Percent
ILOSTAT Database Consumer Price Indices 2014
UN_FAO Food Balance Sheets_2014 Update
UN_FAO RAP based on national HIES, ECS, SES, HLSS_2013 Update, Thailand
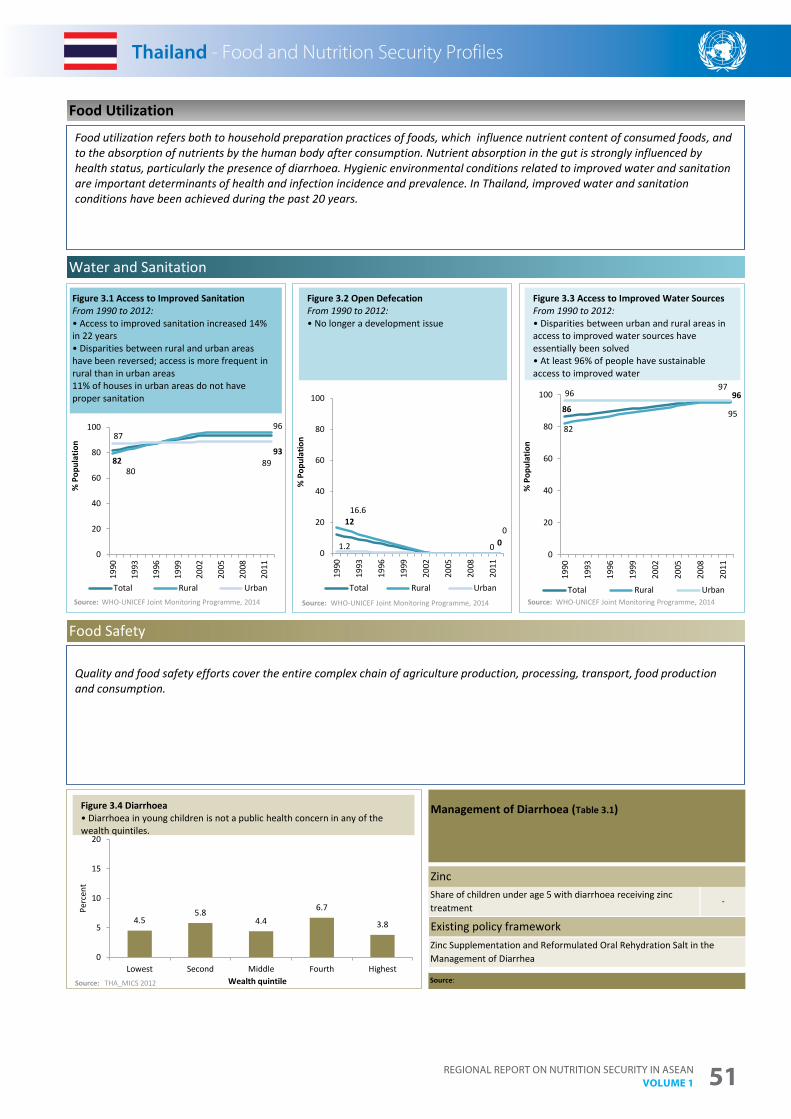
Regional RepoRt on nutRition SecuRity in aSean Volume 1 51
Thailand - Food and Nutrition Security Profiles
-Share of children under age 5 with diarrhoea receiving zinc treatment
Food Safety
Water and Sanitation
Food Utilization
Zinc
Existing policy frameworkZinc Supplementation and Reformulated Oral Rehydration Salt in the Management of Diarrhea
Source:
Management of Diarrhoea (Table 3.1)
12
0
16.6
0
1.2 00
20
40
60
80
100
1990
1993
1996
1999
2002
2005
2008
2011
% P
opul
atio
n
Total Rural Urban
8293
80
9687
89
0
20
40
60
80
100
1990
1993
1996
1999
2002
2005
2008
2011
% P
opul
atio
n
Total Rural Urban
4.55.8
4.46.7
3.8
0
5
10
15
20
Lowest Second Middle Fourth Highest
Perc
ent
Wealth quintileSource: THA_MICS 2012
8696
82
95
9697
0
20
40
60
80
100
1990
1993
1996
1999
2002
2005
2008
2011
% P
opul
atio
n
Total Rural UrbanSource:
Thailand - Food and Nutrition Security Profiles
Figure 3.1 Access to Improved SanitationFrom 1990 to 2012:• Access to improved sanitation increased 14% in 22 years• Disparities between rural and urban areas have been reversed; access is more frequent in rural than in urban areas11% of houses in urban areas do not have proper sanitation
Source: Source:
Food utilization refers both to household preparation practices of foods, which influence nutrient content of consumed foods, and to the absorption of nutrients by the human body after consumption. Nutrient absorption in the gut is strongly influenced by health status, particularly the presence of diarrhoea. Hygienic environmental conditions related to improved water and sanitation are important determinants of health and infection incidence and prevalence. In Thailand, improved water and sanitation conditions have been achieved during the past 20 years.
Figure 3.4 Diarrhoea • Diarrhoea in young children is not a public health concern in any of the wealth quintiles.
Figure 3.2 Open Defecation From 1990 to 2012:• No longer a development issue
Figure 3.3 Access to Improved Water Sources From 1990 to 2012:• Disparities between urban and rural areas in access to improved water sources have essentially been solved • At least 96% of people have sustainable access to improved water
Quality and food safety efforts cover the entire complex chain of agriculture production, processing, transport, food productionand consumption.
WHO-UNICEF Joint Monitoring Programme, 2014 WHO-UNICEF Joint Monitoring Programme, 2014 WHO-UNICEF Joint Monitoring Programme, 2014
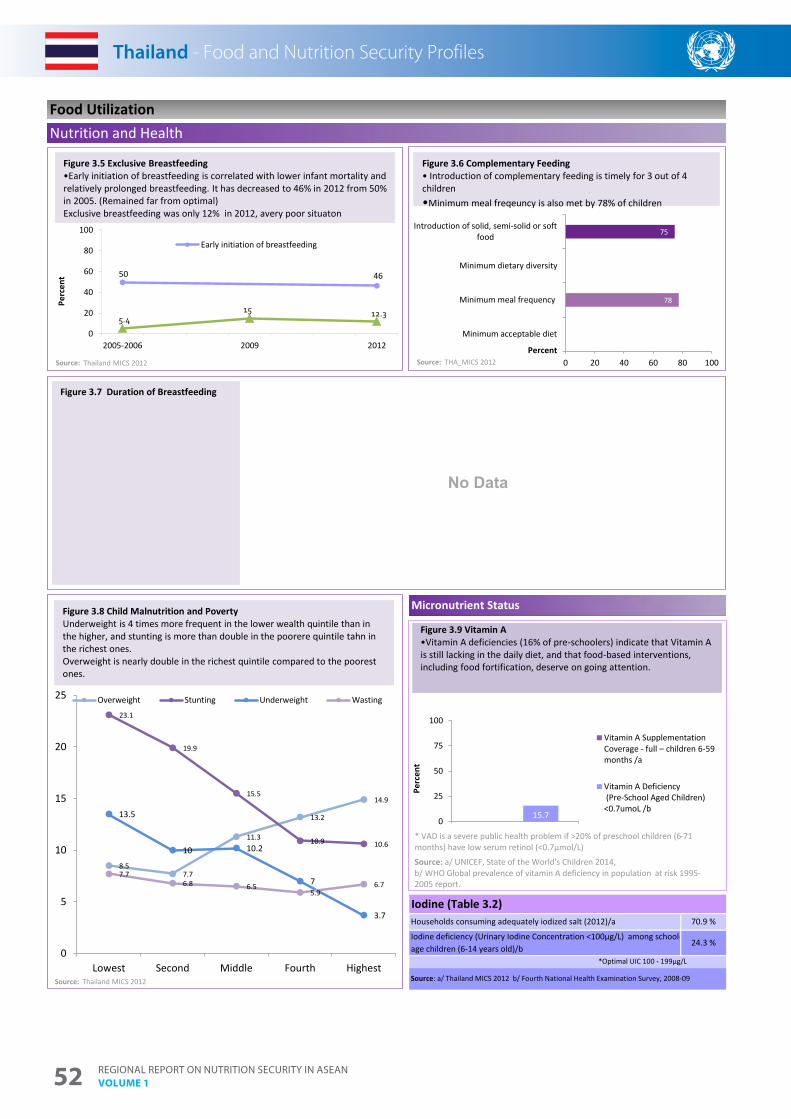
Regional RepoRt on nutRition SecuRity in aSean Volume 152
Thailand - Food and Nutrition Security Profiles
*Optimal UIC 100 - 199µg/L
Source: a/ Thailand MICS 2012 b/ Fourth National Health Examination Survey, 2008-09
24.3 %
Nutrition and Health
70.9 %Households consuming adequately iodized salt (2012)/a
Iodine deficiency (Urinary Iodine Concentration <100µg/L) among school-age children (6-14 years old)/b
Micronutrient Status
Iodine (Table 3.2)
Food Utilization
78
75
0 20 40 60 80 100
Minimum acceptable diet
Minimum meal frequency
Minimum dietary diversity
Introduction of solid, semi-solid or softfood
PercentSource:
Figure 3.6 Complementary Feeding • Introduction of complementary feeding is timely for 3 out of 4 children•Minimum meal freqeuncy is also met by 78% of children
THA_MICS 2012
0 15.70
25
50
75
100
Perc
ent
Vitamin A Supplementation Coverage - full – children 6-59 months /a
Vitamin A Deficiency (Pre-School Aged Children)<0.7umoL /b
50 46
5.415 12.3
0
20
40
60
80
100
2005-2006 2009 2012
Perc
ent
Early initiation of breastfeeding
Source:
Figure 3.5 Exclusive Breastfeeding •Early initiation of breastfeeding is correlated with lower infant mortality and relatively prolonged breastfeeding. It has decreased to 46% in 2012 from 50% in 2005. (Remained far from optimal)Exclusive breastfeeding was only 12% in 2012, avery poor situaton
Figure 3.7 Duration of Breastfeeding
No Data
Thailand - Food and Nutrition Security Profiles
Figure 3.8 Child Malnutrition and Poverty Underweight is 4 times more frequent in the lower wealth quintile than in the higher, and stunting is more than double in the poorere quintile tahn in the richest ones.Overweight is nearly double in the richest quintile compared to the poorest ones.
Figure 3.9 Vitamin A •Vitamin A deficiencies (16% of pre-schoolers) indicate that Vitamin A is still lacking in the daily diet, and that food-based interventions, including food fortification, deserve on going attention.
Source: a/ UNICEF, State of the World's Children 2014,b/ WHO Global prevalence of vitamin A deficiency in population at risk 1995-2005 report.
* VAD is a severe public health problem if >20% of preschool children (6-71 months) have low serum retinol (<0.7µmol/L)
8.57.7
11.3
13.2
14.9
23.1
19.9
15.5
10.9 10.6
13.5
10 10.2
7
3.7
7.76.8 6.5
5.96.7
0
5
10
15
20
25
Lowest Second Middle Fourth Highest
Overweight Stunting Underweight Wasting
Thailand MICS 2012
Source: Thailand MICS 2012
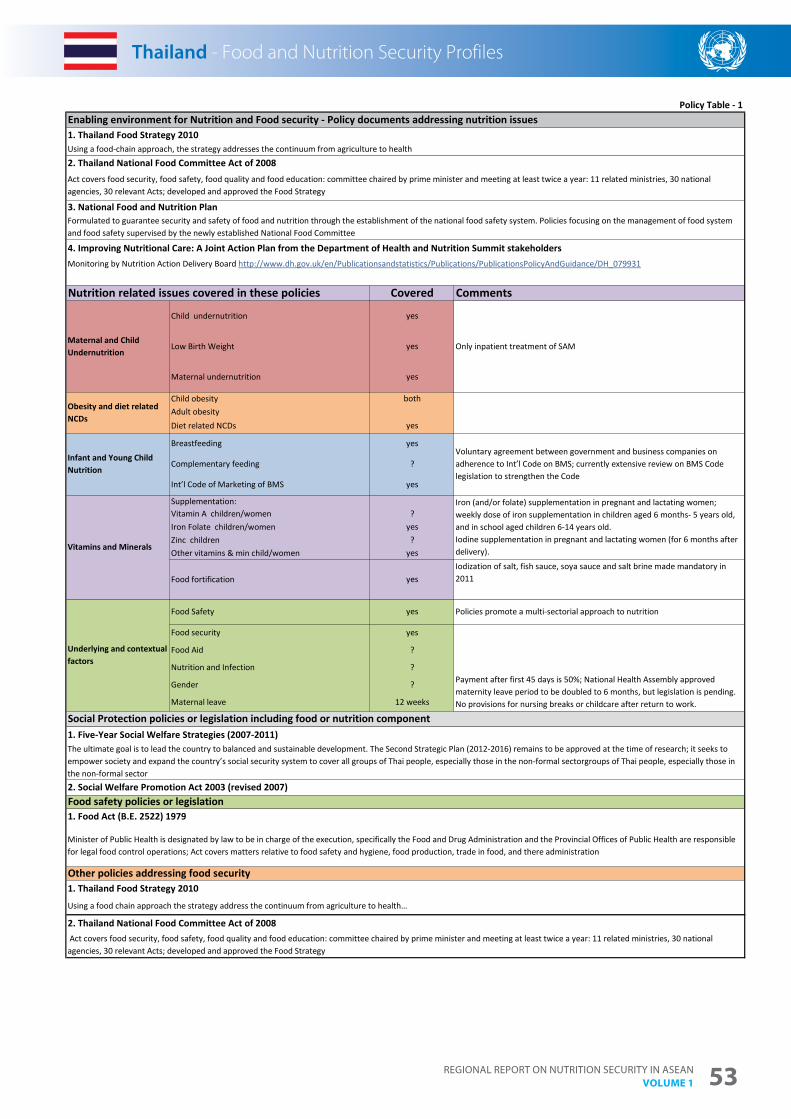
Regional RepoRt on nutRition SecuRity in aSean Volume 1 53
Thailand - Food and Nutrition Security Profiles
Enabling environment for Nutrition and Food security - Policy documents addressing nutrition issues 1. Thailand Food Strategy 2010 Using a food-chain approach, the strategy addresses the continuum from agriculture to health2. Thailand National Food Committee Act of 2008 Act covers food security, food safety, food quality and food education: committee chaired by prime minister and meeting at least twice a year: 11 related ministries, 30 national agencies, 30 relevant Acts; developed and approved the Food Strategy
3. National Food and Nutrition Plan Formulated to guarantee security and safety of food and nutrition through the establishment of the national food safety system. Policies focusing on the management of food system and food safety supervised by the newly established National Food Committee
4. Improving Nutritional Care: A Joint Action Plan from the Department of Health and Nutrition Summit stakeholders Monitoring by Nutrition Action Delivery Board http://www.dh.gov.uk/en/Publicationsandstatistics/Publications/PublicationsPolicyAndGuidance/DH_079931
Nutrition related issues covered in these policies Covered
Policy Table - 1
Comments
Maternal and Child Undernutrition
Child undernutrition yes
Only inpatient treatment of SAMLow Birth Weight yes
Maternal undernutrition yes
Obesity and diet related NCDs
Child obesity bothAdult obesityDiet related NCDs yes
Infant and Young Child Nutrition
Breastfeeding yesVoluntary agreement between government and business companies on adherence to Int’l Code on BMS; currently extensive review on BMS Code legislation to strengthen the Code
Complementary feeding ?
Int’l Code of Marketing of BMS yes
Vitamins and Minerals
Supplementation:Vitamin A children/women ?
Iron (and/or folate) supplementation in pregnant and lactating women; weekly dose of iron supplementation in children aged 6 months- 5 years old, and in school aged children 6-14 years old.Iodine supplementation in pregnant and lactating women (for 6 months after delivery).
Iron Folate children/women yesZinc children ?Other vitamins & min child/women yes
Food fortification yesIodization of salt, fish sauce, soya sauce and salt brine made mandatory in 2011
Underlying and contextual factors
Food Safety yes Policies promote a multi-sectorial approach to nutrition
Food security yes
Payment after first 45 days is 50%; National Health Assembly approved maternity leave period to be doubled to 6 months, but legislation is pending. No provisions for nursing breaks or childcare after return to work.
Food Aid ?
Nutrition and Infection ?
Gender ?
Maternal leave 12 weeks
Using a food chain approach the strategy address the continuum from agriculture to health…
2. Thailand National Food Committee Act of 2008 Act covers food security, food safety, food quality and food education: committee chaired by prime minister and meeting at least twice a year: 11 related ministries, 30 national agencies, 30 relevant Acts; developed and approved the Food Strategy
Social Protection policies or legislation including food or nutrition component1. Five-Year Social Welfare Strategies (2007-2011) The ultimate goal is to lead the country to balanced and sustainable development. The Second Strategic Plan (2012-2016) remains to be approved at the time of research; it seeks to empower society and expand the country’s social security system to cover all groups of Thai people, especially those in the non-formal sectorgroups of Thai people, especially those in the non-formal sector2. Social Welfare Promotion Act 2003 (revised 2007) Food safety policies or legislation1. Food Act (B.E. 2522) 1979
Minister of Public Health is designated by law to be in charge of the execution, specifically the Food and Drug Administration and the Provincial Offices of Public Health are responsible for legal food control operations; Act covers matters relative to food safety and hygiene, food production, trade in food, and there administration
Other policies addressing food security1. Thailand Food Strategy 2010
Thailand - Food and Nutrition Security Profiles

Regional RepoRt on nutRition SecuRity in aSean Volume 154
Thailand - Food and Nutrition Security Profiles
The information included in this Food Security and Nutrition Security Profile is backed by recognized, validated and properly published information available until June 2014. Although updated information might be available at national level form different sources, until requirements of quality, validity and proper
publication are met, it has not been included in this profile.
Demographic Indicators (Table - 5.1)
Population size (thousands) /a
Economic Indicators (Table - 5.3)Year
3,730 2012
34.5 % 2012
Year
66,785 2012
Richest 20%
46.67 % 2010
Income share held by households /c
Unemployment rate /c 0.69 % 2012
Population below US $ 1.25 (PPP) per day /c (%)
0.38 2010
Poverty gap ratio /e 2 2009
Poorest 20%
6.76 % 2010
GDP annual growth rate /c 6.49 % 2012
39.37 2010
40.02 2009
Gini index /c(100= complete inequality; 0= complete equality)
GDP per capita (PPP) (constant 2011 international dollars) /c
13,586 2012
Women aged 20-24 who gave birth before age 18 /d (%) 47 2008-2011
Male 71 2012
Adolescent birth rate (number of births per 1,000 adolescent girls aged 15-19) /a
41 2012
Adolescent girls aged 15-19 currently married or in union /d 14.6 % 2008-2012
Female
Adolescents (Table - 5.2)
39.6 % 2012
77.6 2012
Agriculture population density(people/ ha of arable land /b)
Employment in agriculture sector (% of total employment) /c
Women employed in agriculture sector (% of total female employment) /c)
Year
1.5 2006-2008
Number of children <5 years (thousand)
Education level of mothers of under-fives: None (%)/f 4 2012
37.8 % 2012
Policy Table - 2
Life expectancy at birth (Years) /c
Average annual population growth/a 0.31 % 2012
Proportion of population urbanised/c
Thailand - Food and Nutrition Security Profiles
Sources:a/ World Bank Health Nutrition and Population Statistics
2013b/ FAOSTAT 2013 Update; c/ World Bank, World Development Indicators Database, 2014 Update; d/ UNICEF, State of the World Children 2014 (data refer to the most recent year available during the period specified) ;e/ UN Statistics Division, MDG database 2013 Update.f/ Thailand Multiple Indicator Cluster Survey 2012
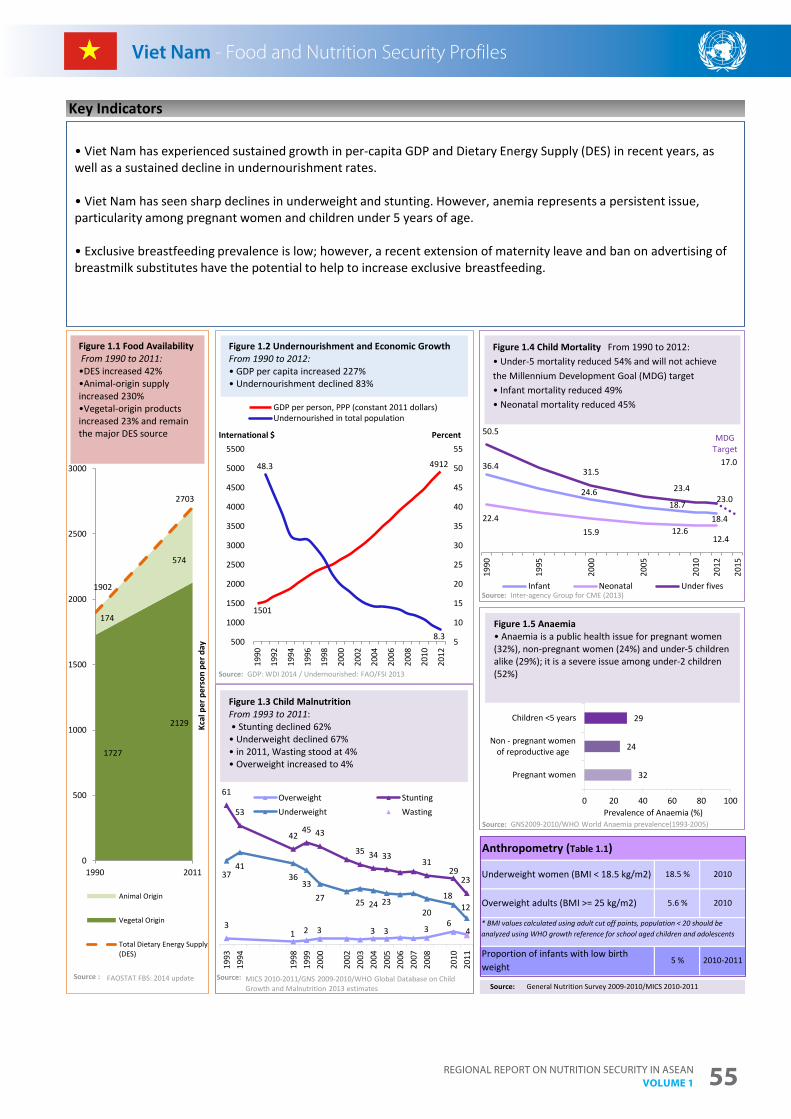
Regional RepoRt on nutRition SecuRity in aSean Volume 1 55
Viet Nam - Food and Nutrition Security Profiles
* BMI values calculated using adult cut off points, population < 20 should be analyzed using WHO growth reference for school aged children and adolescents
Key Indicators
Anthropometry (Table 1.1)
Underweight women (BMI < 18.5 kg/m2)
Overweight adults (BMI >= 25 kg/m2)
2010
2010
2010-2011
18.5 %
5.6 %
5 %Proportion of infants with low birth weight
Source: General Nutrition Survey 2009-2010/MICS 2010-2011
1501
491248.3
8.3 5
10
15
20
25
30
35
40
45
50
55
500
1000
1500
2000
2500
3000
3500
4000
4500
5000
5500
1990
1992
1994
1996
1998
2000
2002
2004
2006
2008
2010
2012
GDP per person, PPP (constant 2011 dollars)Undernourished in total population
31 2 3 3 3 3
6
61
53
4245 43
35 34 3331
292337
4136
3327 25 24 23
20
1812
4
1993
1994
1998
1999
2000
2002
2003
2004
2005
2006
2007
2008
2010
2011
Overweight StuntingUnderweight Wasting
Source:
Figure 1.3 Child Malnutrition From 1993 to 2011:• Stunting declined 62%
• Underweight declined 67%• in 2011, Wasting stood at 4% • Overweight increased to 4%
• Viet Nam has experienced sustained growth in per-capita GDP and Dietary Energy Supply (DES) in recent years, as well as a sustained decline in undernourishment rates.
• Viet Nam has seen sharp declines in underweight and stunting. However, anemia represents a persistent issue, particularity among pregnant women and children under 5 years of age.
• Exclusive breastfeeding prevalence is low; however, a recent extension of maternity leave and ban on advertising of breastmilk substitutes have the potential to help to increase exclusive breastfeeding.
32
24
29
52
0 20 40 60 80 100
Pregnant women
Non - pregnant womenof reproductive age
Children <5 years
Total <2 yr
Prevalence of Anaemia (%)
1727
2129
174
574
1902
2703
0
500
1000
1500
2000
2500
3000
1990 2011
Kcal
per
per
son
per d
ay
Animal Origin
Vegetal Origin
Total Dietary Energy Supply(DES)
Figure 1.1 Food Availability From 1990 to 2011:
•DES increased 42% •Animal-origin supply increased 230% •Vegetal-origin products increased 23% and remain the major DES source
36.4
24.618.7
18.422.415.9 12.6
12.4
50.5
31.5
23.423.0
17.0
1990
1995
2000
2005
2010
2012
2015
Infant Neonatal Under fives
Viet Nam - Food and Nutrition Security Profiles
Figure 1.5 Anaemia • Anaemia is a public health issue for pregnant women (32%), non-pregnant women (24%) and under-5 children alike (29%); it is a severe issue among under-2 children (52%)
Figure 1.4 Child Mortality From 1990 to 2012:• Under-5 mortality reduced 54% and will not achieve the Millennium Development Goal (MDG) target• Infant mortality reduced 49%• Neonatal mortality reduced 45%
Figure 1.2 Undernourishment and Economic Growth From 1990 to 2012: • GDP per capita increased 227%• Undernourishment declined 83%
MDGTarget
PercentInternational $
Source:
Source:
Source:
Source : FAOSTAT FBS: 2014 update MICS 2010-2011/GNS 2009-2010/WHO Global Database on Child Growth and Malnutrition 2013 estimates
GDP: WDI 2014 / Undernourished: FAO/FSI 2013
Inter-agency Group for CME (2013)
GNS2009-2010/WHO World Anaemia prevalence(1993-2005)
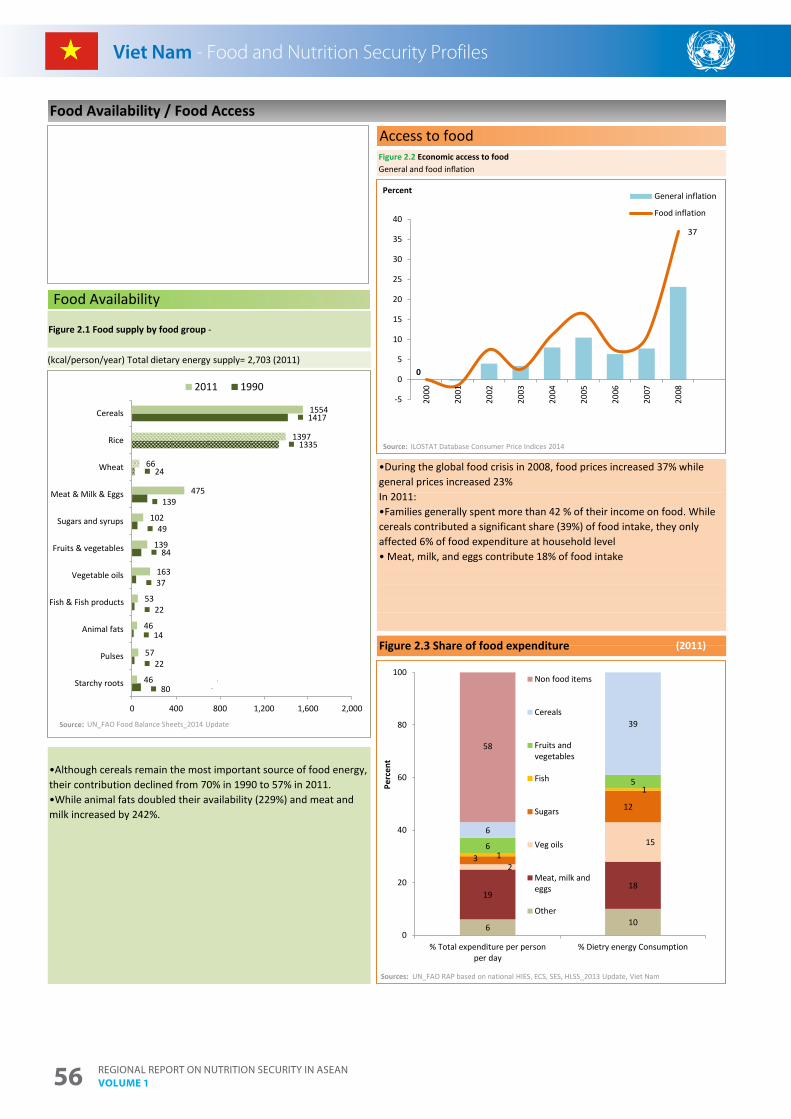
Regional RepoRt on nutRition SecuRity in aSean Volume 156
Viet Nam - Food and Nutrition Security Profiles
•During the global food crisis in 2008, food prices increased 37% while general prices increased 23% In 2011:•Families generally spent more than 42 % of their income on food. While cereals contributed a significant share (39%) of food intake, they only affected 6% of food expenditure at household level• Meat, milk, and eggs contribute 18% of food intake
Food Availability / Food Access
Food Availability
•Although cereals remain the most important source of food energy, their contribution declined from 70% in 1990 to 57% in 2011. •While animal fats doubled their availability (229%) and meat and milk increased by 242%.
Access to foodFigure 2.2 Economic access to foodGeneral and food inflation
(2011)Figure 2.3 Share of food expenditure
80
22
14
22
37
84
49
139
24
1335
1417
46
57
46
53
163
139
102
475
66
1397
1554
Starchy roots
Pulses
Animal fats
Fish & Fish products
Vegetable oils
Fruits & vegetables
Sugars and syrups
Meat & Milk & Eggs
Wheat
Rice
Cereals
0 400 800 1,200 1,600 2,000
2011 1990
Source:
(kcal/person/year) Total dietary energy supply= 2,703 (2011)
Viet Nam - Food and Nutrition Security Profiles
Figure 2.1 Food supply by food group -
0
37
-5
0
5
10
15
20
25
30
35
40
2000
2001
2002
2003
2004
2005
2006
2007
2008
General inflation
Food inflation
Source:
6 10
1918
2
15
3
12
1
1
6
5
6
39
58
0
20
40
60
80
100
% Total expenditure per personper day
% Dietry energy Consumption
Perc
ent
Non food items
Cereals
Fruits andvegetables
Fish
Sugars
Veg oils
Meat, milk andeggs
Other
Sources:
Percent
ILOSTAT Database Consumer Price Indices 2014
UN_FAO Food Balance Sheets_2014 Update
UN_FAO RAP based on national HIES, ECS, SES, HLSS_2013 Update, Viet Nam
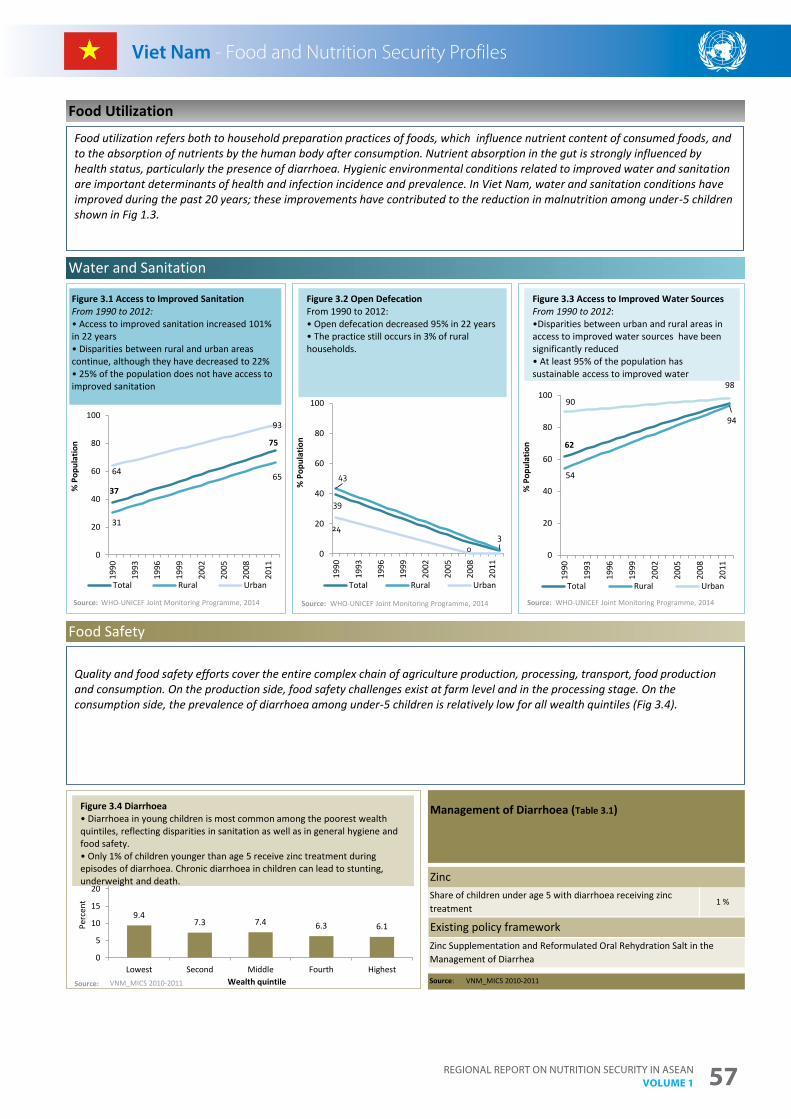
Regional RepoRt on nutRition SecuRity in aSean Volume 1 57
Viet Nam - Food and Nutrition Security Profiles
Management of Diarrhoea (Table 3.1)
Water and Sanitation
Food Utilization
Zinc Supplementation and Reformulated Oral Rehydration Salt in the Management of Diarrhea
Source:
1 %Share of children under age 5 with diarrhoea receiving zinc treatment
Food Safety
Zinc
Existing policy framework
39
43
324
00
20
40
60
80
100
1990
1993
1996
1999
2002
2005
2008
2011
% P
opul
atio
n
Total Rural Urban
37
75
31
6564
93
0
20
40
60
80
100
1990
1993
1996
1999
2002
2005
2008
2011
% P
opul
atio
n
Total Rural Urban
9.47.3 7.4 6.3 6.1
0
5
10
15
20
25
Lowest Second Middle Fourth Highest
Perc
ent
Wealth quintileSource: VNM_MICS 2010-2011
62
54
94
90
98
0
20
40
60
80
100
1990
1993
1996
1999
2002
2005
2008
2011
% P
opul
atio
n
Total Rural Urban
Source:
Viet Nam - Food and Nutrition Security Profiles
Figure 3.1 Access to Improved SanitationFrom 1990 to 2012:• Access to improved sanitation increased 101% in 22 years• Disparities between rural and urban areas continue, although they have decreased to 22% • 25% of the population does not have access to improved sanitation
Source: Source:
Food utilization refers both to household preparation practices of foods, which influence nutrient content of consumed foods, and to the absorption of nutrients by the human body after consumption. Nutrient absorption in the gut is strongly influenced by health status, particularly the presence of diarrhoea. Hygienic environmental conditions related to improved water and sanitation are important determinants of health and infection incidence and prevalence. In Viet Nam, water and sanitation conditions have improved during the past 20 years; these improvements have contributed to the reduction in malnutrition among under-5 children shown in Fig 1.3.
Figure 3.4 Diarrhoea • Diarrhoea in young children is most common among the poorest wealth quintiles, reflecting disparities in sanitation as well as in general hygiene and food safety. • Only 1% of children younger than age 5 receive zinc treatment during episodes of diarrhoea. Chronic diarrhoea in children can lead to stunting, underweight and death.
Figure 3.2 Open Defecation From 1990 to 2012:• Open defecation decreased 95% in 22 years• The practice still occurs in 3% of rural households.
Figure 3.3 Access to Improved Water Sources From 1990 to 2012:•Disparities between urban and rural areas in access to improved water sources have been significantly reduced • At least 95% of the population has sustainable access to improved water
Quality and food safety efforts cover the entire complex chain of agriculture production, processing, transport, food productionand consumption. On the production side, food safety challenges exist at farm level and in the processing stage. On the consumption side, the prevalence of diarrhoea among under-5 children is relatively low for all wealth quintiles (Fig 3.4).
WHO-UNICEF Joint Monitoring Programme, 2014 WHO-UNICEF Joint Monitoring Programme, 2014 WHO-UNICEF Joint Monitoring Programme, 2014
VNM_MICS 2010-2011
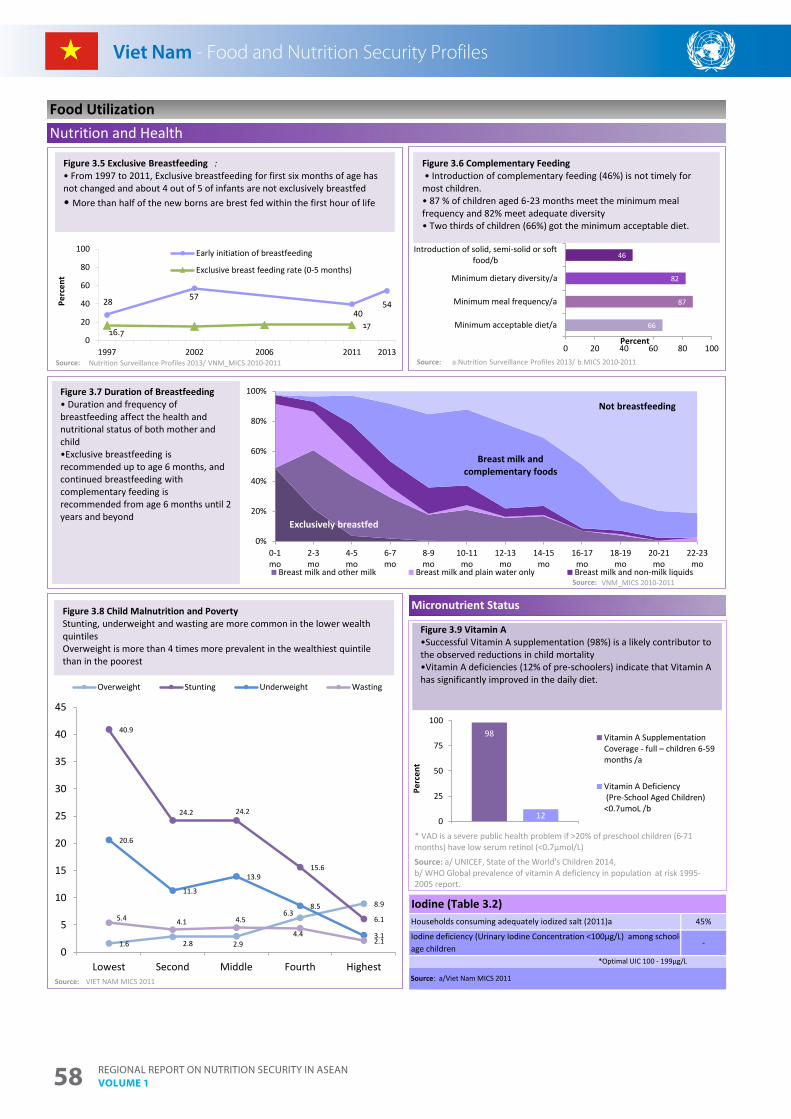
Regional RepoRt on nutRition SecuRity in aSean Volume 158
Viet Nam - Food and Nutrition Security Profiles
*Optimal UIC 100 - 199µg/L
45%Households consuming adequately iodized salt (2011)a
Iodine deficiency (Urinary Iodine Concentration <100µg/L) among school-age children
Micronutrient Status
Iodine (Table 3.2)
Food Utilization
Source: a/Viet Nam MICS 2011
-
Nutrition and Health
98
120
25
50
75
100
Perc
ent
Vitamin A Supplementation Coverage - full – children 6-59 months /a
Vitamin A Deficiency (Pre-School Aged Children)<0.7umoL /b
66
87
82
46
0 20 40 60 80 100
Minimum acceptable diet/a
Minimum meal frequency/a
Minimum dietary diversity/a
Introduction of solid, semi-solid or softfood/b
Percent
Source:
Figure 3.6 Complementary Feeding • Introduction of complementary feeding (46%) is not timely for most children. • 87 % of children aged 6-23 months meet the minimum meal frequency and 82% meet adequate diversity• Two thirds of children (66%) got the minimum acceptable diet.
28 57
4054
16.717
0
20
40
60
80
100
1997 2002 2006 2011 2013
Perc
ent
Early initiation of breastfeeding
Exclusive breast feeding rate (0-5 months)
Source:
Figure 3.5 Exclusive Breastfeeding : • From 1997 to 2011, Exclusive breastfeeding for first six months of age has not changed and about 4 out of 5 of infants are not exclusively breastfed• More than half of the new borns are brest fed within the first hour of life
Exclusively breastfed
Breast milk and complementary foods
Not breastfeeding
0%
20%
40%
60%
80%
100%
0-1mo
2-3mo
4-5mo
6-7mo
8-9mo
10-11mo
12-13mo
14-15mo
16-17mo
18-19mo
20-21mo
22-23mo
Breast milk and other milk Breast milk and plain water only Breast milk and non-milk liquids
Figure 3.7 Duration of Breastfeeding• Duration and frequency of breastfeeding affect the health and nutritional status of both mother and child •Exclusive breastfeeding is recommended up to age 6 months, and continued breastfeeding with complementary feeding is recommended from age 6 months until 2 years and beyond
Source:
Viet Nam - Food and Nutrition Security Profiles
Figure 3.8 Child Malnutrition and Poverty Stunting, underweight and wasting are more common in the lower wealth quintilesOverweight is more than 4 times more prevalent in the wealthiest quintile than in the poorest
Figure 3.9 Vitamin A •Successful Vitamin A supplementation (98%) is a likely contributor to the observed reductions in child mortality •Vitamin A deficiencies (12% of pre-schoolers) indicate that Vitamin A has significantly improved in the daily diet.
Source: a/ UNICEF, State of the World's Children 2014,b/ WHO Global prevalence of vitamin A deficiency in population at risk 1995-2005 report.
* VAD is a severe public health problem if >20% of preschool children (6-71 months) have low serum retinol (<0.7µmol/L)
1.6 2.8 2.9
6.38.9
40.9
24.2 24.2
15.6
6.1
20.6
11.3
13.9
8.5
3.1
5.4 4.1 4.5
4.42.1
0
5
10
15
20
25
30
35
40
45
Lowest Second Middle Fourth Highest
Overweight Stunting Underweight Wasting
Nutrition Surveillance Profiles 2013/ VNM_MICS 2010-2011 a.Nutrition Surveillance Profiles 2013/ b.MICS 2010-2011
VNM_MICS 2010-2011
Source: VIET NAM MICS 2011
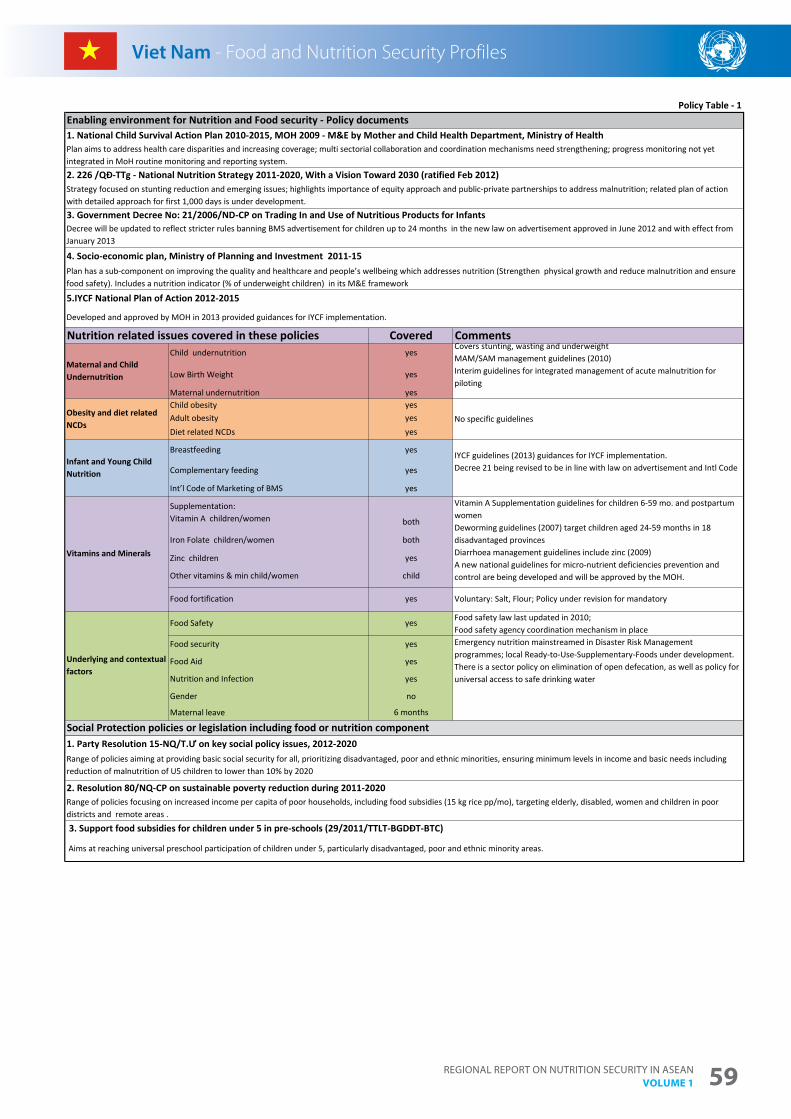
Regional RepoRt on nutRition SecuRity in aSean Volume 1 59
Viet Nam - Food and Nutrition Security Profiles
4. Socio-economic plan, Ministry of Planning and Investment 2011-15Plan has a sub-component on improving the quality and healthcare and people’s wellbeing which addresses nutrition (Strengthen physical growth and reduce malnutrition and ensure food safety). Includes a nutrition indicator (% of underweight children) in its M&E framework
Policy Table - 1Enabling environment for Nutrition and Food security - Policy documents 1. National Child Survival Action Plan 2010-2015, MOH 2009 - M&E by Mother and Child Health Department, Ministry of Health Plan aims to address health care disparities and increasing coverage; multi sectorial collaboration and coordination mechanisms need strengthening; progress monitoring not yet integrated in MoH routine monitoring and reporting system.2. 226 /QÐ-TTg - National Nutrition Strategy 2011-2020, With a Vision Toward 2030 (ratified Feb 2012)Strategy focused on stunting reduction and emerging issues; highlights importance of equity approach and public-private partnerships to address malnutrition; related plan of action with detailed approach for first 1,000 days is under development.3. Government Decree No: 21/2006/ND-CP on Trading In and Use of Nutritious Products for InfantsDecree will be updated to reflect stricter rules banning BMS advertisement for children up to 24 months in the new law on advertisement approved in June 2012 and with effect from January 2013
5.IYCF National Plan of Action 2012-2015
Developed and approved by MOH in 2013 provided guidances for IYCF implementation.
Nutrition related issues covered in these policies Covered Comments
Maternal and Child Undernutrition
Child undernutrition yesCovers stunting, wasting and underweightMAM/SAM management guidelines (2010)Interim guidelines for integrated management of acute malnutrition for piloting
Low Birth Weight yes
Maternal undernutrition yes
Obesity and diet related NCDs
Child obesity yesNo specific guidelinesAdult obesity yes
Diet related NCDs yes
Infant and Young Child Nutrition
Breastfeeding yes IYCF guidelines (2013) guidances for IYCF implementation.Decree 21 being revised to be in line with law on advertisement and Intl CodeComplementary feeding yes
Int’l Code of Marketing of BMS yes
Vitamins and Minerals
Supplementation:Vitamin A children/women both
Vitamin A Supplementation guidelines for children 6-59 mo. and postpartum womenDeworming guidelines (2007) target children aged 24-59 months in 18 disadvantaged provinces Diarrhoea management guidelines include zinc (2009)A new national guidelines for micro-nutrient deficiencies prevention and control are being developed and will be approved by the MOH.
Iron Folate children/women both
Zinc children yes
Other vitamins & min child/women child
Food fortification yes Voluntary: Salt, Flour; Policy under revision for mandatory
Social Protection policies or legislation including food or nutrition component1. Party Resolution 15-NQ/T.Ư on key social policy issues, 2012-2020Range of policies aiming at providing basic social security for all, prioritizing disadvantaged, poor and ethnic minorities, ensuring minimum levels in income and basic needs including reduction of malnutrition of U5 children to lower than 10% by 2020
Underlying and contextual factors
Food Safety yes Food safety law last updated in 2010; Food safety agency coordination mechanism in place
Food security yes Emergency nutrition mainstreamed in Disaster Risk Management programmes; local Ready-to-Use-Supplementary-Foods under development.There is a sector policy on elimination of open defecation, as well as policy for universal access to safe drinking water
Food Aid yes
Nutrition and Infection yes
Gender no
Maternal leave 6 months
2. Resolution 80/NQ-CP on sustainable poverty reduction during 2011-2020Range of policies focusing on increased income per capita of poor households, including food subsidies (15 kg rice pp/mo), targeting elderly, disabled, women and children in poor districts and remote areas . 3. Support food subsidies for children under 5 in pre-schools (29/2011/TTLT-BGDĐT-BTC)
Aims at reaching universal preschool participation of children under 5, particularly disadvantaged, poor and ethnic minority areas.
Viet Nam - Food and Nutrition Security Profiles
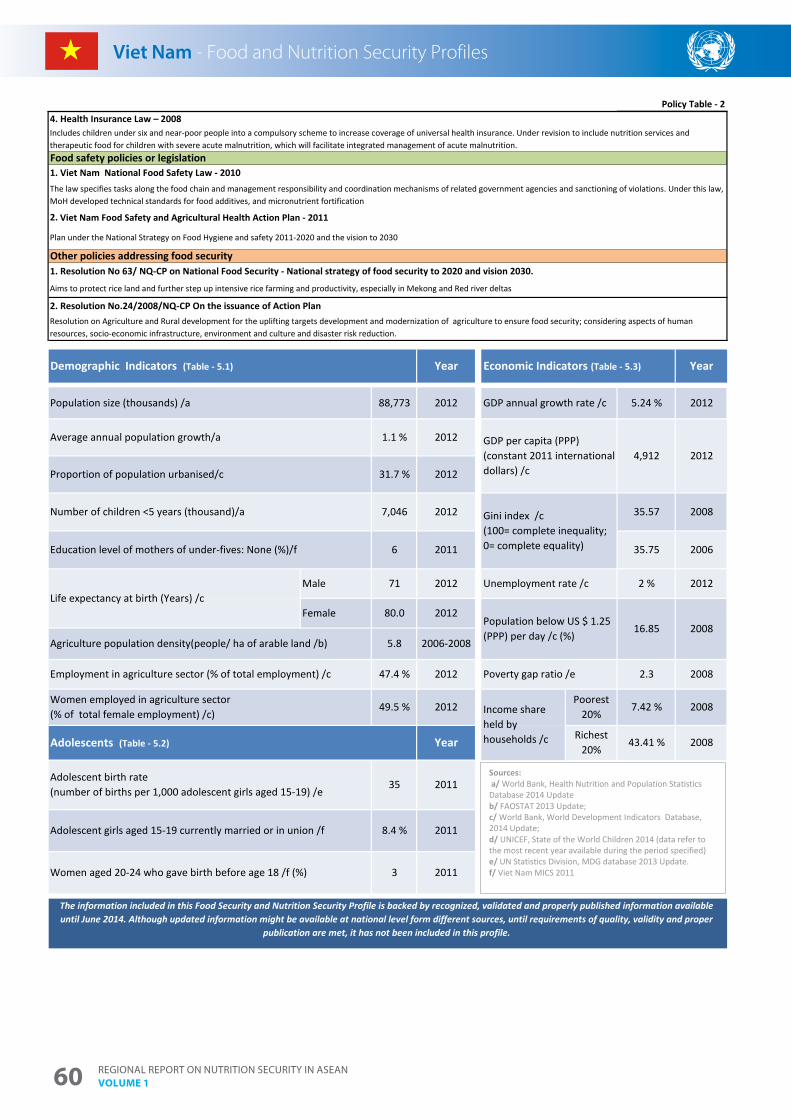
Regional RepoRt on nutRition SecuRity in aSean Volume 160
Viet Nam - Food and Nutrition Security Profiles
Education level of mothers of under-fives: None (%)/f 6 2011
The information included in this Food Security and Nutrition Security Profile is backed by recognized, validated and properly published information available until June 2014. Although updated information might be available at national level form different sources, until requirements of quality, validity and proper
publication are met, it has not been included in this profile.
Average annual population growth/a 1.1 % 2012
Proportion of population urbanised/c 31.7 % 2012
Number of children <5 years (thousand)/a 7,046 2012
2012
Policy Table - 2
Life expectancy at birth (Years) /c
Women aged 20-24 who gave birth before age 18 /f (%) 3 2011
Male 71 2012
Adolescent birth rate (number of births per 1,000 adolescent girls aged 15-19) /e
35 2011
Adolescent girls aged 15-19 currently married or in union /f 8.4 % 2011
Female
Adolescents (Table - 5.2)
47.4 % 2012
80.0 2012
Agriculture population density(people/ ha of arable land /b)
Employment in agriculture sector (% of total employment) /c
Women employed in agriculture sector (% of total female employment) /c)
Year
5.8
49.5 %
35.57 2008
35.75 2006
Gini index /c(100= complete inequality; 0= complete equality)
GDP per capita (PPP) (constant 2011 international dollars) /c
4,912 2012
2006-2008
Richest 20%
43.41 % 2008
Income share held by households /c
Unemployment rate /c 2 % 2012
Population below US $ 1.25 (PPP) per day /c (%)
16.85 2008
Poverty gap ratio /e 2.3 2008
Poorest 20%
7.42 % 2008
Demographic Indicators (Table - 5.1)
Population size (thousands) /a
Economic Indicators (Table - 5.3)Year Year
88,773 2012 5.24 % 2012GDP annual growth rate /c
2. Vietnam Food Safety and Agricultural Health Action Plan -2011
Plan under the National Strategy on Food Hygiene and safety 2011-2020 and the vision to 2030
Other policies addressing food security1. Resolution No 63/ NQ-CP on National Food Security - National strategy of food security to 2020 and vision 2030.
Aims to protect rice land and further step up intensive rice farming and productivity, especially in Mekong and Red river deltas
2. Resolution No.24/2008/NQ-CP On the issuance of Action PlanResolution on Agriculture and Rural development for the uplifting targets development and modernization of agriculture to ensure food security; considering aspects of human resources, socio-economic infrastructure, environment and culture and disaster risk reduction.
4. Health Insurance Law – 2008Includes children under six and near-poor people into a compulsory scheme to increase coverage of universal health insurance. Under revision to include nutrition services and therapeutic food for children with severe acute malnutrition, which will facilitate integrated management of acute malnutrition. Food safety policies or legislation1. Viet Nam National Food Safety Law - 2010The law specifies tasks along the food chain and management responsibility and coordination mechanisms of related government agencies and sanctioning of violations. Under this law, MoH developed technical standards for food additives, and micronutrient fortification
Viet Nam - Food and Nutrition Security Profiles
Sources:a/ World Bank, Health Nutrition and Population Statistics Database 2014 Updateb/ FAOSTAT 2013 Update; c/ World Bank, World Development Indicators Database, 2014 Update; d/ UNICEF, State of the World Children 2014 (data refer to the most recent year available during the period specified) e/ UN Statistics Division, MDG database 2013 Update.f/ Viet Nam MICS 2011
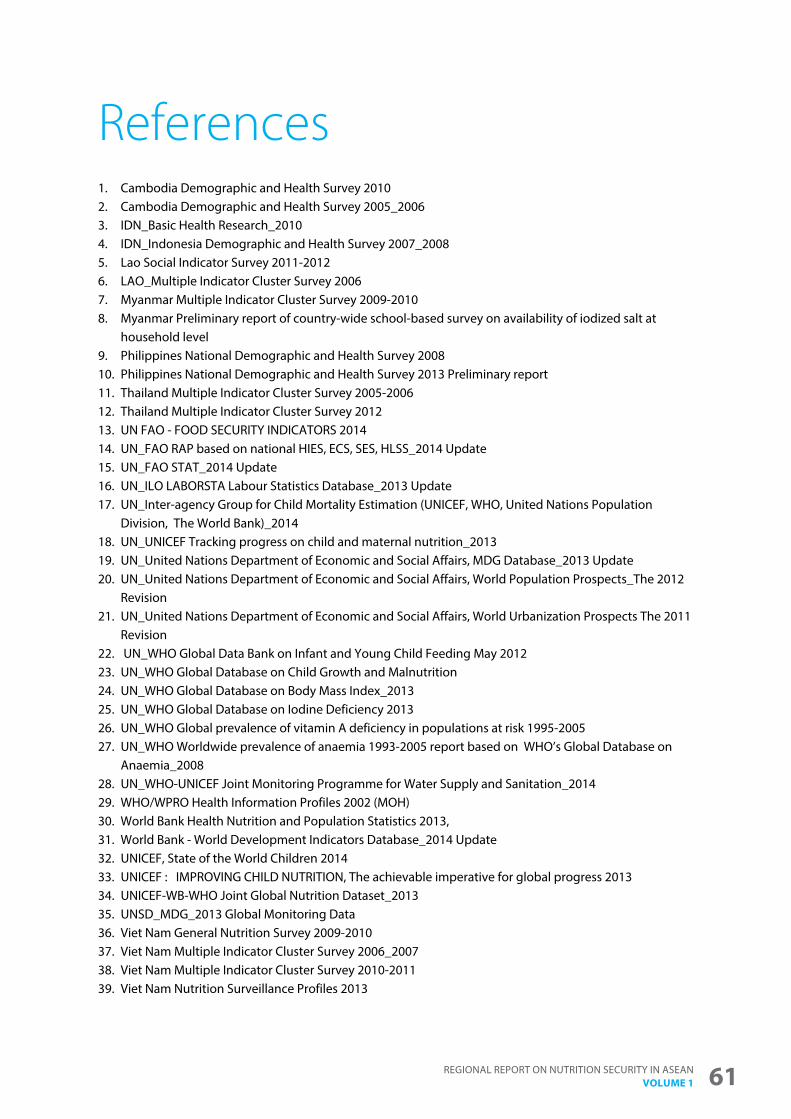
Regional RepoRt on nutRition SecuRity in aSean Volume 1 61
References 1. cambodia Demographic and Health Survey 20102. cambodia Demographic and Health Survey 2005_20063. iDn_Basic Health Research_20104. iDn_indonesia Demographic and Health Survey 2007_20085. lao Social indicator Survey 2011-20126. lao_Multiple indicator cluster Survey 20067. Myanmar Multiple indicator cluster Survey 2009-20108. Myanmar preliminary report of country-wide school-based survey on availability of iodized salt at
household level9. philippines national Demographic and Health Survey 200810. philippines national Demographic and Health Survey 2013 preliminary report11. thailand Multiple indicator cluster Survey 2005-2006 12. thailand Multiple indicator cluster Survey 201213. un Fao - FooD SecuRity inDicatoRS 201414. un_Fao Rap based on national HieS, ecS, SeS, HlSS_2014 update15. un_Fao Stat_2014 update16. un_ilo laBoRSta labour Statistics Database_2013 update17. un_inter-agency group for child Mortality estimation (uniceF, WHo, united nations population
Division, the World Bank)_2014 18. un_uniceF tracking progress on child and maternal nutrition_201319. un_united nations Department of economic and Social affairs, MDg Database_2013 update20. un_united nations Department of economic and Social affairs, World population prospects_the 2012
Revision21. un_united nations Department of economic and Social affairs, World urbanization prospects the 2011
Revision22. un_WHo global Data Bank on infant and young child Feeding May 201223. un_WHo global Database on child growth and Malnutrition24. un_WHo global Database on Body Mass index_201325. un_WHo global Database on iodine Deficiency 201326. un_WHo global prevalence of vitamin a deficiency in populations at risk 1995-200527. un_WHo Worldwide prevalence of anaemia 1993-2005 report based on WHo’s global Database on
anaemia_2008 28. un_WHo-uniceF Joint Monitoring programme for Water Supply and Sanitation_201429. WHo/WpRo Health information profiles 2002 (MoH)30. World Bank Health nutrition and population Statistics 2013,31. World Bank - World Development indicators Database_2014 update32. uniceF, State of the World children 201433. uniceF : iMpRoVing cHilD nutRition, the achievable imperative for global progress 201334. uniceF-WB-WHo Joint global nutrition Dataset_201335. unSD_MDg_2013 global Monitoring Data36. Viet nam general nutrition Survey 2009-201037. Viet nam Multiple indicator cluster Survey 2006_200738. Viet nam Multiple indicator cluster Survey 2010-201139. Viet nam nutrition Surveillance profiles 2013
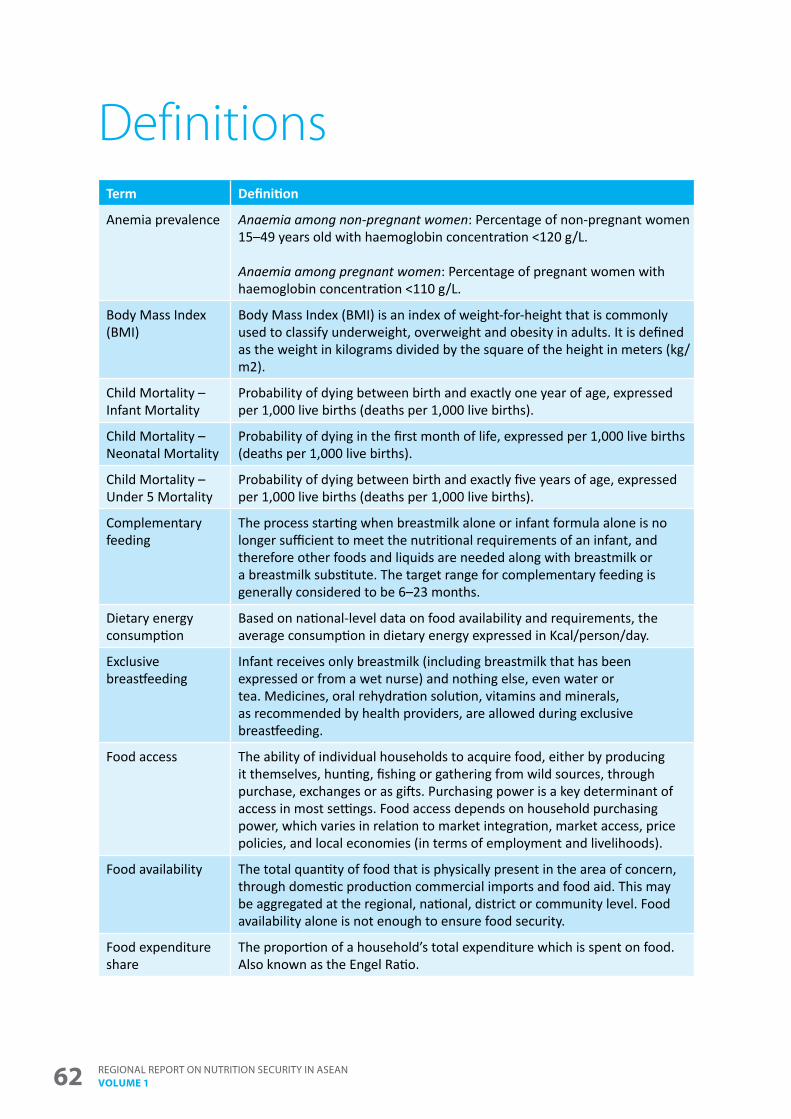
Regional RepoRt on nutRition SecuRity in aSean Volume 162
Definitions Term Definition
Anemia prevalence Anaemia among non-pregnant women: Percentage of non-pregnant women 15–49 years old with haemoglobin concentration <120 g/L.
Anaemia among pregnant women: Percentage of pregnant women with haemoglobin concentration <110 g/L.
Body Mass Index (BMI)
Body Mass Index (BMI) is an index of weight-for-height that is commonly used to classify underweight, overweight and obesity in adults. It is defined as the weight in kilograms divided by the square of the height in meters (kg/m2).
Child Mortality – Infant Mortality
Probability of dying between birth and exactly one year of age, expressed per 1,000 live births (deaths per 1,000 live births).
Child Mortality – Neonatal Mortality
Probability of dying in the first month of life, expressed per 1,000 live births (deaths per 1,000 live births).
Child Mortality – Under 5 Mortality
Probability of dying between birth and exactly five years of age, expressed per 1,000 live births (deaths per 1,000 live births).
Complementary feeding
The process starting when breastmilk alone or infant formula alone is no longer sufficient to meet the nutritional requirements of an infant, and therefore other foods and liquids are needed along with breastmilk or a breastmilk substitute. The target range for complementary feeding is generally considered to be 6–23 months.
Dietary energy consumption
Based on national-level data on food availability and requirements, the average consumption in dietary energy expressed in Kcal/person/day.
Exclusive breastfeeding
Infant receives only breastmilk (including breastmilk that has been expressed or from a wet nurse) and nothing else, even water or tea. Medicines, oral rehydration solution, vitamins and minerals, as recommended by health providers, are allowed during exclusive breastfeeding.
Food access The ability of individual households to acquire food, either by producing it themselves, hunting, fishing or gathering from wild sources, through purchase, exchanges or as gifts. Purchasing power is a key determinant of access in most settings. Food access depends on household purchasing power, which varies in relation to market integration, market access, price policies, and local economies (in terms of employment and livelihoods).
Food availability The total quantity of food that is physically present in the area of concern, through domestic production commercial imports and food aid. This may be aggregated at the regional, national, district or community level. Food availability alone is not enough to ensure food security.
Food expenditure share
The proportion of a household’s total expenditure which is spent on food. Also known as the Engel Ratio.
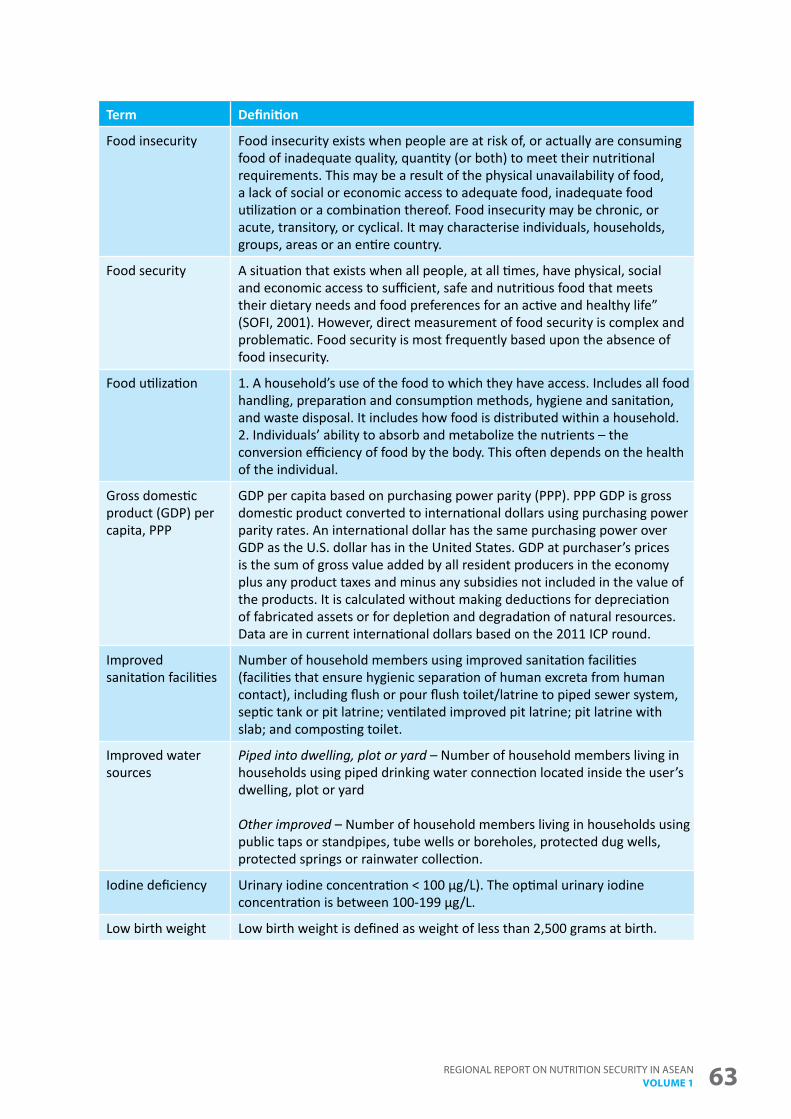
Regional RepoRt on nutRition SecuRity in aSean Volume 1 63
Term Definition
Food insecurity Food insecurity exists when people are at risk of, or actually are consuming food of inadequate quality, quantity (or both) to meet their nutritional requirements. This may be a result of the physical unavailability of food, a lack of social or economic access to adequate food, inadequate food utilization or a combination thereof. Food insecurity may be chronic, or acute, transitory, or cyclical. It may characterise individuals, households, groups, areas or an entire country.
Food security A situation that exists when all people, at all times, have physical, social and economic access to sufficient, safe and nutritious food that meets their dietary needs and food preferences for an active and healthy life” (SOFI, 2001). However, direct measurement of food security is complex and problematic. Food security is most frequently based upon the absence of food insecurity.
Food utilization 1. A household’s use of the food to which they have access. Includes all food handling, preparation and consumption methods, hygiene and sanitation, and waste disposal. It includes how food is distributed within a household.2. Individuals’ ability to absorb and metabolize the nutrients – the conversion efficiency of food by the body. This often depends on the health of the individual.
Gross domestic product (GDP) per capita, PPP
GDP per capita based on purchasing power parity (PPP). PPP GDP is gross domestic product converted to international dollars using purchasing power parity rates. An international dollar has the same purchasing power over GDP as the U.S. dollar has in the United States. GDP at purchaser’s prices is the sum of gross value added by all resident producers in the economy plus any product taxes and minus any subsidies not included in the value of the products. It is calculated without making deductions for depreciation of fabricated assets or for depletion and degradation of natural resources. Data are in current international dollars based on the 2011 ICP round.
Improved sanitation facilities
Number of household members using improved sanitation facilities (facilities that ensure hygienic separation of human excreta from human contact), including flush or pour flush toilet/latrine to piped sewer system, septic tank or pit latrine; ventilated improved pit latrine; pit latrine with slab; and composting toilet.
Improved water sources
Piped into dwelling, plot or yard – Number of household members living in households using piped drinking water connection located inside the user’s dwelling, plot or yard
Other improved – Number of household members living in households using public taps or standpipes, tube wells or boreholes, protected dug wells, protected springs or rainwater collection.
Iodine deficiency Urinary iodine concentration < 100 µg/L). The optimal urinary iodine concentration is between 100-199 µg/L.
Low birth weight Low birth weight is defined as weight of less than 2,500 grams at birth.
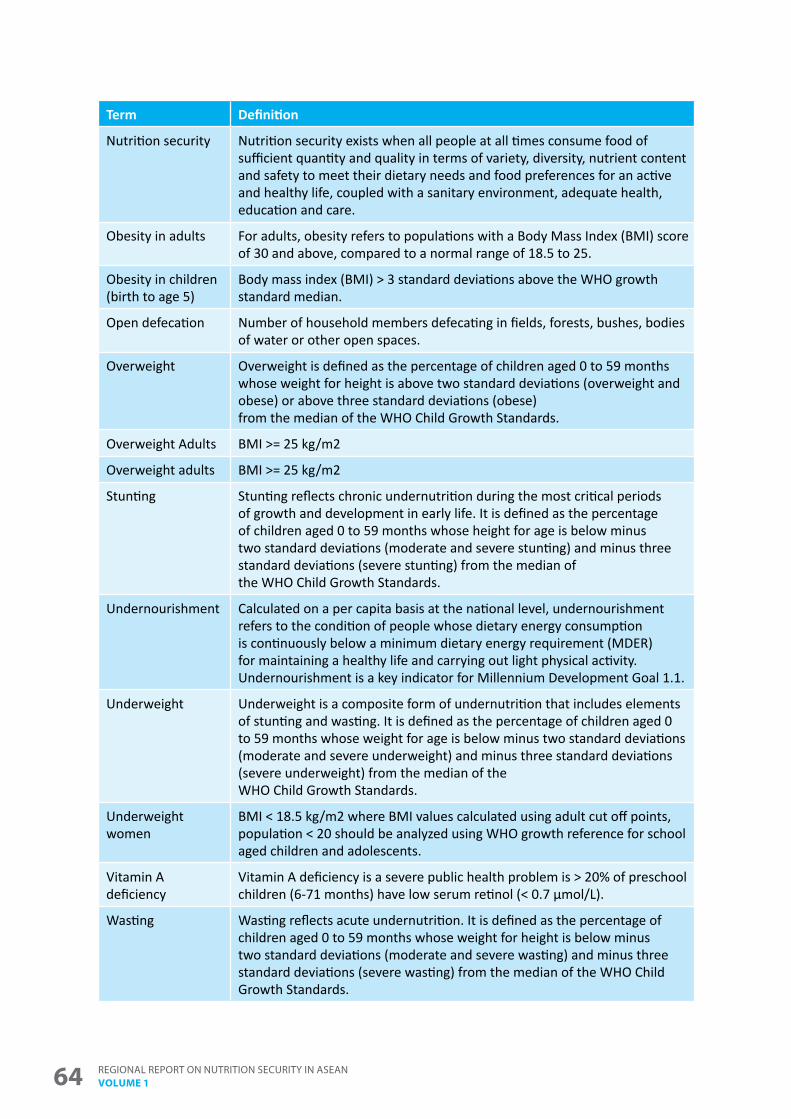
Regional RepoRt on nutRition SecuRity in aSean Volume 164
Term Definition
Nutrition security Nutrition security exists when all people at all times consume food of sufficient quantity and quality in terms of variety, diversity, nutrient content and safety to meet their dietary needs and food preferences for an active and healthy life, coupled with a sanitary environment, adequate health, education and care.
Obesity in adults For adults, obesity refers to populations with a Body Mass Index (BMI) score of 30 and above, compared to a normal range of 18.5 to 25.
Obesity in children (birth to age 5)
Body mass index (BMI) > 3 standard deviations above the WHO growth standard median.
Open defecation Number of household members defecating in fields, forests, bushes, bodies of water or other open spaces.
Overweight Overweight is defined as the percentage of children aged 0 to 59 months whose weight for height is above two standard deviations (overweight and obese) or above three standard deviations (obese)from the median of the WHO Child Growth Standards.
Overweight Adults BMI >= 25 kg/m2
Overweight adults BMI >= 25 kg/m2
Stunting Stunting reflects chronic undernutrition during the most critical periods of growth and development in early life. It is defined as the percentage of children aged 0 to 59 months whose height for age is below minus two standard deviations (moderate and severe stunting) and minus three standard deviations (severe stunting) from the median ofthe WHO Child Growth Standards.
Undernourishment Calculated on a per capita basis at the national level, undernourishment refers to the condition of people whose dietary energy consumption is continuously below a minimum dietary energy requirement (MDER) for maintaining a healthy life and carrying out light physical activity. Undernourishment is a key indicator for Millennium Development Goal 1.1.
Underweight Underweight is a composite form of undernutrition that includes elements of stunting and wasting. It is defined as the percentage of children aged 0 to 59 months whose weight for age is below minus two standard deviations (moderate and severe underweight) and minus three standard deviations (severe underweight) from the median of theWHO Child Growth Standards.
Underweight women
BMI < 18.5 kg/m2 where BMI values calculated using adult cut off points, population < 20 should be analyzed using WHO growth reference for school aged children and adolescents.
Vitamin A deficiency
Vitamin A deficiency is a severe public health problem is > 20% of preschool children (6-71 months) have low serum retinol (< 0.7 µmol/L).
Wasting Wasting reflects acute undernutrition. It is defined as the percentage of children aged 0 to 59 months whose weight for height is below minus two standard deviations (moderate and severe wasting) and minus three standard deviations (severe wasting) from the median of the WHO Child Growth Standards.


united nations children’s FunduniceF east asia and Regional office (eapRo)19 phra atit RoadBangkok 10200thailandWebsite: www.unicef.org/eaproe-mail: [email protected]