Embed Size (px)
Citation preview
Suite 540, 840 Sixth Avenue SW, Calgary, Alberta, T2P 3E5
Edmonton’s Energy Transition Plan (ETP)
CASE FOR GOING BEYOND BUILDING CODE
31st January 2014
Richard Boyd and Karen Gorecki
C3 page 2
INTRODUCTION
CONTEXT
The energy efficiency of new buildings influences energy consumption in the residential and ICI sector far longer than other end-use components determine energy consumption in other sectors. Buildings are typically constructed for use over many decades—in some cases—for 50 to 100 years. In other areas of energy end use, the capital lifetime of energy efficiency improvements will be, at most, a few decades. Hence, influencing decisions taken during a building’s design and initial construction is crucial to reducing long-term energy use in the residential and ICI sector. Moreover, energy savings obtained when construction takes place are relatively cost-effective. Some measures to improve a building’s energy use can only be obtained at construction or through extensive, often expensive refurbishment at a later stage—after several decades.
The policy instrument most frequently used to influence a building’s lifetime energy use at the project stage is building code—specifically minimum energy performance (MEP) requirements in the code. MEP requirements in the building code helps complete the market transformation process by mandating that all new buildings incorporate construction techniques and equipment that meet minimum energy performance levels. They purposefully target the low-efficiency segment of the market seeking to eliminate sales of obsolete or energy inefficient technology. In doing so, building codes “push” the market towards greater levels of energy efficiency by forcing builders, developers, designers, equipment manufacturers, etc. to eliminate the production of less efficient buildings previously sold.1 Moreover, it is much more cost-effective to improve the energy efficiency of the sector’s worst performers through minimum standards (applicable across all end-users) than through measures targeted at individual end-users.
At the same time as energy requirements in building code improve the energy performance of the sector’s worst performers, the high-efficiency and state-of-the-art segments of the market would continue to improve. Indeed, new MEP requirements establish higher baselines for the sector’s top-performers to “go beyond code”, often with the support of financial and non-financial incentives. These newly established top performers serve to “pull” the market forward over time. In addition, MEP requirements in building code often serve as the benchmark for refurbishment and energy efficiency improvements in existing buildings. Higher performance requirements in code thus increase the level of energy efficiency targeted by upgrades to existing buildings. Overall, MEP requirements in building code serve to directly “push” and indirectly “pull” the average energy performance of the building sector to higher and higher levels.
1 Energy labels serve a complementary function in the marketplace; they “pull” the market towards greater levels of
energy efficiency by helping buyers make better-informed decisions and demand more efficient buildings. This in turn
encourages market actors (builders, developers, designers) to provide buildings with higher levels of energy
efficiency. In the absence of the information provided by energy labels, buyers (leasers) are often ill-informed about
the true life-cycle cost of a building, and suppliers lack the incentive to improve energy efficiency as there is no
mechanism for the market to recognize and value this attribute. Building codes and labels work together to transform
the level of energy efficiency offered in the new building market.
C3 page 3
Across both the residential and ICI buildings sectors, recommendations for more stringent MEP requirements in the building code under the Reduced Carbon Case and Low Carbon Case in Edmonton’s ETP are estimated to generate cumulative energy savings of about 390 TJ and 2,390 TJ, respectively, over the period 2014-2044.
OBJECTIVE
The overarching objective of this assignment is to develop an evidence base for residential buildings in support of more stringent MEP requirements in Alberta’s building code. The evidence base comprises two elements:
1. The incremental costs, energy savings, cost of conserved energy (CCE), and simple payback time associated with different scenarios for “above code” homes in Edmonton; and
2. The incremental life-cycle energy savings, GHG savings, undiscounted social and home-owner benefits, undiscounted home-owner costs, and various metrics of economic performance (e.g., NPV, ROI, SPB, and marginal GHG abatement cost) for an illustrative incentive program to drive the supply of, and demand for, “above code” new homes in Edmonton as part of the ETP; and
A qualitative argument for going beyond building code in the context of transforming the market for residential buildings is presented in Assignment 1.6.
ELEMENT 1 – COSTS AND SAVINGS OF “ABOVE CODE” NEW HOMES
METHODOLOGY
o Develop two residential new construction building archetypes, one single family
detached (SFD) home and one single family attached (SFA), as follows:
Calculate the median size SFD and SFA (including row and duplexes) homes
built over the period 2007 to 2012 from the EnerGuide for Houses (EGH)
database. These home sizes correlate well to those used by Natural Resources
Canada’s Comprehensive Energy Use Database (CEUD) and in Edmonton’s
Energy Transition Strategy (approximately 150 m2 for SFD and 131 m2
for SFA).
The number of windows and doors from the median SFD house in the EGH
database is 12 windows and 2 doors. For consistency, we use the same number
of windows and doors for the SFA home.
Assume SFD and SFA archetypes are two floors with a full basement
(representative of the majority of Edmonton homes in the EGH database).
Generate the archetypes using the HOT 2000 “house wizard”, allowing the
program to choose the house shape, window and door sizes and location, and
ceiling and attic type.
C3 page 4
The heel height of the attic was increased (0.69 meters) to allow for up to 100 R-
value of blown cellulose insulation.
Full details of each archetype is presented in Appendix A.
o Establish baseline energy efficiency parameters (e.g., insulation levels, mechanical
system efficiency, and window efficiency) based on what is expected to be in the next
iteration of updated national model construction codes (see Appendix B for details). It is
assumed that Municipal Affairs follows through with its stated intention to adopt the MEP
requirements in Part 9 (Housing and Small Buildings) of the National Energy Code for
Buildings as written. Lower levels of insulation were considered for homes with a heat
recovery ventilator. Our baseline home included a heat recovery ventilator, so these
were the levels of insulation chosen. Given Alberta currently requires a minimum of 90
AFUE natural gas furnace for new construction, we choose this level of efficiency over
92 AFUE chosen by the Canadian Codes Centre study (Proskiw, 2011).
o Three levels of above code energy efficiency were applied to the baseline building
archetypes. Decisions around what energy efficiency measures to include in each
efficiency level was based on:
Energy efficiency measure cost-effective test results from previous program
appraisals and evaluations performed by C3;
The lowest incremental capital cost net zero home in Edmonton in Canmet
ENERGY’s study (CanmetENERGY, 2012); and
Fuel choice for space and water heating.
o The three above code new SFA and SFD homes are best characterized as:
Moderately insulated - moderate levels of insulation and air sealing (as compared
to baseline) with baseline efficiency for mechanical systems;
Highly efficient mechanical systems - moderate levels of insulation, better air
sealing, with the higher level of efficiency for mechanical systems; and
Near net zero - high levels of insulation, a high level of air sealing, and the
highest level of efficiency for mechanical systems possible (considering
appropriate sizing and fuel type).
o Each of the SFD and SFA baseline archetype homes and the three above code levels of
energy efficiency for each archetype home are modeled in HOT2000 to obtain an
estimate of expected annual energy consumption per home.
RESULTS
HOT2000 ENERGY OUTPUTS
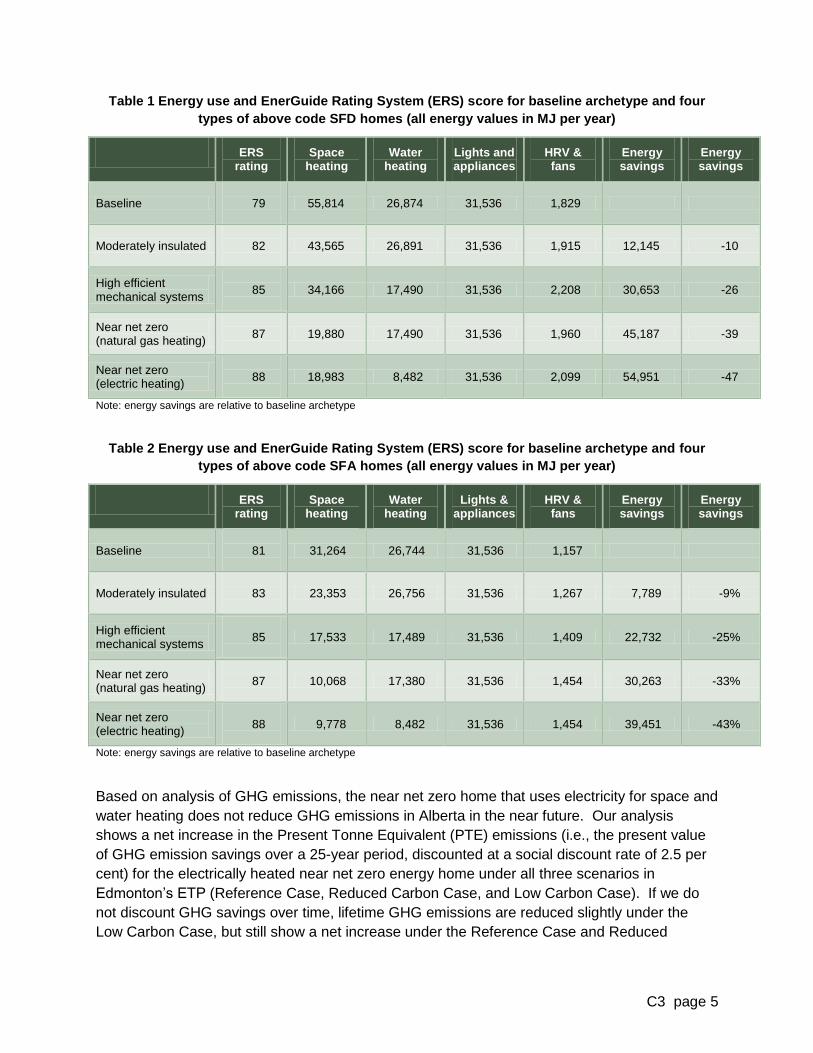
The modeled outputs for the SFD baseline and above code homes and the SFA baseline and
above code homes are shown in Table 1 and Table 2, respectively.
C3 page 5
Table 1 Energy use and EnerGuide Rating System (ERS) score for baseline archetype and four
types of above code SFD homes (all energy values in MJ per year)
ERS rating
Space heating
Water heating
Lights and appliances
HRV & fans
Energy savings
Energy savings
Baseline
79
55,814 26,874 31,536 1,829
Moderately insulated
82
43,565 26,891 31,536 1,915 12,145 -10
High efficient mechanical systems
85
34,166 17,490 31,536 2,208 30,653 -26
Near net zero (natural gas heating)
87
19,880 17,490 31,536 1,960 45,187 -39
Near net zero (electric heating)
88
18,983 8,482 31,536 2,099 54,951 -47
Note: energy savings are relative to baseline archetype
Table 2 Energy use and EnerGuide Rating System (ERS) score for baseline archetype and four
types of above code SFA homes (all energy values in MJ per year)
ERS rating
Space heating
Water heating
Lights & appliances
HRV & fans
Energy savings
Energy savings
Baseline
81
31,264 26,744 31,536 1,157
Moderately insulated
83
23,353 26,756 31,536 1,267 7,789 -9%
High efficient mechanical systems
85
17,533 17,489 31,536 1,409 22,732 -25%
Near net zero (natural gas heating)
87
10,068 17,380 31,536 1,454 30,263 -33%
Near net zero (electric heating)
88
9,778 8,482 31,536 1,454 39,451 -43%
Note: energy savings are relative to baseline archetype
Based on analysis of GHG emissions, the near net zero home that uses electricity for space and
water heating does not reduce GHG emissions in Alberta in the near future. Our analysis
shows a net increase in the Present Tonne Equivalent (PTE) emissions (i.e., the present value
of GHG emission savings over a 25-year period, discounted at a social discount rate of 2.5 per
cent) for the electrically heated near net zero energy home under all three scenarios in
Edmonton’s ETP (Reference Case, Reduced Carbon Case, and Low Carbon Case). If we do
not discount GHG savings over time, lifetime GHG emissions are reduced slightly under the
Low Carbon Case, but still show a net increase under the Reference Case and Reduced
C3 page 6
Carbon Case. Of course, if the homeowner purchases or generates their own renewable
electricity to displace the grid electricity used to heat their net zero energy home, lifetime GHG
emissions are reduced under all three ETP scenarios.
The City of Edmonton (COE) requested that the most energy efficient home modeled attempt to
meet a passive house standard. The criteria for achieving a passive house standard is:
o Space Heat Demand: maximum 15 kWh per m² r maximum heating load of 10 W per m²
annually;
o Pressurization Test Result: maximum 0.6 ACH @ 50 Pa (pressurizing and
depressurizing); and
o Total Primary Energy Demand: maximum 120 kWh per m² annually.
Some energy efficient builders believe that the passive house standard is too stringent as it
pushes building envelope requirements to a point of diminishing returns. We followed Canmet’s
measure choices with the lowest incremental cost to achieve net zero in Edmonton, as these
provided some guidance on cost optimization for a high performing building in Edmonton (even
if we did not have to achieve net zero). Based on these measure choices, we did not manage
to fully achieve the passive house standard for both SFA and SFD homes. The SFA near net
zero homes (both electricity and natural gas based space and water heating) met all passive
house criteria. In contrast, the SFD near net zero homes (both electric and natural gas space
and water heating) did not meet the passive house standard for space heating (achieving 21
kWh per m² for space heating demand). The SFD homes did meet the passive house standard
fully when modeled without basements. The insulation levels in the basement were lower than
a passive house standard given Canmet’s cost optimization, but the other efficiency features of
the building envelope could pass the passive house standard.
INCREMENTAL COSTS OF GOING BEYOND CODE
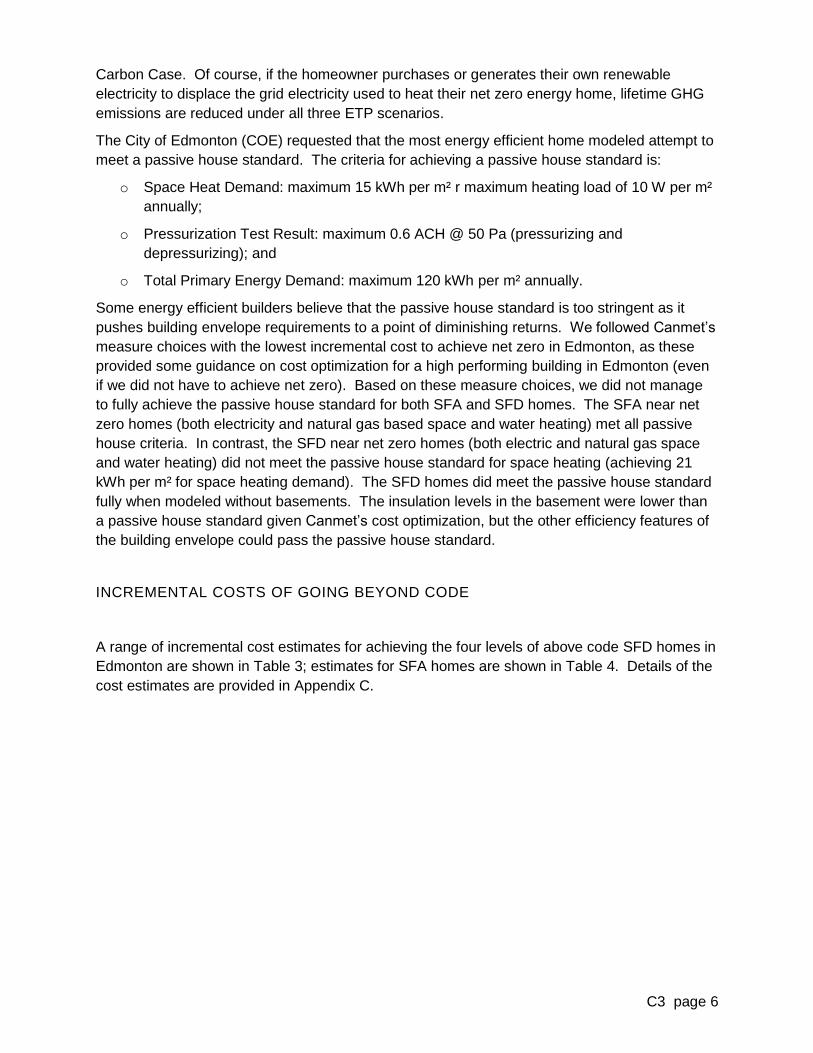
A range of incremental cost estimates for achieving the four levels of above code SFD homes in
Edmonton are shown in Table 3; estimates for SFA homes are shown in Table 4. Details of the
cost estimates are provided in Appendix C.
C3 page 7
Table 3 Total incremental costs for four types of above code SFD homes
Higher-cost Mid-cost Lower-cost
Moderately insulated $6,424 $5,050 $3,676
High efficient mechanical systems $12,604 $9,696 $6,789
Near net zero (natural gas heating) $38,780 $30,423 $21,862
Near net zero (electric heating) $27,056 $23,968 $20,880
Table 4 Total incremental costs for four types of above code SFA homes
Higher-cost Mid-cost Lower-cost
Moderately insulated $4,464 $3,485 $2,506
High efficient mechanical systems $11,630 $8,138 $6,319
Near net zero (natural gas heating) $36,361 $28,379 $20,397
Near net zero (electric heating) $25,850 $23,074 $20,299
COST EFFECTIVENESS OF GOING BEYOND CODE
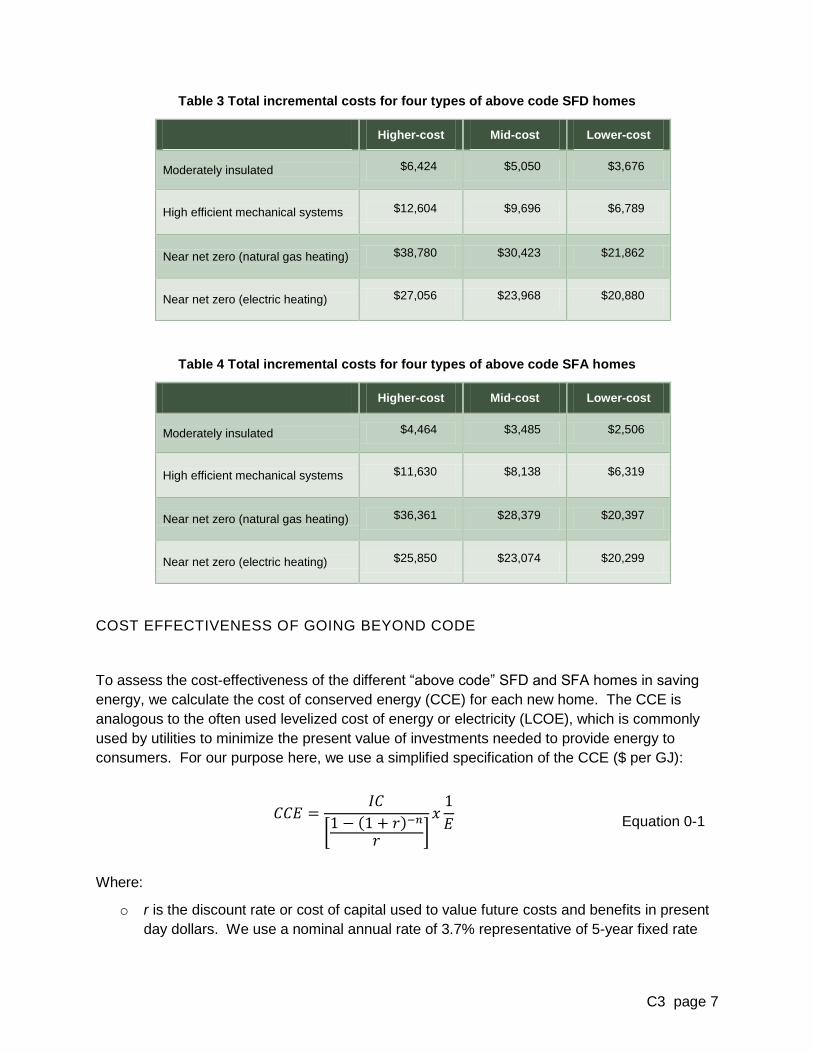
To assess the cost-effectiveness of the different “above code” SFD and SFA homes in saving
energy, we calculate the cost of conserved energy (CCE) for each new home. The CCE is
analogous to the often used levelized cost of energy or electricity (LCOE), which is commonly
used by utilities to minimize the present value of investments needed to provide energy to
consumers. For our purpose here, we use a simplified specification of the CCE ($ per GJ):
[ ( )
]
Equation 0-1
Where:
o r is the discount rate or cost of capital used to value future costs and benefits in present
day dollars. We use a nominal annual rate of 3.7% representative of 5-year fixed rate
C3 page 8
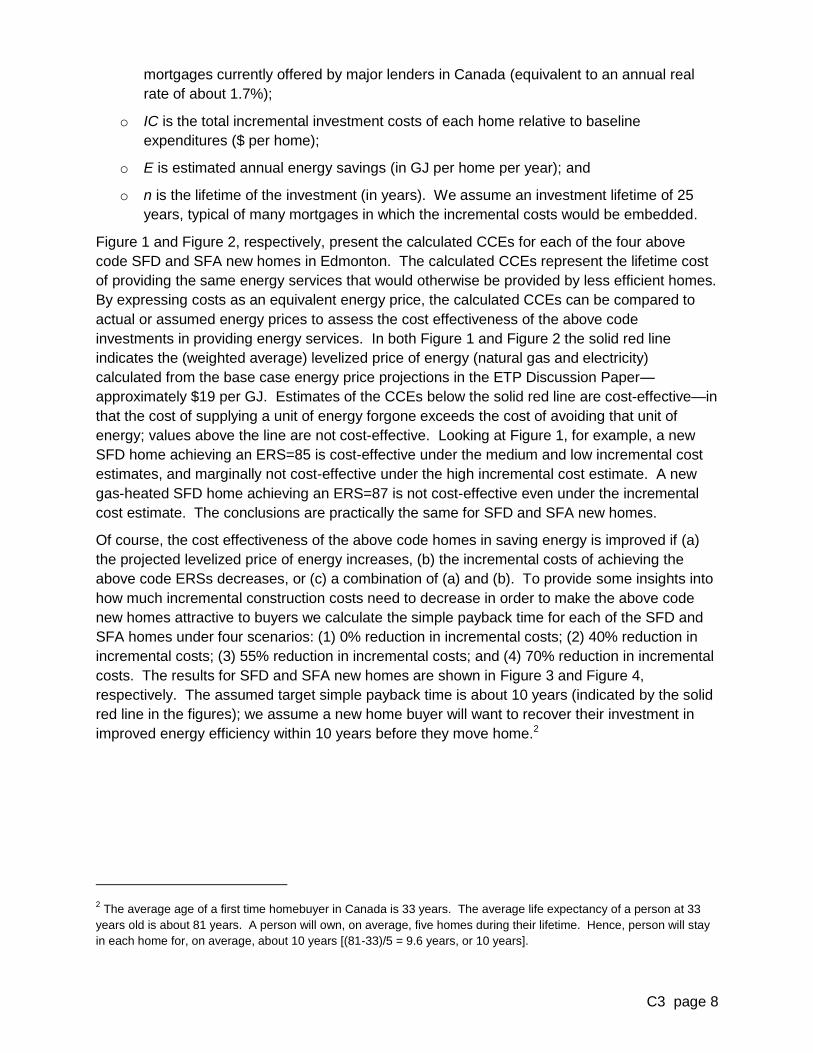
mortgages currently offered by major lenders in Canada (equivalent to an annual real
rate of about 1.7%);
o IC is the total incremental investment costs of each home relative to baseline
expenditures ($ per home);
o E is estimated annual energy savings (in GJ per home per year); and
o n is the lifetime of the investment (in years). We assume an investment lifetime of 25
years, typical of many mortgages in which the incremental costs would be embedded.
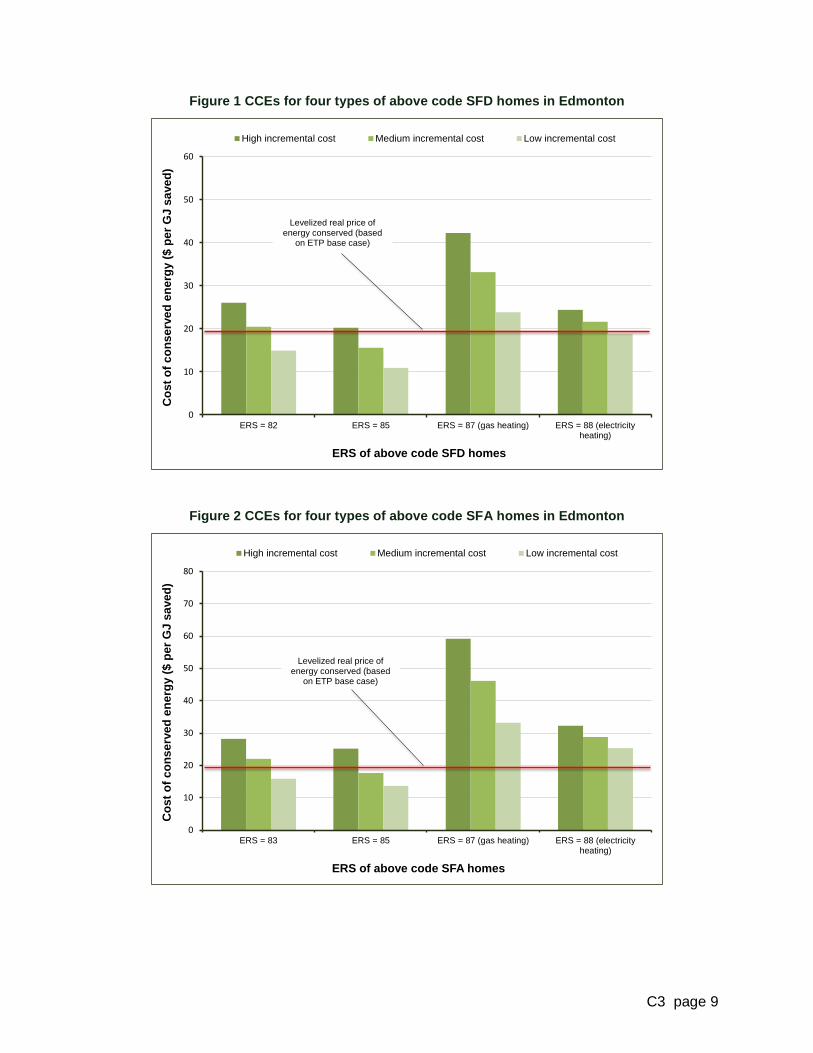
Figure 1 and Figure 2, respectively, present the calculated CCEs for each of the four above
code SFD and SFA new homes in Edmonton. The calculated CCEs represent the lifetime cost
of providing the same energy services that would otherwise be provided by less efficient homes.
By expressing costs as an equivalent energy price, the calculated CCEs can be compared to
actual or assumed energy prices to assess the cost effectiveness of the above code
investments in providing energy services. In both Figure 1 and Figure 2 the solid red line
indicates the (weighted average) levelized price of energy (natural gas and electricity)
calculated from the base case energy price projections in the ETP Discussion Paper—
approximately $19 per GJ. Estimates of the CCEs below the solid red line are cost-effective—in
that the cost of supplying a unit of energy forgone exceeds the cost of avoiding that unit of
energy; values above the line are not cost-effective. Looking at Figure 1, for example, a new
SFD home achieving an ERS=85 is cost-effective under the medium and low incremental cost
estimates, and marginally not cost-effective under the high incremental cost estimate. A new
gas-heated SFD home achieving an ERS=87 is not cost-effective even under the incremental
cost estimate. The conclusions are practically the same for SFD and SFA new homes.
Of course, the cost effectiveness of the above code homes in saving energy is improved if (a)
the projected levelized price of energy increases, (b) the incremental costs of achieving the
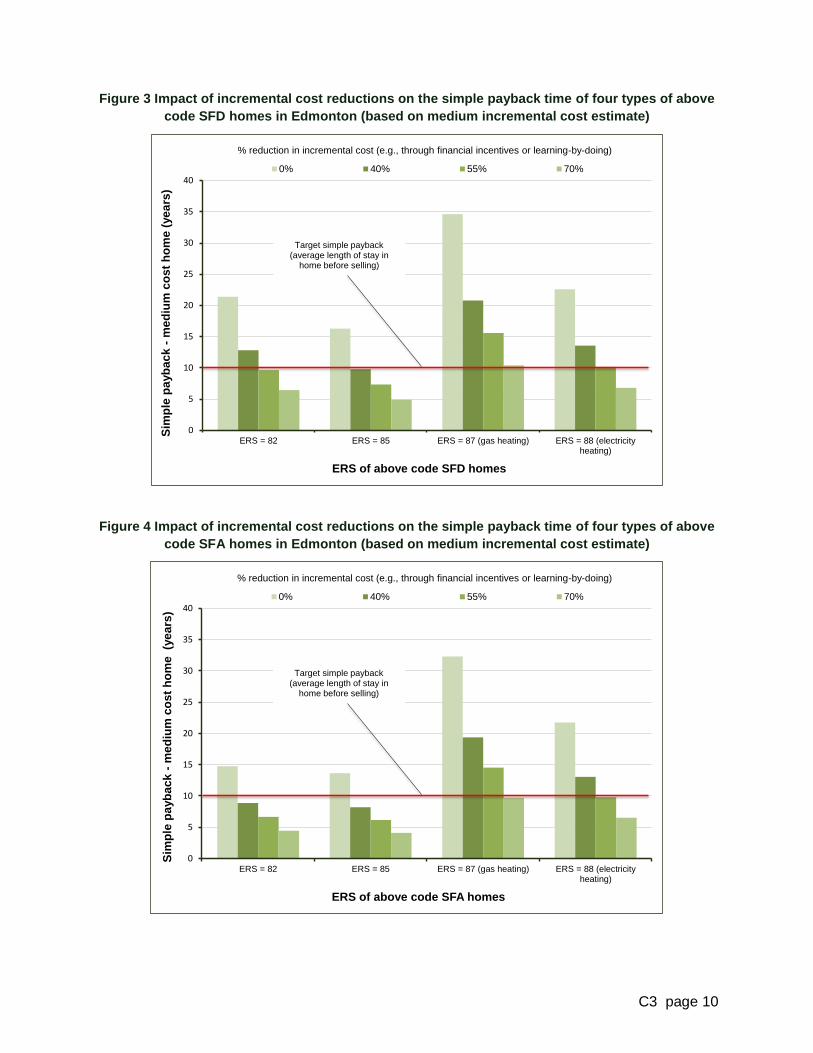
above code ERSs decreases, or (c) a combination of (a) and (b). To provide some insights into
how much incremental construction costs need to decrease in order to make the above code
new homes attractive to buyers we calculate the simple payback time for each of the SFD and
SFA homes under four scenarios: (1) 0% reduction in incremental costs; (2) 40% reduction in
incremental costs; (3) 55% reduction in incremental costs; and (4) 70% reduction in incremental
costs. The results for SFD and SFA new homes are shown in Figure 3 and Figure 4,
respectively. The assumed target simple payback time is about 10 years (indicated by the solid
red line in the figures); we assume a new home buyer will want to recover their investment in
improved energy efficiency within 10 years before they move home.2
2 The average age of a first time homebuyer in Canada is 33 years. The average life expectancy of a person at 33
years old is about 81 years. A person will own, on average, five homes during their lifetime. Hence, person will stay
in each home for, on average, about 10 years [(81-33)/5 = 9.6 years, or 10 years].
C3 page 9
Figure 1 CCEs for four types of above code SFD homes in Edmonton
Figure 2 CCEs for four types of above code SFA homes in Edmonton
0
10
20
30
40
50
60
ERS = 82 ERS = 85 ERS = 87 (gas heating) ERS = 88 (electricityheating)
Co
st
of
co
ns
erv
ed
en
erg
y (
$ p
er
GJ
sa
ve
d)
ERS of above code SFD homes
High incremental cost Medium incremental cost Low incremental cost
Levelized real price of energy conserved (based
on ETP base case)
0
10
20
30
40
50
60
70
80
ERS = 83 ERS = 85 ERS = 87 (gas heating) ERS = 88 (electricityheating)
Co
st
of
co
nse
rved
en
erg
y (
$ p
er
GJ
sa
ved
)
ERS of above code SFA homes
High incremental cost Medium incremental cost Low incremental cost
Levelized real price of energy conserved (based
on ETP base case)
C3 page 10
Figure 3 Impact of incremental cost reductions on the simple payback time of four types of above
code SFD homes in Edmonton (based on medium incremental cost estimate)
Figure 4 Impact of incremental cost reductions on the simple payback time of four types of above
code SFA homes in Edmonton (based on medium incremental cost estimate)
0
5
10
15
20
25
30
35
40
ERS = 82 ERS = 85 ERS = 87 (gas heating) ERS = 88 (electricityheating)
Sim
ple
pa
yb
ac
k -
me
diu
m c
os
t h
om
e (
ye
ars
)
ERS of above code SFD homes
0% 40% 55% 70%
Target simple payback (average length of stay in
home before selling)
% reduction in incremental cost (e.g., through financial incentives or learning-by-doing)
0
5
10
15
20
25
30
35
40
ERS = 82 ERS = 85 ERS = 87 (gas heating) ERS = 88 (electricityheating)
Sim
ple
pa
yb
ac
k -
me
diu
m c
os
t h
om
e (y
ea
rs)
ERS of above code SFA homes
0% 40% 55% 70%
Target simple payback (average length of stay in
home before selling)
% reduction in incremental cost (e.g., through financial incentives or learning-by-doing)
C3 page 11
Looking at new SFD homes in Figure 3, for example, the target simple payback time is achieved
if incremental costs are reduced at most by:
o 55% for the ERS=82 new home;
o 40% for the ERS=85 new home;
o 70% for the ERS=87 (natural gas heated) new home; and
o 55% for the ETR=88 (electricity heated) new home.
For the new SFA homes in Figure 4, the target simple payback time is achieved if incremental
costs are reduced at most by:
o 40% for the ERS=83 new home;
o 40% for the ERS=85 new home;
o 70% for the ERS=87 (natural gas heated) new home; and
o 55% for the ETR=88 (electricity heated) new home.
Incremental costs can be reduced through different mechanisms, including:
o Rebates, discounts or subsidized financing provided through a tiered incentive new home program;
o Experience or learning effects. These effects relate the unit costs of a technology or practice to cumulative sales through a “progress ratio” (the rate at which unit costs decline for each doubling of cumulative production). A progress ratio of 90% results in a learning rate of 10% and similar cost reductions per doubling of cumulative sales. For many energy technologies estimated progress ratios are in the range of 70-90%. Under the ETP Reference Case, the cumulative supply of new homes in Edmonton is projected to double about 3.5 times over the period 2014-2044; or
o A combination of both. A tiered incentive program will serve to accelerate market penetration of above code home and the accumulation of knowledge in market actors, in turn, reducing unit costs.
ELEMENT 2 – ILLUSTRATIVE COSTS AND BENEFITS OF TIERED INCENTIVE
PROGRAM FOR GOING BEYOND CODE
This section presents the estimated economic and environmental outcomes of an illustrative
tiered incentive program to encourage builders in Edmonton to construct new homes that
exceed the minimum energy performance requirements in the new national building code. The
outcomes are generated using C3’s energy-economic-emissions model of the residential
housing sector in Alberta. The approach and key assumptions are presented first, followed by
the results.
C3 page 12
METHODOLOGY
OVERALL APPROACH
The net benefits of the incentive program are appraised from two perspectives:
1. Society
This perspective includes the broadest range of costs and benefits, including monetized
externalities, regardless of who experiences them. It offers the most comprehensive
assessment of the program’s net benefit to society as a whole. Appraising the program from
this perspective answers two essential questions for policy-makers: Are all of the benefits of the
program greater than all of the costs, regardless of who pays the costs and who receives the
benefits? Are Edmontonians collectively better off as a result of the program and by how much?
The costs include all costs incurred by any member of society: the City, the program
administrator, the participants, and anyone else. The two main cost components are:
1. The premium cost of the energy-saving technology or practice (i.e., the “equipment
cost”). Equipment costs are the capital, operating and maintenance and, where
relevant, fuel costs incurred by builders to achieve a reduction in electricity or natural
gas use in new homes. Due to the nature of the equipment purchase decision—that is,
during construction as opposed to a retrofit—the equipment cost is given by the cost
difference between the energy-saving equipment and the baseline equipment; and
2. The other main cost component is the “delivery cost”. These are the costs related to:
planning, design, analysis, measurement and verification, and evaluation of program
elements; compliance and enforcement activities, where relevant (i.e., “regulatory
costs”); activities designed to reach participants, bring them into programs, and deliver
services such as marketing and application processing; inspections and quality control;
staff recruitment, placement, compensation, development and training; data collection,
reporting, record-keeping, and accounting; and overhead costs such as office space and
equipment, and legal fees. In this analysis, incentive costs are included as part of
delivery costs, in order to highlight the total cost of the program to the City. Incentive
costs are payments made to builders to cover the cost of energy assessments and to
assist builders with the incremental equipment costs. Incentive costs take the form of
rebates in the analysis, but can also involve low or no interest loans, shared savings
arrangements, service fees, etc. Incentive costs represent a transfer of funds between
the City and participating builder, thereby reducing energy assessment and equipment
costs. Hence, in order to avoid double counting and underestimating aggregate net
benefits, participant (builder) costs are adjusted accordingly.
Similar to costs, the benefits of each above code new home include all of the benefits
experienced by any member of society. The benefits are given by the energy supply costs and
monetized externalities that are avoided as a result of the energy savings achieved by the
C3 page 13
program, or simply the “avoided costs”. There are two main categories of avoided costs:
energy-related costs; and capacity-related costs. The former include costs associated with
avoided electricity generation and natural gas purchases, and their transmission and
distribution, and other benefits associated with energy production such as reduced GHG
emissions and water usage. Capacity-related avoided costs involve infrastructure investments
such as power plants and transmission and distribution lines. The impact of the program on
capacity-related costs is not considered, since the majority of energy savings result from
reduced natural gas consumption, as opposed to reduce electricity use.
2. Participants
This perspective includes the costs and benefits experienced by the eventual homeowner
directly targeted by the program. It provides an indication of the distributional effects of the
program, and—while of limited use for appraising the overall economic merit of the program as
a public investment—it may be used to help design programs to optimize participation (in terms
of buyers’ willingness to pay and demand for more efficient homes). To this end, appraising the
program from this perspective reveals whether a targeted actor is better off as a result of the
program and by how much? Consequently, analysis from this perspective provides insight into
whether the targeted actor is likely to want to adopt a desired practice or energy-saving
technology.
The costs include the incremental equipment costs, net of all applicable incentive payments (it is
implicitly assumed that net increment equipment costs are passed through to homebuyers in the
price of the new home). The benefits include the eventual reduction in the household’s
electricity and natural gas bills.
Analyzing the economic costs and benefits of the program from either perspective requires a
calculation of the (present value, PV) total benefits and the (present value, PV) total costs in
dollar terms over the lifetime of each purchased and installed efficiency measure, to determine
the Net Present Value (NPV):
NPV = PV avoided cost – (PV equipment cost + PV delivery cost)
The discounted streams of avoided costs, equipment costs and deliver costs are expressed as
present values in 2010 dollars. If the estimated NPV is positive, this shows the magnitude of
the dollar value increase in the wealth of Edmontonians from the program.
ASSUMPTIONS
Key assumptions under pinning the modeling are listed below. Default assumptions in the
model have been modified to match those in the ETP Discussion Paper. The analysis is
performed for the Reference Case only.
o Under the ETP Reference Case 42,840 new homes are constructed in Edmonton in
2015 (65% are SFD and 35% are SFA). The numbers increases to 113,790 new homes
in 2025 (again, 65% are SFD and 35% are SFA).
C3 page 14
o The GHG intensity of natural gas is 0.0509 t CO2e per GJ under the Reference Case.
This is assumed constant over the forecast period through 2050.
o The GHG intensity of electricity under the Reference Case is: 880 t CO2e per GWh
(2009), 628 t CO2e per GWh (2024), and 538 t CO2e per GWh (2044). The GHG
intensity is assumed to follow a linear path between 2009 and 2024 and between 2024
and 2044. The trend between 2024 and 2044 is assumed to continue till 2050.
o Avoided energy supply costs are valued using the base case energy price projections in
the ETP Discussion Paper.
o Avoided GHG emissions are valued at $40 per t CO2e (consistent with current practice
by the City of Edmonton).
o The program is funded for five years (2015 Q1 through 2019 Q4). The model
nonetheless captures the lifetime costs and benefits of new homes constructed in 2025
through 2050. For the purpose of illustration, the annual budget for the program is
$1,000,000.
o The lifetime of the energy efficiency improvements installed at construction is assumed
to be 25 years.
o Tiered incentives (rebates) target builders and developers consistent with “best practice”
energy efficiency programs for residential new construction (Nowak, 2013). The
program is open to builders of both SFD and SFA new homes. Three above code new
SFA homes and three above code new SFD homes are incented:
Tier 1: New homes achieving an ERS = 80-81;
Tier 2: New homes achieving an ERS = 82-85; and
Tier 3: New (gas heated) homes achieving and ERS >85.
o The financial incentives offered builders are set to generate a simple payback time of 10
years (note that these levels of incentives are purely illustrative—builders and
developers may prefer to see a larger fraction of the program budget allocated to
technical assistance):
Tier 1: New homes achieving an ERS = 80-81 ($1,400 for SFA and $2,300 for
SFD);
Tier 2: New homes achieving an ERS = 82-85 ($3,250 for SFA and $3,900 for
SFD); and
Tier 3: New (gas heated) homes achieving and ERS >85 ($19,850 for SFA and
$21,300 for SFD).
o Estimated energy savings for eligible new above code SFD and SFA homes is provided
in Table 1 and Table 2, respectively. Estimated incremental construction costs for
eligible new above code SFD and SFA homes is provided in Table 3 and Table 4,
respectively. The analysis only considers the medium and low incremental cost
estimates. The incentive levels listed above are based on the medium incremental cost
estimates.
C3 page 15
o The cost of a home energy assessment for newly constructed homes is $550; the results
of the assessment (and accompanying label and energy rating) forms part of the
verification process to be eligible for a rebate. The cost of the assessment is subsidized
by $350 reducing the net cost to builders to $200.
o Personalized (integrated design) technical assistance is provided builders and
developers from the planning stages through to construction. Technical assistance
amount to 10% of the total program delivery costs.
o The program works with real estate agents to encourage them to list ERS rating labels
on MLS® and builder specific new home marketing material. Indeed, educating
consumers is vital to increase demand for highly energy efficient homes.
o The overall participation rate in a financial unconstrained program is assumed to
encompass 40% of all new single family dwellings constructed per year in the
Edmonton.3 Given the annual budget constraint of $500,000 the participation rate does
not affect the results—the annual budget is exhausted well before the a participation rate
of 40% is reached. Based on observations from My Rebates total participating homes
are split across the eligible new homes as follows:
33% to Tier 1 new homes achieving an ERS = 80-81;
52% to Tier 2 new homes achieving an ERS = 82-85; and
15% to Tier 3 new (gas heated) homes achieving and ERS >85.
o Fixed program costs (i.e., marketing and outreach, development of the screening and
application process, program management, evaluation and reporting) amount to 25% of
the total program delivery costs.
o The free-ridership rate is assumed to be 21%; this rate was observed under the My
Rebates new home program. This program incented home buyers and is likely to be
pessimistic for a program that incents builders and developers.
o The impact of learning-by-doing (captured by a progress ratio and corresponding
learning rate) on incremental costs is not modeled.
RESULTS
Table 5 and Table 6 show estimated impacts for a three-tiered new construction program based
on, respectively, the medium and low incremental construction cost estimates.
3 Efficiency Vermont’s similar residential new construction program had approximately 61% of the new housing
market participate in 2011 (based on participation numbers in Nowak, 2013 and newly privately owned housing in
U.S. Department of Housing and Urban Development, 2011). Connecticut Light & Power and United Illuminating’s
similar residential new construction program had approximately 26% of the new housing market participate in 2011
(based on participation numbers in Nowak, 2013 and newly privately owned housing in U.S. Department of Housing
and Urban Development, 2011). Therefore, we adopt a participation rate just below the average for these programs.
C3 page 16
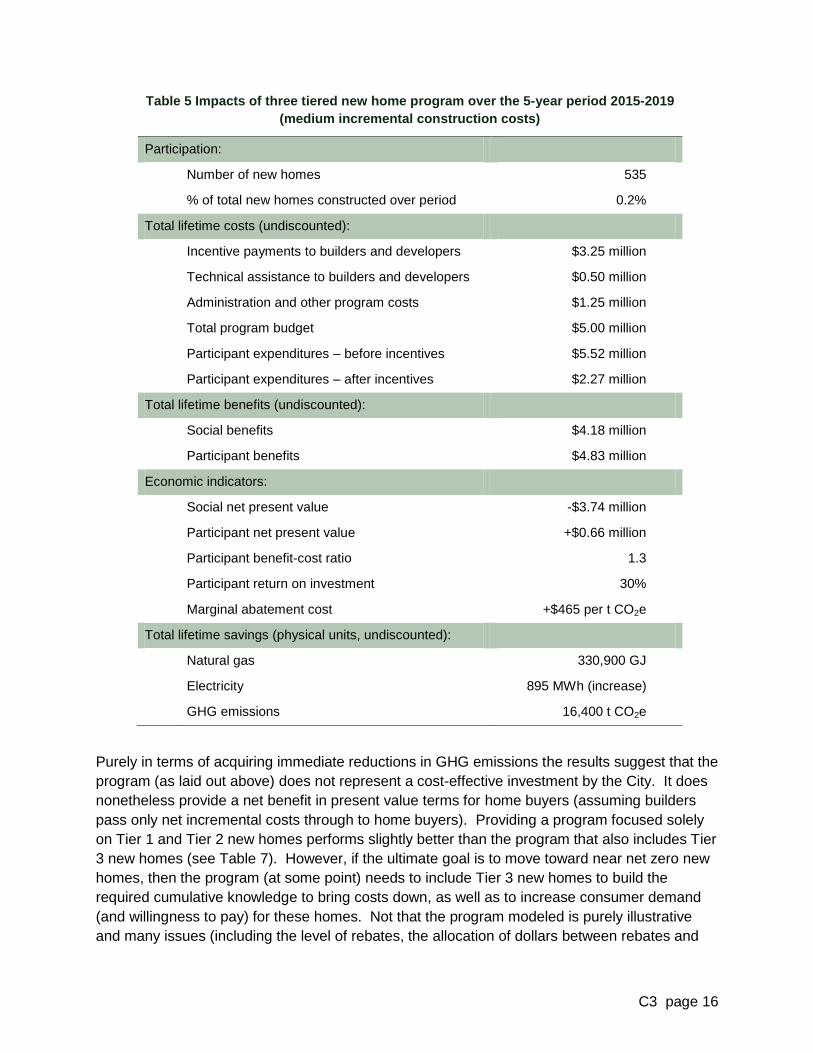
Table 5 Impacts of three tiered new home program over the 5-year period 2015-2019
(medium incremental construction costs)
Participation:
Number of new homes 535
% of total new homes constructed over period 0.2%
Total lifetime costs (undiscounted):
Incentive payments to builders and developers $3.25 million
Technical assistance to builders and developers $0.50 million
Administration and other program costs $1.25 million
Total program budget $5.00 million
Participant expenditures – before incentives $5.52 million
Participant expenditures – after incentives $2.27 million
Total lifetime benefits (undiscounted):
Social benefits $4.18 million
Participant benefits $4.83 million
Economic indicators:
Social net present value -$3.74 million
Participant net present value +$0.66 million
Participant benefit-cost ratio 1.3
Participant return on investment 30%
Marginal abatement cost +$465 per t CO2e
Total lifetime savings (physical units, undiscounted):
Natural gas 330,900 GJ
Electricity 895 MWh (increase)
GHG emissions 16,400 t CO2e
Purely in terms of acquiring immediate reductions in GHG emissions the results suggest that the
program (as laid out above) does not represent a cost-effective investment by the City. It does
nonetheless provide a net benefit in present value terms for home buyers (assuming builders
pass only net incremental costs through to home buyers). Providing a program focused solely
on Tier 1 and Tier 2 new homes performs slightly better than the program that also includes Tier
3 new homes (see Table 7). However, if the ultimate goal is to move toward near net zero new
homes, then the program (at some point) needs to include Tier 3 new homes to build the
required cumulative knowledge to bring costs down, as well as to increase consumer demand
(and willingness to pay) for these homes. Not that the program modeled is purely illustrative
and many issues (including the level of rebates, the allocation of dollars between rebates and
C3 page 17
technical assistance and builder education, and the relationship between builder costs, home
price and consumers’ willingness to pay) would need further exploration during the design of a
“live” program.
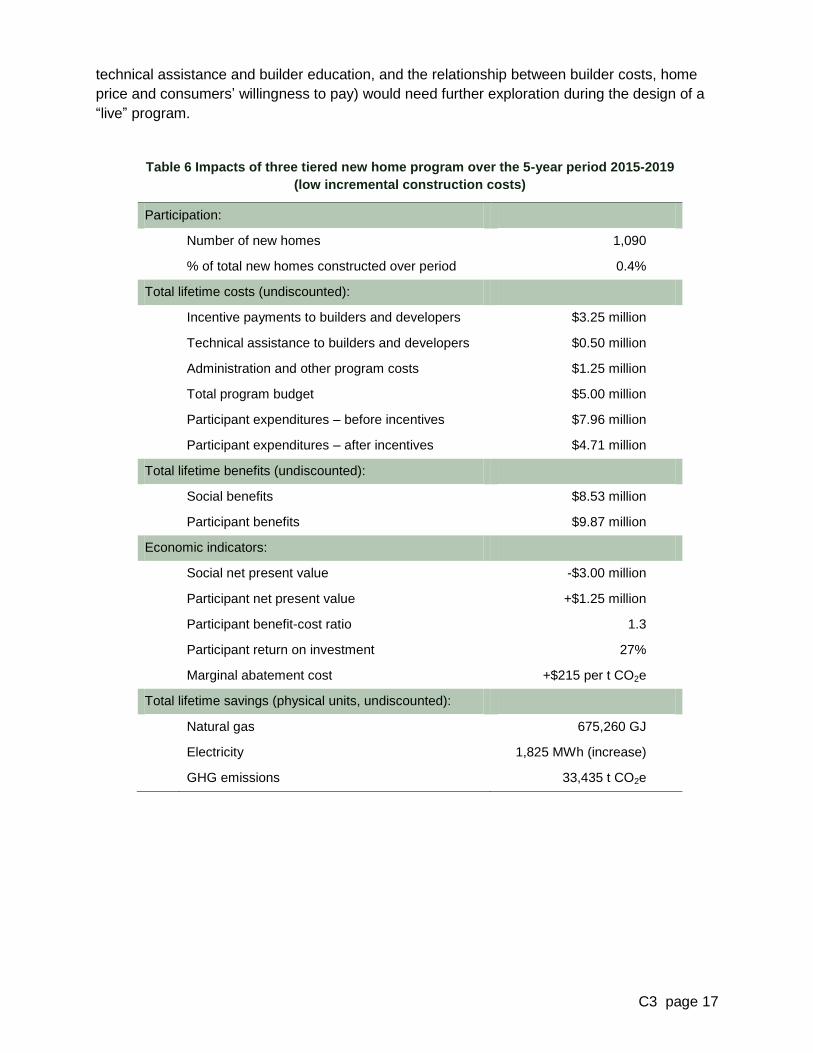
Table 6 Impacts of three tiered new home program over the 5-year period 2015-2019
(low incremental construction costs)
Participation:
Number of new homes 1,090
% of total new homes constructed over period 0.4%
Total lifetime costs (undiscounted):
Incentive payments to builders and developers $3.25 million
Technical assistance to builders and developers $0.50 million
Administration and other program costs $1.25 million
Total program budget $5.00 million
Participant expenditures – before incentives $7.96 million
Participant expenditures – after incentives $4.71 million
Total lifetime benefits (undiscounted):
Social benefits $8.53 million
Participant benefits $9.87 million
Economic indicators:
Social net present value -$3.00 million
Participant net present value +$1.25 million
Participant benefit-cost ratio 1.3
Participant return on investment 27%
Marginal abatement cost +$215 per t CO2e
Total lifetime savings (physical units, undiscounted):
Natural gas 675,260 GJ
Electricity 1,825 MWh (increase)
GHG emissions 33,435 t CO2e
C3 page 18
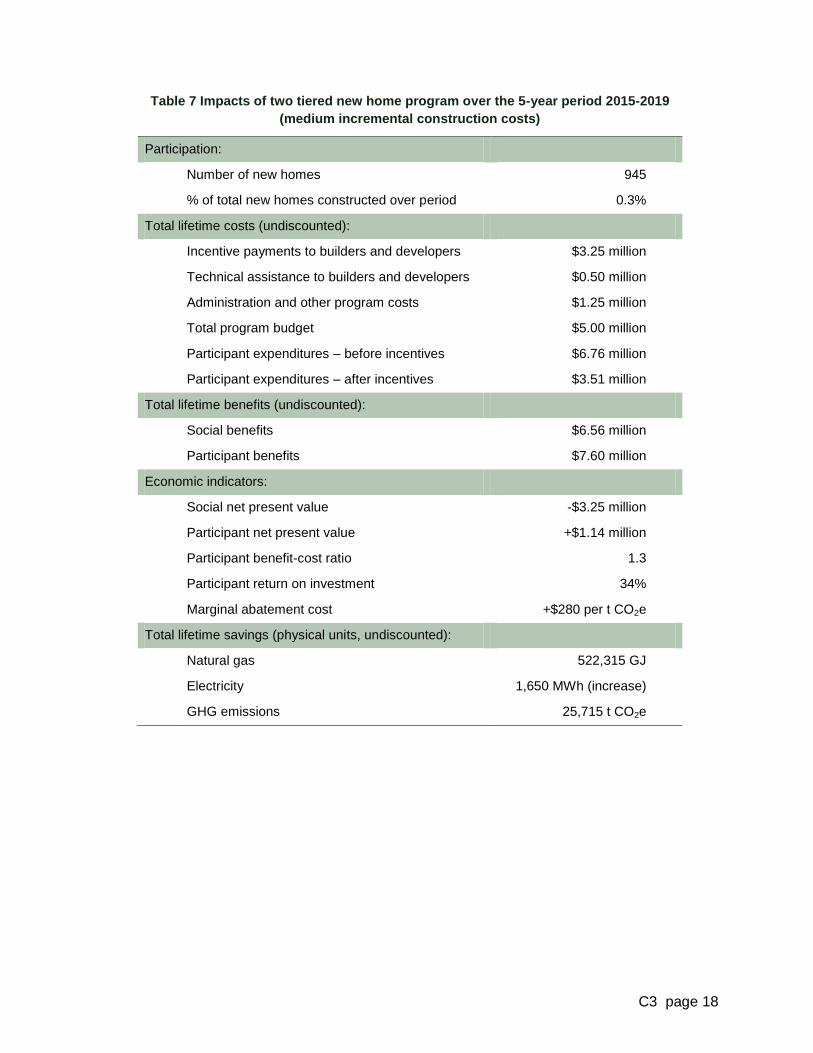
Table 7 Impacts of two tiered new home program over the 5-year period 2015-2019
(medium incremental construction costs)
Participation:
Number of new homes 945
% of total new homes constructed over period 0.3%
Total lifetime costs (undiscounted):
Incentive payments to builders and developers $3.25 million
Technical assistance to builders and developers $0.50 million
Administration and other program costs $1.25 million
Total program budget $5.00 million
Participant expenditures – before incentives $6.76 million
Participant expenditures – after incentives $3.51 million
Total lifetime benefits (undiscounted):
Social benefits $6.56 million
Participant benefits $7.60 million
Economic indicators:
Social net present value -$3.25 million
Participant net present value +$1.14 million
Participant benefit-cost ratio 1.3
Participant return on investment 34%
Marginal abatement cost +$280 per t CO2e
Total lifetime savings (physical units, undiscounted):
Natural gas 522,315 GJ
Electricity 1,650 MWh (increase)
GHG emissions 25,715 t CO2e
C3 page 19
WORK CITED
CanmetENERGY, 2012, Affordable Net-Zero Energy Housing, Natural Resources Canada,
Ottawa.
Carver, M., 2014, personal communication, Project Officer, Canmet, Natural Resources
Canada, Ottawa.
EnerQuality & Leo and Associates, 2010, A Study of Prescriptive Requirements for EnerGuide
80 in Ontario's Building Code, Ontario Ministry of Municipal Affairs and Housing, Toronto.
Nowak, S., et al, 2013, Leaders of the Pack: ACEEE's Third Review of Exemplary Energy
Efficiency Programs, American Council for an Energy Efficient Economy, Washington, DC.
Ontario Power Authority, 2011, 2011 Prescriptive Measures and Assumptions, Ontario Power
Authority, Toronto.
Proskiw, G., 2011, Cost and Benefit Analysis of Proposed Changes for Energy Efficiency in
Housing and Small Building in the National Building Code, Canadian Codes Centre, Institute for
Research in Construction, National Research Council of Canada, Ottawa.
Proskiw, G., 2011, Final Validation of the Proposed Part 9 Prescriptive Requirements for
Insulation, Airtightness, and Windows, relative to the Proposed Target of ERS 80, Canadian
Codes Centre Institute for Research in Construction National Research Council, Ottawa.
Rivers, N., 2013, Free-Riding on Energy Efficiency Subsidies: the Case of Natural Gas
Furnaces in Canada, Economics Department, University of Alberta, Edmonton.
C3 page 20
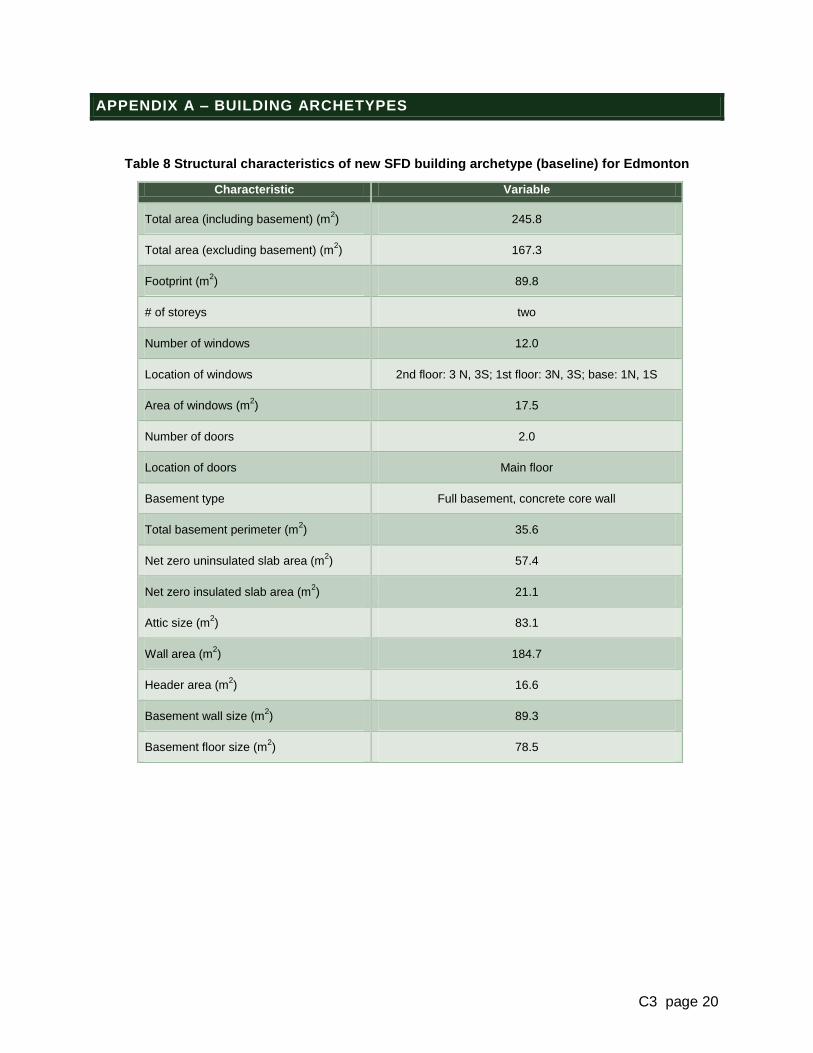
APPENDIX A – BUILDING ARCHETYPES
Table 8 Structural characteristics of new SFD building archetype (baseline) for Edmonton
Characteristic Variable
Total area (including basement) (m2) 245.8
Total area (excluding basement) (m2) 167.3
Footprint (m2) 89.8
# of storeys two
Number of windows 12.0
Location of windows 2nd floor: 3 N, 3S; 1st floor: 3N, 3S; base: 1N, 1S
Area of windows (m2) 17.5
Number of doors 2.0
Location of doors Main floor
Basement type Full basement, concrete core wall
Total basement perimeter (m2) 35.6
Net zero uninsulated slab area (m2) 57.4
Net zero insulated slab area (m2) 21.1
Attic size (m2) 83.1
Wall area (m2) 184.7
Header area (m2) 16.6
Basement wall size (m2) 89.3
Basement floor size (m2) 78.5
C3 page 21
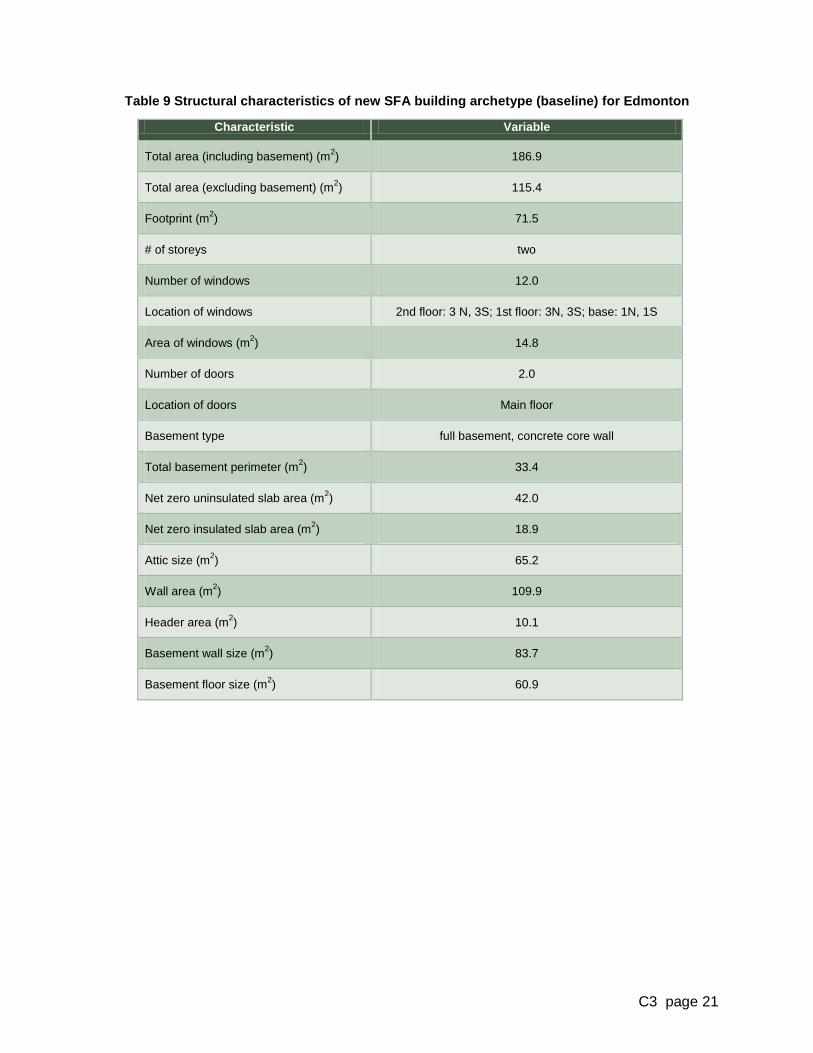
Table 9 Structural characteristics of new SFA building archetype (baseline) for Edmonton
Characteristic Variable
Total area (including basement) (m2) 186.9
Total area (excluding basement) (m2) 115.4
Footprint (m2) 71.5
# of storeys two
Number of windows 12.0
Location of windows 2nd floor: 3 N, 3S; 1st floor: 3N, 3S; base: 1N, 1S
Area of windows (m2) 14.8
Number of doors 2.0
Location of doors Main floor
Basement type full basement, concrete core wall
Total basement perimeter (m2) 33.4
Net zero uninsulated slab area (m2) 42.0
Net zero insulated slab area (m2) 18.9
Attic size (m2) 65.2
Wall area (m2) 109.9
Header area (m2) 10.1
Basement wall size (m2) 83.7
Basement floor size (m2) 60.9
C3 page 22
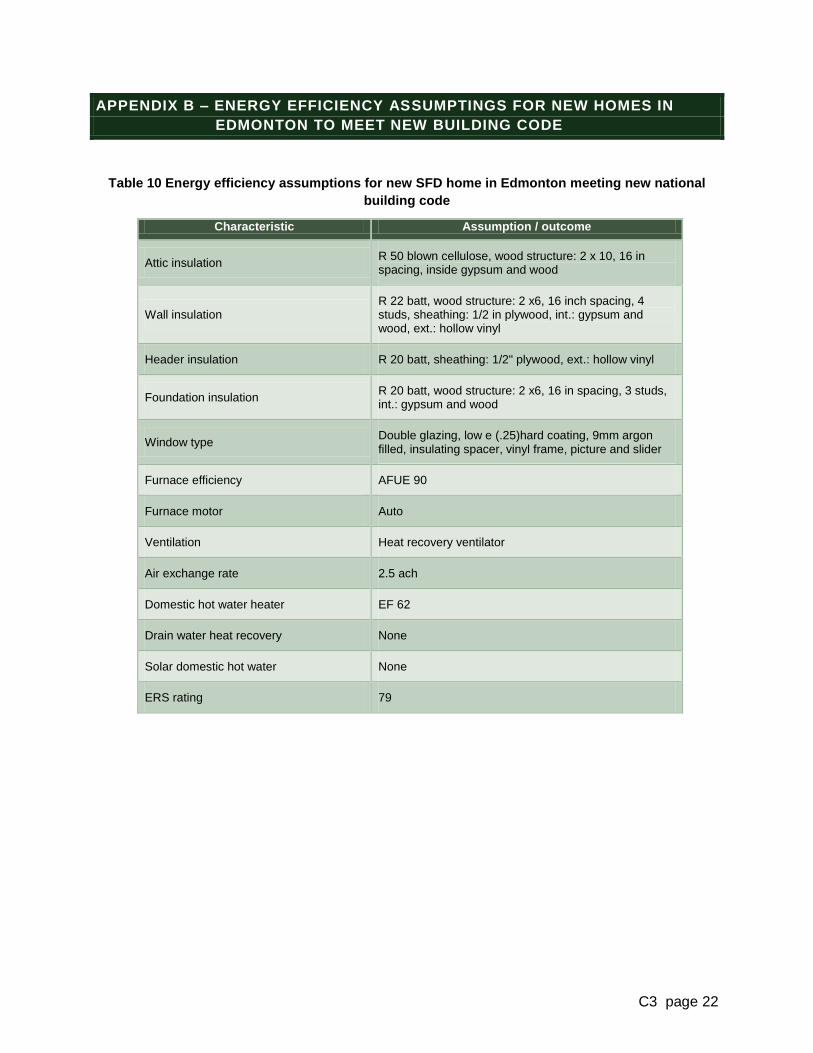
APPENDIX B – ENERGY EFFICIENCY ASSUMPTINGS FOR NEW HOMES IN
EDMONTON TO MEET NEW BUILDING CODE
Table 10 Energy efficiency assumptions for new SFD home in Edmonton meeting new national
building code
Characteristic Assumption / outcome
Attic insulation R 50 blown cellulose, wood structure: 2 x 10, 16 in spacing, inside gypsum and wood
Wall insulation R 22 batt, wood structure: 2 x6, 16 inch spacing, 4 studs, sheathing: 1/2 in plywood, int.: gypsum and wood, ext.: hollow vinyl
Header insulation R 20 batt, sheathing: 1/2" plywood, ext.: hollow vinyl
Foundation insulation R 20 batt, wood structure: 2 x6, 16 in spacing, 3 studs, int.: gypsum and wood
Window type Double glazing, low e (.25)hard coating, 9mm argon filled, insulating spacer, vinyl frame, picture and slider
Furnace efficiency AFUE 90
Furnace motor Auto
Ventilation Heat recovery ventilator
Air exchange rate 2.5 ach
Domestic hot water heater EF 62
Drain water heat recovery None
Solar domestic hot water None
ERS rating 79
C3 page 23
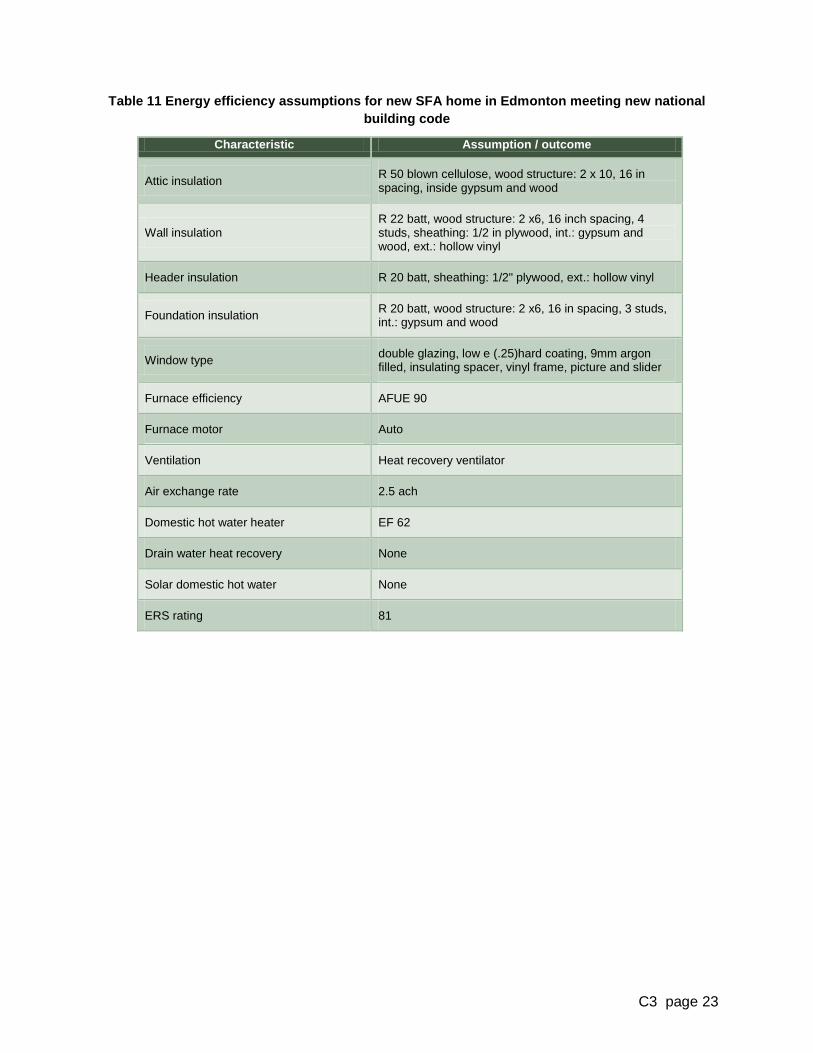
Table 11 Energy efficiency assumptions for new SFA home in Edmonton meeting new national
building code
Characteristic Assumption / outcome
Attic insulation R 50 blown cellulose, wood structure: 2 x 10, 16 in spacing, inside gypsum and wood
Wall insulation R 22 batt, wood structure: 2 x6, 16 inch spacing, 4 studs, sheathing: 1/2 in plywood, int.: gypsum and wood, ext.: hollow vinyl
Header insulation R 20 batt, sheathing: 1/2" plywood, ext.: hollow vinyl
Foundation insulation R 20 batt, wood structure: 2 x6, 16 in spacing, 3 studs, int.: gypsum and wood
Window type double glazing, low e (.25)hard coating, 9mm argon filled, insulating spacer, vinyl frame, picture and slider
Furnace efficiency AFUE 90
Furnace motor Auto
Ventilation Heat recovery ventilator
Air exchange rate 2.5 ach
Domestic hot water heater EF 62
Drain water heat recovery None
Solar domestic hot water None
ERS rating 81
C3 page 24
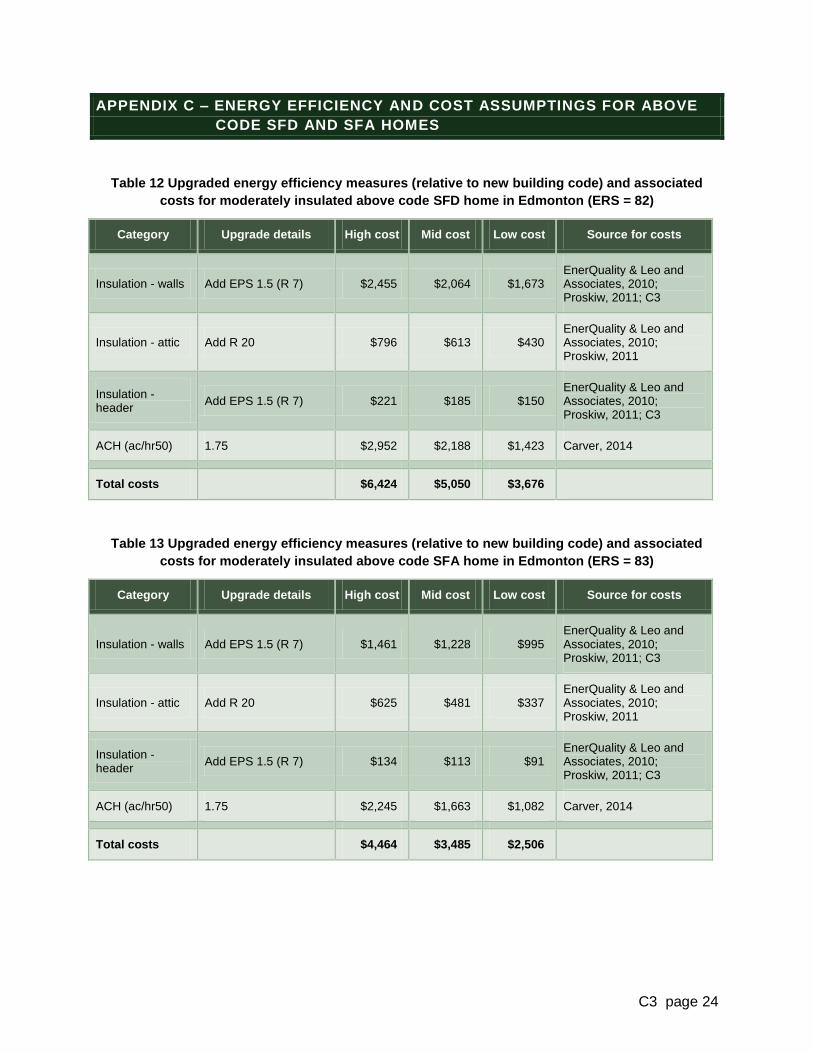
APPENDIX C – ENERGY EFFICIENCY AND COST ASSUMPTINGS FOR ABOVE
CODE SFD AND SFA HOMES
Table 12 Upgraded energy efficiency measures (relative to new building code) and associated
costs for moderately insulated above code SFD home in Edmonton (ERS = 82)
Category Upgrade details High cost Mid cost Low cost Source for costs
Insulation - walls Add EPS 1.5 (R 7) $2,455 $2,064 $1,673 EnerQuality & Leo and Associates, 2010; Proskiw, 2011; C3
Insulation - attic Add R 20 $796 $613 $430 EnerQuality & Leo and Associates, 2010; Proskiw, 2011
Insulation - header
Add EPS 1.5 (R 7) $221 $185 $150 EnerQuality & Leo and Associates, 2010; Proskiw, 2011; C3
ACH (ac/hr50) 1.75 $2,952 $2,188 $1,423 Carver, 2014
Total costs
$6,424 $5,050 $3,676
Table 13 Upgraded energy efficiency measures (relative to new building code) and associated
costs for moderately insulated above code SFA home in Edmonton (ERS = 83)
Category Upgrade details High cost Mid cost Low cost Source for costs
Insulation - walls Add EPS 1.5 (R 7) $1,461 $1,228 $995 EnerQuality & Leo and Associates, 2010; Proskiw, 2011; C3
Insulation - attic Add R 20 $625 $481 $337 EnerQuality & Leo and Associates, 2010; Proskiw, 2011
Insulation - header
Add EPS 1.5 (R 7) $134 $113 $91 EnerQuality & Leo and Associates, 2010; Proskiw, 2011; C3
ACH (ac/hr50) 1.75 $2,245 $1,663 $1,082 Carver, 2014
Total costs
$4,464 $3,485 $2,506
C3 page 25
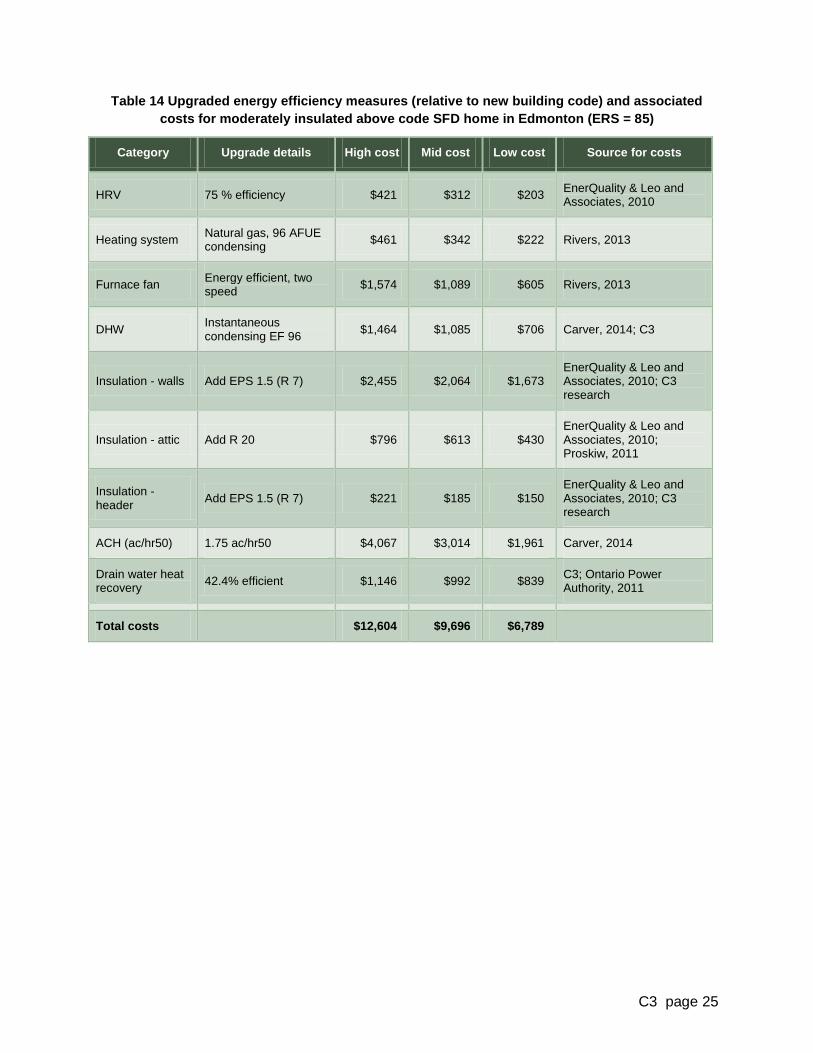
Table 14 Upgraded energy efficiency measures (relative to new building code) and associated
costs for moderately insulated above code SFD home in Edmonton (ERS = 85)
Category Upgrade details High cost Mid cost Low cost Source for costs
HRV 75 % efficiency $421 $312 $203 EnerQuality & Leo and Associates, 2010
Heating system Natural gas, 96 AFUE condensing
$461 $342 $222 Rivers, 2013
Furnace fan Energy efficient, two speed
$1,574 $1,089 $605 Rivers, 2013
DHW Instantaneous condensing EF 96
$1,464 $1,085 $706 Carver, 2014; C3
Insulation - walls Add EPS 1.5 (R 7) $2,455 $2,064 $1,673 EnerQuality & Leo and Associates, 2010; C3 research
Insulation - attic Add R 20 $796 $613 $430 EnerQuality & Leo and Associates, 2010; Proskiw, 2011
Insulation - header
Add EPS 1.5 (R 7) $221 $185 $150 EnerQuality & Leo and Associates, 2010; C3 research
ACH (ac/hr50) 1.75 ac/hr50 $4,067 $3,014 $1,961 Carver, 2014
Drain water heat recovery
42.4% efficient $1,146 $992 $839 C3; Ontario Power Authority, 2011
Total costs $12,604 $9,696 $6,789

C3 page 26
Table 15 Upgraded energy efficiency measures (relative to new building code) and associated
costs for moderately insulated above code SFA home in Edmonton (ERS = 85)
Category Upgrade details High cost Mid cost Low cost Source for costs
HRV 75 % efficiency $421 $312 $203 EnerQuality & Leo and Associates, 2010
Heating system Natural gas, 96 AFUE condensing
$461 $342 $222 Rivers, 2013
Furnace fan Energy efficient, two speed
$1,574 $1,089 $605 Rivers, 2013
DHW Instantaneous condensing EF 96
$1,464 $1,085 $706 Carver, 2014; C3
Insulation - walls Add EPS 1.5 (R 7) $2,455 $1,228 $1,673 EnerQuality & Leo and Associates, 2010; C3 research
Insulation - attic Add R 20 $796 $613 $430 EnerQuality & Leo and Associates, 2010; Proskiw, 2011
Insulation - header
Add EPS 1.5 (R 7) $221 $185 $150 EnerQuality & Leo and Associates, 2010; C3 research
ACH (ac/hr50) 1.75 ac/hr50 $3,092 $2,291 $1,491 Carver, 2014
Drain water heat recovery
42.4% efficient $1,146 $992 $839 C3; Ontario Power Authority, 2011
Total costs
$11,630 $8,138 $6,319
C3 page 27
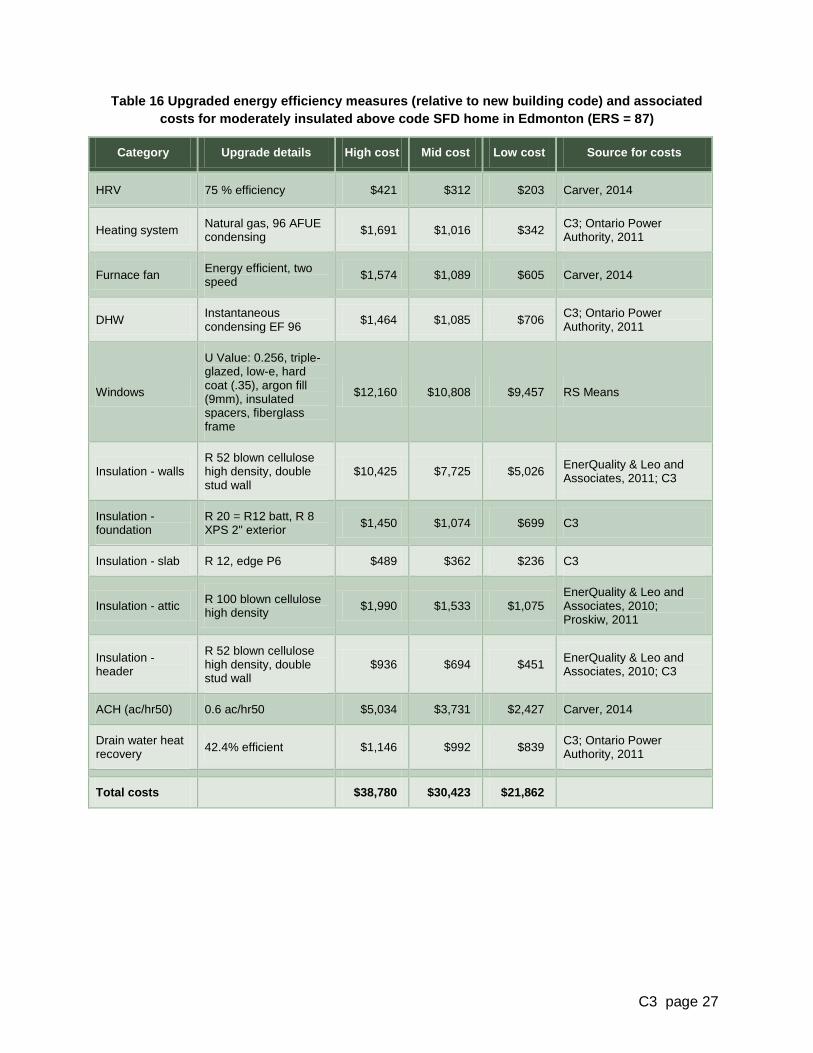
Table 16 Upgraded energy efficiency measures (relative to new building code) and associated
costs for moderately insulated above code SFD home in Edmonton (ERS = 87)
Category Upgrade details High cost Mid cost Low cost Source for costs
HRV 75 % efficiency $421 $312 $203 Carver, 2014
Heating system Natural gas, 96 AFUE condensing
$1,691 $1,016 $342 C3; Ontario Power Authority, 2011
Furnace fan Energy efficient, two speed
$1,574 $1,089 $605 Carver, 2014
DHW Instantaneous condensing EF 96
$1,464 $1,085 $706 C3; Ontario Power Authority, 2011
Windows
U Value: 0.256, triple-glazed, low-e, hard coat (.35), argon fill (9mm), insulated spacers, fiberglass frame
$12,160 $10,808 $9,457 RS Means
Insulation - walls R 52 blown cellulose high density, double stud wall
$10,425 $7,725 $5,026 EnerQuality & Leo and Associates, 2011; C3
Insulation - foundation
R 20 = R12 batt, R 8 XPS 2" exterior
$1,450 $1,074 $699 C3
Insulation - slab R 12, edge P6 $489 $362 $236 C3
Insulation - attic R 100 blown cellulose high density
$1,990 $1,533 $1,075 EnerQuality & Leo and Associates, 2010; Proskiw, 2011
Insulation - header
R 52 blown cellulose high density, double stud wall
$936 $694 $451 EnerQuality & Leo and Associates, 2010; C3
ACH (ac/hr50) 0.6 ac/hr50 $5,034 $3,731 $2,427 Carver, 2014
Drain water heat recovery
42.4% efficient $1,146 $992 $839 C3; Ontario Power Authority, 2011
Total costs $38,780 $30,423 $21,862
C3 page 28
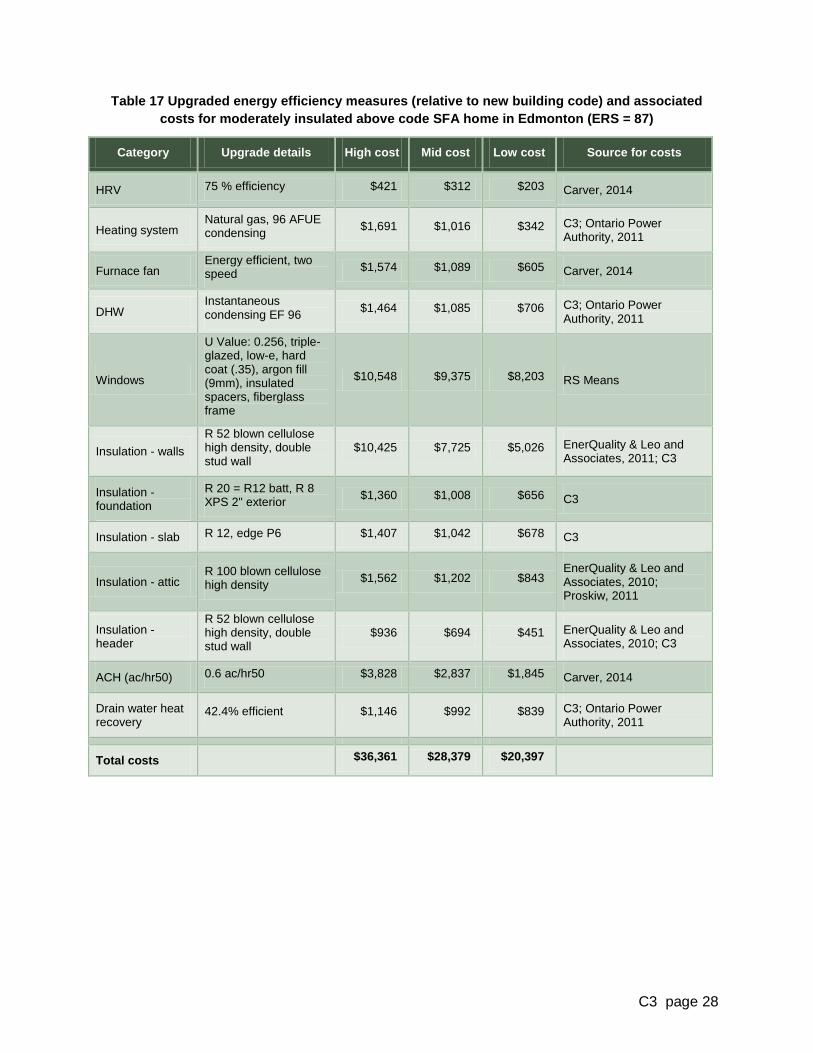
Table 17 Upgraded energy efficiency measures (relative to new building code) and associated
costs for moderately insulated above code SFA home in Edmonton (ERS = 87)
Category Upgrade details High cost Mid cost Low cost Source for costs
HRV 75 % efficiency $421 $312 $203 Carver, 2014
Heating system Natural gas, 96 AFUE condensing
$1,691 $1,016 $342 C3; Ontario Power Authority, 2011
Furnace fan Energy efficient, two speed
$1,574 $1,089 $605 Carver, 2014
DHW Instantaneous condensing EF 96
$1,464 $1,085 $706 C3; Ontario Power Authority, 2011
Windows
U Value: 0.256, triple-glazed, low-e, hard coat (.35), argon fill (9mm), insulated spacers, fiberglass frame
$10,548 $9,375 $8,203 RS Means
Insulation - walls
R 52 blown cellulose high density, double stud wall
$10,425 $7,725 $5,026 EnerQuality & Leo and Associates, 2011; C3
Insulation - foundation
R 20 = R12 batt, R 8 XPS 2" exterior
$1,360 $1,008 $656 C3
Insulation - slab R 12, edge P6 $1,407 $1,042 $678 C3
Insulation - attic R 100 blown cellulose high density
$1,562 $1,202 $843 EnerQuality & Leo and Associates, 2010; Proskiw, 2011
Insulation - header
R 52 blown cellulose high density, double stud wall
$936 $694 $451 EnerQuality & Leo and Associates, 2010; C3
ACH (ac/hr50) 0.6 ac/hr50 $3,828 $2,837 $1,845 Carver, 2014
Drain water heat recovery
42.4% efficient $1,146 $992 $839 C3; Ontario Power Authority, 2011
Total costs
$36,361 $28,379 $20,397
C3 page 29
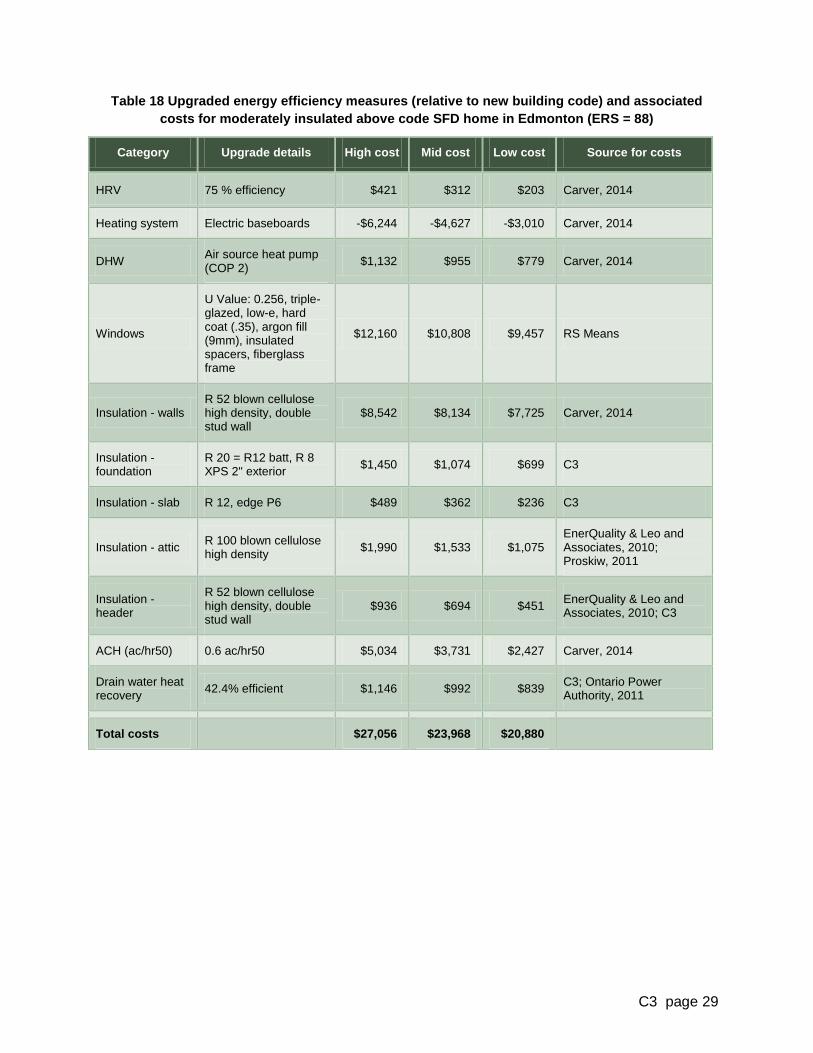
Table 18 Upgraded energy efficiency measures (relative to new building code) and associated
costs for moderately insulated above code SFD home in Edmonton (ERS = 88)
Category Upgrade details High cost Mid cost Low cost Source for costs
HRV 75 % efficiency $421 $312 $203 Carver, 2014
Heating system Electric baseboards -$6,244 -$4,627 -$3,010 Carver, 2014
DHW Air source heat pump (COP 2)
$1,132 $955 $779 Carver, 2014
Windows
U Value: 0.256, triple-glazed, low-e, hard coat (.35), argon fill (9mm), insulated spacers, fiberglass frame
$12,160 $10,808 $9,457 RS Means
Insulation - walls R 52 blown cellulose high density, double stud wall
$8,542 $8,134 $7,725 Carver, 2014
Insulation - foundation
R 20 = R12 batt, R 8 XPS 2" exterior
$1,450 $1,074 $699 C3
Insulation - slab R 12, edge P6 $489 $362 $236 C3
Insulation - attic R 100 blown cellulose high density
$1,990 $1,533 $1,075 EnerQuality & Leo and Associates, 2010; Proskiw, 2011
Insulation - header
R 52 blown cellulose high density, double stud wall
$936 $694 $451 EnerQuality & Leo and Associates, 2010; C3
ACH (ac/hr50) 0.6 ac/hr50 $5,034 $3,731 $2,427 Carver, 2014
Drain water heat recovery
42.4% efficient $1,146 $992 $839 C3; Ontario Power Authority, 2011
Total costs
$27,056 $23,968 $20,880

C3 page 30
Table 19 Upgraded energy efficiency measures (relative to new building code) and associated
costs for moderately insulated above code SFA home in Edmonton (ERS = 88)
Category Upgrade details High cost Mid cost Low cost Source for costs
HRV 75 % efficiency $421 $312 $203 Carver, 2014
Heating system Electric baseboards -$6,244 -$4,627 -$3,010 Carver, 2014
DHW Air source heat pump (COP 2)
$1,132 $955 $779 Carver, 2014
Windows
U Value: 0.256, triple-glazed, low-e, hard coat (.35), argon fill (9mm), insulated spacers, fiberglass frame
$12,160 $10,808 $9,457 RS Means
Insulation - walls R 52 blown cellulose high density, double stud wall
$8,542 $8,134 $7,725 Carver, 2014
Insulation - foundation
R 20 = R12 batt, R 8 XPS 2" exterior
$1,450 $1,074 $699 C3
Insulation - slab R 12, edge P6 $489 $362 $236 C3
Insulation - attic R 100 blown cellulose high density
$1,990 $1,533 $1,075 EnerQuality & Leo and Associates, 2010; Proskiw, 2011
Insulation - header
R 52 blown cellulose high density, double stud wall
$936 $694 $451 EnerQuality & Leo and Associates, 2010; C3
ACH (ac/hr50) 0.6 ac/hr50 $3,828 $2,837 $1,845 Carver, 2014
Drain water heat recovery
42.4% efficient $1,146 $992 $839 C3; Ontario Power Authority, 2011
Total costs
$25,850 $23,074 $20,299